smart work centres - university of technology...
TRANSCRIPT

Smart Work Centres: An Analysis of Demand in Western Sydney FINAL v3
Institute for Sustainable Futures, UTS For Regional Development Australia Sydney, the Western Sydney Regional Organisation of Councils and Penrith Business Alliance
ABOUT THE AUTHORS The Institute for Sustainable Futures (ISF) was established by the University of Technology, Sydney in 1996 to work with industry, government and the community to develop sustainable futures through research and consultancy. Our mission is to create change toward sustainable futures that protect and enhance the environment, human well-being and social equity. We seek to adopt an inter-disciplinary approach to our work and engage our partner organisations in a collaborative process that emphasises strategic decision-making.
For further information visit: www.isf.uts.edu.au
Research team: Ms Kerryn Wilmot, Mr Thomas Boyle, Dr Peter Rickwood, and Dr Samantha Sharpe.
Reviewed by Dr Damien Giurco
CITATION Cite this report as:
Wilmot, K., Boyle, T., Rickwood, P., and Sharpe, S. 2014, The Potential for Smart Work Centres in Blacktown, Liverpool and Penrith: report prepared by the Institute for Sustainable Futures, University of Technology, Sydney, for Regional Development Australia Sydney, the Western Sydney Regional Organisation of Councils (WSROC) and Penrith Business Alliance.
DISCLAIMER The information contained in this report does not necessarily represent the views of the sponsoring organisations - Regional Development Australia Sydney, Western Sydney Regional Organisation of Councils or Penrith Business Alliance.
ACKNOWLEDGEMENT The authors would like to acknowledge and thank the stakeholder participants for giving up their time to participate in interviews.
Cover photo: Hub Adelaide co-working space photographer Nathan Dyer
INSTITUTE FOR SUSTAINABLE FUTURES University of Technology, Sydney PO Box 123 Broadway, NSW, 2007 (02) 9514 4950 www.isf.edu.au
© UTS January 2014

SMART WORK CENTRES: AN ANALYSIS OF DEMAND IN WESTERN SYDNEY 3
INSTITUTE FOR SUSTAINABLE FUTURES JANUARY 2014
TABLE OF CONTENTS 1 Executive Summary ......................................................................... 4
2 Introduction ...................................................................................... 8 2.1 Next generation telework ......................................................... 8
2.1.1 Anywhere working ................................................................ 8 2.1.2 The potential for Smart Work Centres .................................. 9 2.1.3 Research process and objectives ....................................... 10
3 Context ........................................................................................... 11 3.1 What is telework? .................................................................. 11 3.2 Benefits of telework ............................................................... 12 3.3 Reasons for teleworking ........................................................ 13 3.4 Barriers to telework ............................................................... 13 3.5 Who are teleworkers? ........................................................... 16
3.5.1 Workers of the information economy .................................. 16 3.5.2 Demographic characteristics of teleworkers ....................... 18
3.6 The new spatiality of telework ............................................... 19 3.6.1 Beyond the home office ...................................................... 19 3.6.2 The rise of third spaces? .................................................... 19 3.6.3 Telework, collaboration and consolidation in the knowledge
economy ............................................................................. 20 3.6.4 Smart Work Centres ........................................................... 21 3.6.5 Comparison of benefits between spaces ............................ 23
4 Methodology ................................................................................... 24 4.1 Overview ............................................................................... 24 4.2 Determining the catchment ................................................... 24 4.3 Quantifying benefits ............................................................... 25
4.3.1 Private benefits ................................................................... 25 4.3.2 Public benefits .................................................................... 26
4.4 Demand Factors .................................................................... 26 4.4.1 Current teleworking rate—candidate occupations .............. 26 4.4.2 Accounting for barriers and worker preferences ................. 27
5 Current commuting geographies .................................................... 28 5.1 Overview ................................................................................ 28 5.2 Journey to work lengths ......................................................... 28 5.3 Journey to work destinations ................................................. 28 5.4 Congestion ............................................................................. 30
6 Labour market trends and teleworking opportunities ...................... 32 6.1 Overview ................................................................................ 32 6.2 Teleworking trends ................................................................ 32 6.3 Change in employment mix and implications for telework ..... 33
7 Potential for smart work centres ..................................................... 38 7.1 Demand ................................................................................. 38 7.2 Public and private benefits ..................................................... 41 7.3 Liverpool benefits ................................................................... 42 7.4 Blacktown benefits ................................................................. 43 7.5 Penrith benefits ...................................................................... 44
8 Scenario for a smart work centre .................................................... 45 8.1 Proposition ............................................................................. 45 8.2 Operating model .................................................................... 46 8.3 Location ................................................................................. 47 8.4 Centre character and design considerations ......................... 48 8.5 Finance and government support .......................................... 49
9 Conclusion ...................................................................................... 51
10 References ..................................................................................... 52
11 Appendix A—Methodology ............................................................. 56 11.1 Public and private benefits ..................................................... 56
11.1.1 Private benefits ................................................................. 56 11.1.2 Public benefits .................................................................. 56
11.2 Method for quantifying public and private benefits ................ 58 11.3 Method conclusion ................................................................. 68

SMART WORK CENTRES: AN ANALYSIS OF DEMAND IN WESTERN SYDNEY 4
INSTITUTE FOR SUSTAINABLE FUTURES JANUARY 2014
1 EXECUTIVE SUMMARY
This study sets out to explore the potential for smart work centres in the local government areas of Liverpool, Blacktown and Penrith in Western Sydney. Smart work centres are differentiated from other work environments like main workplace, serviced offices, co-working spaces, third spaces and home offices by location, operations and atmosphere. Targeted to serve teleworkers, they are located close to where people live, provide a fully serviced formal workplace but operate with a community atmosphere that engenders creativity and innovation. This report investigates the circumstances that support teleworking, examines the commuting patterns and demographics of the 3 LGAs, and then analyses census data to predict a demand for a centre in any one of the 3 locations. The report goes on to propose a scenario for a successful centre based on the findings from the research.
With the recent exponential growth in communications technologies such as mobile devices, wireless and cloud computing, there are fewer limitations on how and where work is carried out. For workers in the knowledge sector, professional, managerial and clerical occupations, the future of work is increasingly being defined in terms of performance, not by location. An age of ‘anywhere working’ is upon us.
Freeing the worker from attendance at head office at an allocated desk opens opportunities to create alternative work environments. An early step towards this was activity based working, with unallocated desks leading to fewer desks, diversified seating and working spaces, and smaller leased areas. For many years a
small but significant proportion of the workforce has been regularly working from home. Increasing connectivity has enabled casual and informal use of third spaces such as libraries, cafes and in transit.
Not everyone has a suitable home environment to work from, or enjoys the isolation. EH&S considerations add a degree of risk for an employer to encourage work outside the controlled office. One answer of growing interest is smart work centres. A trend to CBD fringe co-working spaces has accommodated freelancers, digital entrepreneurs and start-ups, demonstrating innovation and creativity in a shared environment. Learning from this, a similar model is proposed for locations close to where people live, but targeted more towards part time usage by commuters – smart work centres.
By working near home, workers reap similar benefits to working from home, with additional benefits of locating in a social, well-serviced work environment and the potential for creative interaction leading to innovation. Many currently home-based businesses, local entrepreneurs and teleworkers will be attracted to smart work centres for the social and innovation benefits as well as access to the facilities offered, adding to the creative energy that is a success factor for co-working spaces. For an employer, the benefits include reduced office accommodation costs for a proportion of the workforce, risk management of the work setting, business resilience from the dispersed locations, improved recruitment and retention of employees, access to a broader

SMART WORK CENTRES: AN ANALYSIS OF DEMAND IN WESTERN SYDNEY 5
INSTITUTE FOR SUSTAINABLE FUTURES JANUARY 2014
workforce, reduced absenteeism and potentially improved productivity.
By using a smart work centre a day or two a week, workers reduce their commuting time burden and private vehicle travel costs, whilst maintaining workplace culture and visibility through physical presence in the office on the other days. A reduction in the amount of commuting reduces congestion on roads and public transport systems at peak times. The public benefits that accrue from this include reduced greenhouse gas emissions, noise, pollution and fewer accidents as well as reduced costs for other vehicles, reduced traffic variability and delays.
The ideal location for smart work centres is close to a resident population of professionals, managers, clerical and administrative workers who face long commutes to their place of employment and would therefore find a workplace close to home attractive. This study considers the potential for smart work centres in three Sydney western suburbs that meet this definition, Liverpool, Blacktown and Penrith. These areas are often cited as needing better access to employment opportunities and with poor transport connections. Analysis of labour market trends for the area shows that nearly half the workers living in these 3 local government areas (LGAs) are in the target occupations. All 3 LGAs have zones with a higher than average proportion of people currently working from home although overall the average is lower than that for Greater Sydney.
Analysis of journey to work destinations for people coming from these 3 LGAs shows concentrations of work between Parramatta and Sydney CBD and in North Sydney as well as pockets within
the LGAs. The congestion analysis for each area illustrates that the longest travel time impacts correspond broadly to these employment districts. Journey to work lengths show them spread across all travel times, with a slightly higher proportion in the 15-25 minute range, and large numbers travelling for longer than 90 minutes. Commuters travelling for longer than 60 minutes are considered the most likely candidates for smart work centres.
Potential demand for smart work centres in Liverpool, Blacktown and Penrith is drawn from across the metropolitan area. Realistically, the greatest source will be those living close by who will avoid commuting altogether and possibly even change travel mode to walking or cycling to a nearby centre. The methodology employed in this study is to calculate the time taken for journeys to work for all workers in the Sydney metropolitan area, then calculate the time it would take to travel from the same origin to each of the target smart work centre destinations. If there is a saving of at least 30 minutes, and if the journey to the smart work centre is less than 30 minutes by car or 60 minutes by public transport, then the trip is considered eligible. The second criterion is included to avoid counting lengthy cross-city trips to unfamiliar areas. The eligible trips number is multiplied by the proportion of workers at the destination who are in the target occupations to arrive at the number of eligible candidates. Note that the method assumes only one centre is provided and no allowance is made for multiple centres, so there is overlap in the figures for each destination.
Not all people can or would like to work in a smart work centre. There are a number of variables that will reduce the demand well

SMART WORK CENTRES: AN ANALYSIS OF DEMAND IN WESTERN SYDNEY 6
INSTITUTE FOR SUSTAINABLE FUTURES JANUARY 2014
below that of the number of eligible workers, but currently there is no basis to measure this. As a proxy the study has taken the current rate of working from home as counted in the last census, which is 6%. As an interim position until there is evidence to determine demand, it is considered that the number of those working from home who would not be attracted to a smart work centre would be balanced by those who would be attracted to telework but wouldn’t work from home.
This method establishes the potential demand for each of the destinations on any given day as:
Liverpool 1400 workers each day Blacktown 2050 workers each day
Penrith 1075 workers each day
Using a methodology developed for this study, the cost impacts of reducing commuting time and distances due to smart work center take up for both public and private benefit has been calculated.
If the full demand as shown above were realised, the annual public benefits for each destination would be:
Liverpool $6.4 million
Blacktown $8.1 million
Penrith $6.0 million
which averages for each worker to: Liverpool $4,556/worker/year
Blacktown $3,967/worker/year
Penrith $5,560/worker/year
The selected annual private benefits that cost private travel time savings, fuel savings and avoided tolls for the full demand are:
Liverpool $10.7 million
Blacktown $14.9 million
Penrith $9.6 million
which gives an indicative average of $32.37/worker/day teleworked.
Scenario
The assessed demand suggests that a smart work centre in any of the Liverpool, Blacktown or Penrith locations could be successful. As a pilot to prove the model it is suggested that the centre should be the smallest size for a fully serviced centre that can be financially feasible. A fully serviced centre would be big enough to attract and accommodate a diverse population and create a vibrant atmosphere that co-working spaces have demonstrated is crucial to successful operation. According to sizing of the The Hub, a current co-working space operator, this would be 600m2 for 100 seats. The operating model could be a coventional property arrangement where the landlord leases the property for a fixed rent to an operator who takes the risk and the profit. Alternatively, the landlord could engage an operator for a fixed management fee, taking the risk and profit itself. A third model, that of owner operator, requires a high level of commitment and capability from the property owner.
The location of a smart work centre should be in a commercial activity area with proximity to retail and services. It is essential

SMART WORK CENTRES: AN ANALYSIS OF DEMAND IN WESTERN SYDNEY 7
INSTITUTE FOR SUSTAINABLE FUTURES JANUARY 2014
that there is easy access to public transport, both between home and centre, and to key centres such as the CBD, allowing travel to appointments without any transfer time penalty. Access to good coffee, lunches and secure bicycle parking are also considered essential. Ideally the centre would also be close to general retail and services. Child care access would enhance the offering. The reliance on private cars in western Sydney means access to car parking will be necessary.
Until the use of smart work centres has widespread acceptance there is a risk to use them in an urban renewal strategy, although this will be a useful benefit for local communities in a future of proven demand.
It is important that the centre is “discoverable”, that it is easy to find and easy to know that space is available.
Learning from co-working spaces, the right atmosphere will be important. It needs to engender a sense of community, with enough social interaction for creativity and incidental meetings to differentiate it from home-based working. At the same time, the demand has been calculated on the basis of being occupied by teleworkers who are shifting from enterprise offices, so the centre must meet accommodation, service and facility standards that will be acceptable to larger corporate and government employers and which will allow for working without distraction.
The establishment of smart work centres in outer urban areas addresses current NSW State Government policy about creating jobs close to where people live and relocating government jobs to regional and metropolitan locations, and provides a more creative
solution than forced decentralisation of entire departments. The public benefits of reduced congestion calculated in this study provide an argument for financial support from government to catalyse some of these benefits. Public subsidy could come in the form of direct funding, financial support through provision of buildings, or as a role as anchor tenant, or a combination of two or more. State Government support could also come through policies and procedures to allow their own staff to telework
This study focuses on Liverpool, Blacktown and Penrith as case studies, but with similar circumstances in other LGAs in Western Sydney the same methodology can be applied.
Hub Melbourne co-working space photographer Nathan Dyer

SMART WORK CENTRES: AN ANALYSIS OF DEMAND IN WESTERN SYDNEY 8
INSTITUTE FOR SUSTAINABLE FUTURES JANUARY 2014
2 INTRODUCTION
2.1 Next generation telework
2.1.1 Anywhere working With major advances in information and communications technology (ICT) in the last decade, particularly in mobile computing and high-speed broadband, there is a renewed interest in teleworking owing to its potential benefits to workers, employers and society at large. The Federal Government, for example, aims to double Australia’s level of telework by 2020, so that at least 12 per cent of Australian employees report having a telework arrangement with their employers.
In parallel to technological developments the emerging knowledge economy—characterised by significant growth in the professional services (financial, business, IT, and media services)—has seen work become more flexible both in terms of when work can be performed (‘9 to 5’ less the norm) and where work can be performed1. Whilst working from home remains an important element of teleworking, teleworking is increasingly a matter of ‘anywhere working’.
Outside the home and office, the so-called ‘third space’ has come to accommodate work both inadvertently (between meetings, on the train, at the airport lounge) and purposefully (the coffee shop, the public library). Critically, this work differs from traditional work ‘in the field’ that may have previously occurred before advances in
1 Hardill & Green 2003
ICT. Whilst the inadvertent occupation of these third spaces is an inevitable outcome of increasingly flexible working practices and technological advances, it is the purposeful occupation of third spaces, for reasons of proximity, convenience, worker productivity and open innovation, that has the potential to complement home-based telework, and to further displace work performed in centralised office.
Hub Melbourne co-working space photographer Nathan Dyer

SMART WORK CENTRES: AN ANALYSIS OF DEMAND IN WESTERN SYDNEY 9
INSTITUTE FOR SUSTAINABLE FUTURES JANUARY 2014
2.1.2 The potential for Smart Work Centres Whilst further enabling telework, third spaces also present a new set of challenges to remote working. Principally, they restrict the range of work functions and duration of work that can be performed (for example, the extent to which a coffee shop can be patronised; the use of a phone in a public library; the need for a power supply, the need for enclosed meeting space, etc.).
Teleworking hubs or Smart Work Centres remove such constraints by providing a well-equipped office-like environment in close proximity to workers whom might otherwise commute to the location of their employer’s main office. Smart Work Centres also overcome a number of barriers to working from home, such as feelings of isolation, absence of workplace culture, home-based distractions and access to agglomeration benefits (open innovation via knowledge “spill-overs”).
Regional Development Australia (RDA) Sydney is working with partners to assess the viability of the Smart Work Centre model as an opportunity to promote jobs closer to home and promote local economic development, consistent with the purpose of:
• Consulting and engaging with the community on economic, social and environmental issues, solutions and priorities;
• Liaising with governments and local communities about government programs, services, grants and initiatives for regional development;
• Supporting informed regional planning; • Contributing to business growth plans, investment
strategies, environmental solutions and social inclusion strategies in Sydney.
The plan has involved working closely with the Western Sydney Regional Organisation of Councils (WSROC) to explore the
development of Smart Work Centres as an integrated mix of satellite offices for CBD-based employers, centres for local business services and co-working (e.g. for entrepreneurs).
The NSW Government’s Decentralisation Taskforce, charged with reviewing the Government’s Decade of Decentralisation Strategy, also notes the potential for a network of Smart Work Centres to invigorate outer metropolitan and regional areas2.
Given the international success of telework and the forthcoming roll out of high speed broadband in Australia – this provides a singular opportunity for Blacktown, Penrith or Liverpool to spearhead the implementation of Smart Work Centres in western Sydney. In doing so, Smart Work Centres can help realise the Australian Government’s goal of doubling Australia’s level of telework by 2020, such that at least 12% of Australian employees report having a teleworking arrangement with their employers.
2 NSW Decentralisation Taskforce 2013

SMART WORK CENTRES: AN ANALYSIS OF DEMAND IN WESTERN SYDNEY 10
INSTITUTE FOR SUSTAINABLE FUTURES JANUARY 2014
2.1.3 Research process and objectivesThe aim of this research is to analyse a variety of demand factors, focusing on user demand, that are important components of a potential business case development for any pilot project of Smart Work Centres. Blacktown, Liverpool and Penrith have been selected as the specific subjects of this study due to their locations, populations, jobs targets under the Draft Sydney Metropolitan Strategy, access to public transport services and expressed interest in this area.
Figure 1 outlines the process used to establish demand and analyse the costs and benefits of Smart Work Centres in Penrith, Liverpool and/or Blacktown. The methodology used to estimate demand is explained in more detail in Section 4.
Following a literature review on the definitions of, and the circumstances that support teleworking, the study examines the 3 LGAs to determine if their commuting patterns and demographics meet the conditions. The study uses census data to forecast a demand for a centre in any one of the 3 locations. Public and private benefits are calculated for avoiding long commuting journeys, specific to the target journeys identified. The report goes on to propose a scenario for a successful centre based on the findings from the research. The next step in implementing a centre would be to develop a business case for a selected site, however this is outside the scope of this study.
Figure 1: Research process
Establish commuting geographies
Labour trends & telework opportunities
Cost of long commutes
Scenarios for Smart Work Centre
Recommendations for progressing scenarios
Business case development (by stakeholders)
Literature and evidence review
Forecasting user demand

SMART WORK CENTRES: AN ANALYSIS OF DEMAND IN WESTERN SYDNEY 11
INSTITUTE FOR SUSTAINABLE FUTURES JANUARY 2014
3 CONTEXT
3.1 What is telework? Definitions of teleworking range from the loose ‘working outside of a main office’ or ‘working from home’ to the more detailed ‘worked outside of the main office for a certain number of hours during normal office hours’. Despite these differences, the concept has certain fundamental attributes that can be used to form a working definition for this study on the potential demand for Smart Work Centres (Figure 2). These attributes have been drawn upon to inform the definition of telework adopted in this report:
A arrangement with between employer and employee that allows work to be performed outside of a usual place of work on a regular basis that reduces commuting time, by harnessing ICT which reproduce significant aspects of the centralised work environment.
The approach taken in this study has been to restrict the definition to a regular pattern of telework (e.g. at least a few hours a month that displaces time otherwise spent in the office). Excluding so-called ‘day extenders’—workers who take their work home after a normal days work in the usual centralised workplace—also provides a more accurate representation of the potential demand for ‘displacement telework’, that is, work that displaces work performed in the usual place of work and reduces commuting time.
Critically, the attributes of telework identified in Figure 2 and the definition of telework adopted here offer insight into potential candidates of telework, and in turn, potential clients of Smart Work Centres, as is discussed in later sections of this report.
Figure 2: Attributes of telework

SMART WORK CENTRES: AN ANALYSIS OF DEMAND IN WESTERN SYDNEY 12
INSTITUTE FOR SUSTAINABLE FUTURES JANUARY 2014
3.2 Benefits of teleworkThe potential benefits of telework are well-documented.3 It is important to note that of the benefits derived from telework, almost all are enabled by the impact teleworking has on reducing commuting time and improving the accessibility and flexibility of work.
Shown in Table 1, the benefits of teleworking can accrue to employees, employers and society at large. Some benefits are easily valued in monetary terms, others are more difficult to quantify. In 2010, a study commissioned by the then Department of Broadband, Communications and Digital Economy (DBCDE) found that if 10% of Australian employees were to telework 50% of the time, the total annual gains from teleworking would be in the order of $1.4-$1.9 billion per year as a result of savings from travel avoided, reduced office accommodation costs, increased labour force participation and the retention of relocation staff.4
3 For example, see Tremblay & Thomsin (2012); Wheatley (2012); Deloitte Access Economics (2011); White et al. (2011); Access Economics (2010); Baruch (2000). 4 Access Economics (2010)
Table 1: Benefits of telework
Employee benefits
• Commuting and vehicle costs • Flexibility and improved work/life balance • Increased job satisfaction • Greater ability to participate in the workforce –
particularly for carers and people in regional locations • Flexibility of location • Improved health and well-being – reduced exposure to
pathogens; reduced stress
Employer benefits
• Recruitment and retention – being able to employ workers without geographical limitations; attraction of flexibility associated with multiple workplaces; retention of corporate tacit knowledge
• Reduced absenteeism – improved staff morale; teleworkers will often continue to work from home when ill; reduced exposure to pathogens
• Business resilience – in cases of disruptions to the main workplace or transport networks
• Increased productivity • Reduced office space costs – reduced staff to floor
space ratio • Reduced utilities costs – electricity, etc. • Office decentralisation – in cases of heavy use of
telework the option of moving to a cheaper location
Societal benefits
• Increased labour force participation through improved access
• Reduced congestion and infrastructure demand • Regional development • Reduced/avoided environmental impacts

SMART WORK CENTRES: AN ANALYSIS OF DEMAND IN WESTERN SYDNEY 13
INSTITUTE FOR SUSTAINABLE FUTURES JANUARY 2014
3.3 Reasons for teleworking Reasons given for teleworking are a reflection of the benefits as perceived by employees. Many studies have examined workers’ motivations for teleworking. Reasons commonly cited include flexibility, greater productivity, and ability to achieve work life balance, such as caring for dependents (e.g. ill child). The ABS (2002) survey of teleworking in NSW, for example, asked respondents to identify motivations for working from home (Figure 3). It is important to note that motivations for home-based teleworking may differ to motivations for ‘anywhere’ teleworking. This point is revisited in the following sections.
Figure 3: Main reason for working from home (% total ‘teleworkers’), adapted from ABS Teleworking Survey
3.4 Barriers to telework Much of the research on the barriers to teleworking was completed over a decade ago, so before the current wave of ICT products and services and the proliferation of the knowledge economy. For example in 2001 the ABS conducted a survey of telework in NSW. It defined teleworkers as employed persons aged 15 years and over in NSW who worked at a fixed workplace, for a business that was not based at their own home and in the last 3 months worked at home during normal business hours for a full or part day. The survey found that 47% of all teleworkers would like to telework more often, whilst 38% of those who work at home only after normal business hours would also like to telework. The most common reasons given by all employed persons for not teleworking more often were type of work not suitable (63%), employers not allowing it (14%) and lack of equipment (12%). Importantly, a survey targeted at occupation types most amenable to teleworking (refer to section 3.5) may yield different insights.
Improving the rate of teleworking requires an understanding of the barriers to telework, of which there are many. A crucial finding of this review is the potential for Smart Work Centres to overcome some of the barriers associated with home-based teleworking.
Barriers to telework may be structural or cultural
Structural barriers—are concerned with the physical elements of telework, such as access to the Internet and bandwidth, relevant software, an EH&S certified workspace, data security etc.
Cultural barriers—stem from concerns and misconceptions surrounding telework or the extent to which structural barriers are perceived to be a problem. They are also concerned with management and support systems generally needed to facilitate
Main%reason%for%teleworking0
Work commitments/job requires it
Less distractions
Childcare/family considerations
Greater productivity
Flexibility
Other
Save travelling time/costs
More pleasant working environment
12%
11%
11%
3%
2%
33%
15%
13%

SMART WORK CENTRES: AN ANALYSIS OF DEMAND IN WESTERN SYDNEY 14
INSTITUTE FOR SUSTAINABLE FUTURES JANUARY 2014
telework, such as a teleworking policy (informal or formal). Even if such a policy is in place, employee and employer attitudes can determine are the extent to which teleworking is adopted.
In the case of the ABS survey, ‘lack of equipment’ is a structural barrier, whilst ‘employers not allowing it’ is a cultural barrier, potentially reflecting concerns around structural barriers, or a management culture that dissuades or prevents teleworking activity due to concerns around productivity and appropriate access to staff. Cultural barriers are reflected in employee and employer perceptions of teleworking.
Table 2: Barriers to telework
Structural • EH&S requirements—costs and monitoring • Infrastructure/equipment and ICT—costs and
support • Employee surveillance/access • Disrupted information flows; reduced opportunities
for ‘serendipitous’ encounters • Lack of teleworking workplace (e.g. home-based
teleworking not an option)
Cultural • Attitudes surrounding structural barriers • Work tasks not suitable • Trust and accountability • Worker preferences (access to workplace culture
and locational amenities; issues with isolation) • Employer access to employees • Information flows • Appropriate skills for autonomous working
Employee perceptions One study of 628 employees, 95 per cent of whom were information or clerical workers (the occupation types most likely to telework, refer to Section 3.5), found that 44 per cent of employees did not consider their jobs suitable5 for teleworking from home.6 Another study found 38 per cent of 686 workers, many of which were classified as information workers, thought their job unsuitable for home-based telework. In an Australian study, 74 per cent of respondents reported their job unsuitable for teleworking, although this sample contained a reduced representation of information workers relative to the previous studies mentioned.7 Employee perceptions of suitability may also mask concerns of being absent from the office. In a review of the literature, Baruch (2000) for example identified employee concerns as having less opportunities for affiliation, detachment from social interaction, more home related stress, less influence over people and workplace events, fears of job insecurity, fewer career development opportunities.
Employer perceptions Perhaps more important than employee perceptions are management/employer perceptions, as these will dictate whether employees can telework in the first place, and will shape employee perceptions about suitability. In a study of 868 employers surveyed
5 Taking the definition of telework provided earlier, job suitability is not identified as a barrier to teleworking per se, as only certain types of jobs are amenable to teleworking. This is discussed in the following section. The more important question is rather of those jobs suited to teleworking, which work activities are amenable to telework? As the delineation between job and task suitability is often not clear, the above mentioned studies point to perceived structural and relational barriers, as well as the fact that teleworking may not be well understood. 6 Mokhtarian & Salomon (1996) 7 Brewer and Hensher (1996)

SMART WORK CENTRES: AN ANALYSIS OF DEMAND IN WESTERN SYDNEY 15
INSTITUTE FOR SUSTAINABLE FUTURES JANUARY 2014
in Singapore, 82 per cent perceived their information worker employees to be unsuitable to teleworking8. It has been suggested that employers are likely to take a more conservative view of teleworking than employees do themselves, depending on the level of familiarity and with the concept and the degree to which it is practiced. 9 In the recent Trans-Tasman Telework Survey, which included interviews with 93 managers, the greatest barriers to teleworking were found to be cultural—management trust, attitudes to teleworking and the need for worker autonomy and accountability.10 In a review of the literature, Baruch (2000) identified employer concerns around less committed employees teleworking, loss of team-work, and access to employees.
Once again, it is important to note that many barriers identified in the literature are concerned with home-based teleworking, as many studies confine the definition of telework to the home and to date most teleworking is associated with working from home.
As is revisited throughout this report, Smart Work Centres can overcome many structural barriers to home-based telework. This is a particularly important point to make when assessing the potential demand for a Smart Work Centre.
8 Olszewski & Lam 1996 9 Mokhtarian 1998 10 Bentley et al. 2013
Hub Adelaide co-working space photographer Nathan Dyer
Hub Sydney co-working space photographer Nathan Dyer

SMART WORK CENTRES: AN ANALYSIS OF DEMAND IN WESTERN SYDNEY 16
INSTITUTE FOR SUSTAINABLE FUTURES JANUARY 2014
3.5 Who are teleworkers?
3.5.1 Workers of the information economy It is well established that not all jobs are amenable to teleworking. The first point of differentiation is that teleworking jobs are those that rely on ICT to enable work to be performed remotely. The Australian Telework Advisory Committee (ATAC) for example, confines telework to work that involves telecommunications technology.
[Teleworking is] a form of flexible working, which is enabled by ICT, and undertaken outside of a traditional office environment.11
A reliance of ICT to perform work activities remotely is seen as a hallmark of telework.12 Garrett & Danziger (2007) for example, in their development of a taxonomy of teleworking, argue the use of ICT in remote working is fundamental to the definition of telework:
We recognize that work at home or away from a traditional office by information workers predates the widespread use of work-related ICTs, but we view telework as unique. To constitute telework, the technologies employed must reproduce, at a distance, significant aspects of the centralized work environment, providing access to necessary information resources while supporting multiple modes of information manipulation (e.g., browse or search, edit, calculate, etc.) and/or exchange (e.g., voice, text, images,
11 ATAC 2006 12 Schofield 2009 in Deloitte Access Economics 2011; Sullivan 2003.
etc.). In this view, doing computer-supported work at home or in the field, whether networked or not, or accessing work-related information via a web-enabled phone while away from the office, meet our ICT-use criterion for telework (but taking paperwork home, using a courier service, or calling the office via a mobile phone do not). Defining telework in terms of these modalities provides a reasoned basis for foregrounding the ICTs that have become a central element of most contemporary telework definitions.
This definition of teleworking lends itself to occupations that might traditionally have only been found in the office owing to (i) technological constraints; and (ii) requiring some element of collaborative work activity. In the ABS (2002) NSW survey on teleworking for example, the most commonly used ICT included the telephone (72%), mobile phone (68%), internet (67%) and email (65%)13. Two thirds of teleworking employees used technologies supplied by their employer (most commonly a laptop and a mobile phone). Knowledge/information workers and sales and marketing personnel are considered prime candidates for telework because their jobs are suited to many tasks that can be performed remotely with appropriate ICT.14
A reliance on ICT points to established and emerging occupations associated with the professional services sector of the global
13 It is important to note considerable technological developments that have taken place since this study, which has likely facilitated the adoption of teleworking practices (refer to section 3.4). 14 Bailey & Kurland 2002

SMART WORK CENTRES: AN ANALYSIS OF DEMAND IN WESTERN SYDNEY 17
INSTITUTE FOR SUSTAINABLE FUTURES JANUARY 2014
knowledge economy, such as the finance, advisory, legal, research and consulting services, and the rise of creative industries, including design, new media and advertising, in both the public and private sectors.15 Some authors have also pointed to flexible managerial and clerical roles, which also lend themselves to anywhere working.16 In all of these industries, on-going advances in ICT are key to enabling flexible work practices and the geographical ‘spread’ of work that was previously confined to the main workplace.
Other studies have found the existence of formal teleworking practices in the manufacturing, wholesale and retail industries, although it is likely these teleworkers are information workers as opposed to process workers (e.g. labourers).17 Journey-to-work data for the Greater Sydney Metropolitan Area illustrates this point, when ‘worked from home’ is taken as a proxy for (home-based) teleworking. As Figure 4(a) shows, almost all industries had some people working from home, but as Figure 4(b) shows, the majority of workers who did work from home fall into the information worker categories (managers, professionals and clerical and administrative workers).
15 In the ABS study, 74% of teleworkers were found to work in the private sector, however a greater proportion of employees within the public sector teleworked (10% compared to 7% in the private sector). This is consistent with the findings of Lafferty & Whitehouse (2000) who found a higher incidence of telework in government administration organisations. 16 Lafferty & Whitehouse 2000. 17 Ibid.
Figure 4: Working from home by (a) industry and (b) occupation, Greater Sydney. Section 6 examines this data in more detail.
0
5000
10000
15000
20000
25000
No. w
orke
rs
(a) Working from home by industy in Greater Sydney, 2006-2011
2006 2011
0 5000
10000 15000 20000 25000 30000 35000
No. w
orke
rs
(b) Working from home by occupation, Greater Sydney, 2006-2011
2006
2011

SMART WORK CENTRES: AN ANALYSIS OF DEMAND IN WESTERN SYDNEY 18
INSTITUTE FOR SUSTAINABLE FUTURES JANUARY 2014
The journey-to-work data for the Greater Sydney Metropolitan Region is consistent with the findings of a Bureau of Transport Statistics 2011 study18, which identified 84% of teleworkers as managers, professionals and administrators. It is also consistent with the recent Trans-Tasman Teleworking Survey19, which found 72% of teleworkers identified as working in the Financial and Insurance Services (28%); Information Media and Telecommunications (26%); Professional, Scientific and Technical Services (10%); Administrative and Support Services (4%); and in Public Administration and Safety (4%).
3.5.2 Demographic characteristics of teleworkers Previous studies have found common demographic characteristics of teleworkers. One such study showed the typical U.S. teleworker is around 42 years old and has a median income of US$45 200 (in 2002).20 A Finnish study found teleworkers to be primarily high income, highly educated, independent professionals.21 In Australia, the Bureau of Transport Statistics 2011 study similarly found 67% of teleworkers fell into the highest income bracket (equal to and above $60,000).22 The Trans-Tasman Teleworking Survey meanwhile found most respondents (89% who indicated they teleworked more than one hour per week) were full-time employees working on average 42.3 hours per week, had permanent employment status (90%), were mostly non-managerial employees (60%), and were relatively experienced, having spent on average 5.8 years in their current role.
18 Corpuz 2011 19 Bentley et al. 2013 20 International Telework Association and Council 2000 21 Luukinen 1996 22 Corpuz 2011
Research to date also suggests that the teleworking population may be divided along occupational and gender lines, with a predominantly male professional segment and a largely female clerical segment.23 An Australian study for example, found a higher proportion of female teleworkers in government administration and communication organisations.24 In 2001, the ABS found that more than half (58%) of teleworkers were male, however this did not differ significantly from the sex distribution of employed persons generally. The same survey found that people aged 35-44 were most likely to telework (38% of all teleworking activity). The aforementioned Bureau of Transport Statistics survey similarly found 59% of teleworkers were male, and that 68% of teleworkers were between the age of 31 and 50, whilst the Trans-Tasman Teleworking Survey found 54% of respondents25 were male. The latter also found 79% were married or living with a partner, and an average age of 30.3.26 Relatedly, teleworkers are also more likely to have children, highlighting the use of teleworking as a means to balance work and home life.27
23 Bailey & Kurland 2002 24 Lafferty & Whitehouse 2000 25 Demographic statistics of sample are for all respondents, of which 89% indicated they teleworked more than one hour per week 26 Bentley et al. 2013 27 Corpuz 2011; Golden 2008

SMART WORK CENTRES: AN ANALYSIS OF DEMAND IN WESTERN SYDNEY 19
INSTITUTE FOR SUSTAINABLE FUTURES JANUARY 2014
3.6 The new spatiality of telework
3.6.1 Beyond the home office The term teleworking was first coined in the 1970s and is often deployed with reference to working from home. For example, a recent study by Deloitte Access Economics confined the definition of teleworking to an arrangement where an employee works from home on a regular basis.28
Importantly, confining telework to home-based telework excludes (tele)work performed in from third spaces (neither home nor the main office). Deloitte cites greater cost savings and environmental benefits with working from home as the reason for this. Whilst such benefits are apparent, it is important to recognise the role and benefits of third space telework in the digitally-enabled economy.29 With on-going advances in ICT, the future spatiality of (tele)work is likely to comprise a mix of working from home and anywhere working from third spaces, notably, Smart Work Centres.
3.6.2 The rise of third spaces? Sociologist Ray Oldenburg first coined the term ‘third space’ when he sought to distinguish between the workplace (first or primary space) and the home (secondary space)30.
28 Deloitte Access Economics 2011 29 Lafferty & Whitehouse 2000 30 Third spaces are places where we “relax and build communities” (Bland 2013). In a discussion of teleworking, the term has wider applications than ‘public space’. This is because recent decades have witnessed a blurring of the public and private realms (for example shopping malls)—a phenomenon which has
For many workers third spaces are used inadvertently for telework—work performed in-between meetings when travelling for business for example, in coffee shops, cafés, public libraries, airport lounges, on the train and in hotel rooms and lobbies. Workers can use these spaces for telework because of advanced ICT that enables them to do so. In the past, this ‘down-time’ work has generally not been considered to be telework per se. With advances in ICT and a growing awareness of the value of knowledge sharing and networking in innovation, workers are now purposefully occupying third spaces. Reasons for (tele)working in third spaces are varied and span:
• the rise of flexible working practices (‘9 to 5’ less the norm in the global economy) and freelance work (tied to increasingly ‘loose’ organisational assemblages of mobile workers)31;
• opportunities for professional networking and knowledge sharing;
• the search for a more vibrant atmosphere or change in surroundings (e.g. coffee shop) and conversely, spaces for concentration and solitary work (e.g. library); and perhaps most importantly,
• geographical convenience relative to the usual place of work (e.g. CBD).
received much attention by human geographers (Baxter & Kroll-Smith 2005; Mitchell 1995). 31Whittle & Mueller 2009

SMART WORK CENTRES: AN ANALYSIS OF DEMAND IN WESTERN SYDNEY 20
INSTITUTE FOR SUSTAINABLE FUTURES JANUARY 2014
3.6.3 Telework, collaboration and consolidation in the knowledge economy
The location of third spaces is an obvious factor in influencing when and why they are used for work. Opportunities for collaboration are another important factor. A critical aspect of third spaces is that they offer something working from home does not—an ability to collaborate and to network face-to-face outside the main office, whilst retaining the advantage of geographical convenience and still offering virtual connectivity.
The importance of collaboration and networking, virtual or otherwise, to organisational effectiveness in the information economy is well established.32 Whilst virtual collaboration continues to gain momentum with advances in ICT, the benefits of physical agglomeration and face-to-face social networking are well documented, particularly as they relate to knowledge-intensive industries.33 This literature has influenced the uptake of workplace consolidation practices by many firms in recent times34, with some prominent firms (e.g. Yahoo, Google) even outright rejecting home-based teleworking.35 The emergence of a new paradigm of flexible sustainable office design attempts, to a certain extent, to recreate in office space the conditions that might attract workers to third spaces (day-lighting, vibrant atmosphere, stimulating surrounds), with the idea that keeping more staff on the premises will allow a firm to capitalise on knowledge generation and transfer, as an interviewee of Boyle & McGuirk (2012) explains:
32 Beyerlein et al. 2003 33 Obembe 2012; Sonn & Storper 2008; Torre 2008; Tagliaventi 2006; Zoltan & Varga 2005; Rosenthal & Strange 2001; McCann 2000; Audretsch 1998. 34 Boyle & McGuirk 2012; Heerwagen et al. 2004. 35 Grubb 2013; Moses 2013
[These spaces] can be healthier for your staff, and you can improve their productivity as a result ...So there’s a social place where people can go to perhaps relax and have a coffee. At the same time [they might] interact with their work mates and perhaps enhance creativity, idea generation, sharing of knowledge.
Boyle & McGuirk (2012) found the theme of agglomeration benefits to be repeated in their discussions with stakeholders of Sydney’s commercial property market and throughout the literature on office design and the knowledge and creative industries. For example,
[t]he most productive conversations are the result of chance encounters in the work place. Similarly, a generosity of space filled with natural light can encourage people to linger, and provides alternate places to work and interact.
While arguments for agglomeration benefits remain pervasive, there are a number of reasons why both home-based and anywhere (tele)working are likely to play a complementary and increasingly important role to work performed in centralised offices, in spite of a recent workplace paradigm that promotes consolidation.
First, whilst collaboration is important, solitary work remains an essential element to many office-based occupations. Second, as noted earlier, the many benefits of telework, for employees, employers and the wider community, are well documented. Further, discussion is now turning to the potential benefits of interaction outside of the central office for employers, as a means of pursuing open innovation, “a paradigm that assumes that firms can and should use external ideas as well as internal ideas, and
SMART WORK CENTRES: AN ANALYSIS OF DEMAND IN WESTERN SYDNEY 21
INSTITUTE FOR SUSTAINABLE FUTURES JANUARY 2014
internal and external paths to market”.36 Finally, on-going advances in ICT will continue to render virtual collaboration easier and cheaper.
Importantly, the extent to which third spaces are currently used for telework is largely unknown. This is likely due to the fact that teleworking has in the past predominantly been defined as work performed at home. A recent study of Australian and New Zealand organisations found that 85% of workers who reported to telework at least some of the time for their current employer, teleworked from home, whereas only 7% reported as teleworking elsewhere or in the community.37 Through qualitative insights, the same study also found that ‘anywhere working’ is on the rise.
The extent to which third spaces in general can be used for telework may be capped however, owing to the fact these spaces are not places traditionally set-up for teleworking activities. Unlike other third spaces that do not cater well to prolonged periods of teleworking (e.g. coffee shops, airports) or restrict the kinds of collaborative activity (virtual or otherwise, e.g. libraries), Smart Work Centres may be considered as a special kind of third space tailored to all manner of teleworking activities.
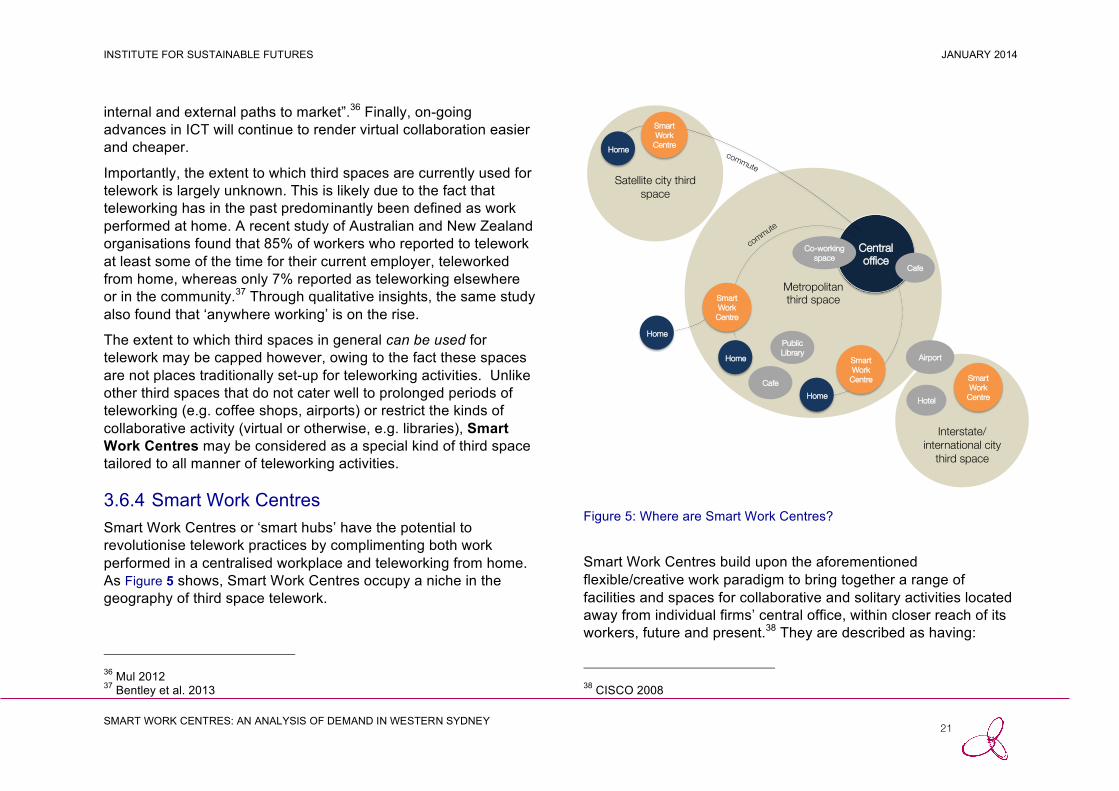
3.6.4 Smart Work Centres Smart Work Centres or ‘smart hubs’ have the potential to revolutionise telework practices by complimenting both work performed in a centralised workplace and teleworking from home. As Figure 5 shows, Smart Work Centres occupy a niche in the geography of third space telework.
36 Mul 2012 37 Bentley et al. 2013
Figure 5: Where are Smart Work Centres?
Smart Work Centres build upon the aforementioned flexible/creative work paradigm to bring together a range of facilities and spaces for collaborative and solitary activities located away from individual firms’ central office, within closer reach of its workers, future and present.38 They are described as having:
38 CISCO 2008
Interstate/
international city third space
Satellite city third space
Metropolitan third space
Central office
Hotel
Public Library
Cafe
Smart Work
Centre
Smart Work
Centre
Co-working space
Smart Work
Centre
Cafe
Airport Smart Work
Centre
Home
Home
Home
Home

SMART WORK CENTRES: AN ANALYSIS OF DEMAND IN WESTERN SYDNEY 22
INSTITUTE FOR SUSTAINABLE FUTURES JANUARY 2014
• A mix of individual offices • Shared flexible office spaces • Meeting rooms • Shared reception • Other facilities
Smart Work Centres thus offer an extension to home-based teleworking by providing access to facilities that may be too expensive or impractical for the home office, such as video conferencing facilities, ultra-fast broadband, meeting spaces, printing facilities, etc. They also enable workers to delineate spaces of ‘work’ and ‘home’ by opening up telework opportunities that may have been previously constrained by the home environment (e.g. distractions, such as children, other household occupants, noise, and feelings of isolation, etc.) and provide a social atmosphere that may be lacking in the home or central office environment, as noted in a recent Microsoft working paper.
Nomadic workers looking for workspace between head office and home will use innovative third space hubs at networked foci around the city and beyond. (Microsoft White Paper, ‘The Anywhere Working City’ www.theanywhereorganisation.com)
In this regard, Smart Work Centres can also act as an incubator of open innovation (refer above).
Smart Work Centres can be differentiated from co-working spaces and serviced offices in several ways (Table 3). Location is key, but target markets and the general ambience of the workplace can also differ. Smart Work Centres also differ from ‘business incubator’ sites, the purpose of which is to nurture entrepreneurs and start-ups.
Table 3: How Smart Work Centres differ
Serviced offices Co-working space
Smart Work Centre
Where usually found
CBD, Satellite nodes
CBD, CBD edge
Suburban nodes, Regional centres
Target market SMEs Small enterprise, freelance workers, start-ups, visiting workers
Primarily teleworkers (but also freelance workers, start-ups and small enterprise)
Ambience (generalisation)
Corporate/private Collaborative/ creative
Corporate/ collaborative
Co-working spaces such as Hub SydneyTM are often located in the CBDs of cities owing to their target market—a mix of freelance workers, small enterprise, start-ups and visiting workers (who might be considered ad-hoc teleworkers). Co-working spaces are in many ways premised on providing a social atmosphere and opportunities for networking and open innovation. As such they are typically located in highly accessible areas of the city, at the point of the greatest number of transport interchanges, i.e. the CBD. Smart Work Centres, by contrast, are located away from clusters of centralised workplaces (the CBD’s of Sydney, North Sydney for example), closer to the suburban homes of workers. In other words, they are primarily geared toward accommodating teleworkers. A Smart Work Centre located in Penrith, Liverpool or Blacktown for example, would provide workers who might

SMART WORK CENTRES: AN ANALYSIS OF DEMAND IN WESTERN SYDNEY 23
INSTITUTE FOR SUSTAINABLE FUTURES JANUARY 2014
otherwise commute to the Sydney CBD with the option to telework a few days a week closer to home.
Smart Work Centres also differ from serviced offices or executive suites, which provide short and long-term managed office suites under a lease arrangement. Smart Work Centres can therefore be distinguished from serviced offices by way of the target market (primarily teleworkers as opposed to temporary or long-term tenants) and the ambience or ‘feel’ of the workplace.
3.6.5 Comparison of benefits between spaces Table 4 provides a comparison of benefits between different types of workplaces. It highlights the complementary role of both home-based teleworking and teleworking from Smart Work Centres relative to work performed in a central workplace. In other words, it is likely teleworking won’t displace work in a main workplace entirely, nor will Smart Work Centres completely replace the need for home-based teleworking.
The purpose of Table 4 is principally to highlight the differences between home-based teleworking and teleworking from a Smart Work Centre, and to show how Smart Work Centres can potentially overcome some existing barriers to telework (Section 3.4). For example, Smart Work Centres can alleviate feelings of isolation that might be encountered with home-based teleworking, and which may have been acting as a barrier to a worker choosing to telework. Smart Work Centres also offer workers who were previously not interested in working from home due to household/family distractions the opportunity to telework. As noted elsewhere, this discussion is an important consideration for determining the potential demand for a Smart Work Centre.
Table 4: Comparison of workplace benefits
Benefit Facet Cen
tral
Wor
kpla
ce
Hom
e-ba
sed
tele
wor
king
Sm
art
Wor
k C
entre
Reduced commuting and vehicle costs
� � Reduced transport congestion � � Flexibility and improved work/life balance
(i) Care of dependents (supervision) � (ii) Easy access to
home/dependents (non-supervised) � � Improved labour force participation � � Fewer distractions (i) Benefits of solitude � (ii) Away from home distractions
and central workplace obligations � Improved health and well-being (i) Reduced stress � � (ii) Lower risk of illness � Recruitment and retention (i) Flexibility in workplace offering—
employee preferences � � (ii) Increased job satisfaction � � Workplace culture/social atmosphere
� � Open innovation / creative interaction
� Ease of supervision � � Reduced absenteeism � � Business resilience � � Reduced office accommodation costs
(i) Lower rate of take-up and low employer costs �
(ii) Greater potential for take-up but at rental costs less than CBD �
Ease of ensuring EH&S compliance � � Supporting dispersed economic activity
� � Agglomeration benefits � �

SMART WORK CENTRES: AN ANALYSIS OF DEMAND IN WESTERN SYDNEY 24
INSTITUTE FOR SUSTAINABLE FUTURES JANUARY 2014
4 METHODOLOGY
4.1 Overview There are two distinct tasks to determining the benefit of a Smart Work Centre:
1) Estimate the number of workers who might utilise the centre on a given day;
2) Estimate the private and public benefits that result for each worker who is ‘diverted’ from their regular commute to a smart work centre.
The approach to calculate the potential demand for a Smart Work Centre in each of the study areas of Blacktown, Liverpool and Penrith has been to take the current level of ‘working from home’ in occupations identified as suited to telework in Smart Work Centres as a proxy for determining the probable uptake of teleworking in Smart Work Centres after applying commuting time-saving and proximity factors.
4.2 Determining The Catchment To accurately determine demand for Smart Work Centres for Sydney requires detailed surveys of work preferences and choices of both employers and employees, which is beyond the scope of this study (refer to Section 4.4 Demand factors). Instead, we estimate plausible ‘catchment’ sizes for Smart Work Centres in Liverpool, Blacktown, and Penrith, as shown in Figure 6.
As discussed in Section 3.5, certain occupations are more likely to be suited to telework. The number of relevant workers has been quantified using the Australian and New Zealand Standard
Classification of Occupations (ANZSCO) level one categories of ‘Managers’, ‘Professionals’ and ‘Clerical and Administration Workers’ as these professions are most likely to telework and most likely candidates for teleworking in a Smart Work Centre.
Figure 6 covers the basic process, but interested readers will find a more detailed description, that also discusses the underlying commuting and travel time data used, in Appendix A. Once the number of workers in the catchment for a Smart Work Centre has been determined, public and private benefits can be quantified.
Hub Sydney co-working space photographer Nathan Dyer

SMART WORK CENTRES: AN ANALYSIS OF DEMAND IN WESTERN SYDNEY 25
INSTITUTE FOR SUSTAINABLE FUTURES JANUARY 2014
Figure 6: Approach to determining demand
4.3 Quantifying benefits There are many potential benefits that could arise from a network of Smart Work Centres, as described in Section 3. While many of these benefits are intangible, it is important to quantify as many of them as possible, in order to clearly present the benefits of a Smart Work Centre.
4.3.1 Private benefits It is important first to distinguish between two different types of benefits. Private costs and benefits are those enjoyed by employers or employees. So an employee who saves 20 minutes in commute time by travelling to a smart work centre rather than their regular work enjoys a private benefit of 20 minutes in saved time. Similarly, an employer may be able to reduce the amount of office space they occupy if employees work at smart work centres, and the resulting saving is a private saving to the employer. While private benefits are relatively easy to quantify, private costs are more difficult. Is there reduced productivity as a result of a worker working in a smart work centre compared with working in the office? Quantifying the productivity benefits of being physically present is exceedingly difficult. Consequently, we make no attempt to exhaustively quantify private costs & benefits, and instead present selected private benefits of Smart Work Centre.
The following private benefits are considered:
1) Travel time saved as a result of shorter commutes to a smart work centre. Time saved is valued at $14/h – the same value as used in the Strategic Travel Model for commuting.39
39 http://www.atrf11.unisa.edu.au/Assets/Papers/ATRF11_0201_final.pdf

SMART WORK CENTRES: AN ANALYSIS OF DEMAND IN WESTERN SYDNEY 26
INSTITUTE FOR SUSTAINABLE FUTURES JANUARY 2014
2) All tolls saved as a result of commuting to a smart work centre instead of usual work destination.
3) Petrol saved due to a shorter commute. Petrol is valued at $1.40 per litre.
Other privately borne benefits/costs not considered are noted in Appendix A.
4.3.2 Public benefits Public benefits are the benefits to the broader public that arise as a result of a shift to smart work centres. For instance, a worker who makes a short trip to a Smart Work Centre rather than a long trip to a workplace, saves commute time and petrol money (a private benefit, as discussed), but also indirectly saves time and money for other travellers because one less car on the road network increases travel speeds for other travellers. This increase in speed for other commuters is a public benefit of the altered trip. While we have mentioned that private benefits/costs are quite difficult to reconcile, and so we make no concerted effort to do so, we do make a concerted effort to quantify the public benefits of Smart Work Centres.
More information on public benefits can be found in Appendix A.
4.4 Demand Factors
4.4.1 Current teleworking rate—candidate occupations
ABS journey-to-work data (derived from the Census) can be used as a proxy for estimating the incidence of home-based teleworking and teleworking in general among certain occupations, as noted in Section 3.5. There are several reasons for using journey-to-work data:
• working from home trends can be compared over time • the definition of telework and teleworkers and the sampling
method employed varies between one-off studies • one-off studies do not always capture informal teleworking
where there is no official teleworking policy in place—as noted in Section 3, the incidence of informal teleworking is worth noting40
• as noted in Section 3, the demand for a Smart Work Centre includes home-based self-employed workers in addition to workers with a formal/informal teleworking arrangement in place with their employer, the former is a cohort generally not captured in teleworking surveys as they are not teleworkers.
The demand outputs (Section 7) are cross-referenced with estimates of current teleworking activity, discussed in Section 6.
The approach assumes 6% of available workers (workers within the defined catchment) will be candidates for a Smart Work
40 Some studies have confined informal teleworking to ‘day extenders’. Here informal teleworkers excludes day extenders.

SMART WORK CENTRES: AN ANALYSIS OF DEMAND IN WESTERN SYDNEY 27
INSTITUTE FOR SUSTAINABLE FUTURES JANUARY 2014
Centre, based on current rates of working from home in the occupations most likely to telework (refer to Section 6).
This does not assume the pool of potential candidates for Smart Work Centres will come only from existing home-based teleworkers. A network of Smart Work Centres will likely increase the overall rate of teleworking. This is because Smart Work Centres can overcome some of the barriers associated with home-based teleworking, therefore likely also drawing on current non-teleworkers and potentially also third space teleworkers, as described in Table 4 and illustrated in Figure 7 (the diagram is purposely indicative as the proportions are unknown). As noted in Section 3, potential workers might also include the self-employed and visiting (interstate/international) teleworkers.
4.4.2 Accounting for barriers and worker preferences
Calculating the level of demand for a Smart Work Centre ideally would involve taking the total available workers within the defined catchment and applying a number of factors that account for variation in the incidence of teleworking, such as barriers to telework and worker preferences (access to telework does not necessarily translate to a desire to do so).41 Whilst numerous studies have been conducted in attempt to provide values for these factors, more research (and in particular, research that takes account of local circumstances) is needed in order to apply these values in a demand analysis for Smart Work Centres in Western Sydney.
41 See Mokhtarian (1998) for an overview.
The approach employed in this study implicitly takes account for these various demand factors by taking the incidence of working from home as a proxy for the prevalence of teleworking among the relevant occupations in the absence of any other quantification. The most recent census data shows this incidence to be 6%. The potential demand and the benefits will alter pro-rata with any change to this rate. A more conservative rate would still show a smart work centre to be feasible in these locations since the demand and benefits are found to be reasonably high.
Figure 7: Sources of demand for a Smart Work Centre
SMART WORK CENTRES: AN ANALYSIS OF DEMAND IN WESTERN SYDNEY 28
INSTITUTE FOR SUSTAINABLE FUTURES JANUARY 2014
5 CURRENT COMMUTING GEOGRAPHIES
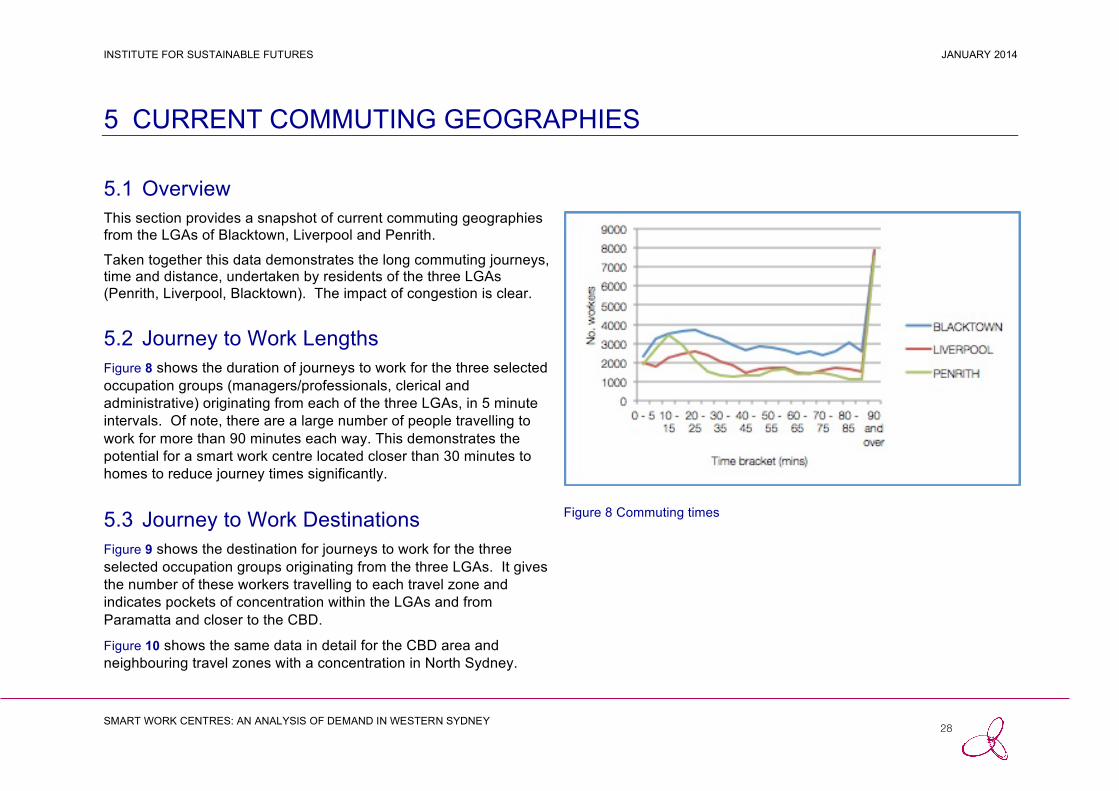
5.1 Overview This section provides a snapshot of current commuting geographies from the LGAs of Blacktown, Liverpool and Penrith.
Taken together this data demonstrates the long commuting journeys, time and distance, undertaken by residents of the three LGAs (Penrith, Liverpool, Blacktown). The impact of congestion is clear.
5.2 Journey to Work Lengths Figure 8 shows the duration of journeys to work for the three selected occupation groups (managers/professionals, clerical and administrative) originating from each of the three LGAs, in 5 minute intervals. Of note, there are a large number of people travelling to work for more than 90 minutes each way. This demonstrates the potential for a smart work centre located closer than 30 minutes to homes to reduce journey times significantly.
5.3 Journey to Work Destinations Figure 9 shows the destination for journeys to work for the three selected occupation groups originating from the three LGAs. It gives the number of these workers travelling to each travel zone and indicates pockets of concentration within the LGAs and from Paramatta and closer to the CBD.
Figure 10 shows the same data in detail for the CBD area and neighbouring travel zones with a concentration in North Sydney.
Figure 8 Commuting times

SMART WORK CENTRES: AN ANALYSIS OF DEMAND IN WESTERN SYDNEY 29
INSTITUTE FOR SUSTAINABLE FUTURES JANUARY 2014
Figure 9 Journey to work destinations- metropolitan Penrith, Blacktown and Liverpool LGAs origins outlined in yellow
Legend for Figures 9 and 10 showing number of journeys
Figure 10 Journey to work destinations – CBD, North Sydney and surrounding suburbs
CBD

SMART WORK CENTRES: AN ANALYSIS OF DEMAND IN WESTERN SYDNEY 30
INSTITUTE FOR SUSTAINABLE FUTURES JANUARY 2014
5.4 CongestionThe following Figures 11, 12 and 13 show the percentage of total commute time that is ‘congestion’ time for trips from each of Blacktown, Liverpool and Penrith. They compare the AM peak commute time with the time taken for the same journey outside peak travel time. A deep blue region is within 5% of the uncongested speed (little congestion) whereas a deep red one is 180% or more of the uncongested travel time (high congestion).
Figure 11: Congestion for AM peak travel from Blacktown
This is calculated by assuming that the inter-peak travel time (i.e. the travel time during the middle of the day) is ‘uncongested’.
As may be expected, travel destinations closer to the CBD are more subject to delay due to congestion. The areas of greatest congestion correspond broadly to areas of greatest employment for Liverpool, Blacktown and Penrith workers in the targeted occupations (Figure 9, Figure 10), further reinforcing the attractiveness of a work location closer to home.
Figure 12: Congestion for AM peak travel from Liverpool

SMART WORK CENTRES: AN ANALYSIS OF DEMAND IN WESTERN SYDNEY 31
INSTITUTE FOR SUSTAINABLE FUTURES JANUARY 2014
Figure 13 Congestion for AM peak travel from Penrith

SMART WORK CENTRES: AN ANALYSIS OF DEMAND IN WESTERN SYDNEY 32
INSTITUTE FOR SUSTAINABLE FUTURES JANUARY 2014
6 LABOUR MARKET TRENDS AND TELEWORKING OPPORTUNITIES
6.1 Overview This section draws on a combination of telework specific studies and journey-to-work (working from home) data specific to Liverpool, Blacktown, Penrith and Greater Sydney to examine the prevalence of telework and the implications for telework arising from labour market trends. Together with the literature review, this information forms the basis of the assumptions used in the demand analysis.
6.2 Teleworking trends Australia is said to rank low-to-middle among developed economies in terms of teleworking prevalence internationally.42 Using data from the European Status Report on Telework43 Lafferty & Whitehouse (2000) found OECD countries with a high incidence of teleworking included the Netherlands, the Scandinavian nations of Finland and Sweden, and the USA. This account of Australia’s level of teleworking relative to other nations is consistent with a review undertaken by Deloitte Access Economics in 2011.
There are varied estimates of teleworking in Australia. Differences in the rate of teleworking can be attributed to variation in the definition of telework and teleworkers, and the methodology employed. For example, a 2001 ABS study on working from home in NSW during ‘normal’ office hours (9 to 5) found an estimated 42 Lafferty & Whitehouse 2000 43 European Commission 1999
244,700 or 8.6% of employed persons in NSW teleworked, of which 72% (176,200) lived in Sydney. By comparison, drawing on ABS 2009 Time of Use data, Deloitte Access Economics (2010, 2011) note 6% of the Australian workforce is engaged in home-based teleworking, based on work performed at home that displaced work in a centralised office.
Using data from the Household, Income and Labour Dynamics in Australia Survey (HILDA), this same study noted a slight decrease in teleworking based on formal arrangements between employee and employer between 2002 and 2009, whilst noting the difficulty in accounting for informal teleworking (those workers who telework without a formal arrangement).
A 2011 Bureau of Transport Statistics NSW study found that whilst the proportion of employees with formal teleworking arrangements in place has remained static, the incidence of those who availed access to a teleworking arrangement has been steadily growing in the last decade to reach 7.5% in 2009 (based on the Household Travel Survey, which defines teleworkers as workers whose usual job is not from home but from a fixed job address, and who worked at home on some days as part of their employer’s teleworking policy in 2001)44.
More recently, the Trans-Tasman Teleworking Survey of employees across 50 small, medium and large enterprises in
44 Corpuz 2011

SMART WORK CENTRES: AN ANALYSIS OF DEMAND IN WESTERN SYDNEY 33
INSTITUTE FOR SUSTAINABLE FUTURES JANUARY 2014
Australia and New Zealand found 35% of respondents teleworked less than eight hours per week, 38% 1-3 days a week and 16% more than 3 days a week.45 Of the 89% that teleworked more than one hour per week, 22% had a written formal agreement with their employer, 27% had a verbal agreement, 47% stated management knew but there was no formal agreement and 3% teleworked without the knowledge of management. It is not clear from the study whether the definition of telework was clearly defined for the survey respondents, or whether it was confined to work that actually displaces work in the office (i.e. whether ‘day extenders’ have been included in the results, refer to Section 3.5).
45 Bentley et al. 2013
6.3 Change in employment mix and implications for telework
As shown in Figure 14 on the following page, the trend that has dominated occupational composition over the past few decades is the increasing knowledge intensity of work, which in turn has resulted in the rapid increase in professional occupations, and also the corresponding occupational changes that have resulted from the rise of service sector industries (and therefore the decline in real terms of primary and secondary industries and associated occupations). Across the Greater Sydney Metropolitan Area for example, the proportion of professional occupations has increased from 22% in 2001 to 25% of the workforce in 2011.
In the case of residents of Blacktown, professional occupations have increased from 13% in 2001 to 17% in 2011; a similiar increase is also evident in Liverpool (12% in 2001 to 15% in 2011) and Penrith (12% in 2001 to 14% in 2011). Technical and trades workers, machinery operators and drivers, and labourers have also declined over the past decade in line with the increasing importance of service industries and occupations.
These same trends are reflected in the figures for the Geater Sydney Metropolitan area. The composition of professional occupations across the Greater Sydney Metropolitan area starts at a higher level and increases more rapidly (in percentage terms) across the decade. The reduction in technicians and trade worker occupations and labourers is also not as pronounced in Penrith and at the Sydney level as in the figures for Blacktown and Liverpool.

SMART WORK CENTRES: AN ANALYSIS OF DEMAND IN WESTERN SYDNEY 34
INSTITUTE FOR SUSTAINABLE FUTURES JANUARY 2014
Figure 14: Change in occupation mix (a) Liverpool (b) Blacktown
(c) Penrith and (d) Greater Sydney (ABS data 2001, 2006, 2011)

SMART WORK CENTRES: AN ANALYSIS OF DEMAND IN WESTERN SYDNEY 35
INSTITUTE FOR SUSTAINABLE FUTURES JANUARY 2014
Figure 15 Number of workers residing in each LGA in target occupations (a) Liverpool, (b) Blacktown, (c) Penrith (ABS data 2011)
Nearly half (between 44 and 46%) of workers resident in the three LGAs are engaged in the three occupation categories ‘Professionals’, ‘Managers’ and ‘Clerical and Administrative workers’. This is illiustrated in Figure 15 above, together with annotation of the proportion who currently work from home for each occupation group – between 3 and 6%.

SMART WORK CENTRES: AN ANALYSIS OF DEMAND IN WESTERN SYDNEY 36
INSTITUTE FOR SUSTAINABLE FUTURES JANUARY 2014
The growth of professional occupations suggests opportunity for increasing teleworking, for as Section 3 highlights, these occupations are most suited to telework. As also noted in Section 3, journey-to-work data reflects both the importance of the professional services sector to Sydney’s economy and the ability for this cohort to work remotely relative to other industries.
However, analysis of journey-to-work data suggests the incidence of working from home has remained relatively static despite the growth in the professional services sector. In absolute terms however, there were actually more teleworkers in Greater Sydney in 2011 than in 2001, as a result of jobs growth, as shown in Figure 16.
Figure 17 provides a snapshot of current working from home rates in the ‘Professionals’, ‘Managers’ and ‘Clerical and Administrative workers’ categories.46
Figure 16: Working from home trends in Greater Sydney
46 Numbers are calculated at SA3 level, but SA2 boundaries are shown on the map.
Figure 17: Actual proportion of people working from home - managers/professionals/clerical workers living in each zone who worked from home on census day (ABS 2011)

SMART WORK CENTRES: AN ANALYSIS OF DEMAND IN WESTERN SYDNEY 37
INSTITUTE FOR SUSTAINABLE FUTURES JANUARY 2014
Why hasn’t working from home increased in line with jobs growth in the professional services? Proportionately, the number of people working from home has remained relatively unchanged between 2006 and 2011 across all occupation categories (Figure 18). We might look to discourses of agglomeration, and other barriers to teleworking, as an explanation for the perhaps less than expected uptake of home-based teleworking in the growing professional services sector. It is also important to note that that the observed working from home data does not account for third space teleworking, which is suggested to be on the rise.47 Critically, Smart Work Centres may alleviate some of the barriers that are preventing a greater uptake of teleworking practices.
47 Bentley et al. 2013
Figure 18: (a) Total working from home by occupation; (b) Proportion of
workers working from home in occupation (ABS 2006, 2011)
0 5000
10000 15000 20000 25000 30000 35000
No. w
orke
rs
(a) Total working from home by occupation,"Greater Sydney, 2006-2011
2006
2011
0% 1% 2% 3% 4% 5% 6% 7%
% w
orkin
g fro
m h
ome (b) Proportion working from home by occupation,"
Greater Sydney, 2006-2011
2006
2011

SMART WORK CENTRES: AN ANALYSIS OF DEMAND IN WESTERN SYDNEY 38
INSTITUTE FOR SUSTAINABLE FUTURES JANUARY 2014
7 POTENTIAL FOR SMART WORK CENTRES
7.1 DemandApplying the methodology described in Section 4, the demand for a smart work centre can be determined for a particular location. In essence, all journeys to work, both by private car and public transport, have been mapped across the metropolitan area for the three identified occupation groups: managers, professionals, and clerical and administrative workers. These journeys have been compared to the possible journey to each smart work centre location. Where the worker would save at least 30 minutes on their journey and where the journey to the smart work centre is 30 minutes or less by car or 60 minutes or less by public transport, they are a candidate. A discount to 6% has been applied to this number to account for a range of other variables to arrive at the predicted demand (refer Section 4.4.2 for an explanation of the 6%). The graphs on the following pages show the potential demand at each of the three locations in this case study, as the number of workers who would reap travel time savings of at least the number of minutes indicated. Hence the number who would save at least 0 minutes is all the possible catchment, and there are considerably fewer who would save at least 90 minutes.
As noted above, the study has concluded that a suitable benchmark to calculate the demand is a time saving of at least 30 minutes on their journey to work. From the data this establishes the demand from the metropolitan area for each destination as:
Liverpool 1400 workers each day Blacktown 2050 workers each day
Penrith 1075 workers each day
Note that the figures are rounded from the calculations; details given in Table 5.
The variance in the figures is a factor of the location, with Blacktown capturing a wider catchment from the metropolitan area and Penrith being on the outskirts. The methodology of requiring the journey to the smart work centre location to be 30 minutes or less will discount some of the potential demand for Penrith originating in the Blue Mountains.
Table 5 Source data
Candidates in targeted occupations with a 30 minute time saving
Variables
Potential demand on any
given day Destination Travel mode Total
Liverpool Car 20002
23313 x 6% 1399 PT* 3311
Blacktown Car 24343
34110 x 6% 2047 PT 9767
Penrith Car 14868
17935 x 6% 1076 PT 3067
(* PT is public transport)

SMART WORK CENTRES: AN ANALYSIS OF DEMAND IN WESTERN SYDNEY 39
INSTITUTE FOR SUSTAINABLE FUTURES JANUARY 2014
Figure 19 Demand for a smart work centre in Liverpool With travel time savings of 30 minutes or better, demand is 1399 workers.
Table 5 on the previous page shows the source data of numbers of candidate workers from which the potential demand was derived. It is important to note that the candidates are drawn from across the metropolitan area. If a different discount is used to account for the variables, the result would vary pro-rata. The demand is “on any given day” reflecting the source of the 6% as a census figure, and hence builds in usage frequency to the figures.
Figure 20 Demand for a smart work centre in Blacktown With travel time savings of 30 minutes or better, demand is 2047 workers.

SMART WORK CENTRES: AN ANALYSIS OF DEMAND IN WESTERN SYDNEY 40
INSTITUTE FOR SUSTAINABLE FUTURES JANUARY 2014
Figure 21 Demand for a smart work centre in Penrith With travel time savings of 30 minutes or better, demand is 1076 workers.

SMART WORK CENTRES: AN ANALYSIS OF DEMAND IN WESTERN SYDNEY 41
INSTITUTE FOR SUSTAINABLE FUTURES JANUARY 2014
7.2 Public and private benefits This study has developed an approach, based on accepted methodologies, to calculate the cost impacts of reducing commuting time and distances due to smart work center take up. If benefits can be quantified it supports an argument for funding to establish the centres to generate the benefits.
Section 4.3 of this report defines public and private benefits and summarises the methodology used. A more detailed discourse can be found in Appendix A.
Public benefits are the avoided externalities - noise, pollution, greenhouse emissions, accidents, and congestion - that benefit the broader community as a result of each trip to a smart work centre. Direct public benefits are directly related to the car use of the worker. Indirect public benefits are those that accrue indirectly from each smart work trip. The main indirect public benefit is avoided congestion– each trip that is not made causes travel speeds to increase for all other motorists. Other indirect benefits all stem from reduced congestion: fuel consumption of other motorists is less as congestion eases, and greenhouse emissions from other motorists are also lower as traffic flows more smoothly.
Although it is the direct savings that are the most obvious, we will see that indirect public savings dominate public benefits.
If the full demand identified in the previous section were realised, the annual public benefit would be:
Liverpool $6.4 million Blacktown $8.1 million
Penrith $6.0 million
These figures assume 240 work days each year for 1400 workers each day for Liverpool, 2050 workers each day for Blacktown and 1075 workers each day for Penrith.
Indicatively, the average annual public benefit for each worker accommodated in the three locations is:
Liverpool $4,556 Blacktown $3,967
Penrith $5,560
The differences will be due to the differing journey lengths to each location.
The selected annual private benefits that cost private travel time savings, fuel savings and avoided tolls for the full demand are:
Liverpool $10.7 million Blacktown $14.9 million
Penrith $9.6 million
Although highly variable, dependent on the length of each individual’s avoided trip, the figures above equate to an average of $32.37/worker/day or $7,768/worker/year (if all days teleworked) in selected private benefits.
Graphs detailing the breakdown of these figures are provided on the following pages.
As concluded in Section 8.5, there is an argument for State Government subsidy of Smart Work Centres to catalyse these benefits.

SMART WORK CENTRES: AN ANALYSIS OF DEMAND IN WESTERN SYDNEY 42
INSTITUTE FOR SUSTAINABLE FUTURES JANUARY 2014
7.3 Liverpool benefits If all the potential demand for a smart work centre at Liverpool were accommodated, 1399 workers from across the Sydney metropolitan area, the annual public benefits would be $6.4 million and selected private benefits would be $10.7 million.

SMART WORK CENTRES: AN ANALYSIS OF DEMAND IN WESTERN SYDNEY 43
INSTITUTE FOR SUSTAINABLE FUTURES JANUARY 2014
7.4 Blacktown benefits If all the potential demand for a smart work centre at Blacktown were accommodated, 2047 workers from across the Sydney metropolitan area, the annual public benefits would be $8.1 million and selected private benefits would be $14.9 million.

SMART WORK CENTRES: AN ANALYSIS OF DEMAND IN WESTERN SYDNEY 44
INSTITUTE FOR SUSTAINABLE FUTURES JANUARY 2014
7.5 Penrith benefits If all the potential demand for a smart work centre at Penrith were accommodated, 1076 workers from across the Sydney metropolitan area, the annual public benefits would be $6.0 million and selected private benefits would be $9.6 million.

SMART WORK CENTRES: AN ANALYSIS OF DEMAND IN WESTERN SYDNEY 45
INSTITUTE FOR SUSTAINABLE FUTURES JANUARY 2014
8 SCENARIO FOR A SMART WORK CENTRE
Calculations of demand in the previous section suggest sufficient levels of demand to support a fully serviced centre in any of the 3 locations. Our analysis projects the potential number of workers each day who may be customers of a telework centre to be 2047 in Blacktown, 1399 in Liverpool or 1076 in Penrith.
The methodology generates some overlap in demand between centres so the numbers are based on the assumption that only one centre is developed in the region. If multiple sites are established in the region then demand for each centre needs to be recalculated to take this into account.
On the basis of the potential demand and our findings about the drivers for teleworking and smart work centres, this report proposes a scenario for developing a smart work centre in Penrith, Liverpool or Blacktown. This scenario is supported by telephone interviews during November 2013 with people with a professional history and interest in developing smart work centres to test the project recommendations. Interview subjects were:
Name Role Organisation
Martin Stewart-Weekes (MSW)
Director Public Sector Practices
Cisco Consulting Services Public Sector (Asia-Pacific) (CISCO)
Gordon Noble (GN) Director Investments and Economy
The Association of Superannuation Funds of Australia Limited (ASFA)
Sam Nickless (SN) National Director – Property Solutions
The GPT Group (GPT)
Nathan Burbridge (NB)
Economic Development Strategist
Blacktown City Council (BCC)
Julie Scott (JS) Manager Economic Development
Liverpool City Council (LCC)
Michael Cullen (MC) Group Manager, Economy and Engagement
Liverpool City Council (LCC)
Additionally, the project team has drawn on presentations from and conversations with:
Brad Krauskopf (BK) CEO and Founder Third Spaces (TS)
Jamie Lawrence (JL) Anytime Office (AO)
8.1 Proposition A pilot centre is recommended to prove the demand and operating model and to generate further interest. It is worth noting cautionary advice from Gordon Noble that a stand alone centre could fail and disprove the concept. He believes that a network of centres is needed in order to attract large employers to offer teleworking equitably to the majority of their staff. Brad Krauskopf

SMART WORK CENTRES: AN ANALYSIS OF DEMAND IN WESTERN SYDNEY 46
INSTITUTE FOR SUSTAINABLE FUTURES JANUARY 2014
and Jamie Lawrence also support this view. Gordon Noble also recommends that the scale of a network is needed to attract investment capital. Although patronage will be required from large employers to sustain the widespread implementation of telework centres across the metropolitan area, this report finds there is enough potential demand from individuals in outer metropolitan locations due primarily to commuting journeys to support isolated centres.
Considering occupations, work habits, personal preferences for work environments and cost drivers, demand is expected from:
• Currently home-based self-employees • Home based teleworkers, full or part timers • Employees with activity-based working environments in
head office, such that an alternative location away from the office on occasion will help with managing reduced desk numbers in head office.
• Employees who o do not have a suitable location at home for home-
based work due to space constraints, unsuitable facilities (e.g. chair, internet connection), distractions from other household members, distractions of household responsibilities, or who need to work in a social environment, and who
o wish to avoid the cost or time implications of long commutes; or
o wish to avoid the day to day distractions at work to concentrate on a particular task
• People who have regular work or appointments in the locality and would appreciate an office environment to continue working between appointments or for the balance of the day.
Lack of quality office space in the region, particularly noted in Blacktown and Liverpool, means there is an untapped market for self-employed people and small enterprises to locate locally, but do not wish to work from home.
Using the scaling described by Brad Krasukopf (as described in the following section), a pilot should be the smallest size that is financially feasible for a fully serviced centre in order to contain risk. At the briefing at Blacktown Council, Brad Krauskopf suggested this would be a 200 seat centre which would service 1000 staff days a week and is 5-10 times smaller than our demand assessment. The Hub Sydney, a city-edge co-working space, is viable at 550m2, supporting 100 seats.
8.2 Operating Model Generally telework market operators identify three basic operating models.
The first is a conventional commercial property arrangement, with the landlord leasing the property for a fixed rent to an operator who takes the risk and the profit. Under this arrangement it may be hard for the operator to commit to the lease, especially in an untested market.
The second possibility is for the operator to be engaged by the landlord for a fixed fee. The landlord pays a management fee and takes the risk and the profit. This arrangement allows the landlord to test the demand for this use of its building and for a centre in the locality. This arrangement seems to be favoured by GPT and Third Spaces.
The third model is the landlord operator. Brad Krauskopf likens those under 400m2 to a “bed and breakfast hotel” reliant on the personal commitment and capability of the landlord. It may serve

SMART WORK CENTRES: AN ANALYSIS OF DEMAND IN WESTERN SYDNEY 47
INSTITUTE FOR SUSTAINABLE FUTURES JANUARY 2014
a niche, but does not appear to be favoured by actors currently in the local market.
Market operators commented that depending on the flexibility of the lease or contract conditions, services and facilities in the smart work centre may be offered to other tenants in the building or locality. For example, meeting rooms or a telepresence centre or high capacity photocopier may be attractive to smaller tenants, enhancing the financial viability of the centre by broadening its commercial base. The additional exposure to the centre may also help to spread the word about its existence and what it offers.
Stakeholders noted that with local government as proponents they may be tenants and potential users, and may be landlords by offering a council owned property for development. One Council interviewed highlighted that the risk involved with operating a telework centre would be too high for Councils (LCC).
8.3 Location Stakeholders agreed that any telework centre should be located in a commercial activity district (CAD) with proximity to retail and services.
Essential: public transport, coffee, lunches, secure bicycle parking.
Ideal: general retail, grocery, medical and dental services, personal services (e.g. drycleaning, repairs, hairdressing), child care, aged care. Strong local demand for child care places noted in Blacktown means provision of integrated childcare would be attractive.
Preferred: adequate car parking. Although use of public transport is preferred, it is acknowledged that local feeder services may be inadequate.
Stakeholders noted that if these services (particularly the essential and ideal) are not available locally then consideration should be given to integrating them within the centre, as these services are necessary for the successful participation of employees in the centres.
Figure 22 Illustration of preferred location relative to commercial centre (CAD) and transport services

SMART WORK CENTRES: AN ANALYSIS OF DEMAND IN WESTERN SYDNEY 48
INSTITUTE FOR SUSTAINABLE FUTURES JANUARY 2014
As well as making the location more vibrant and attractive, proximity of commercial activity allows workers to attend to private business in their breaks more readily than they can in office locations like the CBD or North Sydney (LCC).
Location and accessibility to public transport, particularly heavy rail infrastructure into the city was also considered essential by stakeholders. This would allow easy travel into the CBD, and enable people to work remotely but still travel to appointments if necessary without a time penalty of having to get to the station. Journeys that are time shifted away from peak periods have the additional benefit of distributing peak load on public infrastructure.
Stakeholders also noted the telework centres can also be part of urban renewal strategies, by helping to revitalise slow commercial areas. Whilst these centres can contribute, this is within certain parameters; they cannot be used to kick start greenfields development or revitalise a dead commercial centre (BK). One opportunity for renewal also involves the low cost repurposing of under-utilised real estate (such as redundant public builidngs) in the case study three regions (MSW).
Stakeholders were in agreement that until there is a proven model for teleworking centres in an Australian context, it will be best to locate pilot centres in circumstances where they have the best opportunity to flourish, such as excessive potential demand and locations in vibrant local activity centres. Later, when they are recognised and a demand is proven, they can be established in areas where they urban renewal is also an objective.
8.4 Centre Character And Design Considerations
The study focus on teleworking and calculation of a demand for a smart work centre to service their needs suggests that the centre should target this cohort for its financial sustainability. The design and operation can learn from co-working spaces, and its use by local entrepreneurs and start-ups will add valuable variety and appeal and expand the commercial base. A telework centre should not be seen as a business incubator, although in certain circumstances such a centre may provide a good transition location for graduates of an incubator, such as at Blacktown (BCC).
The centre needs to have a lively buzz and sense of community, to engender social interaction, serendipitous meetings, and be more than a hot desk in a room (LCC, MSW), but still maintain a corporate workplace integrity. This contrasts with the airline lounge sometimes used as a comparison, which has no community activation (MSW). An appealing social environment may attract home-based teleworkers and self-employed people who wish to remain close to home but find home-based working isolating or lacking in facilities.
A larger sized space allows for more diversity of, or distinction between, work areas, offering a combination of large open work areas with flexible desks and seating areas, and small private offices. Fixed desks or small offices could be offered to permanent members. Bigger and more flexible spaces also allow more events to take place.48 Martin Stewart-Weekes recommends larger anchor tenants not be separated from the general space. An array of aesthetics broadens the appeal.
48 deskmag 2012

SMART WORK CENTRES: AN ANALYSIS OF DEMAND IN WESTERN SYDNEY 49
INSTITUTE FOR SUSTAINABLE FUTURES JANUARY 2014
The centre should provide a quality working environment that will comply with large employer and government EH&S requirements (JL). Telework centres manage one of the risks for an employer from having staff working from home or unknown third spaces. It will satisfy criteria that are either difficult or expensive to police with home-based working, and will add to the attractiveness of the centre.
High speed and quality internet connections are essential. Other facilities that will enhance the offering include open and closed meeting rooms, breakout spaces, communal kitchen/coffee area, quality copying/printing, and integrated collaborative technologies eg a telepresence centre (MSW) that is far superior to anything that can be provided at home such as skype.
Centres must be secure regarding internet and also for personal and work property. Customers need to be able to secure their belongings during temporary absences from the workstation (MSW). The management of the centre should offer personal security when it is less occupied, and after hours.
Success factors
Discoverability – easy to find, easy to know there is space available
Accessibility – proximity to home, transport access
Good ambience
Anchor tenants are thought to be important to financially support centre during establishment, although this needs to be proven
Although full consideration was beyond the scope of this report, stakeholders commented that telework centres may extend their commercial base through provision of facilities for tele-education in partnership with tertiary education institutions.
8.5 Finance And Government Support As no equivalent telework centres to the model explored in this research have been developed in Australia, there is limited evidence to support demand and operation models. This makes assessment of telework proposals difficult. The potential of telework centres can offer significant public and private benefits. The public benefits, also noted by Gordon Noble, include:
1. Reductions in the cost of congestion - At present this is a cost to society, borne primarily through costs to state governments; and
2. Workforce participation - Providing access to quality jobs for those whose home locations, circumstances or transport options make it difficult.
These costs are not borne by the employer, although it is the employer who controls the relationship. An employer is unlikely to countenance a situation where they pay twice for office space. The move to activity-base working models is decreasing the office space requirements of many employers and enabling them to support more flexible working arrangements for their employees. However this is a slow process of organisational change, with individual companies at different stages of transition.
The cost equation becomes more balanced where a Smart Work Centre augments the downsizing of an enterprise head office in a more expensive (generally CBD) location. To be equitable the offer should be extended to all employees, requiring a network of

SMART WORK CENTRES: AN ANALYSIS OF DEMAND IN WESTERN SYDNEY 50
INSTITUTE FOR SUSTAINABLE FUTURES JANUARY 2014
SWCs to be available. This scale of roll-out will require government support (GN).
This means in the short to medium term individual firms are unlikely to provide a funding source that will initiate the development of these centres. This is not to say that individually they would not purchase ‘spaces’ for their employees as part of their movements to more flexible working arrangements.
The costs of congestion are the main avoided costs identified in the project findings, amounting to annual costs of $6.4 million for Liverpool, $6.0 million for Penrith and $8.1 million for Blacktown. These figures do provide an argument for some form of initial public subsidy that catalyses some of these public benefits. Public subsidy could come in the form of direct funding, financial support through provision of buildings, or as a role as anchor tenant, or a combination of two or more.
The establishment of smart work centres also addresses current State Government policy about creating jobs close to where people live and relocating government jobs to regional and metropolitan locations, and provides a more creative solution than forced decentralisation of entire departments.
Further support from State Government could also come through policies and procedures to allow their own staff to telework. State Government can also ensure workers compensation and other insurance and EH&S rules do not inadvertently create barriers for uptake by others
Co-working space in Berlin source Deskmag
Hub Zurich co-working space source Flickr

SMART WORK CENTRES: AN ANALYSIS OF DEMAND IN WESTERN SYDNEY 51
INSTITUTE FOR SUSTAINABLE FUTURES JANUARY 2014
9 CONCLUSION
Our cities are growing and sprawling, with knowledge sector jobs concentrated in congested centres. Many workers suffer long commutes on congested roads and public transport. Governments are pressed to fund additional infrastructure to support these patterns.
But technology is changing the way we are working. For knowledge workers - professionals, managers, administration and clerical workers - work is increasingly defined by performance and a physical presence in the office is no longer essential. There is potential for a significant increase in the rate of teleworking, and for new types of work spaces to accommodate the variety of workers needs and preferences.
Smart work centres are shared work spaces located in proximity to where workers live. They can offer the social and facilities benefits of a formal workplace with none (or little) of the commuting travel burden. If well serviced and supported to generate a vibrant, creative community they can be attractive to teleworkers and to locally based small businesses who previously had few work space options.
By reducing the amount of peak period travel workers undertake to key centres, even one or two days a week each, the community benefits from the reduced demand on the transport systems. This eases the supply pressure on government.
The public benefit is sizable and significant enough to justify active support by state governments of teleworking generally and smart work centres in particular.
The study focussed on three Western Sydney local government areas as case studies: Liverpool, Blacktown and Penrith. With nearly half their resident population in the target occupations and long journeys to work on congested transport systems for many, these three areas have the key characteristics of locations that would benefit most from smart work centres. Indeed, analysis of their labour market trends and commuting geographies demonstrates the potential and is confirmed by detailed analysis of journey to work data across the Sydney metropolitan area.
To our knowledge this study is the first time spatially specific estimates of marginal congestion costs have been made for Sydney. The approach used here can be applied to other Australian cities, as it relies on data that is available for the major Australian cities.
This report finds that:
• there is sufficient demand for a fully serviced smart work centre in Liverpool, Blacktown or Penrith;
• for the greatest chance of success the centre should be located in a commercial activity area close to public transport and retail services;
• the average private benefits of more than $32/day teleworked indicate the probable attractiveness to many workers;
• with average annual benefits to the public of between $4,000 and $5,500 for each teleworker accommodated in the area, government support of such centres can be readily justified;
• Government support may be in the form of direct funding, financial support through provision of buildings, as anchor tenant, and through allowing their own staff to telework.

SMART WORK CENTRES: AN ANALYSIS OF DEMAND IN WESTERN SYDNEY 52
INSTITUTE FOR SUSTAINABLE FUTURES JANUARY 2014
10 REFERENCES
ABS, 2002. Teleworking, Cat. No. 1373.1, Australian Bureau of Statistics, Canberra.
Access Economics, 2010. Impacts of Teleworking under the NBN, Prepared for the Department of Broadband, Communications and Digital Economy.
ATAC, 2006. Telework for Australian Employees and Businesses, Report of the Australian Telework Advisory Committee to the Australian Government.
Audretsch, B., 1998. Agglomeration and the location of innovative activity. Oxford Review of Economic Policy, 14(2), pp.18–29. Available at: http://oxrep.oupjournals.org/cgi/doi/10.1093/oxrep/14.2.18.
Bailey, D.E. & Kurland, N.B., 2002. A review of telework research: findings, new directions, and lessons for the study of modern work. Journal of Organizational Behavior, 23(4), pp.383–400. Available at: http://doi.wiley.com/10.1002/job.144.
Baruch, Y., 2000. Teleworking: benefits and pitfalls as perceived by professionals and managers. New Technology, Work and Employment, 15(1), pp.34–49. Available at: http://doi.wiley.com/10.1111/1468-005X.00063.
Baxter, V. & Kroll-Smith, S., 2005. Normalizing the workplace nap: blurring the boundaries between public and private space and time. Current Sociology, 53(1), pp.33–55.
Bentley, T. et al., 2013. Trans-Tasman Telework Survey, Future of Work Programme, NZ Work Research Institute.
Beyerlein, M.M., Freedman, S. & McGee, C., 2003. Beyond Teams: Building the Collaborative Organization, Jossey-Bass/Pfeiffer, San Francisco.
Bland, A., 2013. New work order: From Google and Pixar to Innocent... the future of the office starts here. The Independent, pp.1–7.
Boyle, T. & McGuirk, P., 2012. The Decentred Firm and the Adoption of Sustainable Office Space in Sydney, Australia. Australian Geographer, 43(4), pp.393–410. Available at: http://www.tandfonline.com/doi/abs/10.1080/00049182.2012.731304 [Accessed August 26, 2013].
Brewer, A. M., & Hensher, D. A. (1996, July). Organisational structure, work organisation and flexible work arrangements and their impact on travel behavior: Identifying key linkages and establishing a research agenda. In Proceedings, New International Perspectives on Telework Workshop (pp. 27-44).
CISCO, 2008. Smart Work Center. , (September). Available at: http://www.cisco.com/web/about/ac79/docs/cud/SWC_Fact_Sheet_051209_FINAL.pdf.
SMART WORK CENTRES: AN ANALYSIS OF DEMAND IN WESTERN SYDNEY 53
INSTITUTE FOR SUSTAINABLE FUTURES JANUARY 2014
Corpuz, G., 2011. An empirical assessment of teleworking using the Sydney Household Travel Survey data, Bureau of Transport Statistics, Sydney.
Deloitte Access Economics, 2011. Next Generation Telework: A Literature Review, Prepared by Deloitte for the Department of Broadband, Communications and the Digital Economy.
deskmag, 2012. The 2nd Global Coworking Survey Available at: http://www.deskmag.com/en/first-results-of-global-coworking-survey-171 [Accessed January 9, 2014]
European Commission, 1999. Status Report on European Telework New Methods of Work 1999,
Garrett, R.K. & Danziger, J.N., 2007. Which Telework? Defining and Testing a Taxonomy of Technology-Mediated Work at a Distance. Social Science Computer Review, 25(1), pp.27–47. Available at: http://ssc.sagepub.com/cgi/doi/10.1177/0894439306293819 [Accessed August 15, 2013].
Golden, L., 2008. Limited Access: Disparities in Flexible Work Schedules and Work-at-home Journal of Family and Economic Issues. Journal of Family and Economic Issues, pp.86–109.
Grubb, B., 2013. Do as we say, not as we do: Googlers don’t telecommute. Sydney Morning Herald, pp.1–2.
Haddon, L. & Brynin, M., 2005. The character of telework and the characteristics of teleworkers. New Technology, Work and Employment, 20(1), pp.34–46. Available at: http://doi.wiley.com/10.1111/j.1468-005X.2005.00142.x.
Hardill, I. & Green, A., 2003. Remote working-altering the spatial contours of work and home in the new economy. New Technology, Work and Employment, 18(3), pp.212–222. Available at: http://doi.wiley.com/10.1111/1468-005X.00122.
Heerwagen, J.H. et al., 2004. Collaborative knowledge work environments. Building Research & Information, 32(6), pp.510–528. Available at: http://www.tandfonline.com/doi/abs/10.1080/09613210412331313025 [Accessed September 6, 2013].
International Telework Association and Council, 2000. Telework boosted in 1998 by Internet and economy.
Lafferty, G. & Whitehouse, G., 2000. Telework in Australia: Findings from the national survey in selected industries. ABL, 26(3), pp.236–252.
Luukinen, A., 1996. A profile of Finnish telework: survey results concerning the nature, extent, and potential of telework in Finland. In Directions of Telework in Finland: Report by the Finnish Experience with Telework Project. In A. Luukinen, ed. Directions of Telework in Finland: Report by the Finnish Experience with Telework Project. Ministry of Labour: Publication of Labour Administration, Helsinki., pp. 1–49.

SMART WORK CENTRES: AN ANALYSIS OF DEMAND IN WESTERN SYDNEY 54
INSTITUTE FOR SUSTAINABLE FUTURES JANUARY 2014
McCann, I.R.G.P., 2000. Industrial Clusters: Complexes, Agglomeration and/or Social Networks? Urban Studies, 37(3), pp.513–532. Available at: http://usj.sagepub.com/cgi/doi/10.1080/0042098002096 [Accessed September 2, 2013].
Microsoft White Paper, ‘The Anywhere Working City’ www.theanywhereorganisation.com
Mitchell, D., 1995. The end of public space? People’s Park, definitions of the public, and democracy. Annals of the association of american geographers, 85(1), pp.108–133.
Mokhtarian, P. & Salomon, I., 1996. Modeling the choice of telecommuting 2: A case of the preferred impossible alternative. Available at: http://escholarship.org/uc/item/7br7039r.pdf [Accessed January 21, 2014].
Mokhtarian, P.L., 1998. A Synthetic Approach to Estimating the Impacts of Telecommuting on Travel. Urban Studies, 35(2), pp.215–241. Available at: http://usj.sagepub.com/cgi/doi/10.1080/0042098984952 [Accessed September 11, 2013].
Moses, A., 2013. Telecommuting - the future ain’t what it used to be. Sydney Morning Herald, pp.1–2. Available at: http://www.smh.com.au/it-pro/business-it/telecommuting--the-future-aint-what-it-used-to-be-20130225-2f10u.html.
Mul, I.L., 2012. Success Factors for Co-Work Locations in Stimulating Open Innovation. Faculty of Economics and Business, University of Amsterdam.
NSW Decentralisation Taskforce, 2013. NSW Decentralisation Taskforce Report April 2013, NSW Government.
Obembe, D., 2012. Knowledge sharing, sustained relationships and the habitus. Management Learning, 44(4), pp.355–372. Available at: http://mlq.sagepub.com/cgi/doi/10.1177/1350507612450988 [Accessed September 10, 2013].
Olszewski, P., & Lam, S. H. (1996). Assessment of potential effect on travel of telecommuting in Singapore. Transportation Research Record: Journal of the Transportation Research Board, 1552(1), 154-160.
Rosenthal, S.S. & Strange, W.C., 2001. The Determinants of Agglomeration. Journal of Urban Economics, 50(2), pp.191–229. Available at: http://linkinghub.elsevier.com/retrieve/pii/S0094119001922302.
Sonn, J.W. & Storper, M., 2008. The increasing importance of geographical proximity in knowledge production: an analysis of US patent citations, 1975 – 1997. Environment and Planning A, 40(5), pp.1020–1039.
Sullivan, C., 2003. What’s in a name? Definitions and conceptualisations of teleworking and homeworking. New Technology, Work and Employment, 18(3), pp.158–165. Available at: http://doi.wiley.com/10.1111/1468-005X.00118.

SMART WORK CENTRES: AN ANALYSIS OF DEMAND IN WESTERN SYDNEY 55
INSTITUTE FOR SUSTAINABLE FUTURES JANUARY 2014
Tagliaventi, M.R., 2006. The role of networks of practice, value sharing, and operational proximity in knowledge flows between professional groups. Human Relations, 59(3), pp.291–319. Available at: http://hum.sagepub.com/cgi/doi/10.1177/0018726706064175 [Accessed August 10, 2013].
Torre, A., 2008. On the role played by temporary geographical proximity in knowledge transmission. Regional Studies, 06, pp.869–889.
Tremblay, D.G. & Thomsin, L., 2012. Telework and mobile working: analysis of its benefits and drawbacks. International Journal of Work Innovation, 1(1), p.100. Available at: http://www.inderscience.com/link.php?id=47995.
Wheatley, D., 2012. Good to be home ? Time-use and satisfaction levels among home-based teleworkers. New Technology, Work and Employment, (December 2009), pp.224–241.
White, P., Titheridge, H. & Moffat, D., 2011. Potential impacts of teleworking on transport systems. Logistics and Transport Focus, (November), pp.26–29.
Whittle, A. & Mueller, F., 2009. “I could be dead for two weeks and my boss would never know”: telework and the politics of representation. New Technology, Work and Employment, 24(2), pp.131–143. Available at: http://doi.wiley.com/10.1111/j.1468-005X.2009.00224.x.
Zoltan, A. & Varga, A., 2005. Entrepreneurship, Agglomeration and Technological Change. Small Business Economics, 24(3), pp.323–334. Available at: http://link.springer.com/10.1007/s11187-005-1998-4 [Accessed August 24, 2013].

SMART WORK CENTRES: AN ANALYSIS OF DEMAND IN WESTERN SYDNEY 56
INSTITUTE FOR SUSTAINABLE FUTURES JANUARY 2014
11 APPENDIX A—METHODOLOGY
11.1 Public and private benefits
11.1.1 Private benefits Section 4 provided an overview of the private benefits included in the analysis. The following privately borne benefits/costs have not been considered:
1) Savings to employers able to reduce the office space they occupy as a result of those working in smart work centres.
2) Attendance costs to employers or employees for attending/renting smart work centre space.
3) Any loss (or gain) to productivity as a result of working in a smart work centre.
4) Reductions in car running costs other than fuel. 5) Fare savings from shorter public transport trips (for those
who catch public transport to the smart work centre).
The first two items on this list of ignored costs/benefits may largely cancel each other out. More problematic is the third item, as there is no reliable empirical evidence indicating that workers are either more or less productive in a smart work centre. The current employer preference for physical attendance at work suggests that there are at least perceived advantages to physical proximity that are not easily substituted by technology, and current economic thinking is that there are ‘agglomeration’ productivity benefits that result from physical proximity, (see Location strategies and knowledge spillovers, J Alcácer, W Chung - Management Science, 2007, Glaeser & Gottlieb 2009 The wealth of cities: Agglomeration
economies and spatial equilibrium in the United States), but the empirical work on agglomeration has mainly established agglomeration benefits at the city or region scale, and it remains unclear how much loss to productivity (if any) would result from working at a smart work centre within the same city. For example, while there have been many studies that establish and explain the concentration of information technology workers in Silicon Valley and Boston in America as a consequence of agglomeration benefits, the benefits of intra-city density are not as easily quantified (but see Rawnsley and Szafraniec, Melbourne 2010 Knowledge Cities World Summit: http://www.sgsep.com.au/agglomeration-and-labour-productivity-australian-cities).
11.1.2 Public benefits The negative consequences of automobile travel are well known – noise, pollution, greenhouse emissions, accidents, and congestion have all been studied extensively. Commonly these negative consequences are referred to as ‘externalities’ of automobile travel. For the purpose of this analysis we attempt to quantify avoided externalities, which we will refer to as public benefits. Public benefits are the benefits that accrue to the broader community as a result of each trip to a smart work centre.
In this report, we classify public benefits into two groups: direct and indirect:

SMART WORK CENTRES: AN ANALYSIS OF DEMAND IN WESTERN SYDNEY 57
INSTITUTE FOR SUSTAINABLE FUTURES JANUARY 2014
Direct public benefits are those that accrue directly from each smart work trip. For instance, suppose a worker travels to a smart work centre and thereby saves a 20km commute. This means that the driver’s car is not polluting as much, is not emitting as many greenhouse emissions and noise, and will have a lower chance of causing an accident. These savings we will refer to as direct public benefits, because they are directly related to the car use of the worker. Direct public benefits used in our modelling are shown in Table 6.
Indirect public benefits are those that accrue indirectly from each smart work trip. The main indirect public benefit is avoided congestion– each trip that is not made causes travel speeds to increase for all other motorists. Other indirect benefits all stem from reduced congestion: fuel consumption of other motorists is less as congestion eases, and greenhouse emissions from other motorists are also lower as traffic flows more smoothly.
Although it is the direct savings that are the most obvious, we will see that indirect public savings dominate public benefits. Quantifying indirect benefits requires more work than quantifying direct benefits. We explain in detail our approach to quantifying private and benefits in the following section.
Table 6: Per-km direct externalities/costs of automobile travel
Direct Benefit/
Avoided externality
Value Notes
Greenhouse
emissions
$0.014/vehicle-km We assume 0.108 litres of fuel per km, and 2.64 kg of carbon dioxide per litre of fuel. We value this at $50 per tonne (the price required to limit warming to ~ 2 degrees).
Noise $0.01/vehicle-km The empirical research on this is patchy: studies show a definite effect of noise on property values, but this does not translate easily into a per-km figure. 49
Pollution $0.03/vehicle-km Following CIE (2005)50.
Accident $0.03/vehicle-km This excludes private accident costs. CIE (2005) use a value of $0.06/km. LECG use a value of $0.03/km. Values can vary substantially depending on the value given to a life (VSL).
TOTAL $0.084/vehicle-km
49 Wilhelmsson, M. (2000). The Impact of Traffic Noise on the Values of Single-family Houses. Journal of Environmental Planning and Management, 43(6), 799-815. 50 Centre for International Economics (2005). Sydney’s Transport Infrastructure: The real economics

SMART WORK CENTRES: AN ANALYSIS OF DEMAND IN WESTERN SYDNEY 58
INSTITUTE FOR SUSTAINABLE FUTURES JANUARY 2014
11.2 Method for quantifying public and private benefitsThis section steps the reader through our method for calculating the benefits (i.e. avoided externalities) of trips to a smart work centre.
Step 1: Enumerate all current work trips, and infer occupation We use the journey to work dataset (derived from the 5 yearly census), available from the NSW Bureau of Transport Statistics. This is a near-complete enumeration of all trips to work on the day of the census. Specifically, we use Table 19 (Origin TZ x Destination TZ x Mode9), which gives the origin travel zone of each trip, the destination travel zone of each trip, and the main mode (car driver, car passenger, train, bus, etc) for each trip within the Sydney GMA (including Newcastle and Wollongong). Figure 23 shows the study area, overlaid with travel zone boundaries.
While we have a near-complete enumeration of all work trips, we would also like to know the occupation of each commuter, because in this report we only consider Professionals, Managers, and Clerical Workers as being potential workers in a smart work centre. Unfortunately, this data is not available due to privacy restrictions51. However, we can probabilistically infer the occupation of each trip in the following way:
51 The ABS does not allow census data to be too disaggregated, as individuals might be identified.
For each trip, we know the destination of the trip. Using other journey to work tables, we can work out the occupation distribution at each destination. So, for example, we can work out that 10% of all jobs in zone X are managerial jobs, so we can, initially, guess that any trip to that zone has a 10% chance of being a managerial/professional/clerical job. This may be sufficient for obtaining reasonable probabilistic estimates of occupation for each trip, but we can do slightly better by also including information about trip origins as follows:
a) Using our initial destination-based guess of occupation for each trip, we can calculate the occupation mix at each trip origin.
b) We compare our estimate of the number of jobs in each occupation with the (known) occupation mix at each origin. So, for example, we might infer (in step a) that 40% of all workers travelling from zone X are managers/professionals/clerical, but ABS data may indicate that in fact 30% of all workers in zone X are managers /professionals /clerical. The ratio of actual/estimate is then 0.75.
c) We adjust the occupation probabilities for all trips from X by multiplying by the actual/estimate ratio. So, if we inferred (based on destination occupation mix) that a trip from W to X had a 40% chance of being a manager /professional /clerical worker, but the scale ratio for zone W is 0.75, we multiply by this and get an adjusted probability of 30%. We do the same for all trips from zone W.
This process enables us to make an educated estimate of occupation for each trip, so we have, in effect, synthesized a new

SMART WORK CENTRES: AN ANALYSIS OF DEMAND IN WESTERN SYDNEY 59
INSTITUTE FOR SUSTAINABLE FUTURES JANUARY 2014
dataset that is (Origin Zone X Destination Zone X Mode9 X Occupation). We use this dataset for all future calculations. Occupation is inferred for each trip based on the trip destination, but is constrained so that the occupation mix at each origin matches the occupation mix given by ABS census data.
Note that because we probabilistically estimate occupation, we can have fractional workers, so not all results will be in whole numbers of workers. In any case, we round all results to the nearest whole worker when reporting results.
Figure 23: Study area, with Travel Zone boundaries shown in red. Note that travel zones are smaller in the dense urban area, and boundaries for
these zones are difficult to make out. Generally a typical urban travel zone would be around 500mx500m in size.

SMART WORK CENTRES: AN ANALYSIS OF DEMAND IN WESTERN SYDNEY 60
INSTITUTE FOR SUSTAINABLE FUTURES JANUARY 2014
Step 2: determine current trip travel times and travel time to alternative option (Smart work Centre) For each work trip, we determine the travel time for the trip by using AM peak skim-trees from the BTS’s Strategic Travel Model (STM). This model provides AM peak travel times by car and public transport for each origin/destination travel zone pair. Note that we are implicitly assuming that all commute trips occur at the AM peak. This is clearly not the case for shift workers, those with flexible work hours, and so on, but we ‘correct’ for this assumption later in our analysis (see Step 9).
Next, for each trip, we calculate the travel time from the existing origin zone to the smart work centre. We assume that mode remains unchanged. We then compare the travel time for the existing work trip (call this t1) with the travel time for an ‘alternative’ trip to the smart work centre (call this t2). Figure 24 illustrates. We also calculate the inter-peak travel time for each trip (call these i1, i2), and the network distance (in km) for each trip (call these d1, d2).
For car based trips, trip duration (t1, t2 and i1,i2) is simple unweighted in-vehicle time (in minutes), as reported by the STM skims. For public transport trips, trip duration is the generalized travel time by public transport (in minutes), which combines walk time, waiting time, transfer time (if applicable) and in-vehicle time into a single measure of trip distance.
We use these numbers (t,i,d) in future steps. So that our exposition is clear, for all future steps we explain our methodology for a single example trip, but the reader should understand that we repeat the same calculations for all trips within the study area.
Figure 24 Diagram illustrating calculations
Step 3: determine workers within the catchment of the smart work centre For each trip, we determine if that trip is within the potential catchment of a given smart work centre as follows:
1) The am peak travel time to the smart work centre (t2) must be less than 30 minutes (by car) and less than 60 minutes (by public transport).
2) The time saved by going to the smart work centre (t1-t2) must be greater than 30 minutes.
HOME
SWC
OFFICE t1,$i1,$d1$
t2,$i2,$d2$$$$

SMART WORK CENTRES: AN ANALYSIS OF DEMAND IN WESTERN SYDNEY 61
INSTITUTE FOR SUSTAINABLE FUTURES JANUARY 2014
If a trip meets these two criteria, it is considered a candidate for travel to the smart work centre, and the inferred occupation probability is added to the catchment. So, concretely, if a trip meets criteria (1) and (2) above, and has a 40% probability of being a manager/professional/clerical worker trip, we add 0.4 workers to the potential catchment of the smart work centre.
Step 4: determine the number of these workers who, on any given day, will visit the smart work centre Step 3 above calculates the number of workers who could plausibly use a smart work centre, because they have the right occupation, are close enough to the work centre, and stand to save over 30 minutes in commute time by diverting to a smart work centre. Although these workers are clearly potential candidates for a smart work centre, only a proportion of them will use the smart work centre on any given day. In this report, we assume that 6% of these candidate workers actually use a smart work centre on any given day. This is similar to the current Sydney-wide working from home rate. Ideally, this number would be based on detailed primary survey work and discrete choice experiments involving employers and employees, but this is beyond the scope of this report, so we have selected this number based on current observed working from home trends, and the existing literature on teleworking.
Step 5: Determine private benefits for each trip For each trip to a smart work centre (in place of the regular trip to work), we can easily calculate private benefits as follows:
Time saved = Value_of_time * time_saved
= 14 * ((t1-t2)/60)
Fuel saved = fuel_consumption_per_km * fuel_price * km_saved
= 0.106 * 1.4 * (d1-d2)
Toll saved = toll $ for standard work trip – toll $ for smart work trip
Note that only the first of these is relevant for trips by modes other than car. The other two are calculated only for car-based trips.
Step 6: Determine direct public benefits for each trip For each car trip to a smart work centre, we can calculate direct public benefits as follows:
GHG avoided = per_km_ghg_costs * (d1-d2)
Pollution avoided =per_km_pollution_costs * (d1-d2)
Accident avoided= per_km_accident_costs * (d1-d2)
Noise avoided = per_km_noise_costs * (d1-d2)
The per-km costs for each of these externalities has already been given in Table 6 (page 57).

SMART WORK CENTRES: AN ANALYSIS OF DEMAND IN WESTERN SYDNEY 62
INSTITUTE FOR SUSTAINABLE FUTURES JANUARY 2014
Trips by mode other than car are assumed to have zero direct public benefits (both direct and indirect). This is not exactly true, because diverting people to shorter public transport trips will have some marginal benefit, but estimating the value of this is much more difficult than estimating the marginal value of avoided car travel, and is beyond the scope of this report. In any case, we expect that reductions in car travel will so dominate total public benefits that it is safe to ignore avoided public transport costs.
Step 7: Determine the indirect public costs for each trip In contrast to private benefits and direct public benefits, which can be calculated more or less directly from the trip data, this step requires a deal of work. Why is this? All indirect benefits are a result of decreased congestion costs: each vehicle that makes a shorter trip (to a smart work centre rather than a loner commute) increased travel speeds for other travellers, which saves time, as well as fuel, greenhouse gases, and pollution.
It is not clear that relieving congestion results in fewer accidents, or less noise, and so we do not include indirect noise and accident benefits in our calculations. In order to work out any of the other indirect benefits though, we must estimate the marginal benefit of each vehicle removed from the flow of traffic during peak time.
Note that previous studies have estimated total congestion costs, but we are not aware of any existing work that quantifies marginal congestion costs. For example, BITRE (2007) calculate avoidable (dead-weight loss) congestion costs of ~$0.1/km for Sydney, but this is an average for all traffic, regardless of time (peak/off-peak) and location, and so we know that this figure will be much lower
than the marginal cost of an extra vehicle during peak time. Referring to Figure 25 (reproduced from BITRE 2007, page 100), the marginal benefit of one less vehicle at peak time is PA. BITRE’s total avoidable cost estimate, on the other hand, is the area of the triangle PAQ, divided by the total quantity of travel at the current equilibrium (F). It should be clear to the reader, either from the diagram in Figure 25, or intuitively, that the marginal benefit of removing a vehicle-km at the peak time is much greater than the marginal benefit/cost of removing an average vehicle-km.
Figure 25: Economic valuation of congestion. Reproduced from BITRE (2007), page 100.

SMART WORK CENTRES: AN ANALYSIS OF DEMAND IN WESTERN SYDNEY 63
INSTITUTE FOR SUSTAINABLE FUTURES JANUARY 2014
To give the reader some appreciation for how average avoidable costs differ from marginal costs, we note the following earlier work (as summarized in Litman 2013, http://www.vtpi.org/tca/tca0505.pdf):
• BTCE estimated marginal peak congestion costs in Sydney of $0.62 (CBD roads), $0.21 (inner arterials), $0.13 (freeways), and $0.07 (outer arterials) (BTCE (1996), Traffic Congestion and Road User Charges in Australian Capital Cities, Australian Gov. Publishing Service (Canberra), Table 5.1).
• Land Transport NZ's Economic Evaluation Manual provides the following guidelines for transportation project benefit analysis: Congestion reduction benefits of peak-period shifts from automobile to another mode are valued at $1.27 per kilometer in Auckland, $0.98 in Wellington, and $0.09 in Christchurch (Land Transport New Zealand (2006 / 2005) Economic Evaluation Manual (EEM) – volumes 1 & 2 (www.landtransport.govt.nz); at www.landtransport.govt.nz/funding/manuals.html).
The theoretically correct way of calculating congestion costs is to use a fully specified travel model (such as the STM) and calculate marginal costs on a link by link basis based on each link’s volume/speed curve. The marginal benefit of a particular avoided trip is then simply the sum of all marginal costs along the shortest path52. Such an approach is, we believe, impractical, given the
52 Actually even this is not strictly theoretically correct, because changes to link costs could change the optimal route choice for other drivers, and so strictly one should re-run the travel model separately for each trip to determine the marginal cost of each trip, but this is overkill.
complexity of metropolitan travel models. We will show, however, that it is possible to obtain a trip-specific approximation of the marginal cost using only skim-trees produced by a travel model. This means that we are able to estimate trip-specific congestion costs using only travel-time skims from the STM. This calculation takes a few minutes for over a million trips within the Sydney GMA, and can be done on a standard laptop without any proprietary software53.
Most existing estimates of congestion costs are in terms of costs per vehicle-km. This is mostly a result of expediency – per-km costs are easier to calculate. However, congestion costs are better expressed in terms of costs per vehicle-minute. To understand why, consider two trips --- one by a driver who is stuck on a congested arterial and travels 5 km in ½ an hour, and another by a driver using an uncongested outer orbital, who travels 40 km in ½ an hour. Clearly the first driver contributes to congestion while the second driver doesn’t. Yet the second driver travels a much greater distance. Analyzing congestion in terms of vehicle minutes is clearly a better choice, because in effect, it puts greater weight on slower (congested) trips, relative to any approach that assumes per-km congestion costs. Estimating per-km costs separately for different road types helps, but still doesn’t solve the basic problem.
While estimating costs in per-vehicle-minute terms is clearly better than a per-km approach, it is still not ideal, because it values all minutes equally. It would be better if we could easily separate the time in congested conditions (we will term congested minutes) from time spend in more or less uncongested conditions. Fortunately, we can do this, as explained below.
53 We use a python script, which reads in the skim trees produced by the STM and produces trip specific estimates of marginal congestion costs.

SMART WORK CENTRES: AN ANALYSIS OF DEMAND IN WESTERN SYDNEY 64
INSTITUTE FOR SUSTAINABLE FUTURES JANUARY 2014
To begin with, we see, from Figure 26 (taken from BTS HTS 2011/12 summary report, page 25), that the volume of traffic during the peak periods in Sydney is ~270,000 vehicles. The volume of traffic during the inter-peak period, on the other hand, is ~160,000 vehicles.
Figure 26: Traffic flows in Sydney by time of day. Source: BTS HTS 2011/12 Summary report, page 25.
So, we can see that there are ~110,000 additional vehicles on the network during peak times. Now, in order to work out the effect of those extra vehicles on travel times, we need to know how much slower traffic is during the peak period compared to the inter-peak period. We calculate this by simply summing the peak travel time for all journey-to-work trips (i.e. t1 in Figure 24) and the inter-peak travel time for all journey-to-work trips (i.e. i1 in Step 2 and Figure 24). Doing this, we calculate that the average trip length for a journey to work in inter-peak conditions is 26.0 minutes, whereas those same trips, during the peak period take 37.2 minutes. So we
can say that those additional 110000 vehicles increase trip times from 26 minutes to 37.2 minutes. Putting this in terms of an individual vehicle, this means that the marginal effect of an additional vehicle is an increase in network wide travel times is (37.2/26)^(1/110000), or 1.0000032564800592. This is a unitless ratio, implying that while ever the additional marginal vehicle is on the road, it is increasing the travel times of other vehicles by ~0.0003%. To put this in more concrete terms, if we assume that an additional vehicle is added to the network during the peak for 1 minute, then we expect that travel times will increase by 0.0003% for all existing 270000 vehicles on the network during that minute, which means that the total network-wide delay cost of the additional minute of vehicle travel is 0.88 minutes.
To compare this to other per-km estimates of delay, we can translate this approximately to a per-km figure by multiplying by 2, as average commute travel speeds during the AM peak are 30 km/hr54. This means that marginal external delay costs are $0.41/km.
54 We calculate this by simply dividing the total distance (in km) travelled for all work trips during the AM peak by total trip length (in minutes).
ISF simple estimate of marginal network delay:
0.88 minutes/minute
Using our value of time of $14/hr, this equates to $0.205/minute
On a per-km basis, this is $0.41/km

SMART WORK CENTRES: AN ANALYSIS OF DEMAND IN WESTERN SYDNEY 65
INSTITUTE FOR SUSTAINABLE FUTURES JANUARY 2014
Now, our initial estimate of 0.88 minutes of delay per minute of travel is useful, but it is only a network wide average. We would prefer to calculate congestion costs in some spatially specific manner, so that trips along uncongested routes are treated differently to trips along congested routes. We can in fact do this in a relatively simple manner by weighting trips according to how congested those trips are. The basic idea is that we only consider a vehicle as contributing to congestion when that vehicle is driving in congested conditions. We can calculate how much time a vehicle spends driving in congested conditions between any OriginàDestination pair simply by comparing the peak travel time (t1) for that trip against a baseline travel time (i1). In our case, we use inter-peak travel time as a baseline, because the road network is at close to capacity during this period, but congestion is still low, so the additional minutes of travel required during peak time gives us a good indication of the congestion along that route. Here is the method spelled out more concretely:
1) We have already seen that the marginal cost of an extra vehicle minute of travel during the peak is 0.88 minutes of network wide delay.
2) However, this is an average across all vehicle minutes, and we know that congestion is only caused by driving in congested conditions, so we would like to estimate the marginal cost of each congested minute of travel.
3) Since we can calculate the congested minutes for any trip (it is just t1-i1), we can easily calculate the total number of congested minutes of travel across all trips. Doing this for Sydney reveals that there is 1 minute of congested travel for every 3.3 minutes of total travel time.
4) Using this ratio of 3.3, we can modify our simple estimate above and say that every congested minute of travel causes 2.9 minutes of network delay, or $0.68 (if we value time at $14/hr).
The above approach has the great advantages that it is easy to calculate, and it assigns congestion costs based on time spent in congested conditions, rather than just distance. Perhaps more importantly, this approach is spatially specific, because the ‘congested minutes’ is specific to each OriginàDestination trip. Figure 27 shows total delay costs caused by an additional trip to the CBD by trip origin. Figure 28 shows total delay costs to Blacktown.
Refined estimate of marginal network delay:
2.9 minutes/congested-minute

SMART WORK CENTRES: AN ANALYSIS OF DEMAND IN WESTERN SYDNEY 66
INSTITUTE FOR SUSTAINABLE FUTURES JANUARY 2014
Figure 27: Marginal delay costs for trips to the CBD, by origin.
Figure 28: Marginal delay costs for trips to Blacktown by origin.
To our knowledge this is the first time spatially specific estimates of marginal congestion costs have been made for Sydney. The approach used here can be applied to other Australian cities, as it relies primarily on ABS journey-to-work data and skim trees from a strategic travel model, both of which are available for the major Australian cities.

SMART WORK CENTRES: AN ANALYSIS OF DEMAND IN WESTERN SYDNEY 67
INSTITUTE FOR SUSTAINABLE FUTURES JANUARY 2014
In the preceding discussion, we have only shown how we calculate delay costs from congestion. However, we also need to calculate other congestion-related costs. These are shown in Table 7.
Step 8: Determine the indirect public benefits/costs of each trip ‘diverted’ to a smart work centre In the preceding step (step 7), we explain how to calculate the indirect public costs of any particular trip. The indirect public benefits/costs of each trip diverted from its regular destination to a smart work centre is simply the indirect public costs of the existing work trip minus the indirect public costs of the trip to the smart work centre. In principle, this can be either positive (there is a benefit from diverting the trip) or negative (the trip to the work centre causes more public costs than the existing work trip), but in practice, it is seldom negative, because the work centres considered in this report (at Blacktown, Liverpool, and Penrith) are all far from the city centre, and generally divert trips away from more congested routes.
Step 9: Correct for non-peak commute travel In the preceding 7 steps, we have treated each trip as if it takes place in the peak period. However, not all commute trips do take place during the peak period, and we must correct for this, because trips outside the peak period will have much lower public costs. In this study, we assume (based on data presented in Shaz K and Corpuz G (2009), Making a Molehill out of a Mountain – Spreading the Morning Peak with Flexible Working Hours, Proceedings of the 32rd Australasian Transport Research Forum
Table 7 Congestion related costs
Public cost Cost per congested minute
Notes
Extra running costs $0.204 Derived from delay costs. We assume fuel consumption per km increases proportionally with delay costs. We assume a fuel price of $1.4/litre.
Extra greenhouse gases
$0.02 Derived from additional fuel consumption, with 2.64 kg CO2 per litre of fuel, and $50/tonne carbon price.
Extra pollution $0.064 Derived from additional fuel consumption.
Traffic variability $0.136 Assumed to be 20% of delay costs (BITRE 2007 have variability costs around ¼ of total delay costs55).
Delay $0.68 Derived in detail in this section.
Total $1.088 If converted back into per-km terms (for comparison with other studies), this is $0.66/km.
55 Bureau of Transport and Regional Economics [BTRE], 2007, Estimating urban traffic and congestion cost trends for Australian cities, Working paper 71, BTRE, Canberra ACT. See page 113.

SMART WORK CENTRES: AN ANALYSIS OF DEMAND IN WESTERN SYDNEY 68
INSTITUTE FOR SUSTAINABLE FUTURES JANUARY 2014
(ATRF), Auckland: ATRF) that 60% of commute trips occur in the peak period. We make the further simplifying assumption that public benefits of avoided travel outside the peak periods is zero. Thus, we can correct for non-peak commute travel by multiplying all public benefits by 0.6.
Step 10: Include the return trip All working thus far has focused on estimating the benefits/costs of the trip to work. We do not estimate the benefits of the return trip home separately, but simply assume it is the same as the trip to work. In other words, to work out the total benefit/cost of each person diverted to a smart work centre for a day, we just calculate the benefit/cost of diverting the trip to work by 2.
Step 11: Correct for bounce-back Thus far, we have calculated the costs/benefits of each diverted trip without considering any bounceback effects. This is unrealistic – if a vehicle is diverted to a smart work centre, and this has the effect of decreasing congestion, then the lower level of congestion will entice other vehicles to take its place. To account for this, we assume an elasticity of demand for travel with respect to travel time of 0.3 (from Wallis and Shmidt 2003, http://www.atrf.info/papers/2003/2003_Wallis_Schmidt.pdf, page 13), which equates to a bounceback of 0.26 vehicles for each vehicle diverted56.
56 This is worked out as follows: we have seen that during the peak period, each
11.3 Method conclusion This brings to a conclusion the description of our method for estimating the smart workers within the catchment of a smart work centre, and the private and public benefits associated with diverting those trips from their regular route to the smart work centre. We find that the marginal public benefit of one less car on the road at peak time is $0.66/km in Sydney, but we also show that one can do better than using this average, and instead obtain trip-specific estimates that vary depending on how much congestion there is along each trip route.
vehicle removed from traffic flow decreases travel time by 0.0003%. But an elasticity of 0.3 w.r.t speed means that at peak time, when traffic flow is 270000, the removed vehicle will be replaced by 0.000003*0.3*270000 vehicles.

SMART WORK CENTRES: AN ANALYSIS OF DEMAND IN WESTERN SYDNEY 69
INSTITUTE FOR SUSTAINABLE FUTURES JANUARY 2014