100% matrix 100% fracture 100% matrix 100% fracture matrix dominated fracture dominated % of total...
TRANSCRIPT

100% Matrix
100% Fracture
100% Matrix
100% Fracture
MatrixDominated
FractureDominated
% of Total Porosity
% o
f T
ota
l P
erm
eab
ilit
y
IV
III
II I
After Nelson (2001)
Fractured Reservoir SimulationFractured Reservoir SimulationMilind Deo and Craig Forster
University of Utah

Account for Irregular GeometriesAccount for Irregular GeometriesHypothetical
‘Real System’Regularized Equivalent
ECLIPSE Equivalent
Common Model Properties• Impermeable matrix with = 0 (Type I, basement reservoir system)• Domain = 1,000 ft by 1,000 ft by 200 feet deep• Total feature length = 30,000 feet• Reference Case: Feature k = 1,000 md, = 14 %, width = 0.5 feet• OOIP = 53,580 STB• Injection Pressure = 4,300 psi• Injection Well Production Well

020
40
60
80
100
120
0 300 600 900Time (days)
Oil
Pro
du
ctio
n (
ST
B/d
ay)
PrimaryProduction
Hypothetical ‘Real System’ CVFE
Regularized Equivalent CVFE
ECLIPSE Equivalent
Model Comparison at 900 daysModel Comparison at 900 days
‘Real System’ CVFE
ECLIPSERegularized Equiv. CVFE
0.50
0.35
0.20
0.80
0.65
So

020
40
60
80
100
120
0 300 600 900Time (days)
Oil
Pro
du
ctio
n (
ST
B/d
ay)
PrimaryProduction
Parameter SensitivityParameter Sensitivity (900 days) (900 days)
1000 md Base Case
0.50
0.35
0.20
0.80
0.65
SoGM 100 md 50:50GM 100 md 33:33:33
1000 mdBase Case
Geom. Mean 100 md50:50 Random k
Geom. Mean 100 md33:33:33 Random k

020
40
60
80
100
120
0 300 600 900Time (days)
Oil
Pro
du
ctio
n (
ST
B/d
ay)
PrimaryProduction
Parameter SensitivityParameter Sensitivity (900 days) (900 days)
1000 md Base Case
0.50
0.35
0.20
0.80
0.65
So
1000 mdBase Case
100 md Case 10 md Case
Case 10mdCase 100md

Different Angle Domain Different Angle Domain (900 days)(900 days)
Base Case Different Angle Case
Oil
Pro
du
ctio
n (
ST
B/d
ay)
0.50
0.35
0.20
0.80
0.65
So
020
40
60
80
100
120Base CaseDifferent Angle Case
0 300 600 900Time (days)
PrimaryProduction

Different Height Domain Different Height Domain (900 days)(900 days)
Base Case
Oil
Pro
du
ctio
n (
ST
B/d
ay)
0.50
0.35
0.20
0.80
0.65
So
020
40
60
80
100
120Base CaseHalf Top Case
0 300 600 900Time (days)
Half-bottom Case Half-top Case
Half Bottom CasePrimary
Production

Sandstone
Faulted-Fractured Reservoir SystemFaulted-Fractured Reservoir System
Fault
Increasing FracturesIncreasing Fractures
Upper Reservoir
Lower Reservoir
Shale
k (md) (%)10000
500
100
10
5
11
10
8
100
200 ft
1000 ft
1000 ft
kh (md-ft)Fault
thic
knes
s =
0.3
ft
Production Wells
Secondary Injection Wells (production wells during primary prod’n)

20 daysPrimary Production
0.50
0.35
0.20
0.80
0.65
So
600 daysPrimary Production 3000 daysWater Flood Start after 600 days 6000 daysWater Flood Start after 600 days
Viewed From Bottom of Model Domain
Faulted-Fractured ReservoirFaulted-Fractured Reservoir
Production Well
Injection Well

0.50
0.35
0.20
0.80
0.65
So
Production Well
Injection Well
FaultLower Res.
Primary Production
Wat
er C
ut
(vo
l/vo
l)
0
0.35
0.70
0 3000 6000Time (days)
Primary Production
Oil
Pro
du
ctio
n R
ate
(S
TB
/day
)
0
400
800
0 3000 6000Time (days)
Production From
Primary Production 20 days
Impact of Fault Impact of Fault kk
Primary Production 600 days
Secondary Production after 600 days 3000 days
Secondary Production after 600 days 6000 days
Fault k = 100 mdFault k = 10,000 md

1800 feet
1800
fee
t
200 feet
N
UD
Cocks Comb Study
Cottonwood Wash StudyField
Area
Utah
Teasdale Fault, Utah10 Kilometers
1m
Joint ZoneHigh k Features
Outcrop-to-SimulationOutcrop-to-Simulation
Production• Primary 600 days• Production BHP 2200 psi• Injection BHP 3200 psi
Line Drive 2
Line Drive 1
k (md) (%)100
10
25
10
16000
2500
kh (md-ft)

Line Drive 1 (N to S)Line Drive 1 (N to S) Line Drive 2 (W to E)Line Drive 2 (W to E)
600 days
Primary Production
Oil
Pro
du
ctio
n R
ate
(ST
B/d
ay)
500
1000
2500
3500
0 3000 6000Time (days)
Gas
Oil
Rat
io
1100
1400
1800
0 3000 6000Time (days)
2100
View From Bottom of Model Domain
Well Placement StrategiesWell Placement Strategies
Line Drive 1
Line Drive 2
Line Drive 1Line Drive 2
1000 days2000 days4000 days6000 days
So
0.50
0.35
0.20
0.80
0.65

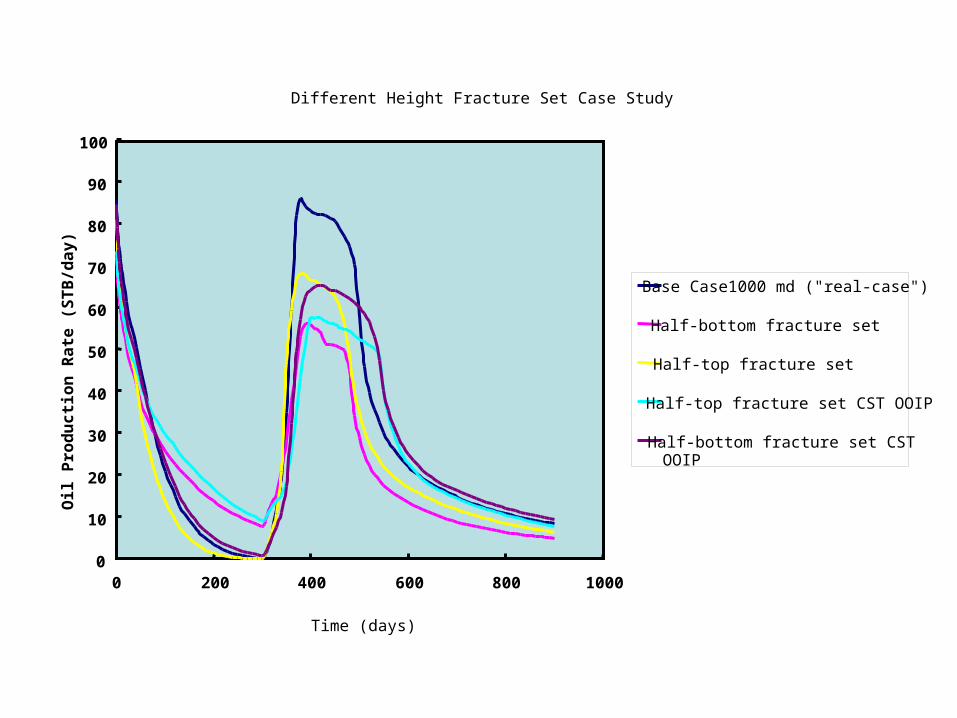
Different Height Fracture Set Case Study
-10
0
10
20
30
40
50
60
70
80
90
100
0 200 400 600 800 1000
Time (days)
Oil
Pro
du
ctio
n R
ate
(S
TB
/day)
Base Case1000 md ("real-case")
Half-bottom fracture set
Half-top fracture set
Half-top fracture set CST OOIP
Half-bottom fracture set CSTOOIP
Different Height Fracture Set Case Study
0
10
20
30
40
50
60
70
80
90
100
0 200 400 600 800 1000
Time (days)
Oil
Pro
du
cti
on
Ra
te (
ST
B/d
ay
)
Base Case1000 md ("real-case")
Half-bottom fracture set
Half-top fracture set
Half-top fracture set CST OOIP
Half-bottom fracture set CSTOOIP

Water Cut
0
0.2
0.4
0.6
0.8
1
1.2
0 1000 2000 3000
Time (days)
Wate
r C
ut
Test01
Test02
Test03
Test04
Center Producer w/o injection

Status and Challenges• Preserve geologic integrity while constructing simulation models• Relationship between discrete-fracture models and dual-porosity
models– DFN as upscaling/calibration tool for DP models? – Field-wide DFN models in the near future?
• Fundamental work– Additional physics?– Upscaling– Integrating geomechanics– Dynamic data updaing– Different discrete-fracture implementations– Discretization schemes– Gridding– Efficiency of solvers– High-performance (parallel) computing

Acknowledgements U.S. DOE Contract DE-FC26-04NT15531 through the
National Energy Technology Laboratory. Schlumberger Inc. – Eclipse academic license Sandia National Laboratories – CUBIT license Argonne National Laboratory – PETSc Our eam
– Jim Evans, Professor, Utah State University, Logan, Utah– Tom Doe, Golder and Associates– Yi-kun Yang, Post-doc– Sriram Balasubramaniam, Graduate student– Ganesh Balasubramaniam, Graduate student– Yao Fu, Graduete student– Kan Huang, Graduate student– Zhiqiang Gu, Graduate student– Huabing Wang, Graduete student