10. a coherent agriculture trade policy for mexico · a coherent agriculture trade policy for...
TRANSCRIPT

10. A COHERENT AGRICULTURE TRADEPOLICY FOR MEXICO
Ralf Peters and David Vanzetti1
10.1 INTRODUCTION
Mexico has a large rural territory and population – the largest population living inpredominantly rural areas in the countries of the Organisation for EconomicCooperation and Development (OECD, 2007, p. 14). Farm employment, however,has dropped significantly in recent decades. Agriculture accounts for about 14 percent of employment in Mexico,2 down from more than 25 per cent in the early1990s. Furthermore, agriculture today contributes only about 4 per cent to Mexico’sgross domestic product (GDP), which is half the level that it contributed two decadesago. Rural poverty is high; 56 per cent of the people in rural areas live in poverty(OECD, 2007, p. 16).
This development coincides with a trade policy that has led to much moreopen markets, especially within the North American Free Trade Agreement (NAFTA)region, and significantly increased trade in agricultural products. Although a shrinkingagricultural sector is not uncommon during the course of development, the situationof the agricultural sector in Mexico is considered unsatisfactory by many Mexicansand development economists, and it has been argued that Mexico’s external traderelations have an adverse impact on the agricultural sector in Mexico. Increasing im-ports of maize, of which more than 99 per cent come from the United States ofAmerica (US), have been discussed extensively in the literature. Corn imports were670 per cent higher in 2008–2010 than they were in 1991–1993. Although it is clearthat NAFTA had an impact on the trade flows, it appears less clear what effects theincreasing trade have had on employment and wages in Mexico. This chapter providesan overview of the development of trade and employment in Mexico’s agriculturalsector and discusses causality. The focus, however, is on analysing the possible effectsof some potential policies intended to reinforce the agricultural sector.
357
1 David Vanzetti was employed by UNCTAD when writing the first draft.2 World Development Indicators 2011. The Food and Agriculture Organization (FAO) reports thatthe agricultural population was 19 per cent of the total population in 2008, down from 30 per centin 1990. OECD statistics report 12.9 per cent employment in agriculture in 2009 as a share of totalcivilian employment, down from 25.7 per cent in 1993.
AcknowledgementsThis is a chapter from "Cheong, D., Jansen, M. and Peters, R (eds.). 2013. SharedHarvests: Agriculture, Trade, and Employment. International Labour Office and UnitedNations Conference on Trade and Development". The edited volume was producedwith the support of the European Union. The contents of this chapter are the soleresponsibility of the authors and can in no way be taken to reflect the views of theILO, UNCTAD, or the European Union.

What can the Mexican government do to strengthen its agricultural sector soas to increase employment and food security while reducing poverty? The scope fortrade measures is limited, as Mexico has committed itself in the World TradeOrganization (WTO) and various regional trade agreements to abstain from certaintypes of measures and as Mexico has a free trade agreement with its largest tradingpartner, the US. There is limited scope for increasing tariffs on imports or reducingtariffs facing its exports.
If agricultural tariffs were to be raised, trade agreements, especially NAFTA,would have to be revised. Revisions have been advocated – by presidential candidates,among others – and discussed in the literature.3 Mexico would probably have to offerCanada and the US something in return, and thus any benefits to some agriculturalsectors could be offset by additional costs to other sectors in Mexico. For example,because of the links between grains, oilseeds, and livestock, trade policies raisingprices for feed grains could have adverse effects on livestock producers and con-sumers.
An alternative policy is to provide additional domestic support, or to providethe same amount in a different fashion, possibly better targeted to producers in need.As a means of support, input subsidies, on electricity or credit, for example, havethe advantage of distorting only one side of the market, production, as opposed toboth sides, as do output subsidies. Input subsidies may be preferred for that reason.However, the question remains whether such support can address poverty. McMillanet al. (2006) find, for example, that the poorest corn farmers in Mexico are net con-sumers of corn, and de Janvry et al. (1995) find that the majority of small- andmedium-size corn producers do not produce for the market. To address poverty, thegovernment might consider providing targeted direct income support to those inneed, whether or not they are farmers.
The purpose of this study is to assess various policy options. Policies examinedinclude:
1. increasing tariffs on agricultural imports from NAFTA countries to most favourednation (MFN) levels;
2. removing the payroll tax on agricultural labour;
3. funding research and development to increase agricultural productivity;
4. switching current domestic support to subsidies on output or input.
A global general equilibrium model, the Global Trade Analysis Project (GTAP) model,is used to analyse the production, trade, and welfare effects of such policy changes.The results show that policies that increase distortions may strengthen the agriculturalsector in terms of higher output, exports, and employment but are likely to have
Shared Harvests: Agriculture, Trade and Employment
358
3 See, for example, DTB Associates and AgRisk Management. Implications for the U.S. and Mexico ofMexico withdrawing certain agricultural products from NAFTA. 2006, and McKinley (2008).

adverse effects on the rest of the economy. In contrast, removing payroll taxes andadopting policies that increase agricultural productivity have positive effects for boththe agricultural sector and the economy as a whole.
10.2 THE AGRICULTURAL SECTOR
Agriculture plays an important role in Mexico’s economy.4 It accounts for about 14per cent of employment in Mexico (World Bank, 2011), contributing, however, onlyabout 4 per cent of its GDP. The relative importance of agriculture to Mexico hasdeclined, as in other OECD countries. Between 1993 and 2010 total agricultural em-ployment in Mexico declined by 28 per cent (figure 10.1).5 In 1993 about 8 millionpeople were employed in agriculture in Mexico, and in 2010, 5.8 million. Agriculture’scontribution to GDP in per cent has halved in two decades.
The decline of the agricultural sector in Mexico appears to be greater than inmany other countries. The share of employment in agriculture declined between theperiods 1990–95 and 2005–10 by 45 per cent, more than in such other middle incomecountries as Brazil (29 per cent), Chile (30 per cent), Malaysia (37 per cent), andTurkey (43 per cent). On average, the decline in the upper-middle income group ofcountries was 29 per cent. Furthermore, agriculture’s current share of employmentin Mexico, at 14 per cent, is at the lower end of the scale compared with many otherdeveloping countries in this group, where an average of 33 per cent are employedin agriculture.6
10: A Coherent Agriculture Trade Policy for Mexico
359
4 Section 10.2, 10.3 and 10.3 partly use material from UNCTAD (2013).5 International Labour Office (ILO) data confirm the order of magnitude for the period 1995–2008.6 Data are based on World Bank World Development Indicators 2012; latest available year for eachcountry.
Figure 10.1: Employment in agriculture in Mexico, in millions of people, 1993–2010
Source: OECD labour force statistics.
0
1
2
3
4
5
6
7
8
9
1993
1994
1995
1996
1997
1998
1999
2000
2001
2002
2003
2004
2005
2006
2007
2008
2009
2010

The structural adjustment of the rural economy, with a declining contributionof agriculture and an increasing share of non-farm activities, has increased significantlythe number of unemployed people in both rural dispersed and rural semi-urban areas.Furthermore, significant migration from rural areas to urban areas or to the US in-dicates a lack of rural employment opportunities.
Economic disparity and poverty remain challenges in Mexico. Most peopleliving below the poverty line live in rural areas(Agriculture and Agri-Food Canada,2010). The percentage of the rural population living in poverty is 56 per cent. Wagesin the primary sector are about one-fifth to one-quarter of wages in other sectors(Scott, 2010). This is one consequence of the low labour productivity of agriculturein Mexico.
Mexico’s agricultural sector is diverse. In some areas, predominantly in north-western parts of the country, larger commercialized farms operate. In central andsouthern states, farms are often smaller and often produce for subsistence. The relativeimportance of products for big and small farms varies as well. According to Prina(2011), fruits and vegetables are relatively more important for smaller farms than forlarger farms, for which maize is more important. The average farm size is 8 hectares.Both small and large farms have become more common, while the number of middle-sized farms has decreased. Small farms represented approximately 73 per cent of totalproduction units in 2007. Small- and medium-size farms employ a majority of theagricultural workforce. Many constraints, such as the land tenure system, limit theproductivity of these smaller operations.
Shared Harvests: Agriculture, Trade and Employment
360
Table 10.1: Mexican agricultural products with highest production value in 1990 and2010, US$ million
Commodity 1990 2010
Indigenous cattle meat 3 735 5 279Indigenous chicken meat 1 065 3 811Cow milk, whole, fresh 1 917 3 332Hen eggs, in shell 838 1 975Indigenous pig meat 1 160 1 804Sugar cane 1 311 1 656Maize 1 510 1 433Tomatoes 797 1 108Chillies and peppers, green 298 1 099Mangoes, mangosteens, guavas 644 978Oranges 429 783Avocados 476 767Lemons and limes 276 750Beans, dry 735 665Bananas 559 592Wheat 547 554
Source: FAOstat.

Production in terms of value and quantity has increased from 1990 to 2010 formost major agricultural products. Meat products have the highest value of production,followed by the crops sugar and maize, and fruits and vegetables (table 10.1). Wheatand rice production values are relatively low, about US$600 million and $200 million,respectively.7
10.3 AGRICULTURAL TRADE
In 2010 agriculture accounted for about 6 per cent of Mexico’s merchandise exports(about US$17 billion) and less than 7 per cent of its imports (US$21 billion) (figure10.2).8 These shares have continuously decreased from an average of 11.9 per centfor exports and 16.8 per cent for imports in 1980–1993 (Kose et al., 2004), whilemanufacturing trade has increased its shares. In absolute terms both exports and im-ports have increased.
Mexico’s agricultural exports and imports both are highly concentrated on theUS, which accounted for 78 per cent of total agricultural exports and 74 per cent ofimports in 2010. The share of agricultural imports sourced from the US increasedbefore the start of the implementation of NAFTA in 1994 to a level of around three-quarters (74 per cent in 1993), and since then has fluctuated around that level (figure10.3). The share of agricultural exports going to the US decreased from 89 per centin 1993 to the current level of 78 per cent. Thus, the share of aggregated agriculturaltrade with the US has not significantly increased since the implementation of NAFTAbegan.9 The composition of trade, however, has changed; for certain staple food andmeat products, the share of US imports has increased significantly (table 10.2).
More staple crops and meats are flowing south and more beverages, seasonalfruits, and vegetables are flowing north. In that sense, NAFTA’s liberalization of agri-cultural trade appears to have produced the “expected” results (Wise, 2009). Themajor imports from the US are stock feed – soya beans, maize, and sorghum. Wheatand beef are the major food imports (table 10.3). Total agricultural imports from theUS have increased from US$4.3 billion in 1993 to $15.6 billion in 2010.
Notwithstanding the growth of aggregate agricultural imports, which is basicallyin line with growth for other developing countries,10 imports of some particularly sen-
10: A Coherent Agriculture Trade Policy for Mexico
361
7 Rice production value was not available from FAO. The value has been calculated from the amountof production and a price of US$500 per ton.8 UN Comtrade; WTO definition of agricultural trade. 9 Trade with Canada has been growing disproportionately but remains at a low level. The share ofimports from Canada grew from 5 per cent to 8 per cent from 1993 to 2010 and the share of exportsto Canada from 1 per cent to 3 per cent.10 From 1995−1997 to 2008−2010, Mexico’s agricultural imports increased by 201 per cent. Duringthat same period world agricultural imports increased by 130 per cent in US$ nominal value terms,and total low- and middle-income countries’ imports increased by 238 per cent (e.g. Brazil26 percent, Chile 207 per cent, Colombia 124 per cent, Guatemala 278 per cent, Peru 146 per cent, andTurkey 147 per cent).

sitive products, such as corn, rice, beef, poultry, and beans, are dramatically high.Moreover, for all these imports, the US market share is very high, and, for many ofthese products, the US share has been increasing since 1993. Imports of maize were670 per cent higher in 2008–2010 than they were in 1991–1993. Almost all of theimported maize comes from the US (table 10.3). Similarly, beans imports have in-creased by 853 per cent. Imports of wheat from the world have increased less, by192 per cent, but the share of imports coming from the US increased from 58.9 to76.1 per cent. Growth in pork and poultry meat imports was also high, at 664 percent and 390 per cent, respectively.
Shared Harvests: Agriculture, Trade and Employment
362
Figure 10.2: Mexican agricultural imports and exports, 1990–2010, in US$ billion
0
5
10
15
20
25
1990
1991
1992
1993
1994
1995
1996
1997
1998
1999
2000
2001
2002
2003
2004
2005
2006
2007
2008
2009
2010
Imports
Exports
Source: UN Comtrade, current US$.
Figure 10.3: Mexican agricultural imports from the world and the US, 1990–2010, in US$ billion
0
5
10
15
20
25
1990
1991
1992
1993
1994
1995
1996
1997
1998
1999
2000
2001
2002
2003
2004
2005
2006
2007
2008
2009
2010
World
US
Source: UN Comtrade, current US$.

Mexico’s agricultural exports to the US increased from an estimated $3.2 billionin 1993 to $13.6 billion in 2010, and account for about 17 per cent of the total valueof agricultural imports of the US. Horticulture products such as tomatoes and fruitsare the main exports (table 10.4). Beer exports have increased significantly, while theimportance of live cattle has decreased.
Regional trade agreements (RTAs) usually cause trade creation and diversion ef-fects, resulting in a higher share of intra-RTA trade. Mexico’s imports from Canadaand the US increased slightly between 1993 and 2010, from 79 per cent to 82 percent (table 10.5). On the other side, US imports from Mexico increased from animport market share of 11 per cent to 17 per cent between 1993 and 2010, and forCanada Mexico’s share of imports has increased from 2 per cent to 4 per cent. Thisconfirms the trade creation effect. The decreasing share of Mexico’s exports to the
10: A Coherent Agriculture Trade Policy for Mexico
363
Table 10.2: Main Mexican agricultural imports from US as a percentage of total agriculture imports from US
HS 2 digit Product 1993 2010
10 Cereals 15.4 19.002 Meat and edible meat offal 13.5 17.712 Oilseed, oleaginous fruits; miscellaneous grains 14.4 12.852 Cotton 8.0 6.823 Residues and waste from the food industry 4.9 6.0
Source: UN Comtrade.
Table 10.3: Imports to Mexico of selected agricultural products
US share of total Imports from the world imports (%)
% %Volume change in Value change in(average volume (average value,2008-10 1991-93 2008-10 1991-93in 1000 to 2008-10 in US$ to 2008-10 Value Valuetons) millions) 1991-93 2008-10
Beans 129.1 852.6 126.1 1 330.0 92.4 90.8
Beef 318.9 70.2 1 152.7 198.6 81.1 84.6
Maize 8 179.6 670.3 1 854.6 947.7 99.0 99.3
Pork 478.4 664.1 843.3 791.5 78.3 90.5
Poultry 642.6 390.2 757.9 506.4 98.5 90.7
Rice 820.7 173.7 345.5 390.8 72.3 99.5
Sorghum 2 101.0 –44.4 411.3 –3.9 99.4 100.0
Sugar 4 556.5 1 031.5 649.7 413.1 43.5 73.9
Wheat 3 323.2 191.7 1 006.8 484.0 58.9 76.1
Source: UN Comtrade, SITC classification of products; see annex.

NAFTA markets (from 89 per cent to 78 per cent) is explained by lower importgrowth rates in Canada and the US and does not reflect loosing market shares.However, the Mexican market share in Canada is still very low.11
Increasing specialization, with more staple crops and meat flowing south andmore seasonal fruits and vegetables flowing north, has resulted from the NAFTA-in-duced tariff cuts, which reduced the real Mexican border price of corn, an importedcommodity, and increased the real Mexican border price of fruits and vegetables,which are exported commodities (McMillan et al., 2006; Prina, 2011). This confirmsthe finding by Dimaranan et al. (2003), cited in Stiglitz and Carlton (2005), that, onone hand, Mexico has become more dependent on imports in programme crops andmeat/livestock. On the other hand, Mexico has been successful in the export of veg-etables and fruits. Vegetable exports to the US increased at 0.8 per cent annuallyduring the 1989–1993 period and then jumped to increases of 6.2 per cent annuallyin the post-NAFTA period (1994–2004)(Prina, 2012). More than 85 per cent of thetomatoes imported into the US come from Mexico. Mexican fruit exports to the USrose at 2.8 per cent per year between 1989 and 1993 and at 4.8 per cent per yearafter that.
Shared Harvests: Agriculture, Trade and Employment
364
Table 10.4: Main Mexican agricultural exports to US as a percentage of total agriculture exports to US
HS 2 digit Product 1993 2010
07 Edible vegetables and certain roots 38.1 30.322 Beverages, spirits, and vinegar 7.8 17.008 Edible fruit and nuts; peel of citrus 12.3 14.917 Sugars and sugar confectionery 1.3 8.719 Preparations of cereal, flour, starch/milk 1.9 5.3
Source: UN Comtrade.
Table 10.5: Market shares of exports and imports in NAFTA
Reporter Partner Imports (%) Exports (%)
1993 2010 1993 2010
Mexico US 74 74 89 78
Canada 5 8 1 3
NAFTA 79 82 90 81
US Mexico 11 17 8 12
Canada Mexico 2 4 2 4
Source: UN Comtrade.
11 The average MFN rate in Mexico has not decreased since the implementation of NAFTA. It re-mains relatively stable at around 20 per cent for the simple average. It is possible, however, that non-NAFTA trade, which accounts for about 20 per cent of agricultural trade, is not MFN trade but isinstead under other preferential schemes.

10.4 TRADE POLICY
Mexico has undertaken significant agricultural market reforms. Since the early 1990sit has decreased its trade barriers, shifted away from commodity support to more de-coupled forms of support, and encouraged market liberalization (OECD, 2007).
10.4.1 Market accessMexico is a founding member of the WTO, with an average bound rate of 44 percent and a relatively high and stable average MFN applied rate of 21 per cent (simpleaverages for agricultural products, 2010) (table 10.6). Sugars and confectionary, animaland dairy products, and coffee and tea attract the highest tariffs.
Most of Mexico’s imports are under preferential agreements. The NAFTA amongMexico, the US, and Canada was ratified in 1994. Many tariffs were eliminated im-mediately, and others were phased out over several years. Because of the sensitivityof agriculture, the agreement featured an extended implementation period for sensitiveproducts over periods of 5 to 14 years. In Mexico maize is particularly sensitive; theNAFTA agreement had a 14-year phase-in period to protect the Mexican market fromimports of US maize. The phase-in was completed in 2008.
It has been shown that the comprehensive liberalization schedule with the UShas had the impact of increasing certain agricultural imports from the US (see, e.g.McMillan et al., 2006 and Prina, 2011). The free market access to the US has mostlikely also helped Mexican exporters, but the US does not in general have very hightariffs on agricultural goods. On fruits and vegetables, the major export products tothe US, the average applied MFN rate is low, at 4.9 per cent. In many sectors where
10: A Coherent Agriculture Trade Policy for Mexico
365
Table 10.6: Mexican tariffs by product group
Bound MFN applied NAFTA2010
Animal products 64 41 0Dairy products 63 35 0Fruit, vegetables, plants 37 18 0Coffee, tea 64 37 0Cereals and preparations 45 20 0Oilseeds, fats, and oils 44 17 0Sugars and confectionary 119 66 0Beverages and tobacco 44 28 0Cotton 39 5 0Other agricultural products 28 7 0All agriculture 44 21 0Fish and fish products 35 17 0
Source: WTO, ITC, UNCTAD world tariff profiles 2010.

the US has high tariffs, such as in dairy (16.2 per cent), Mexico is not a majorexporter.12 Thus, the tariff preferences through NAFTA appear to have relatively lowervalue for Mexico’s agricultural producers than for US farmers (table 10.7).
10.4.2 Domestic supportThere are no limitations in the NAFTA agreement concerning the use of domesticsupport. Still, US subsidies on agriculture are a major concern for Mexican farmers.Total support for US agricultural producers has risen and fallen since NAFTA wasimplemented in 1994. The latest figure for producer support is $26 billion (2010),according to OECD estimates. This is currently about 7 per cent of the total valueof production. After a peak of more than $55 billion in 1999 (about 26 per cent ofthe total value of production), the decline is attributable in part to an increase incommodity prices; since some of the payments are countercyclical, payments are re-duced in times of high prices.
Total domestic support (for example, including general services such as researchand food stamps for low income families) for US agriculture in 2010 was still signif-icant, totalling $133 billion. However, little of this was paid to producers accordingto output use ($1.9 billion) or input use ($9.6 billion). These are the categories thatare considered most production-distorting. Therefore, it is difficult to assess how dis-torting the US domestic support is for Mexico.
Of particular interest is maize, as both Mexico and the US grow this crop, andat the signing of NAFTA Mexican producers were concerned about being floodedwith cheap imports of maize following the removal of tariffs. US and Mexican maizeare not completely substitutable. The US produces mainly yellow maize, which isused as a stock feed. Mexico produces white maize, which is also used as a food forhuman consumption. However, there is some substitutability between yellow andwhite maize, and the US also exports some white maize.
Shared Harvests: Agriculture, Trade and Employment
366
Table 10.7: Average applied tariffs in agriculture between the US, Canada, and Mexico
Import country Export country Preferential MFN rate for export tariff (%) basket (%)
Mexico US 0.0 31.1Canada 0.0 16.7
US Mexico 0.0 5.4Canada Mexico 0.0 5.8
Note: MFN rate is the trade-weighted average MFN tariff for the actual export basket from the indicated export country. Preferentialtariff is the theoretical rate since some products may face the MFN level if they do not meet, for example, rules of origin requirements. Source: UNCTAD TRAINS Database, 2009 and 2010.
12 There are some exceptions. US imports of processed tobacco and processed ground-nuts, for ex-ample, were protected by tariffs of 77 per cent and 164 per cent of the product price, respectively.Relative to the rest of the world, Mexico benefits from preferential access to the US market for theseagricultural products.
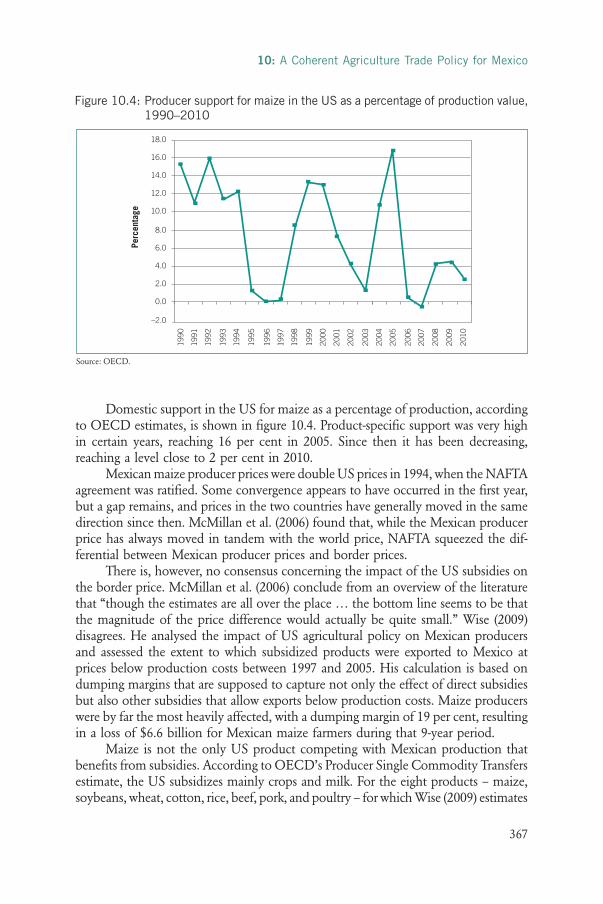
Domestic support in the US for maize as a percentage of production, accordingto OECD estimates, is shown in figure 10.4. Product-specific support was very highin certain years, reaching 16 per cent in 2005. Since then it has been decreasing,reaching a level close to 2 per cent in 2010.
Mexican maize producer prices were double US prices in 1994, when the NAFTAagreement was ratified. Some convergence appears to have occurred in the first year,but a gap remains, and prices in the two countries have generally moved in the samedirection since then. McMillan et al. (2006) found that, while the Mexican producerprice has always moved in tandem with the world price, NAFTA squeezed the dif-ferential between Mexican producer prices and border prices.
There is, however, no consensus concerning the impact of the US subsidies onthe border price. McMillan et al. (2006) conclude from an overview of the literaturethat “though the estimates are all over the place … the bottom line seems to be thatthe magnitude of the price difference would actually be quite small.” Wise (2009)disagrees. He analysed the impact of US agricultural policy on Mexican producersand assessed the extent to which subsidized products were exported to Mexico atprices below production costs between 1997 and 2005. His calculation is based ondumping margins that are supposed to capture not only the effect of direct subsidiesbut also other subsidies that allow exports below production costs. Maize producerswere by far the most heavily affected, with a dumping margin of 19 per cent, resultingin a loss of $6.6 billion for Mexican maize farmers during that 9-year period.
Maize is not the only US product competing with Mexican production thatbenefits from subsidies. According to OECD’s Producer Single Commodity Transfersestimate, the US subsidizes mainly crops and milk. For the eight products – maize,soybeans, wheat, cotton, rice, beef, pork, and poultry – for which Wise (2009) estimates
10: A Coherent Agriculture Trade Policy for Mexico
367
Figure 10.4: Producer support for maize in the US as a percentage of production value,1990–2010
18.0
16.0
14.0
12.0
10.0
8.0
6.0
4.0
2.0
0.0
–2.0
Perc
enta
ge
1990
1991
1992
1993
1994
1995
1996
1997
1998
1999
2000
2001
2002
2003
2004
2005
2006
2007
2008
2009
2010
Source: OECD.

the dumping margin, he calculates that subsidies in the US caused losses of $12.8billion for Mexican producers over the period from 1997 to 2005.
Since 2005 product-specific domestic support in the US has dwindled to verylow levels due to the countercyclical nature of much of that support, as noted. Forinstance, US maize prices have risen from a little over US$2 per bushel in 2001 to$8 per bushel in 2011. Some observers have attributed part of this rise to the influenceof US- and EU-mandated biofuels policies. Some 40 per cent of the US maize cropis diverted for this purpose, according to the United States Department of Agriculture(USDA).13 Babcock (2011) suggests that, as a result, US maize prices were 17 per centhigher in 2011 than they would have been otherwise. This policy not only raises theprice of maize but also the prices of other crops, such as vegetable oils and sugar,that are used in ethanol production, and wheat and coarse grains, which are substituteanimal feeds.
While previous US policies may have had a detrimental effect on Mexicanmaize producers, the data suggest this effect is now small or, indeed, may havereversed. If the US policy that supports the production of maize for ethanol productionleads to higher prices, the Mexican maize sector could benefit from that policy. Whilebeneficial for maize producers, higher maize prices are likely to be detrimental forMexican livestock producers and for consumers’ access to food. Wise (2012) estimatesthat, from 2006 to 2011, expansion of US ethanol production cost Mexico about$1.5 billion due to ethanol-related corn price increases.
For its part, Mexico supported its agricultural producers with MXN79 billionin 2010 (US$6.2 billion),1412 per cent of the value of agricultural production, whichis about MXN592 billion. The total support estimate, which includes transfers fromconsumers, was MXN94 billion. The largest items are support based on commodityoutputs and input use. Market price support goes primarily to poultry meat, sugar,and milk. Subsidies on input use include electricity, price hedging (mainly on maize,sorghum, and wheat), and fixed capital formation. Expenditure on research and de-velopment is relatively low, at MXN1.3 billion.
Mexico’s domestic support is significant but lower than the average OECDfarm support. The OECD calculated an average producer support of 18.3 per centfor 2010, partly driven by highly subsidizing countries such as Japan, Republic ofKorea, Norway, and Switzerland. Although in 2010 the Mexican producer supportestimate was 12 per cent compared with the US level of 7 per cent, during manyyears in recent decades product-specific subsidies on crops in Mexico were lower thanin the US. For instance, maize support was 8.8 per cent in 2005, roughly half of thesupport that US farmers received.
Scott (2010) notes that market price support and output-linked payments inMexico have targeted mostly traditional crops, particularly maize and other grains,as well as raw sugar and some animal products such as milk and poultry meat.
Shared Harvests: Agriculture, Trade and Employment
368
13 http://www.usda.gov/oce/commodity/wasde/14 Exchange rate from USDA ERS 12.64.

However, fruits and vegetables have not received significant support but have benefitedfrom the liberalization of agricultural markets.
10.4.3 Non-tariff measuresMexico’s trade policy has led to much more open markets, especially within theNAFTA region. While tariffs on agricultural products between the US and Mexicohave been eliminated, standards and other non-tariff measures regulating cross-bordertrade prevent full integration of the two markets. Non-tariff measures are the dominantobstacle to exports for Mexican agricultural producers. The most important non-tariffmeasures are technical measures, mainly sanitary and phytosanitary (SPS) measuresand labelling requirements, as well as rules of origin requirements. NAFTA has alloweddiffering levels of standards to develop (as opposed to effective equivalence). Vollrath(2004) notes that SPS-related issues and standards remain contentious in the contextof NAFTA in areas such as dairy, beef, sugar, wheat, rice, corn, and livestock. This isdue to a lack of harmonized product, health, safety, and environmental standards,which, in turn, stem from differences in national laws and regulations, divergent farmprogrammes, and incompatible macroeconomic policies. Products legally producedin one country in NAFTA cannot automatically be sold in other NAFTA countriesbut may require additional certification.
10.4.4 Effect of trade policy on Mexican producersNAFTA has been accused of damaging farmers in Mexico and jeopardizing Mexico’sfood self-sufficiency (Polaski, 2006). Fanjul and Fraser (2003) argue that NAFTA hasbeen responsible for a surge in US maize exports to Mexico and the associated declinein the Mexican producer price of maize. Moreover, Mexican farmers would be at adisadvantage vis-à-vis US farmers because of the US subsidies. The result, it is argued,was an increase in poverty. Similarly, Polaski (2004) contends that US exports of sub-sidized crops such as corn have depressed agricultural prices in Mexico, and the ruralpoor have borne the brunt of the adjustment to NAFTA. Khor (2007) also is criticalof NAFTA, arguing that the increase in Mexican exports of some agricultural productshas not been enough to compensate for the substitution of imports of other productsfor domestic agricultural products.
In contrast, the World Bank (2004) argues that the reduction in producer pricesreflected a long-term trend and cannot be blamed on NAFTA. Barron and Rello(2000) analyse the growing tomato agro-industry and argue that vegetable exportshave proved to be an alternative to rural unemployment and are crucial to the survivalof entire villages. The authors are, however, also critical of poor working conditions.Hufbauer and Schott (2005) acknowledge that expanded agricultural trade underNAFTA imposed adjustment costs in Mexico, but they argue that static and dynamicgains probably exceed adjustment costs within Mexico by a factor of five or more.Others find small effects of US subsidies on Mexican prices (see discussion inMcMillan et al.(2006)).
10: A Coherent Agriculture Trade Policy for Mexico
369

Some analyses of the impact of NAFTA on Mexico’s agricultural sector distin-guishes between regions close to the US border and remote areas in the south ofMexico as well as among farms of different sizes. Nicita (2004) finds that trade lib-eralization has affected domestic prices and labour income differently both acrossincome groups and geographically across the country. The effects on prices werefound to be higher in regions more exposed to global markets, close to the US border.The findings indicate that trade liberalization has lowered relative prices of most non-animal agricultural products, reducing households’ agricultural income. Whilereducing the cost of food, thus benefiting consumers, the policy also contributed towidening the income gap between urban and rural areas.
Using household survey data, de Janvry et al. (1995) found that the majorityof small- and medium-size corn producers do not produce for the market. Therefore,they predicted that most corn farmers’ income will not be directly affected by thedecline in the price of corn associated with NAFTA, while a significant share willbenefit as consumers. Using a general equilibrium model, Levy and Van Wijnbergen(1995) quantify the impact on household income, labour, and land markets of lib-eralizing the Mexican corn sector. They emphasize that even subsistence farmers whodo not sell corn are likely to sell labour. Thus, if dropping corn prices reduce wages,subsistence farmers are likely to be hurt by the liberalization of the corn sector. Prina(2012) finds, however, that NAFTA-triggered changes in the border prices of cropsimported from the US and exported to the US had no impact on the wages of agri-cultural workers in Mexico. She argues that the mobility and flexibility of workers,inter alia resulting from little likelihood of sector-specific skills, insulated workersfrom any adverse impact.
McMillan et al. (2006) confirm that the majority of the poorest corn farmersdid not sell corn in the market prior to NAFTA, and so their income will not havebeen directly affected by the forces of globalization associated with NAFTA. A majorityof the medium- and large-size corn farmers, however, sell corn in the market, andthe medium-size corn farmers experienced a sharp decline in real income as a resultof NAFTA. The income of the largest corn farmers has increased.
Thus, the studies have shown that the impact of globalization, and more specif-ically NAFTA, appear to depend on farm size, proximity to the US border, types ofagricultural products produced, income levels, and share of agricultural income intotal household income. It appears that a majority of small farms were not much af-fected, and that middle-income corn farmers were adversely affected, while thehighest-income farmers were able to profit.
In her econometric study Prina (2012) also assesses the impact of NAFTA-in-duced changes in the border price of crops on agricultural employment in Mexico.15
Shared Harvests: Agriculture, Trade and Employment
370
15 Prina (2011) finds that NAFTA-induced tariff cuts caused a reduction in the real Mexican borderprice of corn and an increase in the border price of tomatoes and melons. Nicita (2009) finds thattariff liberalization in Mexico decreased the price of a basket of agricultural goods.

She finds that increases in the real price of vegetables are associated with an increasein employment in the cultivation of vegetables, and the drop in the real price ofcorn reduces employment in the corn sector. Furthermore, she confirms that theeffects vary with the distance to the US border, emphasizing the importance of ac-counting for regional differences.
Prina (2012) does not assess the overall effect on employment in agriculture.Furthermore, it has been argued that agriculture cannot be looked at separately inthe context of NAFTA. Nicita (2004), for example, shows that, despite the likely neg-ative effect on certain farm households, tariff changes during the 1990s appear tohave raised disposable income for all households, with richer households enjoyinga 6 percent increase and poorer households enjoying a 2 percent increase.
To summarize, it appears that NAFTA has reduced domestic prices for manyagricultural products in Mexico, including corn, while tariff reductions increasedprices for certain vegetables and fruits. Most analysts find an adverse effect of USsubsidies on Mexican farmers, but the degree to which prices are reduced is contro-versial and in any case varies from year to year. These price changes have broughthardship for many Mexican farmers, such as those with medium-size corn farms,whose incomes have declined, while benefiting some larger farms as well as vegetableproducers. Smaller farms appear to be less affected, as they produce little for the mar-kets. Wages seem to have been little affected, while employment has shifted betweensectors.
10.4.5 The way aheadThe need to strengthen the rural sector in Mexico, with its high unemployment andpoverty rates, is evident. The United Nations Conference on Trade and Development(UNCTAD) (2011) argues that, along with structural change in developing countries,agricultural development can facilitate economic development, can promote highervalue addition, and can provide export-led growth opportunities while generatingpositive externalities for society, such as poverty reduction, employment, and foodsecurity. The World Bank (2008) also has emphasised the importance of agricultureas a vital development tool. In recent years agriculture has contributed little toMexico’s growth, however. Between 1996 and 2010 the contribution of agricultureto real GDP growth was 2.6 per cent, considerably lower than the contribution ofagriculture in, for instance, Brazil or Turkey. In developing countries the average con-tribution was much higher, at 5.7 per cent (table 10.8).
What can the Mexican government do to strengthen its agricultural sector soas to increase employment and food security while reducing poverty? The scope fortrade measures appears limited, as Mexico has committed itself in the WTO and invarious RTAs to abstaining from certain types of measures. There is limited scopefor increasing tariffs on imports or reducing tariffs that its exports face. The possibilityto use tariff rate quotas in NAFTA has been phased out, and subsidies have not beenaddressed in existing RTAs. A successful conclusion of the Doha Round, where sub-sidies could be limited, seems unlikely at this point.
10: A Coherent Agriculture Trade Policy for Mexico
371

It is important to increase the competitiveness of the agricultural sector. InMexico agriculture is the least productive sector, in contrast to the case in many otherLatin American countries, where agriculture is often more productive than, for ex-ample, wholesale and retail trade, construction, or even business services (McMillanand Rodrik, 2011). Poverty in rural areas is correlated with low productivity. Increasingtotal factor productivity could help strengthen the agricultural sector, although theimpact on employment is unclear. Mexico spends relatively little on research and de-velopment in agriculture. Studies, such as Alston et al. (2010) and Alston (2010),have shown that increasing research and development can increase the productivityof the agricultural sector and that this policy can have a high rate of return on in-vestment.
If agricultural tariffs were to be raised, trade agreements would have to bechanged. Such revisions have been advocated and discussed in the literature (e.g.DTB Associates and AgRisk Management, 2006). Mexico would probably have tooffer Canada and the US something in return, and any benefits to the agriculturalsector could be offset by additional costs to others sectors in Mexico. Because of thelinks between grains, oilseeds, and livestock, trade policies raising prices for feed grainscould have adverse effects on livestock producers and consumers.
An alternative policy is to provide additional domestic support, or to providethe same amount in a different fashion, possibly better targeted to the producers inneed. The WTO rules on domestic support provide considerable flexibility for coun-tries to design their own support mechanisms, and the domestic support pillar is notcovered in Mexico’s bilateral treaties.
Another possible policy is to reduce payroll taxes on agricultural labour.Agriculture is a labour-intensive sector and such sectors can contribute to creating– or keeping – jobs. A higher labour productivity, however, would allow higherwages in agriculture, a sector where salaries are typically low, especially in developingcountries. Sustainable agriculture could be an alternative to conventional agriculturefor some Mexican small-scale farmers as a means to increase their profitability andto create jobs. Sustainable agriculture relies on such techniques as crop rotation,
Shared Harvests: Agriculture, Trade and Employment
372
Table 10.8: Contribution of agriculture to growth of real GDP between 1996 and 2010
Percentage contribution of agricultureto real GDP growth
Brazil 6.6Mexico 2.6Turkey 3.9United States of America 1.4Developing economies 5.7World 3.2
Source: Authors’ calculation based on UNCTADStat.
composting, and biological pest control to increase soil productivity. Yields increase,they need less expensive inputs, and the production is more labour-intensive thanconventional agriculture, thus having a positive impact on employment and povertyreduction. In Mexico organic production is dominated by small-scale producers. Astudy by UNCTAD and the United Nations Environment Programme (UNEP) con-firmed that this can be an economically advantageous way for small farmers indeveloping countries to escape the rising prices of inputs, with corollary benefitsfor the environment, climate, and employment (UNCTAD, 2008). A lower payrolltax is only one – admittedly weak – instrument that could contribute to movingagriculture in a direction that uses fewer non-labour inputs (that often are based onfossil fuels) towards a more labour-intensive production (see discussion in Hoffmann,2011).
The possible effects of these policy options are analysed in the next section.
10.5 MODEL, DATA, AND SCENARIOS
The well-known global general equilibrium trade model, GTAP, is designed for tradepolicy analysis of this nature (Hertel, 1997, and chapter 3 of this book). Specifically,it contains the bilateral trade and tariff data that are necessary to model the impactsof trade and domestic policy changes in the context of preferential agreements. TheGTAP database, version 8, refers to the base year 2007. The model divides labourinto two types, skilled and unskilled. Input–output tables link the sectors in eacheconomy.
The base data specifies the use of each primary factor (land, labour, capital, etc.)and intermediate input into the production of each good. Changes in output affectthe use of labour according to the labour–output ratios shown in table 10.9. For ex-ample, assuming no changes in response to relative prices, a US$1 increase in theoutput of rice requires an additional 39 US cents in labour costs, whereas the pro-duction of more wheat requires less than half as much additional labour. It can beseen that crops are more labour-intensive than livestock products. This suggests thatpolicies to increase the output of crops are likely to be of greater assistance to labourthan those addressing livestock production. Cereals, including maize, and vegetablesand fruit are similarly labour-intensive, according to the GTAP database.
The GTAP database has Mexican tariffs of 16 per cent on coarse grains and 5per cent on milk products.16 The US has tariffs of 27 per cent on sugar imports fromMexico.
10: A Coherent Agriculture Trade Policy for Mexico
373
16 World Integrated Trade Solution (WITS) data show that for 2010 Mexico imported maize worthUS$1,423 million from the US at a trade-weighted tariff of 5.9 per cent. However, for the previoustwo years the tariff was zero. Positive tariffs can occur despite a free trade agreement if, for example,some imports do not meet the rules of origin requirements.

Shared Harvests: Agriculture, Trade and Employment
374
Table 10.9: Labour–output and capital–output ratios in Mexican agriculture
Product Code Labour–output ratio Capital–output ratio
Primary agriculture
Paddy rice pdr 0.39 0.24
Wheat wht 0.18 0.12
Cereal grains nec gro 0.36 0.23
Vegetables, fruit, nuts v_f 0.34 0.21
Oilseeds osd 0.09 0.07
Sugar cane, sugar beet c_b 0.35 0.22
Plant-based fibres pfb 0.13 0.09
Crops nec ocr 0.30 0.19
Cattle, sheep, goats, horses ctl 0.17 0.13
Animal products nec oap 0.27 0.18
Raw milk rmk 0.10 0.08
Wool, silk-worm cocoons wol 0.15 0.09
Forestry frs 0.47 0.08
Fishing fsh 0.03 0.46
Processed agriculture
Meat: cattle, sheep, goats, horse cmt 0.07 0.01
Poultry and other meats omt 0.23 0.34
Vegetable oils and fats vol 0.16 0.40
Dairy products mil 0.03 0.06
Processed rice pcr 0.69 0.17
Sugar sgr 0.31 0.35
Food products nec ofd 0.23 0.04
nec=not elsewhere classified.Source: GTAP version 8 database.
Four hypothetical scenarios are simulated to assist in analysing the likely impactsof policy options aimed at assisting agriculture (table 10.10).
Trade between Mexico and the US is now duty free. One possible approach tosupport Mexican producers that has been proposed and discussed would be forMexico to request a revision of NAFTA. One option, albeit somewhat speculative,would be for Mexico to raise agricultural tariffs to their MFN levels. This is analysedin the first scenario, MFN.
The second scenario, Labour, involves removing taxes on the employment ofagricultural labour. Payroll taxes for unskilled and skilled labour amount to 4 and 5per cent, respectively, of the cost of employing labour. Lowering the cost of hiring

labour would lead to a substitution of labour for capital and make the sector morecompetitive domestically and internationally.17
In the third scenario, R&D, we assume that R&D expenditure is increased, witha resulting increase in productivity of 1 per cent. Currently, Mexico spends only 2per cent (MXN1.3 billion) of its support to agriculture on R&D. A survey of meta-studies suggests that R&D expenditure has an internal rate of return of between 20and 80 per cent per annum (Alston, 2010), indicating a likely underinvestment inR&D in Mexico. Estimates of returns will depend on specific circumstances, such aslocation and crops, but are likely to be greater in developing countries, where pro-ductivity is low. To finance the increase in R&D expenditures, taxes would have tobe increased or expenditures in other areas reduced. We do not assess these effectshere and focus on sectoral rather than macro effects.
Finally, the fourth scenario, Domestic Support, involves increasing domesticsupport on all agricultural outputs to 5 per cent. Other subsidies in agriculture, suchas general services, remain intact. Subsidies on output tend to benefit non-targetgroups, that is, those farms that are larger than average. Therefore, a second DomesticSupport scenario involves switching the same amount (about US$8 billion) to aninput subsidy on all primary factors (see chapter 3 of this book).
In this application of GTAP, the standard closure is modified to reflect a semi-variable labour market for unskilled labour, implying that a change in the demandfor labour leads to some increase in both wages and employment. Skilled labour isassumed to be mobile in each country but in fixed supply, with no surplus labour.This is the standard GTAP assumption.
GTAP is used here to compare the trade and welfare effects of changes in tradeand other domestic policies once the impacts have worked through. There is no at-tempt either to phase-in the policy changes or to trace the time profile of the impacts.Thus, we ignore changes such as growth in trade that may have occurred over theimplementation period.
10: A Coherent Agriculture Trade Policy for Mexico
375
Table 10.10: Scenarios
Scenario Description
MFN Increasing Mexico’s tariffs on agricultural imports from NAFTA countries to MFN levels
Labour Removing payroll tax on agricultural labour
R&D Funding research and development (R&D) to increaseagricultural productivity
Domestic Support Increasing support on output to 5 per cent or switching support to inputs
17 Technically, changing the payroll tax requires running an uncondensed version of the GTAP model.In the standard model the payroll tax is not an exogenous variable that can be shocked.

10.6 RESULTS
10.6.1 MFN scenarioUnder this scenario tariffs in Mexico on all agricultural imports from the US are in-creased from the preferential tariffs to Mexico’s MFN rates (table 10.11).
The increase in the tariffs leads to a reduction of imports into Mexico of 0.8per cent. Total imports from the US fall by 3.6 per cent. The main imports from theUS that are reduced the most are rice, vegetable oils and fats, dairy products, andmeat products (table 10.12).
Shared Harvests: Agriculture, Trade and Employment
376
Table 10.11: Initial and new tariffs in Mexico on imports of agricultural products fromthe US, MFN scenario
Product Initial (%) MFN (%)
Paddy rice and processed rice 0 49.99Other cereals 16.1 20Sugar 0 10Oilseeds 0 5Vegetable oils and fats 0 18Vegetables and fruit 1.53 19Other crops 0 13Milk 0 0Dairy products 4.66 29Cattle and sheep 0 7Pigs and poultry 0 9Ruminant meat 0 31Non-ruminant meat 0 57.33Other processed agriculture 0 20Source: GTAP and WITS.
Table 10.12: Change in value of imports of agricultural products to Mexico from theUS, MFN scenario
Product Initial (US$ million) Under MFN (US$ million) % change
Paddy rice and processed rice 884.29 142.98 –83.8Other cereals 1 917.38 1 895.42 –1.1Sugar 141.68 110.54 –22.0Oilseeds 1 449.05 1 399.80 –3.4Vegetable oils and fats 747.18 386.44 –48.3Vegetables and fruit 824.69 681.62 –17.3Other crops 190.46 104.40 –45.2Milk 0.50 0.54 8.0Dairy products 894.83 269.09 –69.9Cattle and sheep 57.97 44.23 –23.7Pigs and poultry 648.09 597.78 –7.8Ruminant meat 1 352.44 569.65 –57.9Non-ruminant meat 939.41 57.56 –93.9Other processed agriculture 3 179.58 2 069.92 –34.9Source: GTAP and WITS.
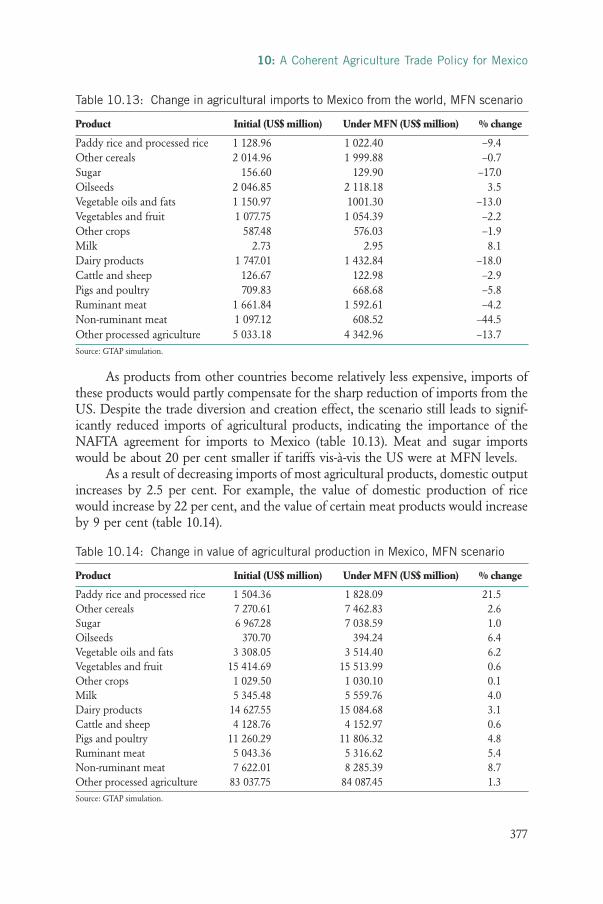
As products from other countries become relatively less expensive, imports ofthese products would partly compensate for the sharp reduction of imports from theUS. Despite the trade diversion and creation effect, the scenario still leads to signif-icantly reduced imports of agricultural products, indicating the importance of theNAFTA agreement for imports to Mexico (table 10.13). Meat and sugar importswould be about 20 per cent smaller if tariffs vis-à-vis the US were at MFN levels.
As a result of decreasing imports of most agricultural products, domestic outputincreases by 2.5 per cent. For example, the value of domestic production of ricewould increase by 22 per cent, and the value of certain meat products would increaseby 9 per cent (table 10.14).
10: A Coherent Agriculture Trade Policy for Mexico
377
Table 10.13: Change in agricultural imports to Mexico from the world, MFN scenario
Product Initial (US$ million) Under MFN (US$ million) % change
Paddy rice and processed rice 1 128.96 1 022.40 –9.4Other cereals 2 014.96 1 999.88 –0.7Sugar 156.60 129.90 –17.0Oilseeds 2 046.85 2 118.18 3.5Vegetable oils and fats 1 150.97 1001.30 –13.0Vegetables and fruit 1 077.75 1 054.39 –2.2Other crops 587.48 576.03 –1.9Milk 2.73 2.95 8.1Dairy products 1 747.01 1 432.84 –18.0Cattle and sheep 126.67 122.98 –2.9Pigs and poultry 709.83 668.68 –5.8Ruminant meat 1 661.84 1 592.61 –4.2Non-ruminant meat 1 097.12 608.52 –44.5Other processed agriculture 5 033.18 4 342.96 –13.7Source: GTAP simulation.
Table 10.14: Change in value of agricultural production in Mexico, MFN scenario
Product Initial (US$ million) Under MFN (US$ million) % change
Paddy rice and processed rice 1 504.36 1 828.09 21.5Other cereals 7 270.61 7 462.83 2.6Sugar 6 967.28 7 038.59 1.0Oilseeds 370.70 394.24 6.4Vegetable oils and fats 3 308.05 3 514.40 6.2Vegetables and fruit 15 414.69 15 513.99 0.6Other crops 1 029.50 1 030.10 0.1Milk 5 345.48 5 559.76 4.0Dairy products 14 627.55 15 084.68 3.1Cattle and sheep 4 128.76 4 152.97 0.6Pigs and poultry 11 260.29 11 806.32 4.8Ruminant meat 5 043.36 5 316.62 5.4Non-ruminant meat 7 622.01 8 285.39 8.7Other processed agriculture 83 037.75 84 087.45 1.3Source: GTAP simulation.

While the output of agricultural products increases, the output of non-agriculturalproducts and services decreases even though tariffs for those products have notchanged. Agricultural output becomes more expensive, and this raises the cost of pro-duction of downstream processed agricultural products. Since the share of agriculturalinputs in non-agricultural production is low, the main reasons for the decrease in pro-duction of non-agricultural products are general equilibrium effects. In addition,demand for primary resources such as land and labour in agriculture is increasing,which raises the costs for these factors. Total value of output increases only slightly,by 0.2 per cent.
The impact of the change in trade policy on imports, exports and output isfairly robust across labour market assumptions. This is also the case for changes inemployment of unskilled labour at the sectoral level, under two different assumptions(table 10.15). Under the first assumption wages are fixed, and all adjustment is absorbedby a change in the level of employment. This is the standard assumption in thisanalysis. Total employment of unskilled labour would decrease by 0.4 per cent. Behindthis nationwide change is an increase of employment in the agricultural sector and adecrease in the non-agricultural sector. The value of employment, i.e. wages multipliedby employment, increases by 1.4 per cent in agriculture, while in the non-agriculturalsector it decreases by 0.02 per cent. Under the second assumption the adjustment forchanges in labour demand is shared equally by employment changes and wage changes.The results are similar, however. In this case total employment of unskilled labourwould decrease by only 0.2 per cent, and wages for unskilled labour would decreaseslightly, by about 0.06 per cent. Sectoral changes in the value of unskilled labour are
Shared Harvests: Agriculture, Trade and Employment
378
Table 10.15: Percentage change in demand for unskilled labour in Mexican agriculture, MFN scenario
Assumption
Wages and employmentSector Fixed wages adjust 50/50
Paddy rice and processed rice 20.50 20.48Other cereals 2.02 1.98Sugar 1.02 1.01Oilseeds 4.99 4.97Vegetable oils and fats 3.97 3.99Vegetables and fruit 0.15 0.11Other crops –0.39 –0.41Milk 2.88 2.85Dairy products 2.26 2.29Cattle and sheep –0.48 –0.50Pigs and poultry 3.73 3.70Ruminant meat 0.52 0.54Non-ruminant meat 7.36 7.39Other processed agriculture 0.54 0.56
Source: GTAP simulation.
similar. Table 10.15 shows the changes in the value of employment for unskilledlabour in agriculture under these two assumptions.
Real land rents would increase by almost 5 per cent under both assumptions.Thus, if farmers own their land, the de facto impact on incomes would be a mixtureof increased revenue from land rents and slightly decreasing wages.
An increase of tariffs to the MFN level in Mexico vis-à-vis imports from theUS would have a strong redistribution effect. Similar but much smaller effects wouldresult from a similar exercise regarding trade with Canada. The agricultural sectorwould benefit, while the other sectors would be worse off. Total welfare in Mexico isestimated to be reduced by about US$1.0 billion.
Since the free trade agreement is a reciprocal preferential agreement, a scenarioin which Mexican tariffs are raised to MFN levels could imply higher rates on Mexicanexports to the US as well. This would result in lower agricultural exports from Mexicoto the US. Raising tariffs in the US to its MFN levels would reduce agricultural exportsby Mexico to the US by 13 per cent and reduce Mexico’s increase in output by 60per cent compared with the scenario in which only Mexican tariffs are raised. Oppositeemployment effects in agriculture would almost neutralize each other, resulting inonly a small positive effect in agriculture of 0.2 per cent but also a small negativetotal employment effect of -0.01 per cent. Output in agriculture would still increase,however, since US MFN rates are considerably lower than Mexico’s. Thus, excludingthe agricultural sector in both Mexico and the US from preferential access wouldhave larger effects on Mexico’s imports than on its exports.
The effect of raising tariffs to MFN levels is likely to be different from the effectof having left trade barriers at that level in the first place, i.e. excluding sensitivesectors from tariff reductions, as is frequently done with agricultural products, asshown in chapter 2 of this book. Years of economic integration have increased inter-dependency, e.g. in terms of inputs being imported, and have led to a structuraladjustment in which some sectors have declined and others have expanded.
A scenario with a long-term closure, in which capital is mobile and adjusts tothe new trade policy, does not lead to very different results. The assumption can havea significant impact, but in the MFN scenario the impact on the agricultural sectoris not dramatic. The decline in employment in Mexico would be slightly greater, atabout 0.6 per cent, than in the standard MFN scenario, at 0.4 per cent. Sectoralchanges in trade and output are roughly similar to the changes discussed above.
10.6.2 Labour scenarioGTAP records information about payroll taxes, which drive a wedge between whatthe employer pays and what the employee receives.18A payroll tax is often an importantsource of revenue for governments and social security systems, but it has negative
10: A Coherent Agriculture Trade Policy for Mexico
379
18 The data are not represented explicitly. They are implicit as the difference between valuations ofprimary factor flows. Payroll taxes are the difference between market value and agents’ value (whereagents are employers of factors). Negative values indicate a subsidy.

economic effects on both the demand side and the supply side. It reduces workers’income and increases the costs of employers to hire workers. In theory payroll taxesreduce the incentive to work and increase the incentive to substitute other productionfactors for labour. Reduction of payroll taxes can be an instrument to increase em-ployment. This is frequently discussed as a policy instrument. In the Labour scenariothe payroll tax on both unskilled and skilled labour is eliminated in the agriculturalsector. Table 10.16 shows the initial payroll tax in the agricultural sector in Mexicoin GTAP. The payroll tax is on average only 4 per cent for unskilled and 5 per centfor skilled labour.
Eliminating payroll taxes has only a small impact on trade and output value.Total agricultural exports increase by 1 per cent, and total agricultural imports decreaseby 0.3 per cent. Total overall and total agricultural production values remain almostthe same, although with some small variation among sectors. The total value ofoutput increases by 0.1 per cent, while the value of agricultural output decreasesslightly, by 0.03 per cent. This reflects the change in domestic prices, which fall dueto the reduction in production costs. Output in real terms increases for all agriculturalsectors and all non-agricultural sectors (table 10.17).
The impact on employment in agriculture is clearly positive. The total valueof unskilled employment in agriculture increases by 2.5 per cent. Employment inthe sectors vegetable oils and fats, dairy products, ruminant meat, non-ruminantmeat, and other processed agriculture increases by more than 5 per cent (table 10.18).These are sectors in which the payroll tax was relatively high, and thus its removalhas a significant impact.Total employment of unskilled labour in Mexico increasesby 0.5 per cent.
Shared Harvests: Agriculture, Trade and Employment
380
Table 10.16: Payroll tax on unskilled and skilled labour in Mexican agriculture
Product Unskilled Skilled(% of wage) (% of wage)
Paddy rice and processed rice 2.85 3.57Other cereals –0.88 –1.01Sugar 2.78 4.87Oilseeds 3.48 3.46Vegetable oils and fats 5.59 5.59Vegetables and fruit 2.53 2.49Other crops 2.97 2.94Milk 2.95 2.94Dairy products 5.59 5.59Cattle and sheep 2.48 2.46Pigs and poultry –0.72 –0.78Ruminant meat 5.59 5.59Non-ruminant meat 5.59 5.59Other processed agriculture 5.59 5.59
Source: GTAP.

10: A Coherent Agriculture Trade Policy for Mexico
381
Table 10.17: Percentage changes in Mexican agricultural imports from and exports tothe world and output (real) of Mexico, Labour scenario
Product Exports Imports Output
Paddy rice and processed rice 2.9 –0.1 1.4Other cereals –0.4 0.6 0.2Sugar 2.4 –1.0 0.4Oilseeds 2.8 0.3 2.0Vegetable oils and fats 1.5 –0.5 0.6Vegetables and fruit 0.6 0.1 0.6Other crops 2.7 –0.3 2.2Milk 0.0 −1.5 0.5Dairy products 3.2 –1.4 0.5Cattle and sheep 1.4 –0.5 0.5Pigs and poultry 0.0 0.1 0.2Ruminant meat 3.1 0.0 0.5Non-ruminant meat 1.7 –0.7 0.4Other processed agriculture 1.4 –0.7 0.5
Source: GTAP simulation.
Table 10.18: Changes in agricultural employment of unskilled labour in Mexico, Labourscenario
Product % change inemployment
Paddy rice and processed rice 2.15Other cereals 0.25Sugar 1.80Oilseeds 2.52Vegetable oils and fats 5.24Vegetables and fruit 0.97Other crops 2.73Milk 0.91Dairy products 5.60Cattle and sheep 0.87Pigs and poultry 0.20Ruminant meat 5.10Non-ruminant meat 5.42Other processed agriculture 5.27
Source: GTAP simulation.

For skilled employment it is assumed that changes in demand for labour leadto changes in wages instead of changes in total employment, as it is assumed forunskilled labour. Under the Labour scenario wages for skilled labour in Mexicorise modestly, by 0.23 per cent (table 10.19). Given that skilled labour is mobilebetween sectors and agriculture employs only a small fraction of Mexico’s skilledlabour (skilled labour accounts for only 8.4 per cent of the wage bill), this smallincrease is remarkable.
Eliminating the payroll tax in agriculture is an opportunity to increase employ-ment in the sector. Although the payroll tax is on average not very high, removingit leads to an estimated increase in agricultural employment of about 2.5 per cent.Government revenue may fall as a consequence of the tax cut. At the same time,however, a tax cut can stimulate the economy and lead to more activity, which inturn leads to higher revenues from other taxes. The general equilibrium model takesthe effect on government revenue into account. Removing the payroll tax in agricultureindeed does lead to a very small increase in government revenue and spending andto a small increase in the GDP. The total welfare effect in Mexico is positive but notlarge, an increase of $940 million.
10.6.3 R&D scenario The approximately 13 per cent of Mexico’s total labour force that works in agricultureis producing 4 per cent of the national output (World Bank, 2011). Thus, as in mostdeveloping countries, labour productivity in Mexican agriculture is low comparedwith other sectors in the economy. While a partial measure of productivity, such asthe productivity of labour, measures output per unit of a particular input, total factorproductivity (TFP) measures output in relation to an index of inputs, usually thevalue-weighted sum of all production components. TFP can be taken as a measureof technological progress, which can be attributed to changes in agricultural researchand development, human capital, infrastructure, extension services, and governmentpolicies. High productivity implies high competitiveness for given factor prices. Inan open economy, where domestic goods compete with goods from abroad, produc-tivity is very important.
Shared Harvests: Agriculture, Trade and Employment
382
Table 10.19: Changes in factor prices, Mexico, Labour scenario
Product % change infactor price
Rent for land 1.55Wage of unskilled labour 0Wage of skilled labour 0.23Capital 0.12Natural resources 0.12
Source: GTAP simulation.
Productivity in agriculture is low because labour is relatively unskilled and theamount of capital used with labour is small. Productivity could be enhanced by im-proving the quality of labour through more education and skills-building for farmersand by investments in physical capital such as infrastructure. Other factors also affectproductivity. Public investments in institutions, extension services, training, and tech-nology research are important levers of productivity in agriculture (Zepeda, 2001).Investment in developing and extending agricultural technology yields high rates ofreturn.
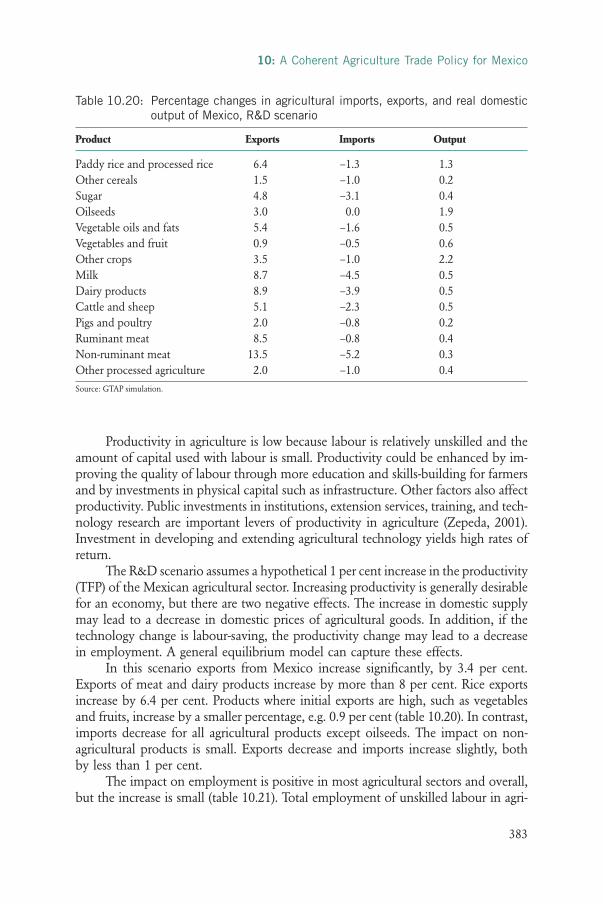
The R&D scenario assumes a hypothetical 1 per cent increase in the productivity(TFP) of the Mexican agricultural sector. Increasing productivity is generally desirablefor an economy, but there are two negative effects. The increase in domestic supplymay lead to a decrease in domestic prices of agricultural goods. In addition, if thetechnology change is labour-saving, the productivity change may lead to a decreasein employment. A general equilibrium model can capture these effects.
In this scenario exports from Mexico increase significantly, by 3.4 per cent.Exports of meat and dairy products increase by more than 8 per cent. Rice exportsincrease by 6.4 per cent. Products where initial exports are high, such as vegetablesand fruits, increase by a smaller percentage, e.g. 0.9 per cent (table 10.20). In contrast,imports decrease for all agricultural products except oilseeds. The impact on non-agricultural products is small. Exports decrease and imports increase slightly, bothby less than 1 per cent.
The impact on employment is positive in most agricultural sectors and overall,but the increase is small (table 10.21). Total employment of unskilled labour in agri-
10: A Coherent Agriculture Trade Policy for Mexico
383
Table 10.20: Percentage changes in agricultural imports, exports, and real domesticoutput of Mexico, R&D scenario
Product Exports Imports Output
Paddy rice and processed rice 6.4 –1.3 1.3Other cereals 1.5 –1.0 0.2Sugar 4.8 –3.1 0.4Oilseeds 3.0 0.0 1.9Vegetable oils and fats 5.4 –1.6 0.5Vegetables and fruit 0.9 –0.5 0.6Other crops 3.5 –1.0 2.2Milk 8.7 –4.5 0.5Dairy products 8.9 –3.9 0.5Cattle and sheep 5.1 –2.3 0.5Pigs and poultry 2.0 –0.8 0.2Ruminant meat 8.5 –0.8 0.4Non-ruminant meat 13.5 –5.2 0.3Other processed agriculture 2.0 –1.0 0.4
Source: GTAP simulation.

culture increases by 1 per cent. The total employment effect for Mexico also is positivebut very small, with an increase in the use of unskilled labour of 0.4 per cent.
The reason for the more significant change in exports and imports and yet smallpositive employment effects is that an increase of productivity leads to reduced factordemand for a given output. Thus, if real output increases only slightly more thanproductivity, the effect on employment is small. As Table 10.20 shows, the outputeffects are mostly below 1 per cent.
R&D programs that increase productivity yield beneficial effects, but the benefitsdo not accrue solely to the workers. Much of the benefit may go to owners of capitaland land and to domestic and foreign consumers. In fact, if the labour mobility be-tween sectors is in reality not perfect, as assumed here, but instead is sluggish, workersin some sectors may be worse off as a result. Also, wages can come under pressure.A program of increasing productivity by 1 per cent in the agricultural sector generallyincreases output in each agricultural sector and real GDP as a result. However, increasedoutput drives down the output price, and the fall in prices more than offsets the in-crease in output. This implies that the value of agricultural production falls, and,with it, employment in the agricultural sector. If real wages are fixed, some agriculturalworkers will seek jobs in the industrial and service sectors.
Despite these caveats, the productivity increase would have many positive im-plications for many of Mexico’s stated objectives. It leads to greater self-sufficiencyratios in agriculture and higher employment in the some agricultural sectors as wellas higher total employment in Mexico; it produces significant welfare gains of some$4.3 billion. Costs for the R&D programmes, however, would need to be deductedfrom those benefits.
Shared Harvests: Agriculture, Trade and Employment
384
Table 10.21: Changes in Mexican agricultural employment, R&D scenario
Product % change inemployment
Paddy rice and processed rice 1.1Other cereals –0.8Sugar –0.6Oilseeds 0.7Vegetable oils and fats 0.6Vegetables and fruit –0.2Other crops 1.6Milk –0.7Dairy products 0.8Cattle and sheep 0.2Pigs and poultry 0.1Ruminant meat 0.7Non-ruminant meat 1.8Other processed agriculture 0.3
Source: GTAP simulation.

10.6.4 Domestic support scenarioMexico’s domestic support for agriculture is well below the OECD average. Accordingto its WTO commitments, it can provide product-specific trade-distorting supportunder de minimis of up to 10 per cent. Official data notified by Mexico to the WTOon domestic support are not available for recent years.19 In 2004, the latest availablenotification, Mexico reported a total of 1.4 billion, in constant 1991 pesos, of product-specific support. Most of this, 954.5 million pesos, falls under de minimis support,i.e. its value is relatively low compared with the value of production.
The GTAP data, based on the year 2007, show subsidies approaching 5 per centonly for oilseeds output (table 10.22). Subsidies for rice are 1.7 per cent. For vegetablesand fruits and other crops, subsidies are around 1 per cent, and for other agriculturalproducts output subsidies are zero or slightly negative.
The scenario Domestic Support assesses the effect of raising domestic supporton agricultural output to the level of 5 per cent and in a separate scenario switchingthe same amount to an input subsidy. Data in GTAP do not necessarily match exactlywith the OECD estimates or WTO notifications. One reason is that definitions ofproduct-specific support vary. Also, GTAP taxes do not fully correspond to the variouscomplex and country-specific support programmes. Furthermore, the producer sup-port estimate aggregates output and input subsidies, while in GTAP these are separated.Table 10.22 shows the initial and new output subsidies on agricultural products inMexico.
10: A Coherent Agriculture Trade Policy for Mexico
385
19 Domestic support under the WTO agreement on agriculture differs from the OECD definition.
Table 10.22: Support to agricultural outputs, Mexico, Domestic Support scenario
Initial NewProduct (%) (%)
Paddy rice and processed rice 1.7 5.0Other cereals 0.1 5.0Sugar –0.1 5.0Oilseeds 4.8 5.0Vegetable oils and fats –0.1 5.0Vegetables and fruit 0.8 5.0Other crops 0.8 5.0Milk 0.0 5.0Dairy products –0.1 5.0Cattle and sheep 0.0 5.0Pigs and poultry 0.0 5.0Ruminant meat –0.1 5.0Non-ruminant meat –0.1 5.0Other processed agriculture –0.2 5.0
Source: GTAP.

Increasing domestic support to 5 per cent of the value of output in agricultureleads to increasing exports and output for all agricultural products except oilseeds,where the initial support value was already 4.8 per cent (table 10.23). Imports increasefor some products and decrease for others. Some imports increase due to their linksin the value chain. For example, if output of meat products increases, demand forimported feed increases.
The impact of the Domestic Support scenario on employment in the agriculturalsector is positive. Employment increases significantly in all agricultural sectors, andtotal unskilled employment in Mexico increases by 1.8 per cent. If the same amountof domestic support spent on output is spent instead on input subsidies, the totalemployment effects are very similar. Employment of unskilled labour in Mexicowould increase by 1.7 per cent. The effects in various agricultural sectors would bevery different from the sectoral effects of the output subsidy, however (table 10.24).
Subsidizing output or inputs supports the corresponding sector, but it is a costlypolicy for the rest of the economy. In trade theory it has been shown that undercertain circumstances subsidies can be welfare-improving, e.g. when the subsidy hasan impact on a country’s terms of trade. This is unlikely for most agricultural productsin Mexico. In general, output subsidies are distorting and move resources into sectorswhere they are not used most efficiently. External effects, however, may economicallyjustify subsidies. For example, when rural-to-urban migration incurs costs to societythat are not reflected in prices and when subsidies can discourage such migration,certain subsidies may be economically justifiable. However, although unskilled labouremployment increases, and this is likely to reduce poverty, the policy may be poorlytargeted, and large industrial farms might benefit disproportionately.
Shared Harvests: Agriculture, Trade and Employment
386
Table 10.23: Percentage changes in agricultural imports, exports, and real domesticoutput of Mexico, Domestic Support scenario
Product Exports Imports Output
Paddy rice and processed rice 7.5 2.9 5.8Other cereals 1.5 2.5 4.2Sugar 21.7 –8.4 3.4Oilseeds –10.5 8.1 –0.1Vegetable oils and fats 28.0 –8.6 7.4Vegetables and fruit 0.4 4.9 1.3Other crops 0.9 4.3 2.6Milk 16.7 –8.8 5.6Dairy products 47.9 –17.4 5.8Cattle and sheep 13.7 –4.5 5.3Pigs and poultry 6.2 –2.9 5.4Ruminant meat 45.3 0.2 5.8Non-ruminant meat 71.6 –21.4 10.1Other processed agriculture 11.8 2.9 4.3
Source: GTAP simulation.

Despite the positive effects of subsidizing the agricultural sector on output and,thus, on self-sufficiency, employment, and trade, input and output subsidies are dis-torting and should be provided only in the case of substantial external effects or ifthe positive effects are politically deemed more important than the costs for the restof the economy.
10.7 CONCLUSION
Agriculture remains a very important sector for Mexico. Mexico’s agricultural tradereform has been associated with increasing agricultural imports and decreasing em-ployment in agriculture, and poverty rates remain high in rural areas. Some haveaccused NAFTA of harming Mexican farmers and jeopardizing Mexico’s food self-sufficiency. Others acknowledge the effects of expanded agricultural trade but arguethat static and dynamic gains far exceed the related adjustment costs.
Imports have increased from all major trading partners and particularly fromNAFTA members, who supply more than 80 per cent of Mexico’s agricultural imports.In recent decades more staple crops and meat products have been imported andmore fruits and vegetables and certain processed agricultural products have been ex-ported. Most analysts acknowledge an adverse effect of US subsidies on Mexicanfarmers, but how much the subsidies depress prices is controversial and in any casevaries from year to year.
10: A Coherent Agriculture Trade Policy for Mexico
387
Table 10.24: Percentage change in employment of unskilled labour, with fixed wages,Mexico, Domestic Support scenario
Product Output subsidy Input subsidy scenario scenario
Paddy rice and processed rice 7.7 12.2Other cereals 5.6 5.7Sugar 5.5 5.7Oilseeds 1.0 10.9Vegetable oils and fats 8.7 4.8Vegetables and fruit 2.5 5.5Other crops 3.9 13.5Milk 7.2 5.6Dairy products 7.1 5.1Cattle and sheep 6.8 5.6Pigs and poultry 6.9 5.0Ruminant meat 7.1 4.5Non-ruminant meat 11.5 7.0Other processed agriculture 5.6 5.0
Source: GTAP.

It has been shown that the impact of globalization and more specifically NAFTAdepends on farm size, proximity to the US border, types of agricultural goods pro-duced, income levels, and share of agricultural income in total income. It appearsthat a majority of small farms were not much affected, while middle-income cornfarmers were adversely affected. Greater market opportunities for vegetables have in-creased employment in the cultivation of vegetables, whereas the drop in the realprice of corn has reduced employment in the corn sector. It is difficult to assess theoverall effect on employment in agriculture, and it has been argued that agriculturecannot be looked at separately in the context of NAFTA.
Despite these mixed effects, the need to strengthen the rural sector in Mexicois evident, given its high unemployment and poverty rates. UNCTAD (2011) arguesthat, along with important structural change in developing countries, agricultural de-velopment can facilitate economic development, can promote higher value additionand provide export-led growth opportunities while generating positive externalitiesfor society, such as poverty reduction and increases in employment and food security.
What policy measures are appropriate to strengthen the agricultural sector de-pends on the specific objectives. Policies to reduce poverty and rural-to-urbanmigration differ from those that increase export revenue or maximize agriculturaloutput. Mexico’s trade policy options are limited due its commitments in trade agree-ments. A stated objective is to use the existing policy space with a view to enhancingMexico’s benefits from its agricultural sector, including increasing jobs in the sector,reducing dependency on imports, and promoting exports.
We have analysed four different policy scenarios for strengthening the agriculturalsector that have been publicly discussed. The well-known CGE model GTAP hasbeen used to assess the potential impact on the agricultural sector as well as on theeconomy as a whole.
1. Revising RTAs to enable Mexico to impose tariffs on agriculture has beendiscussed in Mexico. Imposing MFN tariffs on agricultural imports from itslargest trading partner, the US, would benefit the agricultural sector if notariffs were imposed on Mexico’s exports. Imports would decrease and outputwould increase. Employment would increase in the agricultural sector, but itwould decrease in the non-agricultural sector. If tariffs were applied in theUS on Mexico’s agricultural exports, exports would decrease and oppositeemployment effects in agriculture would almost neutralize each other andleave only a small positive effect on agricultural employment of 0.2 per centalong with a small negative effect on total employment of 0.01 per cent.
2. Removing the payroll tax in agriculture would have only a small effect ontrade and output, but it is an opportunity to increase employment in thesector. Removing the payroll tax leads to a small increase of the GDP. Thetotal welfare effect in Mexico is estimated at US$940 million – small but positive.
Shared Harvests: Agriculture, Trade and Employment
388

3. Mexico’s agricultural sector has low productivity, but the country spends rel-atively little on research and development in agriculture. Supporting activitiesthat would lead to a higher productivity would increase output and exports.Imports would decrease, and thus the self-sufficiency rate would increase. Theimpact on employment would be positive but very small.
4. Subsidizing output in agriculture or providing input subsidieswould increaseproduction, exports, and employment in the agricultural sector but in thelarger economy could shift resources to less efficient activities. Such subsidieswould involve costs for the rest of the economy.
Several limitations ought to be kept in mind when interpreting these results. For in-stance, the R&D scenario does not take into account the cost of such a programme.The analysis addresses the distribution effects and does not focus on national welfareeffects.
The analysis also assumes that the scenarios would be implemented as specified.The MFN scenario is purely hypothetical and is unlikely to be politically feasible.However, since it has been proposed by leading politicians, it is important to analyseit.
A further limitation is the data. No specific data are available on para-tariffsand non-tariff measures. As tariffs are changed, these other impediments to trade arelikely to play a role. Finally, the model used here is static, with no account taken ofdynamic gains relating to growth in technology, competition, and productivity. Norhas account been taken of the one-off costs of structural adjustment, such as temporaryunemployment.
Nevertheless, the results have important implications for policy-makers. Policiesthat increase distortions may strengthen the agricultural sector in terms of higheroutput, exports, and employment, but they are likely to have adverse effects on therest of the economy. In contrast, removing payroll taxes and adopting policies thatincrease agricultural productivity have positive effects for both the agricultural sectorand the economy as a whole.
10: A Coherent Agriculture Trade Policy for Mexico
389

REFERENCES
Agriculture and Agri-Food Canada. [2010]. Mexico agriculture policy review. Available athttp://www4.agr.gc.ca/AAFC-AAC/display-afficher.do?id=1204258695800&lang=eng#alt.
Alston, J. 2010. The benefits from agricultural research and development, innovation, and productivitygrowth, OECD Food, Agriculture and Fisheries Working Papers, No. 31 (Paris, Organisationfor Economic Co-Operation and Development Publishing).
Alston, J.M.; Babcock, B.A.; Pardey, P.G. (eds.). 2010. The shifting patterns of agricultural productionand productivity worldwide (Ames, Iowa, The Midwest Agribusiness Trade Research andInformation Center, Iowa State University).
Babcock, B. 2011. The impact of US biofuel policies on agricultural price levels and volatility, ICTSDIssue Paper, No. 35 (Geneva, International Centre for Trade and Sustainable Development).
Barron, M.A.; Rello, F. 2000. “The impact of the tomato agroindustry on the rural poor inMexico”, in Agricultural Economics, Vol. 23, No. 3, pp. 289−297, Sep.
Dimaranan, B.; Hertel, T.; Keeney, R. 2003. OECD domestic support and developing countries,GTAPWorking Paper, No. 19 (Lafayette, IN, Global Trade Analysis Project, Purdue University).
DTB Associates and AgRisk Management. 2006.Implications for the U.S. and Mexico of Mexicowithdrawing certain agricultural products from NAFTA.
Shared Harvests: Agriculture, Trade and Employment
390
ANNEX
Table A10.1: Product definition
Name SITC Rev.3
Barley 043Beans 05423Beef 011, 01251, 01252, 01681, 0176Coffee 071Eggs 025Maize 044, 04721, 05677, 08124, 4216, 59212Milk 0221, 0222, 02241Pork 0122, 0161Poultry 0123Rice 042Shrimp 03611Sorghum 0453Sugar cane 06111, 06151Sugar 061Tuna 03414, 03423, 03713Wheat 041, 046, 08126, 59217

Fanjul, G.; Fraser, A. 2003. “Dumping without borders: How US agricultural policies are destroyingthe livelihoods of Mexican corn farmers, Briefing Paper, No. 50 (Oxford, OXFAM International).
Hertel, T.W. (ed.). 1997. Global trade analysis: Modeling and applications (Cambridge, CambridgeUniversity Press).
Hoffmann, U. 2011. Some reflections on climate change, green growth illusions and development space,UNCTAD Discussion Papers, No. 205 (Geneva, United Nations Conference on Trade andDevelopment).
Hufbauer, G.; Schott, J. 2005. NAFTA revisited: Achievements and challenges (Washington, DC,Institute for International Economics).
de Janvry, A.; E. Sadoulet; de Anda, G. 1995. “NAFTA and Mexico’s maize producers,” inWorld Development, Vol. 23, No. 8, pp. 1349−1362.
Khor, M. 2007. Bilateral free trade agreements: An outline of elements, nature and development implications,paper presented at the UNCTAD Ad Hoc Expert Group Meeting on the DevelopmentInterface between the Multilateral Trading System and Regional Trade Agreements, Geneva,15–16 March.
Kose, M.A.; Meredith, G.M.; Towe, C.M. 2004. How has NAFTA affected the Mexican economy?Review and evidence, IMF Working Paper, WP/04/59 (Washington, DC, InternationalMonetary Fund).
Levy, S.; van Wijnbergen, S. 1995. «Transition problems in economic reform: Agriculture inthe North American Free Trade Agreement,» in American Economic Review, Vol. 85, No. 4,pp. 738−754, Sept.
McKinley, J.C., Jr. 2008. «Mexican farmers protest end of corn-import taxes”, in The New YorkTimes, p.10, 1 Feb.
McMillan, M.; Nava, A.; Zwane, A. 2006. “My policies or yours: Have OECD agriculturalpolicies affected incomes in developing countries?” in A. Harrison (ed.): Globalization andpoverty (Chicago, IL, University of Chicago Press for the National Bureau of EconomicResearch).
McMillan, M.; Rodrik, D. 2011. “Globalization, structural change and productivity growth”,in M. Baccetta and M. Jansen (eds.): Making globalization socially sustainable (Geneva, WorldTrade Organization and International Labour Office).
North American Free Trade Agreement (NAFTA). 1993. Chapter 7: Agriculture and sanitary andphytosanitary measures (Ottowa).
Nicita, A. 2004. Who benefited from trade liberalization in Mexico? Measuring the effects on householdwelfare, World Bank Policy Research Working Paper, No. 3265 (Washington, DC, WorldBank).
Nicita, A. 2009. “The price effect of tariff liberalization: Measuring the impact on householdwelfare”, in Journal of Development Economics, Vol. 89, pp. 19–27.
Organisation for Economic Co-operation and Development (OECD). 2007. Rural policy reviews:Mexico.
—. 2010.Producer and consumer support estimates: Producer support estimate composition 2010 (Paris,OECD Agriculture Statistics Database).
Polaski, S. 2004. Mexican employment, productivity and income a decade after NAFTA, brief submittedto the Canadian Standing Senate Committee on Foreign Affairs, Ottawa, 25 Feb.
10: A Coherent Agriculture Trade Policy for Mexico
391
Polaski, S. 2006. The employment consequences of NAFTA. Testimony submitted to the SenateSubcommittee on International Trade of the Committee on Finance (Washington, DC,Carnegie Endowment for International Peace).
Prina, S. 2011. Who benefited more from NAFTA: Small or large farmers? Evidence from Mexico,Working Paper (Cleveland, OH, Department of Economics, Case Western ReserveUniversity).
Prina, S. 2012. “Effects of border price changes on agricultural wages and employment”, inJournal of International Development.Available athttp://onlinelibrary.wiley.com/ doi/10.1002/ -jid.2814/abstract.
Scott, J. 2010. The incidence of agricultural subsidies in Mexico, Mexican Rural Development ResearchReport, No. 2 (Washington, DC, Woodrow Wilson International Center for Scholars,Mexico Institute).
Stiglitz, J.; Carlton, A. 2005. Fair trade for all: How trade can promote development (Oxford, OxfordUniversity Press).
United Nations Conference on Trade and Development (UNCTAD). 2008. “Addressing theglobal food crisis: Key trade, investment and commodity policies in ensuring sustainablefood security and alleviating poverty”, United Nations (New York and Geneva).
—. 2011. Evolution of the international trading system and of international trade from a development per-spective, Note by the UNCTAD Secretariat,TD/B/58/3 (Geneva).
—. 2013. “Mexico’s agriculture development: perspectives and outlook”, UN CTAD /DITC/TNDC/ 2012/2, United Nations (New York and Geneva).
Vollrath, T. 2004. “Gauging NAFTA’s success and confronting future challenges”, in AgExporter,Vol. 16, No. 1, pp. 7−8.
Wise, T. 2009. Agricultural dumping under NAFTA: Estimating the costs of U.S. agricultural policiesto Mexican producers, Global Development and Environment Institute Working Paper, No.09–08 (Boston, MA, Tufts University).
Wise, T. 2012. The cost to Mexico of U.S. corn ethanol expansion, Global Development andEnvironment Institute Working Paper, No. 12–01 (Boston, MA, Tufts University).
World Bank. 2004. Mexican corn: The effects of NAFTA, Trade Note, No.18 (Washington, DC).
—. 2008. World Development Report: Agriculture for development (Washington, DC).
—. 2011. World Development Indicators 2011 (Washington, DC).
World Bank and United Nations Convention on Trade and Development. World IntegratedTrade Solution. Available at http://www.wits.worldbank.org.
Zepeda, L. (ed.). 2001. Agricultural investment, production capacity and productivity (Rome, Foodand Agriculture Organization).
Shared Harvests: Agriculture, Trade and Employment
392