10-0039sa development of a nutrient budget approach …. final report 2008- 13 cdfa fertilizer...
TRANSCRIPT

A. Final Report 2008-13 CDFA Fertilizer Research and Education Program
10-0039SA
Development of a Nutrient Budget Approach to Fertilizer Management in Almond Project Leader: Patrick Brown, Professor, Department of Plant Sciences, MS#2, One Shields Ave., University of California, Davis, CA 95616-8683, 530 752-0929, [email protected] Cooperators: Saiful Muhammad, PhD, Department of Plant Sciences, UC Davis. MS#2, One Shields
Avenue, Davis CA 530-752-8499, 530 752 8502 (fax), [email protected]
Sebastian Saa, PhD, Department of Plant Sciences, UC Davis. MS#2, One Shields
Avenue, Davis CA 530-752-8499, 530 752 8502 (fax), [email protected]
Bruce Lampinen, Professor, Department of Plant Sciences, One Shields Ave.,
University of California, Davis, CA 95616-8683, 530-752-2588,
Richard C. Rosecrance, College of Agriculture, California State University, Chico, CA
95926-0310, [email protected] (530) 898-5699
Richard Plant, Professor, Department of Plant Sciences, One Shields Ave., University of
California, Davis, CA 95616-8683, 530 752-1705, [email protected]
Blake Sanden, Irrigation & Agronomy Farm Advisor
University of California Cooperative Extension
1031 S. Mt Vernon Ave. Bakersfield, CA 93307

John Edstrom, University of California Cooperative Extension, 100 Sunrise Blvd Colusa,
Ca. 95932, Office (530) 458-0570, [email protected]
Roger Duncan, University of California Cooperative Extension, 3800 Cornucopia Way
University of California Cooperative Extension, Suite A. Corner of Service and Crows
Landing, Suite A, Modesto, CA 95358, (209) 525-6800, [email protected]
Bob Beede, Farm Advisor, UCCE Kings County, 680 N. Campus Dr. Suite A
Hanford, CA 93230, [email protected], (559) 582-3211 X 2730
Franz Niederholzer, Orchard Systems Farm Advisor -- Sutter & Yuba Counties
University of California Cooperative Extension, 142A Garden Hwy, Yuba City, CA
95991, (530) 822-7515, [email protected]
B. Objectives
1. Develop a phenology and yield based nutrient model for Almond. 2. Develop fertilizer response curves to relate nutrient demand with fertilizer rate
and nutrient use efficiency. 3. Determine nutrient use efficiency of various commercially important N and K
fertilizer sources. 4. Determine the contribution of soil and perennial plant parts to provide nutrients
for tree growth. 5. Validate current CVs and determine if nutrient ratio analysis provides useful
information to optimize fertility management. 6. Develop and extend an integrated nutrient BMP for Almond.
C. Abstract Evidence from the 2007 CDFA-FREP nutrition focus group and survey of industry leading consultants, growers and Farm Advisors suggests that our current approach to managing nutrition in Almond is inadequate to meet production goals. Ninety % of growers and consultants felt that UC Critical Values (CVs), especially for N and K, were not appropriate for current yield levels and that the link between the results of leaf and soil sampling and specific fertilizer recommendations is poor. In general CVs are inadequate tools for nutrient management in high value crops as CVs can only indicate a deficiency. Further this approach does not provide information on how to respond to

deficiency. The protocol of CVs are based on leaf sampling in July and hence limits the in season nutrient adjustment for current crops. In other crops nutrient managements are based on model of plant growth and nutrient demand curves that guide the quantity and timing of fertilizer application. However nutrient demand curves have not been developed for almond. To develop a phenology and yield based nutrient demand curves that guide the timing and rate of fertilizer application, a large experiment was initiated in 2008 in Belridge, Kern county under fan jet and drip irrigations with four rates of nitrogen (N) 125, 200, 275 and 350lb/ac applied with two N fertilizer sources-UAN 32 and CAN 17. Three rate of potassium (K) fertilizer- 100, 200 and 300lb/ac applied with 60% Potassium Sulfate (SOP) and 40% Potassium ThioSulphate (KTS) and three sources of K – SOP+KTS, SOP and Potassium Chloride (KCl) were applied at 200lb/ac. UAN 32, CAN 17, KTS and KCl were applied in four fertigation cycles in February, April, June and postharvest as 20, 30, 30 and 20% of the total respectively while SOP was applied as granule in winter. 768 trees were monitored individually for yield and yield related parameters and in season leaf and fruit nutrient and fruit biomass. Whole tree nutrients were estimated by excavating trees from the four N rate treatments at the beginning and end of two seasons while nutrient remobilization and storage were determined by multiple in-season core sampling of tree perennial organs-roots, trunk, canopy and small branches. N supply had significant yield effect from 2009 and treatment effects increased in the later years of the experiment. There was no significant effects of K rate on kernel yield while K sources had significant effect on kernel yield in 2010 under fan jet irrigation. N and K export in fruits by 1000lb kernel yield ranged from 53lb to 74lb and 51lb to 83lb for N and K rate treatments respectively. In adequately fertilized trees and average N removal of 68 lb N and 80 lb K per 1000 lb kernel yield was observed. This value includes all of the N and K required to grow all fruit parts. Over 85% of the total N and 70-75% of the total K was accumulated in fruit by mid-June. Fruits were the greatest sink for N and other nutrients and 90% of total tree N was partitioned to fruits. Although leaves were the second greatest sink for N (about 6% of total tree N) N from leaves were either remobilized to perennial organs at senescence or re-entered in soil as a result of leaf fall. The demand for N for new perennial wood growth varied from 20-30 lbs per acre per year D. Introduction

The knowledge of growth and development to derive nutrient demand curves that guide the timing and quantity of nutrient applications is widely used in high value agricultural enterprises such as animal production, aquaculture, greenhouse vegetable and flower production, and increasingly in agronomic crops. In these approaches, growth models, estimates of daily nutrient intakes, knowledge of nutrient bioavailability and the interactions between nutrients and other inputs are integrated to ensure that nutrient supply does not limit growth and that profitability is maximized by avoiding excess applications.
Almond production in California is well suited to the adoption of a nutrient budget driven approach to fertilization. Crop values are at an all time high and there is an increasing interest in ‘sustainable’ production techniques to address customer desires and product image. Management techniques are increasingly amenable to ‘on-demand’ fertilization through increased adoption of fertigation systems and the use of fluid fertilizer formulations. The mature almond tree is well suited to a budget approach to fertility management as it is relatively determinant in its growth patterns, almonds show limited vegetative re-growth after fruits reach full size, and the majority of whole tree macronutrient demand is partitioned to nuts. Once the spur leaves are fully mature, the N and K requirements for vegetation are largely satisfied. Fruits, on the other hand, continue to accumulate N and K until harvest. Thus, this project was conducted to develop nutrient demand curves and whole tree budgets for macro and micronutrients in a commercial almond (Prunus dulcis) orchard managed under a variety of N and K fertilization regimes. Experiments and measurements were replicated in drip and fan jet irrigated orchards over a 5 year period, 2008 through 2012. Whole tree nutrient dynamics in annual tissues were derived from multiple in-season sampling of leaves and nuts for nutrients and biomass in all years with the most intensive sampling being conducted in 2009, 2010 and 2011. Trees in this orchard were 9 years old at the commencement of the experiment and 13 years old at completion, with an orchard level light interception of 78% in year 10, increasing to over 88% in year 13. In comparison with industry standards and midday PAR interception, yield in these orchards was very good from 2008 through 2011 while in 2012, for reasons that have not been determined, yields were very low. The majority of the data presented for nutrient dynamics in annual organs was derived from years 2009, 2010 and 2011 in which treatment differences were clearly evident, yields were representative and sampling was most intensive. Data of nutrient dynamics for perennial tissues was solely derived from the 2012 season when tree excavations and tree coring were also performed.

Objectives 1. Develop a phenology and yield based nutrient model for Almond. 2. Develop fertilizer response curves to relate nutrient demand with fertilizer rate
and nutrient use efficiency. 3. Determine nutrient use efficiency of various commercially important N and K
fertilizer sources. 4. Determine the contribution of soil and perennial plant parts to provide nutrients
for tree growth. 5. Validate current CVs and determine if nutrient ratio analysis provides useful
information to optimize fertility management. 6. Develop and extend an integrated nutrient BMP for Almond.
E. Project Description Task 1 (Objective 1): Develop a phenology and yield based nutrient model for Almond.
Initiated Jan 2008, final harvest 2012: Completed. Analysis Completed
This task was conducted in collaboration with sites utilized in project 07-671. Field activities and data collection and analysis completed. A web model was developed to base fertilizer rate and timing with phenology and yield of the crop. The model is available in: Recommendations to integrate nutrient budget and leaf analysis were developed and available in: http://www.almondboard.com/Growers/Documents/Almond%20Early-Season%20Sampling%20and%20In-Season%20Nitrogen%20Application%20Maximizes%20Productivity,%20Minimizes%20Loss.pdf. Model for calculating N demand and interpreting leaf analysis. https://www.sustainablealmondgrowing.org Task 2 (Objectives 2/3): Develop fertilizer response curves and nutrient use efficiency to relate nutrient demand and fertilizer source with fertilizer rate.
Initiate January 2008, final harvest and sampling Dec 2012: Completed Analysis Completed
A large experimental fertilizer response trial was set up in 2008 in an eight year old orchard, planted 50% to Nonpareil and 50% to Monterrey almonds under Fan Jet and Drip irrigation systems. Fifteen individual trees and their immediate 30 neighbors were

considered as a single uniformly treated unit with all measurements taken on the central six Non-Pareil trees individually. A total of 128 experimental units of 15 trees were treated and from this 768 individual trees were monitored for yield, nut growth and development and full nutrient status. A fertigation system was installed and a digital flow meter was employed to provide well controlled doses of fertilizer during four fertigation events. Basal Sulphate of Potash (SOP) application was made in early January and fertigation was done in February, April, June and October. The total experimental area is 100 acres. The twelve treatments include 4 rates of N, 3 rates of K, 4 contrasting rates of CAN17, one Potassium Chloride (KCl) and one SOP treatments. Descriptions of the treatments are given in table 1. Effectiveness of each treatment was determined by changes in leaf tissue analysis, yield, and soil residual N and K over a 5 year period. Table 1. Detail of fertilization treatments.
Treatment N source N amount (lbs/ac)
K source K amount (lbs/ac)
A UAN32 125 60% SOP / 40% KTS 200 B UAN32 200 60% SOP / 40% KTS 200 C UAN32 275 60% SOP / 40% KTS 200 D UAN32 350 60% SOP / 40% KTS 200 E CAN17 125 60% SOP / 40% KTS 200 F CAN17 200 60% SOP / 40% KTS 200 G CAN17 275 60% SOP / 40% KTS 200 H CAN17 350 60% SOP / 40% KTS 200 I UAN32 275 60% SOP / 40% KTS 100 J UAN32 275 60% SOP / 40% KTS 300 K UAN32 275 100% SOP 200 L UAN32 275 100% KCl 200
Leaf samples were collected in April, May, June and July while nut samples were collected in April, May, June, July and August. Tissue determination for the major elements (N, P, K, S, Ca, Mg, B, Zn, Fe, Mn and Cu) in all the collected nut samples and leaf samples was processed by the DANR analytical laboratory at UC Davis. Tree yield and quality attributes were collected from all individual trees. All nutrient and biomass data was cross-referenced to individual tree yield, phenology, environment and

other variables to develop a phenology and yield based nutrient model for Almond. Nutrient demand curves were generated and included in this report. (Figs 13-24) Task 3 (Objective 4). Determine the contribution of soil and perennial plant parts to provide nutrients for tree growth.
Initiate January 2012 and complete in January 2014 Analysis Complete December 2014
Our results from the past four years showed high nitrogen use efficiency (NUE) for the
low nitrogen rate. The efficiency declined through the years; however it is over 100% in
terms of nitrogen applied and nitrogen exported out from the orchard in the fruit. We
introduced a zero N treatment in 2011 by splitting N 125lb/ac into halves. However the
tree in the zero N had some nutrients coming from the previous year. We determined
the source of the high NUE and then determined the contribution of the soil N and the
stored N in the perennial parts of the tree. We analyzed the amount of stored N, P and
K in the trees by taking samples from perennial parts as follow:
One tree from each N replicated treatment (0, 125, 200, 275 and 350lb/ac) were used
for this study with the total 20 trees. Trees from the five N treatments (0, 125, 200, 275
and 350lb/ac) and 4 replicates (total 20 trees) were sampled in January (dormant),
February (full bloom), March (partial leaf growth), April (full leaf growth), June, August
(pre-harvest), October (pre-fertigation), November (post fertigation) and December as
follows:
A. Roots: several root sections were dug up randomly from around the trunk from roots <1cm and >1cm diameter. Samples were dried and ground to analyze for the nutrients.
B. Trunk: several 5-cm-deep holes were drilled into the trunk with an electric drill; subsamples of the shavings were then pooled and ground for analysis.
C. Scaffold: several 2.5cm holes were drilled into the scaffolds with electric drill and the shavings were pooled to analyze for nutrients.
D. Canopy branches: Similar samples as in scaffold were collected from the canopy branches by drilling and collecting the shavings.
E. Branches: 2 and 3 years old branches were sampled randomly from each tree canopy and analyzed for nutrients.
F. Spur samples: spurs were collected in January and December only. G. Flowers: Flower samples were collected at full bloom only.

H. Leaf and Fruit samples: Leaf samples were collected from the trees in April, July, August, October and November. Fruit samples were collected in April, May, June, July and August. Individual yield of the trees were determined at harvest. The leaves fallen during harvest were separated and weighed. Leaves from the same trees were also collected after leaf fall in November to determine total leaf biomass.
Biomass of trees in each N rate treatment (125, 200, 275, 350lb/ac) were determined at
the beginning and the end of the season and increase in tree biomass was calculated.
Tree were excavated using a backhoe and divided into the following parts: Trunk, Roots, Scaffold and Branches
1. Trunk The portion of the wood remaining after removing the roots and scaffolds (stump) was considered the trunk. Saw dust were collected from the sap wood by coring at multiple points- near the crown, in the middle and near scaffold joint and were used for nutrient analysis. Fresh weight of the trunk was determined in the field and sub samples about 7 lbs were collected and dried in the air forced drier at 70oC to get the dry weight of the trunk.
2. Roots All roots were dug out from 15 feet wide x 20 feet long x 5 feet deep area and were separated from the soil using pitchforks and workers. Roots were divided into two groups- small roots <1cm and large root ≥ 1cm diameter. Fresh weights of the roots were determined and 7 lbs sub sample of each group were collected to determine the dry weight. Portions of the roots were collected for nutrient analysis.
3. Scaffold Scaffolds that support the functional canopy were separated from branches. Wood shavings were collected by coring halfway in each scaffold and then pooling the samples into one composite sample. Fresh weight of the scaffolds was determined and 7 lbs sub sample were collected to determine the dry weight.
4. Branches Canopy branches were weighed to get fresh weight and 11 lbs sub sample were collected from the branches by cutting into small pieces. Samples were collected by sawing in the branches and collecting the saw dust for analysis of nutrients. Three, two and one year old branches were collected. Fresh weight was determined and 7 lbs subsamples were collected to determine dry weight and nutrient analysis.
5. Spurs

Spurs having flower buds were collected around the canopy for nutrient analysis in January.
Data collected during all years have been analyzed and reported. Task 4 (Objective 5): Validate current CVs and determine if nutrient ratio analysis provides useful information to optimize fertility management.
Commenced December 2008, Completed December 2013 Sample collection for the task completed by Dec 2012 and statistical analysis completed. Task 5 (Objectives 6): Develop and extend an integrated nutrient BMP for Almond Recommendations developed and available from the website of Almond Board of California at http://www.almondboard.com/Growers/Documents/Almond%20Early-Season%20Sampling%20and%20In-Season%20Nitrogen%20Application%20Maximizes%20Productivity,%20Minimizes%20Loss.pdf. Articles published in journal while other manuscripts have been submitted and others are in progress. F. Results Changes in leaf nutrients The concentration of nutrient in leaves and their seasonal pattern changed for different nutrient elements. Nitrogen Leaf nitrogen concentration was significantly affected by N rate from the first year of the experiment (2008) and the differences increased more in the later years of the experiment (Fig 1). N rate 125lb/ac had the lowest N concentration in leaves and 350lb/ac had the highest N in all years of the experiment. There were small year to year variations in leaf N concentration however the pattern of changes remained similar. N concentrations for all N rate treatments were high at the beginning of the season and then declined gradually until about 125 days after full bloom (DAFB). In the cooler year 2011, changes in leaf N concentration was slower than the previous years and when the last samples were collected in July, there was a phenological lag of over 10 days compared to previous years. Phosphorus Nitrogen application rate had no significant effect on P concentration in the leaves (Fig 2). All treatments showed a sharp decline in P concentration early in the season that

continued slowly later in the season but very low decline in leaf P occurred after 125 DAFB. Potassium The effect of N application on leaf K concentration was not consistent (Fig 3). Leaf K concentration was low for all treatment at the beginning of the experiment and it then gradually increased in the later years. Although there was not a consistent relationship of K concentration in leaves and N treatment in the early years, in 2011 increasing N application resulted in lower Leaf K concentration. K concentration in leaves for all treatments was above the critical value (1.4%) after 2009. Seasonal changes in leaf K concentration were variable in different years with gradual decline in K concentration from 2008 to 2010 while initial increase in concentration in 2001 and then declined. Potassium application rate had significant effect on K concentration in leaves (Fig 4). K application rate 100 lb/ac had lowest K concentration in all years of the experiment while K rate 300 lb/ac had highest K concentration in 2010 and 2011. The seasonal pattern of K in leaves remained same as for K in N rate treatments. Exceptionally, in 2008 mean leaf K concentration was less than 1.2 % and well below the standard critical value of 1.4%. Sulfur N rate had significant effect on leaf Sulfur concentration in all years where increasing N application increased S concentration (Fig 5). Year to year variation in leaf S concentration was not significant however there was an increase in S concentration after 120 DAFB in 2011 due to application of S containing fungicide to control shot hole. Calcium Leaf Calcium concentration was low at the beginning of the season and increased as season progressed (Fig 6). There was no significant effect of N application on leaf Ca concentration early in the season, but the differences increased later in the season and significant effect of N treatment on Ca concentration were observed. Increasing N application resulted in lower Ca concentration in leaves. Magnesium Changes in leaf Mg concentrations followed the pattern of Ca concentration (Fig 7) however there was no significant effect of N application on Mg concentration in leaves. At 125 DAFB leaf Mg concentration was 0.8% or above in all years. Micronutrients N rate had no significant effect on Boron concentration (Fig 8) while its pattern changed in different years. In 2008 and 2010 B concentration was low at the beginning of the

season that slightly increased later in the season while in 2009 and 2011 it started low, increased in the mid-season and then declined. Manganese Nitrogen application had a significant on leaf Mn concentration in 2009, 2010 and 2011 (Fig 9). Increasing N application increased Mn concentration in leaves. Mn concentration in the leaves was low at the start of the season and then increased until 125 DAFB and then remained stable. Zinc N treatment had no consistent and significant effect on Zn concentration of leaves (Fig 10). Soil Zn application was made in 2009 and 2010 resulting in increased leaf Zn concentration in those years. Under high yield in 2011, Zn concentration in leaves was much lower than the recommended 20 ppm in July. Iron N application had no significant effect on Fe concentration in leaves (Fig 11). Fe concentration in leaves increased as season progressed. Copper N application had significant effect on leaf Cu concentration and increasing N application resulted in an increase in Cu concentration in leaves (Fig 12). Cu concentrated started high at the beginning of the season and declined as season progressed.

Figure 1. Leaf Nitrogen concentration (%) for different N rate treatments from 2008-2011. Each point shows mean and standard error of the mean.

Figure 2. Leaf Phosphorus concentration (%) for different N rate treatments from 2008-2011. Each point shows mean and standard error of the mean.

Figure 3. Leaf Potassium concentration (%) for different N rate treatments from 2008-2011. Each point shows mean and standard error of the mean.

Figure 4. Leaf Potassium concentration (%) for different K rate treatments from 2008-2011. Each point shows mean and standard error of the mean.

Figure 5. Leaf Sulfur concentration (ppm) for different N rate treatments from 2008-2011. Each point shows mean and standard error of the mean.

Figure 6. Leaf Calcium concentration (%) for different N rate treatments from 2008-2011. Each point shows mean and standard error of the mean.

Figure 7. Leaf Magnesium concentration (%) for different N rate treatments from 2008-2011. Each point shows mean and standard error of the mean.

Figure 8. Leaf Boron concentration (ppm) for different N rate treatments from 2008-2011. Each point shows mean and standard error of the mean.

Figure 9. Leaf Manganese concentration (ppm) for different N rate treatments from 2008-2011. Each point shows mean and standard error of the mean.

Figure 10. Leaf Zinc concentration (ppm) for different N rate treatments from 2008-2011. Each point shows mean and standard error of the mean.

Figure 11. Leaf Iron concentration (ppm) for different N rate treatments from 2008-2011. Each point shows mean and standard error of the mean.

Figure 12. Leaf Copper concentration (ppm) for different N rate treatments from 2008-2011. Each point shows mean and standard error of the mean. Nutrient export in fruits from almond orchard Nitrogen, P, K, S, Ca and Mg export in fruits are presented in Table 2. Nutrient export in fruits is expressed as export of element in total fruit biomass required to produce 1000lb kernel yield. N export in fruits at harvest was significantly affected by nitrogen application from the first year of the experiment as a result of an increase in N concentration in the fruit. Nitrogen export per 1000 lb kernel yield for the 125lb/ac N rate was 56 lb, 53 lb, 55 lb, 54 lb respectively for 2008, 2009, 2010 and 2011. Nitrogen export for 275 lb was 62 lb, 60 lb, 73 lb and 75 lb for 2008, 2009, 2010 and 2011 respectively, and not significantly different from the 350 lb/ac N treatment. In 2012 N export in the125 lb/ac N treatment was 54 lb of N per 1000 lb kernel showing a deficiency of N while N export for N rate 200, 275, 350 lb/ac was higher with an average N export of 86 lb N per 1000 lb kernel (Table 2).

Phosphorus export in fruits was 6.7 lb, 7.2 lb, 8.9 lb and 9 lb P in fruits per 1000 lb kernel yield in 2008, 2009, 2010 and 2011 respectively and was only significantly affected by nitrogen application rate in 2012 with P export of 11 lb per 1000 lb kernel at the 125 lb/ac rate and 14 lb for 200 lb/ac N application. There were no consistent trends in P export in the different N rate treatments over the years; however P export per 1000 lb kernel yield at harvest increased over the years. Potassium export in fruits per 1000 lb kernel yield was not consistently influenced by the N rate treatments except in 2010 where N export by 1000 lb kernel yield was highest for 125 lb/ac N rate (table 2). Potassium application rate significantly affected K export per 1000 lb kernel yield in all the years except in 2009 (Table 3). K export in fruits was lowest in 100 lb/ac K application (51 lb, 71 lb, 75 lb, 67 lb and 81 lb for 2008, 2009, 2010, 2011 and 2012 respectively) and marginally higher under the 300 lb/ac rate (57 lb, 75 lb, 83 lb, 77 lb and 99 lb per 1000 lb kernel yield) from 2008 to 2012, respectively. Sulfur, calcium and magnesium export in fruits by 1000 lb kernel yield are shown in Table 2. Sulfur export in fruit per 1000 lb kernel yield was strongly affected by N rate treatments in 2010, 2011 and 2012. Sulfur export per 1000 lb kernel yield varied from 2.0 lb (125 lb/ac) to over 3.1 lb for higher N-fertilizer treatments during that time. Calcium export decreased over the years of the experiment, and there was no significant effect of N application on Ca export per 1000 lb kernel yield in the first three years of the experiment. In 2011 increasing N application negative affected Ca export in fruit per 1000 lb kernel yield with 5.7 lb Ca per 1000 lb kernel at the 350 lb/ac N rate to 6.6 lb for the 125 lb/ac N rate. There was a consistent trend of decreasing Ca export in fruits with increasing N application. Magnesium export in fruits per 1000 lb kernel ranged from 4.3 lb to 5.5 lb between 2008 and 2012 and there was no significant effect of N application on Mg export. Boron (B), Zinc (Zn), Manganese (Mn), Iron (Fe) and Copper (Cu) export per 1000 lb kernel yield is presented in Table 4. As there was no significant effect of N application on the export of these nutrient elements, the data for the 275 lb ac-1 N application rate is reported. Boron export in fruits ranged from 115 g to 161 g, Zn from 23 to 42 g, Mn from 15 g to 24 g, Fe from 57 g to 108 g and Cu from 8 g to 12 g per 1000 lb kernel yield.

Table 2. Macronutrient export (lb) in fruit per 1000 lb kernel yield in almond from 2008-2012 under fan jet irrigation. Letters indicate significant differences within the same year at the * < 0.05 or ** < 0.1 level of significance. Refer to table 1 for description of letters.
N Rate (lb/acre)
2008 2009 2010 2011 2012
125 200 275 350 125 200 275 350 125 200 275 350 125 200 275 350 125
200
275
350
N 56 59 61 62 53 56 59 60 55 61 73 70 54 65 74 75 54 86 87 86 c bc ab a b ab a a c b a a c b a a b a a a
* * * * *
P 6.5 6.9 6.7 6.3 7.4 7.4 7.2 6.8 8.6 8.2 8.9 7.8 8.7 8.5 9 8.3 11 14 13 11 b a ab b
ns ns ns ns *
K 53 54 54 52 74 72 73 71 88 81 80 82 77 76 78 75 91 10
0 87 88
a ab b ab ns ns ** ns ns
S 2.3 2.4 2.4 2.5 2.1 2.2 2.2 2.2 2 2.2 2.5 2.4 2.4 2.7 2.9 3 2.4 3.5 3.1 3.1 b b a a c bc ab a b a a a
ns ns * * *
Ca 8.6 8.2 8.1 8.1 7.5 7.4 6.8 6.9 7.6 7.1 7.1 7.1 6.6 6.2 6 5.7 6.4 6.2 5.4 4.9 a b bc c
ns ns ns * ns
Mg 4.8 4.7 4.7 4.7 4.5 4.5 4.4 4.3 4.6 4.4 4.6 4.4 4.6 4.4 4.5 4.4 5.1 5.5 5.0 4.7 ns ns ns ns ns

Table 3. Potassium export (lb) in fruit per 1000 lb kernel yield in almond from 2008-2012 for potassium rate treatments under fan jet irrigation. Letters indicate significant difference in yield within the same year at P < 0.05 level of significance.
Potassium applied (lb/ac)
Potassium export in fruits per 1000 lb kernel yield (lb) 2008 2009 2010 2011 2012
100 51 b 71 ns 75 b 67 b 81 b 200 54 ab 73 ns 80 ab 78 a 92 ab 300 57 a 75 ns 83 a 77 a 99 a
Table 4. Micronutrient export (g) in fruit per 1000 lb kernel yield in almond from 2008-2012. Data shown for the 275 lb/ac N treatment.
Nutrients 2008 2009 2010 2011 2012 B 115 149 142 141 161 Zn 27 33 42 23 34 Mn 18 15 24 19 20 Fe - 101 74 57 108 Cu 8 10 10 8 12
Seasonal Patterns of accumulation of nutrients in fruits The pattern of accumulation of nitrogen in almond fruits per 1000 lb kernel yield during the season is shown in Figure 13. N accumulation in fruit increased with increasing N application while the pattern of N accumulation over the season was generally consistent. In 2008 and 2009, N accumulation occurred rapidly in the early season with 55% of the total N accumulated by 45 days after full bloom (DAFB), 83% at 79 DAFB and 86-93% at 105 DAFB. In 2010 and in 2011, 33-43% and 67-76% of the total fruit N was accumulated in fruit at 44 and 87 DAFB respectively. In 2010 collection of fruit samples was delayed until 126 DAFB at which time > 95% of final fruit N accumulation had occurred. In 2011 due to cooler summer weather N accumulation in fruit was slower and only 76-80% N accumulated in fruit at 119 DAFB. The accumulation of N in fruit between midsummer (110-126 DAFB from 2008-2011) and harvest was consistently low ranging from 5% to 25% of the total N in different years. Phosphorus accumulation per 1000 lb kernel yield increased with time (Figure 14). In 2008 and 2009, P accumulation in fruit was 42-47%, 61-66% and 71-86% at 41, 80 and 105 DAFB respectively. In 2010 and 2011, 30-36%, 53-61% and 67-82% of the total P

was accumulated in fruit by 44, 87 and 123 DAFB respectively. In 2011, P accumulation in fruit was slightly delayed compared to other years. Potassium accumulation in fruits per 1000 lb kernel yield for the N rate treatments is shown in Figure 15 and for K rate treatments in Figure 16. Increasing N application slightly reduced and delayed K accumulation in fruits. All K treatments had similar K accumulation in fruits at the beginning of the season (43 DAFB), but differences then increased till fruit harvest. In all years, K accumulation in fruits per 1000 lb kernel yield ranged from 24-40%, 45-61% and 66-72%, respectively for 43, 87 and 122 DAFB. Sulfur accumulations in fruits for N rate treatments are shown in Figure 17. The pattern of S accumulation over time was similar in all years and closely resembled the N accumulation curves with the exception of 2011 in which very little S accumulation during the period of 88–119 DAFB occurred. In June 2011, a sulfur-based fungicide was applied to the orchard to control fungal diseases; hence values after that date cannot be reliably interpreted. Over 90% of the total S accumulation in fruits occurred before 101-126 DAFB in 2008, 2009 and 2010. Calcium accumulation in fruits per 1000 lb kernel yield increased over the season (Figure 18). Seventy percent to 90% of the total Ca accumulated in the fruits by 111 DAFB. In the cooler years of 2010 and 2011 Ca accumulation in fruits was faster and about 85% to 90% Ca accumulated as soon as 111 DAFB, while in warmer years only about 70% of the total Ca accumulated in fruit by 111 DAFB time. The majority of Mg accumulation (70 to 85% of total) occurred within 111 DAFB (Figure 19) and there was no consistent pattern of Mg accumulation with increasing N application and little variation in Mg accumulation patterns between years. Accumulation of B, Zn, Mn, Fe and Cu are shown in Figures 20, 21, 22, 23 and 24 respectively as nutrient accumulation in 1000lb kernel yield. As all N rates had similar amounts and accumulation patterns for these nutrients, only data for the 275 lb ac-1 N application rate are presented. Fifty percent of the total boron in fruits was accumulated by 111 DAFB and 70-80% by 125 DAFB. Zinc accumulation in fruit was variable during different years. Total and seasonal Zn accumulation in fruit was low during 2008 and 2011 and high during 2009 and 2010. Eighty to 90% of the total Zn was accumulated near 111 DAFB in 2008, 2009 and 2010, while in 2010 about 70% of total Zn was accumulated in fruits near 111 DAFB. Manganese accumulation per 1000 lb kernel yield was lower in 2008 and 2009 and increased in 2010 and 2011. Sixty three percent of the total Mn accumulated in fruit by 101 DAFB in 2008 while 72-82% of total Mn in 2009-2011 accumulated at 117 DAFB. 41%, 57% and 70% of the total Fe was accumulated in

fruit by 117 DAFB in different years. Cu accumulation in fruit was high early in the season and 71-88% of the total Cu was accumulated in fruit at 112 DAFB in different years.
Figure 13. Nitrogen accumulation per 1000 lb kernel yield by nitrogen rate treatment during 2008-2011. Each point represents the mean and bars show standard error of the mean.
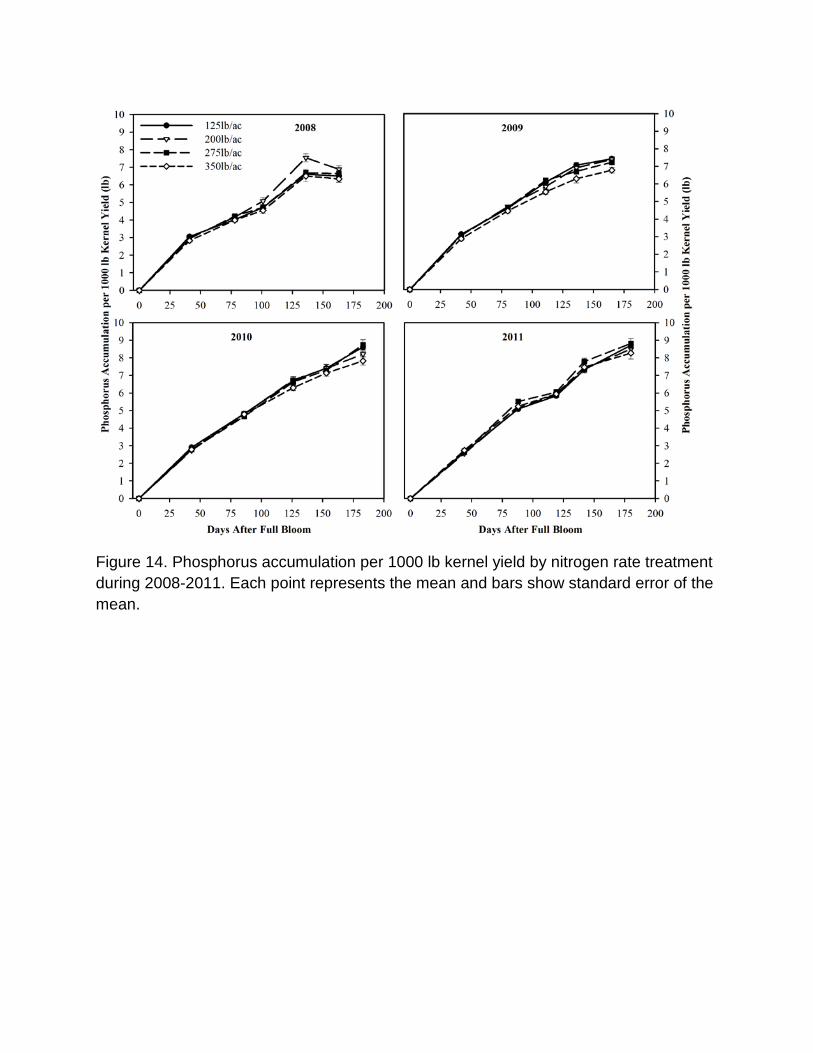
Figure 14. Phosphorus accumulation per 1000 lb kernel yield by nitrogen rate treatment during 2008-2011. Each point represents the mean and bars show standard error of the mean.

Figure 15. Potassium accumulation per 1000 lb kernel yield by nitrogen rate treatment during 2008-2011. Each point represents the mean and bars show standard error of the mean.

Figure 16. Potassium accumulation per 1000 lb kernel yield by potassium rate treatment during 2008-2011. Each point represents the mean and bars show standard error of the mean.

Figure 17. Sulfur accumulation per 1000 lb kernel yield by nitrogen rate treatment during 2008-2011. Each point represents the mean and bars show standard error of the mean.

Figure 18. Calcium accumulation per 1000 lb kernel yield by nitrogen rate treatment during 2008-2011. Each point represents the mean and bars show standard error of the mean.

Figure 19. Magnesium accumulation per 1000 lb kernel yield by nitrogen rate treatment during 2008-2011. Each point represents the mean and bars show standard error of the mean.

Figure 20. Boron accumulation (g) per ton kernel yield by 275 lb/ac N rate during 2008-2011. Each point represents the mean and bars show standard error of the mean.

Figure 21. Zinc accumulation (g) per ton kernel yield by 275 lb/ac N rate during 2008-2011. Each point represents the mean and bars show standard error of the mean.

Figure 22. Manganese accumulation (g) per ton kernel yield by 275 lb/ac N rate during 2008-2011. Each point represents the mean and bars show standard error of the mean.

Figure 23. Iron accumulation (g) per ton kernel yield by 275 lb/ac N rate during 2008-2011. Each point represents the mean and bars show standard error of the mean.

Figure 24. Copper accumulation (g) per ton kernel yield by 275 lb/ac N rate during 2008-2011. Each point represents the mean and bars show standard error of the mean.
Kernel Yield Response of kernel yield to Nitrogen rate is shown in table 5. N rate had no significant effect on kernel yield in 2008 under both fan jet and drip irrigation however there was an increasing trend in kernel yield with increasing N application. Between 2009 and 2011 significant differences in yield were observed under both fan jet and drip irrigation. In all years N rate 125 lb/ac produced minimum yield. In 2009 N application at 350 lb/ac produced maximum yield under both fan jet and drip irrigation. In 2010 maximum kernel yield was obtained with 350 lb/ac N application both under both Fan Jet and drip irrigation while in 2011maximum kernel yield was observed for N rate 275 lb/ac under fan jet irrigations while 350 lb/ac N rate produced maximum kernel yield under drip irrigation. In 2012 overall orchard productivity declined due to high yield in 2011 and frost and no significant differences in yield were observed under any irrigation type. Sources of N had no significant effect on kernel yield in any year and rate combination except in 2011 under drip irrigation and 125 lb/ac N rate where UAN 32 produced significantly higher yield than CAN 17 (table 6).

Potassium rate had no significant effect on kernel yield in any year of the experiment (table 7). K source had no consistent significant effect on kernel yield (table 8). In 2010 under fan jet irrigation, K source SOP+KTS and SOP produced significantly higher yield than KCl however the differences were not significant in the later years. SOP+KTS had a trend towards higher yield though the differences were not significant. Table 5. Kernel yield (lb/ac) of Nonpareil almond with different rates of N as UAN 32 under fan jet and drip irrigations. Means not connected by the same letter within irrigation are significantly different.
Irrigation Year Nitrogen rate (lb/ac) Probability
125 200 275 350
Fan jet
2008 3,068 3,293 3,265 3,455 ns
2009 2,816 3,066 3,216 3,304 0.0247
b ab a a
2010 2,356 2,884 3,510 3,276 0.0001
c b a a
2011 3,870 4,014 4,480 4,424 0.001
b b a a 2012 806 790 884 972 ns
Drip
2008 3,506 3,534 3,762 3,733 ns
2009 2,715 2,943 3,183 3,489 0.0007
c bc b a
2010 2,849 3,413 3,734 4,030 0.0022
c b ab a
2011 3,811 4,274 4,643 4,735 0.0002
c b a a 2012 816 725 858 917 ns

Table 6. Effect of N source on kernel yield (lb/ac) of almond under fan jet and drip irrigations. Means not connected by the same letter within irrigation and similar N rate are significantly different.
Irrigation Year
Nitrogen rate (lb/ac) 125 200 275 350
UAN 32
CAN 17
UAN 32
CAN 17
UAN 32
CAN 17
UAN 32
CAN 17
Fan jet
2008 3,068 3,115 3,293 3,312 3,265 3,224 3,455 3,167 2009 2,816 3,067 3,066 3,116 3,216 3,288 3,304 3,197 2010 2,356 2,766 2,884 2,980 3,510 3,773 3,276 3,489 2011 3,870 3,803 4,014 4,159 4,480 4,452 4,424 4,398 2012 806 729 790 791 884 840 972 860
Drip
2008 3,506 3,476 3,534 3,304 3,762 3,638 3,733 3,515 2009 2,715 2,591 2,943 2,602 3,183 3,030 3,489 3,420 2010 2,849 2,592 3,413 3,283 3,734 3,915 4,030 3,694 2011 3,811 3,640 4,274 4,337 4,643 4,864 4,735 4,852 a b ns ns ns ns ns ns 0.0081 2012 816 853 725 823 858 1,019 917 880
Table 7. Kernel yield (lb/ac) of Nonpareil almond with different potassium fertilizer rates under fan jet and drip irrigations.
Irrigation Year Potassium rate (lb/ac) Probability
100 200 300
Fan jet
2008 2,970 2,914 3,120 ns 2009 2,993 2,871 3,100 ns 2010 3,103 3,134 3,067 ns 2011 3,912 3,999 4,016 ns 2012 789 677 612 ns
Drip
2008 3,255 3,358 3,324 ns 2009 2,925 2,842 3,198 ns 2010 3,387 3,334 3,411 ns 2011 4,196 4,145 4,262 ns 2012 766 855 717 ns
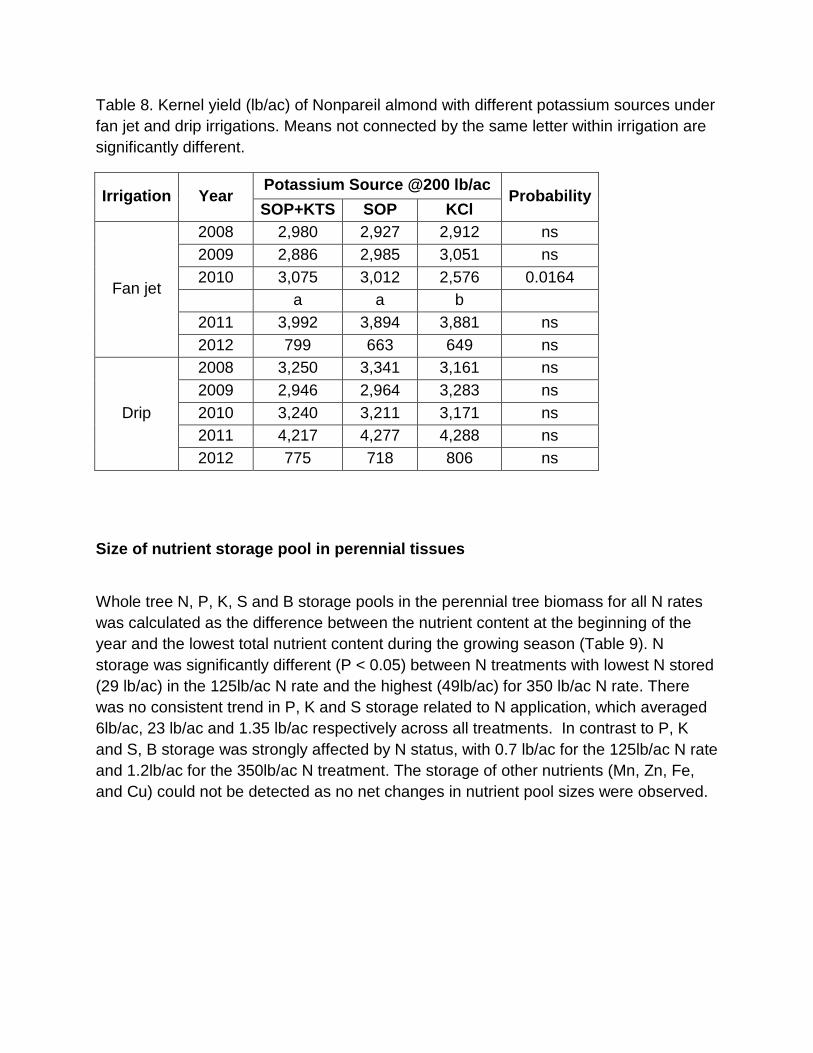
Table 8. Kernel yield (lb/ac) of Nonpareil almond with different potassium sources under fan jet and drip irrigations. Means not connected by the same letter within irrigation are significantly different.
Irrigation Year Potassium Source @200 lb/ac
Probability SOP+KTS SOP KCl
Fan jet
2008 2,980 2,927 2,912 ns 2009 2,886 2,985 3,051 ns 2010 3,075 3,012 2,576 0.0164
a a b 2011 3,992 3,894 3,881 ns 2012 799 663 649 ns
Drip
2008 3,250 3,341 3,161 ns 2009 2,946 2,964 3,283 ns 2010 3,240 3,211 3,171 ns 2011 4,217 4,277 4,288 ns 2012 775 718 806 ns
Size of nutrient storage pool in perennial tissues
Whole tree N, P, K, S and B storage pools in the perennial tree biomass for all N rates was calculated as the difference between the nutrient content at the beginning of the year and the lowest total nutrient content during the growing season (Table 9). N storage was significantly different (P < 0.05) between N treatments with lowest N stored (29 lb/ac) in the 125lb/ac N rate and the highest (49lb/ac) for 350 lb/ac N rate. There was no consistent trend in P, K and S storage related to N application, which averaged 6lb/ac, 23 lb/ac and 1.35 lb/ac respectively across all treatments. In contrast to P, K and S, B storage was strongly affected by N status, with 0.7 lb/ac for the 125lb/ac N rate and 1.2lb/ac for the 350lb/ac N treatment. The storage of other nutrients (Mn, Zn, Fe, and Cu) could not be detected as no net changes in nutrient pool sizes were observed.

Table 9. N, P, K, S and B storage pool in perennial biomass of almond trees (lb/ac) under differential N application rates calculated as the difference in nutrient content between January 2012 and the seasonal lowest nutrient content. Data represents the mean and letters indicate significant difference at < 0.05 level of significance.
N Application (lb/ac)
Storage Pool (lb/ac) N P K S B
125 29 c 7 21 1.5 0.7 b 200 36 bc 5 23 1.3 0.7 b 275 44 ab 7 27 1.7 0.5 b 350 49 a 6 21 0.9 1.2 a
Significance < 0.05 ns ns ns < 0.05
Validation of Critical Values Critical values were re-examined by plotting yield against nutrient concentration in leaves. Optimum yield was obtained when leaf nitrogen concentration was between 2.4 and 2.5% dry weight. Leaf P concentration did not increase above 0.16% in our experiment and optimum yield was obtained at 0.12-0.15% leaf P. Critical K concentration for K was previously been reported to be over 1.4% in this experiment we did not get a yield response over 1% K suggesting that the critical K requirement is no greater than 1% (Table 10).

Table 10: Revalidation of critical values for macro and micro nutrients for almond
Critical Nutrient Concentration Nutrient Element Previously reported Current study
N 2-2.5% 2.4-2.5% K over 1.4% 1.0%
Whole tree nitrogen partitioning In 2011 a new task took place to improve our understanding of whole orchard nutrient balance. In this new task, we collected nutrient concentrations and biomass of all major organs of mature field grown almond trees by whole tree excavation, sequential tissue sampling and nutrient analysis in trees grown under four nitrogen rate treatments. The amount of nutrient accumulated in perennial organs over one year (2012) was determined as the difference between the total tree nutrient pool in dormant trees prior to, and at the completion of a single season (Fig. 25). The dynamics of nutrient remobilization in perennial tissues during early season growth and the accumulation of nutrients in perennial tissues were determined by sequential coring, tissue sampling, biomass estimation and whole tree excavation. Nutrient resorption from leaves was determined from multiple seasonal leaf samples. All measurements were replicated in trees of differing N fertilization regimes. In 2013 more data have been collected and sent to the laboratory for their nutrient content analysis to support the results obtained in 2012. Data collected in 2012 were analyzed from January 2013 to July 2013 and some key results are presented as follow.

Figure 25. Nitrogen partitioning in perennial and annual organs of mature almond trees. The accumulation in perennial biomass is the total N accumulated in the trees from planting to the age of 13 years. While it is not possible to distinguish nutrients accumulated in the previous year and remobilized from nutrients acquired in the current year, it can be presumed that the decline in the nutrient content of perennial organs in the early spring and the equivalent increase in nutrients in annual organs is a measure of the remobilization of the stored nutrients for flowering, fruit set and early fruit growth and initial leaf expansion. This pool is referred to here as stored N. Nitrogen contents in whole tree perennial biomass declined during anthesis and reached the lowest content when fruit set and completion of leaf out occurred. Total perennial biomass N content and seasonal fluxes were strongly influenced by N application rate. N concentration in perennial organs was lowest for 125lbs/ac N rate and increased with N application up to 275lbs/ac N, but did not increase further. The most variable pool of N was roots <1cm diameter. The size of the whole tree remobilized N pool increased with increasing N application and was maximal at 49lbs/ac for 350lbs/ac N application. The pool of remobilized P, K,

S and B for 275lbs/ac N application rate was 7lbs/ac, 27lbs/ac, 1.72lbs/ac, and 0.53lbs/ac respectively. Trends in nutrient contents through the year demonstrate that N was stored predominantly in roots >1cm diameter as well as in canopy branches, while P was stored mostly in roots >1cm diameter and in canopy branches and branches <2.5cm diameter. K storage was greatest in canopy branches followed by branches <2.5cm diameter and roots >1cm diameter. The major storage site for S were branches <2.5cm diameter and roots >1cm diameter, while B was stored in canopy branches and roots >1cm diameter Nitrogen Use Efficiency
Increasing nitrogen supply increased yield however the nitrogen use efficiency (NUE) declined as nitrogen rate increased (table 11). Cumulative NUE between 2008 and 2011 from N rate 275lb/ac was 88% and 93% under fanjet and drip irrigations. This represents a partial factor efficiency since we did not estimate the rate of mineralization of N from unfertilized soil. The irrigation water at this site contained negligible N. Estimates of mineralizable N can be derived from the N limited 125 lb N rate treatment and suggests that from 30 - 50 lbs of N may have been derived from native N or residual N present in the soil from previous historic fertilization. Determining the source (native or fertilizer) of this N is critical as depleting native soil would be an unsustainable practice that would damage native soil properties while depleting residual fertilizer N is a beneficial practice. It is notable that NUE in 2011 was not significantly lower than the 4 year averages shown in table 11. The ability of the low N rate treatments (125 and 200 lb N acre), which were clearly N deficient treatments, to maintain NUE values in excess of 1 over the 4 experimental years, suggests that there is a significant pool of slowly mineralizable N in these soils. The relevance of this N pool to N management in orchards remains unclear. Including 40 lbs of N from soil mineralization reduces the apparent NUE by 10%
Table 11: Cumulative Nitrogen Use Efficiency* 2008-2011. Bracketed numbers represent NUE assuming 40 lbs per acre/year of N supply from soil mineralization.
N Rate (lb/ac) Drip Fan Jet
125 1.43 (1.20) 1.30 (1.15)
200 1.03 (0.94) 1.03 (0.94)
275 0.93 (0.79) 0.88 (0.75)
350 0.82 (0.69) 0.70 (0.55)

*Nitrogen use efficiency was calculated as N exported in harvested fruits by N applied in fertilizers.
G. Discussion and Conclusions:
Increasing nitrogen supply significantly increased kernel yield and nitrogen concentration in plant tissues. 1000lb kernel yield exported 54lb to 75lb N for different N application rates; N export in fruits increased as N application increased however at N rates of 275lb/ac and 350lb/ac the same amount of N was exported in fruits. In these experiments the 275 lb N rate resulted in optimal yields and had a significantly better NUE than the higher N rate. Averaged over 4 years the export of N and K from the orchard in the highest yielding treatment (275 lbs N) was 68 lbs N and 80 lbs K per 1000 lbs kernel yield (this includes all the fruit parts).
K export per 1000lb kernel yield at the 100lb/ac K application was 75lb, 67lb and 81lb in 2010, 2011 and 2012 respectively. Over 85% of the nitrogen and 70% of the potassium in fruit was accumulated by mid-June (126DAFB and 119DAFB in 2010 and 2011 respectively) and this time coincided with kernel filling and shell hardening. This suggests that N and K fertilizer should be applied at or before this time to meet the crop N and K demand. K rate had no significant effect on kernel yield suggesting that the trees were not K deficient. The observed high K export in fruits necessitates annual application of K fertilizers.
Increases in N fertilization from 275 lb to 350 lb N did not result in greater N removal in fruits and did not significantly increase tissue N concentrations, suggesting that leaf analysis is not responsive to over fertilization and that fertilization in excess of demand is wasteful.
No differences in tree response to N source were observed and both N fertilizer sources were equally available to plant on this soil type. K source showed a significant effect on kernel yield under drip irrigation in 2010 where KCl produced lower yield however the cause of the low yield from KCl could not be established as Cl concentration of the leaves was not significant for K source treatment and the yield effect were not consistent in the subsequent years. The very high yield in 2011 and incidence of hull rot resulted in decline in orchard productivity in 2012. The incidence of hull rot was very low in the low N treatments and increased as N supply increased. The lower yield observed at the low N rates was a result of N deficiency as indicated by lower tissue N values (<1.5%) and reduced new tree growth. Analysis of perennial tree parts suggests that lower amounts of N were stored in the low N trees and reduced tree growth. The decline in yield for high N rates was a result of hull rot.

A high nitrogen use efficiency was observed for all N rate treatments in these trials. For the optimal N rate of 275lb/ac the average NUE from 2008 to 2011 was 88% under fan jet irrigation and 93% under drip irrigation. This estimate of NUE did not attempt to account for soil N reserves and evidence now suggests that an average of 40 lbs N per acre per year was available from soil mineralization processes. Significantly this high NUE persisted even in trees grown for 5 years under a net N deficit (exported N > supplied N). After 5 years deficit fertilization we would predict that any residual fertilizer N present from prior year activity would have been thoroughly depleted. Throughout these trials soil solution nitrate remained very low (<5 ppm Nitrate). Collectively these results suggest that the soils used in these trials have a significant (30-40 lb N ac year) ability to release N the question of how to account for this N in N budgeting programs remains unclear. If it is assumed that all of the 40 lbs N available from the soil was a consequence of prior year excess fertilization then the averaged NUE for the 275 lb N rate was 0.77 (77%). Under well-managed conditions as in this experiment, almond is highly efficient in taking up nitrogen from soil. The high efficiency was achieved with well managed irrigation system that limited leaching of water below root zone and timely application of fertilizer according to tree demand. The high NUE (over 100%) from lower N rates suggests that N is contributed from storage in the perennial tree organs and soil supply. Nutrient storage capacity of the tree perennial organs was calculated by seasonal sampling of perennial organs confirmed that almond trees store substantial amounts of N, P, K, S and B in the perennial biomass that are remobilized to support the growth of flowers, leaves and initial fruit development. N fertilizer application can be delayed until late March especially in areas of high spring rainfall that can result in N leaching if N fertilizers applied early in the season. Whole tree excavation and monitoring of tree organs showed that fruits are the greatest sinks for nutrients and hence fertilizer application can be adjusted on the basis of expected yield with proper evaluation and monitoring of fruit load. The size of the whole tree remobilized N pool increased with increasing N application and was maximal at 49lbs/ac for 350lbs/ac N application. Trends in nutrient contents through the year demonstrate that N was stored predominantly in roots >1cm diameter as well as in canopy branches, while P was stored mostly in roots >1cm diameter and in canopy branches and branches <2.5cm diameter. K storage was greatest in canopy branches followed by branches <2.5cm diameter and roots >1cm diameter. The major storage site for S were branches <2.5cm diameter and roots >1cm diameter, while B was stored in canopy branches and roots >1cm diameter

H. Project Impacts As a best management practice fertilizer in an almond orchard should be based on expected yield estimated at flowering and fruit set followed by analysis of leaves to diagnose any deficiency. The combination of nutrient budget determination, nutrient response information, improved sampling and monitoring strategies, and yield determination provide a theoretically sound and flexible approach to ensure high productivity and good environmental stewardship. This project has been widely cited and has formed the basis of the ANR-CDFA Nitrogen Training Workshop series and is being used as the basis for new N management programs industry wide.
I. Outreach Activities Summary: Publications:
Muhammad S., B. L. Sanden, B. D. Lampinen, D. R. Smart, S. S. Silva, A. Olivos, K. A. Shackel, T. DeJong and P. H. Brown (2013). Seasonal Changes in Nutrient Content and Concentration in a Mature Deciduous Tree Species: Studies in Almond (Prunus dulcis (Mill.) D. A. Webb) Journal of the American Society for Horticultural Science. (Submitted)
Muhammad S., B. L. Sanden, B. D. Lampinen, D. R. Smart, S. S. Silva, A. Olivos, K. A. Shackel, T. DeJong and P. H. Brown (2013). Optimization of nitrogen and potassium nutrition to improve yield and yield parameters of irrigated almond (Prunus dulcis (Mill.) D. A. Webb). Journal of the American Society for Horticultural Science. (Submitted).
Muhammad S., B. L. Sanden, S. Metcalf and P. H. Brown (2013). Nutrient storage in the perennial organs of almond (Prunus dulcis) (Mill.) D. A. Webb) and remobilization in spring. Tree Physiology. (Submitted)
Saa S., P. H. Brown, S. Muhammad, A. Olivos, B. L. Sanden, E. A. Laca. Prediction of Leaf Nitrogen from Early Season Samples and development of Field Sampling Protocols for Nitrogen Management in Almonds (Prunus dulcis [Mill.] DA Webb); Plant and Soil. Accepted.
Saa S., S. Muhammad, P. H. Brown. 2013. Development of leaf sampling and interpretation
methods and Nutrient Budget Approach to Nutrient Management in Almond; Acta Hort. (ISHS) 984:291-296.
Saa S., S. Muhammad, S. J. Castro, P. H. Brown. 2013. Effect of Spur Type, Foliar Sprays, and
Differential Nitrogen Rates on Leaf Nutrient Content and Spur Leaf Area of Almond Trees; Acta Hort. (ISHS) 984:139-142.

Muhammad S.,B. L. Sanden, B. D. Lampinen, D. R. Smart, S. S. Silva, Andres Olivos, Kenneth
A. Shackel, Theodore DeJong and Patrick H. Brown (2013). Nutrient use efficiencies of nitrogen and potassium fertilizer rate and sources in high productive almond orchard. Journal of the American Society for Horticultural Science. (Submitted).
Alsina, M.M., A.C Borges, and D.R. Smart. 2013. Spatiotemporal variation of event related N2O and CH4 emissions during fertigation in a California almond orchard. Ecosphere.
Sanden, B, P.H. Brown, R. Snyder. 2012. New insights on water management in almonds. “Regulatory Issues Impacting California Agriculture” Visalia, California 7-8 Feb, 2012 Proceedings: Amer. Soc. Agron. Calif. Chap. pp. 88-93. Univ. Calf. Davis, http://calasa.ucdavis.edu
Schellenberg D.L., M.M. Alsina, S. Muhammad, C.M. Stockert, M.W. Wolff, B.L. Sanden, P.H. Brown and D.R. Smart. 2012. Yield-scaled global warming potential from N2O emissions and CH4 oxidation for almond irrigated with N fertilizers on arid land. Agriculture, Ecosystems and Environment 155: 7-15.
Shackel K.A., T.L. Prichard, L.J. Schwankl. 2012. Irrigation scheduling and tree stress. In: Prune production manual, University of California, ANR publication #3507.
Valdez Zarate, J.L., M.L. Whiting, B.D. Lampinen, S. Metcalf, S.L. Ustin, and P.H. Brown. 2012. Prediction of leaf area index in almonds by vegetation indexes. Computers and Electronics in Agriculture. 85:24-32.
Muhammad S., E. Luedeling, P. H. Brown (2009). A nutrient budget approach to nutrient management in almond. The Proceedings of the International Plant Nutrition Colloquium XVI, held in Sacramento, California, USA, August 26-30. http://ucanr.org/sites/nm/files/76672.pdf
Presentations:
Brown, P. 2012. Nutrient Management of Almonds. Almond Board of California: Sacramento CA.1800 atten.
Brown, P. 2011. Update on Nutrient Management of Almonds. Almond Board of California: Modesto CA.1800 atten.
Brown, P. 2011. CDFA-FREP Annual Conference. Management of N in Tree Crops. Paso Robles CA. 300 atten.
Brown, P. 2011. Sampling strategies for Nutrient Management in Tree Crops. Fluid Fertilizer Foundation Meeting. Stockton CA. 55 atten.
Brown, P. 2011. Stakeholder Meeting Paramount Farming: Bakersfield CA. 18 atten.

Brown, P. 2012. Foliar fertilization of tree crops. ASHS. Miami FL. 60 Attendees.
Brown, P. 2012. Management of N in Almonds. CDFA-FREP and WPHA Annual Workshop. Modesto CA. 400 atten. Expert Panel Member presentation and discussion.
Brown, P. 2012. Managing large scale collaborative research projects. Pomology Extension Continuing Conference. Davis CA. 50 atten.
Brown, P. 2012. Nutrient Budget and development of new sampling strategies for N management. Northern San Joaquin Almond Day. Merced, CA. 420 atten.
Brown, P. 2012. Nutrient Budget and development of new sampling strategies for N management. ISHS Meeting on Nutrition of Tree Crops, Chakrabourty Thailand. 250 atten.
Brown, P. 2012. Nutrient Budget and development of new sampling strategies for N management. Australian Almond Industry Annual Meeting, Nuriootpa, SA. 220 atten.
Brown, P. 2012. Plant Nutrition in a Changing Environment. German Soc. for Plant Nutrition. 200 atten.
Brown, P. USDA Grant Review SCRI CAP Project Panel, Washington DC.
Brown, P. 2013. Management of N in Almonds. CDFA-FREP and WPHA Annual Workshop. Modesto CA. 400 atten. Expert Panel Member presentation and discussion.
Brown, P. 2013. Almond Nitrogen Workshop. Almond Board of California: Modesto CA.1800 atten.
Brown, P.H. and Saa S. 2014. Series of Nitrogen Management Training for Certified Crop Advisers. FREP-UC,Davis: Modesto, Woodland, Fresno, Salinas, Tulare, CA.150 atten per site.
Chabrillat, S. et al. 2012. Quantitative mapping of surface soil moisture with hyper spectral imagery using the HYSOMA interface. IEEE International Geoscience and Remote Sensing Symposium. Munich, Germany.
Sanden, B. 2012. “Irrigation Management to Maximize Almond Production in the SJV”, Organic Almond Farming Workshop, Selma CA. 64 atten.
Sanden, B. 2012. Kern almond meeting, irrigation management and workshop. Kern Soil and Water Newsletter.
Sanden, B. et al. 2012. Almond Worlbsroup Tour, Kern County.
Sanden, B. et al. 2012. California’s Effort to Improve Almond Orchard Kc. European Geosciences Union General Assembly. Vienna, Austria.
Schellenberg D. et al. 2012. Gross N transformations and 15N assimilation after arid land fertilization at the tree scale. ESA. Portland OR.

Shackel K., Sanden B. 2011. Fertigation: Interaction of Water and Nutrient Management in Almonds. Almond board of California annual report #09-HORT11.
Saa. S. 36th Annual Nickels Field Day Meeting. 2013. Speaker. 60 atten
The Seventh International Symposium on Mineral Nutrition of Fruit Crops. Thailand. 2012. Speaker. 400 atten
Saa, S. American Society of Agronomy: Plant & Soil Conference. 2012. Speaker. 250 atten.
Saa, S. Almond Board of California Conference. 2012. Speaker. 1800 atten.
Saa, S. 35th Annual Nickels Field Day Meeting. 2012. Speaker. 60 atten.
Field Meeting Almond Irrigation & Nutrient Management for High Yield. Year: 2011. Speaker. 150 atten
Saa, S. Laboratory Analysis Workshop. 2011. Speaker. 40 atten.
Saa Sebastian, Muhammad Saiful, Castro Sebastian, Brown Patrick; Effect of Spur Type, Foliar Sprays, and Differential Nitrogen Rates on Leaf Nutrient Content and Spur Leaf Area of Almond Trees. Thailand; International ISHS Symposium on Mineral Nutrition of Fruit Crops. 2012.
Posters:
Saa Sebastian, Muhammad Saiful, Brown Patrick; Development of leaf sampling methods and nutrient-budget fertilization; Almond Board of California, Modesto, USA. 2011. Poster.
Patrick Brown, Saiful Muhammad, Sebastian Saa Silva and Eike Luedeling; Development of Leaf Sampling Methods and Nutrient-budget fertilization; Almond Board of California, Modesto, USA. 2010. Poster.
Brown Patrick, Sebastian Saa Silva, Kenneth Shackel, Michael Whiting, Theodore Sammis, Bruce Lampinen, David Slaughter; Advanced Sensing and Management Technologies to Optimize Resource Use in Perennial Crops: Nutrient and Water Status ASHS Palm Springs, California, USA. 2010. Poster.
Saa Sebastian, Muhammad Saiful, Brown Patrick; Development of leaf sampling and interpretation methods Almond Board of California, Modesto, USA. 2010. Poster.
Brown Patrick, Eike Luedeling, Sebastian Saa, Jeremy Nunez; Development of leaf sampling and interpretation methods for Almond; International Plant Nutrition Conference, Sacramento, USA. 2009. Poster.

Brown Patrick, Saiful Muhammad, Sebastian Saa, Eike Luedeling; Development of Leaf Sampling Methods and Nutrient-Budget Fertilization. International Plant Nutrition Conference, Sacramento, USA. 2009. Poster.

J: Factsheet/Database Template:
Development of a Nutrient Budget Approach to Fertilizer Management in Almond
Grant Agreement Number: 10-0039SA
Project Leaders (Patrick Brown, Professor, Department of Plant Sciences, One Shields Ave, University of California, Davis, CA 95616-8683, (530) 752-0929. [email protected].
Start Year/End Year (2008-2013)
Location: Belridge, Kern County.
Highlights
Results demonstrate that fertilizer use in Almonds can be optimized and considerable nitrogen losses can be reduced if nitrogen applications are synchronized with the actual tree demand. This project provides the baseline data to achieve this goal.
• Nitrogen use efficiency can be optimized by adjusting fertilization rate based on realistic, orchard specific yield, accounting for all N inputs and adjusting fertilization in response to spring nutrient status and yield estimates.
• 1000lb almond kernel removes (in all fruit parts) from the orchard 68lb N, 8lb P and 80lb K.
• Leaf analysis following full leaf out and again in the late summer is an important monitoring strategy.
• Late spring review of leaf analysis and conduct of an updated yield estimate, should be used to adjust fertilization for remainder of season.
• Applications to match demand in as many split applications as feasible • 80% N uptake occurs from full leaf out to hull split in Almond. • Apply up to 20% after fruit maturity or immediately post-harvest, corrected for
actual yield - but only if trees are healthy and capable of N uptake from soil. Use foliars to satisfy N supply if N loss is likely.
Introduction
Environmental legislation is forcing a change in farming practices as a result of many years of excess N application and loss of N below the root zone and consequent contamination of water resources. One of the main opportunities to optimize nitrogen fertilization is to synchronize applications with plant crop demand and apply N coincident with root uptake. This project has provided the data needed to correctly

estimate the right rate and right time of fertilizer application for efficient and environmentally sound practices.
Methods
A large experiment covering approximately 100 acres was initiated in 2008 in Belridge, Kern county under fan jet and drip irrigations with four rates of nitrogen (N) 125, 200, 275 and 350lb/ac applied with two N fertilizer sources-UAN 32 and CAN 17. The goal of this experiment was to develop phenology and yield based nutrient demand curves that guide the timing and rate of fertilizer application. Individual tree yield, leaf nutrient analysis and whole tree nutrients were estimated.
Findings (Results and Conclusions)
This project has allowed the development of improved nitrogen management practices for almond growers. Nutrient budget curves were developed for the major nutrients and data on timing and quantity of N, K and other nutrient uptake and removal from orchards was derived. Budget curves quantify the time course of nutrient uptake and total plant demand as determined by tree yield and nutrients required for growth. Yield potential determines fertilizer strategy and there is a large negative impact on overall efficiency that occurs in years or orvchards of poor yield in which standardized fertilization strategies are used. Fertilizing accordingly to predicted yields will dramatically enhance nutrient use efficiency. Findings of this research has been adopted by the Almond Board of California as the new standards for nutrient management and are being widely publicized and distributed.
K: Copy of the Product/Results:
This research has been adopted by the Almond Board of California industry as the new standards for nutrient management and is being widely publicized and distributed. This research project has been presented at grower, industry, extension, CDFA, ASA and university venues including keynote presentation during the years of the project in Almond Industry conferences. A webpage summarizing this work has been posted on the Almond Board’s main grower information portal at http://www.almondboard.com/Growers/OrchardManagement/PlantNutrition/Pages/Default.aspx and on the University of California Fruit and Nuts Website http://ucanr.edu/sites/scri/Crop_Nutrient_Status_and_Demand__Patrick_Brown/ and is in process of being posted at the Almond Boards Sustainable Cropping Systems site. This work has been published in Pacific Nut Growers and other industry publications. A Google search for “Nutrient management in almond” yields 20 top ranked pages based upon this research.
