1 welcome! building assets of people, families and communities “what do outcomes have to do with...
TRANSCRIPT
1
Welcome!
Building Assets of People, Families and Communities
“What Do Outcomes Have to do with It?”
Jessie Ball duPont FundOctober 28-30, 2008
222
Purpose and Performance Purpose and Performance Measures for TodayMeasures for Today
PurposePurpose To offer a framework and techniques for using To offer a framework and techniques for using
outcomes to ensure people are better offoutcomes to ensure people are better off
Performance measures (for presenter) Performance measures (for presenter) Participants will Participants will
understand the difference between program level understand the difference between program level performance and community level outcomes, and how performance and community level outcomes, and how they relatethey relate
Increase skills in using dataIncrease skills in using data Learn a technique for wide-spread community and Learn a technique for wide-spread community and
partner engagementpartner engagement

333
Various Outcome Models Balanced Scorecard
Outcome Funding Framework
Scales and Ladders
Logic Model Results Mapping
Our Own Hybrid

4
What is an Outcome Framework?
An Outcome Framework is a focused way of thinking and taking action that starts with ends (defining the change you want to make) and works backwards to means (developing powerful strategies to bring about the change).
555
Why Use an Outcome Framework?Why Use an Outcome Framework?
1.1. To take actionTo take action in a simple, step-by-step way to in a simple, step-by-step way to to improve the well-being of populations of to improve the well-being of populations of children, individuals or families. children, individuals or families.
2.2. Brings people togetherBrings people together on what they care on what they care about - the well-being for children, families, about - the well-being for children, families, and communities.and communities.
3.3. Provides a Provides a common frameworkcommon framework for human for human services, government, funders and services, government, funders and communities to work in partnership.communities to work in partnership.
4.4. Uses data (numbers and story) Uses data (numbers and story) • to direct action and to direct action and • to know whether conditions are getting better.to know whether conditions are getting better.
666
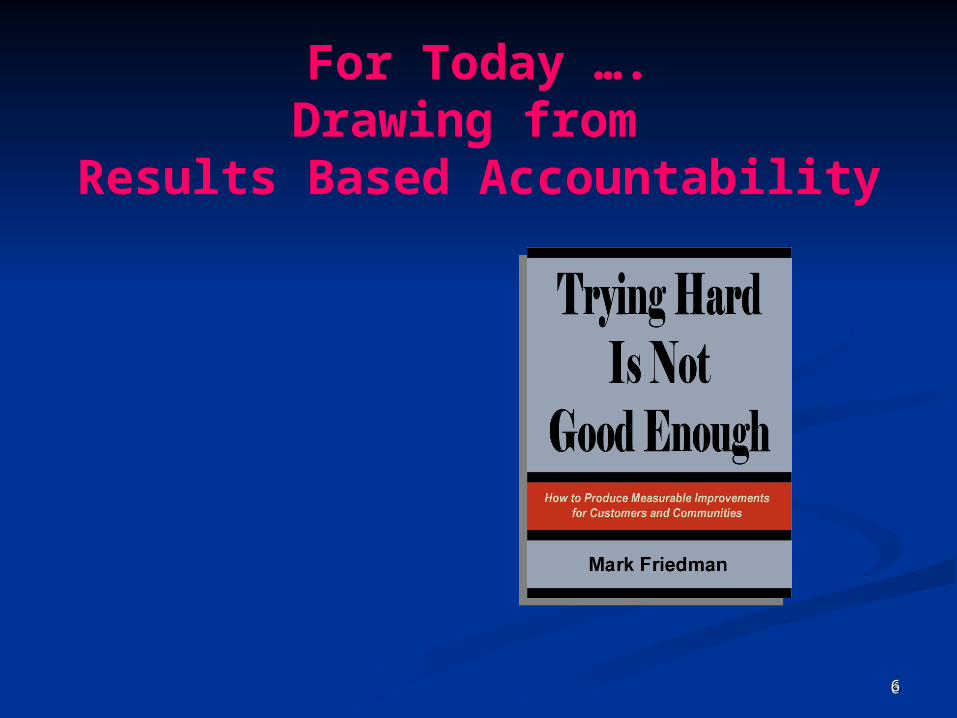
For Today ….Drawing from
Results Based Accountability
777
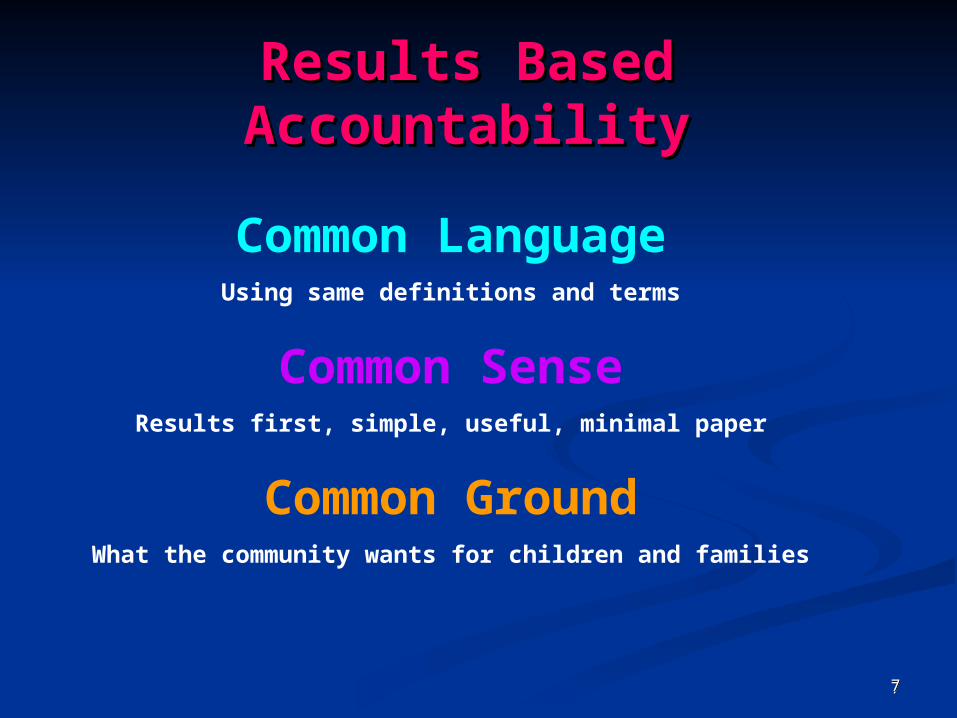
Results Based AccountabilityResults Based Accountability
Common LanguageUsing same definitions and terms
Common SenseResults first, simple, useful, minimal paper
Common GroundWhat the community wants for children and families

8
Accountability is …
“ A relationship between person or groups where one is responsible to another for
something important.”
Mark Friedman,Trying Hard is Not Good Enough
Common Language
999
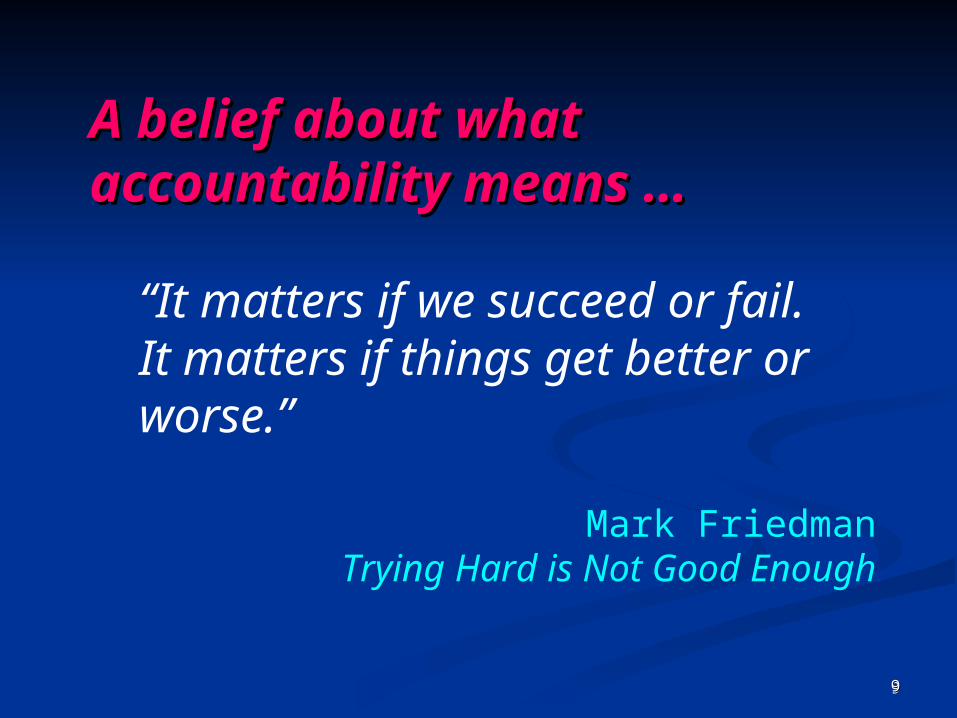
A belief about what A belief about what accountability means …accountability means …
“It matters if we succeed or fail. It matters if things get better or worse.”
Mark FriedmanTrying Hard is Not Good Enough

10
What do you believe?What do you believe?
1.1. Why do you believe that it matters if Why do you believe that it matters if things get better or worse for people in things get better or worse for people in your community with respect to:your community with respect to:
1.1. Having housing that is affordable ?Having housing that is affordable ?2.2. Having sufficient assets to meet monthly Having sufficient assets to meet monthly
bills, send their children to college or live bills, send their children to college or live comfortably in old age?comfortably in old age?
3.3. Having financial literacy skills to use the Having financial literacy skills to use the banking, saving, tax benefit and other banking, saving, tax benefit and other economic structures in our society? economic structures in our society?
4.4. Having policies in place that support asset-Having policies in place that support asset-building for all citizens?building for all citizens?

11
Two Profoundly Different PopulationsTwo Profoundly Different Populations
Customer Population Community Populations
Specific group in a program Whole group in a geographic area
(in programs and not in programs)
Adults in Financial Literacy 101 All adults in Duval County

12
An OutcomeAn Outcome
Statement Statement ==
Whole Group of People
(Community Population)
+ Geographic Area
+Desired Outcome
Community Populations and Outcomes

13
Example: All adults in Duval Example: All adults in Duval County are financially literateCounty are financially literate
Outcome Outcome Statement =Statement =
Statement ofStatement of
what’s what’s important important
for a for a communitycommunity
populationpopulation
Whole Group Whole Group of Peopleof People
(Community (Community Population)Population)
++
For a specific For a specific population of population of peoplepeople
All people All people over 21 years over 21 years of ageof age
Geographic Geographic AreaArea
++
In a specific In a specific geographic geographic areaarea
In Duval In Duval CountyCounty
Desired Desired OutcomeOutcome
Condition of Condition of well-beingwell-being
Financially Financially literateliterate

14
Placer County, California
OUTCOMES for CHILDREN
SAFE
HEALTHY
AT HOME
IN SCHOOL
OUT OF TROUBLE

15
New Mexico Children’s Cabinet
Outcomes for Children Birth to Five
1. All children birth to five will be physically and mentally HEALTHY.
2. All children birth to five will be SAFE and SUPPORTED.
3. All children birth to five will LEARN the skills they need toto support their individual goals.
4. All children birth to five will be able to TRANSITION to school successfully.
5. All children birth to five and their families are valued and their active participation promoted in their COMMUNITIES.

16
Vermont● Families, youth and individuals are engaged in and contribute to their community’s decisions and activities.
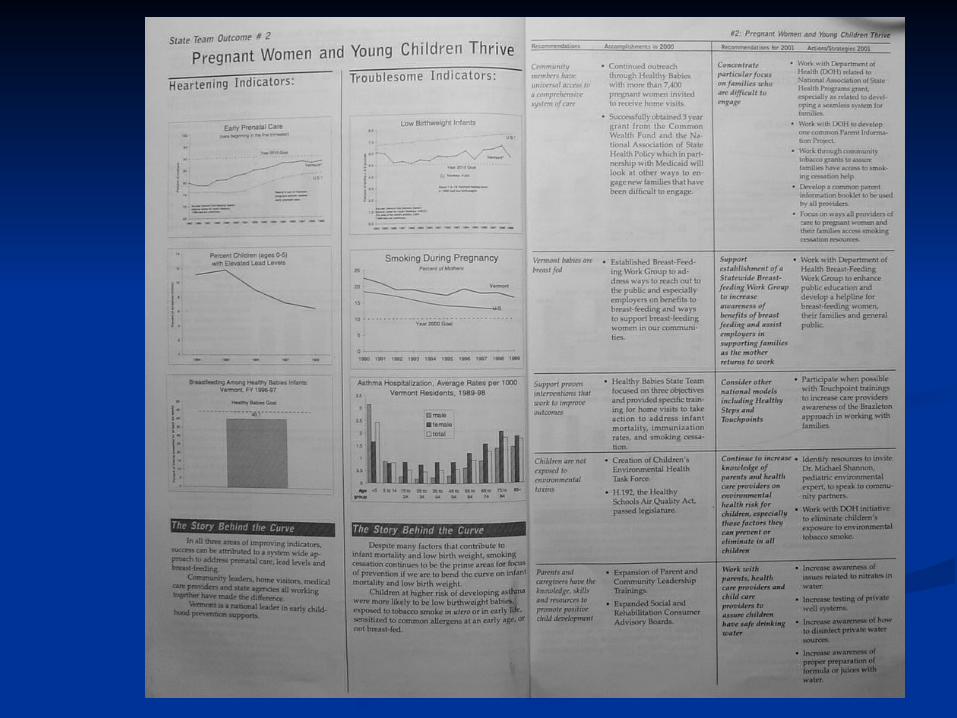
● Pregnant women and young children thrive.
● Children Ready for School
● Children Succeed in School
● Children live in stable, supported families
● Youth choose healthy behaviors
● Youth successfully transition to adulthood
● Adults lead healthy and productive lives.
● Elders and people with disabilities live with dignity and independence in settings they prefer.
● Communities provide safety and support for families and individuals.
17
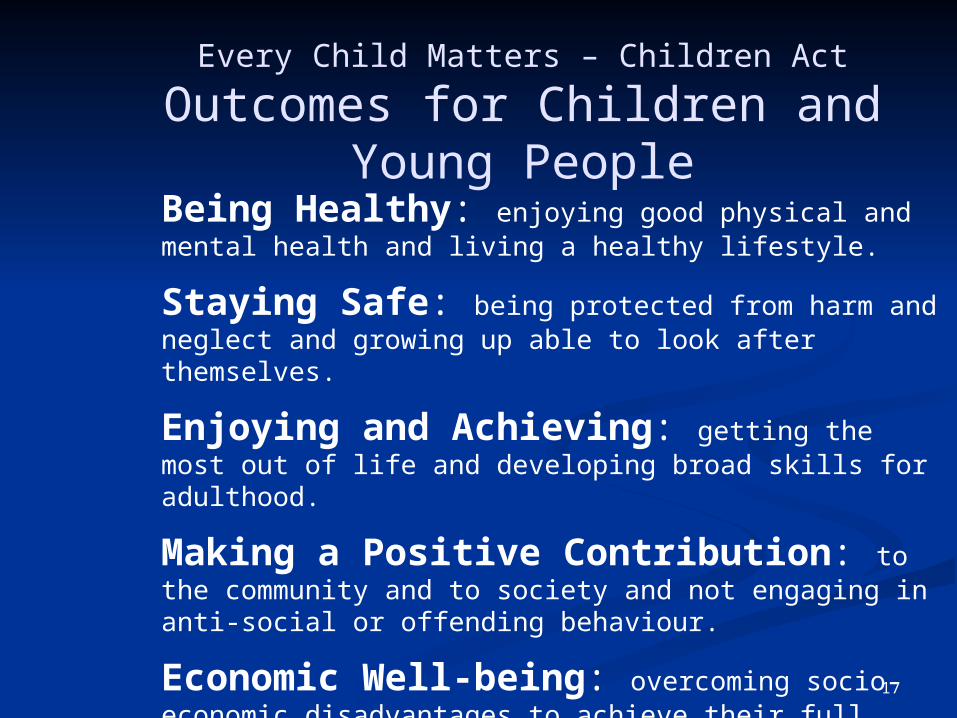
Every Child Matters – Children Act
Outcomes for Children and Young People
Being Healthy: enjoying good physical and mental health and living a healthy lifestyle.
Staying Safe: being protected from harm and neglect and growing up able to look after themselves.
Enjoying and Achieving: getting the most out of life and developing broad skills for adulthood.
Making a Positive Contribution: to the community and to society and not engaging in anti-social or offending behaviour.
Economic Well-being: overcoming socio-economic disadvantages to achieve their full potential in life.

18
Outcome Outcome Statement =Statement =
Making Progress =
Whole Population of People
(Community Population)
+ Geographic Area
+ Desired Outcome Indicator

19
Example: All adults in Duval County Example: All adults in Duval County areare
financially literate financially literate
Outcome Outcome
Statement =Statement =
Whole Whole Population of Population of
People People (Community (Community Population)Population)
++
For a For a specific specific population population of peopleof people
All people All people over 21 over 21 years of ageyears of age
Geographic Geographic AreaArea
++
In a specific In a specific geographic geographic areaarea
In Duval In Duval CountyCounty
Desired Desired OutcomeOutcome
Condition of Condition of well-beingwell-being
Financially Financially literate literate
Making Progress = IndicatorMaking Progress = Indicator Measure Rate of Measure Rate of savingssavings
20
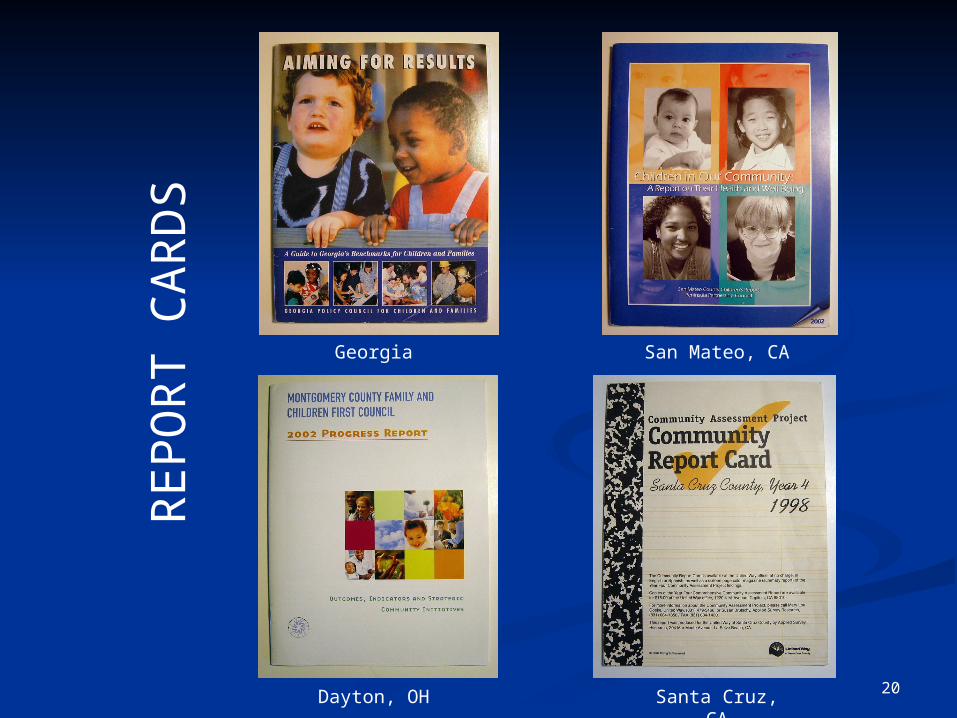
Georgia San Mateo, CA
Dayton, OH Santa Cruz, CA
REPO
RT C
ARDS
21
22
What are the Steps toWhat are the Steps toTaking Action?Taking Action?
232323
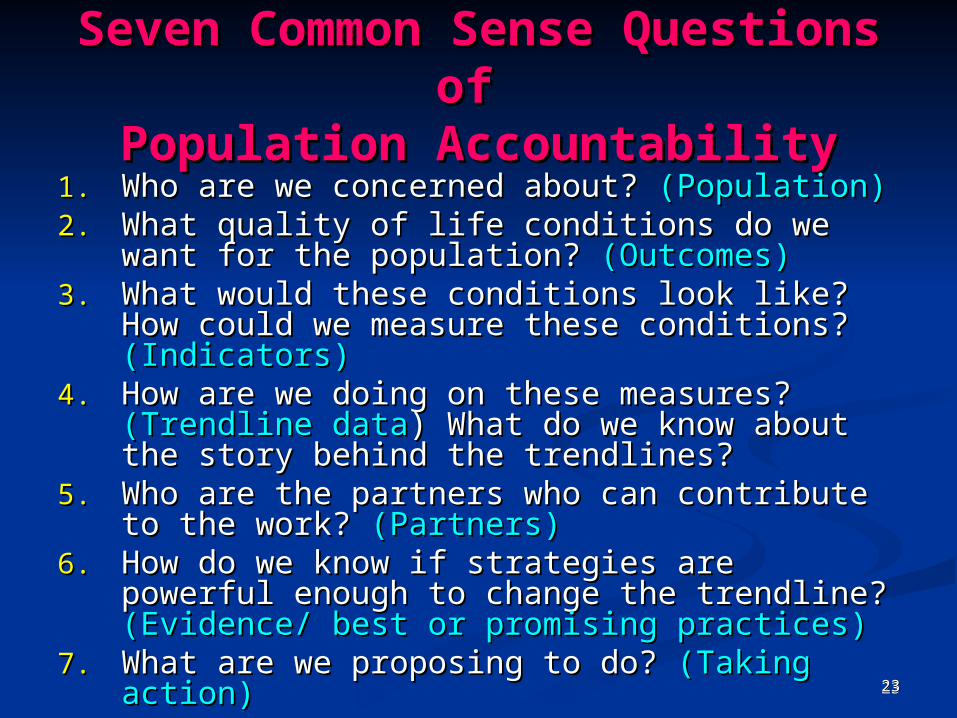
Seven Common Sense Questions of Seven Common Sense Questions of Population AccountabilityPopulation Accountability
1.1. Who are we concerned about? Who are we concerned about? (Population)(Population)2.2. What quality of life conditions do we want for the What quality of life conditions do we want for the
population? population? (Outcomes)(Outcomes)3.3. What would these conditions look like? How could we What would these conditions look like? How could we
measure these conditions? measure these conditions? (Indicators)(Indicators)4.4. How are we doing on these measures? How are we doing on these measures? (Trendline (Trendline
datadata) What do we know about the story behind the ) What do we know about the story behind the trendlines?trendlines?
5.5. Who are the partners who can contribute to the work? Who are the partners who can contribute to the work? (Partners)(Partners)
6.6. How do we know if strategies are powerful enough to How do we know if strategies are powerful enough to change the trendline? change the trendline? (Evidence/ best or promising (Evidence/ best or promising practices)practices)
7.7. What are we proposing to do? What are we proposing to do? (Taking action)(Taking action)
24
Working Through the Working Through the Seven Population Seven Population
Accountability Accountability QuestionsQuestions

252525
1. Who are we concerned about? 1. Who are we concerned about?
PopulationsPopulationsChildrenChildrenYouthYouthFamiliesFamiliesCommunities Communities
PlacesPlaces NeighborhoodNeighborhoodCityCityCountyCountyStateStateUSAUSA

262626
2. What quality of life conditions do we 2. What quality of life conditions do we want for a specific population?want for a specific population?
(Outcomes)(Outcomes)
For children and/or youth? For children and/or youth?
For families? For families?
For residents?For residents?
For our community (all people) ?For our community (all people) ?
272727
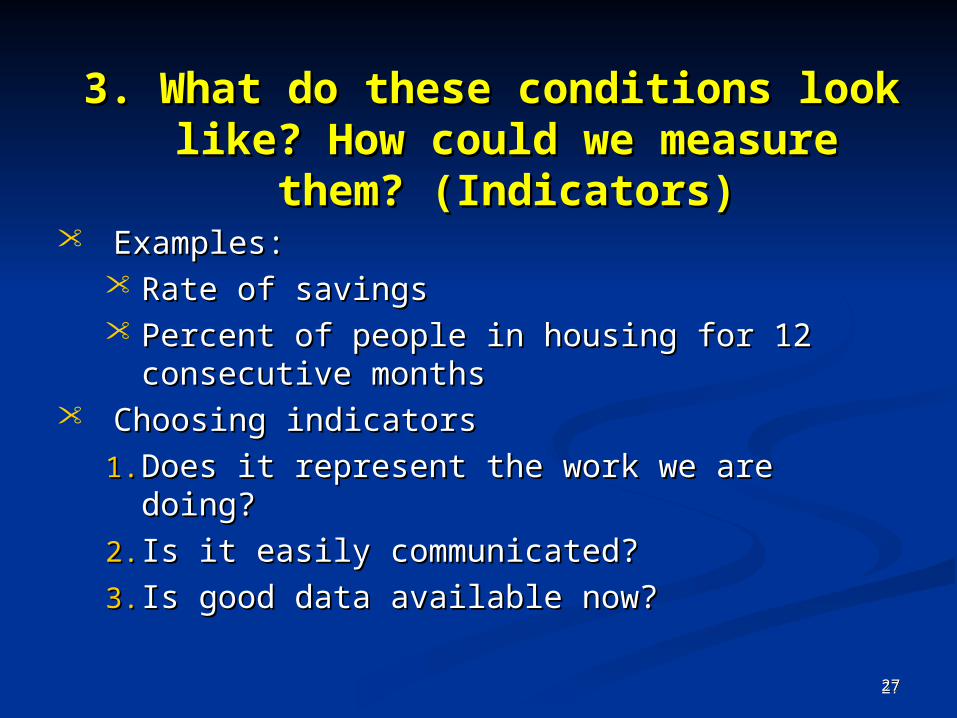
3. What do these conditions look like? 3. What do these conditions look like? How could we measure them? How could we measure them?
(Indicators)(Indicators) Examples:Examples:
Rate of savingsRate of savings Percent of people in housing for 12 consecutive Percent of people in housing for 12 consecutive
monthsmonths Choosing indicatorsChoosing indicators
1.1. Does it represent the work we are doing?Does it represent the work we are doing?
2.2. Is it easily communicated?Is it easily communicated?
3.3. Is good data available now?Is good data available now?
282828
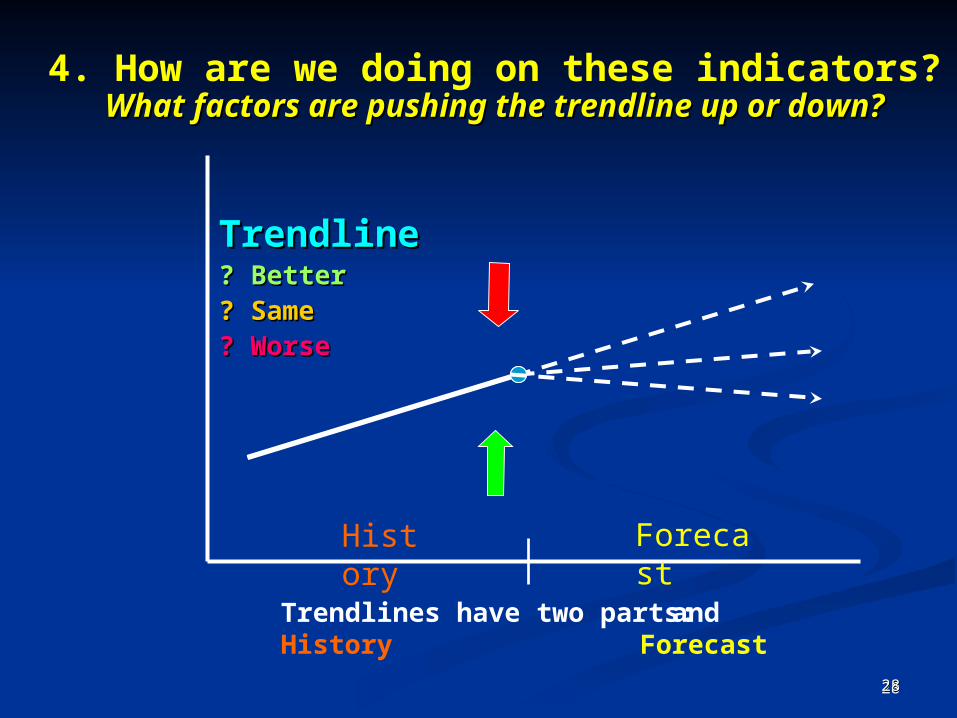
4. How are we doing on these indicators? What factors are pushing the trendline up or down?What factors are pushing the trendline up or down?
Trendlines have two parts: History
History Forecast
and Forecast
TrendlineTrendline? Better? Better? Same? Same? Worse? Worse
292929
5. Who are the partners that can 5. Who are the partners that can contribute the work for better results?contribute the work for better results?
Who can contribute?Who can contribute? Who is needed at the “table”?Who is needed at the “table”? Who can we recruit now to move the work Who can we recruit now to move the work
forwardforward??
303030
OnlyOnly partners partners taking action taking action togethertogether can can change population indicatorschange population indicators

31
6. How do you know a strategy 6. How do you know a strategy is powerful enough to change is powerful enough to change
the trendline?the trendline? Reach – Would it reach the residents, children
and families we care about? Sufficient Numbers – Would it have the level of
scale to reach a sufficient number of families to impact the trendline?
Probability of success – Does it have “good enough” evidence that we can expect success?
Fits in our community – Will residents value it and support it?
Capacity – Do we have the knowledge, partnerships and structure to carry it off?
Resources – Do we have or can get the resources needed?
323232
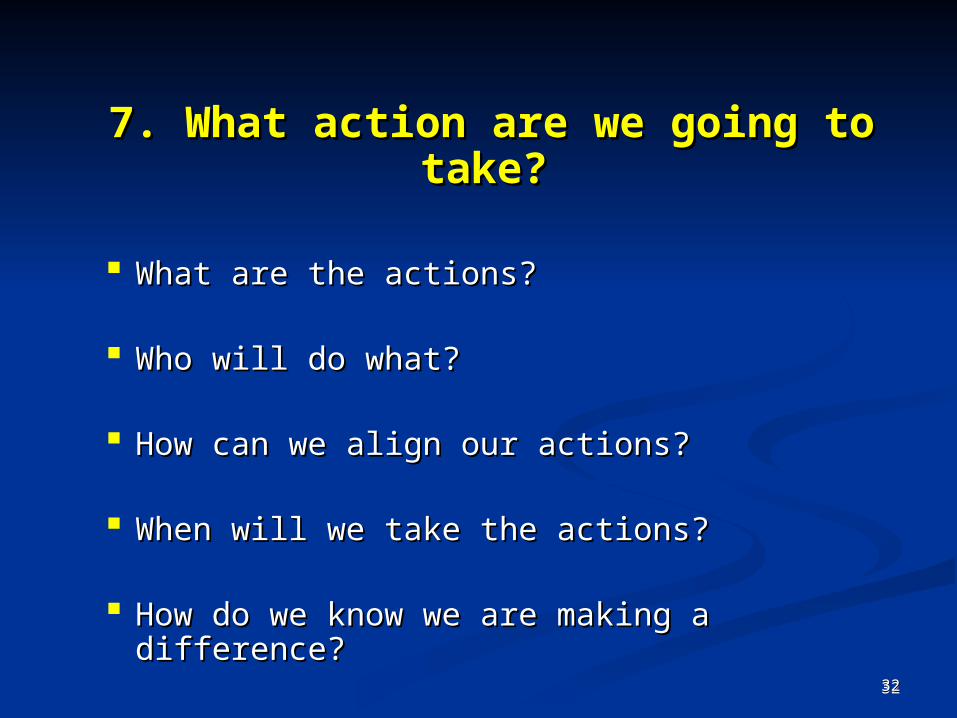
7. What action are we going to take?7. What action are we going to take?
What are the actions? What are the actions?
Who will do what?Who will do what?
How can we align our actions?How can we align our actions?
When will we take the actions?When will we take the actions?
How do we know we are making a difference?How do we know we are making a difference?
33
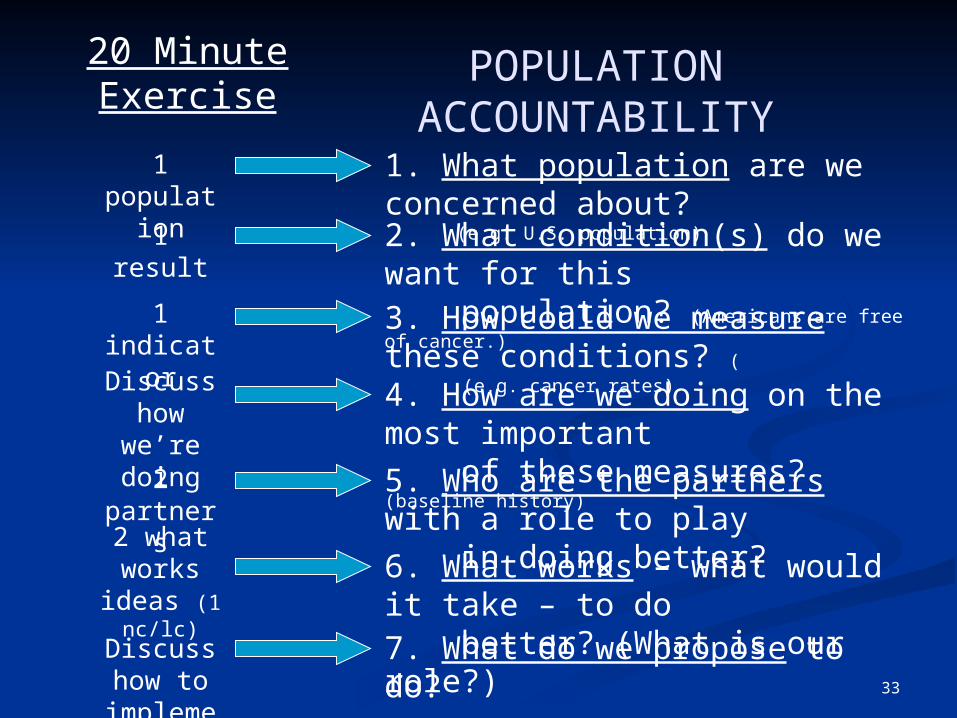
1 population
1 result
1 indicator
Discuss how we’re doing
2 partners
2 what works ideas
(1 nc/lc)
Discuss how to implement
20 MinuteExercise
1. What population are we concerned about? (e.g. U.S. population)
2. What condition(s) do we want for this population? (Americans are free of cancer.)
3. How could we measure these conditions? ( (e.g. cancer rates)
4. How are we doing on the most important
of these measures? (baseline history)5. Who are the partners with a role to play in doing better?6. What works – what would it take – to do better? (What is our role?)7. What do we propose to do?
POPULATION ACCOUNTABILITY
34
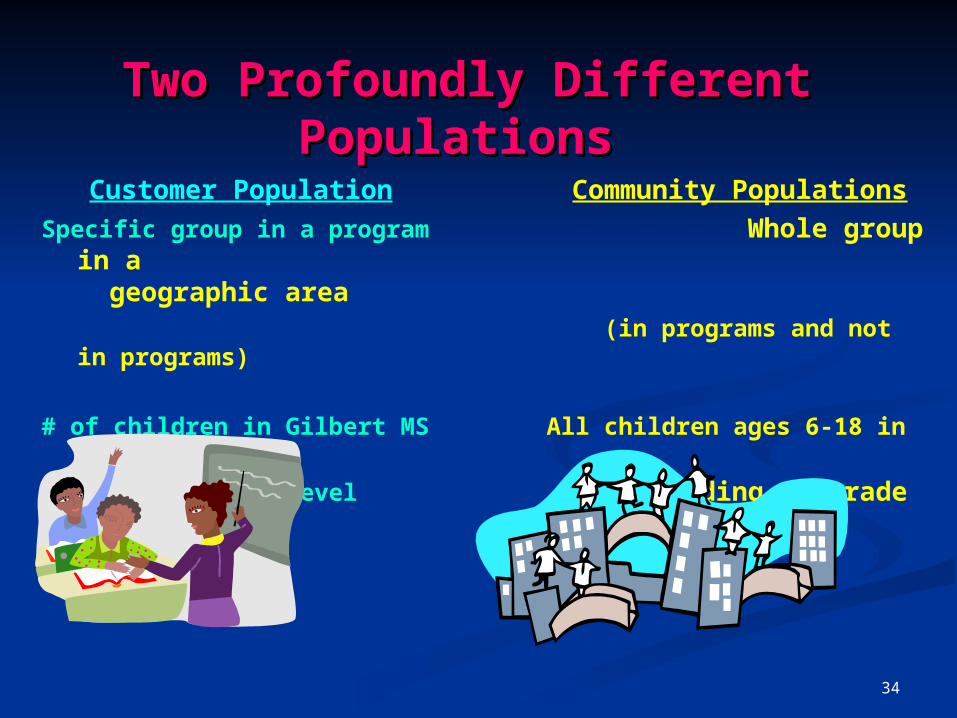
Two Profoundly Different PopulationsTwo Profoundly Different Populations
Customer Population Community Populations
Specific group in a program Whole group in a geographic area
(in programs and not in programs)
# of children in Gilbert MS All children ages 6-18 in Duval County
reading at grade level reading at grade level

353535
Performance Performance Accountability for a Accountability for a
Customer Population is …Customer Population is …
An approach to help us better An approach to help us better see the see the linklink between between our workour work and and our performance,our performance, and the and the achievement of the peopleachievement of the people we we serve in our programs. serve in our programs.

36
Performance Performance Accountability Accountability ==
Organizational
Boundary
+ Customers
+ Performance
37
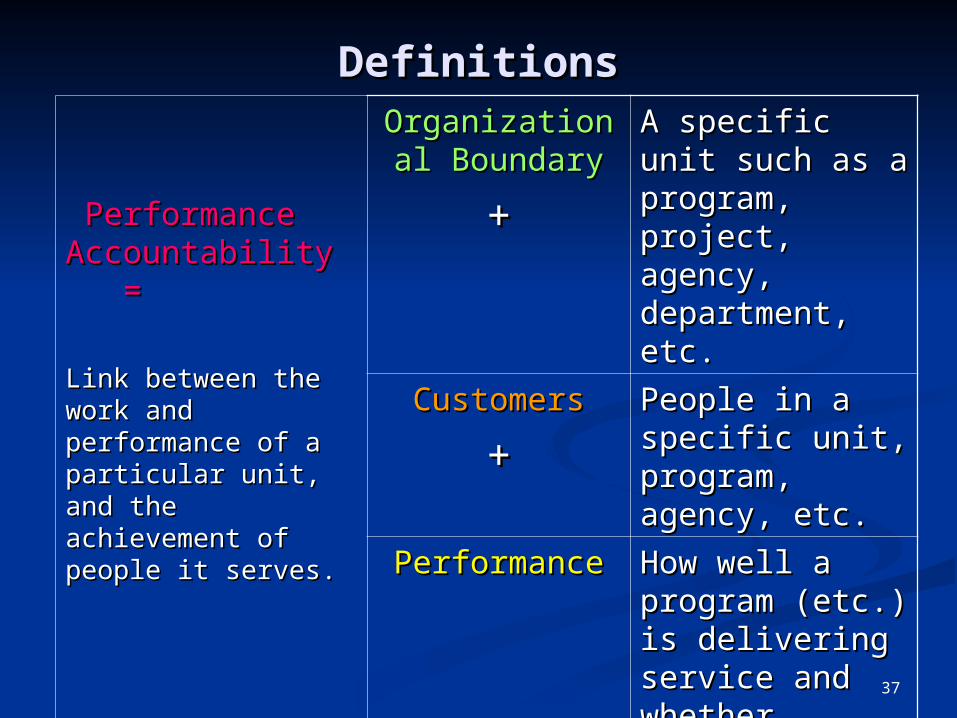
DefinitionsDefinitions
Performance Performance Accountability Accountability ==
Link between the Link between the work and work and performance of a performance of a particular unit, and particular unit, and the achievement of the achievement of people it serves.people it serves.
Organizational Organizational BoundaryBoundary
++
A specific unit A specific unit such as a such as a program, program, project, agency, project, agency, department, department, etc.etc.
CustomersCustomers
++People in a People in a specific unit, specific unit, program, program, agency, etc. agency, etc.
PerformancePerformance
How well a How well a program (etc.) is program (etc.) is delivering delivering service and service and whether whether customers are customers are better off.better off.

38
DefinitionsDefinitions
Performance Performance Accountability =Accountability =
Link between the work Link between the work and performance of a and performance of a particular unit, and the particular unit, and the achievement of people achievement of people it serves.it serves.
Making ProgressMaking Progress
Organizational Organizational BoundaryBoundary
++
A specific unit such as A specific unit such as a program, project, a program, project, agency, department, agency, department, etc.etc.
CustomersCustomers
++People in a specific People in a specific unit, program, unit, program, agency, etc. agency, etc.
PerformancePerformance
How well a program How well a program (etc.) is delivering (etc.) is delivering service and whether service and whether customers are better customers are better off.off.
Performance Performance MeasureMeasure
Specific measure of Specific measure of how well a program how well a program (etc.) is delivering (etc.) is delivering service and whether service and whether customers are better customers are better off.off.

39
Examples: CustomersExamples: Customers
Performance Performance Accountability Accountability ==
Link between the Link between the work and work and performance of a performance of a particular unit, particular unit, and the and the achievement of achievement of people it serves.people it serves.
Making ProgressMaking Progress
Organizational Organizational BoundaryBoundary
++
A specific unit A specific unit such as a such as a program, project, program, project, agency, agency, department, etc.department, etc.
Workforce Workforce Development Development ProgramProgram
CustomersCustomers
++People in a People in a specific unit, specific unit, program, agency, program, agency, etc. etc.
Men and Men and women over women over age 18age 18
PerformancePerformance
How well a How well a program (etc.) is program (etc.) is delivering service delivering service and whether and whether customers are customers are better off.better off.
Maintain Maintain continuous continuous employmentemployment
Performance Performance MeasureMeasure
Specific measure Specific measure of how well a of how well a program (etc.) is program (etc.) is delivering service delivering service and whether and whether customers are customers are better off.better off.
Maintain Maintain employmenemployment for 13 t for 13 monthsmonths

40
Examples: Program Examples: Program
Performance Performance Accountability Accountability ==
Link between the Link between the work and work and performance of a performance of a particular unit, particular unit, and the and the achievement of achievement of people it serves.people it serves.
Making ProgressMaking Progress
Organizational Organizational BoundaryBoundary
++
A specific unit A specific unit such as a such as a program, project, program, project, agency, agency, department, etc.department, etc.
Workforce Workforce Development Development ProgramProgram
CustomersCustomers
++People in a People in a specific unit, specific unit, program, agency, program, agency, etc. etc.
Men and Men and women over women over age 18age 18
PerformancePerformance
How well a How well a program (etc.) is program (etc.) is delivering service delivering service and whether and whether customers are customers are better off.better off.
TimelinessTimeliness
Performance Performance MeasureMeasure
Specific measure Specific measure of how well a of how well a program (etc.) is program (etc.) is delivering service delivering service and whether and whether customers are customers are better off.better off.
Placement Placement made made within 30 within 30 days of days of entering entering programprogram
414141
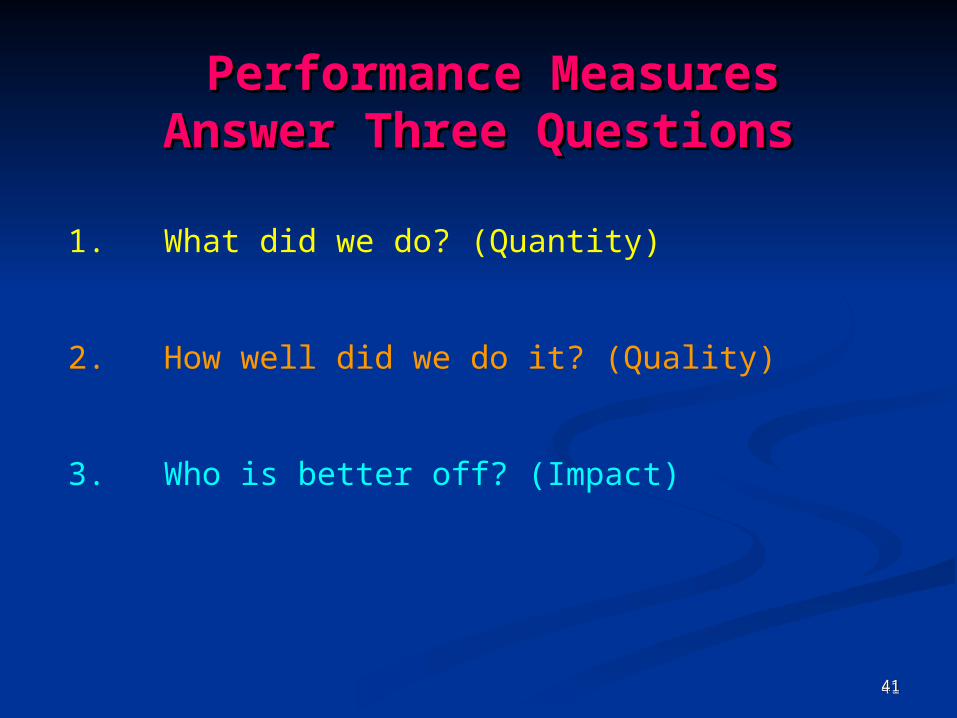
Performance MeasuresPerformance MeasuresAnswer Three QuestionsAnswer Three Questions
1. What did we do? (Quantity)
2. How well did we do it? (Quality)
3. Who is better off? (Impact)
424242
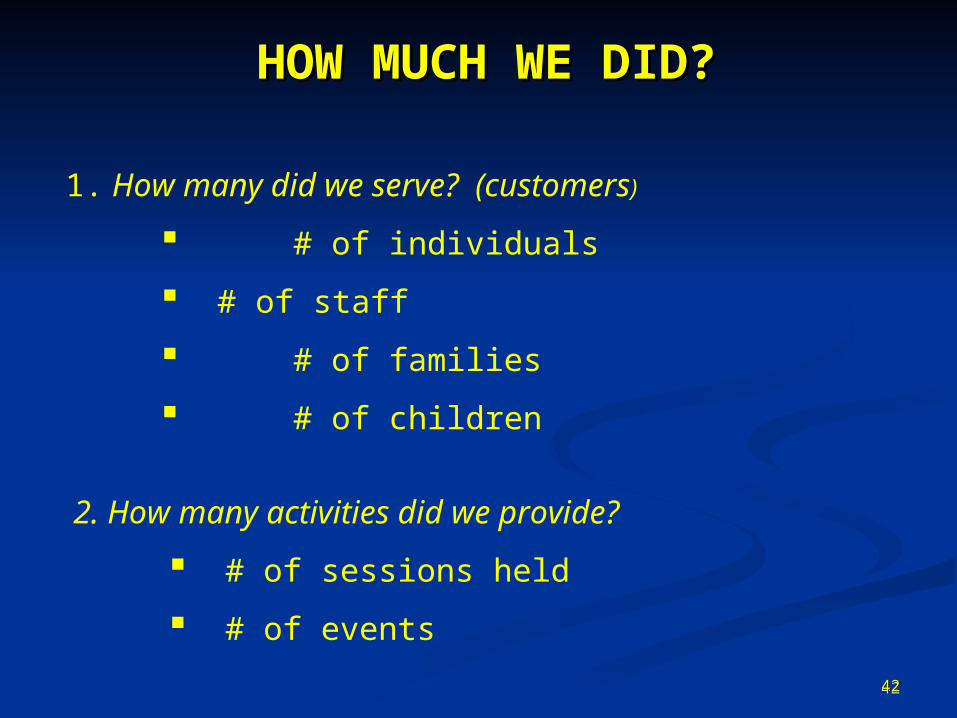
HOW MUCH WE DID?HOW MUCH WE DID?
1. How many did we serve? (customers)
# of individuals
# of staff
# of families
# of children
2. How many activities did we provide?
# of sessions held
# of events

434343
HOW WELL DID WE DO?HOW WELL DID WE DO? Quality of Effort Quality of Effort (TASCS)(TASCS)
1. Are our efforts Timely? % of referrals completed in 24 hours 2. What are the completion or Attendance rates? % new workers completing training 3. Are our customers Satisfied? % of employers satisfied with job hires 4. What are the Costs per unit? $400 per jobs skills training session held
5. What are professional or organizational Standards? Worker to Coaches ratio (10 to 1)

44
IS ANYONE BETTER OFF?IS ANYONE BETTER OFF?What difference did we make? What difference did we make? (BACKS)(BACKS)
1. What changes in Behaviors? (#/% of participants who report to work on time)
2. What changes in Attitudes? (#/% of participants who value seeking a degree)
3. What changes in Circumstances? (#/% of participants who have Employer supported Health Insurance at placement)
4. What changes occurred in Knowledge & SSkills?
(#/% of participants who have job advancement)
45
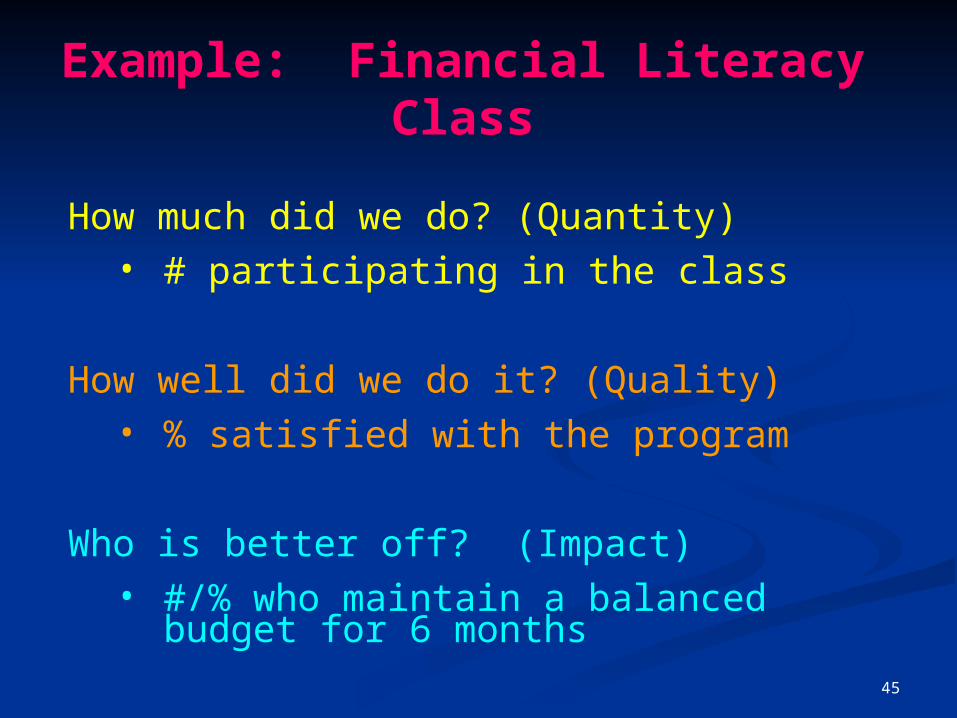
Example: Financial Literacy Class
How much did we do? (Quantity)• # participating in the class
How well did we do it? (Quality)• % satisfied with the program
Who is better off? (Impact)• #/% who maintain a balanced budget
for 6 months

46
How Performance Measures How Performance Measures Fit TogetherFit Together
How Much
How Well
Better Off

47
How hard did we try?
Is anyone better off?
Program Performance Measures
Effort
Effect

48
HowMuchDid we do?
( # )
HowWell
Did we do it?
( % )
Quantity Quality
Performance MeasuresPerformance Measures
49
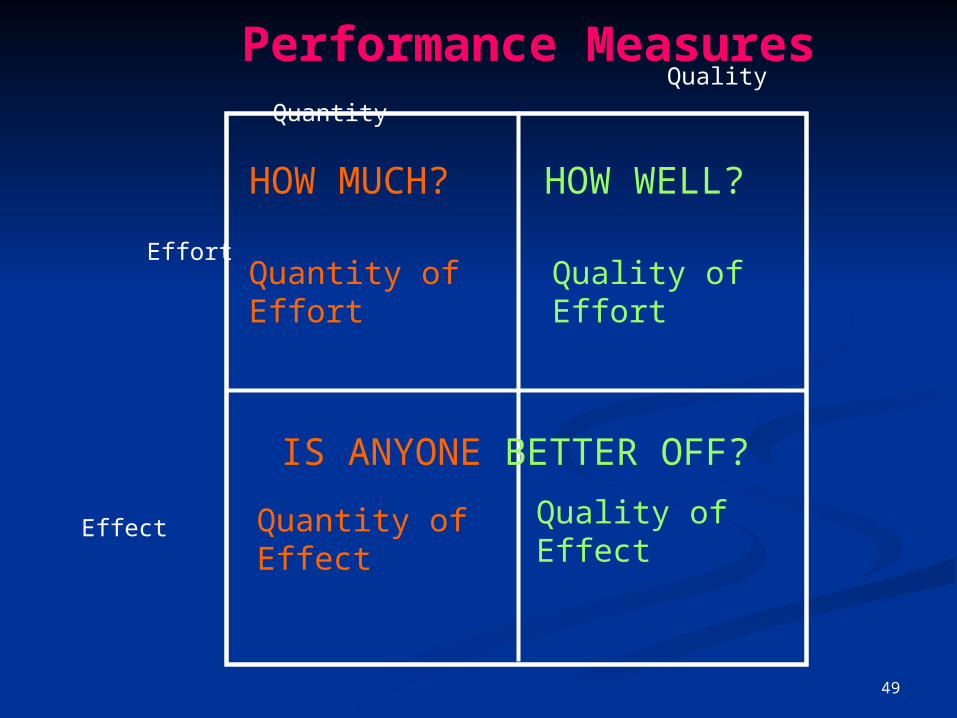
Performance Measures
Quality of Effort
Quantity of Effort
Quantity of EffectQuality of Effect
HOW MUCH? HOW WELL?
Quantity Quality
Effort
Effect
IS ANYONE BETTER OFF?

505050
How much service did we deliver?
#
Performance Measures
How welldid we
deliver it?
%
How much change / effect
did we produce?
#
What quality of change / effect did we produce?
%
Quantity Quality
Effe
ct
Effo
rt
O
utpu
t
In
put
What ways – Better offWhat ways – Better off

51
How much did we do?
Asset Development Policy Program
How well did we do it?
Is anyone better off?
Quantity Quality
E
ffect
E
ffort # of
policies proposed % of policies enacted through legislation or
Executive Order
# of organizations changing or initiating new practices; expanding or starting programs; or increasing funding
% of organizations initiating or expanding
practices, programs or funding

525252
How much did we do?
Performance Measures Are NOT Equal
How well did we do it?
Is anyone better off?
LeastImportant
2nd MostImportant
3rd MostImportant Most
Important
53
What are the Steps What are the Steps toto
Taking Action?Taking Action?

54
7 Questions of Performance 7 Questions of Performance AccountabilityAccountability
1.1. Who are our Who are our customerscustomers? ? 2.2. How can we measure if our How can we measure if our customers customers
are better off?are better off?3.3. How can we measure if we How can we measure if we deliver our deliver our
services well? services well? 4.4. How are we doing on these How are we doing on these measuresmeasures? ?
the trendline – better, worse or the same?the trendline – better, worse or the same? what is the story behind the trendline data?what is the story behind the trendline data?
5.5. Who are the Who are the partnerspartners??6.6. What What worksworks to improve progress for our to improve progress for our
customers? customers?
7.7. What What actions actions are we going to take?are we going to take?
555555
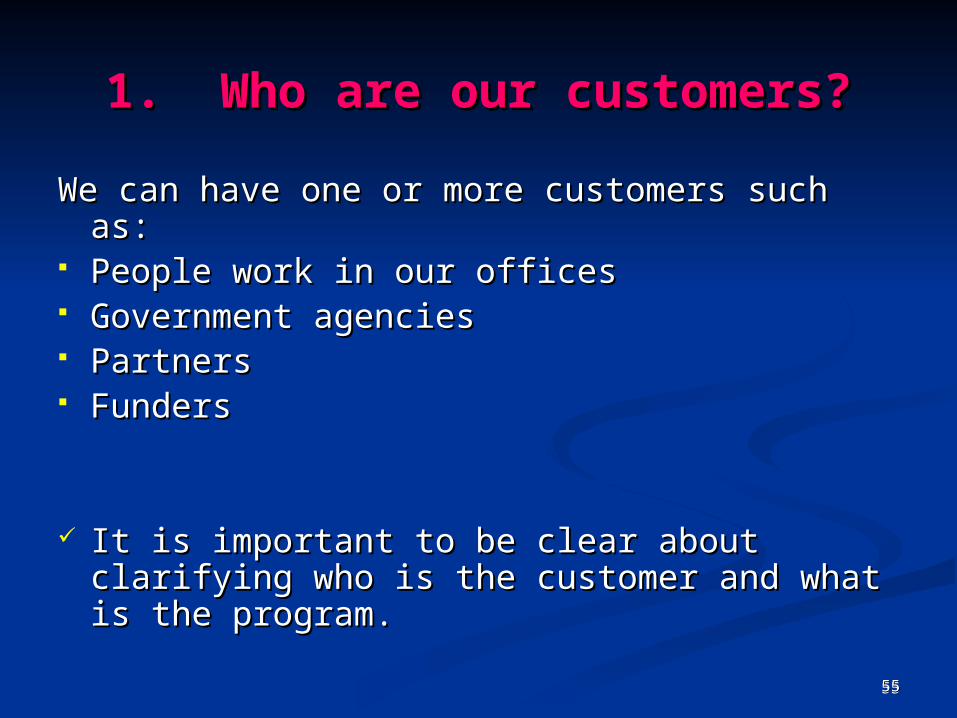
1. Who are our customers?1. Who are our customers?
We can have one or more customers such as: We can have one or more customers such as: People work in our officesPeople work in our offices Government agenciesGovernment agencies PartnersPartners Funders Funders
It is important to be clear about clarifying It is important to be clear about clarifying who is the customer and what is the who is the customer and what is the program. program.
56
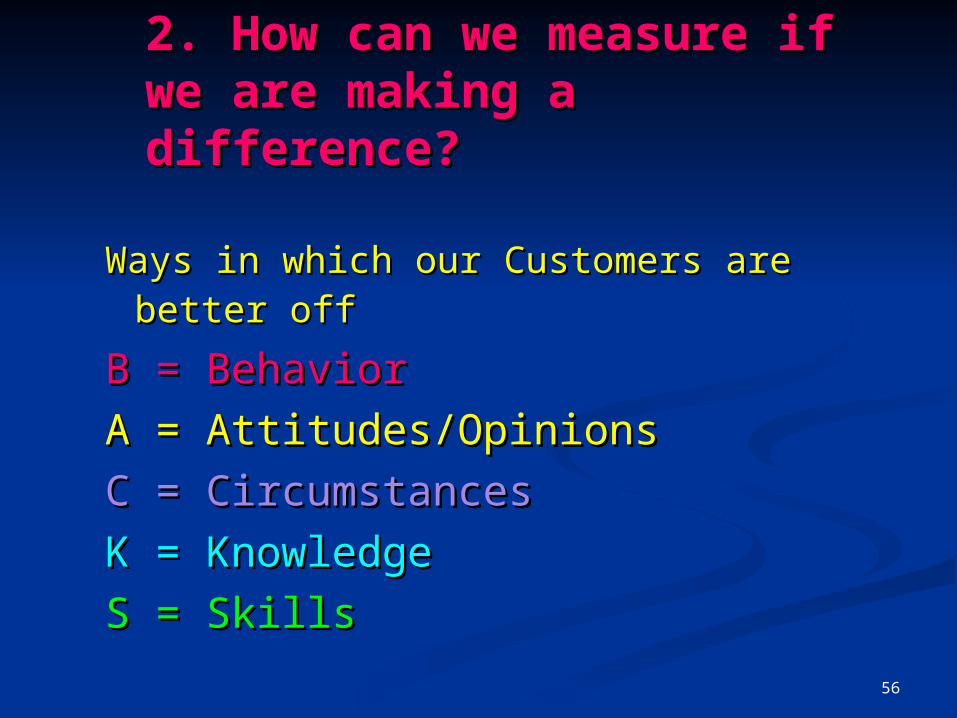
2. How can we measure if 2. How can we measure if we are making a we are making a difference?difference?
Ways in which our Customers are better Ways in which our Customers are better offoff
B = BehaviorB = Behavior
A = Attitudes/OpinionsA = Attitudes/Opinions
C = Circumstances C = Circumstances
K = KnowledgeK = Knowledge
S = SkillsS = Skills

57
3. How can we measure if we 3. How can we measure if we deliver deliver our services well? our services well?Identify common or program specific Identify common or program specific
measures such asmeasures such as: : TTimeliness imeliness AAttendance ttendance SSatisfaction atisfaction CCosts per unit osts per unit SStandards tandards (TASCS)(TASCS)

585858
4. How are we doing on these measures? What factors are pushing the trendline up & down?What factors are pushing the trendline up & down?
Trendlines have two parts: History
History Forecast
and Forecast
TrendlineTrendline? Better? Better? Same? Same? Worse? Worse
59
5. Who are the partners?5. Who are the partners?
Who are partners that can contribute?Who are partners that can contribute?
Who can we recruit now to move the Who can we recruit now to move the work forwardwork forward??
606060
6. What works to do better to 6. What works to do better to
improve the performance measure? improve the performance measure?
What do we think would be effective to make a What do we think would be effective to make a difference difference –– to improve the identified to improve the identified ““better better offoff”” or or ““how wellhow well”” performance measure? performance measure?
What do we know from research, best and What do we know from research, best and promising practices or our experiences?promising practices or our experiences?
Why do we think that these strategies are Why do we think that these strategies are powerful enough to make an impact?powerful enough to make an impact?
61
7. What actions are we 7. What actions are we going to take?going to take?
What actions are we going to take? What actions are we going to take?
Who is going to do what? Who is going to do what?
What is the timeline?What is the timeline?
When will we collect the data, review the data When will we collect the data, review the data to track whether the actions are working? to track whether the actions are working?

62
Three Points of Fit Three Points of Fit between between
Population and Population and Performance Performance
Accountability Accountability

63
The Connection ofThe Connection of PopulationPopulation && PerformancePerformance
AccountabilityAccountabilityResults
Indicators
Strategies
Performance Measures
Pop
ulat
ion
Perform
ance

64
Contributionrelationship
Alignmentof measures
Appropriateresponsibility
THE LINKAGE Between POPULATION and PERFORMANCE
POPULATION ACCOUNTABILITY
Healthy Births Rate of low birth-weight babiesChildren Ready for School Percent fully ready per K-entry assessmentSelf-sufficient Families Percent of parents earning a living wage
CUSTOMERRESULTS
# personsreceivingtraining
Unit costper person
trained
# who getliving wage jobs
% who getliving wage jobs
PERFORMANCE ACCOUNTABILITY
POPULATIONRESULTS
Job Training Program

65

66
ResourcesResources
Mark Friedman’s
Fiscal Policy Studies Institute
www.resultsaccountability.com www.raguide.org