1 visualization solutions for effective communication warren c. weber california state polytechnic...
Post on 22-Dec-2015
214 views
TRANSCRIPT

1
Visualization Solutions for Visualization Solutions for Effective CommunicationEffective Communication
Warren C. Weber
California State Polytechnic University, Pomona

2
Escaping “Flatland”Escaping “Flatland”
• We are caught up in a two-dimensional world which we need to escape (letters, reports, e-mail)
• We need to envision information that is complex and multivariate
• We must try to enrich the density of data displays
3
Purposes of this PresentationPurposes of this Presentation
• Explain the nature of “visualization”• Examine techniques of designing
information• Provide examples of visualization
tools and techniques• Suggest visualization techniques for
training and education

4
What is Visualization?What is Visualization?
1. Forming mental images or pictures to make things and ideas more perceptible to the mind or imagination. (“A picture is worth a thousand words”)
2. Exploring data, information, and processes graphically to understand and gain insight

5
Directing the Directing the “movies of your mind” “movies of your mind”
• Create mental images which can be transformed into reality
• To say “I see!” is to mean “I understand”

6
Positive Mental ImageryPositive Mental Imagery
• Athletes• Dick Fosbury—high jumper
• Business Deals• Onassis, Hilton
• “Think and Grow Rich”
• “The Power of Positive Thinking”

7
The Communicator’s TaskThe Communicator’s Task
• Communicators should make it easy for others to visualize the reality of the way things are.
• Transform data and information into forms (graphic) that can be quickly and effectively understood
• Aid others in understanding real-world situations clearly

8
Two Aspects of VisualizationTwo Aspects of Visualization
1. More effective use of traditional graphics (figures, graphs, tables)
2. Capitalizing on “scientific visualization” techniques to gain insight and understanding into data and processes

9
Evolving Communication Evolving Communication TechniquesTechniques
• Traditional
• Improved
• Visualization Rich

10
Level A—TraditionalLevel A—Traditional
• Oral (speaking)
• Written (letters, reports, memorandums)
• Numbers
• Typography
• Drawings
• Statistics
• Managing Data Sets

11
Level B—ImprovedLevel B—Improved
• Telecommunications
• Tables
• Figures, Graphs, Photography
• Moving Pictures
• Multivariate Statistical Analysis

12
Level C—Visualization RichLevel C—Visualization Rich
• Digital Sound Processing
• V-Mail
• Simulations
• Stereoscopic (3-D) Images
• Metamorphosis
• Holography
• Virtual Reality

13
Presentation Graphics vs. Presentation Graphics vs. VisualizationVisualization
• Presentation Graphics—Communicating results already understood
• Visualization—Seeking to understand and gain insight into data and processes

14
Envisioning InformationEnvisioning Information
• Work at the intersection of Image, Word, Number, and Art
Image
Word Number
Art
Envisioning
Information

15
Developing Effective Developing Effective Visual DisplaysVisual Displays
• Transform raw data into pictures and words
• Utilize writing, typography, managing data sets, statistical analysis, and basic rules of design
• Simultaneously present words, numbers, and pictures

16
Graphical ExcellenceGraphical Excellence
• Well-designed presentation of interesting data
• Complex ideas communicated with clarity, precision, and efficiency
• Greatest number of ideas in shortest time with least ink in the smallest space
• Multivariate• Telling the truth about the data
17
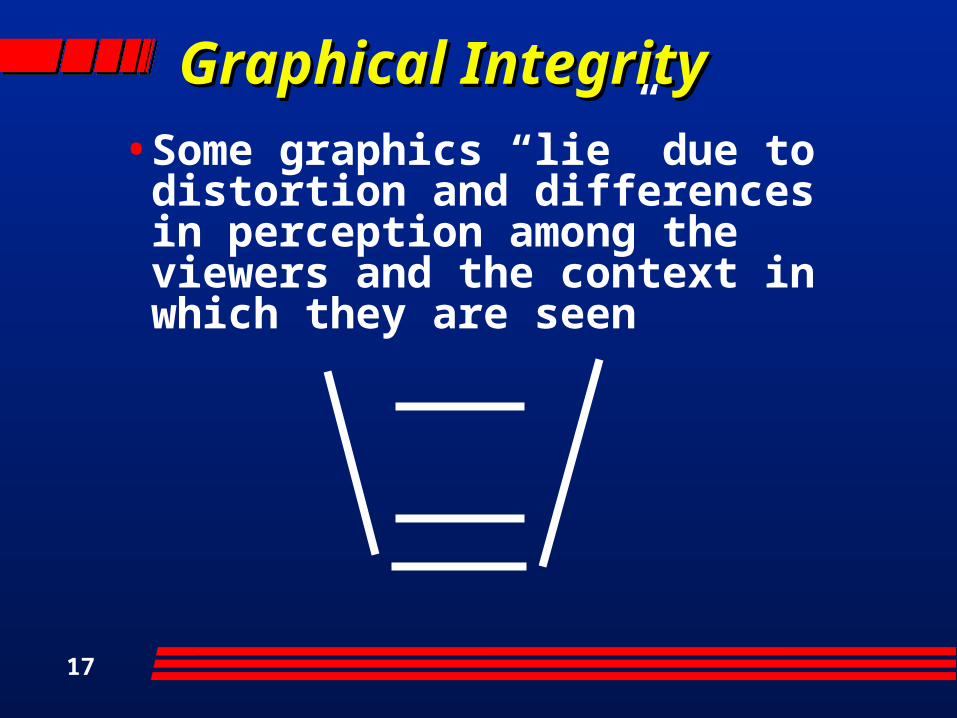
Graphical IntegrityGraphical Integrity• Some graphics “lie” due to distortion
and differences in perception among the viewers and the context in which they are seen

18
The “Lie” FactorThe “Lie” Factor
Size of Effect Shown in Graphic
Size of Effect in Data=

19
Skills Required to Skills Required to Produce Good GraphicsProduce Good Graphics
• Substantive
• Statistical
• Artistic

20
Computers Allow Easy Computers Allow Easy Preparation of GraphsPreparation of Graphs
• But, there is a tendency to use computers without the statistical or artistic knowledge of what makes a good graph
21
Small MultiplesSmall Multiples
• Showing complex data in a relatively small area—allow viewer to see large amounts of data at once

22
Aesthetics and TechniqueAesthetics and Technique
• Good format and design• Use words, numbers, and drawing
together• Balance, proportion, relevant scale• Accessible complexity of detail• Narrative quality—tell a story• Avoid unnecessary decoration or
“chartjunk”
23
““Friendly” GraphicsFriendly” Graphics
• Words spelled out• Labels placed on the graphic• Graphic attracts viewers,
provokes curiosity• Colors chosen so that even color-
deficient and color-blind can understand
• Type clear, precise, modest. Upper/lower case, with serifs

24
Column ChartColumn Chart
0
10
20
30
40
50
60
70
80
90
1st Qtr 2nd Qtr 3rd Qtr 4th Qtr
EastWestNorth

25
Area ChartArea Chart
020406080
100120140160180
1st Qtr 2nd Qtr 3rd Qtr 4th Qtr
NorthWestEast
26
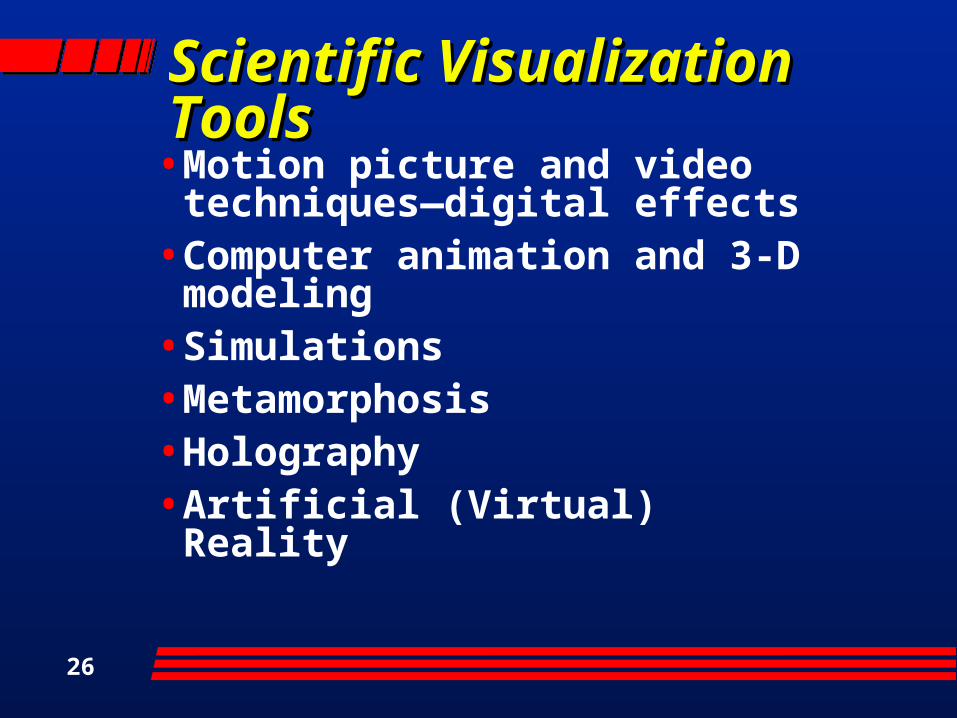
Scientific Visualization ToolsScientific Visualization Tools
• Motion picture and video techniques—digital effects
• Computer animation and 3-D modeling
• Simulations• Metamorphosis• Holography• Artificial (Virtual) Reality

27
Uses of Scientific Visualization Uses of Scientific Visualization
• Previously unseen or understood phenomena and processes
• Design—automobiles, airplanes, clothing
• Cosmetic surgery, hairstyling• Weather forecasting, oil, space, and
mineral exploration• Crime reënactment
28
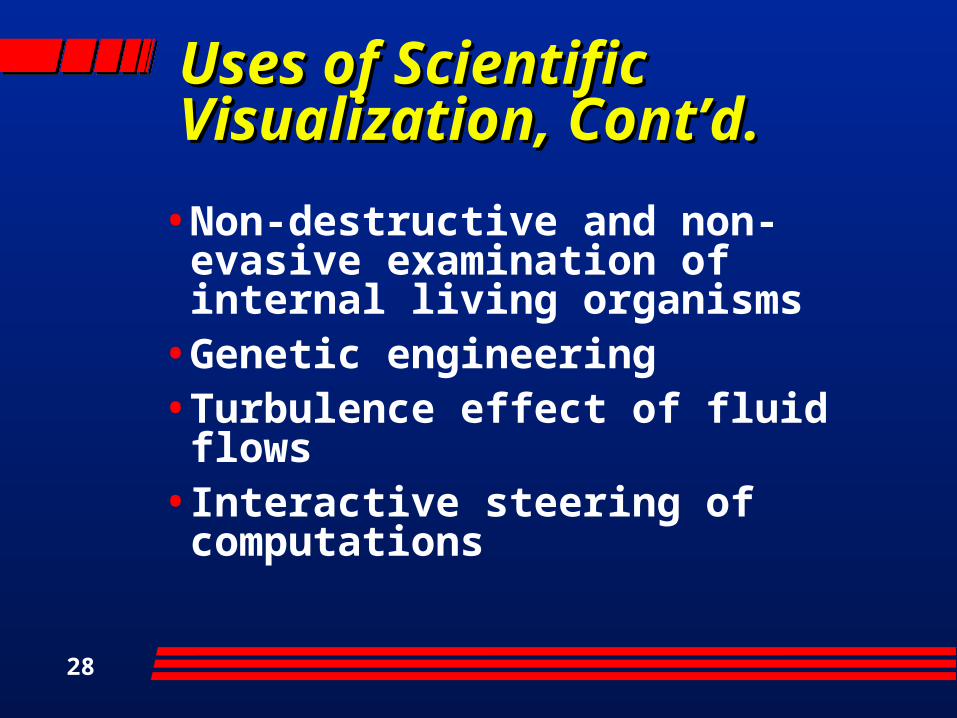
Uses of Scientific Uses of Scientific Visualization, Cont’d.Visualization, Cont’d.
• Non-destructive and non-evasive examination of internal living organisms
• Genetic engineering• Turbulence effect of fluid flows• Interactive steering of
computations

29

30

31
32

33

34

35

36

37

38

39

40

41

42
a
43
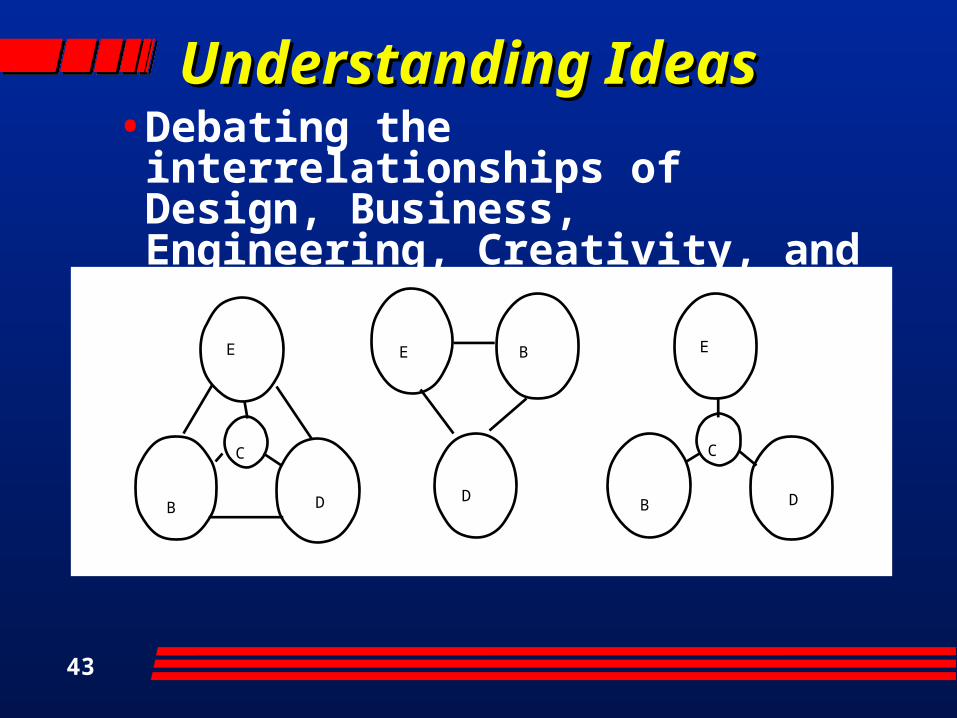
Understanding IdeasUnderstanding Ideas• Debating the interrelationships of
Design, Business, Engineering, Creativity, and Quality
E B
D
E
B D
C
E
B D
C

44
Training Objectives for Training Objectives for Improving VisualizationImproving Visualization
• Perception• Basic statistical and computer
concepts • Basic design principles• Principles of graphical excellence,
integrity, and aesthetics• Examples of visualization
hardware and software

45
RecommendationsRecommendations
• Avoid thinking in “two-dimensional flatland” and include 3-D concepts in education
• Help learners envision complex, multivariate data and processes more easily by involving these concepts in education.

46
Have you visualized Have you visualized some . . .some . . .
Questions? ?