1 today evaluating projects –making investment decisions with the net present value rule reading...
Post on 21-Dec-2015
218 views
TRANSCRIPT

1
Today
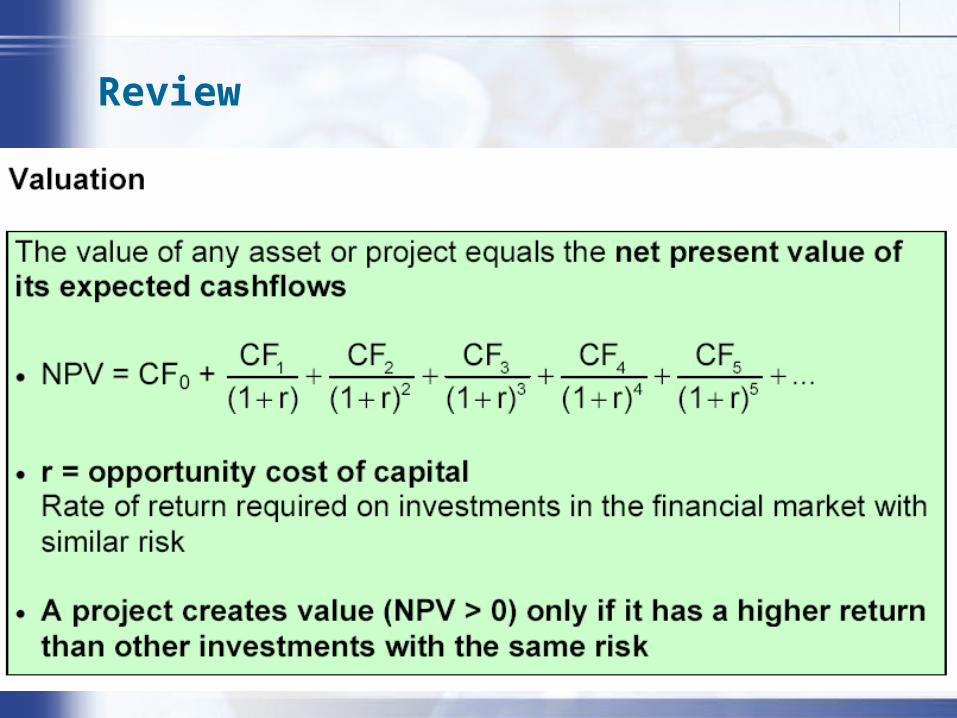
• Evaluating projects– Making Investment Decisions With the
Net Present Value Rule
• Reading– Brealey, Myers, and Allan, Chapters 6 and
12.1 –12.3

2
Capital budgeting
What projects should the firm take?
‧Marketing and advertising‧R&D‧Choices among different production processes‧Expanding into new products, industries, or markets‧Investments in new technology‧Acquisitions
3
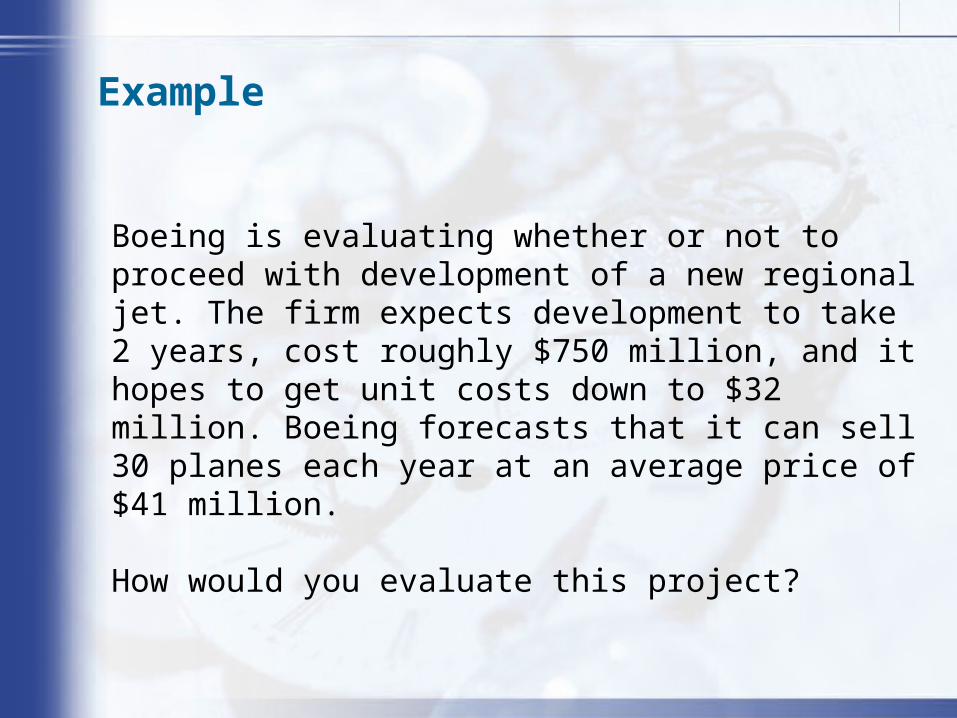
Example
Boeing is evaluating whether or not to proceed with development of a new regional jet. The firm expects development to take 2 years, cost roughly $750 million, and it hopes to get unit costs down to $32 million. Boeing forecasts that it can sell 30 planes each year at an average price of $41 million.
How would you evaluate this project?
4
Review
5
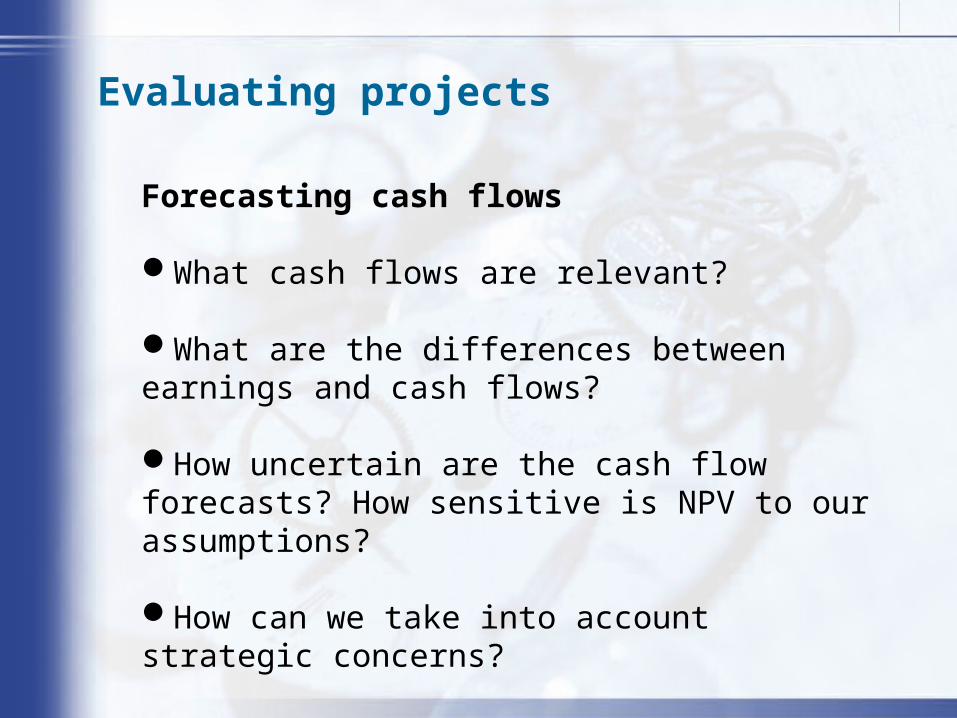
Evaluating projects
Forecasting cash flows
What cash flows are relevant?
What are the differences between earnings and cash flows?
How uncertain are the cash flow forecasts? How sensitive is NPV to our assumptions?
How can we take into account strategic concerns?
6
• Cash flow vs. accounting profit– Accrual base– Current expenses vs. capital expenses

7
Measuring cashflows
•Incremental cash flows•The difference between the firm’s overall cashflows with and without the project, including any competitive or strategic side effects

8
Measuring cash flows
Considerations‧Sunk cost ‧Project interactions‧Opportunity costs ‧inflation‧Average vs. marginal costs ‧Investments in working capital‧Depreciation ‧Taxes‧Real options ‧Projects with different lives
9
Measuring cash flows 1
Example
•Motorola has the opportunity to supply 5,000 cell phones to the Summer Olympics. The accounting department estimates that each phone costs $15 to make, of which $5 represents overhead and $10 represents labor and materials. What is the cost of the sponsorship deal?
•蚊子館 : 建造成本 25 億 , 閒置 3 年 , 建議花 5 億整修 , 改造成展覽館 ? 妳的看法 ?
10
Measuring cash flows 2
Example
Modigliani Import Co. owns an empty warehouse in Boston. The warehouse cost $200,000 to build and has a current value of $250,000. MIC would like to import a new line of Italian lamps, which will be stored in the warehouse. What is the cost of the warehouse space?
11
Opportunity costs, cont.
Example 2
Boeing is evaluating a new regional jet. If it proceeds with development, the firm will have to invest $200 million next year in R&D. The cash is currently invested in short-term securities yielding 2%.
An accounting executive argues that the project should becharged for lost interest, amounting to $4 million per year ($200 million × 0.02). Is he right?

12
Measuring cash flows 3
Example
Boeing is negotiating with Air Canada over the price of 20 new 737s. Air Canada offers $40 million per plane. Based on past data, Boeing estimates that the average cost of a new 737 is $30 million in labor and materials. How valuable is the Air Canada offer?
13
Measuring cash flows 4
Project interactions
ExampleWegmans, a supermarket chain based in Rochester, NY, is thinking about installing movie rental centers in its stores. Each rental center costs $80,000 to build, and Wegmans forecasts that profits will be $7,000 in perpetuity. If the discount rate is 10%, should Wegmans go ahead with the plan?

14
Project interactions, cont.
Example 2
Boeing is evaluating a new regional jet. The firm expectsdevelopment to take 2 years and cost roughly $750 million.Boeing forecasts sales of 30 planes per year and expects profits of $9 million on each sale.
Example 3
Baldwin, a profitable widget maker, has developed a product called the Turbo-Widget (TW). Baldwin has invested $300,000 in R&D to develop TWs, and expects that TWs will capture a large share of the market.
15
Measuring cash flows 5
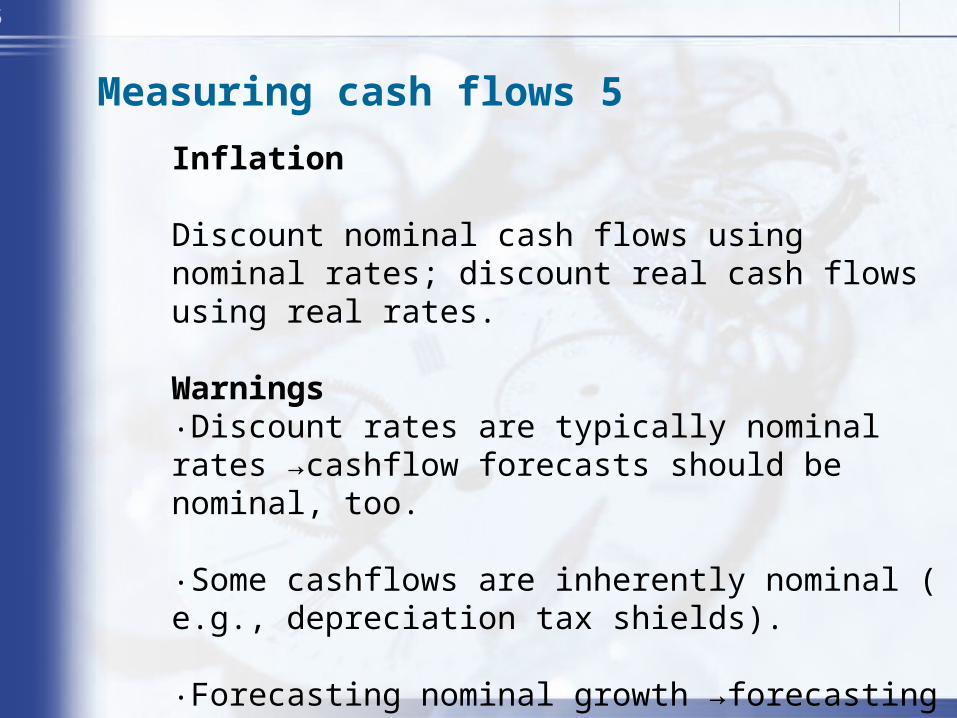
Inflation
Discount nominal cash flows using nominal rates; discount real cash flows using real rates.
Warnings‧Discount rates are typically nominal rates →cashflow forecasts should be nominal, too.
‧Some cashflows are inherently nominal ( e.g., depreciation tax shields).
‧Forecasting nominal growth →forecasting real growth + inflation.

16
Measuring cashflows 6
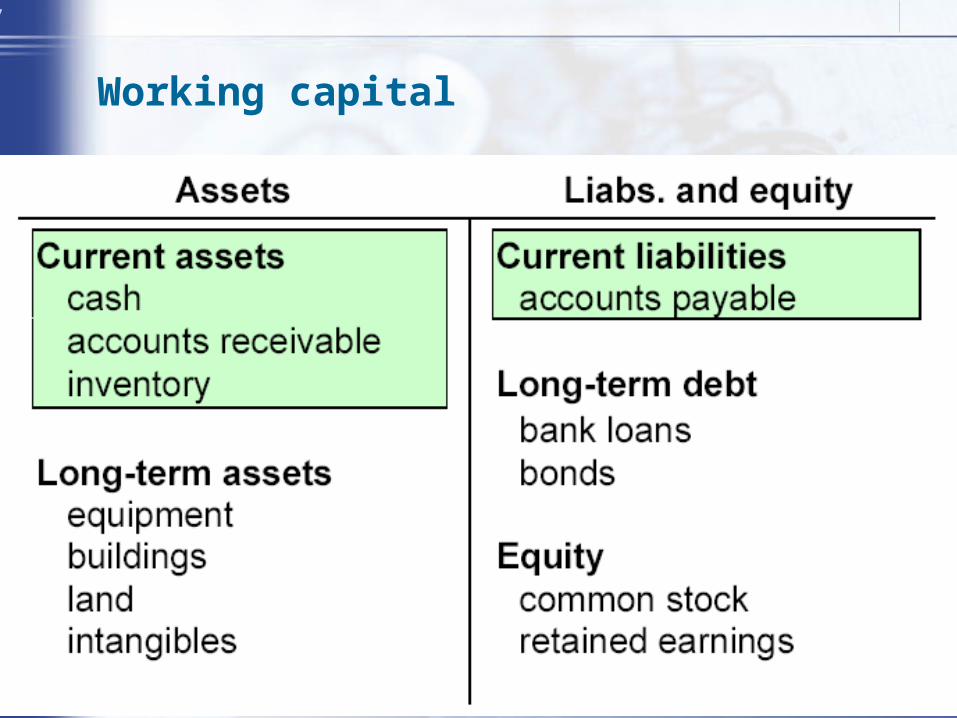
Working capital
Short-term assets and liabilities that the firm generates in the course of doing business.
Current assets – inventory, accounts receivable, cashCurrent liabilities – accounts payable
17
Working capital
18
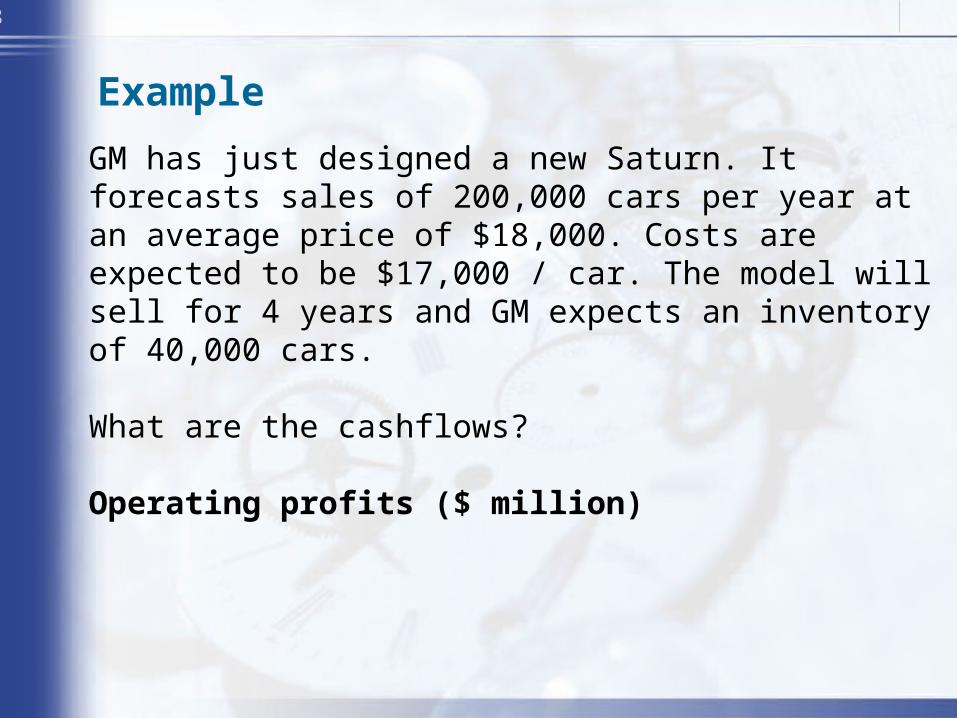
Example
GM has just designed a new Saturn. It forecasts sales of 200,000 cars per year at an average price of $18,000. Costs are expected to be $17,000 / car. The model will sell for 4 years and GM expects an inventory of 40,000 cars.
What are the cashflows?
Operating profits ($ million)

19
Example, cont.
What are the cashflows?
20
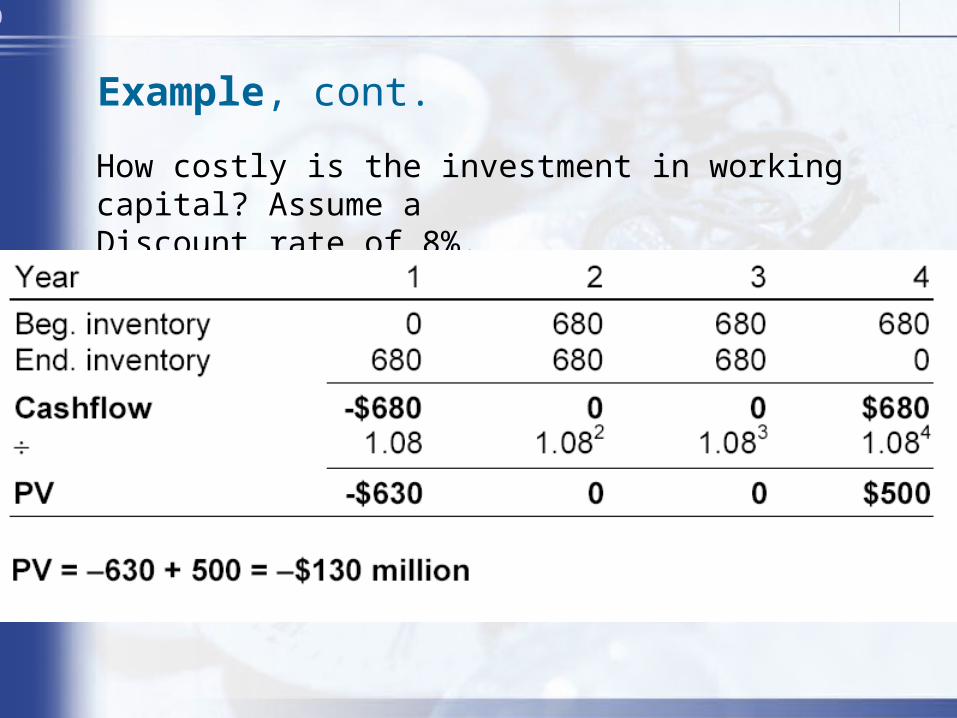
Example, cont.
How costly is the investment in working capital? Assume aDiscount rate of 8%.
21
Measuring cashflows 7
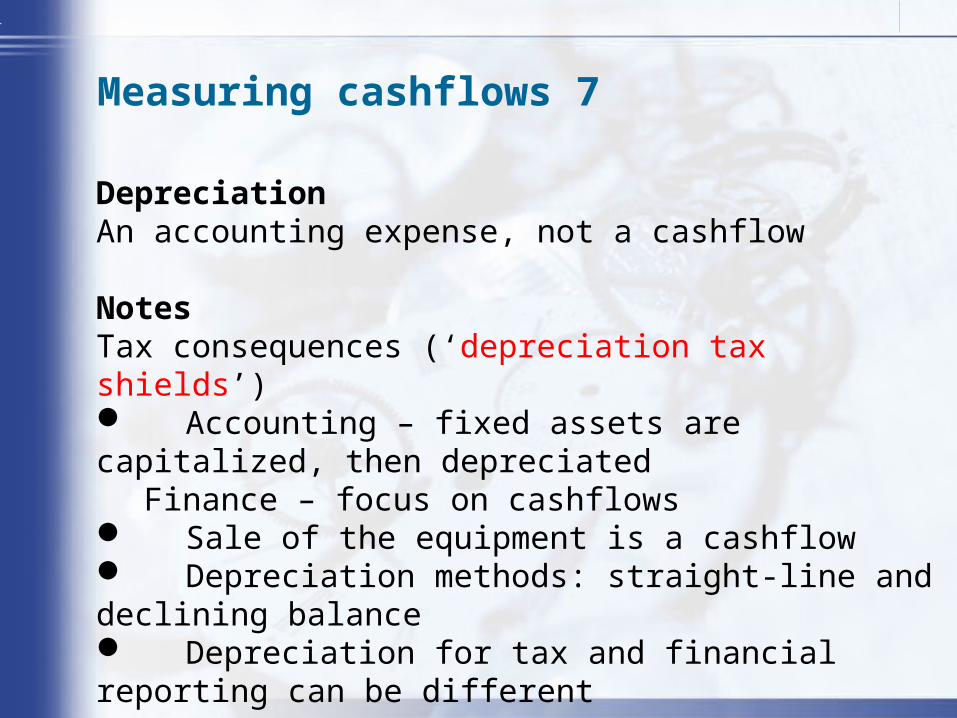
DepreciationAn accounting expense, not a cashflow
NotesTax consequences (‘depreciation tax shields’) Accounting – fixed assets are capitalized, then depreciated
Finance – focus on cashflows Sale of the equipment is a cashflow Depreciation methods: straight-line and declining balance Depreciation for tax and financial reporting can be different
22
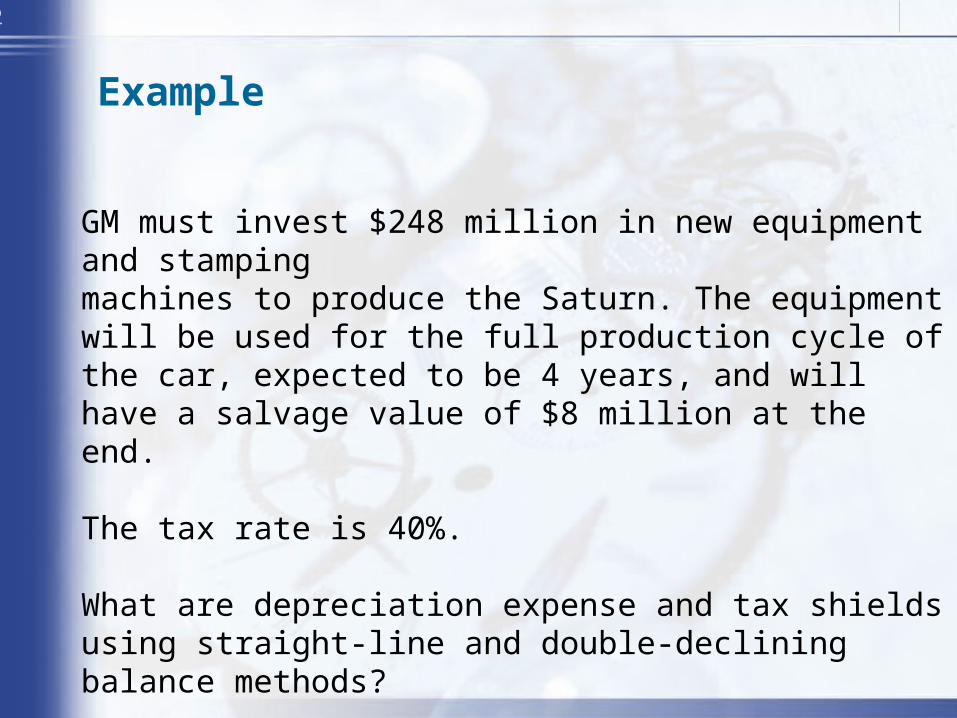
Example
GM must invest $248 million in new equipment and stampingmachines to produce the Saturn. The equipment will be used for the full production cycle of the car, expected to be 4 years, and will have a salvage value of $8 million at the end.
The tax rate is 40%.
What are depreciation expense and tax shields using straight-line and double-declining balance methods?

23
Example, cont.
Straight-line depreciationDepreciable value =248 million –8million =$240 millionAnnual depreciation =240 million /4=$60 million
24
Example, cont.
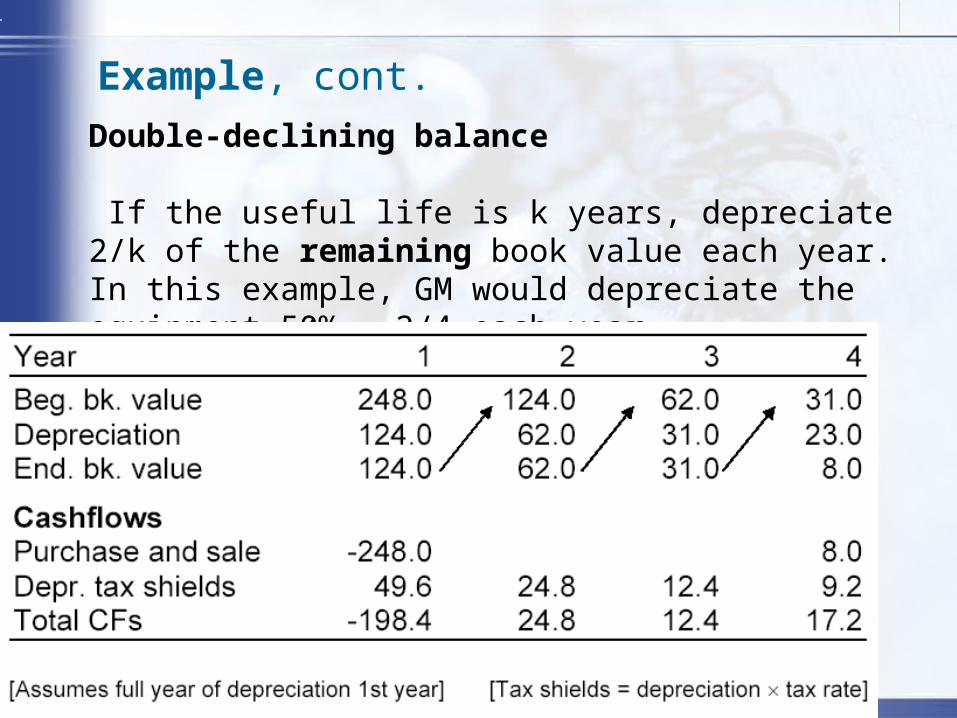
Double-declining balance
If the useful life is k years, depreciate 2/k of the remaining book value each year. In this example, GM would depreciate the equipment 50% = 2/4 each year.
25
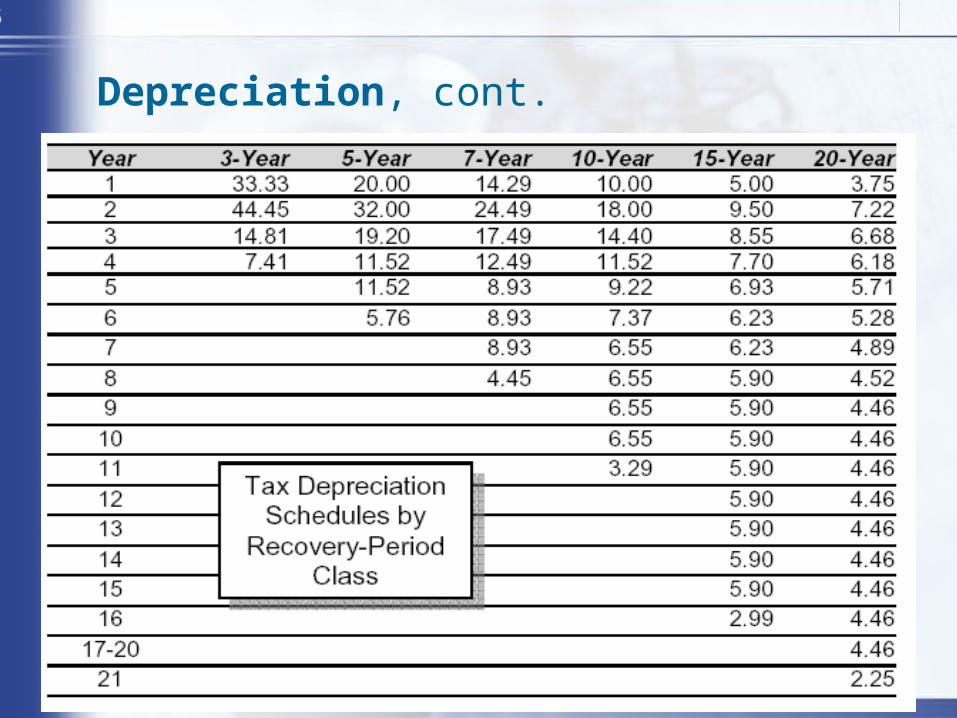
Depreciation, cont.

26
Example
Baldwin, a profitable widget maker, has developed an innovative new product called the Turbo-Widget (TW). Baldwin has invested $300,000 in R&D to develop TWs, and expects that TWs will capture a large share of the market.
ForecastsBaldwin will have to invest $2 million in new equipment. The machines have a 5-year useful life, with an expected salvage value of $250,000. The machines will require a major overhaul after 3 years, costing $100,000.
Over the five-year product life-cycle, unit sales are expected to be 5,000 units, 8,000 units, 12,000 units, 10,000 units, and 6,000 units. Prices in the first year will be $480, and then will grow 2% annually.

27
Turbo-Widgets, cont.
Sales and administrative costs will be $150,000 every year.Production costs will be $500 / unit in the first year, but will decline 8% annually.
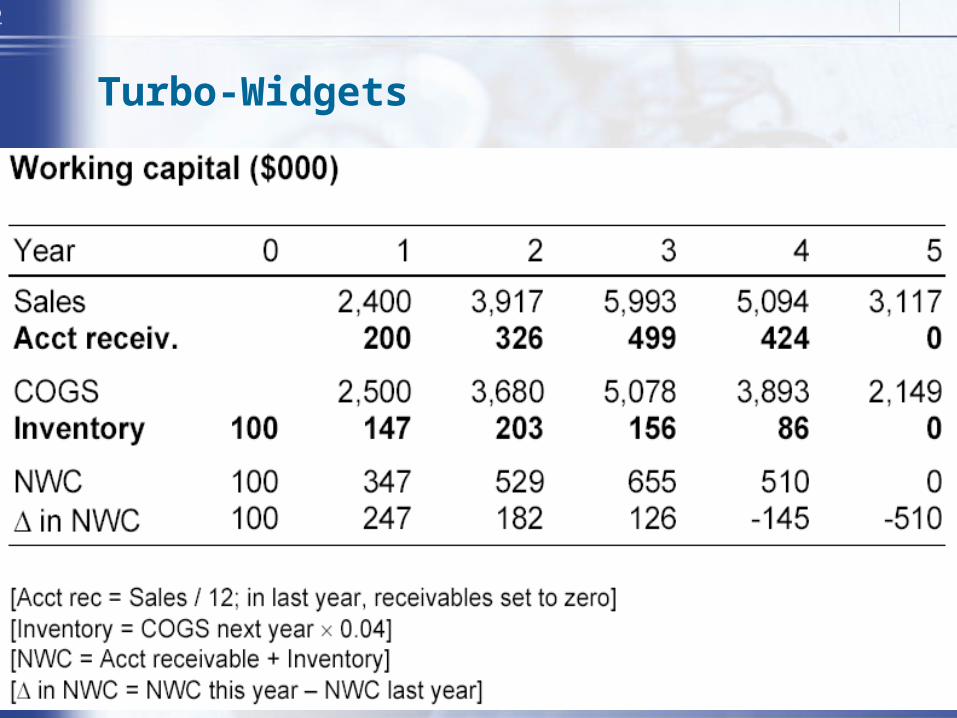
Baldwin must maintain approximately 2 weeks inventory of TWs, or 4% (2 / 52) of forecasted annual sales. Inventory can be stored in one of Baldwin’s existing warehouses. The firm estimates that inventory will require 3,000 square feet and warehouse space costs $80 / s.f. / year.

28
Turbo-Widgets, cont.
Customers don’t pay immediately. Baldwin expects to have 30days of sales outstanding as accounts receivable. Raw materials must be paid for immediately.
The tax rate is 34% and the after-tax cost of capital is 12%.
29
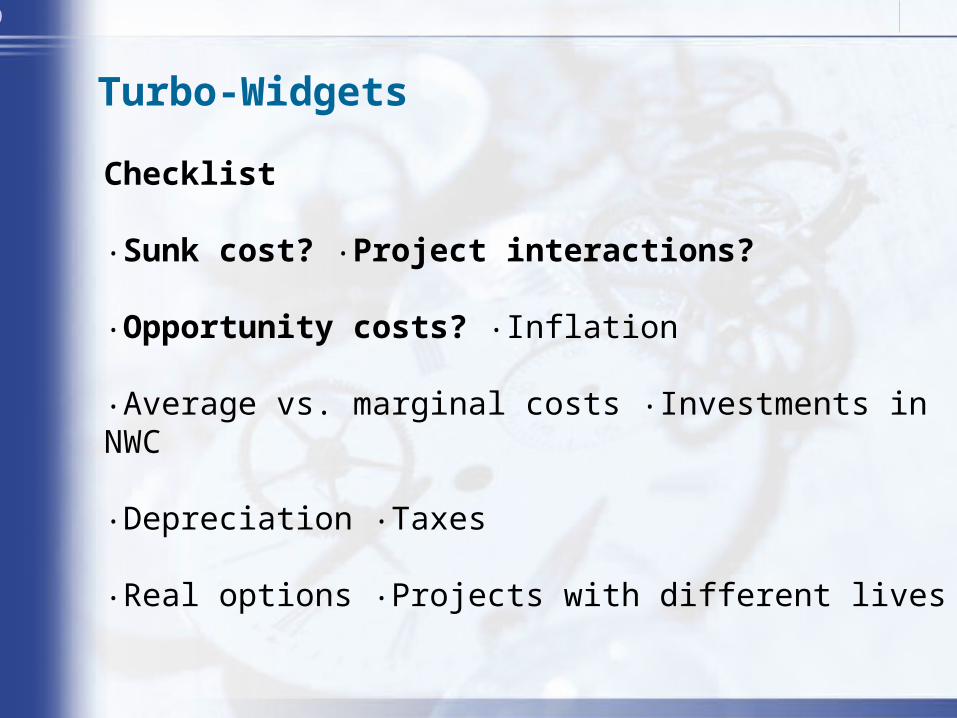
Turbo-Widgets
Checklist
‧Sunk cost? ‧Project interactions?
‧Opportunity costs? Inflation‧
‧Average vs. marginal costs Investments in NWC‧
‧Depreciation Taxes‧
‧Real options Projects with different lives‧

30
Turbo-Widgets

31
Turbo-Widgets
32
Turbo-Widgets
33
Turbo-Widgets
34
Turbo-Widgets
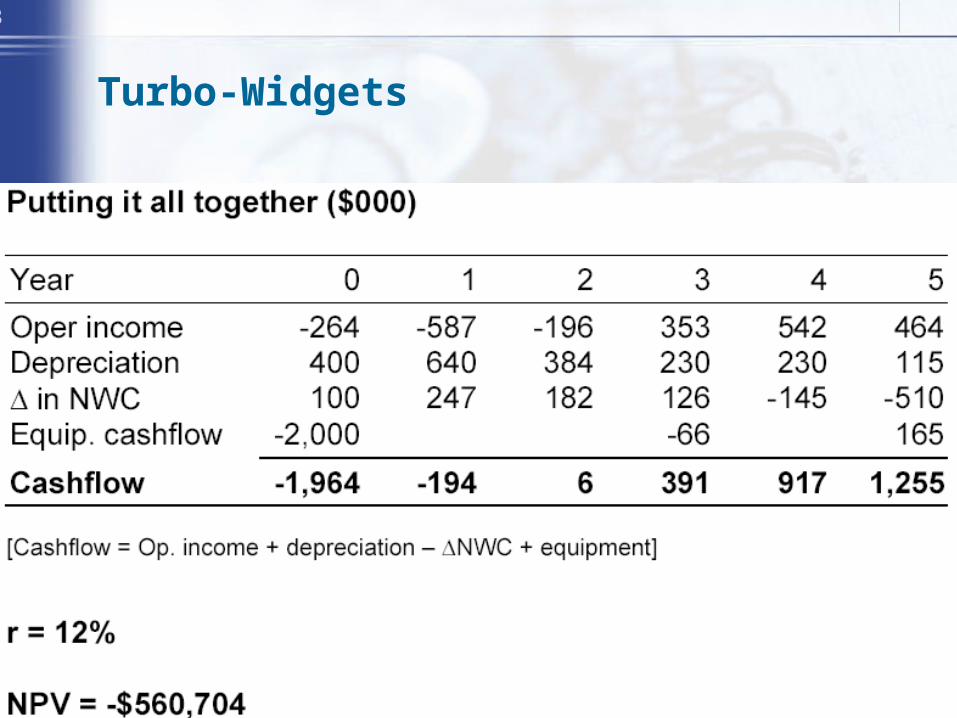
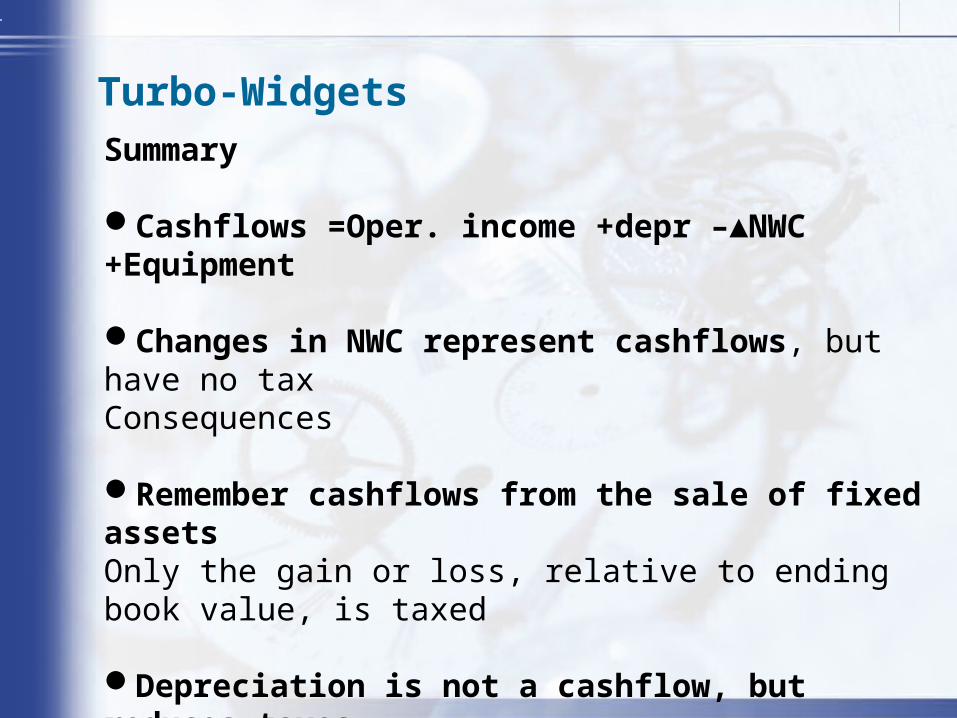
Summary
Cashflows =Oper. income +depr –▲NWC +Equipment
Changes in NWC represent cashflows, but have no taxConsequences
Remember cashflows from the sale of fixed assetsOnly the gain or loss, relative to ending book value, is taxed
Depreciation is not a cashflow, but reduces taxes
35
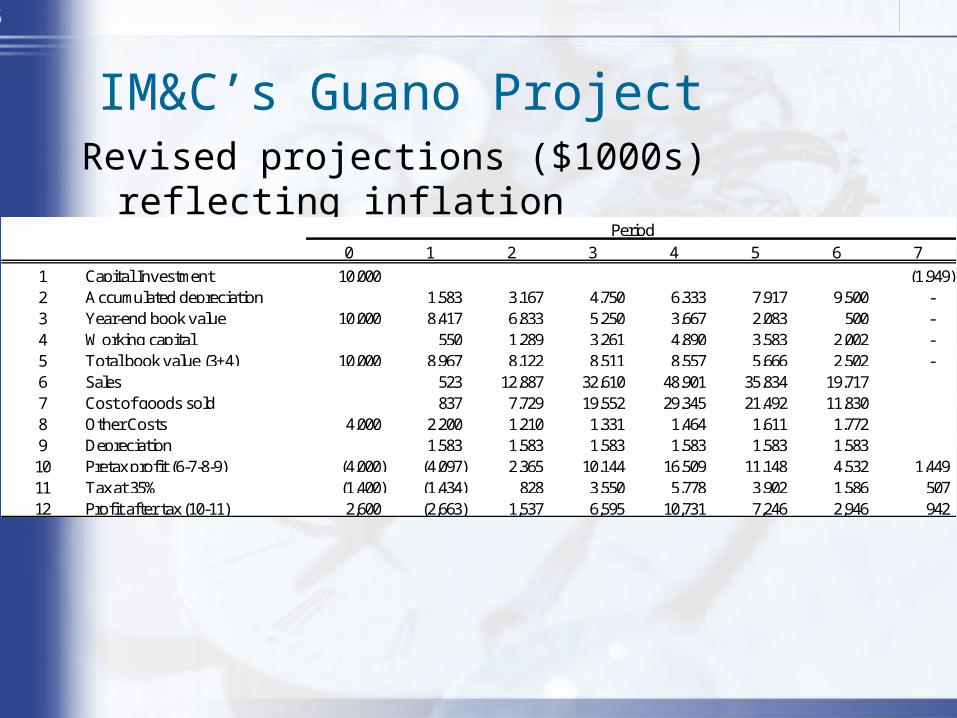
IM&C’s Guano ProjectRevised projections ($1000s) reflecting inflation
0 1 2 3 4 5 6 7
1 Capital Investment 10,000 (1,949) 2 Accumulated depreciation 1,583 3,167 4,750 6,333 7,917 9,500 - 3 Year-end book value 10,000 8,417 6,833 5,250 3,667 2,083 500 - 4 Working capital 550 1,289 3,261 4,890 3,583 2,002 - 5 Total book value (3+4) 10,000 8,967 8,122 8,511 8,557 5,666 2,502 - 6 Sales 523 12,887 32,610 48,901 35,834 19,717 7 Cost of goods sold 837 7,729 19,552 29,345 21,492 11,830 8 Other Costs 4,000 2,200 1,210 1,331 1,464 1,611 1,772 9 Depreciation 1,583 1,583 1,583 1,583 1,583 1,583 10 Pretax profit (6-7-8-9) (4,000) (4,097) 2,365 10,144 16,509 11,148 4,532 1,449 11 Tax at 35% (1,400) (1,434) 828 3,550 5,778 3,902 1,586 507 12 Profit after tax (10-11) 2,600 (2,663) 1,537 6,595 10,731 7,246 2,946 942
Period

36
IM&C’s Guano Project
• NPV using nominal cash flows
$3,520,000or 520,3
20.1
444,3
20.1
110,6
20.1
136,10
20.1
685,10
20.1
205,6
20.1
381,2
20.1
630,1000,12
76
5432
NPV

37
IM&C’s Guano Project
Cash flow analysis ($1000s)
0 1 2 3 4 5 6 71 Sales 523 12,887 32,610 48,901 35,834 19,717 2 Cost of goods sold 837 7,729 19,552 29,345 21,492 11,830 3 Other costs 4,000 2,200 1,210 1,331 1,464 1,611 1,772 4 Tax on operations (1,400) (1,434) 828 3,550 5,778 3,902 1,586
5Cash flow from operations (1-2-3-4) (2,600) (1,080) 3,120 8,177 12,314 8,829 4,529
6 Change in working capital (550) (739) (1,972) (1,629) 1,307 1,581 2,002 7 Capital investment and (10,000) 1,442 8 Net cash flow (5+6+7) (12,600) (1,630) 2,381 6,205 10,685 10,136 6,110 3,444 9 Present value at 20% (12,600) (1,358) 1,654 3,591 5,153 4,074 2,046 961
Period
Net Present value= +3520 (sum of 9)
38
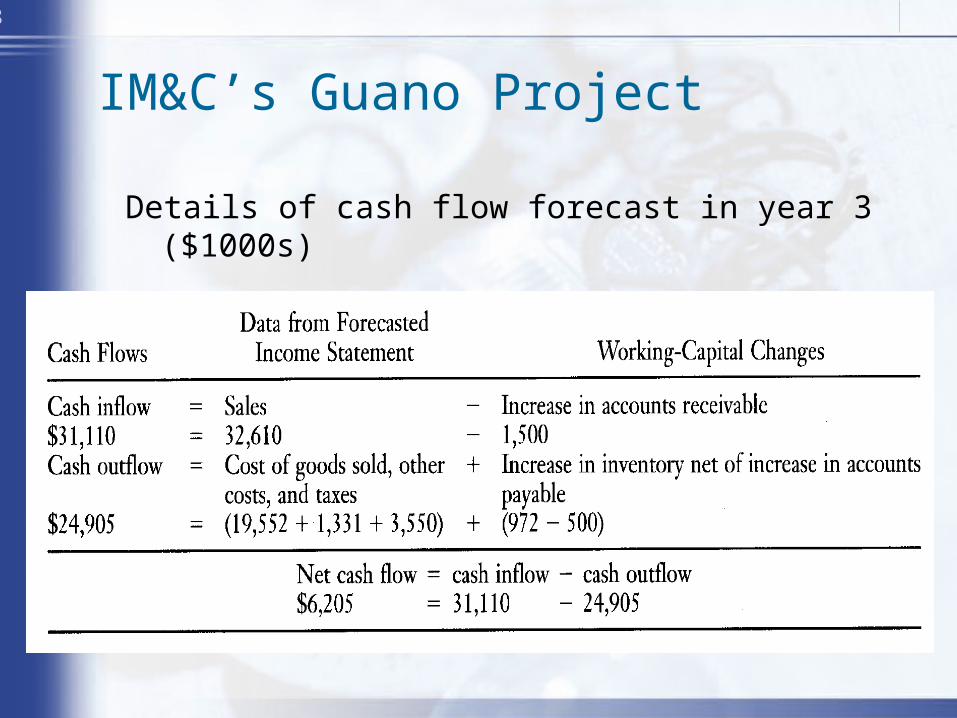
IM&C’s Guano Project
Details of cash flow forecast in year 3 ($1000s)
39
• Tax shield
• =depreciation * tax rate
40
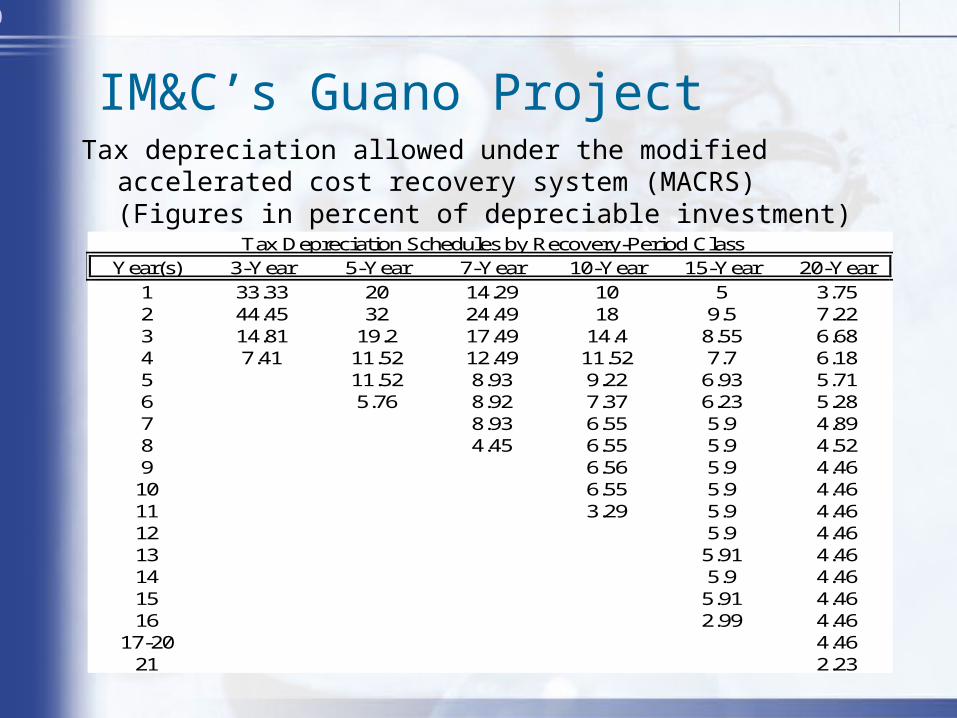
IM&C’s Guano ProjectTax depreciation allowed under the modified accelerated cost
recovery system (MACRS) (Figures in percent of depreciable investment)
Year(s) 3-Year 5-Year 7-Year 10-Year 15-Year 20-Year
1 33.33 20 14.29 10 5 3.752 44.45 32 24.49 18 9.5 7.223 14.81 19.2 17.49 14.4 8.55 6.684 7.41 11.52 12.49 11.52 7.7 6.185 11.52 8.93 9.22 6.93 5.716 5.76 8.92 7.37 6.23 5.287 8.93 6.55 5.9 4.898 4.45 6.55 5.9 4.529 6.56 5.9 4.46
10 6.55 5.9 4.4611 3.29 5.9 4.4612 5.9 4.4613 5.91 4.4614 5.9 4.4615 5.91 4.4616 2.99 4.46
17-20 4.4621 2.23
Tax Depreciation Schedules by Recovery-Period Class
41
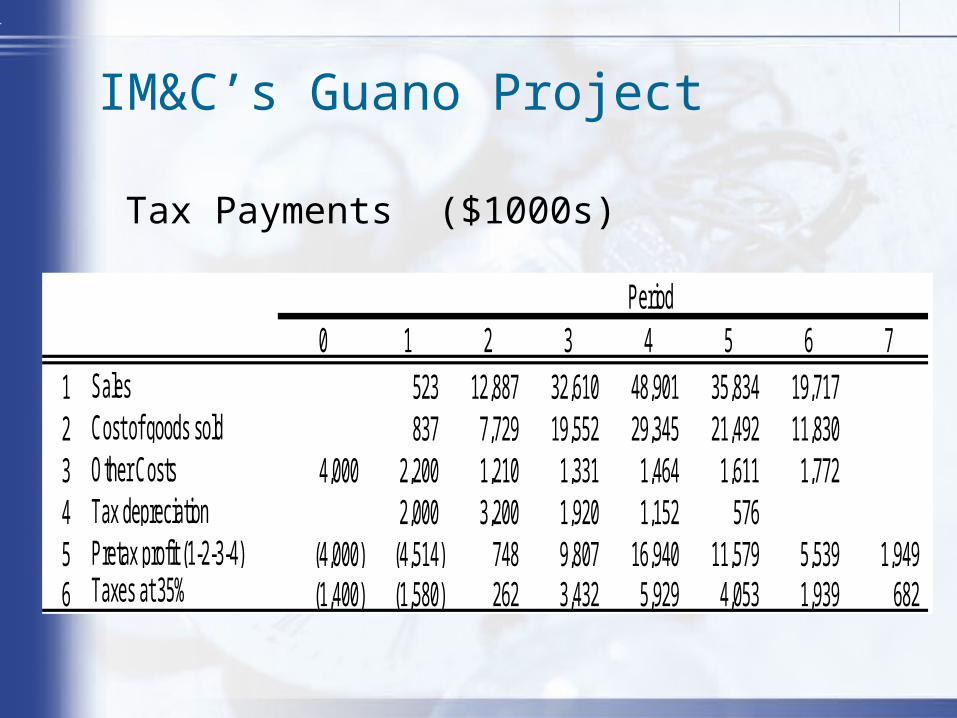
IM&C’s Guano Project
Tax Payments ($1000s)
0 1 2 3 4 5 6 71 Sales 523 12,887 32,610 48,901 35,834 19,717 2 Cost of goods sold 837 7,729 19,552 29,345 21,492 11,830 3 Other Costs 4,000 2,200 1,210 1,331 1,464 1,611 1,772 4 Tax depreciation 2,000 3,200 1,920 1,152 576 5 Pretax profit (1-2-3-4) (4,000) (4,514) 748 9,807 16,940 11,579 5,539 1,949 6 Taxes at 35% (1,400) (1,580) 262 3,432 5,929 4,053 1,939 682
Period
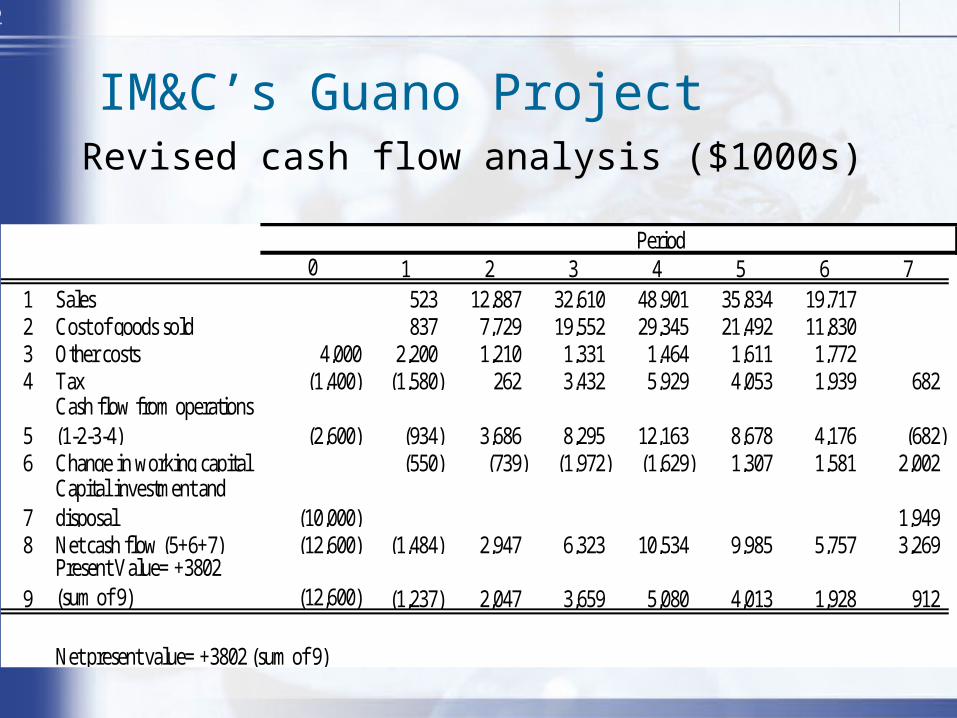
42
IM&C’s Guano ProjectRevised cash flow analysis ($1000s)
0 1 2 3 4 5 6 71 Sales 523 12,887 32,610 48,901 35,834 19,717 2 Cost of goods sold 837 7,729 19,552 29,345 21,492 11,830 3 Other costs 4,000 2,200 1,210 1,331 1,464 1,611 1,772 4 Tax (1,400) (1,580) 262 3,432 5,929 4,053 1,939 682
5Cash flow from operations (1-2-3-4) (2,600) (934) 3,686 8,295 12,163 8,678 4,176 (682)
6 Change in working capital (550) (739) (1,972) (1,629) 1,307 1,581 2,002
7Capital investment and disposal (10,000) 1,949
8 Net cash flow (5+6+7) (12,600) (1,484) 2,947 6,323 10,534 9,985 5,757 3,269
9Present Value= +3802 (sum of 9) (12,600) (1,237) 2,047 3,659 5,080 4,013 1,928 912
Period
Net present value= +3802 (sum of 9)

43
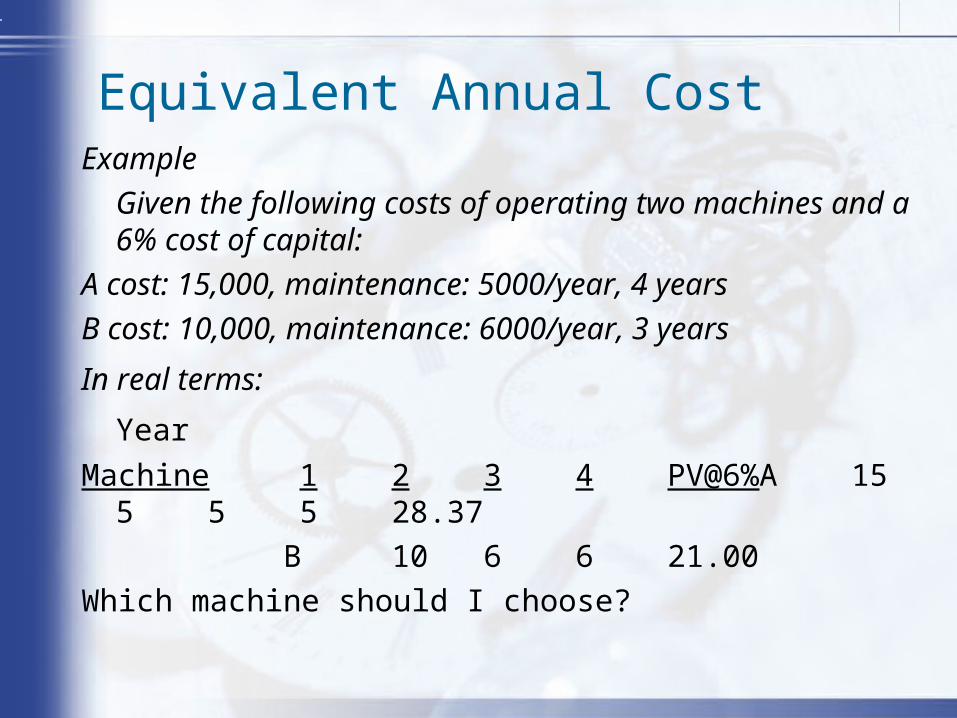
Equivalent Annual Cost
Equivalent Annual Cost - The cost per period with the same present value as the cost of buying and operating a machine.
Equivalent annual cost =present value of costs
annuity factor
44
Example
Given the following costs of operating two machines and a 6% cost of capital:
A cost: 15,000, maintenance: 5000/year, 4 years
B cost: 10,000, maintenance: 6000/year, 3 years
In real terms:
Year
Machine 1 2 3 4 PV@6% A15 5 5 5 28.37
B 10 6 6 21.00
Which machine should I choose?
Equivalent Annual Cost
45
• What assumptions we have made on previous example?

46
Complication
• Replacement
• Cross-sectional
• Time series
• Project interaction– Timing– Fluctuating load factors
47
Timing
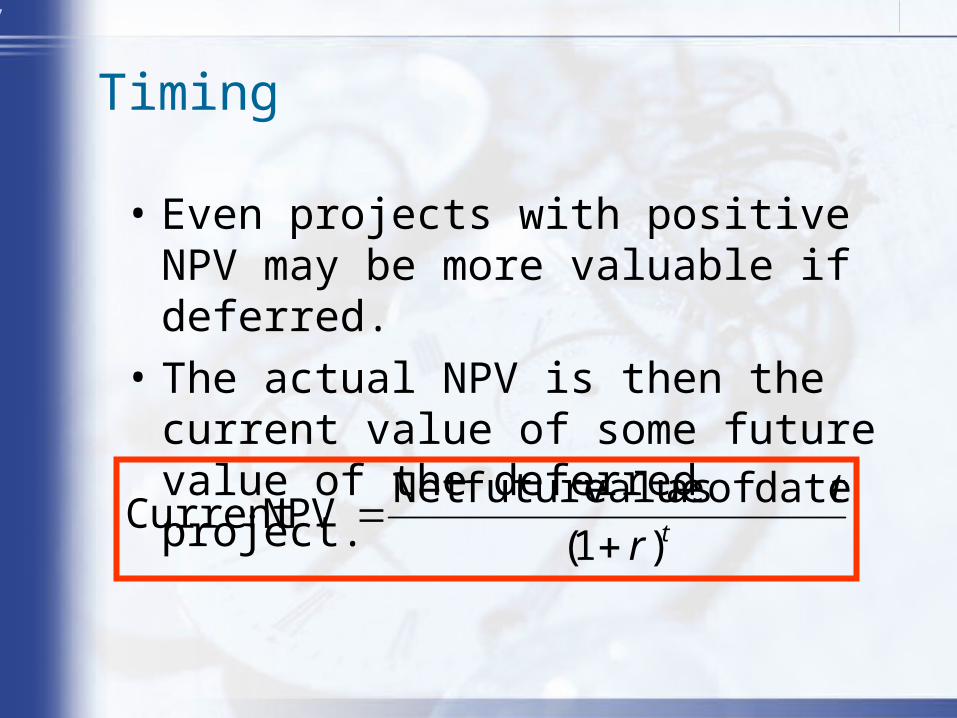
• Even projects with positive NPV may be more valuable if deferred.
• The actual NPV is then the current value of some future value of the deferred project.
tr
t
)1(
date of as valuefutureNet NPVCurrent

48
Timing
Example
You may harvest a set of trees at anytime over the next 5 years. Given the FV of delaying the harvest, which harvest date maximizes current NPV?
9.411.915.420.328.8 valuein change %
109.410089.477.564.450($1000s) Net FV
543210
YearHarvest

49
Timing
Example - continuedYou may harvest a set of trees at anytime over the next 5 years. Given the FV of delaying the harvest, which harvest date maximizes current NPV?
5.581.10
64.41 year in harvested if NPV
67.968.367.264.058.550($1000s) NPV
543210
YearHarvest
50
Fluctuating Load Factors
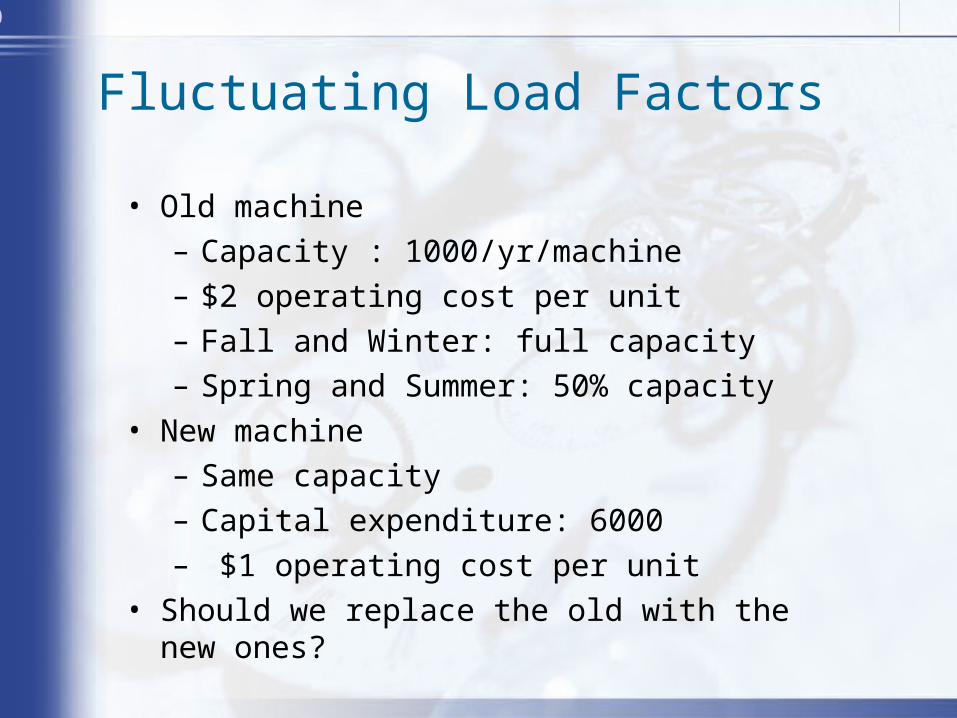
• Old machine– Capacity : 1000/yr/machine– $2 operating cost per unit– Fall and Winter: full capacity– Spring and Summer: 50% capacity
• New machine– Same capacity– Capital expenditure: 6000– $1 operating cost per unit
• Should we replace the old with the new ones?

51
Fluctuating Load Factors
Spring Summer Fall Winter
Old A 250 250 125 125
Old B 250 250 125 125
52
Fluctuating Load Factors
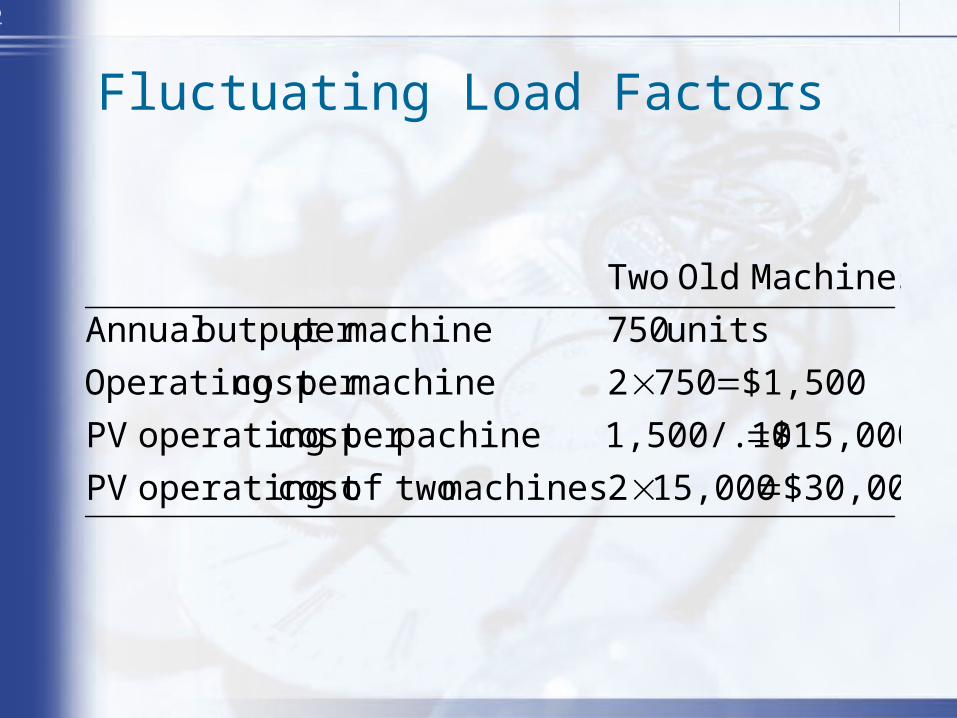
$30,00015,0002machines twoofcost operating PV
$15,0001,500/.10pachineper cost operating PV
$1,5007502machineper cost Operating
units 750machineper output Annual
MachinesOld Two
53
Fluctuating Load Factors
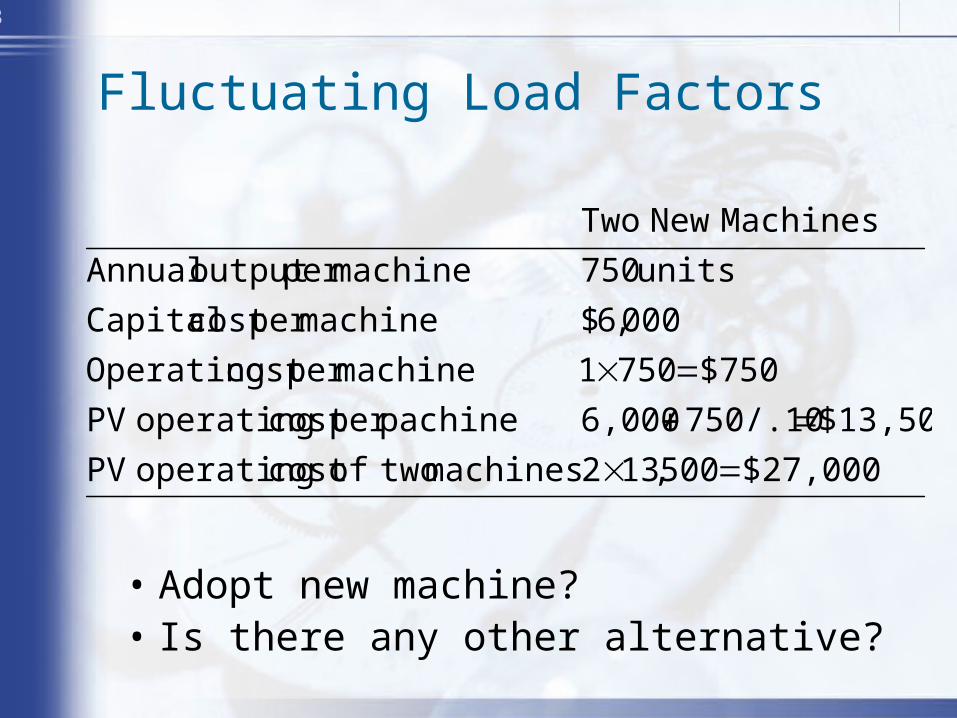
• Adopt new machine? • Is there any other alternative?
$27,000500,132machines twoofcost operating PV
$13,500750/.106,000pachineper cost operating PV
$7507501machineper cost Operating
000,6$machineper cost Capital
units 750machineper output Annual
Machines New Two