1. title: characterisation of elastic and acoustic
TRANSCRIPT
1
1. Title: Characterisation of elastic and acoustic properties of an agar-based tissue 1
mimicking material. 2
Authors: 3
1. M.P.Brewin, Blizard Institute, Barts and The London School of Medicine and Dentistry, 4
Queen Mary University of London, London, UK 5
2. M.J.Birch, Clinical Physics, Barts Health NHS Trust, 56-76 Ashfield Street, London, UK 6
3. D.J.Mehta, Blizard Institute, Barts and The London School of Medicine and Dentistry, 7
Queen Mary University of London, London, UK 8
4. J.W.Reeves, Clinical Physics, Barts Health NHS Trust, 56-76 Ashfield Street, London, 9
UK 10
5. S.Shaw, BICOM (Brunel Institute of Computational Mathematics) and Mathematics, 11
Brunel University, UK 12
6. C. Kruse, BICOM (Brunel Institute of Computational Mathematics) and Mathematics, 13
Brunel University, UK 14
7. J.R. Whiteman, BICOM (Brunel Institute of Computational Mathematics) and 15
Mathematics, Brunel University, UK 16
8. S.Hu, Center for Research in Scientific Computation, North Carolina State University, 17
Raleigh, NC, USA 18
9. Z.R.Kenz, Center for Research in Scientific Computation, North Carolina State 19
University, Raleigh, NC, USA 20
10. H.T.Banks, Center for Research in Scientific Computation, North Carolina State 21
University, Raleigh, NC, USA 22
2
11. S.E. Greenwald, Blizard Institute, Barts and The London School of Medicine and 1
Dentistry, Queen Mary University of London, London, UK 2
3
Running Head: Acoustic and elastic properties of an agar tissue mimic 4
5
Corresponding Author: S.E. Greenwald, Blizard Institute, Barts and the London School of 6
Medicine and Dentistry, Queen Mary University of London, UK 7
Telephone: +44 (0) 20 3246 0178 8
Fax: +44 (0) 20 3246 0216 9
Email: [email protected]
3
2. Abstract 1
As a first step towards an acoustic localisation device for coronary stenosis to provide a non-2
invasive means of diagnosing arterial disease, measurements are reported for an agar-based 3
tissue mimicking material of the propagation velocity, attenuation and viscoelastic constants, 4
together with one dimensional quasi-static elastic moduli and Poisson’s ratio. Phase speed and 5
attenuation coefficients, determined by generating and detecting shear waves piezo-electrically 6
in the range 300 Hz - 2 kHz, were 3.2 - 7.5 ms-1 and 320 dB m-1. Quasi-static Young’s modulus, 7
shear modulus and Poisson’s ratio, obtained by compressive or shear loading of cylindrical 8
specimens were 150 - 160 kPa; 54 - 56 kPa and 0.37 - 0.44. The dynamic Young’s and shear 9
moduli, derived from fitting viscoelastic internal variables by an iterative statistical inverse 10
solver to freely oscillating specimens were 230 kPa and 33 kPa and the corresponding relaxation 11
times, 0.046 s and 0.036 s. The results were self-consistent, repeatable and provide baseline data 12
required for the computational modelling of wave propagation in a phantom. 13
14
Keywords: acoustic properties, acoustic localisation, coronary artery, elastic moduli, Poisson’s 15
ratio, shear modulus, shear wave, stenosis, tissue mimicking material, viscoelasticity 16
17
4
3. INTRODUCTION 1
Previous work on acoustic localisation of coronary arterial stenosis has been summarised in a 2
review paper 29. This has shown that, in principle, the detection of the shear waves generated at 3
the vessel wall by disturbed flow may be used in the diagnosis of arterial disease. The overall 4
aim of our research is to understand the way in which energy is transmitted from the arterial wall 5
blood to the skin surface by simulating the propagation of these stenosis-induced shear waves, 6
both experimentally in chest phantoms and computationally by software approximations to the 7
underlying partial differential equations. 8
9
In this paper, our objective is to characterise the physical properties of an agar-based tissue 10
mimicking material (TMM). Shear wave speed and attenuation were measured in the frequency 11
range 300 to 2000 Hz as well as Young’s, shear modulus modulus, and Poisson’s ratio under 12
quasi-static conditions, as well as the viscoelastic relaxation times following the sudden release 13
of a normal or shearing load. 14
15
Water-based tissue-mimicking materials using either gelatin or agar have been investigated 16
extensively in the ultrasonic range of frequencies to determine the acoustic properties of speed 17
and attenuation 8,23,24. They have been developed specifically as a calibrated material with 18
acoustic properties similar to soft tissue for the purposes of both the assessment of ultrasound 19
imaging performance and the construction of anthropomorphic phantoms 25. 20
21
Our laboratory has much experience in the manufacture of tissue mimicking agarose gels as a 22
tissue mimic 5,6,30. We chose here to characterise a simplified 3% agarose gel because it is cheap 23
5
and easy both to manufacture and mould. Furthermore, the initial aim of our studies was for a 1
proof of concept that shear waves, generated by a stenosis, can be transmitted through an 2
anthropomorphic phantom of the chest constructed with this gel. Our intention is to show that 3
shear waves generated by disturbed flow in a stenosed vessel within our chest phantom would be 4
detectable at the surface. Further work may explore the adaptation of the TMM, or combination 5
of TMMs, to better match the wave path in the chest. 6
7
Recent ultrasound studies have assessed the acoustic properties of agar-based TMM 7,27. The 8
mechanical characterisation of both tissue and vessel ultrasound mimics have also been 9
considered 14,27. Dineley et al. used an Instron tensile testing machine to measure the tangent 10
elastic modulus of polyvinyl alcohol cryogel (PVA-C) vessel mimic at strains up to 10% 27. 11
Elsewhere, hyper-frequency viscoelastic spectroscopy (HFVS) was compared to classical 12
oscillatory rheometry to measure both the dynamic storage and loss moduli, G’ and G’’, of soft 13
biomaterials 21. Measurements were made on cylindrical tube samples of various mixtures of 14
agar-gelatin at strains up to 1%. 15
16
The results of our measurements have been used in the initial phase of the numerical simulations 17
to establish the appropriate viscoelastic model of the TMM 3,4. This TMM will then be used in 18
the construction of a physical chest phantom. 19
20
6
4. MATERIALS AND METHODS 1
Preparation of agar tissue mimicking material (TMM). 2
Batches of TMM of approximately 0.5 litres were prepared by adding granulated, purified agar 3
(Merck, Darmstadt, Germany) to deionised water in the ratio 3:97 by weight. Rodalon™ 4
(Benzalkonium Chloride, an antibacterial, antifungal agent) was also added to the mixture to 5
suppress bacterial and fungal proliferation 6. The mixture was stirred with a rotating coil and 6
surface stirrer at 175 rpm and heated by a thermo-regulator (TE-10D, Techne, Stone, UK) in an 7
insulated water bath for an hour at 96 °C. The gel was then allowed to cool slowly over a period 8
of 2 - 3 hours to 47 °C. It was then poured into moulds where it set at approximately 43 °C. The 9
TMM sample was removed from its moulds and its elastic properties were measured “fresh”. It 10
was then stored in deionised water. Its weight and linear dimensions were re-measured “stored” 11
on the following day along with its acoustic and elastic properties. All measurements were 12
performed at room temperature (22 ± 2oC). 13
14
Elastic Properties 15
Poisson’s Ratio 16
Height and width measurements under quasi-static conditions were made on 50 mm square 17
TMM blocks of thickness 12.7 mm. The dimensions were measured using a travelling 18
microscope (Griffin & George, London, UK) with a resolution of 10 µm. The height and width 19
of the block were first measured with no applied weight to determine its unloaded dimensions. 20
A load of approximately 14 N was then applied to the top surface of the gel. The width and 21
height of each side was then measured again giving the changes in these variables, ∆H and ∆W. 22
Poisson’s ratio (ν) was calculated from the two strain values as: 23

7
HH
WW
/
/
∆
∆−=ν (1) 1
where ∆W/W is the transverse strain and ∆H/H is the compressional strain. 2
3
Young’s and Shear Modulus 4
These elastic constants were determined by measuring the deformation due to the application of 5
a known load, again under quasi-static conditions. The load was progressively increased using 6
ten lead masses each of approximately 13 g. The experimental set-up for the measurement of 7
each modulus is outlined in figure 1. For the Young’s (compressional) modulus, the load was 8
applied to the top of the unbound TMM cylinder via a Perspex top cap attached to the central 9
rod. The displacement was measured using a laser displacement sensor (LDS) with 0.2 µm 10
resolution, (AR700, Schmitt Industries, Oregon, USA). The analogue displacement signal from 11
the LDS was acquired in real time using a data acquisition system running LabVIEW software 12
(version 11.0.1, National Instruments (NI), Newbury, UK). The NI system comprised an 13
analogue input module (NI 9234) interfaced to a real-time controller (NI 9024), via a customised 14
field-programmable gate array (NI 9116). The real-time controller digitises the signals at 17 kHz 15
and the waveform and data are passed to a PC for display and storage. For the shear modulus, 16
the load was applied to the inner core. This core was wrapped in abrasive paper and the TMM 17
was moulded around it to prevent movement between the core and the TMM. Whereas the outer 18
boundaries of the TMM cylinder were free in the compressional set up, thus allowing 19
longitudinal movement, for the shear measurements they were fixed to the grooved Perspex 20
cylinder into which the TMM was cast. The fixation of the boundary of the cylinder wall in this 21
manner prevented longitudinal movement and enabled the load forces to be exerted in the shear 22
8
plane. The loads were applied incrementally in each set up and the gradient of the stress-strain 1
curve was used to calculate each elastic modulus. 2
3
For comparison, the stress-strain measurements were repeated in another laboratory (Department 4
of Materials, Queen Mary University of London, UK) using a materials testing machine fitted 5
with a strain gauge load cell (Instron, Norwood, MA, USA). In these experiments, the force 6
generated by a known displacement is measured rather than the displacement resulting from a 7
known load. 8
9
Creep 10
Viscoelastic creep was also investigated using both the compressional and shear set up on TMM 11
cylinders shown in Figure 1. A load of 48.0 g was applied. The measurement set up was housed 12
in a temperature controlled water bath to minimise the effect of room temperature changes 13
which, in preliminary experiments, had been shown to cause displacements comparable to those 14
resulting from the applied load. The water also prevented dehydration of the gel. A thermo-15
regulator (Techne TE10D, Bibby Scientific, Stone, UK) maintained the water bath temperature 16
at 24.9 ± 0.2°C for the duration of the study. A miniature thermocouple (K-type, Omega, UK) 17
was embedded in the gel. The temperature of the gel was recorded using the National 18
Instruments data capture hardware and LabVIEW software at a sampling rate of 0.1 Hz. The gel 19
was allowed to equilibrate in the water bath for approximately 2 hours before the 48.0 g load was 20
applied. 21
9
1
Free Oscillations 2
In order to investigate further the viscoelastic behaviour of the TMM and provide a diverse range 3
of data for the mathematical modelling of its properties, free oscillations were induced within the 4
cylinder in both the compressional and shear set-ups. One of four different loads, 66 g, 132 g, 5
198 g and 264 g, was applied to the central rod via a nylon filament having a diameter of 0.35 6
mm. After a few seconds, while the load on the end of the filament was allowed to stabilise, it 7
was then rapidly released, over a time period of 10 ms, by burning through the filament with a 8
blow torch flame. Time-displacement curves for each load and set-up were captured using the 9
LabVIEW software. 10
11
Shear Wave Acoustic Properties 12
The acoustic measurements were carried out only on samples that had been stored in water 13
overnight. In order to make the measurements using the substitution technique, as described 14
below, an acoustic transmitter and receiver were used. The transmitting accelerometer 15
(TR0APN, PCB Piezotronics, Depew, NY, US), that is shown as Tx in figure 2, was 16
manufactured as a receiver. However, here, it acted as a shear wave transmitter by application of 17
a drive voltage to the output terminals. The driving frequency of the transmitter was set on the 18
function generator and the amplified driving voltage was 141 V. A tone-burst of 40 cycles was 19
used for the measurements. The drive was produced by a 700 Watt audio amplifier (SX-2800, 20
Samson, Hauppauge, NY, US) being itself driven by a function generator (33250A, Agilent, 21
Santa Clara, CA, US). A digital oscilloscope (LT264, LeCroy, Chestnut Ridge, NY, US) 22
allowed the input and output signal to and from the amplifier to be viewed in real time. A shear 23
10
stress was created by the induced vibration and consequent strain propagated as a wave in the 1
tissue mimicking material. 2
3
The shear waves were detected at the opposite face of the TMM by an accelerometer (Y352A24, 4
PCB Piezotronics, Depew, NY, US), shown as Rx in figure 2, with physical dimensions of 12 x 7 5
x 4 mm and weighing 0.8 g. This is responsive only to displacements in a single plane defined 6
parallel to the base, or surface, of the device. This receiver was connected to the analogue input 7
module (NI9234), which is configured for IEP-type transducers, by a low-noise Teflon cable. 8
The transmit, receive and synchronisation signals were passed from the controller by Ethernet 9
connection to the PC. This enabled the modulus and phase of the received signal power 10
spectrum, derived from a fast Fourier transform, to be displayed in real time. The PC provided 11
control of the real time acquisition parameters, phase of the transmitted and received shear 12
waves, extended real time measurements for the longer duration TMM creep measurements and 13
enabled data storage and output as text files for further analysis. 14
15
Attenuation 16
Attenuation was measured using the insertion or substitution technique 1,5. By comparison of the 17
signal strength received through different path lengths, the attenuation per unit distance at 18
various frequencies can be obtained. The transmit signal was injected at fixed frequencies from 19
300 to 2500 Hz at increments of 100 Hz. The relative signal strength in dB of transmitted 20
signals at the receiver was assessed as the amplitude at the peak frequency of the power 21
spectrum. The signal amplitude in dB was then calculated for different block thicknesses 22
normalised to the thinnest specimen. The thicknesses of the 50 mm square specimen blocks 23
11
were 15, 30, 45 and 60 mm. The Vrms signal was acquired from the Rx accelerometer voltage 1
output, calibrated from manufacturer’s data to give shear wave acceleration in units of ms-2. The 2
peak amplitude of each power spectrum was measured, using an electronic cursor on the 3
LabVIEW screen, ten times per TMM block. The data were averaged and the attenuation in dB 4
cm-1 was calculated using the expression: 5
A( f , x, y) =(P1( f , x, y)− P0( f , x, y))
d (2) 6
where P1 and P0 are the average peak power spectral amplitudes of the signal through two 7
different TMM blocks in dB, and d is the difference in path length travelled by each signal, i.e. 8
the difference in thickness between any two blocks. 9
10
Velocity 11
The velocity of the shear waves in the TMM was derived from the transit time of the wave along 12
a known path length. The transit time was found by measurement of the phase difference 13
between transmission and reception of the shear wave. In this experiment, the phase difference 14
between transmit and receive signals was measured at frequencies between 300 and 2000 Hz, at 15
100 Hz intervals. The phase difference was expressed as a time shift (∆t) in the signal, as shown 16
in equation 3, for a known change in beam path length, which is equivalent to the difference in 17
TMM thickness. 18
f
ffft
π
φφ
2
)()()( 01 −=∆ (3) 19
where φ1 and φ0 are the phase in radians for different thicknesses and f is the frequency. 20
12
The phase change was adjusted by 2nπ radians as necessary in order to account for any phase 1
change greater than one wavelength or time period. The jumps in 2π are apparent from the plot 2
of phase change against frequency. The phase velocity was then calculated knowing the 3
difference in TMM thickness between the blocks. 4
5
5. RESULTS 6
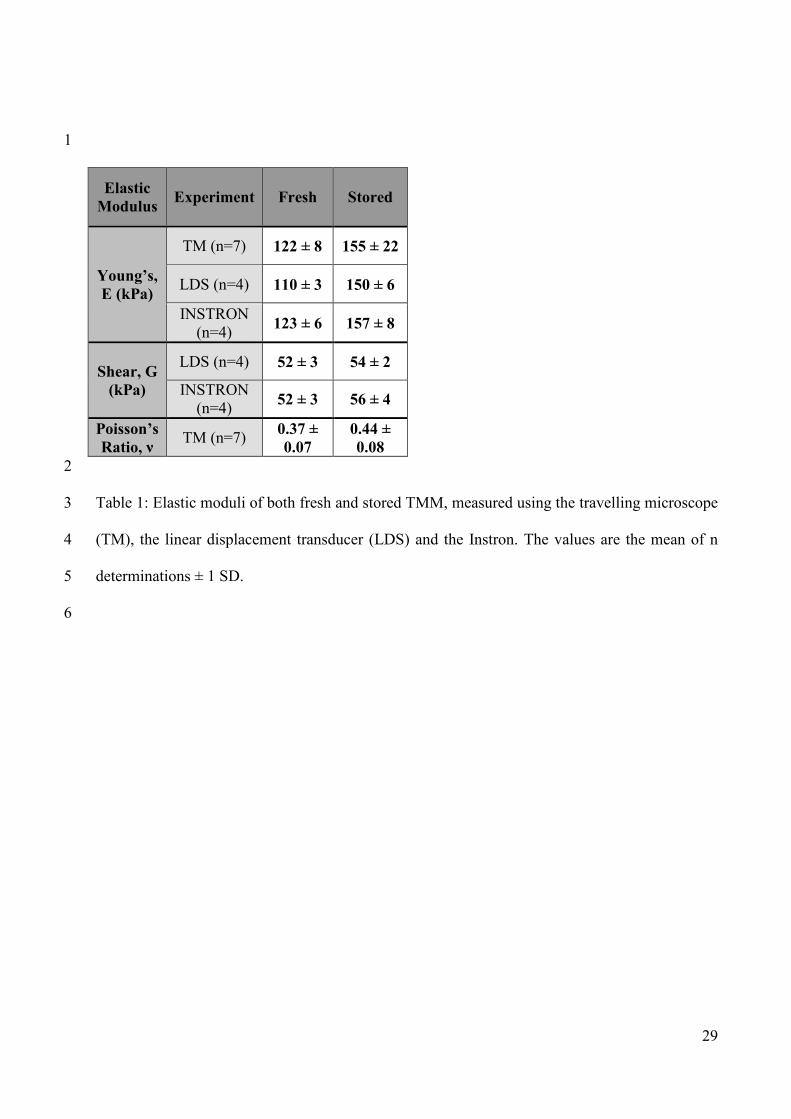
The Poisson’s ratio for fresh TMM was 0.37 ± 0.07 (SD, n = 3) and for that stored in water was 7
0.44 ± 0.08 (n = 7), where n is the number of samples measured. Young’s modulus measured 8
when axially compressing the sample was in the range of 110 - 120 ± 4 kPa (mean ± SD) for 9
fresh TMM and in the range 150 - 160 ± 8 kPa after storage in water. The values for shear 10
modulus were 53 ± 2 kPa for fresh TMM and 55 ± 2 kPa for stored TMM. These data are 11
compared with the values measured for the moduli using the incremental load (LDS) and Instron 12
methods, as shown in table 1, which also allows comparison between the shear modulus values 13
measured by the LDS and Instron methods. 14
15
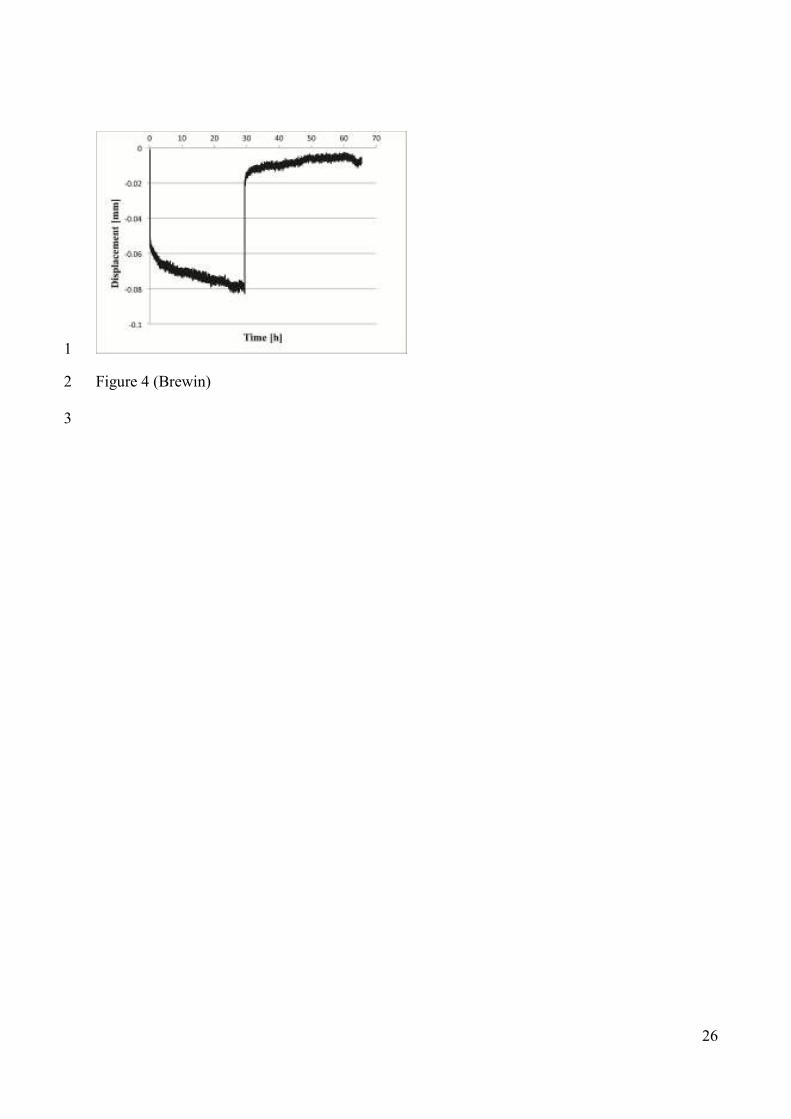
The creep curve is shown for both the compressional and shear set up in figures 3 & 4. The 16
unloaded displacement was set to zero and the displacement is normalised to the initial loaded 17
displacement. It became apparent that, with the load applied for nearly 30 hours for the shear 18
and 50 hours for the compression measurements, the creep on the gels did not show signs of 19
stopping. The load was then released and the gel was allowed to settle. For the axial creep 20
under compression, shown in figure 3, it is apparent that the load of Perspex lid and rod caused a 21
continued creep of the gel following the removal of the applied load at the 50 hour mark. For the 22
shear creep, shown in figure 4, the gel tends towards its original displacement for 30 hours 23
13
before the extant load causes the gel to creep again. Note that the initial displacement of the gel 1
when subjected to the axial load is approximately 6 times greater than when it is sheared with a 2
similar load, the differing y-axis scales accounting for the apparently greater noise in the shear 3
experiment. The stresses due to the 48 g load were 189 and 253 N m-2 for the axial and shear 4
cases, respectively. Allowing for the greater stress in the shear experiment (shear to axial stress 5
ratio 4:3 and the difference between the shear and Young’s modulus values, ratio 3:1), the 6
expected initial strain ratio would be approximately 4:1, which is inconsistent with the observed 7
ratio of 6:1. 8
9
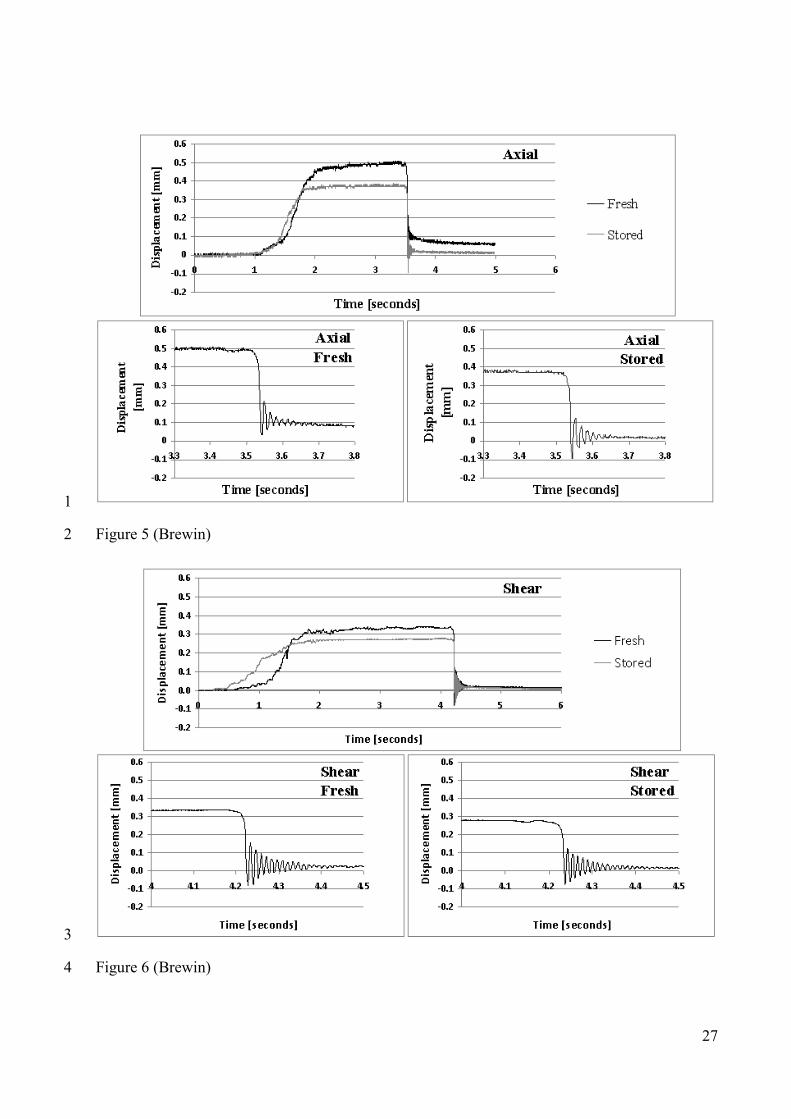
The free oscillations following abrupt unloading of the TMM for the compressional and shear set 10
ups are shown in figures 5 & 6. These representative plots are for the 264 g load. The other 11
loads produced similar qualitative behaviour (number of repeats, n = 9 for each load). The top 12
section of each figure panel shows the entire time course of the experiment for the fresh and 13
stored cylinders. The system is at rest before the load is added at t = 1 to 2 seconds. The load is 14
then released at t = 3.5 s (compressional) and at t = 4.2 s (shear). The oscillations occur as the 15
system returns towards equilibrium. The lower panels of each figure show the oscillations at an 16
expanded time scale. The gel specimens in both the shear and the compressional set-ups 17
oscillated at frequencies between 50 and 60 Hz. The dynamic Young’s modulus and relaxation 18
time for a representative stored specimen subjected to a load of 264 g were 230 kPa and 0.046 s. 19
The corresponding values for the shear experiment were 33.4 kPa and 0.036 s. More details of 20
the fitting procedure and error analysis can be found in a companion paper 3. 21
22
14
The acoustic property measurements were repeated six times for both attenuation and velocity. 1
The values of attenuation are normalised to the 15 mm thick block and are plotted against 2
frequency in the range 300 - 2500 Hz as shown in figure 7. A straight line is fitted to the data 3
from the 60mm specimen. There was a highly significant correlation between frequency and 4
attenuation, (r2 = 0.65, P < 0.001), although it is clear that there are regular fluctuations either 5
side of the line, with an approximate period of 400 Hz. The shear phase speed was calculated for 6
each block thickness over the frequency range 300 - 2000 Hz. The frequency dependence of 7
phase speed is plotted in figure 8. The average value over the thicknesses is shown by the dark 8
line. The range of shear phase speed is 3.2 – 7.5 ms-1. 9
10
6. DISCUSSION 11
Elastic Properties 12
As the TMM must be kept hydrated to avoid changes in physical properties due to dehydration, it 13
was deemed necessary to characterise any change in its properties following storage in water. 14
The proposed anthropomorphic phantoms will be kept in water as they may need to be tested 15
over many hours and perhaps days. The reason for this change in properties remains to be 16
understood and could form the basis of further studies. 17
18
Measured values of Poisson’s ratio in the fresh TMM were significantly lower than those in the 19
stored specimens (0.37 ± 0.07 (n = 3) and 0.44 ± 0.08 (n = 7) respectively, ±1 SD), both values 20
being less than the majority quoted in the literature. Indeed, many studies assume the material is 21
incompressible and therefore quote an assumed value of ~ 0.5 19,26. We note in passing that the 22
95% confidence interval of the stored specimen encompasses values greater than 0.5, which 23
15
reflects the variability in the measurements rather than the reality of values greater than 0.5. One 1
study measured both elastic modulus and Poisson’s ratio of a 3 % agar gel and obtained a value 2
for Poisson’s ratio of 0.32 28. Similar blood vessel mimicking materials such as PVA cryogel 3
have also been measured with a Poisson’s ratio in the range of 0.42 - 0.48 16. Our TMM has 4
similar values to that of lead at ~ 0.44 and copper at ~ 0.34 - 0.37 20. The measured values do 5
not therefore seem unreasonable and we can assume that the gel is indeed compressible. To 6
ensure that the material did not demonstrate poroelastic properties, we weighed specimens before 7
and after subjecting them to a compressive load. For gels, typically weighing around 120g, the 8
difference in weight between pre- and post-loading was less than 0.5g and in some cases was not 9
detectable. We assume that the compressibility of the gel is not due to the exudation of water 10
when subjected to a compressive load. 11
12
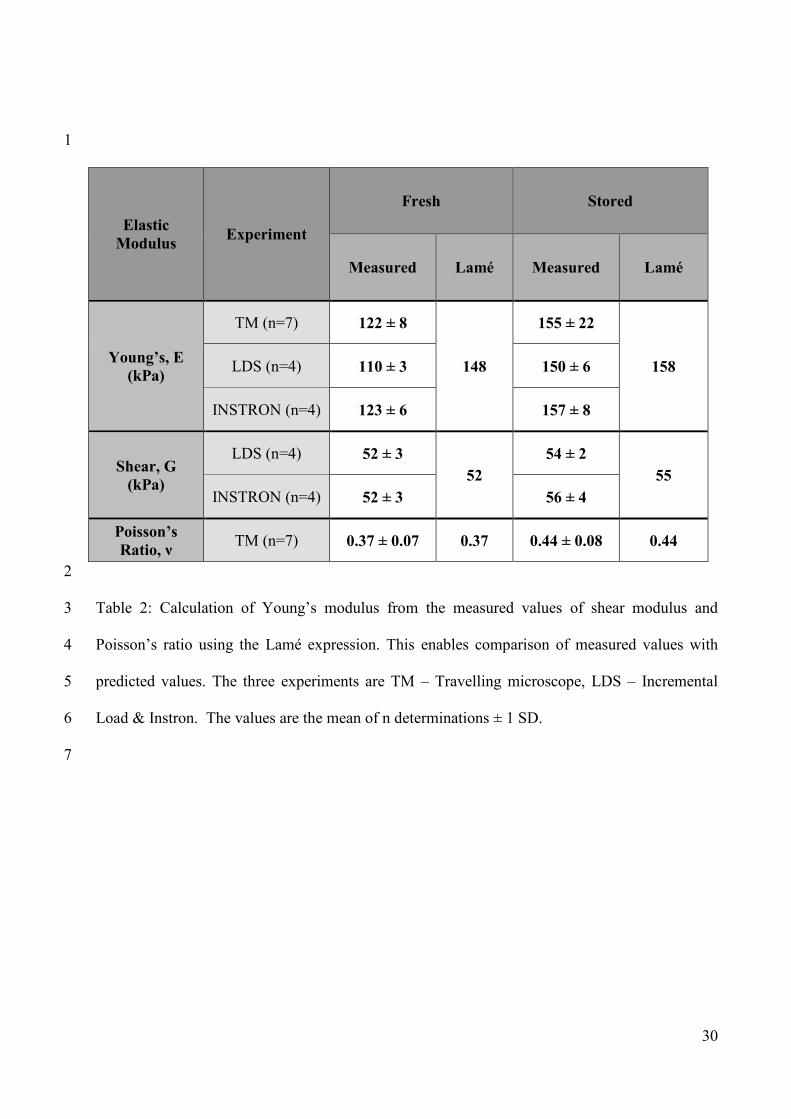
However, our measured values for Poisson’s ratio, Young’s modulus and shear modulus are 13
internally consistent. To our knowledge, this has not been shown before in agar gels. By 14
application of the Lamé expression 15, E = 2G(1+ν), where G is the shear modulus and ν, 15
Poisson’s ratio, we find that these values along with our results for Young’s and shear Modulus 16
are self-consistent, as shown in table 2. By substitution of values for G and ν close to the 17
measured values, the Lamé equations gave values for E close to those measured for the stored 18
TMM. We conclude that the compressibility of the gels is a reflection of their complex 19
polysaccharide structure containing numerous voids capable of deformation 2. For the fresh agar 20
gel, the three methods used in this study to measure Young’s modulus gave small but significant 21
differences. As shown in table 2, the LDS values were significantly lower than those obtained 22
from the TM and Instron measurements (p = 0.004 and 0.02 (n = 4) respectively, Student’s t-test) 23
16
whilst the TM and Instron results were in close agreement. When comparing the values obtained 1
by the three methods for the stored specimens, no differences were found (n = 4). For the shear 2
modulus, the results from the LDS and Instron measurements were not significantly different in 3
both the fresh and stored specimens. Given the good agreement between the three methods 4
found in the stored specimens and the fact that the LDS measurements were performed up to 2 5
hours before the TM and Instron experiments, we believe that the disparity in the fresh material 6
is due to rapid changes in the properties of the gel in the period shortly after it is removed from 7
the mould and needs further investigation. It is worth noting that under the quasi-static 8
conditions used in these measurements, the relationship between stress and strain was linear 9
from strains of zero up to 1%, with Pearson correlation coefficients (r2) typically > 0.998 (Data 10
not shown). 11
12
Indentation tests 28 have shown that the Young’s modulus for 3% agar was ~52 kPa. Low and 13
high viscosity agar gels have been measured elsewhere using an Instron tester 26; the low 14
viscosity gels had a compression modulus of 254 kPa at a concentration of 2.5%, whereas the 15
high measured 516 kPa at a concentration of 3%. It is apparent that there is a range of measured 16
values for this variable. Our results also appear consistent with data measured using HFVS 21. In 17
that study, the measured storage modulus, G', for a 1.5% agar gel ranged between 200 - 300 kPa 18
over the frequency range, 10 - 1000 Hz. Here also, in our reported results, the storage moduli 19
were dispersive, which indicates viscosity. It is emphasised here that care should be taken to 20
ensure a consistent gel manufacture process and with careful control of the manufacturing 21
temperatures and heating rates we have found little variability in the properties of different gel 22
batches. 23
17
1
In both creep experiments, the TMM became stiffer once it had been stored in water and it has 2
been shown that this stored TMM has similar values for these elastic moduli as human muscle 13. 3
Neither the compressional nor shear creep curves appear to be reaching an asymptote, which 4
implies that the TMM is a viscoelastic fluid. Also, neither set of curves returns to its initial 5
displacement, which implies that the TMM is viscous. These contradictory observations confirm 6
the complex structure and properties of these agar gels and we emphasise the need for carefully 7
specifying the conditions under which measurements are made. 8
9
For the oscillations, it can be seen that the initial displacement on loading is approximately 50 % 10
larger for the compressional experiment than for the shear set up, an observation in keeping with 11
the measured quasi-static Young’s and shear moduli. We note that the initial loaded deformation 12
of around 0.3 mm corresponds to normal and shear strains of less than 1% and we therefore 13
assume that the elastic response, under these conditions too, is linear. In both experiments, it is 14
again apparent that the stored TMM is stiffer than the fresh. We observed little difference 15
between the fresh and stored specimens in the number of oscillations both in the compressional, 16
(~ 6-7), and shear, (~ 18-20), experiments, nor in their respective frequencies which, as they are 17
free oscillations, presumably reflect a characteristic resonance mode. The amplitude of the free 18
oscillations exhibits an exponential decay. These data have been used as input to a one 19
dimensional viscoelastic model of wave propagation in viscoelastic media 3. The agreement 20
between the measured and computed displacement/time data was excellent and allowed us to 21
obtain estimates of the dynamic Young’s and shear moduli together with their corresponding 22
relaxation times. 23
18
1
As mentioned above, we have treated the elastic properties of the material under investigation as 2
linear. Although the elastic response of soft tissues is non-linear under the large strains 3
associated with the propagation of the arterial pulse wave and the movement of the heart itself, 4
the displacement waves caused by the stenosis are very weak and such that, even in a soft 5
biomaterial, are unlikely to cause geometric nonlinearities and hence there seems no need for 6
finite strain measures. It is therefore reasonable to assume the existence of linear elastic 7
constants such as Young's modulus and Poisson's ratio for the instantaneous elastic response of 8
the viscoelastic material. The question of whether or not there is constitutive nonlinearity arising 9
from the time constants is rather more delicate. Our hypothesis here, by operating in this fairly 10
narrow range of dominant frequencies due to acoustic signature of the stenosis, is that there is no 11
such nonlinearity. This will make our computational model simpler and help to make our 12
anticipated diagnostic technology more practical. The inclusion of nonlinear effects can be 13
considered later, if they are needed, and these will be issues for future research. 14
15
Acoustic Properties 16
Although there was a statistically significant correlation between attenuation and frequency, 17
where the Pearson correlation coefficient for the 60 mm thickness was 0.65 and the p-value, p < 18
0.001 (n = 6), strong, regular fluctuations of attenuation with frequency were observed with the 19
maxima occurring at around 500, 900, 1300 and 1700 Hz, i.e. at approximately 400 Hz intervals, 20
as seen in figure 7. These fluctuations appear for all three specimen thicknesses but are more 21
pronounced in the thinner specimens. We speculate that they are due to interference from 22
internal reflections within the block. Strong reflections might also be expected to cause 23
19
fluctuation in the apparent (i.e. measured) wave speed but, as figure 8 shows, these are less 1
prominent. The possibility of reflections will be investigated in another study in which the 2
impulse response within a cylindrical gel specimen will be analysed. As with the other measures 3
of elasticity reported here the strains induced are small, in this case < 1µm, and we again assume 4
that the elastic response is linear. 5
6
The value for attenuation at 300 Hz for the 60 mm thickness, as derived from the data in figure 7, 7
is approximately 320 ± 30 dB m-1 , (SEM, n = 6). This is equivalent to a value of 37 Np m-1. 8
Other studies have limited their measurement frequency range up to 200 Hz 18,26. In one study, 9
an unexpected decrease in attenuation was seen in the frequency range 100 - 200 Hz 22, whereas 10
elsewhere a rise was seen with a coefficient of approximately 25 Np m-1 per 100 Hz 17. It can be 11
seen that, given the disparate experimental conditions in the various reports, our data agree 12
reasonably well with previously published values and closely with the results of 40 Np m-1 13
obtained at 300 Hz 22. 14
15
Shear wave velocity has been measured in 3 % agar / 3 % gelatin gel at approximately 2.1 ms-1 16
over the frequency range of 50 - 200 Hz 17, where it was also found to be frequency 17
independent. Liver tissue was measured using shear wave spectroscopy and found to have a 18
shear wave velocity of 1.5 - 3 ms-1 for the frequency range 75 – 500 Hz 13. Our results measured 19
at 300 Hz, i.e. close to the frequencies in the studies mentioned above, correspond well to that 20
published with a velocity at approximately 3 ms-1. We observed that the phase velocity increases 21
with frequency and that the rate of increase is highest at low frequencies. This observation may 22
fit with a Maxwellian rheological model but conflicts with previous studies that suggest the 23
20
velocity remains constant with frequency over the range 100-500 Hz 9,10,11,22. However, the 1
variation of velocity with frequency seen here matches well with values obtained from agar 2
plates measured using shear wave imaging 12. Measurements at higher frequencies, beyond 3
those of relevance to this study, would be needed to ascertain whether the velocity is tending 4
towards an asymptotic value. 5
6
The acoustic properties of the TMM change with frequency. The attenuation increases linearly 7
at a rate of 1.9 dB cm-1 kHz-1. The phase speed also increases with frequency and although the 8
rate of change decreases with frequency. It shows no tendency to reach an asymptotic value. 9
10
The experiments described here have provided baseline values of the acoustic and elastic 11
properties of tissue mimicking materials from which we are currently manufacturing soft tissue 12
phantoms of the chest and in which we are measuring the propagation of mechanically generated 13
and flow induced shear waves. Data from these experiments, the next step towards our longer 14
term aim of producing a diagnostic instrument, will be reported in due course. 15
16
Conflict of Interest 17
No benefits in any form have been or will be received from a commercial party related directly 18
or indirectly to the subject of this manuscript. 19
20
7. Acknowledgements 21
This work is supported by the Engineering and Physical Sciences Research Council (EPSRC) 22
[EP/H011072/1 and EP/H011285/1]. 23
24
21
8. References 1
1. AIUM. Methods for specifying acoustic properties of tissue mimicking phantoms and objects, 2
Stage I. Laurel, MD, American Institute of Ultrasound in Medicine Technical Standards 3
Committee. 1995. 4
2. Arnott S, Fulmer A, Scott WE, Dea IC, Moorhouse R, Rees DA. The agarose double helix and 5
its function in agarose gel structure. J Mol Biol. 90(2): 269-284, 1974. 6
3. Banks HT, Hu S, Kenz ZR, Kruse C, Shaw S, Whiteman JR, Brewin MP, Greenwald SE, 7
Birch MJ. Material parameter estimation and hypothesis testing on a 1D viscoelastic stenosis 8
model: Methodology. J Inverse and Ill-posed Problems. 21(1): 25-57, 2013. 9
4. Banks HT, Hu S, Kenz ZR, Kruse C, Shaw S, Whiteman JR, Brewin MP, Greenwald SE, 10
Birch MJ. Model validation for a noninvasive arterial stenosis detection problem mathematical 11
biosciences and engineering. IJNME. 11(3): 427-448, 2014. 12
5. Brewin MP, Pike LC, Rowland DE, Birch MJ. The acoustic properties, centered on 20 MHz, 13
of an agar-based tissue-mimicking material and its temperature, frequency and age dependence. 14
Ultrasound Med Biol. 34(8): 1292-1306, 2008. 15
6. Brewin M.P, Srodon PD, Greenwald SE, Birch MJ. Carotid atherosclerotic plaque 16
characterisation by measurement of ultrasound sound speed in vitro at high frequency, 20 MHz. 17
Ultrasonics. 54(2): 428-441, 2014. 18
7. Browne JE, Ramnarine KV, Watson AJ, Hoskins PR. Assessment of the acoustic properties of 19
common tissue mimicking test phantoms. Ultrasound Med Biol. 29(7): 1053-1060, 2003. 20
8. Burlew MM, Madsen EL, Zagzebski JA, Banjavic RA, Sum SW. A new ultrasound tissue-21
equivalent material. Radiology. 134(2): 517–520, 1980. 22
22
9. Catheline S, Wu F, Fink M. A solution to diffraction biases in sonoelasticity: The acoustic 1
impulse technique. J Acoust Soc Am. 105(5): 2941-2950, 1999. 2
10. Catheline S, Sandrin L, Gennisson J-L, Tanter M, Fink M. Ultrasound-based noninvasive 3
shear elasticity probe for soft tissues. IEEE Ultrasonics Symposium. 2: 1799-1801, 2000. 4
11. Catheline S, Gennisson J-L, Delon G, Fink M, Sinkus R, Abouelkaram S, Culioli J. 5
Measurement of viscoelastic properties of homogeneous soft solid using transient elastography: 6
An inverse problem approach. J Acoust Soc Am. 116(6): 3734-3741, 2004. 7
12. Couade M, Pernot M, Prada C, Messas E, Emmerich J, Bruneval P, Criton A, Fink M, Tanter 8
M. Quantitative assessment of arterial wall biomechanical properties using shear wave imaging. 9
Ultrasound Med Biol. 2010; 36(10): 1662-76. 10
13. Deffieux T, Montaldo G, Fink M. Shear wave spectroscopy for in vivo quantification of 11
human soft tissues visco-elasticity. IEEE Trans Med Imaging. 28(3): 313-322, 2009. 12
14. Dineley J, Meagher S, Poepping TL, McDicken WN, Hoskins PR. Design and 13
characterisation of a wall motion phantom. Ultrasound Med Biol. 32(9): 1349-1357, 2006. 14
15. Feng K and Shi Z-C. Mathematical theory of elastic structures. New York: Springer, 1981. 15
16. Fromageau J, Brusseau E, Vray D. Characterization of PVA cryogel for intravascular 16
ultrasound elasticity imaging. IEEE-UFFC. 50(10): 1318-1323, 2003. 17
17. Gennisson J-L and Cloutier G. Sol-gel transition in agar-gelatin mixtures studied with 18
transient elastography. IEEE-UFFC. 53(4): 716 –723, 2006. 19
18. Glagov S. Intimal hyperplasia, vascular modeling, and the restenosis problem. Circulation. 20
89(6): 2888-2891, 1994. 21
23
19. Glozman T and Azhari H. A method for characterization of tissue elastic properties 1
combining ultrasonic computed tomography with elastography. J Ultrasound Med. 29(3): 387-2
398, 2010. 3
20. Gray DE. American Institute of Physics Handbook. 3rd ed. New York: McGraw Hill. 1973. 4
21. Hadj Henni A, Schmitt C, Tremblay MÉ, Hamdine M, Heuzey MC, Carreau P, Cloutier G. 5
Hyper-frequency viscoelastic spectroscopy of biomaterials. J Mech Behav Biomed Mater. 4(7): 6
1115-1122, 2011. 7
22. Klinkosz T, Lewa CJ, Paczkowski J. Propagation velocity and attenuation of a shear wave 8
pulse measured by ultrasound detection in agarose and polyacrylamide gels. Ultrasound Med 9
Biol. 34(2): 265-275, 2008. 10
23. Madsen EL, Zagzebski JA, Banjavic RA, Jutila RE. Tissue mimicking materials for 11
ultrasound phantoms. Med Phys. 5(5): 391–394, 1978. 12
24. Madsen EL, Zagzebski JA, Frank GR. Oil-in-gelatin dispersions for use as ultrasonically 13
tissue-mimicking materials. Ultrasound Med Biol. 8(3): 277–287, 1982. 14
25. Madsen EL, Hobson MA, Shi H, Varghese T, Frank GR. Tissue-mimicking agar/gelatin 15
materials for use in heterogeneous elastography phantoms. Phys Med Biol. 50(23): 5597-5618, 16
2005. 17
26. Normand V, Lootens DL, Amici E, Plucknett KP, Aymard P. New insight into agarose gel 18
mechanical properties. Biomacromolecules. 1(4): 730-738, 2000. 19
27. Poepping TL, Nikolov HN, Thorne ML, Holdsworth DW. A thin-walled carotid vessel 20
phantom for Doppler ultrasound flow studies. Ultrasound Med Biol. 30(8): 1067-1078, 2004. 21
28. Ross KA. and Scanlon MG. Analysis of the elastic modulus of agar gel by indentation. J 22
Texture Studies. 30(1): 17-27, 1999. 23
24
29. Semmlow JL and Rahalkar K. Acoustic detection of coronary artery disease. Ann Rev 1
Biomed Eng. 9: 449-469, 2007. 2
30. Thrush AJ, Brewin MP, Birch MJ. Assessment of tissue Doppler imaging measurements of 3
arterial wall motion using a tissue mimicking test rig. Ultrasound Med Biol. 34(3): 446-53, 2008. 4
5

25
1
Figure 1 (Brewin) 2
3
Figure 2 (Brewin) 4
5
Figure 3 (Brewin) 6
7
26
1
Figure 4 (Brewin) 2
3
27
1
Figure 5 (Brewin) 2
3
Figure 6 (Brewin) 4

28
y = 0.19x + 322
R² = 0.65
0
200
400
600
800
1000
1200
1400
1600
0 1000 2000 3000
Frequency (Hz)
Att
en
uati
on
(d
B/m
) 30mm
45mm
60mm
1
Figure 7 (Brewin) 2
3
Figure 8 (Brewin) 4
5
29
1
Elastic
Modulus Experiment Fresh Stored
Young’s,
E (kPa)
TM (n=7) 122 ± 8 155 ± 22
LDS (n=4) 110 ± 3 150 ± 6
INSTRON (n=4)
123 ± 6 157 ± 8
Shear, G
(kPa)
LDS (n=4) 52 ± 3 54 ± 2
INSTRON (n=4)
52 ± 3 56 ± 4
Poisson’s
Ratio, ν TM (n=7)
0.37 ±
0.07
0.44 ±
0.08
2
Table 1: Elastic moduli of both fresh and stored TMM, measured using the travelling microscope 3
(TM), the linear displacement transducer (LDS) and the Instron. The values are the mean of n 4
determinations ± 1 SD. 5
6
30
1
Elastic
Modulus Experiment
Fresh Stored
Measured Lamé Measured Lamé
Young’s, E
(kPa)
TM (n=7) 122 ± 8
148
155 ± 22
158 LDS (n=4) 110 ± 3 150 ± 6
INSTRON (n=4) 123 ± 6 157 ± 8
Shear, G
(kPa)
LDS (n=4) 52 ± 3
52
54 ± 2
55
INSTRON (n=4) 52 ± 3 56 ± 4
Poisson’s
Ratio, ν TM (n=7) 0.37 ± 0.07 0.37 0.44 ± 0.08 0.44
2
Table 2: Calculation of Young’s modulus from the measured values of shear modulus and 3
Poisson’s ratio using the Lamé expression. This enables comparison of measured values with 4
predicted values. The three experiments are TM – Travelling microscope, LDS – Incremental 5
Load & Instron. The values are the mean of n determinations ± 1 SD. 6
7

31
Figure Captions 1
2
Figure 1: The compressional, left, and shear, right, set up for the measurement of moduli, creep 3
and free oscillations. The load is applied to the Perspex top cap in compressional mode and to 4
the inner core for the shear measurements. The scissors represent the sudden release of the load 5
in the free oscillation experiment as described in the method. 6
7
Figure 2: Block diagram for the wave propagation measurements. Tx and Rx signify the transmit 8
and receive accelerometers. TMM is the block of tissue mimicking material resting on the 9
Perspex frame (bold line). The FPGA is the field-programmable gate array module. 10
11
Figure 3: A typical time-displacement curve showing the axial creep of the TMM cylinder. The 12
48 g load was applied at time zero and removed after 50 hours. 13
14
Figure 4: A typical time-displacement curve showing the shear creep of the TMM cylinder. The 15
48 g load was applied time zero and removed after 30 hours. 16
17
Figure 5: The free compressional oscillations induced in the compressional experiment for 264 g 18
load. The top panel shows both time-displacement plots in their entirety. The bottom two panels 19
show the magnified section of the free oscillations for fresh and stored TMM respectively. 20
21

32
Figure 6: The free shear oscillations induced in the shear experiment for 264 g load. The top 1
panel shows both time-displacement plots in their entirety. The bottom two panels show the 2
magnified section of the free oscillations for fresh and stored TMM respectively. 3
4
Figure 7: Frequency dependence of attenuation of three different thicknesses (30 mm, 45 mm 5
and 60 mm) of the agar-based TMM, normalised to a 15mm thick sample. 6
7
Figure 8: Frequency dependence of phase velocity over the range, 300 – 2000 Hz. Each 8
thickness has its associated 2nπ phase addition as detailed in the legend. Error bars show ± 1 9
SD. 10