acoustic characterisation of micronekton distribution in
TRANSCRIPT

Vol. 191: 127-140, 1999 MARINE ECOLOGY PROGRESS SERIES Mar Ecol Prog Ser
l Published December 30
Acoustic characterisation of micronekton distribution in French Polynesia
Arnaud B e r t r a n d l l * , Robert L e ~ o r g n e ~ , Erwan Jossel
'IRD, BP 70,29280 Plouzane, France 'IRD. Station Marine d'Endourne, Chernin de la Batterie des lions. 13007 Marseille, France
ABSTRACT: Tuna distribution may be directly linked to food ava~labllity, the density of which can be assessed by echo-sounding. A study was performed in the French Polynesian EEZ (Economic Exclusive Zone) between 1995 and 1997 with a 38 kHz echo sounder working down to 500 m depth. With the settings used, acoustic back-scattered energy may be considered as representative of micronektonic fish biomass and provided information on horizontal and vertical micronekton variabilities and the structure of the echograms. Three different zones were defined by multivanate analysis. The classical biomass decreasing gradient from the equator to higher latitudes did not appear. Instead, the maximum micronekton abundance was found between Marquesas Archipelagos and a west-northwest/east- southeast oriented line stretching between l1 and 14"S, i.e. in a weak convergence, favourable to micronekton development due to the concentration of lower trophic levels with no oxygen limitation in the deep layers. Two zones with very different hydrological features, but with comparable micro- nektonic abundances, surround the richest micronekton zone. To the north, waters are enriched by the equatorial upwelling, but intense organic matter remineralisation limits oxygen availability under the therrnocline. To the south, waters are influenced by the great southern gyre and present oligotrophic characteristics less favourable to rnicronekton development. The present results suggest that prediction of tuna forage distribution should take not only trophic parameters into account, but also environmen- tal ones. They also suggest that echo-sounding data should be used more extensively in the validation of models predicting tuna forage.
KEY WORDS: Acoustics . Micronekton . Tuna forage . Abundance estimation . French Polynesia
INTRODUCTION
The French Polynesian EEZ (Economic Exclusive Zone) is located in important longline fishing grounds, mainly for bigeye (Thunnus obesus), yellowfin (Thun- nus albacares) and albacore tuna (Thunnus alalunga) (Fonteneau 1997, see his Fig. 2.7). Since these fish have a high metabolic demand (Ktchell et al. 1978, Olson & Boggs 1986), their distribution may be gov- erned by food availability (Sund et al. 1981), particu- larly in oligotrophic areas. Fishes, molluscs and crus- taceans (size-class of 1 to 10 cm) of the micronekton are the main tuna prey (Blackburn 1968, Sund et al. 1981). Micronekton distribution and composition have
been studied in some parts of the Pacific (Blackburn 1968, Young et al. 1996a,b) but remain poorly studied in the central South Pacific; the principal investigation was carned out by Legand et al. (1972) but, unfortu- nately, micronekton spatial distribution was mainly described in the vertical plane and from pelagic trawls. However, micronekton biomass and composition studies are known to be biased by this type of sampling (Power 1996), particularly for micronektonic fishes, which are difficult to catch with existing techniques (Roger 1994). Other strategies have, therefore, been developed in micronektonic fish studies, and include modelling and echo-sounding. For example, Lehodey et al. (1998) predicted tuna forage with a coupled 3-dimensional dynamical/biogeochemical model. This type of model may be useful in predicting tuna forage on a large scale. However, it assumes that tuna forage
O Inter-Research 1999 Resale of fuU article not permitted

128 Mar Ecol Prog Ser 191. 127-140, 1999
directly depends on zooplankton abundance. Acoustic surveys, on the other hand, allow a 2-dimensional and continuous approach to the pelagic habitat and are a good tool when studying the distribution of micronek- ton. For example, Marchal et al. (1993), Roger & Mar- chal (1994) and Marchal & Lebourges (1996) used acoustics to study the behaviour and distribution of Vinciguerria nimbaria, the main tuna prey south of Libena in the Tropical Atlantic. This method was also used on dolphin prey by Fiedler et al. (1998).
In the present study, acoustics are used to describe the distribution of micronekton in relation to oceano- graphic features found in the French Polynesian EEZ, which are the great southern anticyclonic gyre in its southern part and the equatorial upwelling in its north- ern part. The aim of this study is to provide a typology of micronekton distribution as described by acoustic surveys in a quantitative and qualitative way. In order to understand tuna forage occurrence, micronekton distribution will subsequently be matched with present knowledge of the oceanographic features: ocean circu- lation (Wyrtki & Kilonsky 1984, Rougene & Rancher 1994), amount of nutrients and oxygen distribution (Murray et al. 1995, Pujo-Pay 1995), primary produc- tion (Lindley et al. 1995) and zooplankton distribution (White et al. 1995, Le Borgne & Rodier 1997).
Acoustic surveys have been conducted in French Polynesia within the framework of the ECOTAP pro-
gramme (Etude du Comportement des Thonides par 1'Acoustique et la Peche/Study of Tuna Behaviour using Acoustics and Fishing), a joint project of ORSTOM (now IRD, Institut de recherche pour le developpement), IFREMER (Institut Franqais de Re- cherche pour llExploitation de la MER) and EVAAM (now SRM, Service des Ressources Marines).
MATERIALS AND METHODS
Sampling and acoustic surveys. Data were collected on board ORSTOM RV 'ALIS' (28 m long) during ECO- TAP experiments carried out in the Society, Tuamotu and Marquesas Archipelagos, from October 1995 to August 1997 (Fig. 1).
Both ECOTAP programme objectives and spatio- temporal constraints imposed acoustic sampling de- sign. Experimental longline fishing was carried out each day. Due to the large geographical extension of the studied zone and logistic constraints, fishing sets were distributed continuously along a route in such a way that the largest possible surface could be sampled (Fig. 1). Acoustic data used in this study came either from diurnal rectangular surveys above the longline, or from nocturnal rectangular or straight surveys be- tween each fishing operation (Fig. 1). In order to work on homogeneous samples, dawn and dusk micronek-
LONGITUDE ( W )
Fig. 1. Longline station positions during ECOTAP cruises in French Polynesia. Lower right: acoustic observations were conducted along rectangular tracks above the longline (fine line) dunng the daytlme and along rectangular or hnear trarks between each
fishing operation (bold Line) at night

Bertrand et al.: Micronekton distribution in French Polynesia 129
ton migrating periods were avoided. Surveys were considered as nocturnal between 19:30 and 05:50 h, and as diurnal between 07:30 and 17:30 h local time. A total of 119 nocturnal and 136 diurnal surveys was carried out.
Acoustic data were collected with a SIMRAD EK500 (version 4.01) echosounder connected to a 38 kHz split-beam, hull-mounted transducer SIMRAD ES38B (beam angle 6.9") used with a pulse duration of 1 ms. The water column was extended down to 500 m depth. Acoustic and navigation data were stored via Ethernet on a PC using SIMRAD EP 500 software. On-axis and off-axis calibration was performed with a 60 mm cop- per sphere using the standard procedure described in the EK500 operator manual (SIMRAD Subsea 1993). Table 1 gives the main settings used during the ECO- TAP cruises.
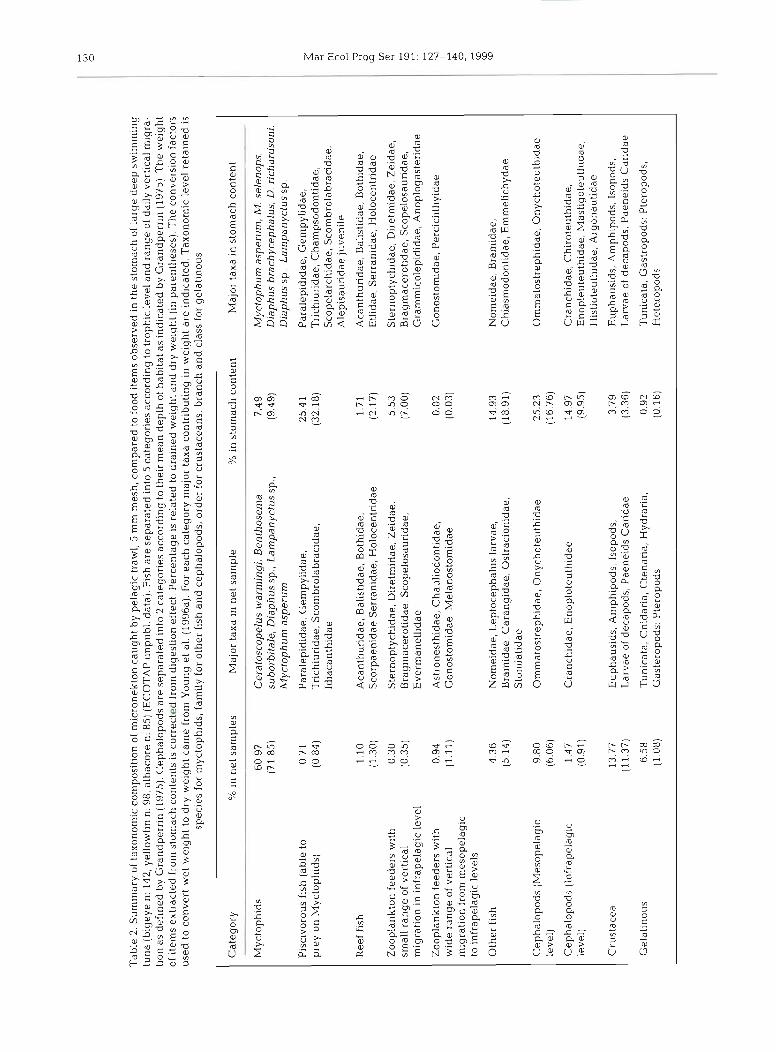
An integration threshold was applied to acoustic data. The choice of the threshold level involved a com- promise so that bias due to noise or integration of non- micronekton organisms was minimised. On the other hand, too high a threshold could lead to a large micronekton underestimation. The threshold was cho- sen from theoretical and empirical considerations. A -65 dB threshold was first chosen until observations of a tracked tuna, which had a vertical migration linked to a sound scattering layer (SSL) migration (Josse et al. 1998, see their Fig. 7), led to the conclusion that the SSL was detected with a -70 dB threshold but not with a -65 dB one. Micronekton sampling with a fry pelagic trawl (5 mm mesh) coupled with echo-sounding car- ried out during ECOTAP cruises led to the conclusion that the fish, and particularly myctophids, were the dominant taxa in the study area (Table 2), a trend which has already been observed in the Pacific Ocean by Young et al. (199613). With the settings used, a 7 0 dB threshold allowed the observation of a minimal density of 1 myctophid (with a target strength [TS] of -58 dB) in 15.8 m3 Since the swimbladder is supposed to be responsible for 90 to 95 ?& of the backscattering energy (Foote 1980), other physolclist fish likely have a TS equal to or greater than myctophids because the myc- tophid swimbladder volume is proportionally lower than that of other physoclists (Kloser et al. 1997, Koslow et al. 1997). It seems that all fish with a swim- bladder were likely to be acoustically detected with a -70 dB threshold. Conversely, crustaceans mainly com- posed of euphausiids (Table 2) are probably not de- tected since their density must be higher than 100 ind. m-3, a density which is seldom encountered outside of Antarctic waters (Mitson et al. 1996). Finally, due to avoidance, cephalopods were probably undersampled by pelagic trawl, although their target strength has the same range as that of the myctophids (Jefferts et al. 1987, Kajiwara et al. 1990, MacLennan & Simmonds
Table 1. Main settings of the SIhlRAD EK500 echosounder used during ECOTAP cruises
Operation menu Ping interval 0.0 (automatic) Transmit power Normal Noise margin 10 dB
Tranceiver menu Absorption coefficient 10 dB kin-' Pulse length Medium Bandwidth Auto Maximum power 2000 W 2-way beam angle -20.9 dB Sv transducer gain 27.7 dB TS transducer gain 27.8 dB Angle sens~tivity 21.9 3 dB beam angle 6.9" Alongship offset -0.07" Athwart ship offset 0.21"
1992). The stomach content composition of tuna caught by longline during the ECOTAP programme differed from pelagic trawl sample composition (Table 2), owing especially to sampling efficiency problems (Roger 1994, Young et al. 1996b). Since tuna forage is mainly composed of both taxa sampled by pelagic trawl and larger animals foraging on taxa sampled by the pelagic trawl such as myctophids, the acoustic back-scattered energy may be considered representative of micro- nektonic fish (and probably cephalopod) biomass.
Parameter description. Describers of acoustic pro- files, horizontal and vertical micronekton variabilities and morphology of the echograms have been either computed or measured in order to achieve a typology of the study area (Table 3). At each station, cruise num- ber, latitude (computed by 16 classes of l"), longitude and season, i.e. dry from May to October or wet from November to April, were also considered.
Acoustic profiles. For each diurnal or nocturnal sur- vey, a mean acoustic back-scattering energy by sur- face unit (sa) was calculated on 10 m thick layers rang- ing between 10 and 490 m following a log(x+l) transformation (Table 3). Total acoustic density, inte- grated on the whole vertical range (10 to 490 m), was also calculated for each survey (Table 3). Back-scat- tered energy sections and total aco'ustic densities were used both to compute latitudinal vertical sections and horizontal representations, gridded by kriging with the SURFER software (Golden Software 1995), and to com- pute multivariate analysis.
Horizontal and vertical variability. Vertical vari- ability was determined on each survey by simple de- scribers: mean and variance. The horizontal variability of each survey was quantified using geostatistic meth- ods (Matheron 1965) which are regularly used in fish- eries science in order to provide resource spatial pat-
Tab
le 2
. Su
mm
ary
of
tax
on
om
ic c
om
po
siti
on
of
mic
ron
ekto
n c
aug
ht
by p
elag
ic t
raw
l, 5
mm
mes
h,
com
par
ed t
o fo
od [
tern
s o
bse
rved
in
the
sto
mac
h o
f la
rge
de
ep
sw
imm
ing
tu
na
(big
eye
n:
14
2, y
ello
wfi
n n
: 98
, alb
aco
re n
: 85
) (E
CO
TA
P u
np
ub
l. d
ata)
. Fis
h ar
e se
par
ated
into
5 c
ateg
ori
es a
cco
rdin
g t
o tr
op
hic
lev
el a
nd
ran
ge
of d
aily
ver
tica
l m
lgra
- ti
on a
s d
ef~
ne
d by
Gra
nd
per
rin
(1
97
5).
Cep
hal
op
od
s ar
e se
par
ated
into
2 c
ateg
ori
es a
cco
rdin
g t
o t
hei
r m
ean
dep
th o
f h
abit
at a
s in
dic
ated
by
Gra
nd
per
rin
(1
97
5).
Th
e w
eig
ht
of i
tem
s ex
trac
ted
fro
m s
tom
ach
co
nte
nts
is c
orr
ecte
d f
rom
dig
esti
on
eff
ect.
Per
cen
tag
e is
rel
ated
to
dra
ined
wei
gh
t an
d d
ry w
eig
ht
(in
par
enth
eses
). T
he
con
ver
sio
n f
acto
rs
use
d t
o co
nv
ert
wet
wei
gh
t to
dry
wei
gh
t ca
me
from
You
ng e
t al
. (1
99
6a)
. For
eac
h c
ateg
ory
maj
or
tax
a co
ntr
ibu
tin
g i
n w
eig
ht
are
indic
ated
. T
axo
no
mic
lev
el r
etai
ned
is
spec
ies
for
my
cto
ph
lds,
fam
ily
for
oth
er f
ish
and
cep
hal
op
od
s, o
rder
for
cru
stac
ean
s, b
ran
ch a
nd
cla
ss f
or g
elat
ino
us
('at
ego
ry
% ~
n n
et s
amp
les
Maj
or
tax
a in
net
sam
ple
%
in
sto
mac
h c
on
ten
t p
-P
60.9
7 C
erat
osc
op
elu
s w
arrn
jngj
, B
enth
ose
ma
7.4
9
(71
.85
) su
bo
rbit
ale,
Dia
ph
us
sp.,
Lam
pan
yct
us
sp.,
(9
.49
) M
yct
op
hu
m a
sper
um
Maj
or
tax
a in
sto
mac
h c
on
ten
t P
My
cto
ph
um
asp
eru
m, M
, sel
eno
ps,
D
iap
hu
s b
rach
yce
ph
alu
s, D
, ric
har
dso
ni,
D
jap
hu
s sp
., L
amp
any
ctu
s sp
.
My
cto
ph
ids
Pis
c~v
oro
us fi
sh (
able
to
pre
y o
n M
yct
op
hid
s)
Par
alep
idid
ae,
Gem
py
lid
ae,
Tri
chiu
rid
ae,
Ch
amp
sod
on
tid
ae,
Par
alep
idid
ae, G
emp
yli
dae
, T
rich
iuri
dae
, S
com
bro
lab
raci
dae
, Id
iaca
nth
idae
S
cop
elar
chid
ae, S
com
bro
lab
raci
dae
, A
lep
isau
nd
ae j
uv
enil
e
Ree
f fi
sh
Aca
nth
uri
dae
, B
alis
tid
ae, B
oth
idae
, S
corp
aen
idae
Ser
ran
idae
, Ho
loce
ntr
idae
A
can
thu
rid
ae,
Bal
isti
dae
, Bo
th~
da
e,
Etl
idae
, S
erra
nid
ae, H
olo
cen
trid
ae
Zo
op
lan
kto
n f
eed
ers
wit
h
smal
l ra
ng
e of
ver
t~ca
l m
lgra
t~o
n in i
nfr
apel
agic
leve
l
Ste
rno
pty
chid
ae, D
iret
mid
ae, Z
eld
ae,
Bra
gm
acer
oti
dae
, Sco
pel
osa
uri
dae
, E
ver
man
elli
dae
Ste
rno
pty
chid
ae, D
iret
mid
ae, Z
eid
ae,
Bra
gm
acer
oti
dae
, Sco
pel
osa
uri
dae
, G
ram
mic
ole
pid
ldae
, An
op
log
aste
rid
ae
Zo
op
lan
kto
n f
eed
ers
wit
h w
ide
ran
ge
of v
erti
cal
mig
rati
on f
rom
mes
op
elag
lc
to i
nfr
apel
agic
lev
els
Ast
ron
esth
idae
, Ch
aul~
od
on
tld
ae,
Go
no
sto
mid
ae, M
elan
ost
om
idae
G
on
ost
om
dae
, Per
cich
thy
idae
Oth
er f
ish
No
mei
dae
, L
epto
cep
hal
us
larv
ae,
Bra
mid
ae,
Car
ang
idae
, Ost
raci
on
idae
, S
tom
iati
dae
No
mei
dae
, B
ram
idae
, C
hia
srn
od
on
tid
ae, E
mm
ehch
yd
ae
Cep
hal
op
od
s (M
eso
pel
agic
le
vel
) O
mm
ato
stre
ph
idae
, O
ny
cho
teu
thid
ae
Om
rnat
ost
rep
hid
ae, O
ny
cho
teu
th~
dae
Crs
nch
idae
, Ch
iro
teu
thid
ae,
Cep
hal
op
od
s (I
nfr
apel
agic
le
vel
) C
ran
chid
ae, E
no
plo
teu
thid
ae
En
op
leu
teu
thid
ae,
Mas
tig
ote
uth
~d
ae,
His
tio
teu
thid
ae,
Arg
on
auti
dae
Cru
stac
ea
Eu
ph
ausi
ds,
Am
ph
ipo
ds,
Iso
po
ds,
L
arv
ae o
f d
ecap
od
s, P
aen
eid
s C
arid
ae
Tu
nlc
ata,
Cn
idar
ia, C
ten
aria
, H
yd
rari
a,
Gas
tero
po
ds:
Pte
rop
od
s
Eu
ph
ausi
ds,
Am
ph
ipo
ds,
Iso
po
ds,
L
arv
ae o
f d
ecap
od
s, P
aen
eid
s C
an
da
e
Tu
nic
ata,
Gas
tro
po
ds:
Pte
rop
od
s,
Het
ero
po
ds

Bertrand et al.: Micronekton distribution in French Polynesia 131
Table 3. Parameters used in multivariate analysis (M: modality, C: continue, A: active, I illustrative, NU: non-used variables)
Variable code Description Type Night Day -
Cru~se Season Lat Long P1 to P49 Meanv Varv
Belonging to one of the 18 ECOTAP cruises Wet (1) or dry (2) season Belonging to one of the 16 classes of latitude Longitude Log(sa+l) on a whole prospecting by 10 m thick layers Log(mean s a + l ) by 10 m thick layers Vertical variance
Varh Geostatistical hori7ontal variance Range Geostatistical rdnge Total Log(sa+l) total integrated on the whole water column SSL, IMSL. TSL, LSL, NSL, LAS, Presence (2)/absence (1) of the structural descriptors SSS, SAG, NUL of the scattering structures during a whole prospecting SSLl.5, hlSLI.5, TSLl.5, LSL1~5, NSL1.5, Presence (2)/absence (1) of the structural descriptors LASI.5, SSSI.~, NUL1.5 of the scattering structures by 100 m strata from surface
to 500 m
terns (Swartzman et al. 1992, Simard et al. 1993, Pel- letier & Parma 1994, Coyle et al. 1998) and stock assess- ments (Sullivan 1991, Guillard et al. 1992, Petitgas 1993). Geostatistic methods are particularly recom- mended in the case of acoustic surveys as acoustic data are generally sampled continuously along transects and are thus spatially correlated. The use of variograms allows variance to be calculated according to spatial autocorrelation and density distribution models.
Geostatistic methods were only applied to nocturnal surveys, as they are more homogeneous than the diur- nal ones since most of the biomass is located between the surface and 250 m at night. The biomass is made of surface non-migrant organisms and of a high propor- tion of vertically migrating organisms which live in the deep layers during the day. Surface strata nocturnal acoustic density is therefore considered to be a good indicator of the total acoustic density. Thus, the sa val- ues were integrated between 10 and 250 m with 0.5 nm ESDU (elementary sampllng distance unit).
Nocturnal sampling was designated as rectangular or linear transects (Fig. 1). No anisotropy was observed on any of the rectangular surveys. This was a pre- dictable result as a pelagic habitat is studied at a smaller scale than the large environmental features of spatial anisotropy (Piontkovski & Williams 1995). Therefore an isotropic model was adjusted on each variogram of the 119 nocturnal surveys using the EVA software (Petitgas & Prampart 1995), and sill (i.e. geo- statistical horizontal variance) and range were mea- sured (Table 3).
Scattering structures coding. Acoustic profiles allow for the study of the quantitative aspect of echograms, therefore the structural information is not taken into account. Thus, acoustic structure morphology is deter-
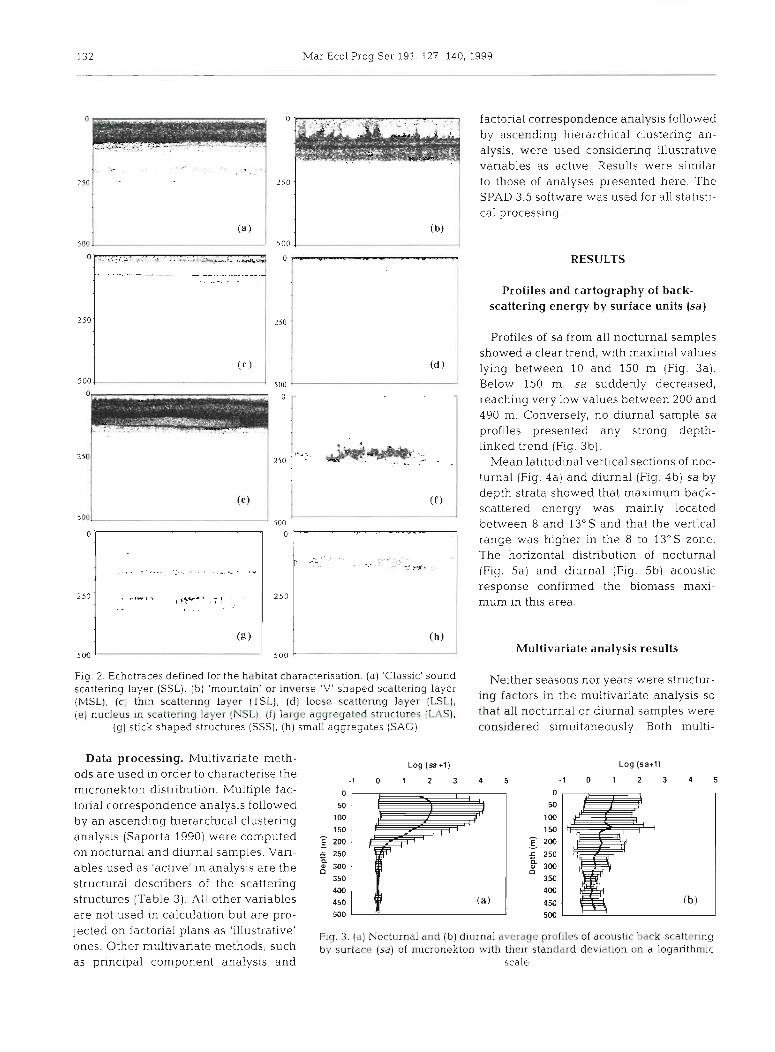
mined by the con~position of the specific community and also by physicochemical factors which may be subject to regional changes. For instance, Wiebe (1970) considers that zooplanktonic aggregations are induced by physical processes, and Levin (1992) supposes that, on large scales, patchy krill distribution would be induced by physical processes even though aggrega- tion behaviour may become significant at smaller scales. Finally, Zhou & Huntley (1996) suppose that behaviour plays a role in zooplankton and micronek- ton patch dynamics. Therefore, the echo structure rep- resents information which expresses physical and bio- logical phenomena as well. A morphological coding of echograms was undertaken using the method pro- posed by Petitgas & Levenez (1996). Nine different types of echogram were defined and were denoted by a 3-letter code. Presence/absence coding is made on an entire nocturnal or diurnal survey and also on 100 m strata located between the surface and 500 m. For the latter, a number between 1 and 5 was added to the 3- letter code. The different echo types are as follows:
(1) SSL are 'classic' layers, i.e. continue on a horizontal plane and are vertically homogenous (Fig. 2a); (2) moun- tain shaped layers (MSL) are SSL shaped like an inverse 'V' or a succession of 'mountains' (Fig. 2b); (3) thin scattering layers (TSL) are very thm, dense and stratified SSL (Fig. 2c) (4) loose scattering layers (LSL) are very loose SSL (Fig. 2d); (5) nucleus in scattering layers (NSL) is a dense nucleus inside more homogeneous scattering layers (Fig. 2e); (6) large aggregated structures (LAS) are large, school-shaped structures (Fig. 2f); (7) stick shaped structures (SSS) are aggregated structures with a vertical stick-like aspect (Fig. 2g); (8) small aggregates (SAG) are small aggregated struc- tures (Fig. 2h); (9) absence of echo trace (NUL).
132 Mar Ecol Prog Ser 3.91 127-140, 1999
factorial correspondence analys~s followed by ascending hierarchical clustering an- alysis, were used considenng illustrative var~ables as active. Results were similar to those of analyses presented here. The SPAD 3.5 software was used for all statisti- cal processing.
RESULTS
Profiles and cartography of back- scattering energy by surface units (sa)
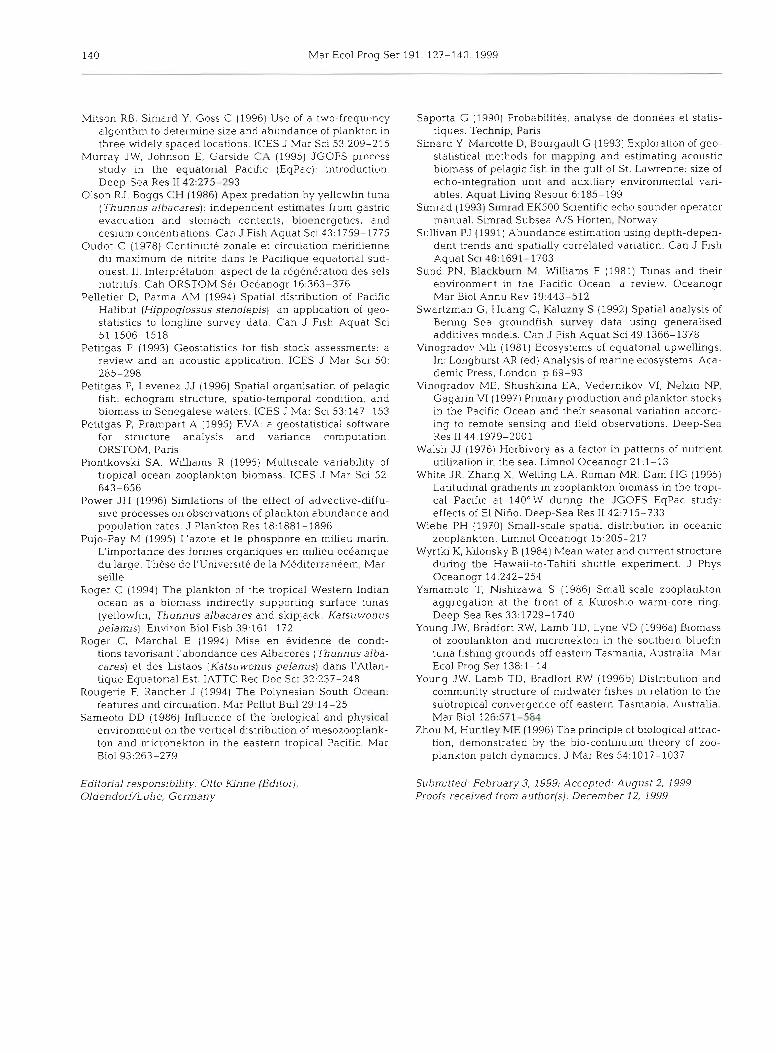
Proflles of sa from all nocturnal samples showed a clear trend, wlth maximal values lying between 10 and 150 m (Fig. 3a). Below 150 m, sa suddenly decreased, reaching very low values between 200 and 490 m. Conversely, no diurnal sample sa profiles presented any strong depth- llnked trend (Fig. 3b).
Mean latitudinal vertlcal sectlons of noc- turnal (Fig. 4a) and diurnal (Fig. 4b) sa by depth strata showed that maximum back- scattered energy was mainly located between 8 and 13" S and that the vertical range was higher in the 8 to 13's zone. The horizontal distribution of nocturnal (Fig. 5a) and dlurnal (Fig. 5b) acoustic response confirmed the b~omass maxi- mum in this area.
Multivariate analysis results
Fig 2 Echotraces defined for the habl'tat characterisation (a) 'Classic' sound ~~~~h~~ seasons nor years were structur- scatterlng layer (SSL), (b) 'mountam' or anverse 'V' shaped scattenng layer (MSL). (c) t h n scattenng layer (TSL), (d) loose scattenng layer (LSL). ing factors In the mul t~var~a te analys~s so
( e ) nudeus m scattering layer (NSL). (f) large aggregated structures (LAS), that all Or dlurnal were (g) stick shaped structures (SSS), ( h ) small aggregates (SAG) considered simultaneously Both multi-
Data processing. Multlvanate meth- Log (sa +l) Log ( sa+l )
ods are used In order to charactense the - 1 0 1 2 3 4 5 - 1 0 1 2 3 4 5
mlcronekton d~stribution Mul t~ple fac- o o tonal correspondence analys~s followed 50 M
by an ascendlng hierarchical clustermg loo 100 150 150
analys~s (Saporta 1990) were computed p - E 200
on nocturnal and dlurnal samples Van- 250 E 250
ables used as 'active' ~n analysls are the 300 o g 3,
structural dcscnbers of the scattenng 350
4 W structures (Table 3) A!1 other variables 450 450
are not used ~n calculation but are pro- 500 500
lected On as 'lllustrative' Jlq 7 i d ) Norturnal c ~ - , r l (b ) d~i l rn~r l C , , ? r r lq r pr8,ftlv< of drnlrstlr l i ack-vitttc*r~rlg ones Other multivanate methods, such t,, , u r t i ~ c , (h,, of nilcrunekhn \ v l t h t h ~ l r stan~!<,rd d~v i~ i t con n d logarithni~c as principal component analysls and scale

Bertrand et al.: Micronekton distribution in French Polynesia
log (sa+l)
l , , , , , 500
-18 -16 -14 -12 -10 4 -6
Latitude
-18 -16 -14 -12 -10 -8 -6
Latitude
log (sa+l)
Fig. 4 . Latitudinal vertical section of (a) nocturnal and [b) diurnal acoustic back-scattering by surface (sa) of micronekton on a log- arithmic scale with the 1.5 m1 1-' oxygen isoline plotted (solid line) on vertical section
-152 -150 -148 -146 -144 -142 -140 -138 -136 -134
Longitude
log (sa+l
3.5
3.4
3.2
3.0
2.8
2.6
2.4
2.2
2.1
I -1 54 -152 -150 -1 48 -146 -144 -142 -140 -138 -136 -134
Longitude
Fig. 5. Spatial distribution of (a) nocturnal and (b) diurnal acoustic back-scattering by surface (sa) of micronekton on a logarith- mic scale
variate analyses presented here on nocturnal (Fig. 6) and diurnal (Fig. 7) acoustic samples displayed a simi- lar pattern. In both cases, cluster analysis focused on a 3-class typology which allowed the study area to be divided into 3 zones, following a west-northwest/east- southeast oriented line (Fig. 8).
The first zone was located so'uth of a line stretching between l l and 14" S (Fig. 8). It was characterised by a low biomass and a low number of aggregated struc- tures. Maximal detection was located between 10 and 100 m, nocturnal and diurnal SSL was encountered at times between 200 and 300 m, and almost no diurnal SSL was observed between 400 and 500 m. The 'usual' deep nugrant layer was located during the day below 500 m as observed in situ during sporadic integrations of 100 to 600 m or 0 to 1000 m layers.
The second zone was located south of Marquesas Archipelago and north of the 11 to 14's line. It was characterised by maximal variance and biomass. At night, SAG occurred below 200 m. Concurrently, N S L were present in the SSL where the biomass maximum was found. During the day, aggregated structures of all kinds (SAG, SSS, LAS) were present on the whole ver- tical range studied. Relatively high biomasses were encountered between 400 and 500 nl as indicated by deep SSL.
The third zone, located north of the Marquesas Archipelago, had many similarities with the first zone although both zones were hydrologically very differ- ent. Micronektonic biomass had an average value with respect to the entire study area. Few nocturnal aggre- gated structures were present. The maximum noctur-

134 Mar Ecol Prog Ser 191: 127-140, 1999
Factor 2: 15.24 '3%
Factor 1: 24.32 %
Fig. 6. First 2 axes of the correspondence analysis based on the structural descriptors of the nocturnal scattering structures. Sam- ples are grouped into 3 cluster analysis classes (1 to 3). Parameters (0: absence, 1: presence) on the figure are the only ones con-
sidered significant and useful
Factor 2: 15.22 %
Factor 1: 22.5 1 %
Fig. 7 First 2 axes of the correspondence analysis based on the structural descriptors of the diurnal scattering structures. Sarn- pies are grouped into 3 cluster analysis classes (1 to 3). Parameters (0: absence, 1. presence) on the figure are the only ones con-
sidered significant and useful

Bertrand et al.: Micronekton distribution in French Polynesia 135
-4- From ECOTAP cruises 3 different character- istic zones may be defined between 4 and
-6- 20" S. Micronekton density is maximal in the central zone stretching mainly from 8 to 13"s
-8- - (Fig. 8). North and south of this zone, its den-
E sities are lower but similar, in spite of very dis- W -10- 0
tinct physico-chemical environmental condi- 3 tions which generally prevail. The equatorial k + -12-
a upwelling north of the Marquesas is a rich -I area, and the waters of the South Pacific
-14-
-16-
-18-
-20 -154 -152 -150 -148 -146 -144 -142 -140 -138 -136 -134 is known to be the origin of an increased
LONGITUDE ( W ) pelagic productivity, is said to be at the equa- tor or slightly south of it, and biomasses are
Fig. 8. Micronektonic biomass zones as dlscrirninated by multivariate known to decrease as latitude increases (Vino- analysis gradov 1981). This is true for primary produc-
tivity which is maximal between 2" N and 2" S nal biomass was located deeper than in the first zone (Lindley et al. 1995, Barber et al. 1996, Chavez et al. but almost no real SSL were present below 200 m. MSL 1996, Vinogradov et al. 1997), but not for the mesozoo- were often encountered close to the surface. During plankton maximum which is shifted several degrees to the day, fewer aggregated structures were found than the south or to the north: between 2 and 5" S for Vino- in the second zone. When they occurred, they were gradov (1981) and White et al. (1995) at 140°W. The mainly located in the upper 200 m. Detection was reason for this is that the pelagic foodweb evolves much lower below 200 m. whilst the equatorial watermasses are drifting to the
southwest. This is due to the meridian component of the South Equatorial Current (SEC) (Vinogradov 1981,
DISCUSSION Rougerie & Rancher 1994). Although Vinogradov (1981) and Lehodey et al. (1998) predict a tuna forage
The ECOTAP field programme extended over biomass maximum at the same latitude as that of the nearly 2 yr. Therefore, temporal variations could have zooplankton, ECOTAP results locate it more to the influenced the results obtained on rnicronekton den- south (Fig. 8). From what is known of the currents, sity and distribution. However, such an effect was not biogeochemistry and dissolved oxygen distributions, evidenced by the multivariate analysis, a result which it can be demonstrated that acoustically observed is in agreement with the well known temporal stabil- micronekton distribution is realistic. ity of open ocean pelagic ecosystems of the tropical The equatorial rich zone is generated by the SEC area (Cushing 1959, Walsh 1976, Landry 1981, Le divergence and is limited by 2 convergences: the Borgne et al. 1983, Longhurst 1998). It would also northern convergence between SEC and NECC (North indicate that during the study climatic variations had Equatorial Counter Current) at 4 to 5'N, and the no significant effect on the micronekton of this southern convergence between SEC and SECC (South oceanic province. Thus, the Southern Oscillation Equatorial Counter Current), around 8" s (Fig. 9). At Index (SOI), which depicts the climatic situation in 140" W, SECC is not always well marked (Rougerie & the equatorial Pacific, was positive during most of the Rancher 1994, meridional current profiles of Murray et study (from December 1995 to February 1997) and al. 1995) so that the convergence zone is weak and corresponded to a maximum extension of the high spread out in latitude. Both equatorial convergences nutrient-low chlorophyll (HNLC) area. The strong El are 'wells' of organic matter which accumulates and is Nifio which followed (as indicated by a negative SOI) mineralised, and are aggregative systems for micro- started at the very end of the study (March 1997) so nekton and nekton (Yarnamoto & Nishizame 1986, that the present results might not have been signifi- Power 1996, Kimura et al. 1997, Lehodey et al. 1997). cantly influenced by the climatic change that oc- Our measurements of the depth of the photic layer curred. illustrates this (Fig. 10): it is minimal between 8 and
0- v - . - O- 3, h'., .
(l j - b:.%;. d . - \ * ,
. . ' . *a .I <
. - . ..
central gyre south of 13"s are oligotrophic (Rougerie & Rancher 1994). These observa- tions need to be discussed since they appear to be different from general ideas raised in bibliographical data.
Classically, the equatorial upwelling, which

136 Mar Ecol Prog Ser 191. 127-140, 1999
LONGITUDE
Fig. 9. Schematic current features in the Polynesian EEZ area
12" S, a result which agrees with the particle load max- imum at the southern convergence zone.
However, micronekton could be located not in the convergence area but closer to the mesozooplankton maximum so that other factors controlling micronekton distribution, such as the distribution of dissolved oxy- gen concentrations, need to be found. Thus, minerali- sa t~on of organic matter uses oxygen, and active min- eralisation areas are therefore oxygen deficient. In the equatorial area, mineralisation of organic ma.tter starts at the base of the photic layer, In the pycnocline. As a result, ammonium and nitrite maximums are obsewed in the pycnocline, the depth of which increases from the equator to the southern convergence zone (Fig. 4 of Murray et al. 1995). Nutrient profiles of Murray et al. (1995) at 140" W can be used as reference since tem- perature, salinity an.d, dissolved oxygen distribution were very similar during the ECOTAP programme (Fig. l l ) and the Eqpac Survey 11. The value of the den- sity gradient is important when considering exchanges between the mixed layer and the deeper layers, partic- ularly as far as oxygen concentrations are concerned. Between 0 and 6" S, a strong pycnocline around 100 to 150 m leads to particularly low O2 values below 100 m (<1.5 m1 I-'). However, south of 6" S, density gradients become lower and O:! concentrations start to increase underneath the pycnocline As a result, oxygen con- centration exceeds 3.4 m1 1-' at the nitrite maximum depth between 8 and 12"s. A similar pattern has already been described in the Western Pacific (170" E) south equatorial convergence zone by Oudot (1978).
To suppose that micronekton avoids the very low oxy- gen depths prevailing below the d : i & y e r ,, , between 0 and 6" S seems to be a realistic hypot'hesis consider- ing bibliographical data and present observations. Thus, as shown in Fig. 4b, very low acoustic detections are observed during the day, underneath the 1.5 m1 1-' oxygen isoline when all ECOTAP data are considered. Similarly, Sameoto (1986), Andersen et al. (1997) and Le Borgne & Rodier (1997), report on the effect of low O2 concentrations on the vertical distribution of meso- zooplankton and micronekton. To conclude, micronek- ton would find both significant particulate biomasses and reasonable oxygen concentrations in the deep lev- els at the convergence zone.
Finally, the structure of the foodweb may partly explain micronekton biomass levels and vertical distri- bution in the ECOTAP area. In the equatorial up- welling, occurrence of macronutrients (such as nitrate or orthophosphate) in the photic layer allows prod- uction of more large phytoplanktonic cells than in oligotrophic areas which are nutrient-limited (Le Bouteiller et al. 1992). As a result, mesozooplankton diet consists of a greater proportion of phytoplankton in the former case, leading to a closer relationship be- tween phytoplankton and mesozooplankton. Accord- ing to Le Borgne & Rodier (1997), the consequence is a surface-oriented distribution and small diel migrations of the mesozooplankton of the equatorial Pacific. The inverse situation is observed in the oligotrophic areas with a more homogeneous vertical distribution and significant diel migrations. This may be the case for micronekton, which feeds on the mesozooplankton, and does not contradict the 'oxygen concentration' explanation. In the northern part of the ECOTAP area, which is situated in the equatorial upwelling, micro- nekton may be associated with mesozooplankton and
Latitude
-20 -18 -16 -14 -12 -10 -8 -6
Fig. 10. Latitudmal evolution of the euphotic layer depth determined by the depth of 1 % of incident light (ECOTAP
unpubl. data)

Bertrand et al.: Micronekton distribution in French Polynesia 137
Temperature ( O C )
Salinity
Oxygen (ml " )
BET T -
-14' - 1 3' -12O - 1 l 0 -1O0 -go -8' -7O -6' - 5 O
Latitude
Fig. 11 Temperature, salinity and dissolved oxygen from 5 to 14OS at 140" W during the ECOTAP programme (ECOTAP unpubl. data)

138 Mar Ecol Prog Ser 191. 127-140,1999
I Biomass index
5w1 Depth (m)
4 Meridional advection
-13' Mieronekton max. -8" -go Z O O P ~ . Sesto accumulation
4 Remineralisation
. - - - - - - .
+ max. -2"
-= .I'
A N Phytopk. max. +2,
*-
Deoxypnated zone
Fig. 12. Schematic representation of latitudinal distribution of phytoplankton (dotted line), zooplankton (dashed line) and micronekton (solid line) biomass in the 140" W zone with respect to latitudinal distribution of the deep deoxygenated zone
during a positive Southern Oscillation Index (SOI) period
CONCLUSION
may display a surface-oriented distribution and small to 8" S and 13 to 20°S, would generate similar bio- vertical migrations. Its habitat volume would therefore masses and aggregative distributions for different be less significant than further south. reasons.
To sum up, interpretation of larger micronekton bio- masses south of the Marquesas instead of the northern and equatorial upwelling zone relies on knowledge of the functioning of the equatorial Pacific ecosystem and of the ecology of the micronekton itself. A schematic Acoustic data collected extensively in the French diagram which synthesises present results and classic Polynesian EEZ over 2 yr, between 4 and 20" S and 134 knowledge on phytoplankton and zooplankton distrib- and 154" W, were used in the study of micronekton bio- ution can be proposed (Fig. 12) and commented as fol- mass distribution. They led to the definition of 3 differ- lows: increased primary productivity, which is gener- ent areas. The richest zone is located between Mar- ated by the divergence of the SEC at the equator, quesas and a NW-SE oriented 11 to 14"s line, and is produces zooplankton biomass, the maximum of which not as close to the equator as would be expected from is shifted further to the south (2 to 5"s ) due to the published results on primary and secondary produc- meridian component of the SEC and the generation tion latitudinal distribution. This result may be as- time of the animals. Micronekton would originate from cribed to the location of the south equatorial conver- 2 distinct zones: (1) in the maximum mesozooplankton gence, which concentrates particles and presents no area, micronekton larvae could take advantage of oxygen limitation in the deep layers. North and south phytoplankton biomasses in the photic layer and drift of the richest zone, different hydrological features, but southwards as they grow, until, after a month long trip, a comparable abundance of rnicronekton, are encoun- they find favourable conditions for metamorphosis and tered. To the north, waters are enriched by the equato- downward migration in the convergence zone (around rial upwelling, but intense organic matter reminerali- 8 to 12" S), (2) in the convergence zone itself, both lar- sation limits oxygen availability under the mixed layer. vae and adults could find the appropriate food such as To the south, waters are influenced by the great south- phytoplankton, zooplankton and particles of the mlcro- ern gyre and display oligotrophic features, which are bial foodweb whlch accumulate in the convergence. less favourable to micronekton development. South of the south equatorial convergence, micronek- From the present study, it appears that micronekton ton are no longer limited by oxygen in the deep layers, distribution and biomass rely on both trophic and envi- but by food. Thus, the 2 hydrological structures, at 4 ronmental factors. Therefore, predictive models of

Bertrand et a1 Micronekton distribution in French Polynesia 139
of tuna movements and their prey by sonic tracking and acoustlc surveys. Hydrobiologia 371/372:61-69
Kajiwara Y, Iida K, Kamei Y (1990) Measurement of target strength for the flylng squid (Ommastrephes bartrami) Bull Fac Fish Hokkaido Univ 41:205-212
Kimura S, Kasai A, Nakata H , Sugimoto T, Siinpson J H , Cheok JVS (1997) Biological productivity of meso-scale
tuna forage, which are usually based on direct rela- tionships between micronekton and lower trophic lev- els, are not always appropriate. Such models should also take environmental limiting factors, such as dis- solved oxygen, into account. Moreover, acoustic stud- ies provide a multidimensional description of micro- nekton habitat, and should be used in order to validate any modelled tuna forage description.
Acknowledgements This research was supported by the Government of French Polynesia The authors wish to thank the officers and crew of the RV ALIS' for their lund assistance dunng exper~menls Sincere thanks are extended to all of our colleagues from SRM (ex-EVAAM) IFREMER and IRD (ex- ORSTOM), who worked with us dunng the ECOTAP pro- gramme The authors are also grateful to C Oudot for his helpful discussions The authors are grateful for the helpful insights and comments of the 3 ieferees
LITERATURE CITED
Andersen V, Sardou J , Gasser B (1997) Macroplankton and micronekton In the Northeast tropical Atlantic: abun- dance, community composition and vertical distribution in relation to different trophic environments. Deep-Sea Res I 44.193-222
Barber RT, Sanderson MP, Lindley ST, Chai F, Newton J , Trees CC, Foley D (1996) Pilmary productivity and its reg- ulation in the equatorial Pacific during and following the 1991-1992 El Nino. Deep-Sea Res I1 43:933-969
Blackburn M (1968) Micronekton of the eastern tropical Pacific Ocean: family composition, distribution, abun- dance, and relations to tuna. Fish Bull US 67:71-115
Chavez FP, Buck KR, Service SK, Newton J , Barber RT (1996) Phytoplankton variability in the central and eastern tropi- cal Pacific. Deep-Sea Res I1 43:835-870
Coyle OC, Weingartner TJ, Hunt GL Jr (1998) Distnbution of acoustically determined biomass and major zooplankton taxa In the upper mixed layer re la t~ve to water masses in the western Aleutian Islands. Mar Ecol Prog Ser 165: 95-108
Cushing DH (1959) The seasonal vanation in oceanic produc- tion as a problenl in population dynamics. J Cons Int Explor Mer 24 455-464
Fiedler CP, Barlow J , Gerrodette T (1998) Dolphin prey abun- dance determined from acoustic backscatter data in east- ern Pacific surveys. Fish Bull 96:237-247
Fonteneau A (1997) Atlas of tropical tuna fisheries. World catches and environment. ORSTOM, Pans
Foote (1980) Importance of the swimbladder m acoustic scat- tering by fish. a companson of gadoid and mackerel target strength. J Acoust Soc Am 67:2084 2089
Grandperrin R (1975) Structures trophiques aboutlssant aux thons de longue hgne dans le Pacifique sud-ouest tropical These d e 1'Umversite d ' h - M a r s e i l l e 11, ORSTOM, Paris
Guillard J , Gerdeaux D, Chautru J M (1990) The use of geo- statistics for abundance estimation by echo-integration in lakes. the example of Lake Annecy. Rapp P-V Reun Cons Int Explor Mer 189-410-414
Jefferts K , Burczynski J , Pearcy WG (1987) Acoustical assess- ment of squid (Loligo opalescens) off the Central Oregon coast. Can J Fish Aquat Sci 44.1261-1267
Josse E, Bach P, Dagorn L (1998) Simultaneous observations
eddies caused by frontal disturbances in the Kuroshio ICES J Mar Sc154:179-192
Kltchell JF, Neill WH, Dizon AE, Magnuson J J (1978) Bioen- ergetic spectra of skipjack and yellowfln tunas. The phys- lcal ecology of tunas. In Sharp GD, Dizon AE (eds) The physiological ecology of tunas Academic Press, New York, p 357-368
Kloser RJ, Williams A, Koslow JA (1997) Problems with acoustic target strength measurements of a deepwater fish, orange roughy (Hoplostethus atlanticus, Collett). ICES J Mar Res 54:60-71
Koslow JA, Kloser RJ, Williams A (1997) Pelagic biomass and community structure over the mld-continental slope off Southeastern Australia based upon acoustic and midwater trawl sampling. Mar Ecol Prog Ser 146:21-35
Landry MR (1981) Switching between herbivory and car- nivory by the planktonic marine copepod Calanus pacifi- cus. Mar Biol65:77-82
Le Borgne R, Rodier M (1997) Net zooplankton and the b~olog- ical pump: a companson between the ohgotrophc and meso- t roph~c equatorial Pacific. Deep-Sea Res I1 44:2003-2023
Le Borgne R, Herbland A, Le Boutelller A, Roger C (1983) Zooplankton and micronekton biomass in the open-ocean of the Gulf of Guinea. relations with phytoplankton and partlculate matter. Oceanogr Trop 18:419-460
Le Boutedler A, Blanchot J , Rodier M (1992) Size distnbution patterns of phytoplankton In the Western Pacific: towards a generalisation for the tropical open ocean. Deep-Sea Res 39:805-823
Legand M, Bourret P, Fourmanoir P, Grandperrin R, Guere- drat JA, Michel A, Rancurel P, Repelin R, Roger C (1972) Relations trophiques et distributions verticales e n milieu pelagique dans l 'Ocean Paclfique intertropical. Cah ORSTOM Ser Oceanogr 10:303-393
Lehodey P, Bertignac M, Hampton J , Lewis A, Picaut J (1997) El Niiio southern oscillation and tuna in the western Pacific. Nature 389 715-718
Lehodey P, Andre JM, Bertignac M, Hampton J , Stoens A, Menkes C , Memery L, Gnma N (1998) Predicting skipjack tuna forage distributions in the equatorial Pacific using a coupled dynamical bio-geochernical model Fish Oce- anogr 7.317-325
Levin SA (1992) The problem of pattern and scale in ecology. Ecology ?3:1943-1967
Lindley ST, B~digare RR, Barber KT (1995) Phytoplankton photosynthesis parameters along 140" W in the equatorial Pacific Deep-Sea Res I1 42:441-463
Longhurst A (1998) Ecological geography of the sea. Acade- m c Press, London
MacLennan DN, Simmonds EJ (1992) Fisheries acoustics. Chapman and Hall, London
Marchal E, Lebourges A (1996) Acoustic evldence for unusual die1 behaviour of a mesopelagic fish (Vincinguerna nlm- bana) exploited by tuna. ICES J Mar Sci 53-443-447
Marchal E, Gerlotto F, Stequert B (1993) On the relationship between scattering layer, thermal structure and tuna abundance in the Eastern Atlantic Equatorial current sys- tem. Ocean01 Acta 16:261-272
Matheron G (1965) La theorie des variables regionalisees e t ses applications Masson e t Cie, Paris
140 Mar Ecol Prog Ser 191. 127-140, 1999
Mitson RB, Simard Y, Goss C (1996) Use of a two-frequvncy algorithm to determine size and abundance of plankton in three widely spaced locations. ICES J ~Var Sci 53:209-215
Murray JW, Johnson E, Garside CA (1995) JGOFS prnrpss study in the equatorial Pacific (EqPac): introduction. Deep-Sea Res I1 42:275-293
Olson RJ, Boggs CH (1986) Apex predation by yellowfin tuna (Thunnus albacares): independent estimates from gastric evacuation and stomach contents, bioenergetics, and cesium concentratlons. Can J Fish Aquat Sci 43:1759-1775
Oudot C (1978) Continuite zonale et circulation meridienne du maximum de nitrite dans le Pacifique equatorial sud- ouest. 11. Interpretation: aspect de la regeneration des sels nutritifs. Cah ORSTOM Ser Oceanogr 16:363-376
PeUetier D, Parma AM (1994) Spatial distribution of Pacific Halibut (Hippoglossus stenolepls). an applicati.on of geo- statistics to longline survey data. Can J Fish Aquat Sci 51:1506-l518
Petitgas P (1993) Geostatistics for fish stock assessments: a review and an acoustic application. ICES J Mar Sci 50: 285-298
Petitgas P, Levenez JJ (1996) Spatial organisation of pelagic fish: echogram structure, spatio-temporal condition, and biomass in Senegalese waters. ICES J Mar Sci 53:147-153
Petitgas P, Prampart A (1995) EVA: a geostati.stica1 software for structure analysis and variance computation. ORSTOM. Paris
Piontkovski SA. Williams R (1995) Multiscale variability of tropical ocean zooplankton biomass. ICES J Mar Sci 52: 643-656
Power JH (1996) Simlations of the effect of advective-diffu- sive processes on observations of plankton abundance and population rates J Plankton Res 18.1881-1896
Pujo-Pay M (1995) L'azote et le phosphore en milieu marin. L'importance des formes organiques en milieu oceanique du large. These de l'universite de la Mediterraneem, Mar- seille
Roger C (1994) The plankton of the tropical Western Indian ocean as a b~omass indirectly supporting surface tunas (yellowfin, Thunnus albacares and skipjack, Katsuwonus pelamis). Envjron Biol Fish 39.161-172
Roger C, Marchal E (1994) Mise en evidence de condi- tions favorisant l'abondance des Albacores (Thunnus alba- cares) et des Listaos (Katsuwonus pelamis) dans 1'Atlan- tique Equatorial Est. IATTC Rec Doc Sci 32:237-248
Rougerie F, Rancher J (1994) The Polynesian South Ocean: features and circulation. Mar Pollut Bull 29:14-25
Sameoto DD (1986) Influence of the biological and physical environment on the vertical distribution of mesozooplank- ton and micronekton in the eastern tropical Pacific. Mar Bio193:263-279
Editorial responsibility: Otto IOnne (Editor), Oldendorf/Luhe, Germany
Saporta G (1990) Probabilites, analyse de donnees et statis- tiques. Technip, Paris
Sirnard Y, Marcotte D, Bourgault G (1993) Exploration of geo- statist~cal methods for mapping and estimating acoustic biomass of pelagic fish in the gulf of St. Lawrence: size of echo-integration unit and auxiliary environmental vari- ables. Aquat Living Resour 6:185-199
Simrad (1993) Simrad EK500 Scientific echo sounder operator manual. Simrad Subsea A/S Horten, Norway
Sullivan PJ (1991) Abundance estimation using depth-depen- dent trends an.d spatially correlated variation. Can J Fish Aquat Sci 48:1691-1703
Sund PN, Blackburn M, Williams F (1981) Tunas and their environment in the Pacific Ocean: a review. Oceanogr Mar Biol Annu Rev 19:443-512
Swartzman G. Huang C, Kaluzny S (1992) Spatial analysis of Bering Sea groundfish survey data using generalised additives models. Can J F ~ s h Aquat Sci 49:1366-1378
Vinogradov ME (1981) Ecosystems of equatorial upwellings. In: Longhurst AR (ed) Analysis of marine ecosystems. Aca- demic Press, London, p 69-93
Vinogradov ME, Shushkina EA, Vedernikov VI, Nelzin NP, Gagarin V1 (1997) Primary production and plankton stocks in the Pacific Ocean and their seasonal variation accord- ing to remote sensing and field observations Deep-Sea Res I1 44.1979-2001
Walsh JJ (1976) Herbivory as a factor in patterns of nutrient utilization in the sea. Limnol Oceanogr 21:l-13
White JR, Zhang X, Welling LA, Roman MR, Dam HG (1995) Latitudinal gradients in zooplankton biomass in the tropi- cal Pacific at 140°W during the JGOFS EqPac study: effects of El Niiio. Deep-Sea Res I1 42:715-733
Wiebe PH (1970) Small-scale spatial distribution in 0ceani.c zooplankton. Limnol Oceanogr 15:205-217
CVyrtki K, Kilonsky B (1984) Mean water and current structure during the Hawaii-to-Tahiti shuttle experiment. J Phys Oceanogr 14:242-254
Yamamoto T, Nishizawa S (1986) Small-scale zooplankton aggregation at the front of a Kuroshio warm-core ring. Deep-Sea Res 33:1729-1740
Young JW, ~radfor t RW, Lamb TD, Lyne VD (1996a) Blomass of zooplankton and mlcronekton in the southern bluefin tuna fishing grounds off eastern Tasmania. Australia. Mar Ecol Prog Ser 138:l-14
Young JW. Lamb TD, Bradfort RW (1996b) Distribution and community structure of midwater fishes in relation to the subtropical convergence off eastern Tasmania, Australia. Mar Biol 126:5?1-584
Zhou M, Huntley ME (1996) The principle of b~ological attrac- tion, demonstrated by the bio-continuum theory of zoo- plankton patch dynamics. J Mar Res 54:1017-1037
Submitted: February 3, 1999; Accepted: August 2, 1999 Proofs received from author(s)r December 12, 1999