1 social class, pupil composition, pupil - university of bath
TRANSCRIPT
1
Social Class, Pupil Composition, Pupil Progress and School Performance: An Analysis of Primary Schools Hugh Lauder, Daphne Kounali, Tony Robinson, Harvey Goldstein and Martin Thrupp This paper investigates the effects of pupil composition in primary schools.
There has been considerable debate about the nature and effects of pupil
composition, by which we mean the effects the student body may have on
school outcomes independent of individual pupil characteristics such as their
social class, gender, and ethnicity backgrounds and whether they have
learning difficulties.
The debate has been ‘alive’ since the publication of Coleman’s et al’s (1966)
celebrated report because it is central to two related concerns: the nature of
school effectiveness and appropriate policies to raise school effectiveness.
With respect to the former Thrupp and Hirsch (2006) have argued that we can
identify two ideal typical positions, the first claims that school effectiveness is
a function of school management and teacher performance, while the latter
claims that social factors (e.g., social class) determine pupil outcomes in
schools. In this respect, pupil composition can be seen as one social factor
that may be significant in determining pupil outcomes. However, they note
that we can consider these two positions as at the ends of a spectrum and
that much of the debate centres on the relative contributions of schools and
teachers and social factors.
In policy terms, the debate is crucial because if indeed it were to be the case
that school management and teacher performance were key to school
effectiveness, then the focus would be on the policy levels that would best
raise school performance. It can be argued that policy makers have focussed,
over the past twenty years, on these factors by enlisting the support of some
school effectiveness and improvement studies (Goldstein and Woodhouse,
2000). Policy makers claimed that reference to social factors, is no more than
an excuse for poor performance made by educators.

2
In England and to some extent the United States this has led to two specific
sets of policy: a) what may be called the state theory of learning (Lauder,
Brown, Dillabough and Halsey, 2006) and b) the introduction of market
mechanisms. The state theory of learning in England is based on the idea that
a combination of the repeated high stakes testing of pupils, a national
curriculum, and in primary schools mandated pedagogy, with respect to
numeracy and literacy will raise ‘standards’. High stakes testing is meant to
hold schools and increasingly teachers to account while it is also intended to
provide feedback for students. Students are set targets related to the tests
and their progress is monitored in relation to them. These policies presuppose
a theory of motivation in which children are stimulated to achieve the test
results while teachers similarly have the spur of achieving high test results
since their school with be judged against others in published league tables.
Of particular relevance to the findings presented below, schools are usually
judged only in terms of their overall test results and rarely in terms of pupil
progress. In our study, we introduce value added measures by which schools
may be judged according to a range of measures associated with social class,
prior achievement and composition variables relating to these. Official studies
have used limited contextual measures of value added, although there remain
major issues as to how they have been used (Goldstein, 2007). As we detail
below, the official value added measures are limited because they do not
include a range of key variables, amongst them composition variables. How
school performance is measured is important because where schools do not
achieve expected test results or in principle, appropriate levels of pupil
progress a battery of measures can be externally imposed on a school to
raise test results (Lauder, Brown, Lupton, Hempel-Jorgensen and Castle,
2006), raising questions about teacher’s professional autonomy and morale.
In addition to these state spurs and sanctions, the market mechanism of
parental choice is also seen as a way of driving up ‘standards’, in that schools
which do not attract pupils to fill their allocated rolls may be penalised
financially and ultimately threatened with closure. This latter policy is
particularly germane to the question of the nature of the pupil body since
3
studies have shown that parental choice has an impact on the flows of
students to schools, according to social class, gender and ethnicity (Lauder,
Hughes, et al, 1999).
In summary, the question of whether pupil composition has a significant
impact on school performance assumes a central position with the debate
over school effectiveness for two reasons: in so far as pupil composition does
not enter into official judgements about school performance, it may be that
schools and teachers are wrongly held responsible for their school’s
performance. Official government statistics in England take into account
various contextual measures in assessing school performance but they do not
take into account a key consideration in this paper as to whether, for example,
a disadvantaged pupil in a predominantly high social class school will perform
better than one in a predominantly low social class school. Moreover, if
parental choice significantly alters the pupil composition of schools such that,
for example, they become more polarised in terms of social class intake and
this is found to have a bearing on pupil outcomes, then fundamental questions
will be raised about this policy.
The Debate
The literature on the effects of pupil composition has been extensive and
while it is probably fair to say that the balance of evidence favours the
existence of such effects, there is no consensus (Thrupp, 1997, Nash, 2004).
After three decades of studies reporting either the presence or absence of
composition effects attention has turned to the basis for disagreement and
these have turned on both theoretical and methodological issues.
Theoretically, the question of how pupil composition might affect school and
individual pupil outcomes, was not given sustained consideration until the
advent of Thrupp’s work (1999). He outlined three ways in which pupil
composition might affect school and pupil outcomes: through peer
subcultures, instruction and the curriculum and school policies and illuminated
his theory with an ethnographic study of working and middle class schools. He
hypothesised that peer subcultures might either support school aims and
4
processes or resist them. In schools with a high proportion of working class
youth schools there was a greater possibility of classroom disruption. In turn
instruction and the curriculum are changed to seek to arrest their interest.
However, at a policy level more time is spent on issues of discipline and ways
of funding non core activities. At these three different but related levels,
Thrupp (1999) argues that pupil composition has a significant impact on
school and individual performance.
However, Thrupp’s theoretical work arose our of the study of secondary
schools and it is not immediately obvious that the pupil level aspect of his
theory has application in primary schools largely because while we might
expect to see issues of discipline and social control as of significance in some
schools (Hempel-Jorgensen, 2007), these are unlikely to coalesce around
sub-cultures of resistance in the sense, described for example, by Willis
(1977).
The contrary view has been most consistently advanced by Nash (see, e.g.,
2003, 2006), who makes two points. The first , which reflects a position he
has developed over twenty years, is that the experiences of the early
childhood years develop a cognitive habitus which largely determines future
school careers, hence;
Discussion of the school composition effect and its relevance to school effectiveness should be located more securely in the larger debate about the relationships between social class, early childhood socialisation, the development of cognitive and no cognitive habitus and the responsibility of the school for the learning outcomes of its students. (2003. p.453).
Added to this theoretical position is a methodological critique by which he
argues that the causes of what we observe in schools may lie outside the
school of which composition effects may be an example. He cites Bourdieu
(1999) who argues that:
[t]he perfectly commendable wish to see things in person, close up, sometimes leads people to search for the explanatory principles of

5
observed realities where they are not to be found (not all of them, in any case), namely, at the site of observation itself (p.181).
Nash’s critique is directed at ethnographic studies such as Thrupp’s and not
at quantitative studies which he sees as the essential precursor to qualitative
studies which seek to explain observed quantitative effects.1
There are three points to make in thinking about studies investigating
compositional effects to emerge from this debate. Firstly, causes that can be
attributed to school effects as opposed to wider societal effects are always a
matter of theoretical contestation, especially in relation to those processes
which appear to cross the border between school and society (Lauder,
Jamieson and Wikeley, 1998). This is one reason why studies of school
effectiveness should be theoretically driven. Secondly, it follows that Nash is
correct in his methodological critique, which is why studies of school
effectiveness should both be quantitative and qualitative, since quantitative
studies should enable the identification of effects, if not necessarily the
causes. Finally, and most importantly for this study we need to unpack the
notion of social class that is being used because it is germane to the two
positions outlined above and more directly to present government policies: in
particular, whether we can distinguish between three components that are
often associated with social class: status, education and income.
Social Class, Income and Education
Typically in class analyses the underlying variable that links these factors is
that of power. Power in this respect has three dimensions, power over others
and of the degree of autonomy that it confers at work and that accrues at
home through disposable income. In this context education can be seen as
related to the technical demands of work and also to the authority and status
that it confers. Here Kohn’s (1977) research is significant because he argues
that it is professional middle class parents’ sense of power over their destiny
1 Although, Thrupp (1999) is well aware of this problem noting that there may be factors that are
school based but not school caused (p.5).

6
which is given to them by their paid work and which they communicate to their
children that enables them to perform well at school.
In relation to this study we are interested in distinguishing, where possible,
between social class as reflected in occupation and its attendant relations of
power and income. This is for two reasons. The first concerns the theoretical
position outlined by Nash (see especially his 2006). For Nash, it is family
cultural resources in particular reading that are germane to future educational
performance. Here social class is translated into a particular cultural
orientation. The material basis in terms of income although not dismissed is
downplayed. Mayer (1997) has perhaps the clearest argument as to the view
that it is the culture of parents in poverty and the nature of their parenting
rather than income which explains the relationship between poverty and
school underperformance.
However, the present government’s strategy for reducing child poverty is
largely focussed on raising the income of those in poorly paid work through
amongst other policies, working tax credits. These are given to families where
one adult is in low paid work. In 2005, when the data on our families were
collected, a couple or lone parent with one dependent child under 11 and a
gross annual income of up to about £13,500 would have been eligible for
WTC, although those with higher incomes would also be eligible if they were
paying for childcare, or were disabled, or working more than 30 hours per
week, or if they had more children.
If Mayer (1997) is correct then we should not expect this policy to have any
effect on schooling, indeed it could be argued that with respect to schooling at
least this policy merely throws good money after bad.
Therefore, in this paper we have attempted to distinguish various measures of
income from the more omnibus measure of social class. In particular our data
enables us to identify those that are: unemployed, in rented accommodation
and in receipt of WTCs. The distinction between rented accommodation and
home ownership may be considered important since home ownership

7
presupposes a degree of wealth accumulation which is absent for those that
are renting.
It will be apparent that there is considerable overlap between concepts of
social class and income, most clearly seen perhaps in relation to the
unemployed where paid work confers no sense of status and work and
reduces choices outside work due to low income. However, it may be that
raising income to a certain minimum level reduces stress within the home and
confers a note of hope, both of which may translate into school performance.
Testing the Pupil Composition Thesis in Primary Schools
There are several reasons as to why a study of primary schools might be
considered a particularly stringent test of the pupil composition thesis. Firstly,
given the view that it might well be the creation of pupil sub-cultures of
resistance that are the source of a composition effect, for the reasons given
above, they well be absent from primary schools. Secondly, one of the
reasons why this might be the case is that primary schools tend to be small
and pupils are unlikely to avert the ‘gaze’ of teachers. Hence, even if sub-
cultures of resistance were nascent within the primary school they are less
likely to develop. Thirdly, pupils of primary school may not have generated the
identities necessary to create groups which challenge the teachers’ and
school’s goals. However, at the organisational level because primary schools
are smaller schools the compositional effects on the organisation may be
larger; by the same token, the issues raised by composition may be easier to
handle. In the event, there have been few large scale studies of school
effectiveness in primary schools that have taken composition into account and
where they have the analysis using social class has been relatively crude
(e.g. Mortimore, Sammons, Stoll, Lewis and Ecob,1989).
These considerations provide a theoretical framework for this study. However,
in addition to the theoretical debate, there has been a related debate about
methods. This latter debate is concerned with the extent to which conflicting
methods and error could give rise to dubious claims over compositional effect.
8
It is these methodological differences, it is argued, that have led to
disagreement over the presence and nature of compositional effects.
The Methodological Debate
There are two major issues with respect to methodology that can explain the
unresolved nature of the debate over compositional effects. These relate to
the techniques and sampling used in order to identify compositional effects
and which have sometimes been termed phantom effects (Harker and
Tymms,2004). Thrupp, Lauder and Robinson (2002) have noted that there are
few studies that conform to what they argue would approximate to the ideal
with respect to techniques and sampling. As a consequence, it may well be
that whether composition effects are identified will be a function of differences
in the sample and techniques used. In outlining what they consider to be a
desirable model with respect to sampling they argue for the following criteria:
First, the sample should include schools from both ends of the socio-
economic spectrum. School compositional effects are unlikely to appear in
reasonably well-mixed schools because there may be countervailing factors
involved: the effects of school composition could be cancelled out by student
sub-cultures in which those of high prior achievement excelled, while those of
lower prior achievement generated a culture of resistance and school failure.
Second, a full set of entry-level variables, including prior achievement
variables, need to be included. Entry level variables should include measures
of social class for the sample population, this has rarely been the case in
England and Wales where the measure Free School Meals typically has been
used. We have shown this measure to be highly unreliable in identifying
disadvantaged pupils and as a predictor of subsequent performance (Kounali,
Robinson, Goldstein and Lauder, 2007). Third, there should be measures that
can capture the possible correlations between the theoretical dimensions of
the school composition model (such as peer group processes, instructional,
and school organisational and management processes). It is noteworthy that
many school effectiveness studies are not whole school studies in the sense
that not all pupils are sampled. Typically, it is particular years that are
9
sampled. This then raises a question about how representative a year can be
of a school. But we can also distinguish between schools in terms of the
different levels described above (e.g. pupils, curriculum and policy). For
analytical purposes then we can distinguish between the notion of a school as
reflecting all the pupils in the school and the notion of a school as having
different levels. These points will be germane to the discussion below. Fourth,
a combination of compositional variables (e.g., prior achievement or social
class composition) should be constructed in order to measure the various
dimensions of pupil composition. Fifth, different techniques for measuring
composition should be used. The typical measure employed is the mean in
measuring, for example, social class composition, however ratios of high to
low social class distribution could also be used. Sixth, where possible, a mix
of school types would be included in the sample including denominational
schools. This is because in the United States, for example, catholic schools
have been identified as performing a little better than public schools. Sixth,
where possible the study should be longitudinal. Finally, we assume that
studies should conduct their analyses using appropriate statistical methods
which respects the dependence structure characterizing such data i.e. multi-
level modelling.
In addition to these criteria, there are several other factors that need to be
taken into account: these include seeking to capture elements of the
dynamics of the markets in primary schools and the question of pupil
turbulence. By turbulence we mean ‘A child joining or leaving school at a point
other than the normal age in which children start or finish their education at
that school, whether or not this involves a move of home’ (Dobson and
Henthorne, (1999:5). The question of turbulence is of significance because
some 43 per cent of pupils move primary school at least once between the
ages of 7 and 11: in some areas and schools the turbulence is far higher. The
issue of turbulence has not been widely considered in the school
effectiveness and improvement literatures but it was part of the remit for this
project. Indeed, it is only since the inception of this project that a detailed
analysis has been undertaken by one of us (Goldstein, Burgess and
McConnell, 2007). Finally, within our sample there were schools with high
10
proportions of students that had been categorised as having special
educational needs. How such pupils are categorised is problematic because
for there is variability from local authority to local authority and schools with
respect to how the ‘school action’ and ‘school action +’ categories of SEN are
determined and especially with respect to the later because of the resource
implications involved.
With respect to the possibility of phantom effects Harker and Tymms (2004)
have noted that in multilevel models composition effects can be identified
erroneously if at level 1 if there are poorly measured variables. They go on to
argue that while it is possible for a variable to be validly measured at level 1, if
covariates are added and the effect disappears then this may not be a
question of validity but a whole model issue. If the variables at level 1 have
strong validity but the compositional effect disappears this, they argue,
suggests the presence of an indirect effect in which for example there is a
relationship between teacher quality and the composition effect – in this case
that high quality teachers are attracted by the nature of the pupil body.
Given these considerations we move to a description of the sample.
Study design: The HARPS project
The HARPS project is an acronym for ‘Hampshire Research with Primary
Schools’ and looks at the impact of school composition upon student
academic progress. The main aim of the study is to estimate and better
understand compositional effects at the primary school level. Compositional
variables included in this study will be; social class (SES, Appendix 2)2,
ethnicity, gender, prior achievement, special educational needs (SEN) and
age.
The research design is both quantitative and qualitative. Like a set of Russian
dolls the project design is of 3 nested parts:
2 Social class has been classified according to the Goldthorpe-Hope (1974) scale, this operationalises a
theory of class, rather than socio-economic status, however as an abbreviation we have used the term
SES.
11
1. A large scale analysis of over 300 primary schools
2. A study of a subsample of 46 schools in one urban school area,
Greenwood (pseudonym).
3 More detailed case studies of 12 schools.
Hampshire-wide data: Our original population cohort consists of 11793 (51%
boys) of all Hampshire pupils who took the baseline test during 2001-2002
and their KS1 tests during 2003-2004. We have test results for approximately
84% of this cohort. The Hampshire-wide size of the cohort of Reception pupils
from PLASC 2001/02 is 14329 and the size of the Yr2 pupils from PLASC
2003/04 is 14308.
The pattern of longitudinal losses in terms of test-results seems quite typical
for Hampshire for this phase, judging for the historical cohort data provided by
the Hampshire LEA. Examination of these historical cohorts showed that a
wave of around 2000 pupils are systematically lost as we move in time
because they are leaving the schools and another wave of 2000 new pupils
are coming-into to these schools.
Because of data-inconsistencies related to correctly identifying and recording
school changes (school mergings) we ended-up looking at 11702 pupils for
the phase - Baseline to KS1 data. These pupils come from 318 (Infant or
Junior and Primary Schools) at baseline and 302 schools at KS1.
This cohort is also followed-up to the QCA3 phase: Hampshire managed to
get QCA3 from 200 schools contributing data for 8730 pupils. However, this
sample resulted in a 61% follow-up for our cohort up from baseline to QCA3.
More specifically, only 7092 pupils from our cohort also have QCA3 and 4610
did not. Also another 1638 pupils were added to our cohort for whom baseline
and KS1 test results were not available. The KS1 test results for these 1638
pupils were traced through the National Pupil database. It was not possible
however to trace their baseline scores since these tests are not standard
across LEAs – the baseline score we used for our cohort is in fact a
12
Hampshire standard.
We have chosen the subsample of 46 schools, as the focus for this paper
because it enables us to approximate closely to the sample specification
outlined above, we have collected and analysed detailed family background
information from the year 3 children in the 46 Greenwood schools. The
Greenwood subsample contains family background data on 1653 year 3
pupils from a total of 2012 students attending 46 out of all 50 schools in the
Greenwood area during the second semester of the academic year 2004 -
2005. Relevant to economic status these data include: occupational group
(Goldthorpe and Hope 1974, Appendix 2), working status; home ownership;
whether in receipt of Working Tax Credit; whether in receipt of FSM, level of
education of the parents, and house movements during the child’s lifetime.
3The deprivation geography of Hampshire according to the multiple
deprivation index suggests that the children attending the selected
Greenwood schools are not among the most deprived in Hampshire, but it
does include pockets of particularly deprived areas, thus in principle, covering
the deprivation spectrum.
This sample of schools seemed appropriate in order to control for the
selection bias typically present in studies of this type. Such studies involve the
distribution of a questionnaire which attempts to record information on the
social class background of the family including occupation. Previous research
suggests that higher the social class of the family the more likely they are to
respond in surveys in comparison to their lower social class counterparts
(Goyder, Warriner et al. 2002). Our sample does not seem to be exempt from
these difficulties. Despite the high questionnaire return rates (85%), we have
found that non-responders were twice more likely to be FSM eligible
according to their LEA records.
The majority of the responders were the mothers of the children (87%) or the
mother and the father (1.3%) and less than 1% was not the child’s parent.
3 Details of how these data were collected are in Brown and Thrupp (2005).

13
Female responders accounted for 90% of the returned questionnaires. This is
also a sample predominantly white with 92.7% of the responders being white-
British or Irish, another 3.4% being white-mixed and another 3.3% all other
racial backgrounds.
In addition to data on these factors we also had data supplied by Hampshire
LA on pupils’ baseline and KS1 scores, turbulence within schools in terms of
pupils entering and leaving schools, and absences and various levels of
special needs.
Quantitatively, we could look at value added between years 3 and 4 because
we administered QCA tests in both years. This meant that we had progress
data on, students that started with baseline tests, KS1, QCA 3 and QCA 4
tests. In this paper we have used valued added measures from baseline and
KS1 to QCA 3 in reading and mental arithmetic. Reading competence, it can
be argued, is essential for all forms of education although it may also be
highly related to social class cultural capital (Nash, 2006). In contrast learning
in maths is typically seen to be more subject to the influence of the school and
less of the home. For reasons we give in Appendix 1 we have only be able to
use the mental arithmetic element of the QCA3 maths test.
Modelling Achievement and Progress
We have fitted a multilevel model with the QCA reading and mental arithmetic
test scores as response and the following set of variables as predictors given
in Table 1, with the detailed results given in Table 2.
A formal statement of the model is as follows:

14
=ΣΣ
=ΣΣ
++++=
++++=
∑
∑
2
Re,/Re,
2
Re,
,
,Re
2
1,1,Re,1,0,1,0,Re,1,
2
1,Re0,,1,Re0,1,Re
2
0,0,0,/Re
2
0,Re
,1,
,1,Re
,0,
,0,Re
,,,1,,0,,0,,
,Re,Re,1,Re,0,Re,0,Re,Re
),,0(~
),,0(~
1
1
2
1
adingeMathsadinge
adinge
ee
ijMaths
ijading
MathsadingMathsMathsadMaths
adingMathsadingading
MathsMathsading
ading
uu
jMaths
jading
jMaths
jading
k
ijMathsijMathsjMathsjMathsijkkMathsijMaths
k
ijadingijadingjadingjadingijkkadingijading
Ne
e
N
u
u
u
u
eKSuuxy
eKSuuxy
σσ
σ
σσσσ
σσσ
σσ
σ
ββ
ββ
where i indexes individual pupils and j indexes schools
y denotes the response variable
β denotes the regression coefficients quantifying the effect of each predictor
x on the response
u0 denotes between school variation in scores attained for reading and maths
respectively
u1 denotes between school variation in progress made from KS1 for reading
and maths respectively
e denotes the residual pupil-level variance.
Variable Construction and Results
The tables below present the following data:
Table 1: Pupil level data with respect to prior achievement and pupil outcomes
related to class organization characteristics.
Table 2: Pupil Level data with respect to aspects of income and social class.
Table 3: School and classroom effects.
Table 4: Between school variation and progress.
15
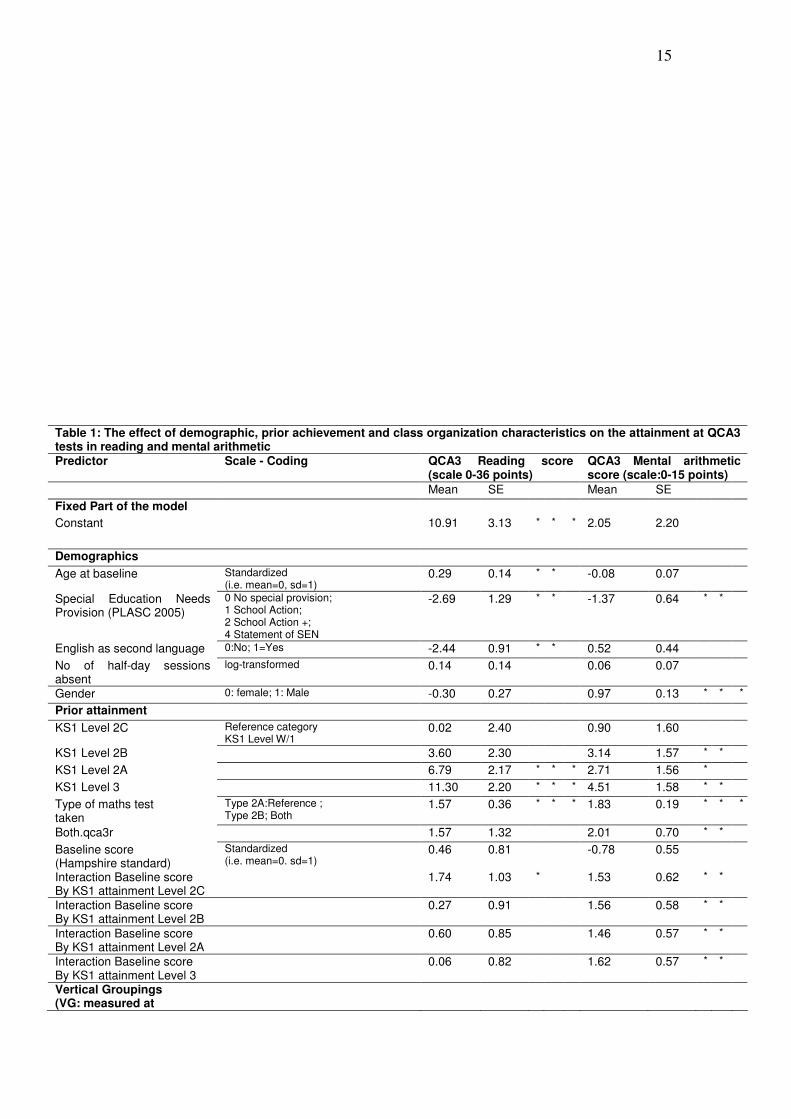
Table 1: The effect of demographic, prior achievement and class organization characteristics on the attainment at QCA3 tests in reading and mental arithmetic Predictor Scale - Coding QCA3 Reading score
(scale 0-36 points) QCA3 Mental arithmetic score (scale:0-15 points)
Mean SE Mean SE
Fixed Part of the model
Constant 10.91 3.13 * * * 2.05 2.20
Demographics
Age at baseline Standardized (i.e. mean=0, sd=1)
0.29 0.14 * * -0.08 0.07
Special Education Needs Provision (PLASC 2005)
0 No special provision; 1 School Action; 2 School Action +; 4 Statement of SEN
-2.69 1.29 * * -1.37 0.64 * *
English as second language 0:No; 1=Yes -2.44 0.91 * * 0.52 0.44
No of half-day sessions absent
log-transformed 0.14 0.14 0.06 0.07
Gender 0: female; 1: Male -0.30 0.27 0.97 0.13 * * *
Prior attainment
KS1 Level 2C Reference category KS1 Level W/1
0.02 2.40 0.90 1.60
KS1 Level 2B 3.60 2.30 3.14 1.57 * *
KS1 Level 2A 6.79 2.17 * * * 2.71 1.56 *
KS1 Level 3 11.30 2.20 * * * 4.51 1.58 * *
Type of maths test taken
Type 2A:Reference ; Type 2B; Both
1.57 0.36 * * * 1.83 0.19 * * *
Both.qca3r 1.57 1.32 2.01 0.70 * *
Baseline score (Hampshire standard)
Standardized (i.e. mean=0. sd=1)
0.46 0.81 -0.78 0.55
Interaction Baseline score By KS1 attainment Level 2C
1.74 1.03 * 1.53 0.62 * *
Interaction Baseline score By KS1 attainment Level 2B
0.27 0.91 1.56 0.58 * *
Interaction Baseline score By KS1 attainment Level 2A
0.60 0.85 1.46 0.57 * *
Interaction Baseline score By KS1 attainment Level 3
0.06 0.82 1.62 0.57 * *
Vertical Groupings (VG: measured at
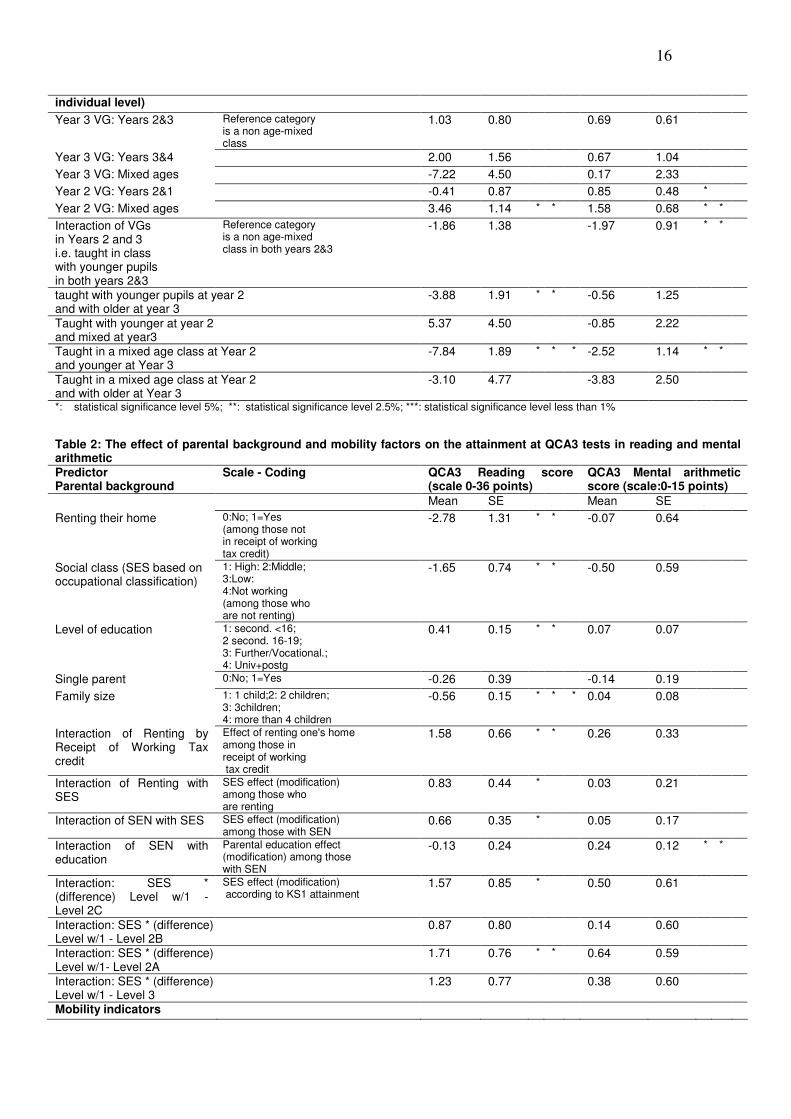
16
individual level)
Year 3 VG: Years 2&3 Reference category is a non age-mixed class
1.03 0.80 0.69 0.61
Year 3 VG: Years 3&4 2.00 1.56 0.67 1.04
Year 3 VG: Mixed ages -7.22 4.50 0.17 2.33
Year 2 VG: Years 2&1 -0.41 0.87 0.85 0.48 *
Year 2 VG: Mixed ages 3.46 1.14 * * 1.58 0.68 * *
Interaction of VGs in Years 2 and 3 i.e. taught in class with younger pupils in both years 2&3
Reference category is a non age-mixed class in both years 2&3
-1.86 1.38 -1.97 0.91 * *
taught with younger pupils at year 2 and with older at year 3
-3.88 1.91 * * -0.56 1.25
Taught with younger at year 2 and mixed at year3
5.37 4.50 -0.85 2.22
Taught in a mixed age class at Year 2 and younger at Year 3
-7.84 1.89 * * * -2.52 1.14 * *
Taught in a mixed age class at Year 2 and with older at Year 3
-3.10 4.77 -3.83 2.50
*: statistical significance level 5%; **: statistical significance level 2.5%; ***: statistical significance level less than 1%
Table 2: The effect of parental background and mobility factors on the attainment at QCA3 tests in reading and mental arithmetic
Predictor Parental background
Scale - Coding QCA3 Reading score (scale 0-36 points)
QCA3 Mental arithmetic score (scale:0-15 points)
Mean SE Mean SE
Renting their home 0:No; 1=Yes (among those not in receipt of working tax credit)
-2.78 1.31 * * -0.07 0.64
Social class (SES based on occupational classification)
1: High: 2:Middle; 3:Low: 4:Not working (among those who are not renting)
-1.65 0.74 * * -0.50 0.59
Level of education 1: second. <16; 2 second. 16-19; 3: Further/Vocational.; 4: Univ+postg
0.41 0.15 * * 0.07 0.07
Single parent 0:No; 1=Yes -0.26 0.39 -0.14 0.19
Family size 1: 1 child;2: 2 children; 3: 3children; 4: more than 4 children
-0.56 0.15 * * * 0.04 0.08
Interaction of Renting by Receipt of Working Tax credit
Effect of renting one's home among those in receipt of working tax credit
1.58 0.66 * * 0.26 0.33
Interaction of Renting with SES
SES effect (modification) among those who are renting
0.83 0.44 * 0.03 0.21
Interaction of SEN with SES SES effect (modification) among those with SEN
0.66 0.35 * 0.05 0.17
Interaction of SEN with education
Parental education effect (modification) among those with SEN
-0.13 0.24 0.24 0.12 * *
Interaction: SES * (difference) Level w/1 - Level 2C
SES effect (modification) according to KS1 attainment
1.57 0.85 * 0.50 0.61
Interaction: SES * (difference) Level w/1 - Level 2B
0.87 0.80 0.14 0.60
Interaction: SES * (difference) Level w/1- Level 2A
1.71 0.76 * * 0.64 0.59
Interaction: SES * (difference) Level w/1 - Level 3
1.23 0.77 0.38 0.60
Mobility indicators
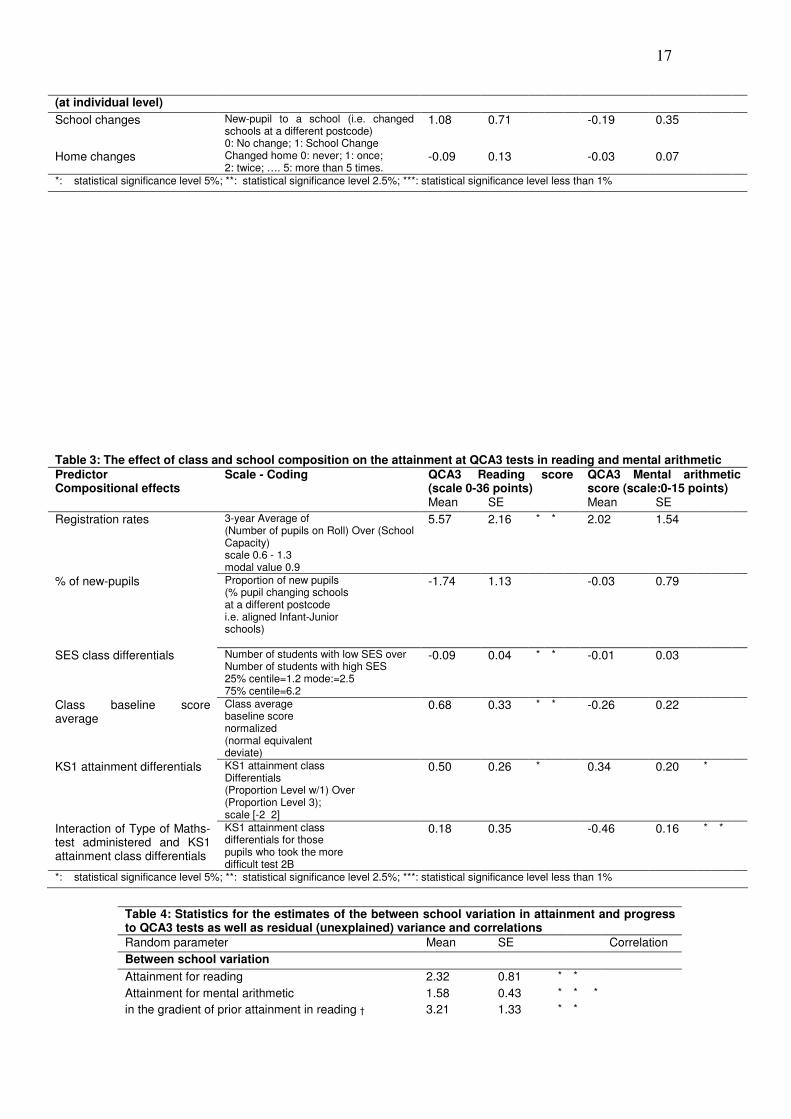
17
(at individual level)
School changes New-pupil to a school (i.e. changed schools at a different postcode) 0: No change; 1: School Change
1.08 0.71 -0.19 0.35
Home changes Changed home 0: never; 1: once; 2: twice; …. 5: more than 5 times.
-0.09 0.13 -0.03 0.07
*: statistical significance level 5%; **: statistical significance level 2.5%; ***: statistical significance level less than 1%
Table 3: The effect of class and school composition on the attainment at QCA3 tests in reading and mental arithmetic
Predictor Compositional effects
Scale - Coding QCA3 Reading score (scale 0-36 points)
QCA3 Mental arithmetic score (scale:0-15 points)
Mean SE Mean SE
Registration rates 3-year Average of (Number of pupils on Roll) Over (School Capacity) scale 0.6 - 1.3 modal value 0.9
5.57 2.16 * * 2.02 1.54
% of new-pupils Proportion of new pupils (% pupil changing schools at a different postcode i.e. aligned Infant-Junior schools)
-1.74 1.13 -0.03 0.79
SES class differentials Number of students with low SES over Number of students with high SES 25% centile=1.2 mode:=2.5 75% centile=6.2
-0.09 0.04 * * -0.01 0.03
Class baseline score average
Class average baseline score normalized (normal equivalent deviate)
0.68 0.33 * * -0.26 0.22
KS1 attainment differentials KS1 attainment class Differentials (Proportion Level w/1) Over (Proportion Level 3); scale [-2 2]
0.50 0.26 * 0.34 0.20 *
Interaction of Type of Maths-test administered and KS1 attainment class differentials
KS1 attainment class differentials for those pupils who took the more difficult test 2B
0.18 0.35 -0.46 0.16 * *
*: statistical significance level 5%; **: statistical significance level 2.5%; ***: statistical significance level less than 1%
Table 4: Statistics for the estimates of the between school variation in attainment and progress to QCA3 tests as well as residual (unexplained) variance and correlations
Random parameter Mean SE Correlation
Between school variation
Attainment for reading 2.32 0.81 * *
Attainment for mental arithmetic 1.58 0.43 * * *
in the gradient of prior attainment in reading † 3.21 1.33 * *
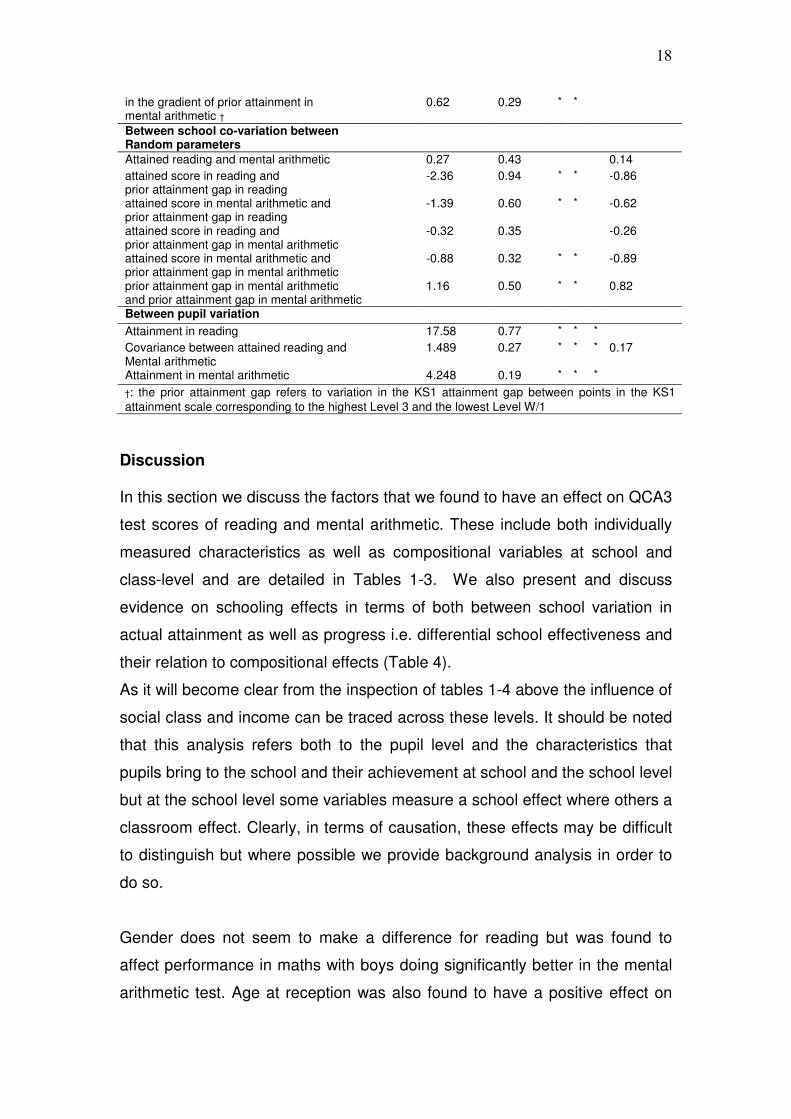
18
in the gradient of prior attainment in mental arithmetic †
0.62 0.29 * *
Between school co-variation between Random parameters
Attained reading and mental arithmetic 0.27 0.43 0.14
attained score in reading and prior attainment gap in reading
-2.36 0.94 * * -0.86
attained score in mental arithmetic and prior attainment gap in reading
-1.39 0.60 * * -0.62
attained score in reading and prior attainment gap in mental arithmetic
-0.32 0.35 -0.26
attained score in mental arithmetic and prior attainment gap in mental arithmetic
-0.88 0.32 * * -0.89
prior attainment gap in mental arithmetic and prior attainment gap in mental arithmetic
1.16 0.50 * * 0.82
Between pupil variation
Attainment in reading 17.58 0.77 * * *
Covariance between attained reading and Mental arithmetic
1.489 0.27 * * * 0.17
Attainment in mental arithmetic 4.248 0.19 * * *
†: the prior attainment gap refers to variation in the KS1 attainment gap between points in the KS1
attainment scale corresponding to the highest Level 3 and the lowest Level W/1
Discussion In this section we discuss the factors that we found to have an effect on QCA3
test scores of reading and mental arithmetic. These include both individually
measured characteristics as well as compositional variables at school and
class-level and are detailed in Tables 1-3. We also present and discuss
evidence on schooling effects in terms of both between school variation in
actual attainment as well as progress i.e. differential school effectiveness and
their relation to compositional effects (Table 4).
As it will become clear from the inspection of tables 1-4 above the influence of
social class and income can be traced across these levels. It should be noted
that this analysis refers both to the pupil level and the characteristics that
pupils bring to the school and their achievement at school and the school level
but at the school level some variables measure a school effect where others a
classroom effect. Clearly, in terms of causation, these effects may be difficult
to distinguish but where possible we provide background analysis in order to
do so.
Gender does not seem to make a difference for reading but was found to
affect performance in maths with boys doing significantly better in the mental
arithmetic test. Age at reception was also found to have a positive effect on
19
QCA3 test performance but only for reading. However age, as we shall see,
becomes part of a far more complex equation when related to prior
achievement in relation to some grouping practices. English as a second
language bears a significant penalty for test performance at QCA3 in Reading
only. Special education needs as expected also result in large penalties in
QCA3 test performance in both reading and maths (Table 1). For example in
reading, those who had been statemented had a penalty of close to 11 points
(10.76). As we shall there were interesting interaction effects with social class
(Table 1)
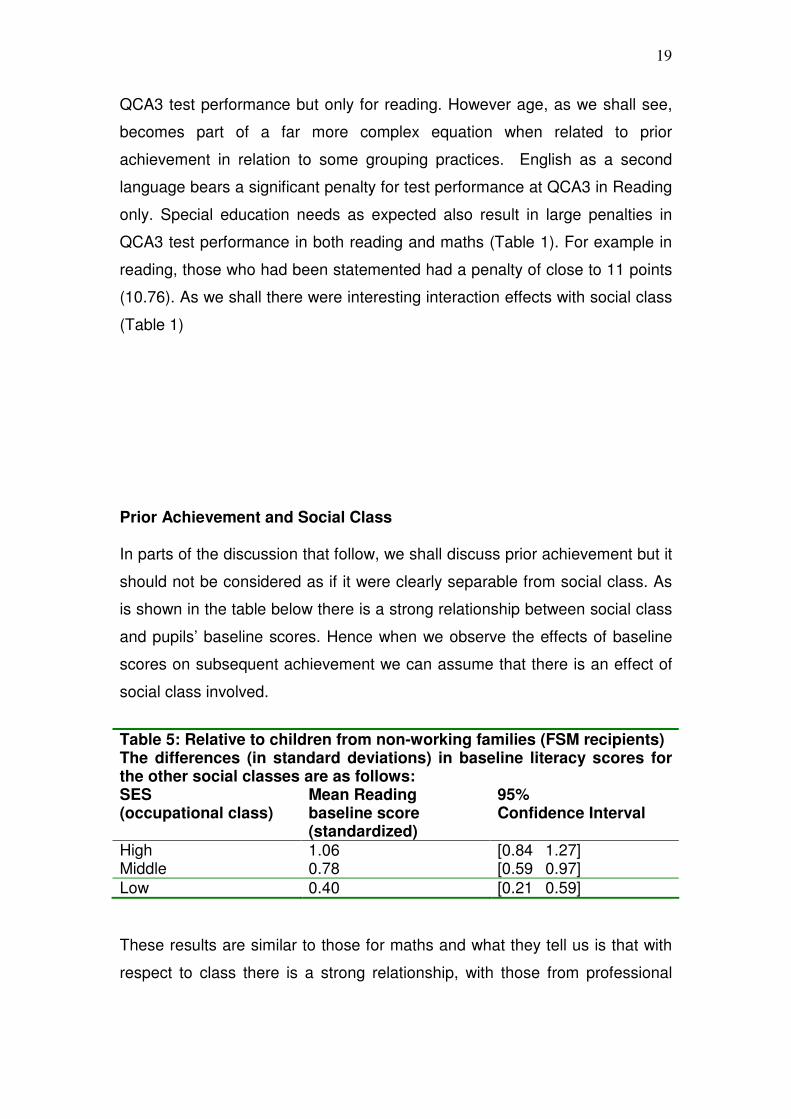
Prior Achievement and Social Class In parts of the discussion that follow, we shall discuss prior achievement but it
should not be considered as if it were clearly separable from social class. As
is shown in the table below there is a strong relationship between social class
and pupils’ baseline scores. Hence when we observe the effects of baseline
scores on subsequent achievement we can assume that there is an effect of
social class involved.
Table 5: Relative to children from non-working families (FSM recipients) The differences (in standard deviations) in baseline literacy scores for the other social classes are as follows: SES (occupational class)
Mean Reading baseline score (standardized)
95% Confidence Interval
High 1.06 [0.84 1.27] Middle 0.78 [0.59 0.97]
Low 0.40 [0.21 0.59]
These results are similar to those for maths and what they tell us is that with
respect to class there is a strong relationship, with those from professional
20
middle class families performing far better than those from middle or working
class families.
Moreover, while prior achievement has typically proved to be the strongest
predictor of performance we can assume that where social class shows up as
influencing children’s achievement and progress over and above ‘prior
achievement’ that there is an ongoing additional class effect over and above
that embedded in ‘prior achievement’.
The significance of Table 5 is that it accords with an important body of
research that suggests that social class disadvantage is already present by
the age of 5 (Feinstein, 2006; Nash, 2006). It also is consistent with Nash’s
view that social class differences in early childhood constitute the social class
basis for later educational inequalities.
The Effects of Social Class and Income on Pupils’ Performance The family’s social class (abbreviated to SES in the tables) and income
background were found to have a significant impact on QCA3 test
performance. All economic indicators: home renting, receipt of working tax
credit, as well as social class were found to have a significant impact on the
reading test – but not on the maths test. Pupils whose parents rent their
homes experience a 3-point penalty on average when compared to those
whose parents own their homes. Low parental social class compared to a
high/professional parental social class translates to almost an 8 point penalty
in the QCA3 reading test once all other factors had been taken into account.
There are also significant interactions among these indicators.
Of those with no capital assets (e.g., home ownership) we found that the
negative effect of home renting on the child’s QCA3 reading test performance
will reduce significantly if the parent is receiving working tax credits when
compared to the majority of home renters who are not in paid work ( in receipt
of FSMs). The majority of those renting are not eligible for WTCs (86 per cent
21
of FSM families were renting). This suggests that income makes a difference
to children’s school performance where parents do not own their homes.
Parental education was found to be associated with almost a 2 point QCA3
difference in QCA3 reading in favour of those pupils whose parents were
university graduates or post-graduates compared with those whose parents
left school at 16 years. Parental education was not found to have a similar
impact for maths. However, parental education was found to have a
significant impact on their child’s QCA3 attainment in maths among children
with special education needs (Table 2). The SEN related attainment
differentials are smaller among parents with higher level of education.
Interestingly, the SEN-related differentials in reading attainment significantly
reduce among lower SES classes. This may be because middle class parents
are adept at having their children classified as more severe, thereby
commanding greater resources, while working class pupils may be classified
as having behavioural difficulties where the additional support they receive
makes little difference to their test performance. This conjecture is supported
by Sacker et al (2001) also report on biases with respect to class, revealing
that - although more children from manual working class homes were
receiving help in school - when scores in reading, mathematics and social
adjustment were taken into account, children from professional homes were
more likely to be receiving greater help than those from manual working class
homes.
Prior Achievement and Performance in QCA3 Reading and Maths
Attainment at KS1 is an important predictor for test performance at year 3 for
both reading and maths. In QCA3 reading, this translates to a penalty of 11
points (the QCA3 score difference between a pupil who attained Level 2B at
KS1 and Level 3A at KS1) for a pupil at the lowest level of the KS1 scale
compared with a pupil at the highest. The type of test that schools selected for
the mathematics test was also found to be a significant predictor for QCA3
attainment for both English and maths. In year 3 there are two written tests
(one covering levels 2B–3B and the other covering levels 3C–4C) and a

22
mental mathematics test. Pupils take one written paper and the mental
mathematics test. In other words, the two tests cover different parts of the
assessment scale – test 3A covers the lower part of the scale and 3B the
upper and they overlap in the middle (levels 3C and 3B) (see Appendix 1 for a
discussion). Thus, it is not surprising that pupils who were tested on maths
using the type 2B did perform significantly better in both reading and maths
(Table 1).
The effect of prior attainment at the end of the reception year was also found
to affect progress from year 2, especially for maths. Pupils with higher scores
at baseline seem to progress significantly more in maths with different effects
across the KS1 scale. The gradient of baseline prior attainment seems to
have an impact across the scale for maths. In reading, baseline prior
attainment seems to have an impact only at the lower end of the scale (Table
1).
Class Organisation and Outcomes in Reading and Maths
Our data enabled us to examine one element with respect to grouping. This
was where a child was taught in a class with older or younger pupils. Data
were available for individual pupils at both years 2 and 3 indicating whether
the pupil was taught in a class where pupils from older, younger or both older
and younger year groups were included. This gave us data patterns on
vertical groupings which are often employed in primary schools where schools
are small or there are falling rolls and/or scarce resources and in which class
size needs to be balanced with costs. Grouping strategies in primary schools
are complex, varied and subject to change (Lupton et al, 2006) and therefore
it was only in this limited sense that we were able to see if there are any
grouping effects. The reason why grouping strategies may be considered
important is that as Robertson and Symons (2003) have noted they effectively
reconfigure pupil composition at the classroom level so that any compositional
effects may be distributed by prior achievement (hereinafter ability) through
groupings.
23
The picture we present below is complex and we draw attention to two points.
Firstly, mixed age classes appear to have a significant effect on outcomes,
suggesting that further research may prove helpful in this area. Secondly, that
there may be a complex dynamic between age and ability.
We found that for both reading and maths, if children in year 2 were grouped
with older pupils that seemed to raise their performance at QCA3. Mixing with
younger pupils at year 2 also seems to have a positive effect at QCA3 test
results but this was only significant for maths. However there was a problem
for year 3 pupils who were in mixed classes. A hypothesis raised by these
results is whether teachers exercise judgement on pupils’ abilities in order to
assign pupils into vertical groupings when the need arises. In schools where
the proportion of low KS1 attainers is less than 10% only 1% of pupils are
mixed with younger year groups whereas in schools where the proportion of
low attainers is higher (more than 10%) significantly more of their pupils (19%)
will be grouped with younger year groups. Similarly, at KS1, the average
baseline score in both reading and maths was almost one standard deviation
above the average for those pupils who were taught in classes with older year
groups (Table 1).
Thus the above effects relating to vertical groupings could reflect differences
in performance associated with the matching of pupils’ ability to a class of
similar ability. If, for example, teachers group lower ability pupils with younger
year groups then this could explain the benefit these pupils experience in
QCA3 attainment. It should be noted that the majority (80%) of pupils
attending mixed-age classes at year 2, consist of pupils actually mixing with
older year groups. Thus, similarly the positive impact on attainment that pupils
taught in such classes experienced could also reflect pupils’ ability (Table 1).
There were also significant interactions between vertical groupings at these
two years and suggest that the class strategies adopted in this transition from
one year to the next are important. We found that pupils who were taught with
younger pupils at year 2 but changed age class-mix at year 3 and were taught
with older pupils performed significantly worse in the QCA3 reading test. This
24
suggests that pupils who have gained from Year 2 mixed classes may not
capitalise on that gain at Year 3. The key point here is that the relationship
between prior achievement, age and grouping requires further investigation.
Rolls and Registration Rates
Pupils attending schools with high registration rates were found to perform
significantly better in the reading test. There is a difference of almost one
point score in reading between a pupil going to a school with a registration
rate at the 25th centile and a pupil going to a school at the 75th centile (of the
distribution of registration rates among schools). Given the literature on
educational markets and their relationship to rolls (Lauder, Hughes, et al,
1999), it is worth considering the relationship between with lower registration
rates than capacity and their social class composition.
Because of the small number of schools it is difficult to make strong
inferences with regards to the association of social class and registration rates
at the school level. However, we note the following which provides some
insight on the association between social class composition, school popularity
and school turbulence.
We did find strong evidence of association between registration rates and
school turbulence. Most schools (36 out of the 46) operate below their
capacity. More than half of the high (8 out of 14) social class schools (i.e.
schools with >16% pupils with professional parents) are schools which
operate at their capacity or above and have low proportions of occasional
pupils (the turbulence measure used by the LEA, with correlation=-0.49;
p=0.0007). A quarter (8 out of the 32) of the low SES, are schools which
operate at their capacity or above have low proportions of occasional pupils.
Among highly turbulent (a high percentage proportion of occasional pupils)
schools with low registration rates, only 3 schools have an above average
(>16%) proportion of pupils with professional parents and 10 are low SES
(<16% proportion of pupils with professional parents). This is an important
effect which we will investigate further because it suggests that the penalty
25
attached to less popular schools is related to parental choice which in turn
may be affected by judgements relating to the social class composition and
stability of the school population. This prompts the question of the effects
turbulence may have on pupil outcomes. While others have found a significant
effect (Goldstein, Burgess, and McConnell (2007) our findings suggest that
those attending schools with a high proportion of new pupils seem to perform
less well but this result is statistically marginal (i.e. significance level α=6%)
and also had a very small effect (1/20 of a point reduction in QCA3 reading
test score between the extremes 75% and 25% of the distribution of the
proportion of new pupils among schools). In part this may be because the
schools in this study had relatively stable pupil populations when compared to
some areas.
Social Class Composition Effects The social class composition of a school class was found to have a significant
impact on pupils’ reading attainment only. Children going to schools with high
proportions of pupils from low social class backgrounds relative perform
significantly worse in the reading test. For an average school in terms of SES
composition (comprising pupils from low social class backgrounds which are
2.5 times the number of those from high social class backgrounds) the penalty
is ¼ of a point score. The point gap between pupils attending schools at the
25% lowest centile and the 75% upper centile of the school distribution of
social class differentials is almost one point.
Prior Achievement Compositional Effects
With respect to prior achievement composition effects we need to take a
developmental perspective. We have seen that pupils from lower social class
backgrounds start their school careers well behind those from higher social
class backgrounds. Those lower achievers who attend high baseline intake
classes perform better than those who do not, while there is no penalty for
higher achievers in the same class. From KS1 through to the QCA3 tests

26
those who have been more disadvantaged improve more rapidly than those
who are advantaged.
However, at KS1 most teachers make a judgement as to the ability of their
pupils and they took the relevant QCA3 test in maths (either the one deemed
less or more demanding) according to their teachers’ judgements. When
these teacher judgements as to a pupil’s ability are taken into account then
the outcomes with respect to the QCA3 tests are somewhat different. Low
attainers benefit from being taught in classes with students of similarly defined
ability in reading and maths.
However, for those judged to be of higher ability (those who take the more
demanding exam) there is a penalty in being mixed with those judged of lower
ability. This is an effect also found by Robertson and Symons (2003). This
raises questions about the role of teachers’ expectations and judgements in
relation to pupil progress. It is noteworthy in this context that qualitative
studies in this project show that those within lower sets or groups within the
year were more likely to be anxious about their learning and/or more like to
raise discipline issues (Brown, 2007; Hempel-Jorgensen, 2007). Given the
finding in relation to baseline tests, this raises questions about the judgments
teachers make and the developmental organization of children’s learning.
Given the previous discussion of mixed age classes and their effects, it may
be that compositional effects in primary schools, at the class level, are
mediated by pupil groupings
There are two broad points to emerge from these findings. The first is that the
contribution of social class and the related prior achievement scores appear
low relative to other factors in affecting pupils’ scores on the QCA3 tests.
However, several points need to be noted. The introduction of compositional
effects as predictors led to a significant improvement in the model fit because
it reduced the unexplained variability. Entering compositional effects resulted
in a small reduction in the level 1 residual (unexplained) variability but
significant reductions in the between school variability in QCA3 attainment.
Ignoring compositional effects resulted in 40% and 8.4% increase in the
27
between school variability of attained reading and math scores, respectively. It
also resulted in a significant increase in the between school variability in
progress (24% and 27% for reading and maths respectively). In terms of the
judgements we make about school performance the inclusion of composition
effects is particularly germane.
Further analysis (see Appendix 3) shows that including composition effects
reduces the error in our predictions for the high and even more for the lowest
attaining pupils, providing a basis for our understanding of the factors which
can make a difference among the low achievers and schools with low
achieving intakes.
Finally, the data on composition effects are almost certainly underestimates
for two reasons. Our missing data appears to be biased towards those on
lower incomes (Goldstein, Kounali and Robinson, 2008) which is likely to
increase composition effect sizes. Moreover, we argued earlier that it is in
schools at the extremes of the social class distribution that composition
effects are most likely to be observed. In our sample, while there were
schools with such compositions they were relatively few in number. Six
schools had over 40% of pupils from professional backgrounds, two of which
had 60%. In contrast, approximately 11 schools had predominantly working
class populations. However, these included those not working, low skilled
routine workers and skilled craftspeople. In turn this raises questions about
how we understand the nature of the working class and its relationship to
education, which requires further analysis. Of these only four schools had a
predominance of those who are unemployed or low skilled routine workers.
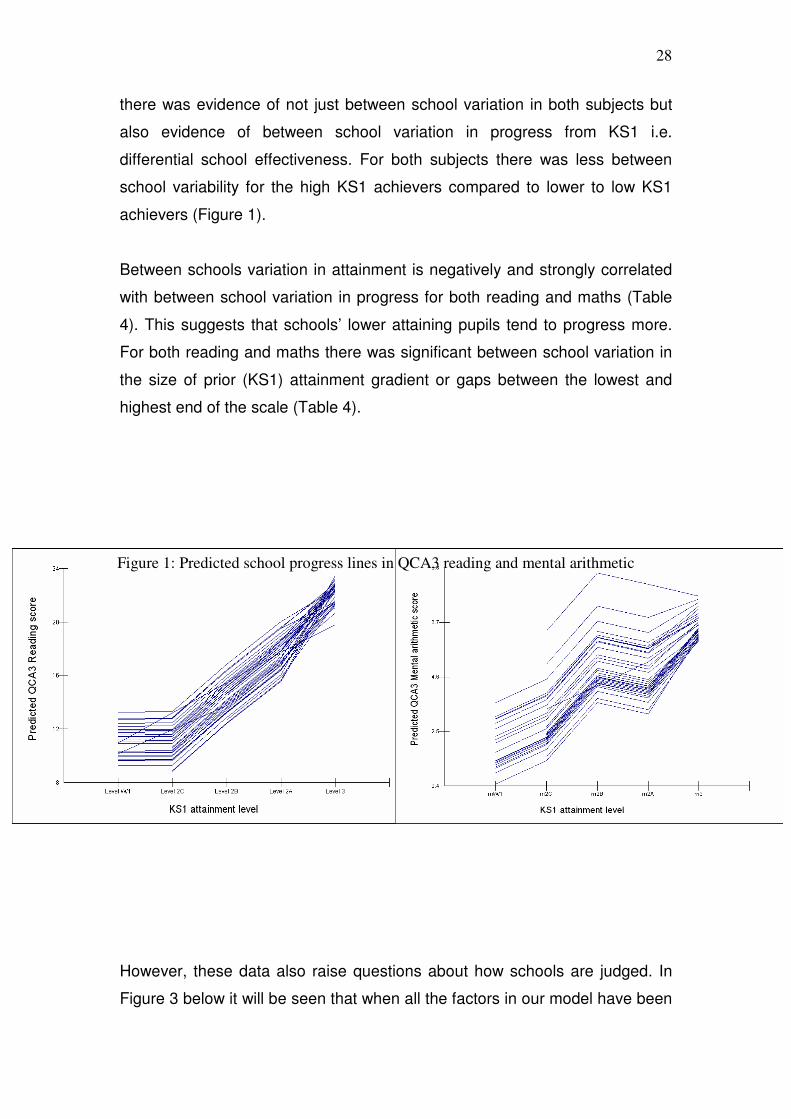
School Achievement and Progress There is significant between school variation in attainment in QCA3 reading -
ranging between 4.4% - 12% and in mental arithmetic test scores ranging
between 1% - 26.5% - and these depend on KS1 attainment. This is because,
28
there was evidence of not just between school variation in both subjects but
also evidence of between school variation in progress from KS1 i.e.
differential school effectiveness. For both subjects there was less between
school variability for the high KS1 achievers compared to lower to low KS1
achievers (Figure 1).
Between schools variation in attainment is negatively and strongly correlated
with between school variation in progress for both reading and maths (Table
4). This suggests that schools’ lower attaining pupils tend to progress more.
For both reading and maths there was significant between school variation in
the size of prior (KS1) attainment gradient or gaps between the lowest and
highest end of the scale (Table 4).
However, these data also raise questions about how schools are judged. In
Figure 3 below it will be seen that when all the factors in our model have been
Figure 1: Predicted school progress lines in QCA3 reading and mental arithmetic
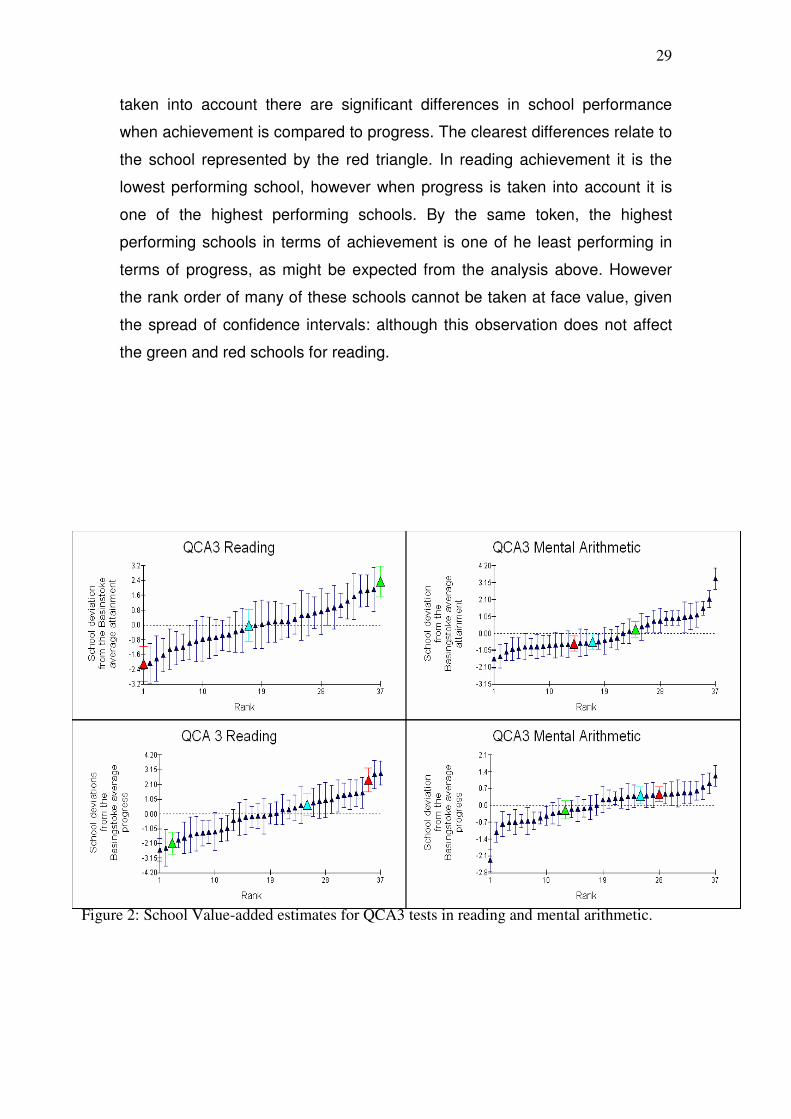
29
taken into account there are significant differences in school performance
when achievement is compared to progress. The clearest differences relate to
the school represented by the red triangle. In reading achievement it is the
lowest performing school, however when progress is taken into account it is
one of the highest performing schools. By the same token, the highest
performing schools in terms of achievement is one of he least performing in
terms of progress, as might be expected from the analysis above. However
the rank order of many of these schools cannot be taken at face value, given
the spread of confidence intervals: although this observation does not affect
the green and red schools for reading.
Figure 2: School Value-added estimates for QCA3 tests in reading and mental arithmetic.
30
Given the point made above that school composition can affect the
differences between schools’ performances and the discussion of Figure 2,
fundamental questions should be raised about the analyses used in official
statistics as a basis for judging schools.
Conclusion
In looking at our results when compared to the competing theories outlined
above several comments can be made. There is a strong social class
influence on pupils’ achievement and progress throughout that part of their
school career that we studied. The finding that there is a strong correlation
between social class and baseline test scores provides additional evidence for
the view that social class influences early educational development. This
much accords with Nash’s theory and he findings of Feinstein and others.
However, it would be a mistake to believe that early intervention for
disadvantaged children can correct the ‘deficit’ that is apparent by the time
they enter Year 1. The social class imprint was with them throughout the
period that we studied. In highlighting elements of social class related to
income we found that for the group which has no capital assets (e.g., house
ownership) government policy with respect to WTC increases pupil’s
achievement over those families were no one is in employment. Although,
there is considerable debate about WTCs this finding does suggest that
income matters when it comes to children’s school performance, although
how it matters remains a matter of conjecture.
We had data on the performance of children in mixed age groupings and
while these data are difficult to interpret they do draw attention to the point
that groupings seem to have an effect on pupil achievement and progress.
The difficulty in understanding these effects lies in the complexity of the
relationship between the dynamics of age and prior achievement.
Nevertheless, there is clearly research required to follow up this finding.

31
In moving to the central foci of this study, it is clear that the effects of
composition are varied. The question of a school’s popularity is important and
raises questions about current policy. While the issue is not straightforward, it
seems that parents may make judgements relative to the social class
composition of the school and its level of turbulence, where there is some
association between the latter and social class. However, we know from
pervious studies that school choice is highly contextualised (Ball, Bowe and
Gewirtz, 1997) and it is for this reason that we most likely can say little more
about our results. While rolls were relatively stable in the schools in our study,
we would raise the question as to whether being undersubscribed has the
same effect as that of spirals of decline documented by Nash and Harker
(2005) who found that schools with declining rolls suffered a penalty.
With respect to social class composition our findings are janus headed: for
individual pupils the effects of social class composition are present but not
great. Here we would raise the possibility, suggested by the effects of vertical
grouping and aspects of our qualitative study, that composition effects in
primary schools are mediated by grouping strategies and that it is through
these that we will see composition effects most clearly. However, for schools,
the impact of social class composition on their performance relative to other
schools is highly significant and again this raises questions about the
adequacy of even the government’s contextually value added rankings. These
value added tables do not include the composition effects that we have
identified nor as Goldstein has repeatedly noted, do they take into account the
confidence intervals that renders these league tables misleading.
In more general terms our study has found the following:
• The quality of predictors used to compare schools is important for
value-added analysis. Correctly accounting for differences in their
intakes and Social Class composition lead to large reductions in the
differences between schools and more fair comparisons between
schools. What is less common practice in value-added analysis is the
use of techniques that test differential school progress when examining
32
variations in schooling. We found that the lack of such practice could
unfairly penalize schools with lower attaining pupils in particular.
• A fair amount of the variability in QCA3 test results (about 30%)
remains unexplained. This means that important factors affecting
pupils’ test performance remain unaccounted. These could well relate
to unmeasured school characteristics since these account for a
significant amount of the unexplained variance.
• Evidence on the importance of school context was found through the
study of the effects of measured composition factors at individual,
school and class levels as well as unmeasured between school
variability. The measured factors included age-mix class strategies and
class context with respect to socio-economic as well as prior-intake
composition.
• Maths can be seen being less affected by social class background than
English
• there is a greater school effect for Maths than Reading
• boys perform better than girls in maths
• those judged to have special educational needs suffer a progressive
penalty depending on the nature of their SEN.
• Finally that in contrast to the often cited claim that pupils from single
parent families are at a disadvantage, we found no supportive
evidence.
However, in order to develop a better understanding of the factors affecting
pupils’ performance, the measurement of factors determining school
organization and resourcing and their interplay with the school’s social class
composition need to be considered
Acknowledgements This paper could not have been written without the critical comments and insights of our colleagues on the project Ruth Lupton, Ceri Brown, Amelia Hempel-Jorgensen and Frances Castle. We should acknowledge the role of Ruth Lupton in providing critical insights through the writing of this paper and Ceri Brown in the development and administration of the questionnaire on
33
family background and structure which was crucial to this paper. The project could not have been undertaken without the cooperation of Hampshire LA. In particular we would like to thank Nigel Hill, Paula Guy and Eddie Izzard. References
Bourdieu, P., Accardo, A., Balzas, G., Beaud, S., Bonvin, F., Bourdieu, E et al (1999), The Weight of the World: Social Suffering in Contemporary Society, Standford, CA, Stanford University Press. Brown, C., (2007) The making of ideal pupils: the role of pedagogical styles
and testing cultures in the construction of primary school learner identities, Education Department, University of Bath. Brown, C., and Thrupp, M., (2005) Pulling out all the stops: Getting a high response rate with a questionnaire for parents., paper presented to the 2005 BERA conference, University of Glamorgan, 14-17 September. Coleman, J., Campbell, E., Hobson, C., McPartland, J., Mood, A., Weinfeld, F., and York, R., (1966) Equality of Educational Opportunity, Washington DC, Government Printing Office.
Dobson, J. and Henthorne, K. (1999) Pupil Mobility in Schools, DfEE Research Report, RR168 London; DFEE Publications Feinstein, L (2003) Inequality in the Early Cognitive Development of British Children, Economica, 70, 73-97. Goldstein, H., and Woodhouse, G., (2000) School Effectiveness Research and Educational Policy, Oxford Review of Education, 26, 3&4, 353-363. Goldstein, H., Kounali, D. and Robinson A.(2007) Modelling measurement errors and category misclassifications in multilevel models. To appear in the international journal: Statistical Modelling. Goldstein, H., (2007) Evidence and Educational Policy –some reflections and Allegations, paper presented to the Royal Statistical Society Conference, York, July. Goldstein, H., aned Kounali, D. (2007). Multilevel modelling of multivariate ordered data. Submitted to the special issue of the Journal of the Royal Statistical Society (RSS), Series A. (December, 2007) – Paper given at the RSS workshop: Recent Advances in Multilevel Modelling.
34
Goldstein, H., Burgess, S., and McConnell, B., (2007) Modelling the Impact of Pupil Mobility on School Differences in Educational Achievement, The Centre for MultiLevel Modelling, Bristol University. Goldthorpe, J.H. & Hope, K. (1974) The social grading of occupations: A new approach and scale (Oxford, Clarendon Press - Oxford). Goyder, J., Warriner, K. & Miller, S. (2002) Evaluating socio-economic status (SES) bias in survey nonresponse, Journal of Official Statistics, Statistics Sweden, 18(1), pp. 1-11. Hampshire County Council (1999) Baseline Assessment, 2nd edition, Winchester. Harker, R and Tymmms, P., (2004) The Effect of Student Composition on School Outcomes, School Effectiveness and Improvement, 15, 2, 177-199. Hempel-Jorgensen, A., (2007) The construction of the ‘ideal pupil’ and pupils’ perceptions of ‘misbehaviour’ and discipline: contrasting experiences in a low and a high socio-economic primary school, Institute of Education. Kounali, D.,Robinson, A., Goldstein, H., and Lauder, H., (2007) The Probity of Free School Meals as a Proxy Measure for Disadvantage, University of Bath, Maths/Education. Submitted to Oxford Review of Education Lauder, H, Brown, P, Dillabough J-A and Halsey, A.H.(2006) Introduction: The Prospects for Education: Individualization, Globalization and Social Change in Lauder, H, Brown, P, Dillabough J-A and Halsey, A.H. (eds.) (2006) Education, Globalization and Social Change, Oxford, Oxford University Press. pp.1-70 Lauder, H., Brown, C., Lupton, R., Castle, F and Hempel-Jorgensen, A., (2006) Politics and Professionalism: The Question of School and Teacher Autonomy in Relation to Grouping Practices, BERA Symposium on the HARPS Project Lauder, H., and Hughes, D., et al. (1999) Trading in Futures: Why Markets in Education Don’t Work, Buckingham, Open University Press.
Lauder, H., Jamieson, I, and Wikeley, F (1998) Models of Effective Schools: Limits and Capabilities, (1998) in Slee, R., Weiner, G., and Tomlinson, S., (eds.) School Effectiveness for Whom? Challenges to the School Effectiveness and School Improvement Movements, London, Falmer.
Meyer, S., (1997) What Money Can’t Buy: Family Income and Children’s Life Chances, Camb, Mass, Harvard University Press. Mortimore,P., Sammons, P., Stoll, L., Lewis., D., and Ecob , R.,(1989) School Matters, Wells, Open Books.

35
Nash, R., (2003) Is the School Composition effect Real? A Discussion with Evidence from the UK PISA Data, School Effectiveness and Improvement, 14, 4, 441-457. Nash, R., and Harker, R., (2006) Signals of Success: Decoding the Sociological Meaning of Associations between Childhood Abilities and Adult Educational Achievement, in Lauder, H, Brown, P, Dillabough J-A and Halsey, A.H. (eds.) (2006) Education, Globalization and Social Change, Oxford, Oxford University Press. Nash, R and Harker, R (2005) The Predictable Failure of School Marketisation: The Limitations of Policy Reform, in Codd, J., and Sullivan, K., Education Policy Directions in Aotearoa New Zealand, Sotuh Bank, Victoria, Dunmore Press. Roberston D. & Symons, J. (2003) Do peer groups matter: school effects and academic achievement'. Economica, 277 31-54.
Thrupp, M., and Hirsch, D., (2006), The Limits of Managerialist School Reform: The Case of Target setting in England and the USA, in Lauder, H, Brown, P, Dillabough J-A and Halsey, A.H. (eds.) (2006) Education, Globalization and Social Change, Oxford, Oxford University Press. Sacker, A., Schoon, I. & Bartley, M. (2001) 'Sources of bias in special needs provision in mainstream primary schools: evidence from two British cohort studies'. European Journal of Special Needs Education 16(3): pp. 259 - 276. Thrupp, M., Lauder, H., and Robinson, T (2002) School Composition and Peer Effects, International Journal of Educational Research, 37, 483-504.
Thrupp, M., (1999) Schools Making a Difference: Let's be Realistic, Buckingham, Open University Press. Thrupp, M., (1997) The school Mix effect: The History of an Enduring Problem in Educational Research, Policy and Practice, British Journal of Sociology of Education, 16,2, 183-203.
Willis, P., (1977) Learning to Labour, Farnborough, Saxon House.
36
05
10
15
Me
nta
l a
rith
metic s
core
A B Bothtype
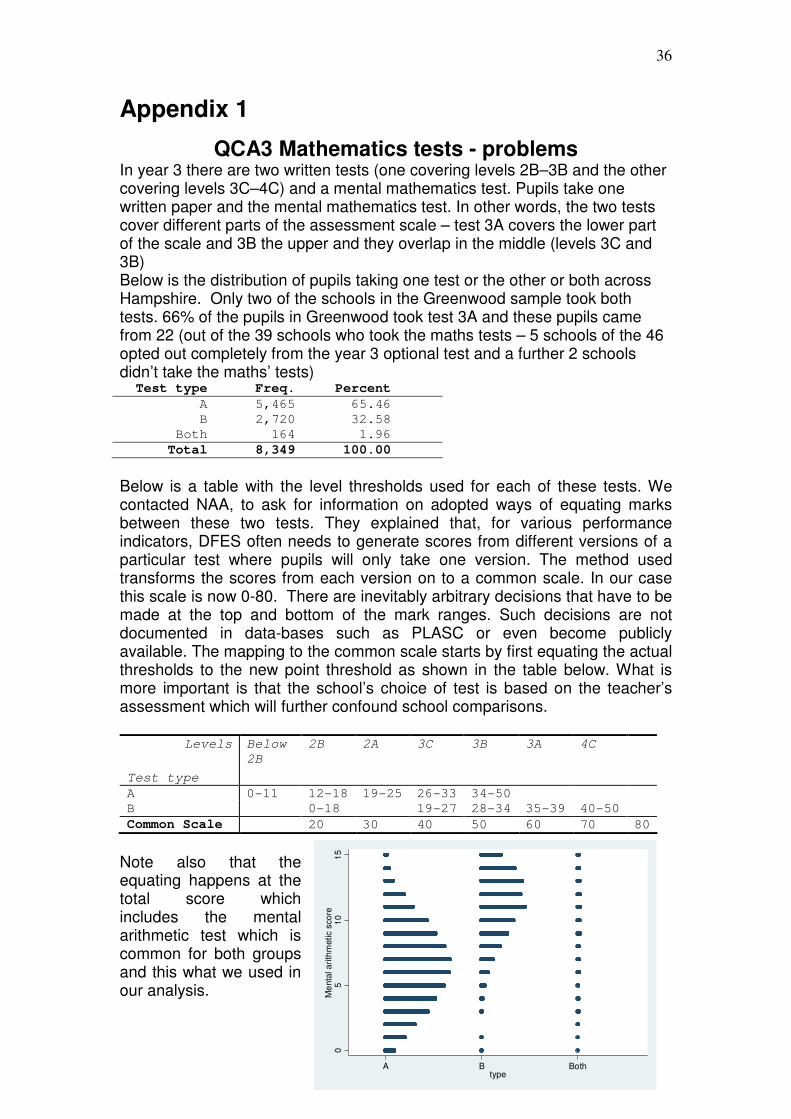
Appendix 1
QCA3 Mathematics tests - problems In year 3 there are two written tests (one covering levels 2B–3B and the other covering levels 3C–4C) and a mental mathematics test. Pupils take one written paper and the mental mathematics test. In other words, the two tests cover different parts of the assessment scale – test 3A covers the lower part of the scale and 3B the upper and they overlap in the middle (levels 3C and 3B) Below is the distribution of pupils taking one test or the other or both across Hampshire. Only two of the schools in the Greenwood sample took both tests. 66% of the pupils in Greenwood took test 3A and these pupils came from 22 (out of the 39 schools who took the maths tests – 5 schools of the 46 opted out completely from the year 3 optional test and a further 2 schools didn’t take the maths’ tests) Test type Freq. Percent
A 5,465 65.46
B 2,720 32.58
Both 164 1.96
Total 8,349 100.00
Below is a table with the level thresholds used for each of these tests. We contacted NAA, to ask for information on adopted ways of equating marks between these two tests. They explained that, for various performance indicators, DFES often needs to generate scores from different versions of a particular test where pupils will only take one version. The method used transforms the scores from each version on to a common scale. In our case this scale is now 0-80. There are inevitably arbitrary decisions that have to be made at the top and bottom of the mark ranges. Such decisions are not documented in data-bases such as PLASC or even become publicly available. The mapping to the common scale starts by first equating the actual thresholds to the new point threshold as shown in the table below. What is more important is that the school’s choice of test is based on the teacher’s assessment which will further confound school comparisons.
Levels
Test type
Below
2B
2B 2A 3C 3B 3A 4C
A 0-11 12-18 19-25 26-33 34-50
B 0-18 19-27 28-34 35-39 40-50
Common Scale 20 30 40 50 60 70 80
Note also that the equating happens at the total score which includes the mental arithmetic test which is common for both groups and this what we used in our analysis.
37
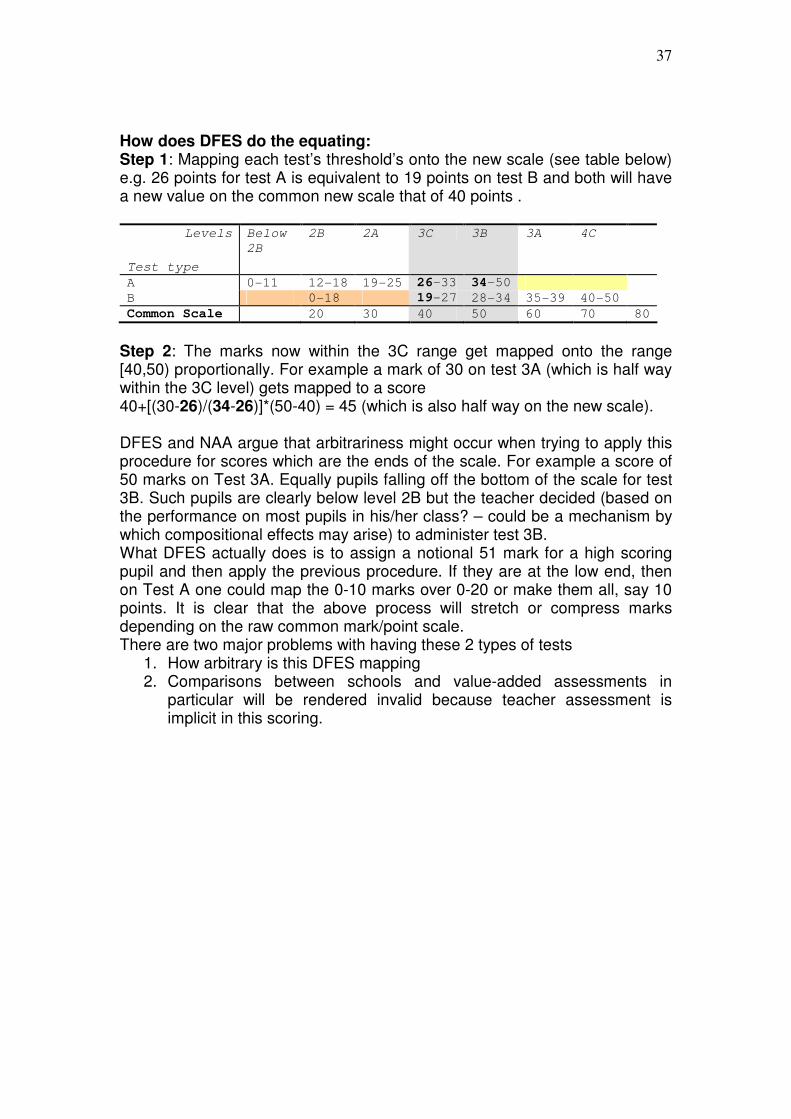
How does DFES do the equating: Step 1: Mapping each test’s threshold’s onto the new scale (see table below) e.g. 26 points for test A is equivalent to 19 points on test B and both will have a new value on the common new scale that of 40 points .
Levels
Test type
Below
2B
2B 2A 3C 3B 3A 4C
A 0-11 12-18 19-25 26-33 34-50
B 0-18 19-27 28-34 35-39 40-50
Common Scale 20 30 40 50 60 70 80
Step 2: The marks now within the 3C range get mapped onto the range [40,50) proportionally. For example a mark of 30 on test 3A (which is half way within the 3C level) gets mapped to a score 40+[(30-26)/(34-26)]*(50-40) = 45 (which is also half way on the new scale). DFES and NAA argue that arbitrariness might occur when trying to apply this procedure for scores which are the ends of the scale. For example a score of 50 marks on Test 3A. Equally pupils falling off the bottom of the scale for test 3B. Such pupils are clearly below level 2B but the teacher decided (based on the performance on most pupils in his/her class? – could be a mechanism by which compositional effects may arise) to administer test 3B. What DFES actually does is to assign a notional 51 mark for a high scoring pupil and then apply the previous procedure. If they are at the low end, then on Test A one could map the 0-10 marks over 0-20 or make them all, say 10 points. It is clear that the above process will stretch or compress marks depending on the raw common mark/point scale. There are two major problems with having these 2 types of tests
1. How arbitrary is this DFES mapping 2. Comparisons between schools and value-added assessments in
particular will be rendered invalid because teacher assessment is implicit in this scoring.
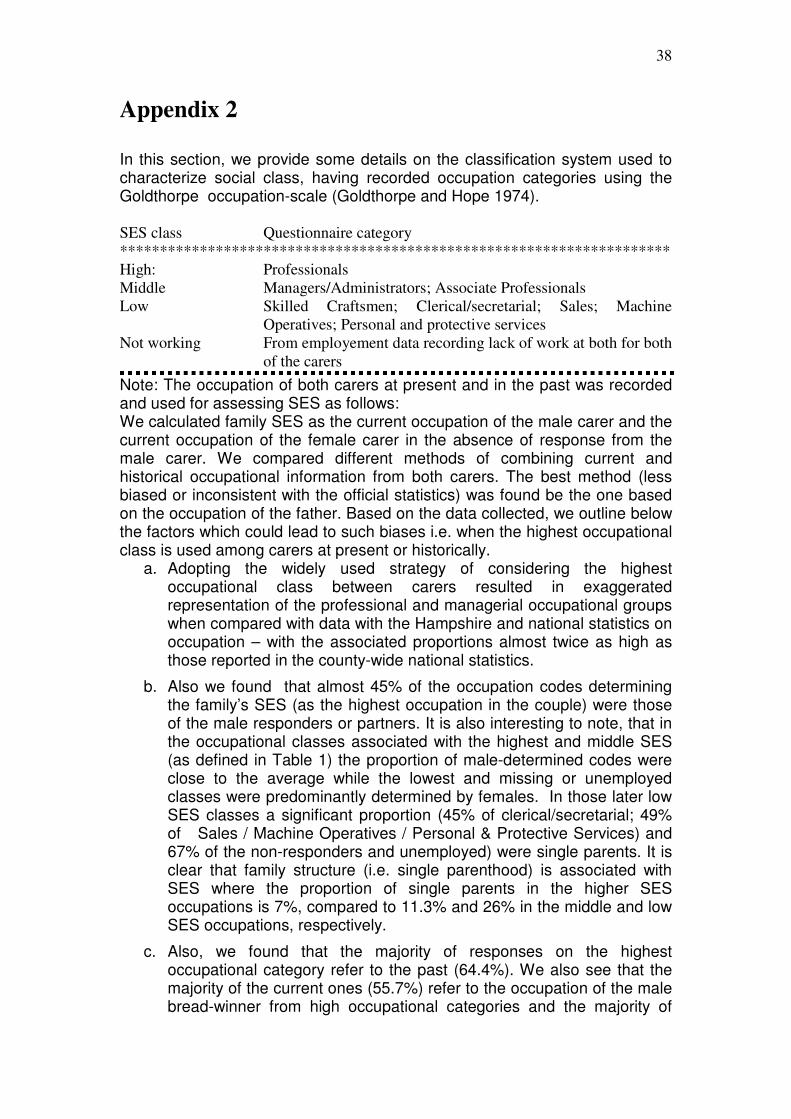
38
Appendix 2
In this section, we provide some details on the classification system used to characterize social class, having recorded occupation categories using the Goldthorpe occupation-scale (Goldthorpe and Hope 1974).
SES class Questionnaire category
*********************************************************************
High: Professionals
Middle Managers/Administrators; Associate Professionals
Low Skilled Craftsmen; Clerical/secretarial; Sales; Machine
Operatives; Personal and protective services
Not working From employement data recording lack of work at both for both
of the carers
Note: The occupation of both carers at present and in the past was recorded and used for assessing SES as follows: We calculated family SES as the current occupation of the male carer and the current occupation of the female carer in the absence of response from the male carer. We compared different methods of combining current and historical occupational information from both carers. The best method (less biased or inconsistent with the official statistics) was found be the one based on the occupation of the father. Based on the data collected, we outline below the factors which could lead to such biases i.e. when the highest occupational class is used among carers at present or historically.
a. Adopting the widely used strategy of considering the highest occupational class between carers resulted in exaggerated representation of the professional and managerial occupational groups when compared with data with the Hampshire and national statistics on occupation – with the associated proportions almost twice as high as those reported in the county-wide national statistics.
b. Also we found that almost 45% of the occupation codes determining the family’s SES (as the highest occupation in the couple) were those of the male responders or partners. It is also interesting to note, that in the occupational classes associated with the highest and middle SES (as defined in Table 1) the proportion of male-determined codes were close to the average while the lowest and missing or unemployed classes were predominantly determined by females. In those later low SES classes a significant proportion (45% of clerical/secretarial; 49% of Sales / Machine Operatives / Personal & Protective Services) and 67% of the non-responders and unemployed) were single parents. It is clear that family structure (i.e. single parenthood) is associated with SES where the proportion of single parents in the higher SES occupations is 7%, compared to 11.3% and 26% in the middle and low SES occupations, respectively.
c. Also, we found that the majority of responses on the highest occupational category refer to the past (64.4%). We also see that the majority of the current ones (55.7%) refer to the occupation of the male bread-winner from high occupational categories and the majority of
39
past ones (61.1%) refer to female bread-winner from low occupational categories. This suggests that the bread-winner has a male gender. If we look closer at the change of occupational status for the major bread winner we find that those with higher SES occupations suffer less in the job market (job-stability/ insecurity). A total of 365 families (22.1%) experienced a worsening of their occupational status. Among these families, 81% corresponds to female bread-winners. Among higher SES occupations 20.7 % experienced a worsening of their occupational status compared with 23.7% and 24.3% for the middle and low SES occupations. The gender of the bread-winner modifies this relationship and suggests that working mothers might experience a tougher deal in the job market. More specifically, we find that if we control for the gender of the major bread-winner then among females with occupations associated with high SES 27.4% experience worsening of their occupational status. This worsening of occupational status is 36.9% and 39.2% among women with middle and low SES occupations, respectively.
Appendix 3
Although, the reductions in the individual pupil-level unexplained variability
were small (Figure 3) they were found to affect those pupils who are difficult to
predict i.e. those pupils with attainment scores at the lowest and highest ends
of the attainment distributions. What is important is that accounting for school
context/composition will reduce the error in our predictions for the high and
even more for the lowest attaining pupils. We have seen, evidence of
differential school effectiveness i.e. pupils across schools progress differently
with progress outcomes being more variable across the lower end of the prior
(KS1) attainment scale. Thus, it is important to find ways to improve our
understanding on the factors which can make a difference among the low
achievers or schools with low intakes. These findings suggest that school
context is important in exactly this sense. However, more work is needed to
improve measurement of school context and operationalize the process that
give rise to these compositional effects in a more focused way (possibly
individual level variables – compare the effects of aggregates/compositional
variables with compositional variable measured at individual level as in
vertical groupings).

40
Another way of illustrating the importance of compositional effects despite their small impact can be seen in Figure 4. The most important consequence of the differential school progress identified relates to how we need to think about designing future studies to inform policy makers. Figure 4 depicts how attainment in QCA3 observed pupils performance in reading and maths relates to what we haven’t measured i.e. individual total variation (at both pupil and school levels) in test scores not accounted for by what we measured in this study. This shows – not surprisingly - that the low attainers are the most difficult pupils to make predictions for. It also shows that school context /composition could make a difference for exactly those pupils , especially for maths.
010
20
30
40
Fitte
d Q
CA3 R
eadin
g s
core
0 10 20 30 40Observed QCA3 Reading score 0-36
Model With Compositional effects
Model Without Compositional Effects
Model Without Compostional & VG effects
05
10
15
Fitte
d Q
CA3 s
core
0 5 10 15Observed QCA3 Mental Arithmetic score 0-15
Model With Compostional effects
Model Without Compositional Effects
Model Without Compositional & VG effects
Figure 1: Comparison of observed and fitted scores when accounting versus ignoring
compositional effects.
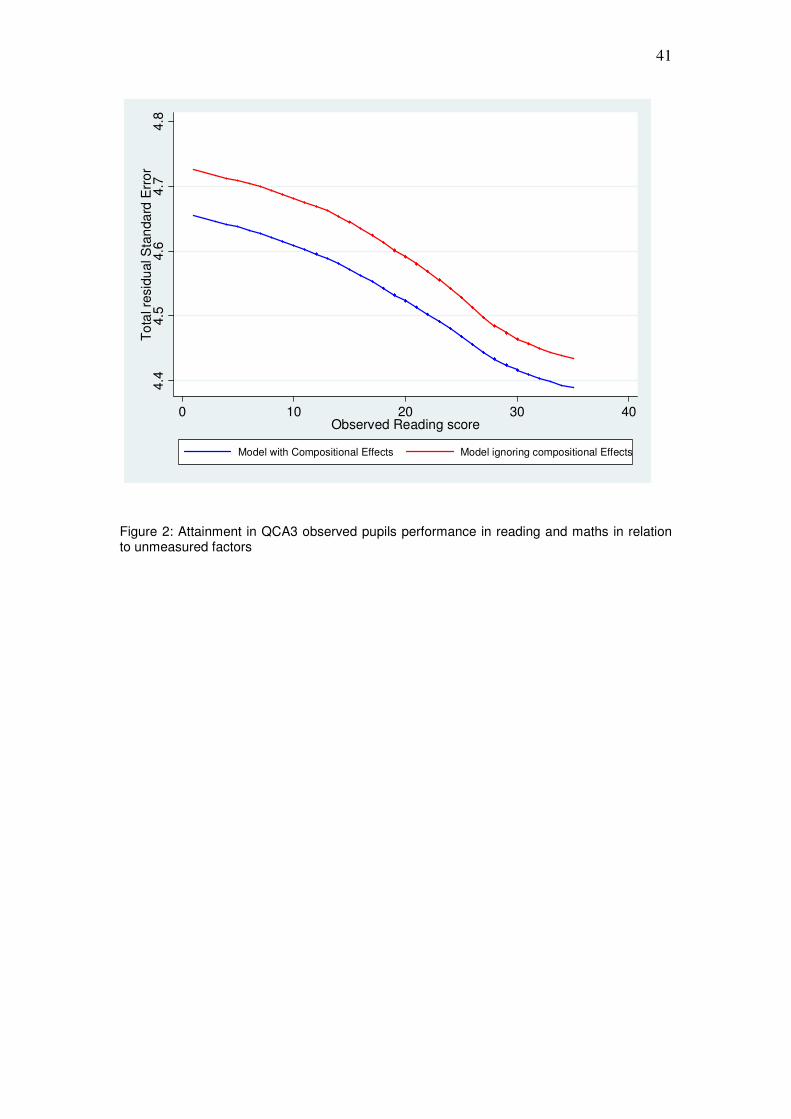
41
4.4
4.5
4.6
4.7
4.8
To
tal re
sid
ual S
tan
da
rd E
rro
r
0 10 20 30 40Observed Reading score
Model with Compositional Effects Model ignoring compositional Effects
Figure 2: Attainment in QCA3 observed pupils performance in reading and maths in relation to unmeasured factors