pupil characteristics
TRANSCRIPT

1
Pupil Characteristics Section 1 - Who Comes to Our School? This is our school population. These are the groups of people we need to plan services for. As a school our main function is to provide good access to educational opportunities and help/support our pupils to do well at school. We have to make sure we do not disadvantage anyone in our school. We use the following information to help us.
School
No. %
Gender Girls 1555 100.0% Boys 0 0.0%
Ethnicity
Any other Asian background 26 1.7% Any other Black background 12 0.8% Any other mixed background 19 1.2% Bangladeshi 1262 81.2% Black - Somali 62 4.0% Black Caribbean 6 0.4% Chinese 2 0.1% Indian 14 0.9% Information Not Yet Obtained 13 0.8% Other Black African 12 0.8% Other ethnic group 21 1.4% Pakistani 26 1.7% Refused 4 0.3% Turkish/Turkish Cypriot 1 0.1% Vietnamese 6 0.4% White - British 30 1.9% White and Asian 16 1.0% White and Black African 3 0.2% White and Black Caribbean 4 0.3% White European 8 0.5% White Other 8 0.5%
Free School Meal Eligibility Not Eligible 586 37.7% Eligible 969 62.3%
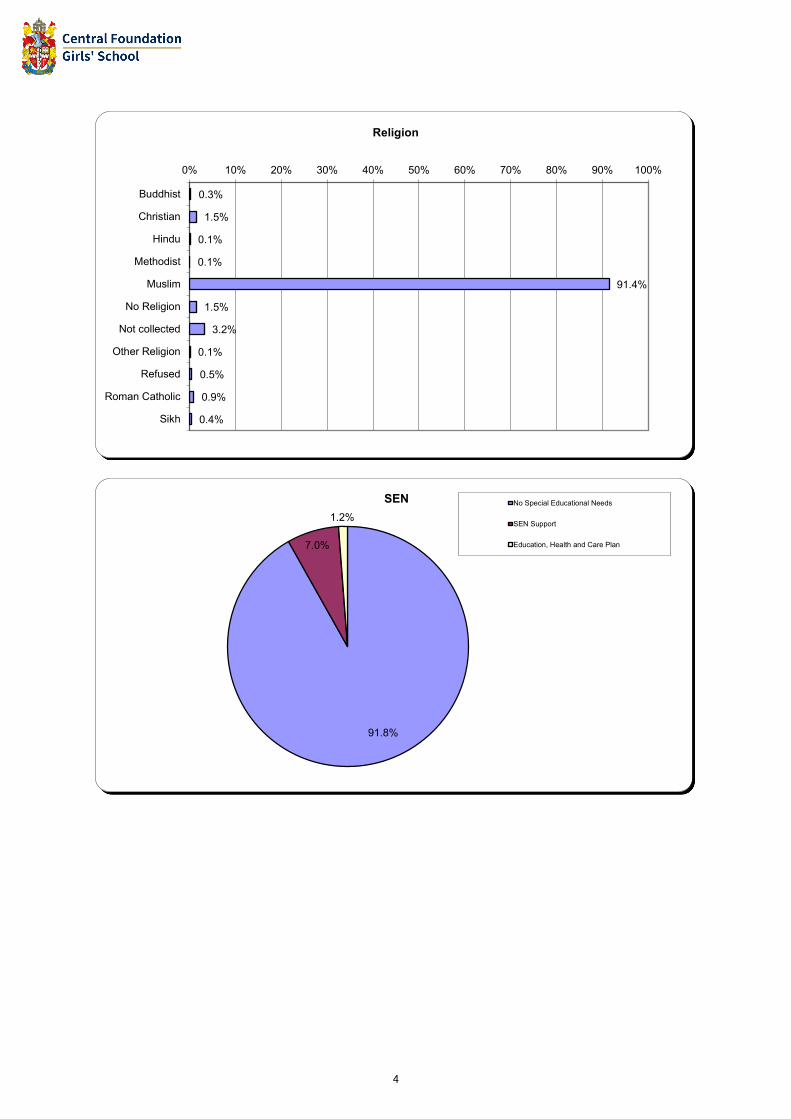
Religion/Belief
Buddhist 4 0.3% Christian 23 1.5% Hindu 2 0.1% Methodist 1 0.1% Muslim 1422 91.4% No Religion 23 1.5% Not collected 50 3.2% Other Religion 2 0.1% Refused 8 0.5% Roman Catholic 14 0.9%

2
Sikh 6 0.4%
Special Educational Need No Special Educational Needs 1427 91.8% SEN Support 109 7.0% Education, Health and Care Plan 19 1.2%
Profile of Need (% based on total number of SEN
pupils with Primary Needs)
Autistic Spectrum Disorder 3 1.2% Hearing Impairment 8 3.2% Moderate Learning Difficulty 53 21.0% No Specialist Assessment 12 4.8% Other Difficulty/Disability 23 9.1% Physical Disability 3 1.2% Severe Learning Difficulty 3 1.2% Social: Emotional and Mental Health 47 18.7% Specific Learning Difficulty 22 8.7% Speech: Language or Communication Need 73 29.0% Vision Impairment 5 2.0%
Girls100.0%
Boys0.0%
Gender

3
1.7%
0.8%
1.2%
81.2%
4.0%
0.4%
0.1%
0.9%
0.8%
0.8%
1.4%
1.7%
0.3%
0.1%
0.4%
1.9%
1.0%
0.2%
0.3%
0.5%
0.5%
0% 10%
20%
30%
40%
50%
60%
70%
80%
90%
100%
Any other Asian background
Any other Black background
Any other mixed background
Bangladeshi
Black - Somali
Black Caribbean
Chinese
Indian
Information Not Yet Obtained
Other Black African
Other ethnic group
Pakistani
Refused
Turkish/Turkish Cypriot
Vietnamese
White - British
White and Asian
White and Black African
White and Black Caribbean
White European
White Other
Ethnicity
37.7%
62.3%
FSM Eligibility
Not Eligible Eligible
4
0.3%
1.5%
0.1%
0.1%
91.4%
1.5%
3.2%
0.1%
0.5%
0.9%
0.4%
0% 10% 20% 30% 40% 50% 60% 70% 80% 90% 100%
Buddhist
Christian
Hindu
Methodist
Muslim
No Religion
Not collected
Other Religion
Refused
Roman Catholic
Sikh
Religion
91.8%
7.0%
1.2%SEN No Special Educational Needs
SEN Support
Education, Health and Care Plan

5
GCSE Section 2 - Attainment - GCSE and Equivalent Percentage of pupils gaining 5 or more A*-C/9-4 grades including Maths and English
Percentage of pupils gaining 5 or more A*-C/9-4 grades including Maths and English
School
No. Achieving TOTAL %
Gender Girls 193 236 82% Boys #DIV/0!
Any other mixed background 1 2 50% Any other Black background #DIV/0! Bangladeshi 167 204 82% Black - Somali 8 9 89% Information Not Yet Obtained 4 5 80% Pakistani 1 1 100% Indian #DIV/0! Other ethnic group 1 1 100% Black Caribbean 1 1 100% Other Black African 3 3 100% White - European 1 1 100% White - British 4 5 80% White and Black Caribbean 0 1 0% White and Black African #DIV/0! White and Asian 1 3 33%
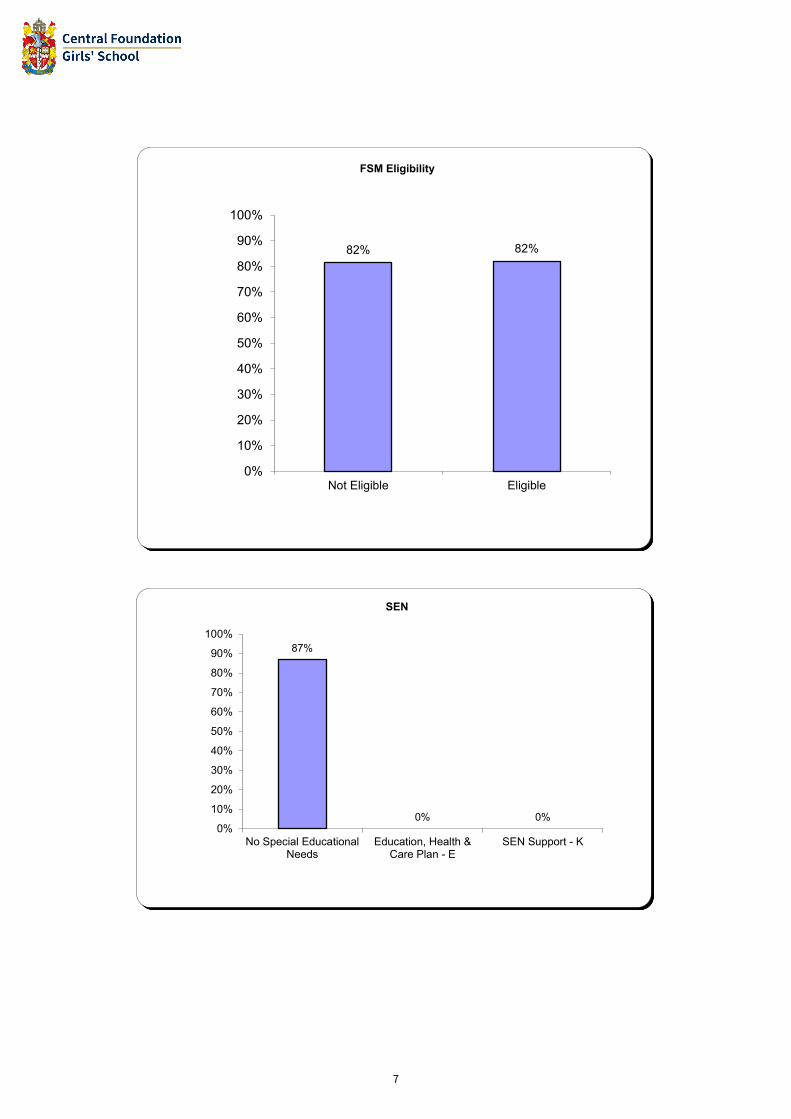
Free School Meal Eligibility Not Eligible 106 130 82% Eligible 87 106 82%
Special Educational Need No Special Educational Needs 191 220 87% Education, Health & Care Plan - E 0 1 0% SEN Support - K 0 15 0%
Attainment 8 5.75 Progress 8 Ebacc APS 5.12 9-4 inc English and Maths 82% 9-5 inc Enlgish and Maths 66%

6
82%
0%0%
10%
20%
30%
40%
50%
60%
70%
80%
90%
100%
Girls Boys
Gender
50%
0%
82%
89%
80%
100%
0%
100%
100%
100%
100%
80%
0%
0%
33%
0% 10%
20%
30%
40%
50%
60%
70%
80%
90%
100%
Any other mixed background
Any other Black background
Bangladeshi
Black - Somali
Information Not Yet Obtained
Pakistani
Indian
Other ethnic group
Black Caribbean
Other Black African
White - European
White - British
White and Black Caribbean
White and Black African
White and Asian
Ethnicity
7
82% 82%
0%
10%
20%
30%
40%
50%
60%
70%
80%
90%
100%
Not Eligible Eligible
FSM Eligibility
87%
0% 0%0%
10%
20%
30%
40%
50%
60%
70%
80%
90%
100%
No Special EducationalNeeds
Education, Health &Care Plan - E
SEN Support - K
SEN

8
KS5 Section 2 - Attainment - Key Stage 5
A Level
No. Achievi
ng 1A*-C
No. Achievi
ng 2A*-C
No. Achievi
ng 3A*-C
TOTAL
1A*-C %
2A*-C %
3A*-C %
Gender Girls 118 109 75 122 97% 89% 61%
Boys #DIV/0!
#DIV/0!
#DIV/0!
Ethnicity
Any other black background
1 1 1 1 100% 100% 100%
Any other asian background
1 1 1 1 100% 100% 100%
Bangladeshi 106 97 67 153 69% 63% 44%
Black - Somali 2 2 2 4 50% 50% 50%
Black Caribbean #DIV/0!
#DIV/0!
#DIV/0!
Indian #DIV/0!
#DIV/0!
#DIV/0!
Refused 0 0 0 1 0% 0% 0%
Other Black African #DIV/0!
#DIV/0!
#DIV/0!
Other ethnic group #DIV/0!
#DIV/0!
#DIV/0!
Pakistani 6 6 4 8 75% 75% 50%
Turkish/Turkish Cypriot #DIV/0!
#DIV/0!
#DIV/0!
White - British #DIV/0!
#DIV/0!
#DIV/0!
White and Asian #DIV/0!
#DIV/0!
#DIV/0!
White and Black Caribbean
1 1 1 100% 100% 0%
White European #DIV/0!
#DIV/0!
#DIV/0!
White Other 1 1 1 100% 100% 0%
Free School Meal
Eligibility
Not Eligible 79 72 48 80 99% 90% 60%
Eligible 39 37 27 42 93% 88% 64%
Special Educatio
nal Need
No Special Educational Needs
117 108 74 121 97% 89% 61%
SEN Support 1 1 1 1 100% 100% 100%
Education, Health and Care Plan
#DIV/0!
#DIV/0!
#DIV/0!

9
Number of students at the end of 16-18 study with an A level exam entry 122
Average Point Score per A level entry expressed as a grade B
Average Point score per A level entry (new point system) 39.82
Number of students at the end of vocational study 79 Average point score per applied general entry expressed as a vocational grade Dist+
Average point score per applied general entry (new point score) 39.64

10
Btec No.
Achieving D*-P
Total Extended Certificate
No. Achieving D*D*-PP
Total National Diploma
No. Achieving D*D*D*-
PPP
Total Extended Diploma
D*-P %
D*D*-PP %
D*D*D*-PPP %
Gender Girls 35 35 48 48 100% #DIV/0! 100%
Boys #DIV/0! #DIV/0! #DIV/0!
Ethnicity
Any other asian background #DIV/0! #DIV/0! #DIV/0!
Any other black background #DIV/0! #DIV/0! #DIV/0!
Any other mixed background #DIV/0! #DIV/0! #DIV/0!
Bangladeshi 30 30 45 45 100% #DIV/0! 100%
Black - Somali 1 1 #DIV/0! #DIV/0! 100%
Other Ethnic Group #DIV/0! #DIV/0! #DIV/0!
Indian #DIV/0! #DIV/0! #DIV/0!
Refused 1 1 #DIV/0! #DIV/0! 100%
Other Black African #DIV/0! #DIV/0! #DIV/0!
Pakistani 3 3 1 1 100% #DIV/0! 100%
Turkish/Turkish Cypriot #DIV/0! #DIV/0! #DIV/0!
White - British #DIV/0! #DIV/0! #DIV/0!
White and Asian 1 1 100% #DIV/0! #DIV/0!
White and Black African #DIV/0! #DIV/0! #DIV/0!
White European #DIV/0! #DIV/0! #DIV/0!
White Other 1 1 100% #DIV/0! #DIV/0!
Free School Meal
Eligibility
Not Eligible 31 31 #DIV/0! #DIV/0! 100%
Eligible 17 17 #DIV/0! #DIV/0! 100%
Special Educational
Need
No Special Educational Needs 48 48 #DIV/0! #DIV/0! 100%
SEN Support #DIV/0! #DIV/0! #DIV/0!
Education, Health and Care Plan #DIV/0! #DIV/0! #DIV/0!

11
0
10
20
30
40
50
60
70
80
90
100
Girls Boys
Gender
1A*-C%
2A*-C%
3A*-C%
0% 10%
20%
30%
40%
50%
60%
70%
80%
90%
100%
Any other black background
Any other asian background
Bangladeshi
Black - Somali
Black Caribbean
Indian
Refused
Other Black African
Other ethnic group
Pakistani
Turkish/Turkish Cypriot
White - British
White and Asian
White and Black Caribbean
White European
White Other
Ethnicity
1A*-C%
2A*-C%
3A*-C%

12
0
10
20
30
40
50
60
70
80
90
100
Girls Boys
Btec: Gender
D*-P%
D*D*-PP%
D*D*D*-PPP%
0% 10%
20%
30%
40%
50%
60%
70%
80%
90%
100%
Any other asian background
Any other black background
Any other mixed background
Bangladeshi
Black - Somali
Other Ethnic Group
Indian
Refused
Other Black African
Pakistani
Turkish/Turkish Cypriot
White - British
White and Asian
White and Black African
White European
White Other
Btec: Ethnicity
D*-P%
D*D*-PP%
D*D*D*-PPP%

13
0%
10%
20%
30%
40%
50%
60%
70%
80%
90%
100%
Not Eligible Eligible
FSM Eligibility
1A*-C%
2A*-C%
3A*-C%
0%
10%
20%
30%
40%
50%
60%
70%
80%
90%
100%
No Special EducationalNeeds
SEN Support Education, Health and CarePlan
SEN
1A*-C%
2A*-C%
3A*-C%

14
0%
10%
20%
30%
40%
50%
60%
70%
80%
90%
100%
Not Eligible Eligible
Btec: FSM Eligibility
D*-P%
D*D*-PP%
D*D*D*-PPP%
0%
10%
20%
30%
40%
50%
60%
70%
80%
90%
100%
No Special EducationalNeeds
SEN Support Education, Health andCare Plan
Btec: SEN
D*-P%
D*D*-PP%
D*D*D*-PPP%

15
School Staff Section 3 - Who works at our School? This information is required for schools with more than 150 staff
School
No. %
Gender Male 46 19.7% Female 188 80.3%
Ethnicity
Any other ethnic background 9 3.8% Asian or Asian British, Bangladeshi 64 27.4% Asian or Asian British, Indian 6 2.6% Asian or Asian British, Pakistani 5 2.1% Black or Black British, African 7 3.0% Black or Black British, Any other Black background 2 0.9% Black or Black British, Caribbean 15 6.4% Did not wish to be recorded 2 0.9% Mixed White and Asian 5 2.1% Mixed, any other mixed background 1 0.4% Mixed, White and Black African 1 0.4% Mixed, White and Black Caribbean 2 0.9% Not Obtained 27 11.5% White, any other White Background 16 6.8% White, British 61 26.1% White, English 2 0.9% White, Irish 6 2.6% White, Scottish 2 0.9% White, Welsh 1 0.4%
Religion
Christian 29 12.4% Do not want to say 1 0.4% Methodist 1 0.4% Muslim 55 23.5% No Religion 30 12.8% Not Collected 104 44.4% Other Religion 7 3.0% Roman Catholic 6 2.6% Sikh 1 0.4%
Age
18 - 25 13 5.6% 26 - 35 79 33.8% 36 - 45 71 30.3% 46 - 55 47 20.1% 56+ 24 10.3%
Marital / Civil Partnership Status
Married 87 37.2% Civil Partnership 2 0.9% Single or not collected 145 62.0%

16
Pregnancy Pregnant or on Maternity Leave 11 5.9%
Male19.7%
Female80.3%
Gender
Married37.2%
Civil Partnership0.9%
Single or not collected62.0%
Marital / Civil Partnership Status

17
3.8%
27.4%
2.6%
2.1%
3.0%
0.9%
6.4%
0.9%
2.1%
0.4%
0.4%
0.9%
11.5%
6.8%
26.1%
0.9%
2.6%
0.9%
0.4%
0% 10%
20%
30%
40%
50%
60%
70%
80%
90%
100%
Any other ethnic background
Asian or Asian British, Bangladeshi
Asian or Asian British, Indian
Asian or Asian British, Pakistani
Black or Black British, African
Black or Black British, Any other Black background
Black or Black British, Caribbean
Did not wish to be recorded
Mixed White and Asian
Mixed, any other mixed background
Mixed, White and Black African
Mixed, White and Black Caribbean
Not Obtained
White, any other White Background
White, British
White, English
White, Irish
White, Scottish
White, Welsh
Ethnicity

18
12.4%
0.4%
0.4%
23.5%
12.8%
44.4%
3.0%
2.6%
0.4%
0% 10%
20%
30%
40%
50%
60%
70%
80%
90%
100%
Christian
Do not want tosay
Methodist
Muslim
No Religion
Not Collected
Other Religion
RomanCatholic
Sikh
Religion
5.6%
33.8%
30.3%
20.1%
10.3%
Age
18 - 25
26 - 35
36 - 45
46 - 55
56+