1 setting target reliabilities by marginal safety returns rolf skjong strategic research det norske...
TRANSCRIPT
1
Setting Target Reliabilities by Marginal Safety Returns
Rolf SkjongStrategic Research
Det Norske Veritas
Rolf.Skjong @dnv.com
JCSS Workshop on Code Calibration, March 21-22 2002
2
Traditional Approach - SRA
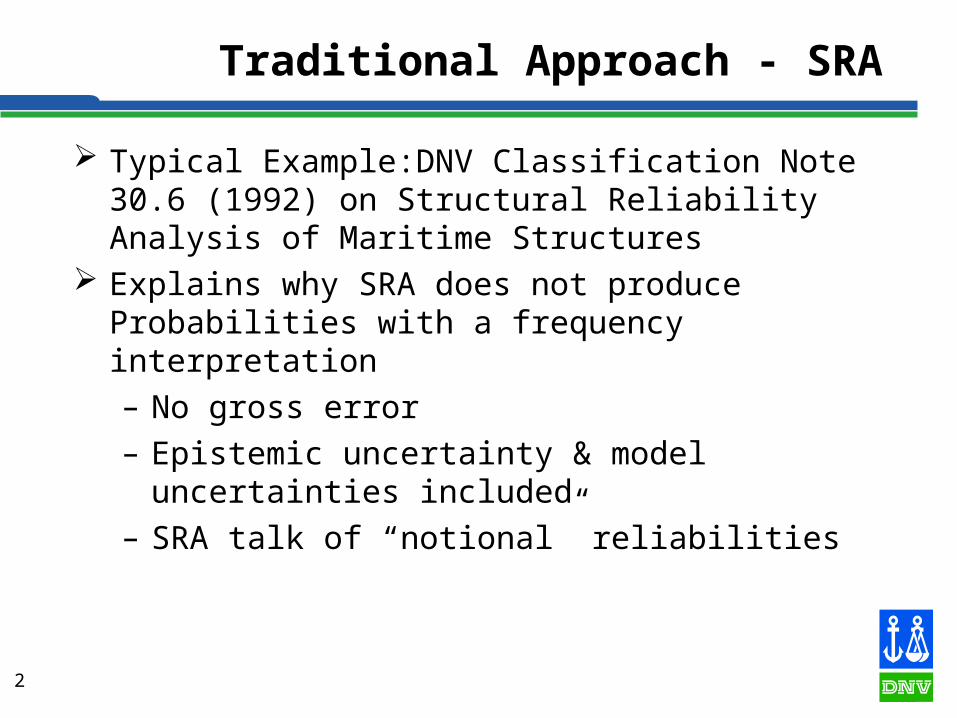
Typical Example:DNV Classification Note 30.6 (1992) on Structural Reliability Analysis of Maritime Structures
Explains why SRA does not produce Probabilities with a frequency interpretation– No gross error– Epistemic uncertainty & model uncertainties
included– SRA talk of “notional” reliabilities

3
Traditional Approach - SRA
Target should depend on consequence Calibration against known cases (that are acceptable
good/best practices in the industry) Calibration against similar cases with similar
consequences Based on accepted decision analysis techniques Based on tabular values (presented as a last resort)

4
Traditional Approach - SRA
Target should depend on consequence Calibration against known cases (that are acceptable
good/best practices in the industry) Calibration against similar cases with similar
consequences Based on accepted decision analysis techniques Based on tabular values (presented as a last resort)

5
Traditional Approach - SRA
Based on tabular values (presented as a last resort)
Annual Target Probabilities (and Target βT) from DNV Classification Note 30.6Consequence of FailureClass of Failure
Less serious SeriousI- Redundant Structure PF = 10-3, βT = 3.09 PF = 10-4, βT = 3.71II - Significant warning before the occurrence offailure in a non-redundant structure
PF = 10-4, βT = 3.71 PF = 10-5, βT = 4.26
III - No warning before the occurrence of failure ina non-redundant structure
PF = 10-5, β T = 4.26 PF = 10-6, β T = 4.75

6
Traditional Approach - QRA
Quantitative risk assessment is the basis for regulations in many industries– PSA/PRA - Nuclear– Hazardous Industries (Seveso I/II)– Offshore (Safety Case)– Shipping (FSA)– Etc.

7
Quantitative Risk Assessment
Two uses of Risk assessment Use as a basis for receiving and maintaining a licence
to operate (the plant, platform etc.)– Safety Case
Use as a basis for implementing risk reducing measures for “populations (all cars, all ships, all planes etc.)– Formal Safety Assessment

8
Traditional Approach - QRA
Present Risk Results in terms of– Individual risk (fatalities)– Individual risk (Health and Injuries)– Societal Risk (group Risk)– Environmental risk– Economic risk (not necessarily a regulatory issue)
9
Traditional Approach - QRA
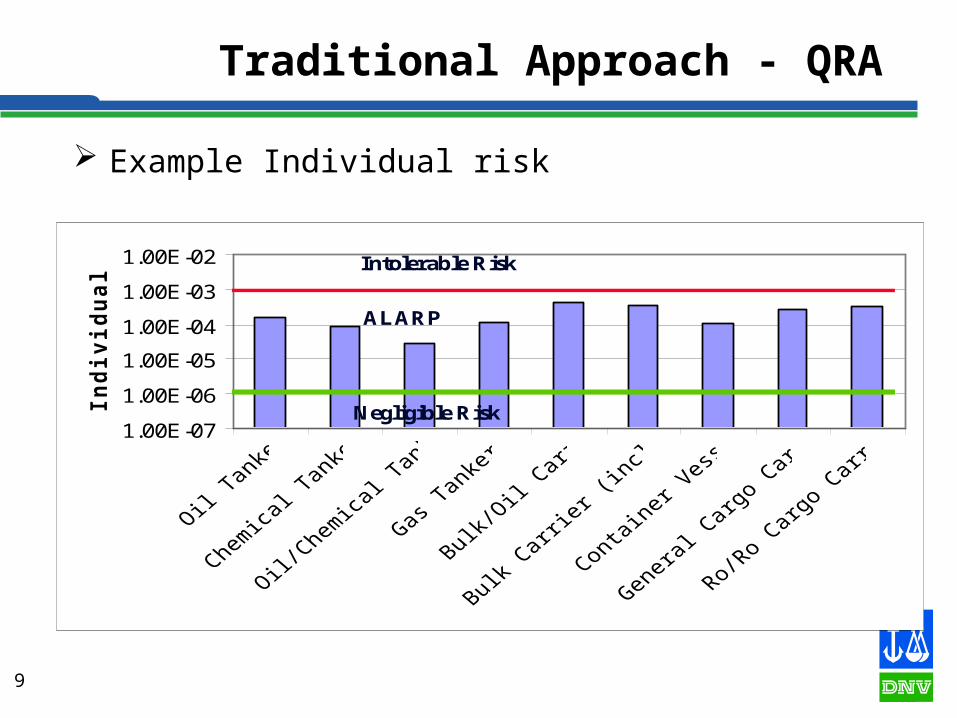
Example Individual risk
1.00E-07
1.00E-06
1.00E-05
1.00E-04
1.00E-03
1.00E-02
Ind
ivid
ual
risk Intolerable Risk
ALARP
Negligible Risk

10
Traditional Approach - QRA
Example Health Risk
Time (years)
Health index
1Perfecthealth
Death 0
A
C
A’ B’
BExpected Health index, when RCO implemented
Expected Health index,when RCO not implemented
Quality Adjusted Life Years gainedby implementing the RCO

11
Traditional Approach - QRA
Example Societal Risk
1.0E-06
1.0E-05
1.0E-04
1.0E-03
1.0E-02
1 10 100
Fatalities (N)
Fre
qu
en
cy
of
N o
r m
ore
fa
taliti
es
(p
er
sh
ip
ye
ar)
Oil tankers
Chem. tankers
Oil/Chemicaltankers
Gas tanker
Negligible
Intolerable
ALARP
12
Traditional Approach - QRA
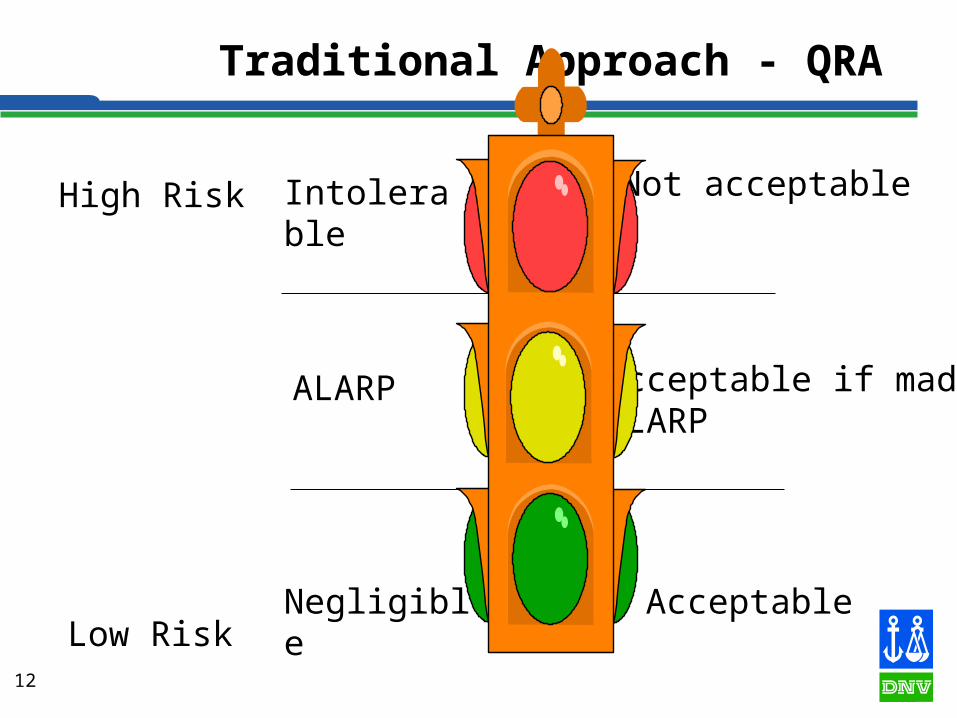
Low Risk
High Risk Intolerable
ALARP
Negligible
Not acceptable
Acceptable
Acceptable if made ALARP

13
Traditional Approach - QRA
The As Low As Reasonably Practicable Area implies that cost effectiveness assessment may be used
Risk is made As Low As Reasonably Practicable, when all cost effective safety measures have been implemented
Implies that a decision criteria for cost effectiveness will be required

14
Methods for deriving criteria
Human capital approach Willingness to pay Comparing to well informed (risk informed) decisions in
democratic forum (a willingness to pay) Comparing to previous decision (a willingness to pay) Societal Indicators (a willingness to pay) Individual decisions

15
Human capital approach
Value of man as a resource in economic production Has discredited cost effectiveness & cost benefit
assessment Contradicts ethical principle (Protagoras: “Homo
mensura” and later formulations, e.g. Kant) Same reason as many governments ban research on
human stem-cells
16
Willingness to pay
Many forms of willingness to pay studies– Questionnaires– Observed behaviour (e.g. insurance)– Implicit in previous decisions– Implicit in existing regulations– Etc.

17
Comparing to well informed decisions
Example from IMO: UN Organisation for maritime safety and environmental protection regulations
Cost of averting fatalities in actual decisions
Decision DecisionMaker
Value
Strengthening Bulkheads on Existing BulkCarriers
IACS andIMO (1)
> $ 1.5 million
Helicopter Landing Area on non-Ro/RoPassenger Ships
IMO(2) < $ 37 million($ 12 million to $ 73
billion)3 bulkheads on car deck IMO(3) < $ 5 million3 bulkheads on car deck NMD(3) > $ 5 million3 bulkheads + sponsons IMO(3) < 7.8 millionExtended sponsons only IMO(3) < $ 11 millionCollision Avoidance Training Owner(3) > $ 0.7 millionExtra Deck Officer IMO(3) < $ 5.5 millionRe: (1) Mathisen et al.(1997), (2) Skjong et al.(1997), (3) DNV(1997)
18
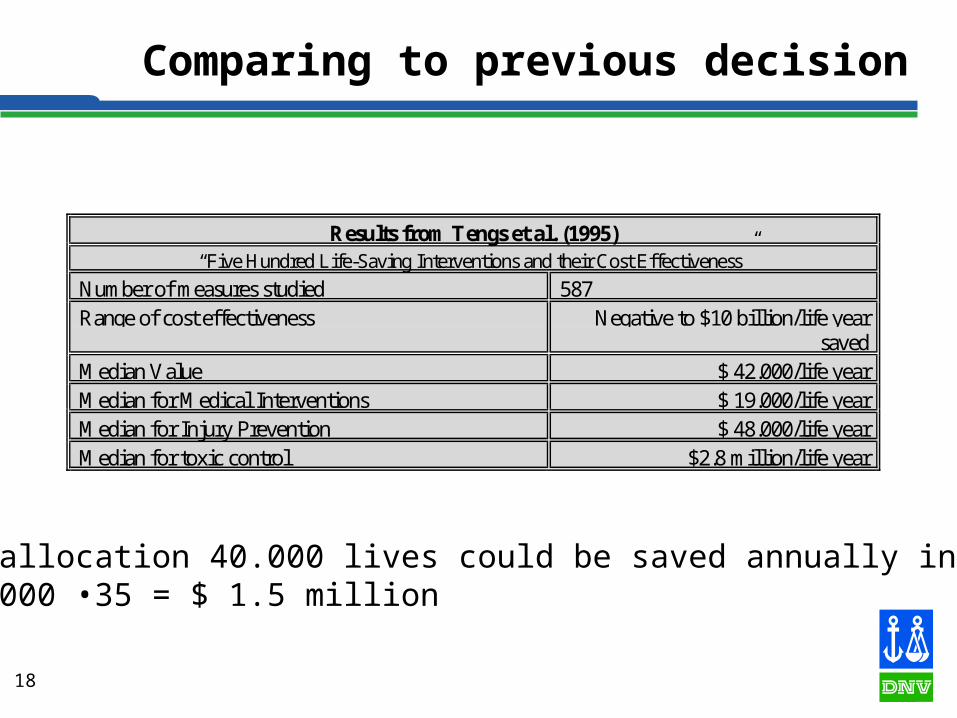
Comparing to previous decision
Results from Tengs et al. (1995)“Five Hundred Life-Saving Interventions and their Cost Effectiveness”
Number of measures studied 587Range of cost effectiveness Negative to $10 billion/life year
savedMedian Value $ 42.000/life yearMedian for Medical Interventions $ 19.000/life yearMedian for Injury Prevention $ 48.000/life yearMedian for toxic control $2.8 million/life year
•By reallocation 40.000 lives could be saved annually in the US•$ 42.000 •35 = $ 1.5 million

19
Societal Indicators
Societal Indicators used to rate “quality of life” in countries
Published by UN (UNDP) Many different indictors exist Include such parameters as: GDP/Capita, Life
Expectancy at Birth, literacy etc.HDI (1999)
1 Norway 0.9392 Australia 0.9363 Canada 0.9364 Sweden 0.9365 Belgium 0.9356 United States 0.9347 Iceland 0.9328 Netherlands 0.9319 Japan 0.92810 Finland 0.92511 Switzerland 0.924

20
Social Indicators
e
dew
g
dgw
L
dL)1(
wwegL 1
21
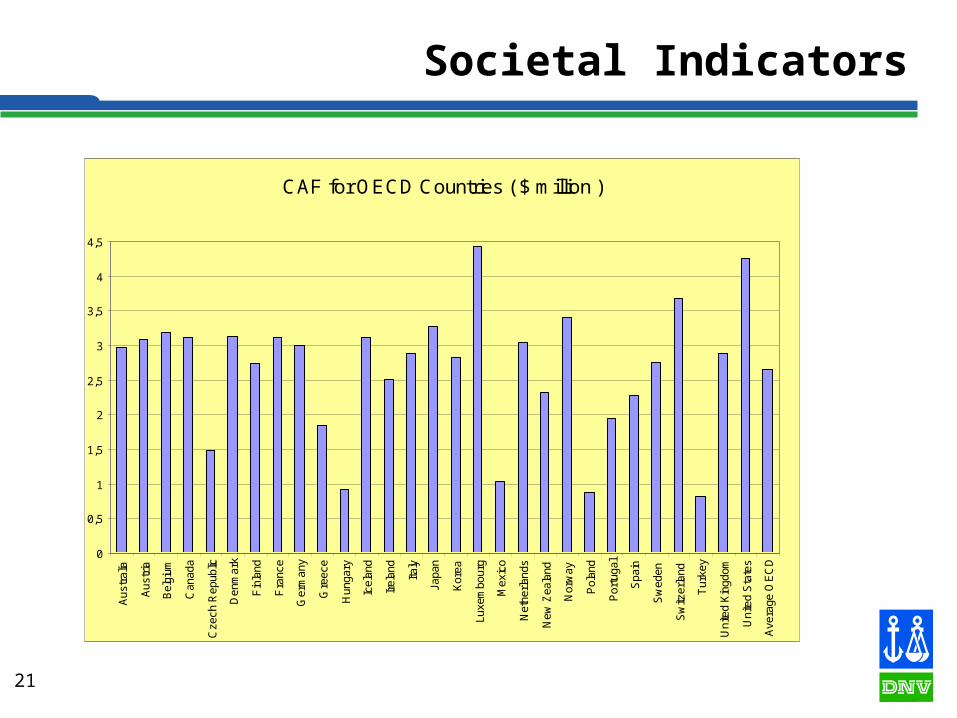
Societal Indicators
CAF for OECD Countries ( $ million )
0
0,5
1
1,5
2
2,5
3
3,5
4
4,5
Aus
tral
ia
Aus
tria
Bel
gium
Can
ada
Cze
ch R
epub
lic
Den
mar
k
Fin
land
Fra
nce
Ger
man
y
Gre
ece
Hun
gary
Icel
and
Irel
and
Italy
Japa
n
Kor
ea
Luxe
mbo
urg
Mex
ico
Net
herla
nds
New
Zea
land
Nor
way
Pol
and
Por
tuga
l
Spa
in
Sw
eden
Sw
itzer
land
Tur
key
Uni
ted
Kin
gdom
Uni
ted
Sta
tes
Ave
rage
OE
CD

22
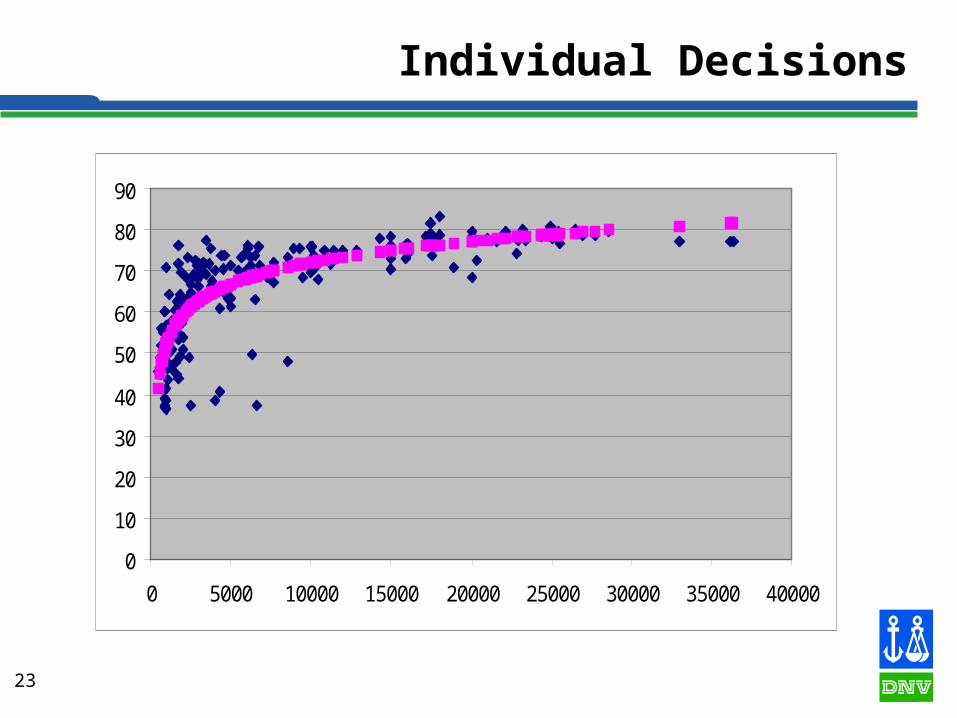
Individual Decisions
Also individuals take decision that increase life expectancy and reduces accident frequencies
For example:– Buy safer cars– Buy more healthy food– Go to the doctor more frequently– Etc.
How much increase in purchasing power is necessary to increase the life expectancy in a population by “e”
23
Individual Decisions
0
10
20
30
40
50
60
70
80
90
0 5000 10000 15000 20000 25000 30000 35000 40000
24
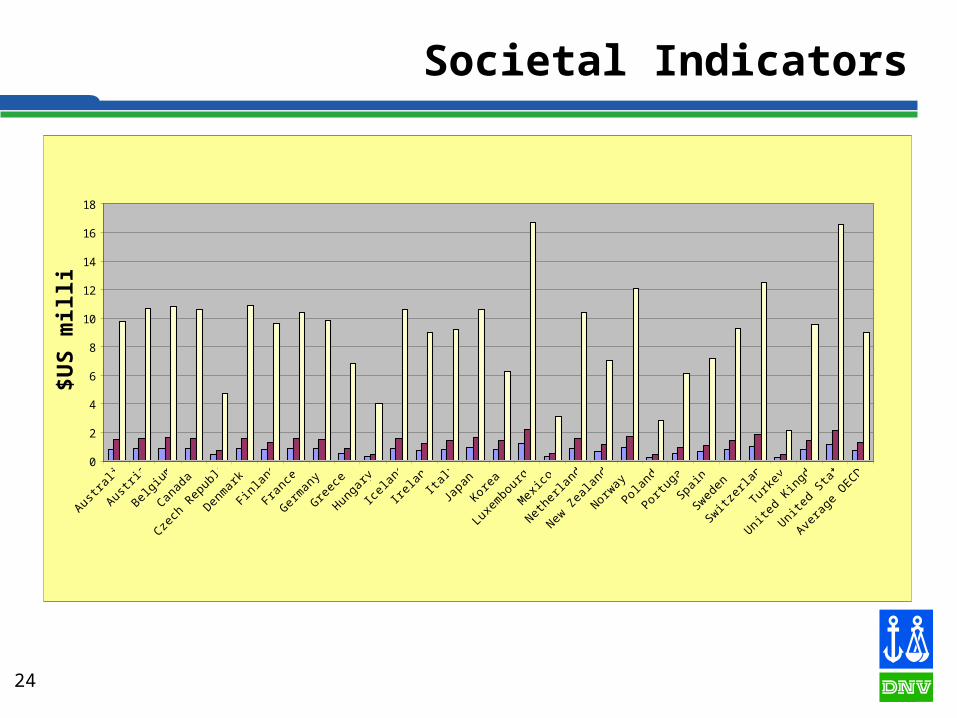
Societal Indicators
0
2
4
6
8
10
12
14
16
18
Austra
lia
Austri
a
Belgium
Canad
a
Czech
Rep
ublic
Denm
ark
Finlan
d
Franc
e
Ger
man
y
Gre
ece
Hunga
ry
Icela
nd
Irelan
dIta
ly
Japa
n
Korea
Luxe
mbo
urg
Mex
ico
Nethe
rland
s
New Z
ealan
d
Norway
Poland
Portu
gal
Spain
Sweden
Switzer
land
Turk
ey
United
King
dom
United
Sta
tes
Avera
ge O
ECD
$U
S m
illi
on
25
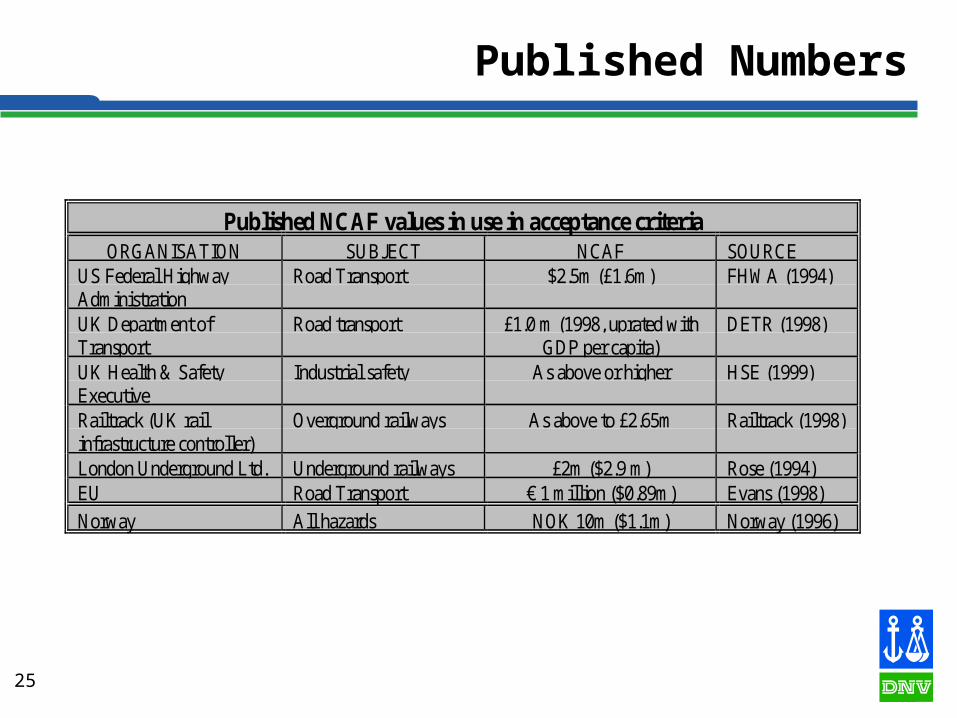
Published Numbers
Published NCAF values in use in acceptance criteriaORGANISATION SUBJECT NCAF SOURCE
US Federal HighwayAdministration
Road Transport $2.5m (£1.6m) FHWA (1994)
UK Department ofTransport
Road transport £1.0 m (1998, uprated withGDP per capita)
DETR (1998)
UK Health & SafetyExecutive
Industrial safety As above or higher HSE (1999)
Railtrack (UK railinfrastructure controller)
Overground railways As above to £2.65m Railtrack (1998)
London Underground Ltd. Underground railways £2m ($2.9 m) Rose (1994)EU Road Transport € 1 million ($0.89m) Evans (1998)Norway All hazards NOK 10m ($1.1m) Norway (1996)
26
Criterion?
For an OECD member country (excluding the newest members) the criteria is somewhere in the range $ 1.5 -3.0 million
Some uncertainties relates to: Fatalities as indicator or actual fatalities NCAF or GCAF Despite uncertainty different methods give surprisingly
consistent results In a QRA a factor of 2 is not much compared to the
uncertainty in the analysis In SRA the design variables are continuos, and we do not
know how sensitive the resulting dimensions are to the criterion
27
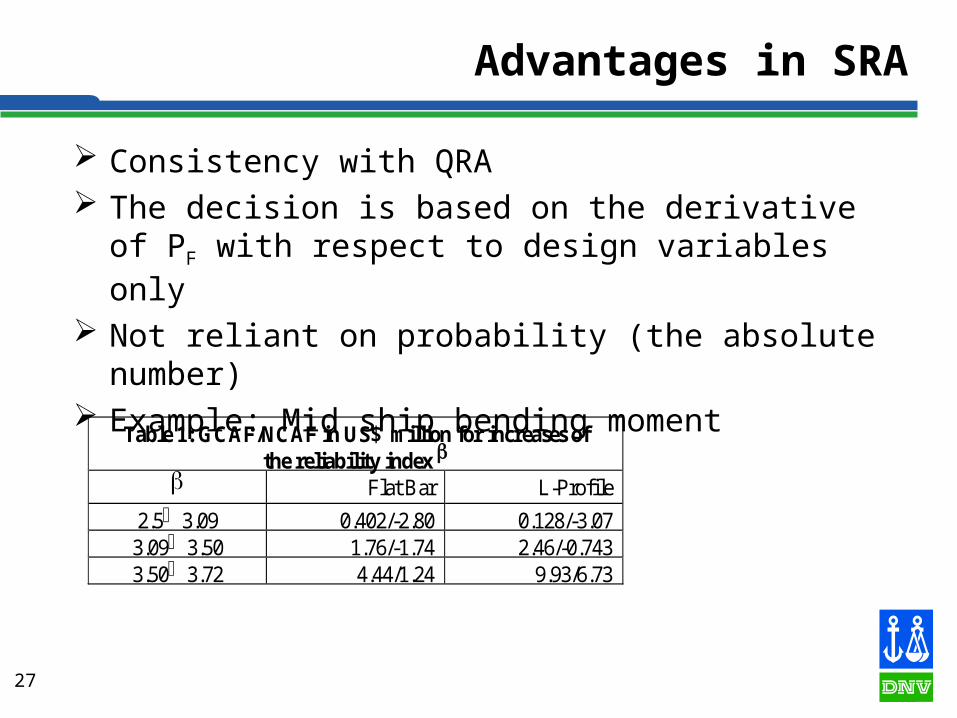
Advantages in SRA
Consistency with QRA The decision is based on the derivative of PF with
respect to design variables only Not reliant on probability (the absolute number) Example: Mid ship bending moment
Table 1: GCAF/NCAF in US$ million for increases ofthe reliability index
Flat Bar L-Profile
2.53.09 0.402/-2.80 0.128/-3.073.093.50 1.76/-1.74 2.46/-0.7433.503.72 4.44/1.24 9.93/6.73