1 running head: dif with passage-based testlets … · testlet dif 2 abstract the objective of this...
TRANSCRIPT

Testlet DIF 1
Running head: DIF WITH PASSAGE-BASED TESTLETS
Using Five Procedures to Detect DIF with Passage-Based Testlets
Lingyun Gao and Changjiang Wang
University of Alberta
A paper prepared for the poster presentation at the Graduate Student Poster Session at the annual
meeting of the National Council of Measurement in Education, Montreal, Quebec, April 2005
Testlet DIF 2
Abstract
The objective of this study was to assess differential item functioning (DIF) for passage-based
reading testlets across two gender groups using five procedures and then to compare the results
across the procedures. The five procedures were: (1) polytomous logistic regression (PLR;
Zumbo, 1999), (2) graded response model (GRM; Samejima, 1969, 1997), (3) Mantel-Haenszel
(MH; Zwick, Donoghue, & Grima, 1993), (4) polytomous SIBTEST (Poly-SIBTEST; Chang,
Mazzeo, & Roussos, 1996), and (5) testlet response theory model (TRTM; Wang, Bradlow and
Wainer, 2002). Consistent results were produced between the PLR, MH, and Poly-SIBTEST
procedures but not the other two. A simulation study was called for to evaluate the accuracy of
each procedure in the passage-based testlet situation.
Testlet DIF 3
Using Five Procedures to Detect DIF with Passage-Based Testlets
Differential Item functioning (DIF) is present when individuals of the same ability but from
different groups have different probabilities of success on a given item (Hambleton,
Swaminathan, & Rogers, 1991). The presence of DIF poses a potential threat to the validity of
score interpretations. To date, a variety of DIF analysis procedures with a strong theoretical basis
and strong empirical support have been developed (Clauser & Mazor, 1998) and many DIF-
related studies have been published (Haladyna & Downing, 2004). However, comparatively
fewer studies have investigated DIF where testlets are involved (Thissen, Steinberg, & Mooney,
1989; Wainer, 1995; Wainer & Lewis, 1990; Wainer, Sireci, & Thissen, 1991).
In Wainer and Kiely (1987), the concept of testlet is proposed to refer to a group of items
related to a single content area that is developed as a unit. Taking reading tests as an example,
one of the most commonly used test formats for assessing reading features a set of related items
based on a common reading passage. However, such a test format can pose problems for analysis
by IRT models, since the interrelatedness among the set of items violates the local item
independence (LII) assumption of IRT (Lee, Brennan, & Frisbie, 2000). Research has
demonstrated that violating the LII assumption can cause inaccurate estimation of test reliability,
examinee abilities, and item information (Lee, 2004; Wainer & Lukhele, 1997). Further, Bolt
(2002) claims that model misfit due to local item dependence may affect the results of DIF
detection methods. As Wainer and Lukhele (1997) warn, if the problem of local dependence
among passage-based test items is not tackled, test score analyses may yield quite misleading
information to test developers and test users.
To tackle this problem, two major approaches have been proposed. One involves treating
the items that share a common passage as a testlet and fitting the data to a polytomous IRT

Testlet DIF 4
model (Wainer & Kiely, 1987). The other involves treating the items based on a passage as a set
that share an additional item parameter and fitting the 4-parameter dichotomous IRT model to
data (i.e., the testlet response theory (TRT) model; Wang, Bradlow, & Wainer, 2002).
In testlet-related DIF research, a general way of addressing the problem of local item
dependence has been to treat the items that share a common reading passage as a unit (i.e.,
testlet) and then to fit the data to a polytomous IRT model (Thissen et al., 1989; Wainer, 1995;
Wainer & Lewis, 1990; Wainer et al., 1991). In so doing, the conventional IRT analysis of
individual dichotomous items has evolved into the analysis of polytomous testlets, with the
scores on a testlet ranging from zero to the number of items within the testlet. These studies
demonstrated the advantages of treating passage-based items as a unit where testlet DIF is
assessed. For example, Thissen et al. (1989) reported two major outcomes in their testlet DIF
study. First, there seemed to be a slightly greater validity of the testlet-derived scores when
correlated with an external criterion. Second, the test information function yielded by the
traditional analysis, in which test items were treated as single independent items, was spuriously
high.
Moreover, Wainer et al. (1991) argued for three major advantages of treating passage-
based items as testlets in assessing DIF. First, they contended that if items were built to be
administered as a unit (testlet), then it was important that the items be analyzed in that way. In
this sense, the testlet-level DIF analysis allowed the match between the analysis model and the
test construction principle. Second, they argued that balancing DIF at the testlet level was much
simpler than balancing DIF at the test level. Hence, the testlet-level DIF analysis made it less
difficult for test developers to provide DIF-free tests. Third, they argued that a set of items might
show no detectable DIF at the item level but show significant DIF when aggregated at the testlet
Testlet DIF 5
level. Thus, testlet-level DIF analysis increased the sensitivity of detecting DIF. These arguments
were empirically validated in a series of testlet DIF studies (Wainer et al., 1991; Wainer, 1995).
A limitation with these studies, however, is that they were constrained to the nominal
response model (NRM; Bock, 1972) and the likelihood ratio test (Thissen, Steinberg, & Wainer,
1988). A drawback of the NRM is that a large number of parameters need to be estimated when
fitting the model to data, which makes the process of detecting testlet DIF cumbersome and
inefficient. Indeed, a variety of polytomous DIF detection procedures have been available (e.g.,
graded response model, Samejima, 1997; polytomous SIBTEST, Chang, Mazzeo, & Roussos,
1996), and some of these procedures may have advantages over the NRM in testlet DIF
applications. For example, in the GRM (Samejima, 1997), a smaller number of parameters need
to be estimated in fitting the GRM to data, since the item discrimination parameter in the GRM is
assumed to be constant across the graded response categories. In addition, it is more in
accordance with the feature of testlets that those who score in higher categories generally have
higher ability estimates than those who score in lower categories. Lee (2001) justified the use of
GRM for detecting testlet DIF using these arguments. Assuming that the estimated difficulty
parameters in testlets increase from the lower to higher steps, he concluded that the score
categories for a passage-based testlet could be considered as graded responses.
Using Potenza and Dorans’ (1995) two-dimensional taxonomy, Penfield and Lam (2000)
categorized current polytomous DIF detection procedures into four groups: observed score
parametric, latent variable parametric, observed score nonparametric, and latent variable
nonparametric. According to Penfield and Lam (2000), the observed score procedures use the
total observed score as the ability estimate, while the latent variable procedures use an estimate
of the latent ability. The parametric procedures use mathematical models to estimate item
Testlet DIF 6
performance at each ability level, while the nonparametric procedures use no mathematical
model (it simply compares the observed item performance at each ability level between the
groups. Any differences would suggest the presence of DIF). However, no studies have used
these procedures to detect testlet DIF or compared the results of testlet DIF across different
procedures. Further, no research has investigated whether the testlet response theory model can
be applied to testlet DIF detection. The testlet item format is widely adopted in large-scale tests.
As an essential aspect of test fairness, DIF with testlets is of importance and consequence in
educational and psychological testing (Gierl, Bisanz, Bisanz, Boughton, & Khaliq, 2001, Wainer
et al., 1991). Therefore, research in assessing testlet DIF is sorely needed.
With respect to the subgroups used in DIF analyses, gender differences on high stakes
examinations has become and continue to be a major concern for educational researchers and test
developers (Lin & Wu, 2004). While abundant studies investigated gender DIF on tests of
mathematics (e.g., Lane, Wang, & Magone, 1996; Ryan & Fan, 1996), only a few examined
gender DIF on passage-based reading testlets (Ryan & Bachman, 1992; Wainer & Lukhele,
1997) and these studies were limited to the item-level analyses. Gender DIF is a major issue of
test fairness for all examinees and research on gender DIF at the testlet-level will allow the test
developers and test users to better understand the effect of gender on test performance.
Consequently, the objective of this study was to assess DIF with passage-based testlets
across two gender groups using five different procedures and then to compare the results across
the procedures. The first four procedures were polytomous DIF detection procedures chosen in
light of Penfield and Lam’s (2000) two-dimensional taxonomy (i.e., one procedure from each of
the observed score parametric, latent variable parametric, observed score nonparametric, and

Testlet DIF 7
latent variable nonparametric procedures in their taxonomy). The last procedure was an attempt
to detect testlet DIF based on the testlet response theory model (TRTM; Wang, et al., 2002).
Method
Sample
The subjects in this study were Grade 12 students who took the English 30 Diploma
Examination administered in June 1997 in the province of Alberta, Canada. The dichotomously-
scored item responses from the students on the reading section of this examination were used in
the current study. In order to provide a cross-validation of the findings, two samples were
randomly selected from the June 1997 English 30 database. One sample was used for the major
analysis, and the other for cross-validation. Each sample contains 3000 examinees, with an equal
number of males and females (i.e., 1500 females and 1500 males).
Instrument
The English 30 Diploma Examination of Alberta is one of the Grade 12 Diploma
Examinations designed to certify the level of individual student achievement in selected Grade
12 courses. It is administered province-wide in January, June, and August of each year and is
compulsory for all of the Grade 12 students of Alberta to receive a high school diploma
(http://www.education.gov.ab.ca). The June 1997 English 30 Diploma Examination consisted of
two sections: Written Response and Reading, with each section worth 50% of the total mark. The
reading section consisted of seven reading passages on a variety of topics and a total of 70 four-
option multiple-choice test items based on the passages. Each passage was respectively followed
by a set of 10, 7, 12, 12, 10, 10, and 9 related test items (i.e., the testlet format). Students were
required to select the single correct answer.

Testlet DIF 8
Procedures
Polytomous logistic regression (PLR). The polytomous logistic regression (PLR;
Zumbo, 1999) procedure was performed to demonstrate the use of observed score parametric
polytomous DIF detection procedures (Penfield & Lam, 2000) for detecting testlet DIF.
Assuming the existence of a latent variable, this procedure estimates the cumulative probability
for each point on the scale (Agresti, 1996). For example, for an item of the 3-point scale (0, 1,
and 2), the PLR procedure models the cumulative probability of scoring 1 or less versus greater
than 1, and the cumulative probability of scoring 2 or less versus greater than 2. Zumbo (1999)
presents the statistical model for DIF analysis for polytomously scored items as,
Logit [P (Y ≤ j)] = αj + b1 Total Score + b2 Group + b3 (Total Score * Group),
where a logit is the natural log of the odds ratio, j = 0, 1, 2,…, c-1, where c is the number of
categories in the scale, αj is the intercept parameter for each cumulative probability. Total Score
is the covariate for ability level, and Total Score * Group is the ability level by group
membership interaction variable.
As the equation defines, the conditioning variable (i.e., the total score), the group
variable, and the interaction term (Total Score * Group) are sequentially entered into the
hierarchical model. Tests of statistical significance for DIF are followed to examine whether the
fully augmented model (i.e., after the interaction terms are entered) significantly contributes to
the data-model fit over the compact model (i.e., after the conditioning variable is entered). If it is
statistically significant, then the null-hypothesis, b3 = 0, is rejected, which indicates that the item
shows DIF due to group membership and/or interaction between group and ability (Swaminathan
& Rogers, 1990). Zumbo (1999) shows that testing for the statistical significance of DIF can be
conducted using the chi-square test with two degrees of freedom (2 df, i.e., the difference in df of

Testlet DIF 9
the fully augmented model and the compact model). The resulting 2df chi-square test is a
simultaneous test of uniform and non-uniform DIF (Swaminathan & Rogers, 1990).
In addition, as the statistical significance of effects can be affected by sample size,
Zumbo (1999) proposes a measure of DIF effect size, which is the difference in the R-squared
values at each step of DIF modeling. He further explains that the amount of the variation in
predicting the dependent variable attributable to both the group variable and the interaction of the
group and the ability level is the magnitude of overall DIF. The amount of the unique variation
attributable to the group variable is the magnitude of uniform-DIF. The amount of the unique
variation attributable to the interaction is the magnitude of non-uniform DIF.
The graded response model (GRM). The graded response model (GRM; Samejima, 1969,
1997) procedure was performed to demonstrate the use of latent variable parametric polytomous
DIF detection procedures (Penfield & Lam, 2000) for detecting testlet DIF. In the GRM, an item
i has m ordered polytomous categories. The GRM specifies the cumulative probability of a
response in category k or higher versus a response in categories lower than k. The probability
that an examinee obtains a certain score category is explained as follows,
* *1( ) ( ) ( )k k kP P Pθ θ += − θ ,
where k=0, 1, 2, …m; θ is the latent trait; Pk*(θ) represent the cumulative probability of a
response above category k; and
*,
1( )1 exp[ 1.7 ( )]x i
i xiP
a bθ
θ=
+ − − ,
where bxi is the difficulty parameter for category score x of item i, and ai is the discrimination
parameter for item i.
In the GRM procedure, the item parameters are assumed invariant across the groups at a
given ability level. If an item parameter varies across the groups at the same ability level, the

Testlet DIF 10
item will be identified as displaying DIF. The likelihood ratio test proposed by Thissen et al.
(1988) was conducted to assess DIF. According to Thissen et al., the compact model is based on
the assumption that all testlets have the same parameters across the two populations of interest
(i.e., no DIF). The augmented model assumes the testlet being investigated as having DIF and
includes the parameters for the internal anchor testlets from the compact model. The data are fit
to the compact model and then to the augmented model. The test statistics G2 (i.e., the ratio of the
likelihood from the two models) is computed to investigate whether the augmented model
significantly increases model fit over the compact model. The formula for G2 is
2 2 log ( )2 log ( )
likelihood CGlikelihood A
−=−
,
where C is the compact model and A is the augmented model.
Thissen et al. (1988) shows that the test statistics G2 has a chi-square distribution with degrees of
freedom equal to the difference in the number of parameters between the compact and the
augmented model. If G2 is statistically significant, the studied testlet displays DIF. Further, as the
IRT-based parameter estimates for discrimination and difficulty provide information regarding
which group a testlet favors at the given ability levels, the GRM procedure can detect both
uniform and nonuniform DIF (Kim, 2001; Thissen, 2001).
The Mantel-Haenszel (MH). The Mantel-Haenszel (MH; Zwick, Donoghue, & Grima,
1993) procedure for ordered response categories was performed to demonstrate the use of
observed score nonparametric polytomous DIF detection procedures (Penfield & Lam, 2000) in
detecting testlet DIF. According to Zwick et al. (1993), this procedure involves assigning index
numbers to the response categories and comparing the item means for the reference and focal
groups, conditional on an observed score as ability estimate. To implement this procedure, the
data are organized into a 2 x T x K contingency table, where T is the number of response
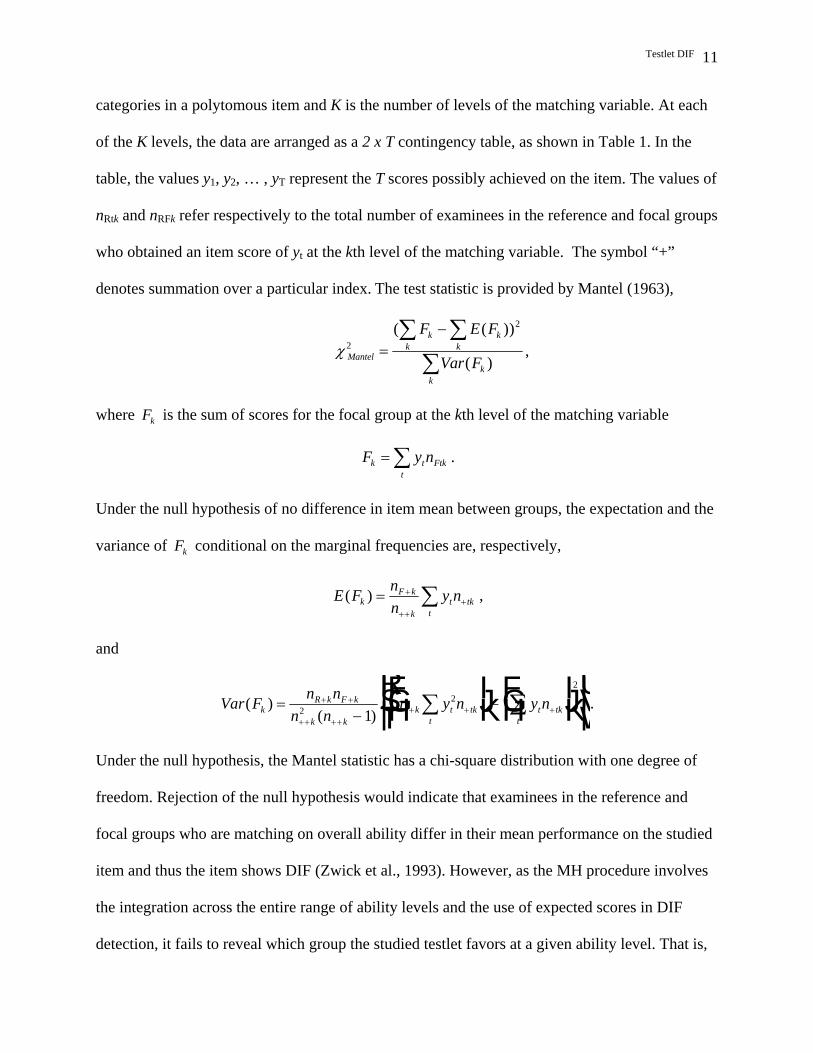
Testlet DIF 11
categories in a polytomous item and K is the number of levels of the matching variable. At each
of the K levels, the data are arranged as a 2 x T contingency table, as shown in Table 1. In the
table, the values y1, y2, … , yT represent the T scores possibly achieved on the item. The values of
nRtk and nRFk refer respectively to the total number of examinees in the reference and focal groups
who obtained an item score of yt at the kth level of the matching variable. The symbol “+”
denotes summation over a particular index. The test statistic is provided by Mantel (1963),
χ Mantel
k kkk
kk
F E F
Var F2
2
=−∑∑
∑
( (
( )
))
Ftk
,
where is the sum of scores for the focal group at the kth level of the matching variable Fk
F y nk tt
= ∑ .
Under the null hypothesis of no difference in item mean between groups, the expectation and the
variance of conditional on the marginal frequencies are, respectively, Fk
E F nn
y nkF k
kt tk
t
( ) = +
+++∑ ,
and
Var F n nn n
n y n y nkR k F k
k kk t tk
tt tk
t
( )( )
=−
FHG
IKJ−
FHG
IKJ
RS|T|UV|W|
+ +
++ ++++ + +∑ ∑2
22
1.
Under the null hypothesis, the Mantel statistic has a chi-square distribution with one degree of
freedom. Rejection of the null hypothesis would indicate that examinees in the reference and
focal groups who are matching on overall ability differ in their mean performance on the studied
item and thus the item shows DIF (Zwick et al., 1993). However, as the MH procedure involves
the integration across the entire range of ability levels and the use of expected scores in DIF
detection, it fails to reveal which group the studied testlet favors at a given ability level. That is,

Testlet DIF 12
the MH procedure can only detect overall DIF and lacks the ability to detect uniform and
nonuniform DIF.
The polytomous SIBTEST (Poly-SIBTEST). The polytomous SIBTEST (poly-SIBTEST)
procedure was performed to demonstrate the use of latent variable nonparametric polytomous
DIF detection procedures (Penfield & Lam, 2000) for detecting testlet DIF. This procedure
estimates the expected item scores ( )RES θ and ( )FES θ for the studied item by conditioning on
total scores for a valid subtest of items believed to contain no DIF (Bolt, 2002; Chang et al.,
1996). Replacing θ with these valid subtest scores, the expected item scores are estimated as
1( ) ( ),
m
R Rk
kES t kP t=
= ∑
and
1
( ) ( )m
F F
k
kES t kP t=
= ∑ ,
where denotes the empirical proportion of examinees in group g that obtain score k on the
studied item and have valid subtest score t. Because
( )gkP t
( )RES t and ( )FES t contain bias due to
measurement error in the valid subtest, Poly-SIBTEST uses the adjusted expected item scores
* ( )RES t and * ( )FES t through a regression process. The adjusted scores more accurately reflect
examinees of equal ability levels across groups and thus are more meaningful for comparing
group differences on the studied item (Bolt, 2002). Poly-SIBTEST uses a weighted average
difference of the adjusted scores to estimate DIF statistic UNIβ ,
1
( ) ( ){[ * ( ) * ( )] }T
R FUNI R F
t
N t N tES t ES tN
β∧
=
+= −∑ ,

Testlet DIF 13
where T is the maximum score on the valid subtest, , are the number of examinees
obtaining valid subtest score of t from the reference and focal groups respectively, and N is the
total number of examinees (Bolt, 2002). The test statistic
( )RN t ( )FN t
UNI
UNI
Bβ
β
σ ∧
∧
∧= is used to detect DIF, where
1/ 22 22
0
( ) ( )TR F Rt Ft
UNIt Rt Ft
N t N tN N N
βσ σσ ∧
∧
=
⎡ ⎤⎛ ⎞+⎛ ⎞⎢ ⎥⎜ ⎟= +⎜ ⎟ ⎜ ⎟⎢ ⎥⎝ ⎠ ⎝ ⎠⎣ ⎦∑ .
If 1 2| |B z α−> , then reject the H0 and conclude that DIF exists for the studied item (Bolt, 2002;
Chang et al., 1996). Like the MH procedure, the Poly-SIBTEST procedure also involves the
integration across the entire range of ability levels and the use of expected scores in DIF
analyses. As a result, the Poly-SIBTEST can only detect overall DIF effect and fails to provide
information about whether DIF is present in the same pattern across all the ability levels.
The testlet response theory model (TRTM). Different from the polytomous DIF detection
procedures applied to testlet DIF detection, a new testlet DIF detection procedure based on the
testlet response theory model (TRTM, Wang et al., 2002) is explored in the current study. The
TRTM is a 4-parameter dichotomous IRT model. To tackle the problem of local item
dependence of testlets in IRT analysis, this model introduces a testlet effect parameter, γig(j). The
TRTM is formally expressed as
p y c ca b
a bij j j
j i j ig j
j i j ig j
( ) ( )exp
exp( )
( )
= = + −− −
+ − −1 1
1
θ γ
θ γ
d id i ,
where is the score for item j received by examinee i , is the item discrimination, b is the
item difficulty, c is the guessing parameter,
yij a j j
j θ i is examinee’s ability, and γ ig j( ) is the testlet
effect parameter indicating the testlet effect for examinee i in testlet g, to which item j belongs.
Testlet DIF 14
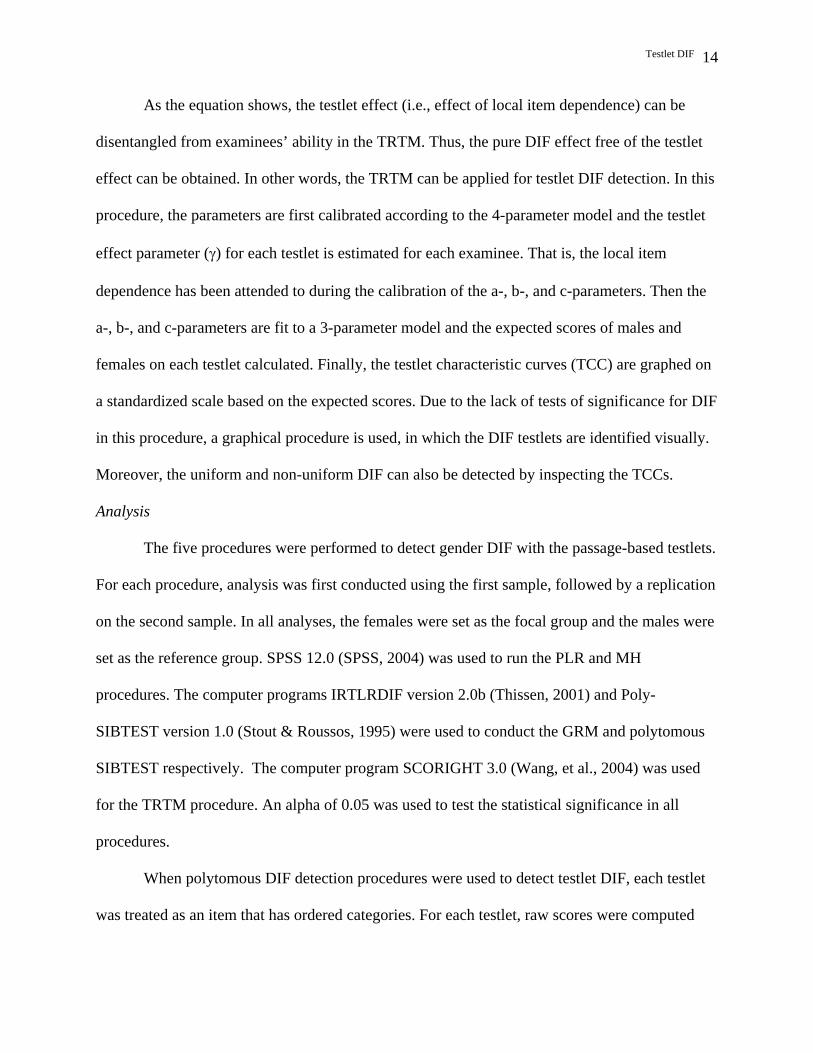
As the equation shows, the testlet effect (i.e., effect of local item dependence) can be
disentangled from examinees’ ability in the TRTM. Thus, the pure DIF effect free of the testlet
effect can be obtained. In other words, the TRTM can be applied for testlet DIF detection. In this
procedure, the parameters are first calibrated according to the 4-parameter model and the testlet
effect parameter (γ) for each testlet is estimated for each examinee. That is, the local item
dependence has been attended to during the calibration of the a-, b-, and c-parameters. Then the
a-, b-, and c-parameters are fit to a 3-parameter model and the expected scores of males and
females on each testlet calculated. Finally, the testlet characteristic curves (TCC) are graphed on
a standardized scale based on the expected scores. Due to the lack of tests of significance for DIF
in this procedure, a graphical procedure is used, in which the DIF testlets are identified visually.
Moreover, the uniform and non-uniform DIF can also be detected by inspecting the TCCs.
Analysis
The five procedures were performed to detect gender DIF with the passage-based testlets.
For each procedure, analysis was first conducted using the first sample, followed by a replication
on the second sample. In all analyses, the females were set as the focal group and the males were
set as the reference group. SPSS 12.0 (SPSS, 2004) was used to run the PLR and MH
procedures. The computer programs IRTLRDIF version 2.0b (Thissen, 2001) and Poly-
SIBTEST version 1.0 (Stout & Roussos, 1995) were used to conduct the GRM and polytomous
SIBTEST respectively. The computer program SCORIGHT 3.0 (Wang, et al., 2004) was used
for the TRTM procedure. An alpha of 0.05 was used to test the statistical significance in all
procedures.
When polytomous DIF detection procedures were used to detect testlet DIF, each testlet
was treated as an item that has ordered categories. For each testlet, raw scores were computed
Testlet DIF 15
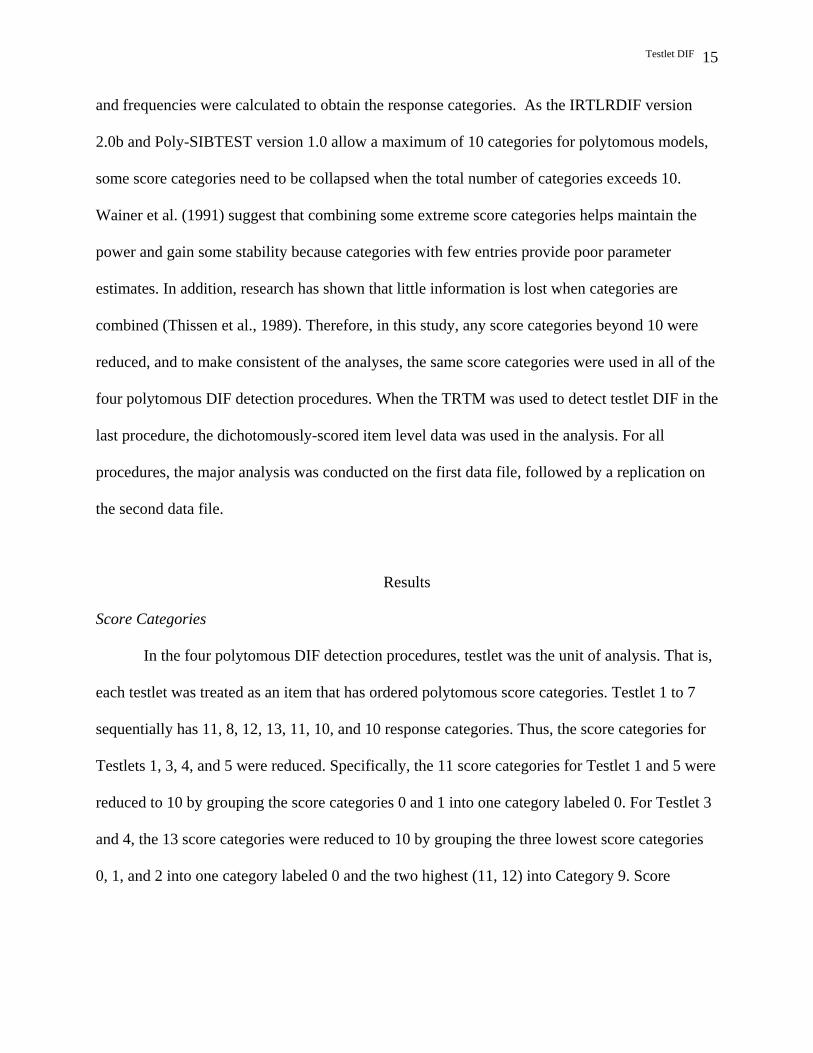
and frequencies were calculated to obtain the response categories. As the IRTLRDIF version
2.0b and Poly-SIBTEST version 1.0 allow a maximum of 10 categories for polytomous models,
some score categories need to be collapsed when the total number of categories exceeds 10.
Wainer et al. (1991) suggest that combining some extreme score categories helps maintain the
power and gain some stability because categories with few entries provide poor parameter
estimates. In addition, research has shown that little information is lost when categories are
combined (Thissen et al., 1989). Therefore, in this study, any score categories beyond 10 were
reduced, and to make consistent of the analyses, the same score categories were used in all of the
four polytomous DIF detection procedures. When the TRTM was used to detect testlet DIF in the
last procedure, the dichotomously-scored item level data was used in the analysis. For all
procedures, the major analysis was conducted on the first data file, followed by a replication on
the second data file.
Results
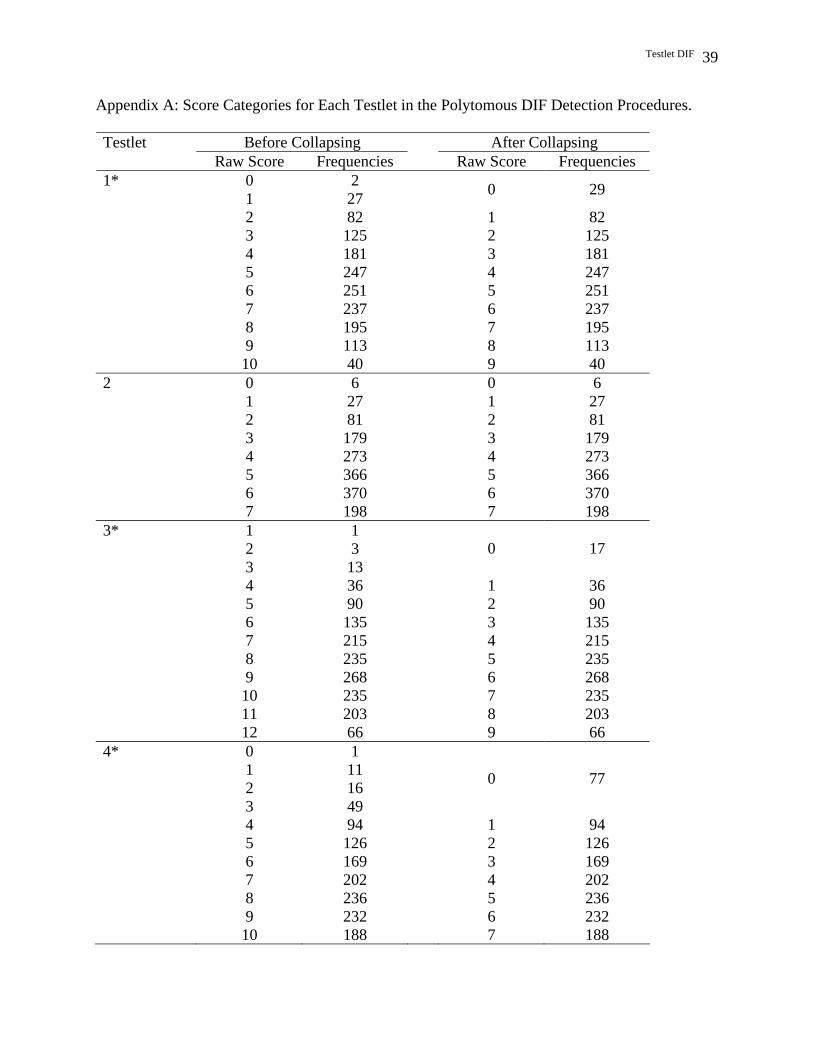
Score Categories
In the four polytomous DIF detection procedures, testlet was the unit of analysis. That is,
each testlet was treated as an item that has ordered polytomous score categories. Testlet 1 to 7
sequentially has 11, 8, 12, 13, 11, 10, and 10 response categories. Thus, the score categories for
Testlets 1, 3, 4, and 5 were reduced. Specifically, the 11 score categories for Testlet 1 and 5 were
reduced to 10 by grouping the score categories 0 and 1 into one category labeled 0. For Testlet 3
and 4, the 13 score categories were reduced to 10 by grouping the three lowest score categories
0, 1, and 2 into one category labeled 0 and the two highest (11, 12) into Category 9. Score
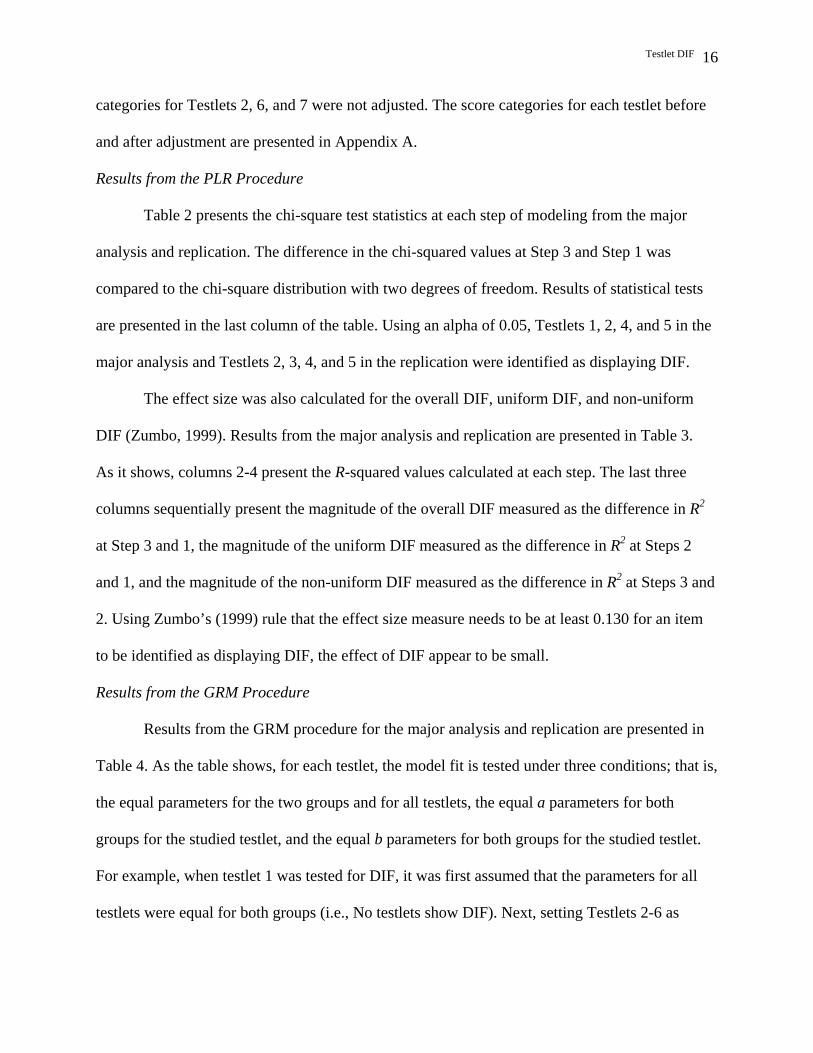
Testlet DIF 16
categories for Testlets 2, 6, and 7 were not adjusted. The score categories for each testlet before
and after adjustment are presented in Appendix A.
Results from the PLR Procedure
Table 2 presents the chi-square test statistics at each step of modeling from the major
analysis and replication. The difference in the chi-squared values at Step 3 and Step 1 was
compared to the chi-square distribution with two degrees of freedom. Results of statistical tests
are presented in the last column of the table. Using an alpha of 0.05, Testlets 1, 2, 4, and 5 in the
major analysis and Testlets 2, 3, 4, and 5 in the replication were identified as displaying DIF.
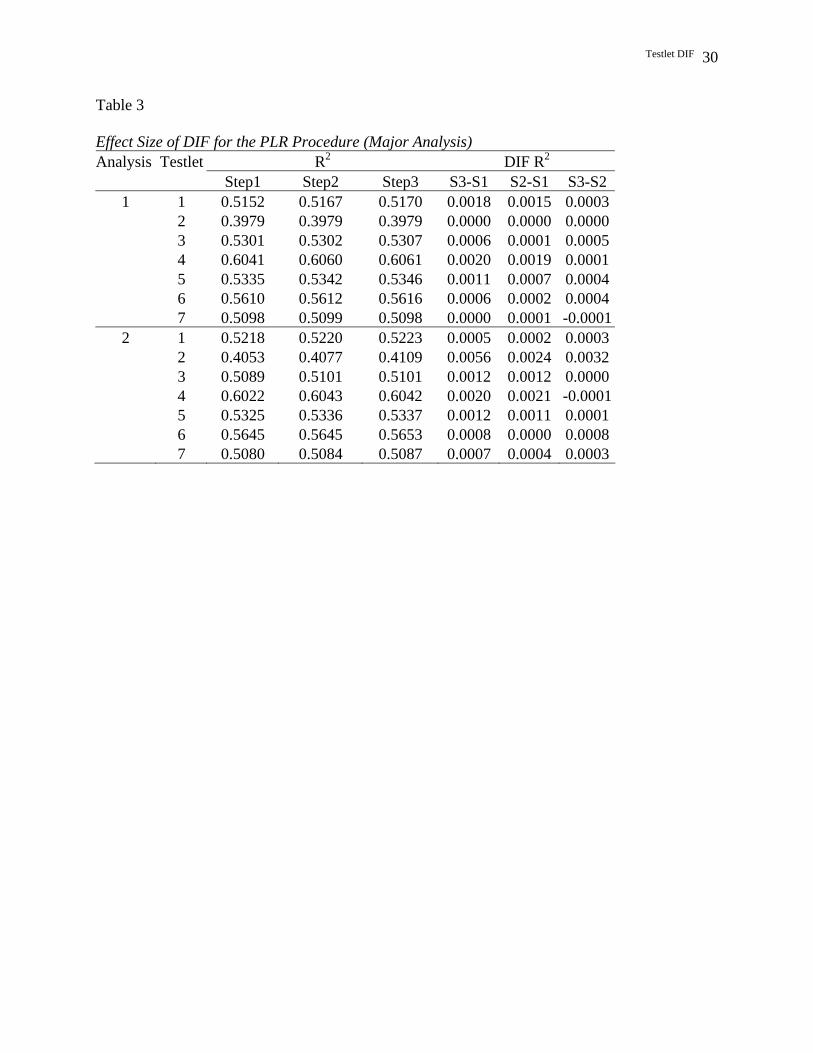
The effect size was also calculated for the overall DIF, uniform DIF, and non-uniform
DIF (Zumbo, 1999). Results from the major analysis and replication are presented in Table 3.
As it shows, columns 2-4 present the R-squared values calculated at each step. The last three
columns sequentially present the magnitude of the overall DIF measured as the difference in R2
at Step 3 and 1, the magnitude of the uniform DIF measured as the difference in R2 at Steps 2
and 1, and the magnitude of the non-uniform DIF measured as the difference in R2 at Steps 3 and
2. Using Zumbo’s (1999) rule that the effect size measure needs to be at least 0.130 for an item
to be identified as displaying DIF, the effect of DIF appear to be small.
Results from the GRM Procedure
Results from the GRM procedure for the major analysis and replication are presented in
Table 4. As the table shows, for each testlet, the model fit is tested under three conditions; that is,
the equal parameters for the two groups and for all testlets, the equal a parameters for both
groups for the studied testlet, and the equal b parameters for both groups for the studied testlet.
For example, when testlet 1 was tested for DIF, it was first assumed that the parameters for all
testlets were equal for both groups (i.e., No testlets show DIF). Next, setting Testlets 2-6 as

Testlet DIF 17
anchor testlets, Testlet 1 was assumed to have DIF, with parameter b of Testlet 1 constrained to
be functioning differentially across the groups and parameter a being equal across the groups.
Then, Testlet 1 was again assumed to have DIF, with Testlets 2-6 set as anchor testlets. But now
the parameter a of Testlet 1 was constrained to be functioning differentially across the groups
and parameters b was assumed equal across the groups.
The likelihood ratio test statistics, G2, are also presented in Table 4, in which the
identified DIF testlets are highlighted in bold. Using an alpha of 0.05, Testlets 2, 3, 5, and 6 in
the major analysis and Testlet 2 in the cross-validation are identified as displaying significant
DIF. Further, results show that the b parameters of Testlets 2, 3, and 5 in the major analysis and
Testlet 2 in the replication have significant G2s. This result indicates that the difficulty of these
testlets function differentially across the two groups, and as a result, the males and female
examinees may have different probabilities of getting the same scores. No significant G2 was
found with the a parameters of the identified DIF testlets, which suggests that these testlets are
almost equally discriminating for the two groups, and as a result, it can be concluded that purely
uniform DIF is present in these identified DIF testlets.
Results from the MH Procedure
Results from the MH procedure for the major analysis and replication are presented in
Table 5. Using an alpha of 0.05, Testlets 1, 2, and 4 in the major analysis and Testlets 2, 3, 4, and
5 in the replication were identified as displaying DIF. However, as the MH procedure involves
the integration across the entire range of ability levels and the use of expected scores in detecting
DIF, the uniform and nonuniform DIF cannot be ascertained. Hence, the DIF results from the
MH procedure are limited to the overall DIF effects only.

Testlet DIF 18
Results from the Poly-SIBTEST Procedure
Results from the Poly-SIBTEST in the major analysis and replication are displayed in
Table 6. Using an alpha of 0.05, Testlets 1, 2, 4, and 5 in the major analysis and Testlets 2, 3, 4,
and 5 in the replication are identified as displaying DIF. Futher, judging from the Beta-uni values
in the table, Testlets 1 and 2 favor the male group and Testlets 4 and 5 favor the female group in
the major analysis, and Testlets 2 and 3 favor the male group and again Testlets 4 and 5 favor the
female group in the replication. However, unlike the case of dichotomous items where the
magnitude of DIF can be judged by absolute values of Beta-uni estimates, no guidelines exist for
interpreting the magnitude of DIF based on Beta-uni estimates in the case of polytomous items
(Gierl, Bisanz, Bisanz, & Boughton, 2003). Further, like the MH procedure, Poly-SIBTEST also
involves the integration across the entire range of ability levels, and therefore only expected
scores in DIF detection are provided. As a result, Poly-SIBTEST provides no information about
uniform or nonuniform DIF.
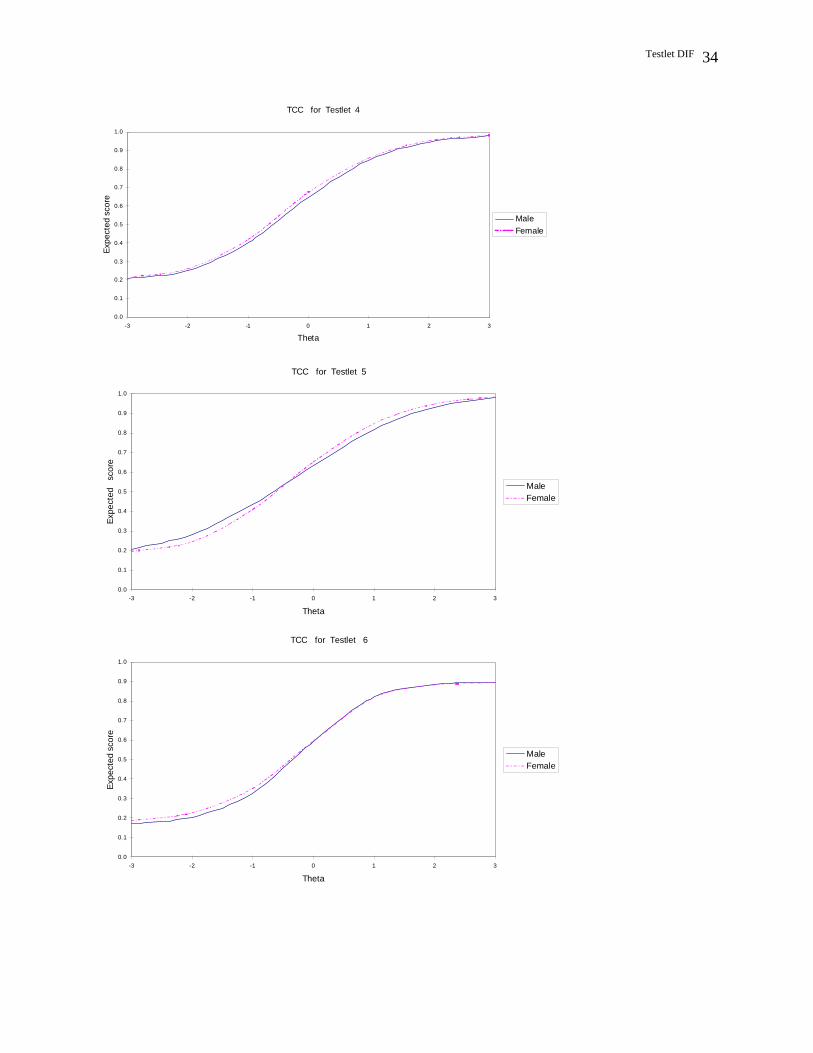
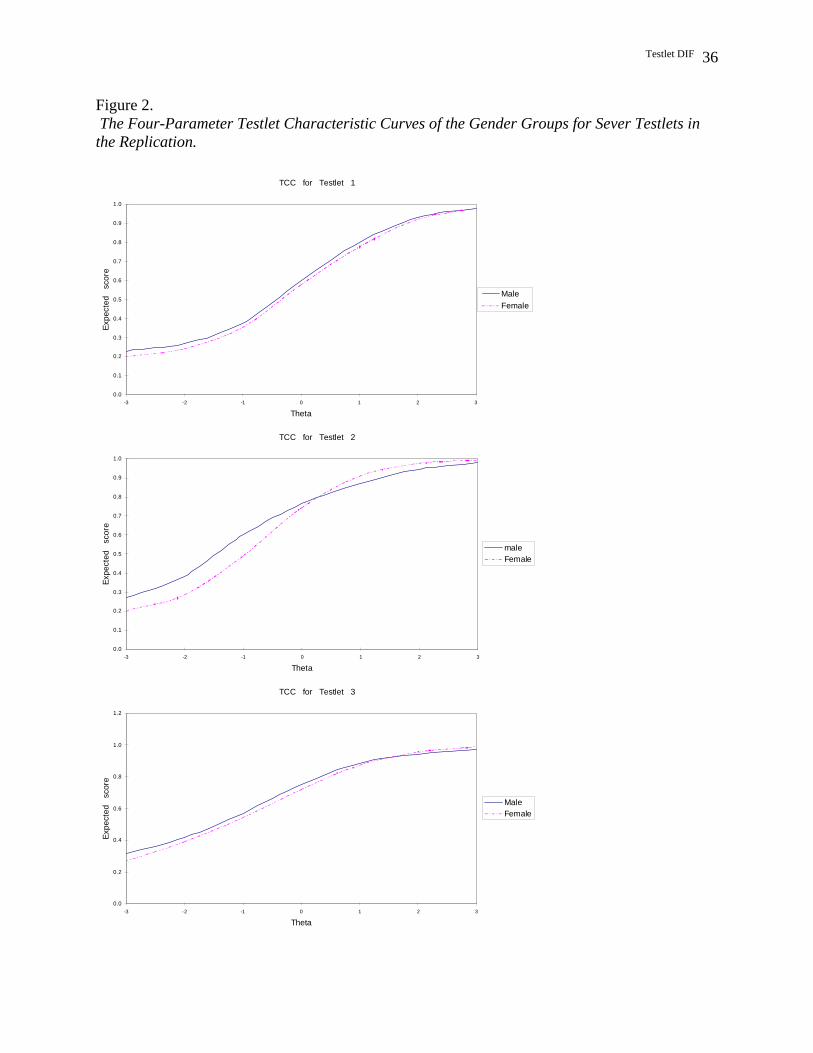
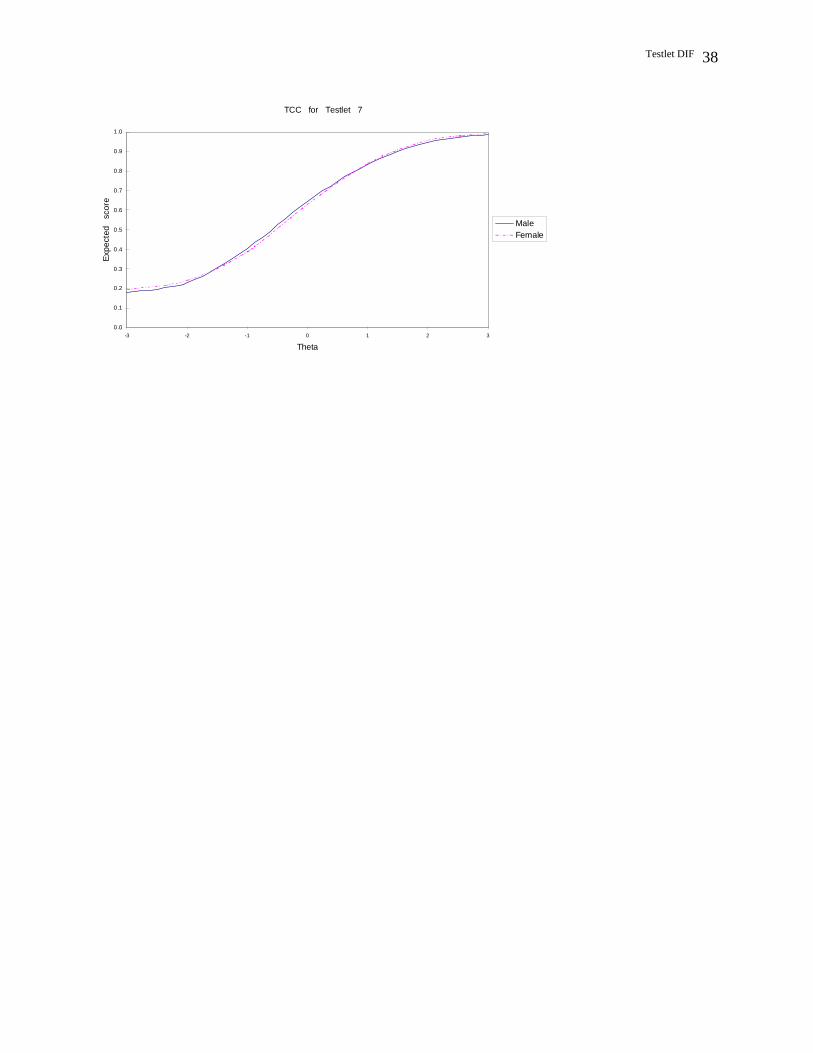
Results from the TRTM procedure
Results of the TRTM procedure for the major analysis and replication are presented in
Figure 1 and Figure 2, respectively. In both figures, the solid line represents the males and the
dashed line represents the females. As can be seen from the figures, Testlet 2 appears to show the
largest amount of DIF in both the major analysis and the replication. Further, the DIF pattern of
Testlet 2 appears to be non-uniform in both analyses, with the males outperforming females in
the lower end of the ability scale and females outperforming males in the higher end of the
ability scale. In addition, the figures reveal that Testlet 7 appears to show no DIF in both
analyses, which is consistent with the results of previous procedures. However, it is hard to
determine whether the other testlets show DIF due to the lack of statistical tests for DIF.

Testlet DIF 19
A Summary of the Results from the Five Procedures
Results from the five procedures are summarized in Table 7. In the major analysis, the
DIF testlets detected by the five procedures display some similar outcomes. Specifically, Testlet
2 was identified as displaying DIF in all procedures. In addition, the PLR and Poly-SIBTEST
procedures produced the same results, with Testlets 1, 2, 4, and 5 identified as displaying DIF.
The MH procedure produced similar results as the PLR and Poly-SIBTEST procedures, with
Testlets 1, 2, and 4 identified as displaying DIF. In the replication, again, the LR, MH, and Poly-
SIBTEST procedures produced the same results, with Testlets 2, 3, 4, and 5 identified as
displaying DIF. However, the two IRT-based DIF detection procedures, the GRM and TRTM,
produced results divergent from the other three procedures. Overall, results produced by the
major analysis based on the first data file are discrepant from the results produced by the
replication based on the second data file.
Discussion
In this study, five procedures were used to detect gender DIF with passage-based testlets
on the reading section of the June 1997 English 30 Diploma Examination. Two samples were
randomly selected from this database, with one used for major analysis and the other for cross-
validation. The first four procedures were chosen in light of Penfield and Lam’s (2000) two-
dimensional taxonomy of polytomous DIF detection procedures and the fifth procedure is based
on the testlet response theory model (Wang, et al., 2002).
The results produced by the five procedures did not converge. The results between the
major analysis and replication differ. For example, in the major analysis, three procedures (PLR,
MH, and Poly-SIBTEST) identified Testlet 1 as having DIF and Testlet 3 as having no DIF. But

Testlet DIF 20
the opposite results were obtained in the replication. Random error may be a likely explanation.
Further, in both analyses, the GRM procedure produced results divergent from the other
procedures. For example, in the major analysis, while Testlets 3 and 6 were flagged as displaying
DIF by the GRM procedure, they were not flagged by the other procedures. In the replication,
while Testlets 2, 3, 4, and 5 were flagged by the PLR, MH, and Poly-SIBTEST procedures, only
Testlet 2 was flagged by the GRM procedure.
The inconsistencies between the two analyses and five procedures in this study speak for
the complexity of testlet DIF analysis and remind us that caution need to be exerted when
interpreting the testlet DIF results, which can be affected by the samples and procedures used in
the analysis. To effectively assess DIF in testlets, using a combination of several procedures is
superior to using a single procedure. Another effective strategy for assessing DIF in testlets may
be integrating substantive analysis with statistical analysis, as recommended in other DIF studies
(Roussos & Stout, 1996; Gierl, Bisanz, Bisanz, & Boughton, 2003). This suggestion is especially
important in content-rich situations like the passage-based testlets, since numerous studies have
indicated that background knowledge plays an important role in tests of reading (e.g., Alderson,
2000; Johnston, 1984; Walker, 1987).
While the five procedures conducted in this study produced somewhat divergent results,
according to Penfield and Lam (2000), the pattern of agreement of the procedures could shed
some light on which of the testlets most likely display DIF. The resulting DIF testlets could be
used to guide test development and analysis, though they are identified simply by evaluating the
results across the DIF detection procedures. In this study, Testlet 2 was identified as displaying
DIF by all five procedures and none of the procedures detected Testlet 7 as displaying DIF in
both analyses. Thus, we conclude that Testlet 2 functions differentially across the gender groups,

Testlet DIF 21
while Testlet 7 does not. Further, it appears that Testlets 1, 3, 4 and 5 may function differentially
across the gender groups, since three of the five procedures indicated that DIF was present in
these testlets. However, Testlet 6 is not likely to display DIF, since it was flagged by the GRM
procedure in the major analysis only. But, as we stated earlier, these interpretations are made on
a probabilistic base with differential confidence, especially for Testlets 1, 3, 4, 5, and 6, on which
no completely convergent results were obtained.
Moreover, a comparison of the results across five procedures and two samples reveal four
major points about the procedures used in this study. First, the PLR, MH, and Poly-SIBTEST
procedures produced comparable results. That is, in the major analysis, three of the four testlets
identified as having DIF by the PLR and Poly-SIBTEST procedures were flagged by the MH
procedure. In the replication, the PLR, MH, and Poly-SIBTEST procedures identified significant
DIF in the same testlets.
Second, the GRM procedure produced aberrant results in comparison to the PLR, MH,
and Poly-SIBTEST procedures. This finding is not consistent with previous studies comparing
the GRM and other dichotomous or polytomous DIF detection procedures. For example, Kim
(2001) applied the GRM and PLR procedures for detecting DIF with the polytomous items on a
speaking test and reported that the two procedures provided similar results. Further, Bolt (2002)
compared the effectiveness of the GRM and Poly-SIBTEST DIF detection procedures and
concluded that the GRM had greater detecting power than the Poly-SIBTEST when the sample
size is not too small (N < 500). However, Bolt (2002) also claimed that because the GRM is
model-based, even slight model-data misfit can have a deleterious impact on its performance in
detecting DIF. This explanation might account for why the GRM performed in an aberrant way
in the current study.

Testlet DIF 22
As mentioned earlier, in the GRM procedure, the total score of each testlet was fit to the
model, while the pseudo-chance factor in the testlet situation was not accounted for. However,
the pseudo-chance factor should not be ignored. This is because the items within the testlets in
this study are all multiple-choice items. For such a test format, there is always a guessing factor,
which, though may be reduced through the ingenuity of the test developers (Lord, 1980), cannot
be eliminated entirely. Also, given the interrelatedness among the test items based on a common
reading passage, examinees may have a better chance of getting an item correct through guessing
even if they do not read or comprehend the reading passage. Previous studies (Gao, 2002; Katz
& Lautenschlager, 2001; Powers & Leung, 1995) have shown that without the reading passage,
the proportion of correct answers in the testlet situation may be well above the chance level.
Hence, it may well be that the GRM is not appropriate for DIF analysis with passage-based
testlets, particularly where a pseudo-chance factor is operating.
Third, compared to the PLR, MH and Poly-SIBTEST procedures, the TRTM procedure
does not show any apparent advantages due to two major limitations with the procedure at the
present stage. First, the results of the TRTM procedure, as obtained in the present study, are not
reliable because they are based purely on visual inspection. No statistical test is available to test
the significance of DIF for this procedure. Second, as mentioned earlier, this procedure could
break the total DIF effect into actual DIF effect and testlet effect (i.e., the effect caused by local
item dependence). However, until the nature of local item dependence in passage-based testlets
is established, that is, whether local item dependence reflects bias or actual ability difference, the
legitimacy of breaking up the total DIF effect is not theoretically supported.
Nevertheless, these limitations, if overcome, may turn into advantages of the TRTM
procedure. For the first limitation, if Raju’s (1988) two-area measures, which aim to detect DIF
Testlet DIF 23
by examining the area differences between two item characteristic curves, could be extended to
the situation of testlet characteristic curves, a statistical test would be available for the TRTM
procedure. For the second limitation, if local item dependence with passage-based testlets is
caused by bias, then the TRTM procedure merely provides an additional option for testlet DIF
analysis. However, if local item dependence is caused by actual ability difference, then the
TRTM procedure may have advantages over the other procedures by breaking up the total DIF
effect into two separate effects.
Fourth, as parametric methods, the PLR, GRM and TRTM procedures have the potential
of detecting uniform and non-uniform DIF. For the PLR, if the difference between the R-squared
values at Step 3 and 2 is greater than 0.13 (Zumbo, 1999), then non-uniform DIF occurs. For the
GRM, a significant G2 value for a-parameter indicates non-uniform DIF effect (Thissen, 2001).
For the TRTM procedures, if the testlet characteristic curves for the two groups cross, then non-
uniform DIF occurs. In this study, Testlet 2 was flagged by all of the three procedures. However,
neither the PLR nor the GRM procedure signifies a non-uniform DIF effect, but the TRTM
procedure, as can be seen from Figures 1 and 2, indicates non-uniform DIF with Testlet 2. As
these results are not convergent, information as to whether Testlet 2 displays uniform or non-
uniform DIF cannot be determined. Such divergent results also indicate that the three parametric
methods have differential power in detecting non-uniform DIF. However, we are unable to
evaluate the power differences of the procedures in this study.
One limitation with the present study is that the results are based on real data analyses.
Therefore, a priori information on the true differences between the groups is lacking. Hence, we
are unable to evaluate the accuracy of these testlet DIF detection procedures. Our next step will
be to perform a simulation study to more fully address the strengths and weaknesses of different

Testlet DIF 24
procedures for detecting testlet DIF using data with known characteristics. It is expected that this
study will bridge the gap between theoretical and practical DIF research and it may provide a
modest contribution to our knowledge of testlet DIF.
References
Agresti, A. (1996). An introduction to Categorical data analysis. New York: Wiley.
Alderson, J. C. (2000). Assessing reading. Cambridge, UK: Cambridge University Press.
Bock, R. D. (1972). Estimating item parameters and latent ability when responses are stored in
two or more latent categories. Psychometrika, 37, 29-51.
Bolt, D. M. (2002). A Monte Carlo comparison of parametric and nonparametric polytomous
DIF detection methods. Applied Measurement in Education, 15, 113-141.
Chang, H. H., Mazzeo, J., & Roussos, L. (1996). Detecting DIF for polytomous scored items: An
adaptation of the SIBTEST procedure. Journal of Educational Measurement, 33, 333-
353.
Clauser, B. E. & Mazor, K. M. (1998). Using statistical procedures to identify differentially
functioning test items. Educational Measurement: Issues and Practic,17,31- 44.
Gao, L. (2002). Passage dependence of the College English Test reading comprehension
component. Unpublished Master Thesis: Queen’s University, Kingston, Ontario.
Gierl, M. J., Bisanz, J., Bisanz, G. L., & Boughton, K. A. (2003). Identifying content and
cognitive skills that produce gender differences in mathematics: A demonstration of the
multidimensionality-based DIF analysis paradigm. Journal of Educational
Measurement, 40, 281-306.
Gierl, M. J., Bisanz, J., Bisanz, G. L., Boughton, K. A., & Khaliq, S. N. (2001). Illustrating the
utility of differential bundle functioning analyses to identify and interpret group
Testlet DIF 25
differences on achievement tests. Educational Measurement: Issues and Practice, 20,
summer, 26-36.
Haladyna, T. M. & Downing, S. M. (2004). Construct-irrelevant variance in high-stakes testing.
Educational Measurement: Issues and Practice, 23, 17-27.
Hambleton, R. K., Swaminathan, H. & Rogers, H. J. (1991). Fundamentals of item response
theory. Newbury Park, Calif: Sage Publications.
Johnston, P. (1984). Prior knowledge and reading comprehension test bias. Reading Research
Quarterly, 21, 220-39.
Katz, S., & Lautenschlager, G. J. (2001). The contribution of passage and no-passage factors to
item performance on the SAT reading task. Educational Measurement, 7, 165-176.
Kim, M. (2001). Detecting DIF across the different language groups in a speaking test. Language
Testing, 18, 89-114.
Lane, S., Wang, N., & Magone, M. (1996). Gender-related differential item functioning on a
middle-school mathematics performance assessment. Educational Measurement: Issues and
Practice, 15(4), 21-27,31.
Lee, G., Brennan, R. L., & Frisbie, D. A. (2000). Incorporating the testlet concept in test score
analyses. Educational Measurement: Issues and Practice, 19(4), 9-15.
Lee, Y. (2001). Investigating the graded relationships among score categories in passage-based
testlets: Application of the Nominal Response Model. Paper presented at the
International Conference of the Korea English Education Society.
Lee, Y. (2004). Examining passage-related local item dependence (LID) and measurement
construct using Q3 statistics in an EFL reading comprehension test. Language Testing,
21, 74-100.

Testlet DIF 26
Lin, J., & Wu, F. (2004). Differential performance by gender in foreign language testing.
(ED478206).
Lord, F. M. (1980). Applications of item response theory to practical testing problems. Hillsdale,
NJ: Lawrence Erlbaum Associates.
Mantel, N. (1963). Chi-square tests with one degree of freedom: Extension of the Mantel-
Haenszel procedure. Journal of the American Statistical Association, 58, 690-700.
Penfield, R. D., & Lam, T. C. M. (2000). Assessing differential item functioning in performance
assessment: Review and recommendations. Educational Measurement: Issues and
Practice, 19(3), 5-15.
Potenza, M. T., & Dorans, N. J. (1995). DIF assessment for polytomously scored items: A
framework for classification and evaluation. Applied Psychological Measurement, 19,
23-37.
Powers, D. E. & Leung, S. W. (1995) Answering the new SAT reading comprehension test items
without the passages. Journal of Educational Measurement, 32, 105-129.
Raju, N. S. (1988). The area between two item characteristic curves. Psychometrika, 53, 495-
502.
Roussos, L., & Stout, W. (1996). A multidimensionality-based DIF analysis paradigm. Applied
Psychological Measurement, 20, 355-371.
Ryan, K. E., & Fan, M. (1996). Examining gender DIF on a multiple-choice test of mathematics:
A confirmatory approach. Educational Measurement: Issues and Practice, 15(4), 15-
20.
Samejima, F. (1969). Estimation of latent ability using a response pattern of graded scores.
Psychometric monograph, 17.

Testlet DIF 27
Samejima, F. (1997). Graded response model. In W. J. Van der Linden & R. K. Hambleton
(Eds.), Handbook of modern item response theory (pp. 85-100). Ann Arbor, MI:
Edwards Brothers.
SPSS for windows (2004). SPSS 12.0. Chicago, IL: SPSS.
Stout, W., & Roussos, L. (1995). SIBTEST manual. University of Illinois: Department of
Statistics, Statistical Laboratory for Educational and Psychological Measurement.
Swaminathan, H., & Rogers, H. J. (1990). Detecting differential item functioning using logistic
regression procedures. Journal of Educational Measurement, 27, 361-370.
Thissen, D. (2001). IRTLRDIF v.2.0.b: Software for the computation of the statistics involved in
item response theory likelihood-ratio tests for differential item functioning.
University of North Carolina at Chapel Hill, L. L. Thurstone Psychometric
Laboratory.
Thissen, D., Steinberg, L., & Mooney, J. A. (1989). Trace lines for testlets: A use of multiple-
categorical response models. Journal of Educational Measurement, 26, 247-260.
Thissen, D., Steinberg, L., & Wainer, H. (1988). Use of item response theory in the study of
group differences in trace lines. In Wainer, H. and Braun, H. I. (Eds.), Test validity.
Hillsdale, NJ: Erlbaum, 147-169.
Wainer, H. (1995). Precision and differential item functioning on a testlet-based test: The 1991
law school admissions test as an example. Applied Measurement in Education, 8, 157-
186.
Wainer, H. & Kiely, G. (1987). Item clusters and computerized adaptive testing: A case for
testlets. Journal of Educational Measurement, 24, 185-201.

Testlet DIF 28
Wainer, H. & Lewis, C. (1990). Toward a psychometric for testlets. Journal of Educational
Measurement, 27, 1-14.
Wainer, H. & Lukhele, R. (1997). How reliable are TOEFL scores? Educational &
Psychological Measurement, 57, 741-58.
Wainer, H., Sireci, S. G., & Thissen, D. (1991). Differential Testlet Functioning: Definitions and
Detection. Journal of Educational Measurement, 28, 197-219.
Walker, C. H. (1987). Relative importance of domain knowledge and overall aptitude on
acquisition of domain-related knowledge. Cognition and Instruction, 4, 25-42.
Wang, X., Bradlow, E. T., & Wainer , H. (2002). A general Bayesian model for testlets: Theory
and applications. Applied Psychological Measurement, 26, 109 – 128.
Wang, X., Bradlow, E. T., & Wainer , H. (2004). User’s guide for SCORIGHT (version 3.0): A
computer program for scoring tests built of testlets including a module for covariate
analysis. Princeton, NJ: Educational Testing Service; Philadelphia, PA: National
Board of Medical Examiners.
Zumbo, B. (1999). A handbook on the theory and methods of differential item functioning:
logistic regression modeling as a unitary framework for binary and likert-type (ordinal)
item scores. Ottawa, CA: Directorate of Human Resources Research and Evaluation,
Department of National Defence.
Zwick, R., Donoghue, J. R., & Grima, A. (1993). Assessment of differential item functioning for
performance tasks. Journal of Educational Measurement, 30, 233-251.

Testlet DIF 29
Table 1 The Kth Level 2 x T Contingency Table
Item Score Group y1 y2 y3 yr Total Reference nR1k nR2k nR3k … nRTk nR+kFocal nF1k nF2k nF3k … nFTk nF+kTotal n+1k n+2k n+3k n+Tk n++kCited in Zwick, R., Donoghue, J. R., & Grima, A. (1993). Assessment of different item functioning for performance tasks. Journal of Educational Measurement, 30, 233-251. Table 2 Chi-square Test Statistics for the PLR Procedure (Major Analysis and Replication) Analysis Testlet Step 1 Step 2 Step 3 S3-S1 χ2 df p 1 1* 2199.479 2208.076 2210.076 10.597 2 0.0050 2* 1501.414 1510.473 1524.137 22.723 2 0.0000 3 2300.487 2302.041 2303.589 3.102 2 0.2120 4* 2807.096 2820.534 2821.119 14.023 2 0.0009 5* 2307.834 2312.906 2314.661 6.827 2 0.0329 6 2506.568 2507.991 2511.602 5.034 2 0.0807 7 2175.524 2176.020 2176.163 0.639 2 0.7265 2 1 2232.913 2234.174 2236.572 3.659 2 0.1605 2* 1533.235 1544.967 1560.465 27.230 2 0.0000 3* 2169.471 2176.267 2176.349 6.878 2 0.0321 4* 2806.447 2819.720 2820.890 14.443 2 0.0007 5* 2306.104 2312.843 2313.374 7.270 2 0.0264 6 2512.011 2512.317 2516.603 4.592 2 0.1007 7 2169.797 2172.357 2173.380 3.583 2 0.1667 * indicates the value is significant at 0.05 level of significance.
Testlet DIF 30
Table 3 Effect Size of DIF for the PLR Procedure (Major Analysis) Analysis R2 DIF R2
Testlet
Step1 Step2 Step3 S3-S1 S2-S1 S3-S2 1 1 0.5152 0.5167 0.5170 0.0018 0.0015 0.0003 2 0.3979 0.3979 0.3979 0.0000 0.0000 0.0000 3 0.5301 0.5302 0.5307 0.0006 0.0001 0.0005 4 0.6041 0.6060 0.6061 0.0020 0.0019 0.0001 5 0.5335 0.5342 0.5346 0.0011 0.0007 0.0004 6 0.5610 0.5612 0.5616 0.0006 0.0002 0.0004 7 0.5098 0.5099 0.5098 0.0000 0.0001 -0.0001 2 1 0.5218 0.5220 0.5223 0.0005 0.0002 0.0003 2 0.4053 0.4077 0.4109 0.0056 0.0024 0.0032 3 0.5089 0.5101 0.5101 0.0012 0.0012 0.0000 4 0.6022 0.6043 0.6042 0.0020 0.0021 -0.0001 5 0.5325 0.5336 0.5337 0.0012 0.0011 0.0001 6 0.5645 0.5645 0.5653 0.0008 0.0000 0.0008 7 0.5080 0.5084 0.5087 0.0007 0.0004 0.0003

Testlet DIF 31
Table 4 The Likelihood Ratio Test Statistics for the GRM Procedure (Major Analysis and Replication)
Major Analysis Replication Testlet Condition G2 df Testlet Condition G2 df 1 All equal 11.8 9 1 All equal 3.5 9 a equal -0.0 1 a equal b equal 11.8 8 b equal 2* All equal 17.3 7 2* All equal 23.4 7 a equal 0.2 1 a equal 0.1 1 b equal 17.1 6 b equal 23.3 6 3* All equal 22.0 9 3 All equal 12.4 9 a equal 2.9 1 a equal 2.2 1 b equal 19.1 8 b equal 10.2 8 4 All equal 10.6 9 4 All equal 11.6 9 a equal 2.4 1 a equal 1.9 1 b equal 8.1 8 b equal 9.8 8 5* All equal 19.7 9 5 All equal 6.8 9 a equal 0.3 1 a equal 0.1 1 b equal 19.4 8 b equal 6.7 8 6* All equal 17.2 9 6 All equal 11.7 9 a equal 3.0 1 a equal 0.1 1 b equal 14.2 8 b equal 11.7 8 7 All equal 12.9 9 7 All equal 5.8 9 a equal 0.7 1 a equal 0 1 b equal 12.2 8 b equal 5.8 8 * indicates the value is significant at 0.05 level of significance.
Table 5 Chi-square Test Statistics for the Mantel-Haenszel Procedure (Major Analysis and Replication)
Major Analysis Replication Testlet χ2 df p Testlet χ2 df p 1* 8.6078 1 0.0033 1 2.3768 1 0.12312* 11.4482 1 0.0007 2* 16.3130 1 0.00013 0.5265 1 0.4681 3* 8.2036 1 0.00424* 12.1101 1 0.0005 4* 10.9859 1 0.00095 3.6240 1 0.0570 5* 6.2340 1 0.01256 2.0488 1 0.1523 6 0.0156 1 0.90057 0.2628 1 0.6082 7 3.3867 1 0.0657
* indicates the value is significant at 0.05 level of significance.

Testlet DIF 32
Table 6 DIF Results Produced by Poly-SIBTEST in Major Analysis and Cross-validation
Major Analysis Cross Validation Testlet Beta-uni SIB-uni z-
statistic SIB-uni p
valueTestlet Beta-uni SIB-uni z-
statisticSIB-uni p
value1* 0.179 2.954 0.003 1 0.071 1.199 0.2312* 0.138 3.097 0.002 2* 0.195 4.385 0.0003 0.024 0.403 0.687 3* 0.174 2.839 0.0054* -0.233 -3.648 0.000 4* -0.228 -3.511 0.0005* -0.125 -2.127 0.033 5* -0.150 -2.521 0.0126 -0.086 -1.437 0.151 6 0.032 0.548 0.5837 0.039 0.672 0.502 7 -0.107 -1.805 0.071* indicates the value is significant at 0.05 level of significance.
Table 7 DIF Testlets Detected by the Five Procedures in the Major Analysis and Replication DIF Detection Procedures PLR GRM MH Poly-SIB TRTM Sample Testlet Uni Non-U Uni Non-U Uni Non-U 1 1 √ √ √ 2 √ √ √ √ √ 3 √ 4 √ √ √ 5 √ √ √ 6 √ 7 2 1 2 √ √ √ √ √ 3 √ √ √ 4 √ √ √ 5 √ √ √ 6 7

Testlet DIF 33
Figure 1. The Four-Parameter Testlet Characteristic Curves of the Gender Groups for Sever Testlets in the Major Analysis.
TCC for Testlet 1
0.0
0.1
0.2
0.3
0.4
0.5
0.6
0.7
0.8
0.9
1.0
-3 -2 -1 0 1 2 3
Theta
Expe
cted
sc
ore
MaleFemale
TCC for Testlet 2
0.0
0.1
0.2
0.3
0.4
0.5
0.6
0.7
0.8
0.9
1.0
-3 -2 -1 0 1 2 3
Theta
Expe
cted
sc
ore
MaleFemale
TCC for Testlet 3
0.0
0.1
0.2
0.3
0.4
0.5
0.6
0.7
0.8
0.9
1.0
-3 -2 -1 0 1 2 3
Theta
Expe
cted
sco
re
MaleFemale
Testlet DIF 34
TCC for Testlet 4
0.0
0.1
0.2
0.3
0.4
0.5
0.6
0.7
0.8
0.9
1.0
-3 -2 -1 0 1 2 3
Theta
Expe
cted
sco
re
MaleFemale
TCC for Testlet 5
0.0
0.1
0.2
0.3
0.4
0.5
0.6
0.7
0.8
0.9
1.0
-3 -2 -1 0 1 2 3
Theta
Expe
cted
sc
ore
MaleFemale
TCC for Testlet 6
0.0
0.1
0.2
0.3
0.4
0.5
0.6
0.7
0.8
0.9
1.0
-3 -2 -1 0 1 2 3
Theta
Expe
cted
sco
re
MaleFemale

Testlet DIF 35
TCC for Testlet 7
0.0
0.1
0.2
0.3
0.4
0.5
0.6
0.7
0.8
0.9
1.0
-3 -2 -1 0 1 2 3
Theta
Expe
cted
sco
re
MaleFemale
Testlet DIF 36
Figure 2. The Four-Parameter Testlet Characteristic Curves of the Gender Groups for Sever Testlets in the Replication.
TCC for Testlet 1
0.0
0.1
0.2
0.3
0.4
0.5
0.6
0.7
0.8
0.9
1.0
-3 -2 -1 0 1 2 3
Theta
Expe
cted
sc
ore
MaleFemale
TCC for Testlet 2
0.0
0.1
0.2
0.3
0.4
0.5
0.6
0.7
0.8
0.9
1.0
-3 -2 -1 0 1 2 3
Theta
Expe
cted
sc
ore
maleFemale
TCC for Testlet 3
0.0
0.2
0.4
0.6
0.8
1.0
1.2
-3 -2 -1 0 1 2 3
Theta
Expe
cted
sc
ore
MaleFemale

Testlet DIF 37
TCC for Testlet 4
0.0
0.1
0.2
0.3
0.4
0.5
0.6
0.7
0.8
0.9
1.0
-3 -2 -1 0 1 2 3
Theta
Expe
cted
sc
ore
MaleFemale
TCC for Testlet 5
0.0
0.1
0.2
0.3
0.4
0.5
0.6
0.7
0.8
0.9
1.0
-3 -2 -1 0 1 2 3
Theta
Expe
cted
sc
ore
MaleFemale
TCC for Testlet 6
0.0
0.1
0.2
0.3
0.4
0.5
0.6
0.7
0.8
0.9
1.0
-3 -2 -1 0 1 2 3
Theta
Expe
cted
sco
re
MaleFemale
Testlet DIF 38
TCC for Testlet 7
0.0
0.1
0.2
0.3
0.4
0.5
0.6
0.7
0.8
0.9
1.0
-3 -2 -1 0 1 2 3
Theta
Expe
cted
sc
ore
MaleFemale
Testlet DIF 39
Appendix A: Score Categories for Each Testlet in the Polytomous DIF Detection Procedures.
Before Collapsing After Collapsing Testlet Raw Score Frequencies Raw Score Frequencies
1* 0 2 1 27 0 29
2 82 1 82 3 125 2 125 4 181 3 181 5 247 4 247 6 251 5 251 7 237 6 237 8 195 7 195 9 113 8 113 10 40 9 40 2 0 6 0 6 1 27 1 27 2 81 2 81 3 179 3 179 4 273 4 273 5 366 5 366 6 370 6 370 7 198 7 198 3* 1 1 2 3 3 13
0 17
4 36 1 36 5 90 2 90 6 135 3 135 7 215 4 215 8 235 5 235 9 268 6 268 10 235 7 235 11 203 8 203 12 66 9 66 4* 0 1 1 11 2 16 3 49
0 77
4 94 1 94 5 126 2 126 6 169 3 169 7 202 4 202 8 236 5 236 9 232 6 232 10 188 7 188

Testlet DIF 40
Testlet Before Collapsing After Collapsing Raw Score Frequencies Raw Score Frequencies 11 121 8 121 12 55 9 55 5* 0 2 1 22 0 24
2 43 1 43 3 78 2 78 4 161 3 161 5 200 4 200 6 254 5 254 7 275 6 275 8 237 7 237 9 179 8 179 10 49 9 49 6 0 9 0 9 1 26 1 26 2 81 2 81 3 122 3 122 4 197 4 197 5 228 5 228 6 236 6 236 7 253 7 253 8 206 8 206 9 142 9 142 7 0 5 0 5 1 18 1 18 2 79 2 79 3 146 3 146 4 203 4 203 5 246 5 246 6 281 6 281 7 243 7 243 8 183 8 183 9 96 9 96
*Asterisk indicates that the score categories of the testlet were adjusted. No Collapsing Performed for Testlets 2, 6, and 7.