1 risk preferences and aging: the “certainty … risk preferences and aging: the “certainty...
TRANSCRIPT

1
Risk preferences and aging:
The “Certainty Effect” in older adults’ decision making
Mara Mather
University of Southern California
Nina Mazar
University of Toronto
Marissa A. Gorlick
University of Texas at Austin
Nichole R. Lighthall
Jessica Burgeno
Andrej Schoeke
University of Southern California
Dan Ariely
Duke University
June, 2012, in press, Psychology and Aging
Address correspondence to:
University of Southern California
3715 McClintock Avenue
Los Angeles, CA 90089-0191

2
Abstract
A prevalent stereotype is that people become less risk taking and more cautious as
they get older. However, in laboratory studies, findings are mixed and often reveal no age
differences. In the current series of experiments, we examined whether age differences in
risk seeking are more likely to emerge when choices include a certain option (a sure gain
or a sure loss). In four experiments, we found that age differences in risk preferences only
emerged when participants were offered a choice between a risky and a certain gamble
but not when offered two risky gambles. In particular, Experiments 1 and 2 included only
gambles about potential gains. Here, compared with younger adults, older adults
preferred a certain gain over a chance to win a larger gain and thus, exhibited more risk
aversion in the domain of gains. But in Experiments 3 and 4, when offered the chance to
take a small sure loss rather than risking a larger loss, older adults exhibited more risk
seeking in the domain of losses than younger adults. Both their greater preference for
sure gains and greater avoidance of sure losses suggest that older adults weigh certainty
more heavily than younger adults. Experiment 4 also indicates that older adults focus
more on positive emotions than younger adults do when considering their options and
that this emotional shift can at least partially account for age differences in how much
people are swayed by certainty in their choices.
3
Risk preferences and aging: The “Certainty Effect” in older adults’ decision making
A prevalent stereotype is that people become less risk taking and more cautious as
they get older (Heckhausen, Dixon, & Baltes, 1989; Okun, 1976). However, studies of
real-world financial behavior have revealed mixed findings about age differences in risk
preferences. One study found that older individuals show more risk aversion in their life
insurance coverage than younger individuals (Halek & Eisenhauer, 2001). Similarly,
some studies found that older investors tend to own less risky stocks than younger
investors (Hunter & Kemp, 2004; McInish, 1982) and have a smaller proportion of their
assets in risky investments (Jianakoplos & Bernasek, 2006; Morin & Suarez, 1983;
Palsson, 1996). However, other studies showed that when retirement status was
controlled for, older people tended to have a higher proportion of their net worth invested
in risky assets (Bellante & Saba, 1986; Wang & Hanna, 1997). Finally, one observational
study examined the relationship between demographic characteristics and risk taking
among nearly a thousand contestants on the television game show “Who Wants to Be a
Millionaire” (Daghofer, 2007). The age of the contestants did not significantly predict
whether they voluntarily quit the game as the stakes got higher.
It is difficult to interpret findings about real-world choices because many of them
are influenced by factors that co-vary with age. For example, workers with regular
income are likely to make different investment decisions about their assets than retirees,
regardless of age (Bellante & Saba, 1986; Wang & Hanna, 1997). Also, investment
advisors instruct people to invest in less risky assets as they get older or closer to
retirement, and so age differences in the type of assets people hold in their financial
4
portfolios may be more a function of the differing advice they received rather than of
their own risk preferences.
Contrary to popular stereotype, studies that have attempted to examine age
differences in risk preferences in a controlled lab environment typically do not find
reduced risk preferences among older adults (for reviews see Mather, 2006; Peters, Hess,
Västfjäll, & Auman, 2007). For instance, when given a hypothetical life dilemma (e.g.,
making decisions about medical treatment or career planning) and asked to choose
between aggressive and conservative options, older and younger adults show similar
levels of risk seeking (Botwinick, 1969; Chou, Lee, & Ho, 2007; Curley, Eraker, &
Yates, 1984). In another context, when playing a risky card game (“21”), older and
younger adults’ decisions to take an additional card were similarly influenced by risk
(Dror, Katona, & Mungur, 1998). Likewise, in a gambling task involving learning which
decks of cards are most advantageous in the long run (the Iowa Gambling Task; Bechara,
Damasio, Tranel, & Damasio, 1997), older adults usually learn to avoid the “bad” decks
(higher average gains but also occasional large losses) about as well as younger adults do
(Brand, Recknor, Grabenhorst, & Bechara, 2007; Kovalchik, Camerer, Grether, Plott, &
Allman, 2005; MacPherson, Phillips, & Della Sala, 2002; Wood, Busemeyer, Koling,
Cox, & Davis, 2005; but see Denburg, Tranel, & Bechara, 2005; Fein, McGillivray, &
Finn, 2007).
In contrast to the aforementioned lab studies that do not find age differences in
risk preferences, Lauriola and Levin (2001) found that when asked to make a series of
choices between option pairs with equivalent expected values, older adults were less risk
seeking than younger adults when deciding between two potential gains (see also Deakin,
5
Aitken, Robbins, & Sahakian, 2004) but more risk seeking when deciding between two
potential losses. Interestingly, in their study each choice pair was between a certain
outcome (sure gain or loss) and an uncertain outcome (gamble with specified probability
of a gain or loss).1 A study using the Cups Task that similarly relied on choices between
a certain outcome and an uncertain outcome also revealed age differences in risk seeking
that depended on whether the decisions were about gains or losses (Weller, Levin, &
Denburg, 2011). In each trial in the Cups Task, participants choose between cups on the
certain side of the screen for which one quarter would be gained (or lost) for whichever
cup was selected and cups on the risky side where the probability of a win or loss is
represented by the number of cups. Risk taking decreased with age when the choices
were between a sure gain and a larger but uncertain gain but not when the choices were
between a sure loss and a larger but uncertain loss. Thus, studies that included certain
outcomes in the choice scenarios yielded different results than those that did not.
In summary, the existing literature presents a confusing picture. Older adults are
less risk seeking in some studies whereas they seem quite similar to younger adults in
other studies. In addition, the effects of age group differ depending on whether the
decisions involve gains or losses and whether there is an option with a certain outcome
available. As outlined below, we propose that this pattern may result from age differences
in the susceptibility to the “Certainty Effect.”
The “Certainty Effect”
The probability weighting function in Kahneman and Tversky’s prospect theory
describes how people generally perceive or “weigh” probabilities. It suggests not only
that people treat probabilities as nonlinear (i.e. people overweight small probabilities and
6
underweight large probabilities) but also that certain outcomes (0% and 100% chance)
are perceived as categorically different and weighted more heavily than uncertain
outcomes (i.e. any other probability between 0% and 100%). This latter observation has
been coined the “Certainty Effect” (Kahneman & Tversky, 1979).
According to the “Certainty Effect,” in the domain of gains, because people
overweight certainty, and gains are desirable outcomes, overweighting a sure gain leads
people to choose it over a risky gain. Conversely, in the domain of losses, because people
overweight certainty, and losses are unattractive outcomes, overweighting a sure loss
leads people to not choose it over a risky loss. That is, the “Certainty Effect” as coined by
Kahneman and Tversky predicts risk aversion in gains and risk seeking in losses when
there is a choice between a sure and a risky option. Together with other research on the
unique effects of zero in terms of motivation (Bem, 1965; Festinger & Carlsmith, 1959;
Lepper, Greene, & Nisbett, 1973), social norms (Gneezy & Rustichini, 2000; Heyman &
Ariely, 2004), and pricing (Mazar, Shampanier, & Ariely, 2012; Shampanier, Mazar, &
Ariely, 2007), the “Certainty Effect” suggests that the way people compute risk-related
information for choices between gambles that include a certain option are fundamentally
different from choices between gambles without a certain option.
Given that in Lauriola and Levin’s (2001) studies older adults both showed a bias
towards certain gains and against certain losses, older adults may simply exhibit a larger
“Certainty Effect” than younger adults rather than exhibiting a more general difference in
risk-seeking tendencies. However, previous studies examining age differences in risky
choices have not compared choices between two risky options with choices involving one
sure option and one risky option. Consequently, it is not clear whether age differences are

7
specifically about the “Certainty Effect” or reflect a more general effect such that,
compared with younger adults, older adults are less risk seeking in the domain of gains
but more risk seeking in the domain of losses.
In the current paper, we examine the effect of age on the tendency to engage in
risks both in choices that include a certain option and choices without one. The choice
task was designed to allow examination of potential differences in motivation or ability to
calculate expected values. In addition, a recent finding by Mather, Gorlick, and Lighthall
(2009) demonstrated that acute stress can decrease risk seeking in older adults (in
comparison with younger adults) in a time-pressured reaction task (a driving game). Our
task (i.e. choosing between monetary outcomes) is relatively more cognitive in nature
than the reaction task used by Mather, et al. (2009) and gave participants unlimited
decision-time. Nevertheless, because Prospect Theory (Kahneman & Tversky, 1979)
predicts risk aversion in the domain of gains, and previous findings suggest that older
adults might be more risk averse than younger adults (due to the “Certainty Effect”), we
manipulated stress levels in the domain of gains in one of our experiments, to see whether
stress could account for age differences in risk preferences or decision strategies in our
task. In addition, in the choice scenarios with two risky options, we examined whether
the complexity of the probabilistic outcome (50% vs. a harder-to-calculate probability)
affect younger and older adults choices differently.
To foreshadow our results, in Experiment 1, we found that for a series of choices
in the domain of gains older adults showed similar risk preferences as younger adults
when there were two risky options, but older adults were more likely than younger adults
to select a sure-thing option when it was available—even if it had a lower expected value.

8
In Experiment 2, we replicated our findings while also manipulating stress levels. Next,
to see if older adults’ sure-gain bias is a preference for sure outcomes per se or just sure
gains, in Experiment 3 we examined choices among gambles involving certain losses. In
contrast with findings from Experiments 1 and 2, older adults avoided sure options more
than younger adults did in the domain of losses. Finally, in Experiment 4, participants
completed a mixed series of choices, half about potential losses and half about potential
gains. As in the other experiments, no age differences were seen when a choice involved
two risky options, whether it was about losses or gains. In addition, as in Experiment 3,
older adults avoided sure-loss options more than younger adults did. No age differences
in the effects of stress or option complexity were seen. Together our results provide
support for the hypothesis that older adults (in comparison with younger adults) weigh
certainty more heavily rather than having a general preference for certainty.
Experiment 1: Choices between possible gains
Method
Participants. Seventy-six people participated (see Table 1 for demographics2) in
exchange for a chance to receive a $50 gift certificate. Younger adults (age 18-23 years)
were recruited from an undergraduate subject pool and received course credit for
completing the study in the lab; older adults (age 59-86 years) were community dwelling
residents recruited at a library serving senior citizens and completed the study in a quiet
room in the library. Older adults also received no cash compensation; instead for each
participant, $15 was donated to the library.
Procedure. Participants first completed the Wechsler Test of Adult Reading
(WTAR; Wechsler, 2001) to assess their intellectual functioning followed by the positive

9
and negative affect scale (PANAS) to assess mood (Watson, Clark, & Tellegen, 1988;
Wechsler, 2001). Then they completed 40 choices between two monetary gains each.
They were told that only after they completed all their choices, we would play them all
out and add up the results to calculate their total, and the person with the highest total
would win a $50 gift certificate. That is, participants did not see the individual outcome
of any of their chosen options nor the outcome of any of their forgone options.
The order of the choice pairs was random, but came from four different sets of
options, of which Sets 1 and 2 had a sure-gain outcome whereas Sets 3 and 4 did not and
Sets 1 and 3 had options with equal expected values (EV) whereas Sets 2 and 4 had one
option with a higher EV. Specifically, Set 1 offered choices between a sure gain-option
and a risky gain-option of equal expected values (e.g., choice pair for EV = $10: Option
1: 100% chance of winning $10 vs. Option 2: 80% chance of winning $12.50 and 20%
chance of winning $0), Set 2 offered choices between a sure gain-option of lower EV and
a risky option of higher EV, Set 3 offered choices between two risky gain-options of
equal EV, one of which always offered a 50% chance of $10 (e.g., choice pair for EV =
$5: Option 1: 50% chance of winning $10 and a 50% chance of winning $0 vs. Option 2:
80% chance of winning $6.25 and 20% chance of winning $0), and Set 4 offered choices
between two risky gain-options with unequal EVs, one of which always offered a 50%
chance of $10 and had a lower EV than the non-50% chance option.
Results
In the following sections, we compare younger and older adults’ risk preferences
for each choice set separately in repeated-measure ANOVAs with age group as between-
subject and choice pair as within-subject independent variables (see Table 2 for
10
statistics). Together, the four sets differed in their EV-structure and whether the risky
(vs. sure) option in Sets 1 and 2 or the riskier of two options in Sets 3 and 4 had a higher,
equal, or lower EV and was easier or harder to evaluate. Therefore, we analyzed the four
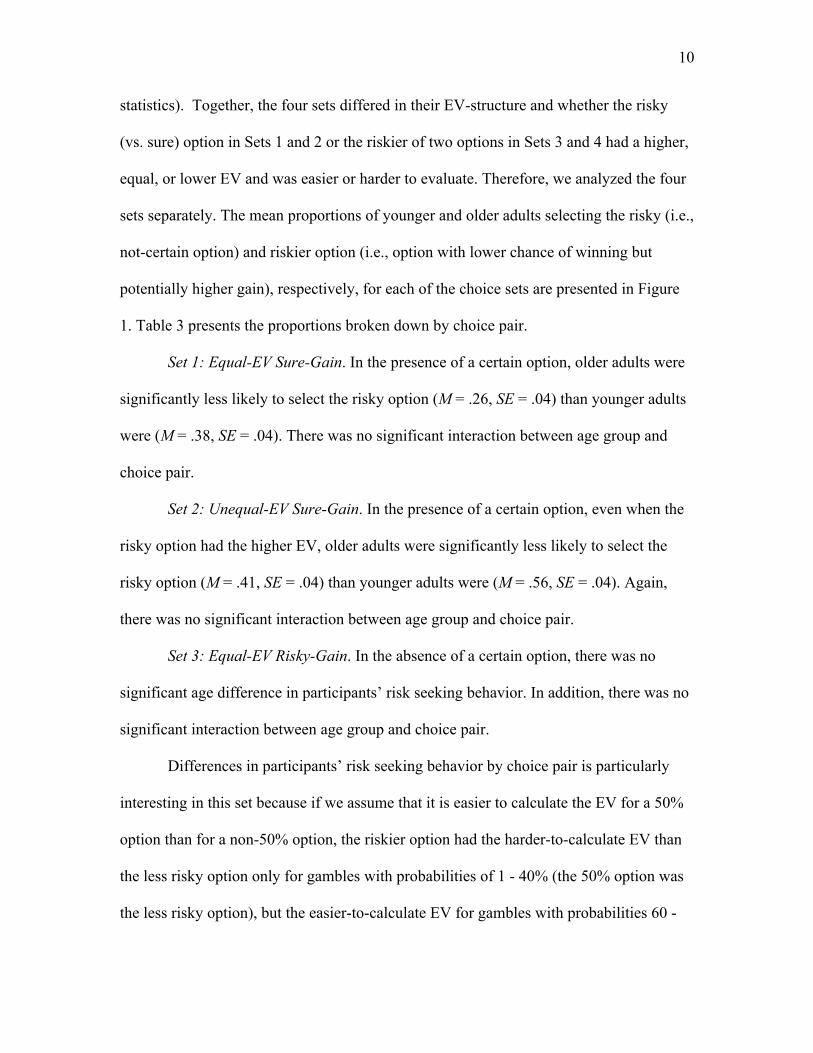
sets separately. The mean proportions of younger and older adults selecting the risky (i.e.,
not-certain option) and riskier option (i.e., option with lower chance of winning but
potentially higher gain), respectively, for each of the choice sets are presented in Figure
1. Table 3 presents the proportions broken down by choice pair.
Set 1: Equal-EV Sure-Gain. In the presence of a certain option, older adults were
significantly less likely to select the risky option (M = .26, SE = .04) than younger adults
were (M = .38, SE = .04). There was no significant interaction between age group and
choice pair.
Set 2: Unequal-EV Sure-Gain. In the presence of a certain option, even when the
risky option had the higher EV, older adults were significantly less likely to select the
risky option (M = .41, SE = .04) than younger adults were (M = .56, SE = .04). Again,
there was no significant interaction between age group and choice pair.
Set 3: Equal-EV Risky-Gain. In the absence of a certain option, there was no
significant age difference in participants’ risk seeking behavior. In addition, there was no
significant interaction between age group and choice pair.
Differences in participants’ risk seeking behavior by choice pair is particularly
interesting in this set because if we assume that it is easier to calculate the EV for a 50%
option than for a non-50% option, the riskier option had the harder-to-calculate EV than
the less risky option only for gambles with probabilities of 1 - 40% (the 50% option was
the less risky option), but the easier-to-calculate EV for gambles with probabilities 60 -

11
99% (the 50% option was the riskier option). That is, for the former half of choice pairs
the riskier option represented the option that required more effort to evaluate (similar to
Set 1), while for the latter half it represented the easier to evaluate option. Thus, if older
adults were not willing to exert too much effort, we would expect ease of evaluation to
matter and lead to relative risk aversion for the lower probabilities and relative risk
seeking for the higher probabilities, and these two opposing tendencies might have been
washed out in the overall ANOVA.
To further investigate this possibility of a significant interaction between age
group and ease of evaluation on people’s risk-seeking behavior, we conducted a repeated-
measures ANOVA with age group as a between-subjects factor and riskier option type
(50% probability vs. non-50% probability) as a within-subject factor. The results revealed
that participants were more likely to select the riskier option when it represented the
easier to evaluate 50% option (M = .51, SE = .04) than when it represented the harder to
evaluate non-50% option (M = .21, SE = .02), F(1, 74) = 49.40, p < .001, η2p = .40. But
there was no significant main effect of age group, F(1, 74) = 1.24, p = .27, η2p = .02, nor
a significant interaction of ease of evaluation and age group, F(1, 74) = .24, p = .62, η2p =
.003. Thus, when the choice pairs consisted of two risky options both younger and older
adults were equally sensitive to the ease of calculating the EV.
Set 4: Unequal-EV Risky Gain. Likewise, in choice pairs with unequal EVs, in the
absence of a certain option there was no significant age difference in likelihood of
selecting the riskier option. In addition, there was no significant interaction between age
group and choice pair.
12
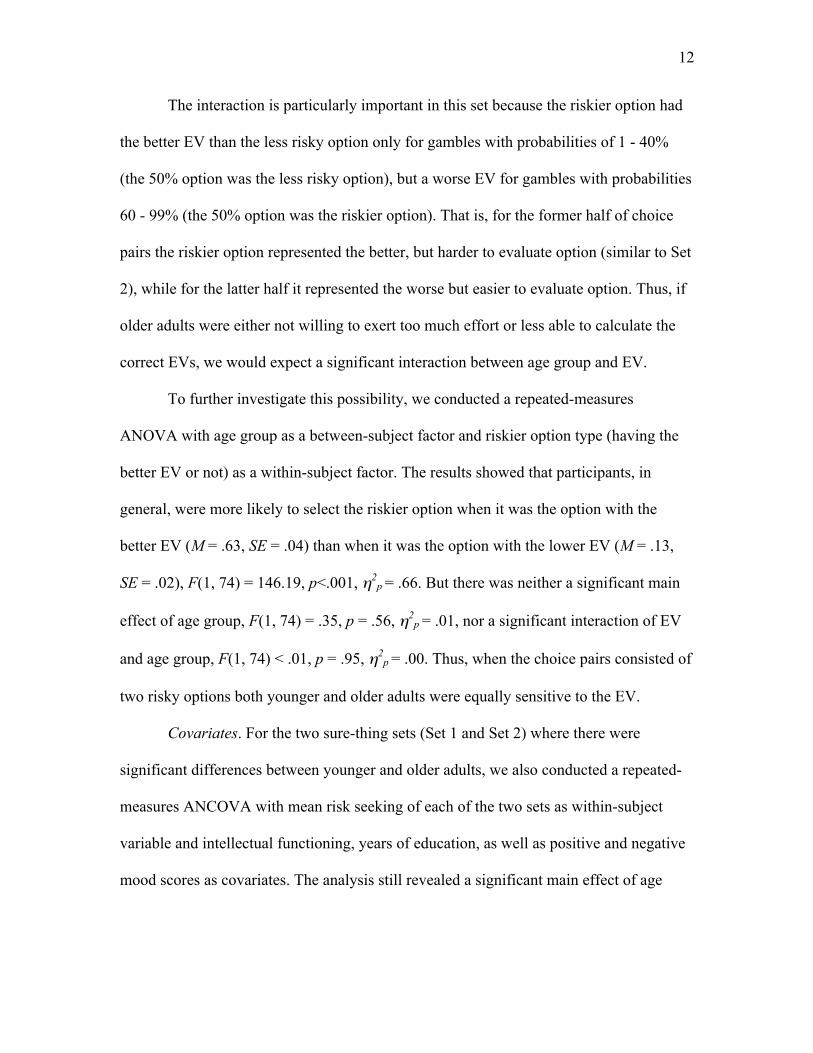
The interaction is particularly important in this set because the riskier option had
the better EV than the less risky option only for gambles with probabilities of 1 - 40%
(the 50% option was the less risky option), but a worse EV for gambles with probabilities
60 - 99% (the 50% option was the riskier option). That is, for the former half of choice
pairs the riskier option represented the better, but harder to evaluate option (similar to Set
2), while for the latter half it represented the worse but easier to evaluate option. Thus, if
older adults were either not willing to exert too much effort or less able to calculate the
correct EVs, we would expect a significant interaction between age group and EV.
To further investigate this possibility, we conducted a repeated-measures
ANOVA with age group as a between-subject factor and riskier option type (having the
better EV or not) as a within-subject factor. The results showed that participants, in
general, were more likely to select the riskier option when it was the option with the
better EV (M = .63, SE = .04) than when it was the option with the lower EV (M = .13,
SE = .02), F(1, 74) = 146.19, p<.001, η2p = .66. But there was neither a significant main
effect of age group, F(1, 74) = .35, p = .56, η2p = .01, nor a significant interaction of EV
and age group, F(1, 74) < .01, p = .95, η2p = .00. Thus, when the choice pairs consisted of
two risky options both younger and older adults were equally sensitive to the EV.
Covariates. For the two sure-thing sets (Set 1 and Set 2) where there were
significant differences between younger and older adults, we also conducted a repeated-
measures ANCOVA with mean risk seeking of each of the two sets as within-subject
variable and intellectual functioning, years of education, as well as positive and negative
mood scores as covariates. The analysis still revealed a significant main effect of age

13
group, F(1, 64) = 6.78, p = .01, η2p = .10. There were no significant interactions (all ps >
.29).
Discussion
Older adults were more likely to select the sure gain, thus displaying risk aversion
– even when the sure gain option offered a lower EV than the risky alternative. However,
when both options were risky, older adults’ risk preferences did not differ significantly
from younger adults’ risk preferences. In addition, older and younger adults were equally
sensitive to EVs as well as ease of evaluation. These findings go against the hypotheses
that older adults might have chosen the sure option simply because it represents the easier
to evaluate option or because of problems calculating EVs. Similarly, even when
controlling for mood, level of education, and intellectual functioning we still observed
age differences in risk seeking behavior.
Experiment 2: Effects of acute stress on risk preferences for gains
In a recent study by Mather et al. (2009), age differences in risk taking in a
driving game emerged when participants had experienced an acute stressor before
playing the game. In particular, in that driving game, participants earned points by
driving a car during yellow lights; but if they were driving at the moment the light turned
red (at a randomly determined time), they lost points earned for that trial. The authors
found that in the stress condition, older adults drove for less time during the yellow lights
and stopped and restarted more frequently than did younger adults. These changes in
older adults’ decision strategies led them to earn fewer points in the stress condition than
in the control condition, whereas younger adults did not show a significant effect of
14
stress. Thus, older adults appeared more conservative or less risk seeking in their
strategies when under acute stress.
The driving task relied mainly on motor skills and required fast reactions under
time-pressure while the task in our Experiment 1 (choosing between monetary outcomes)
was relatively more cognitive in nature and gave participants unlimited decision-time.
Nevertheless, it could be that older adults in contrast with younger adults get stressed
when having to make a choice between a sure and a risky gain and that this difference in
stress might be driving the observed sure option-bias for older adults.
We examined the effects of acute stress (measured through cortisol levels in
saliva samples) on risk preferences using the same cold pressor stress manipulation as in
Mather et al., (2009). After the cold pressor task we used the same procedure as in
Experiment 1: participants had to make a series of choices across four sets (see Table 3),
and the participant with the greatest earnings would win a $30 gift certificate. However,
unlike Experiment 1, this time we equated the expected values in Sets 3 and 4 to the
expected values in Sets 1 and 2. We predicted that we would replicate the effects of
Experiment 1 in the control (no-stress) condition. In addition, we predicted that if stress
was a factor underlying older adults’ greater preference for the sure gain then in the stress
condition, younger adults should look more like older adults in their sure-thing
preferences.
Methods
Participants. Forty-eight younger adults (age 18-32 years) and 48 older adults
(64-89 years) completed the study (see Table 1 for demographics) in exchange for a
chance to win a $30 gift certificate. Younger adults were students recruited on campus,

15
who also received course credit for completing the study, and older adults were recruited
from newspaper advertisements and flyers and received $15 to compensate them for
traveling to the lab. No participants were using hormone birth control. In order to
maintain stable cortisol levels, all participants avoided eating, smoking, exercising, and
caffeine intake within one hour of the study, and sleeping within two hours of the study.
Materials and Procedure. Baseline cortisol levels peak in the early morning and
decline throughout the day in a similar pattern for younger and older adults (Van Cauter,
Leproult, & Kupfer, 1996). Thus, to avoid testing during the morning hours when high
baseline cortisol levels might reduce the impact of our stress manipulation, the study was
run between 2 PM and 5 PM. Participants were randomly assigned to the stress or control
condition and were asked to drink an 8-oz bottle of water at the beginning of the
experiment to ensure clean saliva samples. Because stress can affect decision strategies
differently for males and females (e.g., Lighthall, Mather, & Gorlick, 2009; Lighthall et
al., 2011; Preston, Buchanan, Stansfield, & Bechara, 2007; van den Bos, Harteveld, &
Stoop, 2009), we included equal numbers of males and females in each condition.
Participants then completed the WTAR and the PANAS questionnaire (Nelson & Denny,
1960; Watson et al., 1988). Ten minutes later a baseline saliva sample was collected
followed either by the cold pressor stress task or control task. The cold pressor stress task
was conducted by having participants submerge their non-dominant hand in a pitcher of
ice water (0–3°C) for three minutes. The control task was conducted in the same manner
using room-temperature water (22–25°C). About eight minutes after the cessation of
either task, participants started the series of 40 choices between two potential monetary

16
gain-options. After completing the series of choices, a post-choice saliva sample was
collected.
Results
Manipulation Check - Cortisol. As expected, an ANOVA with age group and
stress condition as independent variables and cortisol change (difference between post-
choice and baseline sample) as the dependent variable revealed a significant effect of the
stress manipulation, F(1, 78) = 13.19, p < .01, η2p = .15; cortisol levels increased in the
stress condition (M = .11 ug/dL, SE = .02) but not in the control condition (M = -.02
ug/dL, SE = .03). Furthermore, there was neither a main effect of age group, F(1, 78) =
2.38, p = .13, η2p = .03, nor an interaction of age group and stress condition, F(1, 78)
=.13, p = .72, η2p < .01.3 Together these results go against the hypothesis that age group
differences in risk seeking behavior observed in Experiment 1 were driven by increased
decision-induced stress among older adults.
Main Analyses. Analogous to Experiment 1, we compared younger and older
adults’ risk preferences for each choice set separately using univariate repeated-measures
ANOVAs with age group and, as a new addition, the stress condition as between-subjects
factors (see Table 2). The mean proportions of younger and older adults selecting the
risky (i.e. not-certain option) and riskier option (i.e. option with lower chance of winning
but potentially higher gain), respectively, for each of the choice sets are presented in
Figure 2. The proportions broken down by the specific choice pair are noted in Table 3.
In summary, we replicated our previous findings. First, older adults in comparison
with younger adults were less likely to select the risky option in the presence of a sure
option (Sets 1 and 2). There were no other significant effects of stress condition and age

17
group. Second, there were no significant age group differences for choices with two risky
options (Sets 3 and 4), and there were no other significant effects of stress condition and
age group. Third, when the choice pairs consisted of two risky options of equal EV,
younger and older adults were equally insensitive to ease of evaluation regardless of
whether they had experienced acute stress or not (2-way interaction age group x ease of
evaluation: F(1, 92) = 3.25, p = .08, η2p = .03; 3-way interaction age group x stress
condition x ease of evaluation: F(1, 92) = .06, p = .81, η2p = .001). Fourth, when the
choice pairs consisted of two risky options of unequal EV, younger and older adults were
equally sensitive to the EVs regardless of whether they had experienced acute stress or
not (2-way interaction age group x ease of evaluation: F(1, 92) = 3.73, p = .06, η2p = .04;
3-way interaction age group x stress condition x ease of evaluation: F(1, 92) = .66, p =
.42, η2p = .01).
Covariates. Analogous to Experiment 1, for the two sure-thing sets (Set 1 and Set
2), where there were significant differences between younger and older adults, we also
conducted one repeated-measures ANCOVA over both Sets 1 and 2 together with age
group and stress as between-subject factors, set type as a within-subject factor, and years
of education, intellectual functioning, positive mood and negative mood as covariates.
The age group difference remained significant, F(1,87)=11.62, p=.001, η2p=.12.
Discussion
Experiment 2 replicated the findings from Experiment 1 that when given a sure
gain option older adults were more likely to select it, but when both gain options were
risky, older adults’ risk preferences did not differ significantly from younger adults’ risk
preferences. Also replicating Experiment 1, older and younger adults were equally
18
effective at taking EVs into account and both age groups were equally insensitive to the
ease of value calculation – even under stress (see behaviors in Set 3 and 4). Similarly,
when statistically controlling for differences in mood, education, and general intellectual
functioning we still observed age differences in risk seeking behavior.
Finally, Experiment 2 extends the findings from Experiment 1 by revealing that
stress cannot account for the observed age differences in risk seeking behavior in our
task. In a previous study examining decisions in a driving game, stress decreased older
adults’ risk-seeking behavior within the context of that game and increased
indecisiveness (Mather et al., 2009). Two of the crucial differences between that driving
game and our gamble choices are that, unlike our task, performance in the driving game
drew relatively more on people’s motor reaction (rather than cognitive skills) and
required making decisions under time pressure in the context of a quickly changing
situation. Thus, the underlying mechanism of how stress affects younger and older adults’
decision strategies might have more to do with motor reaction and/or the speed with
which decisions have to be made and the role of impulsivity rather than with changes in
risk preferences.
Experiment 3: Choices between possible losses
Experiments 1 and 2 showed that older adults were less risk seeking than younger
adults only in the presence of sure options, and that this age difference could neither be
accounted for by stress responses, mood, education, ease or ability of calculating EVs
(i.e., motivational or cognitive shortcomings), nor intelligence as assessed by vocabulary.
But it is not clear whether older adults would be more likely than younger adults to select
any sure monetary outcome over an uncertain one, including the option of a sure loss
19
rather than risking a larger loss in return for a chance to avoid loss entirely. Thus,
analogous to the previous Sets 1 and Sets 2, in this study, we gave participants choices
between a sure loss and a risky loss that offered a chance of a larger loss in exchange for
a chance to not lose anything to see if the same age differences would occur in the
domain of losses. If older adults show more of the “Certainty Effect” than younger adults,
in the domain of losses weighing certain options more heavily would lead to greater
avoidance of them. Thus, for this experiment, we predicted that older adults would be
more risk seeking than younger adults when confronted with choices between a sure loss
and a gamble involving some chance of a loss. If obtained, this result would indicate that
older adults are not simply more attracted to certain options than uncertain options, but
that they weigh the possible outcome of certain options (whether good or bad) more
heavily than younger adults do.
Method
Participants. Forty people participated (see Table 1 for demographics). Younger
adults (age 18-35 years) were undergraduate and graduate students recruited on campus
and older adults (age 60-85 years) were recruited from the same library as in Experiment
1 (none of the participants completed both Experiments 1 and 3). As in Experiment 1,
older participants received no cash compensation but had a donation of $15 made for
them to the library. Younger participants were paid $12 for their participation.
Procedure. The procedure was the same as in Experiment 1 with a few
exceptions: (1) we did not conduct the WTAR, (2) we only included Sets 1 and 2 that
always offered a sure thing option, and (3) in the unequal EV Loss-Set 2 the certain
option had a better EV (i.e., less negative) than the alternative risky options. Participants’
20
objective was to lose as little money as possible knowing that the best performer would
win a $50 gift certificate.
Results
In the following sections, we compare younger and older adults’ risk preferences
for each choice set separately in repeated-measure ANOVAs with age group as between-
subject and choice pair as within-subject independent variables (see Table 4). The mean
proportions of younger and older adults selecting the risky (i.e., not-certain) option for
each of the choice sets are presented in Figure 3. Overall, as can be seen by comparing
Figure 3 from this experiment to Figures 1 and 2 from the first two experiments,
participants were more risk seeking in the domain of losses than in the domain of gains.
The proportions broken down by choice pair are noted in Table 5.
Set 1: Equal-EV Sure-Loss. When deciding between a sure loss and a gamble that
offered a chance of no loss with the downside of a potentially larger loss, older adults
were significantly more likely to select the risky option (M = .80, SE = .05) than younger
adults were (M = .65, SE = .05). This result was in the opposite direction from the
behavior observed for gains.
Set 2: Unequal-EV Sure-Loss. Also in this set, even in the presence of a sure loss
with a less punishing EV than the risky option, older adults were significantly more likely
to select the risky option that offered a chance to avoid any loss (M = .75, SE = .05) than
younger adults were (M = .39, SE = .07).
Covariates. We conducted a repeated-measures ANCOVA over the average
proportion of choices for the risky option with Sets 1 versus 2 as a within-subject
variable, age group as a between-subject variable, and controlling for years of education
21
as well as positive and negative mood scores. The results replicated the ones obtained in
the individual-set analyses without the covariates: Older adults in comparison with
younger adults were still more risk seeking and less likely to select the sure-loss option,
F(1,34) = 14.78, p=.001, η2p=.30. There was also a significant interaction between age
group and set type, F(1,34) = 9.32, p=.004, η2p=.22. As can be seen in Figure 3, older
adults were not significantly sensitive to whether the EVs between the risky and sure
options were equal or unequal, paired-t(19) = 1.34, p = .2, while younger adults were,
paired-t(19) = 3.95, p < .01. That is, when the risky option had a less favorable EV than
the certain option (Set 2) both age groups’ risk seeking behavior decreased, but it
decreased much more and significantly so for younger adults compared to older adults.
Discussion
In this study, participants attempted to avoid losses rather than garnering gains.
Age differences in the sure-thing bias in the domain of losses were opposite of those
observed in the domain of gains. Instead of showing certainty seeking, older adults in
comparison with younger adults were more biased against the sure-thing option when
associated with a loss. That is, we observed certainty aversion for losses. Furthermore,
controlling for mood and education did not eliminate the effect of age on risk seeking
behavior. Together with the findings from Experiments 1 and 2, these findings suggest
that instead of a general preference for (or bias towards) certainty, older adults show
more of a “Certainty Effect” than younger adults, which seems consistent with an
exaggerated prospect theory model. In addition, Experiment 3 that was conducted with
choices about losses yielded more extreme age differences than Experiments 1 and 2 that

22
were conducted with choices about gains. Thus, older adults appeared more loss averse
than younger adults (see Prospect Theory, Kahneman & Tversky, 1979).
For losses, older adults in comparison with younger adults were not as sensitive to
differences in expected values between the sure and risky options. That is, younger adults
were more likely than older adults to select the option that, if played out many times,
would on average offer the less punishing loss. This finding is different from those in
Experiments 1 and 2 where older adults and younger adults were equally sensitive to
differences in EVs. Thus, it remains an open question whether older adults are less
effective at taking into account expected values for potential losses (in comparison with
potential gains) – either because they are less able to do so or because they care less
about it.
Experiment 4: Intermixed choices between losses and choices between gains
This experiment had several objectives. The first was to replicate our findings
from Experiment 3 about age differences in the Certainty Effect in the domain of losses.
As in Experiments 1 and 2, we included choice sets with a sure and a risky option as well
as choice sets with two risky options. The second objective was to expose the same
participants to both choices about gains and choices about losses to see if, in the context
of the strong reactions that losses exude (see “Loss Aversion” described by Prospect
Theory, Kahneman & Tversky, 1979) we would still find certainty seeking in the domain
of gains. We thought this important as some of the previous research that only found age
differences in risk preferences for losses but not for gains exposed the same participants
to both types of domains (Weber et al., 2004).

23
Another objective was to compare samples of younger and older adults both
recruited from non-campus settings, as in our previous studies the younger participants
were university students and it is possible that that specific group of young adults has
different risk preferences than other younger adults. As part of this, we expanded the age
range for the younger adults to be 18-45 years. We also included a numeracy scale
(Weller et al., in press) to see if people with lower numeracy would show a larger
Certainty Effect. We included only gambles in which the sure option and the risky option
had the same expected values, to avoid additional factors differing between the options
that might be related to numeracy.
Finally, based on recent findings we were also interested in whether age
differences in the Certainty Effect might be related to older adults’ greater reliance on
emotional cues during decision making (Mather, 2006; Peters et al., 2007). In particular,
because our experimental design in Experiments 1 and 2 suggested that older adults’
decision strategies were not simply driven by an effort-conservation heuristic to focus on
the easier to evaluate option (“low-effort heuristic”; see Sets 3), we hypothesized that
older adults’ relatively greater focus on positive than negative information (Mather &
Carstensen, 2005) might lead them to make different choices than younger adults. We
initially followed up on this hypothesis with a pilot study conducted in public places
(college campuses, shopping malls and an AARP convention; N = 351), in which we
offered participants a single, real choice between $1 or a gamble with a 50% chance of $2
and a 50% chance of $0 (realized by a coin toss carried out by the participants
themselves). After participants’ choice but before realizing it, we asked them to check
one or more reasons (from a list of 5 options) that best explained why they selected the
24
option they did. We again replicated our findings: older adults were significantly more
certainty seeking in gains than younger adults. More importantly, consistent with an
affective-mechanism story, we found that more of the older than younger adults wanted
to receive at least some positive reward, even if small, while less of them cared about
avoiding regret.
If we extrapolate the focus on obtaining a positive outcome to the domain of
losses, choosing the risky option appears to be the optimal choice for older adults because
it provides a chance to avoid loss entirely (i.e., the risky option represents the only chance
for a positive outcome). This age difference is consistent with previous findings that
anticipated happiness is more influential for older adults’ decisions (Chen & Ma, 2009).
More generally, this is also consistent with findings that older adults attend more to
positive information than negative information when making decisions (Löckenhoff &
Carstensen, 2007; Mather, Knight, & McCaffrey, 2005). To examine the role of
emotional valence in the present experiment, we asked participants to give explanations
for their choices and then used an automated software program to count the number of
positive versus negative emotion words they used. We predicted that older adults would
use relatively more positive than negative words compared with younger adults, and that
this tendency would be related to any age differences in choice preferences.
Method
Participants. Participants were recruited via Amazon.com’s Mechanical Turk
(mTurk). Only those workers mTurk identified as located in the United States and whose
year of birth on a prescreening question indicated they were either between 18 and 45
years old or 55 or older were offered the opportunity to participate. To insure data
25
quality, we had several exclusion criteria for completed surveys: 1) those who did not
answer “gold” to the final question, indicating a failure to read instructions (see
methods); 2) those whose Internet Protocol (IP) addresses were identified as non-US by
the GeoIP city database (MaxMind, 2012); 3) those with the same IP address as a
previous survey respondent; 4) those whose stated year of birth in the questionnaire did
not match their stated year of birth in mTurk; 5) those who completed the survey in 12
minutes or less (68% of those who completed the survey this quickly were excluded for
at least one of the other reasons, whereas exclusion rates were much lower among those
working more slowly, indicating time was an additional indicator of quality; seven
additional respondents were excluded for this reason; before excluding these participants
but after excluding the ones who did not meet other criteria, the mean survey completion
time was 22.5 minutes). Based on these criteria, 28% of respondents were excluded, most
for more than one reason. This left 107 younger adults (age 18-45) and 50 older adults
(age 55+) for the final data set (see Table 1 for demographics).
Procedure. Participants identified by mTurk as meeting the location and year-of-
birth initial screening criteria were offered to participate in a 30-minute experiment in
which they would have to make choices between different gambles and answer some
questions in exchange for a payment that would vary between $1 and $9 depending on
the choices they made and their outcomes (each individual was offered only one
opportunity to participate). They were then directed to an external survey website.
At the beginning of the survey we explained to participants that they right now
had earnings of $5 and they next would have to choose between several gamble options
(gains and losses). We noted that all options would be of equal expected value (EV = –/+
26
$1) and that even though they needed to make 20 choices, only one of them would be
really carried out. That is, at the end of the study, participants learned which of their
twenty choices was randomly selected, the outcome of this gamble, and correspondingly,
their final total earnings (the selected gamble outcome was added to or subtracted from
the $5-base payment resulting in a final payment of $1-$9).
Participants encountered the 20 choices in a random order. Similar to Set 1 of the
previous experiments, 10 choices were between a sure gain or loss of $1 and a risky gain
or loss. In addition, similar to Set 3 of the previous experiments, 10 choices were
between two risky gains or losses, in each of which participants had to choose between a
risky 50% option of –/+$2 and a riskier non-50% option.
Upon completion, participants were presented in random order with four sample
choices they had previously encountered (one from each category), with their decisions
mentioned and were asked to explain why they had made the decisions they did. Our aim
with these four open-ended questions was to use the Linguistic Inquiry and Word Count
(LIWC) text analysis software program designed by Pennebaker and colleagues (2007) to
calculate the degree to which people used positive or negative emotion words to explain
their decisions to examine whether there were emotional differences related to the age
differences in sure-thing preferences. Next, as a measure of affective forecasting, we
presented participants with a series of hypothetical choices, decisions, and outcomes and
asked them to rate how they would feel upon learning the outcomes, on a scale from -3
(“very negative”) to 3 (“very positive”). Then we administered eight numeracy questions
(Weller et al., in press), one at a time, followed by a memory test in which they saw a
series of pictures and had to identify whether they had seen each picture before in the

27
series or not (adapted from Ashford, Gere, & Bayley, 2011). The memory test was
included to provide an indicator of aging and dementia-related memory decline. Next, we
asked them for their year of birth, occupation, sex, and race/ethnicity. We then randomly
selected one of participants’ 20 decisions, carried it out, and presented the result to then
ask participants to rate how positive or negative they felt about the outcome. To check
that participants were reading instructions, the final multiple choice question asked,
“What was this study about?” with “current events,” “judgments,” “products” and “other”
as the options. Instructions above the question instructed participants to select the “other”
option and type “gold” in the text box next to it.
Results
As in previous experiments, in the following sections, we compare younger and
older adults’ risk preferences for each choice set separately using univariate repeated-
measures ANOVAs with age group as a between-subject and choice pair as within-
subject independent variables (Table 6). The mean proportions of younger and older
adults selecting the risky (i.e., not-certain option) and riskier option (i.e., non-50%
option), respectively, for each of the choice sets are presented in Figure 4. The
proportions broken down by choice pair are noted in Table 7.
Set 1: Equal-EV Sure-Loss. When deciding between a sure loss and a gamble that
offered a chance of no loss with the downside of a potentially larger loss, older adults
were significantly more likely to select the risky option (M = .70, SE = .04) than younger
adults were (M = .59, SE = .03), consistent with Experiment 3.
28
Set 2: Equal-EV Sure-Gain. Unlike Experiments 1 and 2 in which only choices
about gains were presented, in this mixed gain and loss context there were no significant
age effects.
Set 3:Equal-EV Risky-Loss. As expected, there were no significant age differences
or interactions for choices with two risky loss options.
Set 4:Equal-EV Risky-Gain. As expected, there were no significant age
differences or interactions for choices between two risky gain options.
Linear age effect. For the sure-loss Set 1 proportion of risky choices, we split the
younger-adult group at the median age to include both a group aged 18-28 (N = 50, M =
.55, SE = .04) and a group aged 29-45 (N = 57, M = .62, SE = .04) to compare with the
aged-55+ group (N = 50, M = .70, SE = .04). The linear contrast of age group was
significant, F(1,154) = 5.41, p = .02, whereas the quadratic contrast was not, F(1,154) =
.003, p = .95, indicating the age effect was linear rather than curvilinear. In addition,
actual age (over all participants, N = 157) was positively correlated with the proportion of
risky option choices in the sure-loss Set 1 (r = .21, p < .01). There were no significant
correlations with age and proportion of risky choices in the other three choice sets.
In addition, exclusion of the 22 younger adults who identified their occupation as
“student” did not affect which statistical tests were significant, indicating that the age
differences in sure-loss aversion held up when the younger cohort were from a non-
student population.
Covariates. For Set 1 where there was a significant effect by age group, we ran an
ANCOVA with numeracy and picture memory as covariates and choice pair as a within-
subjects factor. The main effect of age group remained significant, F(1,153) = 4.00,
29
p=.047, η2=.03, and there were no significant effects of the covariates. In addition, for the
non-students for whom we had occupation socioeconomic status codes, we conducted the
analysis with occupation codes as a covariate (we used the Nam-Powers-Boyd
Occupational Status Scale to categorize occupations with the coder blind to age; Nam &
Boyd, 2004). Again, the main effect of age group remained significant, F(1,128) = 4.02,
p=.047, η2=.03, and there were no significant effects of the covariate.
Correlations with cognitive measures. Regardless of whether correlations were
run across all participants or separately for the three age groups, proportion of risky or
riskier choices were not significantly correlated with numeracy scores for any of the four
choice sets (all ps > .5). Across all 157 participants, memory scores were negatively
correlated with risk seeking for the Set 3 choice set with two risky options (r = -.17, p =
.04)4 but did not show any significant relationships with risk seeking in either of the sure-
thing sets. Thus, memory scores did not appear to be related to the age effects we saw in
the study; it is not clear why they correlated with the risk seeking in one of the sets with
two risky options but this relationship does not seem related to our main focus of interest
(i.e., age differences in the “Certainty Effect”).
Relationship between affective words in explanations and risk seeking. As
described in the procedure section, we asked participants to explain one of their choices
from each of the four types of choices (see Appendix for example explanations from each
age group). We used an automated program (Pennebaker et al., 2007) to count the
proportion of participants’ explanations about their gamble choices that consisted of
positive (e.g., “better,” “good,” “like,” “win”) versus negative (e.g., “bad,” “greedy,”
“ignore,” “lose”) emotion words. We used the average scores across participants’ four
30
choice explanations as an individual-difference marker of how much people focus on
positive versus negative aspects of choices. The positive-emotion-word proportion
correlated positively with age (r = .20, p=.01), whereas the negative-emotion-word
proportion was not positively correlated with age (r = -.12, p=.15). Likewise, the
positive-emotion-word proportion correlated positively with risk seeking in the sure-loss
Set 1 choices (r = .16, p=.046) whereas the negative-emotion-word proportion correlated
negatively with risk seeking in the sure-loss Set 1 choices, although not significantly (r =
-.14, p=.09). The difference score (positive minus negative proportion) correlated
positively with both age (r = .21, p=.01) and risk seeking in Set 1 choices (r = .19,
p=.02).5
There were no significant correlations with average positive or negative word
proportions and risk seeking for the other three choice scenarios, in which no age
differences in risk seeking had been seen. Including the positive-minus-negative-word
proportion as a covariate in the analysis of Set 1, where there had been a significant age
difference in risk seeking, reduced the age effect such that it was no longer significant,
F(1,154) = 2.83, p=.09, η2=.02, while yielding a significant effect of the covariate,
F(1,154) = 4.66, p=.03, η2=.03. Thus, the relative positivity of participants’ reasons for
their choices appeared to account for some of the age effect for sure-loss choices.
Differences among choice types in the amount of affect they induce. Given that
older adults differ in how much they focus on positive versus negative aspects of choices,
it would make sense that choices that elicit large changes in affect should be those most
likely to show age differences, whereas choices which elicit small changes in affect
should be less likely to be associated with age differences. Thus, we were interested in
31
whether people expressed more affect in their explanations for choices involving sure-
thing outcomes than those with two risky options. We examined the percentage of
explanations consisting of affective words (positive plus negative words) in an ANOVA
with age group as a between-subjects variable and choice option type (sure-thing option
included in choice or not) and choice frame (gains or losses) as within-subjects variables.
There was a main effect of choice option type, F(1,155) =18.58, p<.001, η2=.11, as
participants used a higher percentage of emotion words when explaining choices
involving sure-thing options (M = 9.97, SE = .40) than those without them (M = 7.89, SE
= .39). There also was a main effect of choice frame, F(1,155) =56.77, p<.001, η2=.27, as
participants used a higher percentage of emotion words when explaining choices framed
as losses (M = 10.76, SE = .38) than those framed as gains (M = 7.10, SE = .41). There
was no interaction of the two factors or other significant effects, and so the net result was
that participants were most emotional about sure-loss scenarios (M = 11.69, SE = .54),
followed by risky-loss scenarios (M = 9.82, SE = .50), then sure-gain scenarios (M =
8.25, SE = .55), and finally risky-gain scenarios (M = 5.95, SE = .47).
Adding valence into the ANOVA model revealed a significant interaction of
choice frame and valence, F(1,155) =146.92, p<.001, η2=.49, as the valence of
explanations was more negative and less positive when explaining choices about losses
(Mnegative = 7.21, SE = .36; Mpositive = 3.47, SE = .29) than when explaining choices about
gains (Mnegative = 1.69, SE = .22; Mpositive = 5.38, SE = .36). There were no other
significant effects, although the interaction of valence and age group was marginally
significant, F(1,155) =3.82, p=.05, η2=.02, as the valence of older adults’ explanations
differed (Mnegative = 4.18, SE = .38; Mpositive = 4.89, SE = .43) from that of younger adults
32
(Mnegative = 4.72, SE = .26; Mpositive = 3.97, SE = .29), consistent with the positive
correlation described above between age and positive versus negative words and more
generally with the positivity effect seen in older adults’ attention and memory (Mather &
Carstensen, 2005).
In summary, these analyses revealed that participants expressed more emotion
when explaining choices about losses than about gains and more emotion when
explaining choices involving sure-thing options than those involving two risky options.
Affective forecasting. Comparisons of how participants said they would feel if
different outcomes occurred yielded no significant age differences when t-tests were run
for each question. In particular, the four outcome scenarios about one sure vs. risky loss
choice pair (related to Set 1) revealed that participants thought they would feel
significantly more positive with the better outcome (M = 1.57, SE = .09) than with the
worse outcome (M = -1.40, SE = .08), F(1,155) =465.32, p<.001, η2=.75, and that their
feelings would be more extreme for the better/worse outcomes in the scenario in which
they had chosen the risky loss-option (Mbetter = 1.73, SE = .10; Mworse = -1.49, SE = .09)
than for the better/worse outcomes in the scenario in which they had chosen the sure loss-
option (Mbetter = 1.40, SE = .12; Mworse = -1.30, SE = .10), F(1,155) =13.89, p<.001,
η2=.08. However, there was no interaction with age group (F<1). Similarly, running an
analysis for the affective forecasting ratings for the four outcome scenarios about one
sure vs. risky gain choice pair (related to Set 2) revealed that participants thought their
feelings would be more extreme for the better/worse outcomes in the scenario with the
risky gain-option as their choice (Mbetter = 2.10, SE = .10; Mworse = -1.17, SE = .10) than
for the better/worse outcomes in the scenario with the sure-thing option as their choice

33
(Mbetter = 1.94, SE = .10; Mworse = -.040, SE = .11), F(1,155) =39.92, p<.001, η2=.21. Here
again, there was not a significant interaction with age group, F(1,155) =2.86, p=.09,
η2=.02.
Thus, younger and older adults both forecasted that when learning how choice
options played out, they would experience more extreme emotions if they had chosen the
risky option than the sure-thing option. In addition, there were no age group differences
in this tendency.
Discussion
This experiment provides further support that when both options involve some
risk, there are no age differences in how much risk people are likely to take. In addition,
it is consistent with the previous experiments in indicating that age group differences
emerge only when choices involve a sure-thing option. However, this time this age group
difference was only evident in choices with a sure loss and not in choices with a sure-gain
option.
A major difference from Experiments 1-3 is that in this study, choices between
two potential gain options and choices between two potential loss options were
intermixed. In general, losses loom larger than gains (Kahneman & Tversky, 1984), and
so having a mixed set of gambles may adjust people’s frame of reference such that
missing out on a sure gain no longer seems as bad as it would without the comparison of
having a sure loss. That is, the contrast of a sure versus risky option in the gain domain
might have been reduced by participants being also exposed to the loss domain. For
instance, when explaining their choice for passing up a sure gain in order to take a risky-
gain option one participant noted that, “Not gaining is better than losing, so there is an
34
acceptable risk since none will be lost, only potentially gained.” In other words, not
getting anything as the result of a risky gain choice did not look so bad when compared
with the possibility of losing something.
This experiment also indicated that the age differences in sure-loss avoidance
were related to age differences in the relative proportion of positive versus negative
emotion words used in the explanations for their choices. Older adults used relatively
more positive but not negative emotion words than younger adults in their explanations,
and when the relative positive to negative word percentage was included as a covariate,
the age differences in sure-loss avoidance were no longer significant. In contrast, neither
participants’ numeracy scores, memory scores, nor the socioeconomic status of their
occupation accounted for the age differences in sure-loss avoidance.
This experiment also revealed that participants explained their choices using a
higher percentage of emotional words when choices involved sure-thing options than
when they involved only risky options and when choices involved losses than when they
involved gains. Across our studies, we found that age differences emerged in sure-thing
choices but not in choices about two risky options. In addition, the current study showed
age differences in choices about losses but not in those about gains. Thus, age differences
were most likely to emerge in the types of choice scenarios that elicit affect and thus
should be more likely to be the target of emotion regulation strategies.
General Discussion
Choices for options with different probabilities of a gain or a loss are influenced
by the degree of risk one is willing to take. However, when options with certain (rather
than probabilistic) outcomes are available, the willingness to take on any risk at all comes

35
into play. Experiments 1, 2, and 4 showed that, when given a choice between two risky
options, younger and older adults do not differ in risk taking. However, age differences
did emerge when we pitted a risky option against a sure-thing option. Experiments 1 and
2 (and the pilot explanations experiment) revealed that older adults were more likely than
younger adults to select a sure gain over a possibility of a larger gain – even when the EV
of the sure gain was lower than the EV of the gamble. Experiments 3 and 4 revealed the
opposite for losses: older adults were more likely than younger adults to risk a larger loss
than to accept a smaller certain loss. Thus, the age difference in risk preferences when
there is a certain option is not just a preference for any sure outcome over a risky
outcome. Instead, older adults seem to weigh certainty more heavily than younger adults
do. This finding suggests that older adults are even more susceptible to what Kahneman
and Tversky (1979) termed the “Certainty Effect,” in which people overweight outcomes
that are believed to be certain, relative to outcomes that are probable.
Furthermore, comparing the results of Experiment 3 (choices in the loss-domain)
to those of Experiments 1 and 2 (choices in the gain-domain) suggested that the age
differences in the strength of the “Certainty Effect” were larger for losses than for gains.
The results of Experiment 4 in which participants made choices among both sets of gain
options and sets of loss options also indicated that age differences in the “Certainty
Effect” are less context dependent in the domain of losses than in the domain of gains. In
fact, in this experiment, an age-related increase in the “Certainty Effect” was only seen in
the domain of losses and not in the domain of gains. When people see choices about
gains in the context of other choices about losses, the significance of the losses may
weigh more heavily than that of the gains.
36
Together, our findings help shed light on the circumstances leading to age
differences in risk taking preferences. In addition, our studies showed that the observed
age differences in risk taking behavior remained significant when controlling for age
differences in enduring traits or current characteristics such as level of education, general
intellectual functioning, mood, stress, or occupational socioeconomic status.
Furthermore, our experimental design in Experiments 1 and 2 revealed that older adults’
decision strategies were not simply driven by an effort-conservation heuristic to focus on
the easier to evaluate option (Sets 3). Another obvious possibility was that the age
differences were due to differences in ability to cope with the complexity of probabilistic
options compared with the more simple sure-thing options. However, Experiments 1 and
2 showed that older adults were as sensitive to expected values as younger adults were
(see Sets 4 as well as joint ANOVA over Sets 1 and 2). Thus, even though older adults
seemed to be as effective as younger adults at selecting the better of two risky options,
when a sure-thing option was present, even if it was inferior to the risky option, they were
more likely to select it. Interestingly, in the domain of losses, older adults were less
sensitive to expected values (see joint ANOVA over Sets 1 and 2 in Experiment 3). It
remains an open question whether in the domain of losses (in comparison with the
domain of gains) older adults are less able to take expected values into account or if loss-
related expected values are simply less important in older adults’ decision strategies.
Our last experiment also suggests that age differences in the degree to which
people focus on positive versus negative emotion when making choices (e.g., Mather et
al., 2005, Experiment 4B) is a factor that contributes to the age differences we found.
Older adults used relatively more positive but not negative emotion words when
37
explaining their choices. Overall, using relatively more positive than negative emotion
words was correlated with avoiding sure losses. When included as a covariate, the focus
on positive over negative emotions was significant while the age effect was no longer
significant. In our study, when choosing between a sure loss and a risky option, the only
hope for a positive outcome was the risky option. When choosing between a sure gain
and a risky option, the only assured positive outcome was the sure gain. Thus, older
adults’ focus on choosing something with a positive outcome may have influenced them
to favor sure gains and avoid sure losses even more than younger adults did.
Limitations and Future Directions
While our results rule out some potential explanations for older adults’ greater
“Certainty Effect” (such as age-related differences in stress or numeracy), more work
remains to be done to delineate the mechanisms underlying these age differences and
determine how large the role of affect is in the age effects. Part of the challenge in
delineating the mechanisms of the age effects we found is that little is known about the
basic mechanisms of the “Certainty Effect.” Why is zero so different from 1% or 100%
so different from 99% for decision makers? What factors influence how much people are
swayed by the certainty of a loss or a gain? Some evidence from research on the special
effect of zero in pricing suggests that affect is a key factor (Shampanier et al., 2007), but
more work is needed to understand the specific role of positive versus negative affect.
One limitation of our studies is that we did not manipulate time of day of testing.
Younger and older adults differ in their optimal time of day for completing some types of
cognitive tasks, especially those that require inhibitory processing (Yoon, May, &
Hasher, 1999). In addition, in Experiment 2, we restricted testing to the afternoon in order
38
to reduce variance in baseline cortisol levels, and the afternoon is more likely to be an
optimal time of day for younger adults than for older adults. Although we have no a
priori reason to believe that risk seeking tendencies vary by time of day, it would be
useful to measure the effects of time of day in future research along these lines.
Conclusions and Potential Implications
Across four experiments our findings reveal that older adults in comparison with
younger adults weight certain outcomes more heavily when offered a choice between a
certain and a risky option. Because of this heavier weighting, older adults both show a
stronger preference for sure gains and a stronger aversion for sure losses than younger
adults do. In contrast, there were no age differences in overall risk preferences when
participants were asked to choose between two risky options.
As we mentioned at the start of this paper, this differential approach to risk may
effect the manipulability of older individuals when they approach important decisions.
For instance, to the extent that financial decisions can be framed as a choice between a
sure gain, perhaps Treasury Inflation Protected Securities, and a more risky gain, such as
stocks, older individuals might be significantly more likely than younger individuals to
opt for the Treasury Inflation Protected Securities relative to a situation in which both
options were framed as having some risk – even if the Treasury Inflation Protected
Securities were less optimal. Similarly, when it comes to the important decision whether
to claim social security benefits at the earliest retirement age (i.e., 62 years old) and
receive a sure but lower-dollar payout (i.e., up to 20% less) versus a higher-dollar payout
a few years later at full (between 65-67 years old) or after full retirement age (at 70 years
age at the latest, with a benefit increase between 4% and 8% for each year after full

39
retirement age until age 70) at the risk of not being alive, older adults might sub-
optimally go for the sure payout at the earliest possible age rather than delaying their
retirement benefits (see http://www.ssa.gov/); thus, permanently reducing their benefits.
Finally, the “Certainty Effect” may disproportionally bias older adults’ health
decisions in comparison to younger adults’ health decisions with potentially profound
implications for clinical care and public health (see e.g., Pinquart & Duberstein, 2004).
For example, when patients with end-stage cancer are confronted with a situation that is
framed as a choice between a sure loss (e.g., certain soon death if no further cancer
treatments) versus a risky loss (e.g., chance of no soon death at the risk of seriously
compromising ones quality of life, if chemotherapy), our findings suggest that older
adults might be disproportionately more likely than younger adults to opt for the last-
ditch chemotherapy – even if the overall utility of that option was worse. On the other
hand, if the choice was conversely framed as one between a sure gain (e.g., better quality
of life if no further cancer treatments) versus a risky gain (e.g., chance for a longer life
span at the risk of no life extension along with physical suffering, if chemotherapy) we
would expect to see the opposite effect: that older adults in comparison to younger adults
are more likely to choose no further cancer treatments.
40
References
Ashford, J. W., Gere, E., & Bayley, P. J. (2011). Measuring memory in large group settings using a continuous recognition test. Journal of Alzheimers Disease, 27, 885-895.
Bechara, A., Damasio, H., Tranel, D., & Damasio, A. R. (1997). Deciding advantageously before knowing the advantageous strategy. Science, 275, 1293-1294.
Bellante, D., & Saba, R. P. (1986). Human capital and life-cycle effects on risk aversion. Journal of Financial Research, 9, 41-51.
Bem, D. J. (1965). An experimental analysis of self-persuasion. Journal of Experimental Social Psychology, 1, 199-218.
Botwinick, J. (1969). Disinclination to venture responses vs. cautiousness in responding: Age differences. Journal of Genetic Psychology, 115, 55-62.
Brand, M., Recknor, E. C., Grabenhorst, F., & Bechara, A. (2007). Decisions under ambiguity and decisions under risk: Correlations with executive functions and comparisons of two different gambling tasks with implicit and explicit rules. Journal of Clinical and Experimental Neuropsychology, 29, 86-99.
Chen, Y. W., & Ma, X. D. (2009). Age differences in risky decisions: The role of anticipated emotions. Educational Gerontology, 35, 575-586.
Chou, K. L., Lee, T. M. C., & Ho, A. H. Y. (2007). Does mood state change risk taking tendency in older adults? Psychology and Aging, 22, 310-318.
Curley, S. P., Eraker, S. A., & Yates, J. F. (1984). An investigation of patient's reactions to therapeutic uncertainty. Medical Decision Making, 4, 501-511.
Daghofer, F. (2007). Financial risk-taking on "Who wants to be a millionaire": A comparison between Austria, Germany, and Slovenia. International Journal of Psychology, 42, 317-330.
Deakin, J., Aitken, M., Robbins, T., & Sahakian, B. J. (2004). Risk taking during decision-making in normal volunteers changes with age. Journal of the International Neuropsychological Society, 10, 590-598.
Denburg, N. L., Tranel, D., & Bechara, A. (2005). The ability to decide advantageously declines prematurely in some normal older persons. Neuropsychologia, 43, 1099-1106.
Dror, I. E., Katona, M., & Mungur, K. (1998). Age differences in decision making: To take a risk or not? Gerontology, 44, 67-71.
Fein, G., McGillivray, S., & Finn, P. (2007). Older adults make less advantageous decisions than younger adults: Cognitive and psychological correlates. Journal of the International Neuropsychological Society, 13, 480-489.
Festinger, L., & Carlsmith, J. M. (1959). Cognitive consequences of forced compliance. Journal of Abnormal and Social Psychology, 58, 203-210.
Gneezy, U., & Rustichini, A. (2000). Pay enough or don't pay at all. Quarterly Journal of Economics, 115, 791-810.
Halek, M., & Eisenhauer, J. G. (2001). Demography of risk aversion. Journal of Risk and Insurance, 68, 1-24.

41
Heckhausen, J., Dixon, R. A., & Baltes, P. B. (1989). Gains and losses in development throughout adulthood as perceived by different adult age groups. Developmental Psychology, 25, 109-121.
Heyman, J., & Ariely, D. (2004). Effort for payment: A tale of two markets. Psychological Science, 15, 787-793.
Holliday, S. G. (1988). Risky-choice behavior: A life-span analysis. International Journal of Aging and Human Development, 27, 25-33.
Hunter, K., & Kemp, S. (2004). The personality of e-commerce investors. Journal of Economic Psychology, 25, 529-537.
Jianakoplos, N. A., & Bernasek, A. (2006). Financial risk taking by age and birth cohort. Southern Economic Journal, 72, 981-1001.
Kahneman, D., & Tversky, A. (1979). Prospect Theory: Analysis of decision under risk. Econometrica, 47, 263-291.
Kahneman, D., & Tversky, A. (1984). Choices, values, and frames. American Psychologist, 39, 341-350.
Kovalchik, S., Camerer, C. F., Grether, D. M., Plott, C. R., & Allman, J. M. (2005). Aging and decision making: a comparison between neurologically healthy elderly and young individuals. Journal of Economic Behavior & Organization, 58, 79-94.
Lauriola, M., & Levin, I. P. (2001). Personality traits and risky decision-making in a controlled experimental task: an exploratory study. Personality and Individual Differences, 31, 215-226.
Lepper, M. R., Greene, D., & Nisbett, R. E. (1973). Undermining children's intrinsic interest with extrinsic reward: Test of overjustification hypothesis. Journal of Personality and Social Psychology, 28, 129-137.
Lighthall, N. R., Mather, M., & Gorlick, M. A. (2009). Acute stress increases sex differences in risk seeking in the Balloon Analogue Risk Task. PLoS ONE, 4, e6002.
Lighthall, N. R., Sakaki, M., Vasunilashorn, S., Nga, L., Somayajula, S., Chen, E. Y., et al. (2011). Gender differences in reward-related decision processing under stress. Social Cognitive and Affective Neuroscience.
Löckenhoff, C. E., & Carstensen, L. L. (2007). Aging, emotion, and health-related decision strategies: Motivational manipulations can reduce age differences. Psychology and Aging, 22, 134-146.
MacPherson, S. E., Phillips, L. H., & Della Sala, S. (2002). Age, executive function, and social decision making: A dorsolateral prefrontal theory of cognitive aging. Psychology and Aging, 17, 598-609.
Mather, M. (2006). A review of decision-making processes: Weighing the risks and benefits of aging. In L. L. Carstensen & C. R. Hartel (Eds.), When I'm 64 (pp. 145-173). Washington, DC: The National Academies Press.
Mather, M., & Carstensen, L. L. (2005). Aging and motivated cognition: The positivity effect in attention and memory. Trends in Cognitive Sciences, 9, 496-502.
Mather, M., Gorlick, M. A., & Lighthall, N. R. (2009). To brake or accelerate when the light turns yellow? Stress reduces older adults' risk taking in a driving game. Psychological Science, 20, 174-176.
42
Mather, M., Knight, M., & McCaffrey, M. (2005). The allure of the alignable: Younger and older adults' false memories of choice features. Journal of Experimental Psychology: General, 134, 38-51.
MaxMind. (2012). GeoIP City Database. Retrieved Jan. 29, 2012, from http://www.maxmind.com/app/city
Mazar, N., Shampanier, K., & Ariely, D. (2012). Probabilistic discounts: When retailing and Las Vegas meet. University of Toronto: Working Paper.
McInish, T. H. (1982). Individual investors and risk-taking. Journal of Economic Psychology, 2, 125-136.
Morin, R. A., & Suarez, A. F. (1983). Risk aversion revisited. Journal of Finance, 38, 1201-1216.
Nam, C. B., & Boyd, M. (2004). Occupational status in 2000; Over a century of census-based measurement. Population Research and Policy Review, 23, 327-358.
Nelson, M. J., & Denny, E. C. (1960). The Nelson-Denny reading test (revised by James L. Brown). Boston, MA: Houghton Mifflin.
Okun, M. A. (1976). Adult age and cautiousness in decision: A review of the literature. Human Development, 19, 220-233.
Palsson, A. M. (1996). Does the degree of relative risk aversion vary with household characteristics? Journal of Economic Psychology, 17, 771-787.
Pennebaker, J. W., Chung, C. K., Ireland, M., Gonzales, A., & Booth, R. J. (2007). The development and psychometric properties of LIWC2007.
Peters, E., Hess, T. M., Västfjäll, D., & Auman, C. (2007). Adult age differences in dual information processes: Implications for the role of affective and deliberative processes in older adults' decision making. Perspectives on Psychological Science, 2, 1-23.
Pinquart, M., & Duberstein, P. R. (2004). Information needs and decision-making processes in older cancer patients. Critical Reviews in Oncology Hematology, 51, 69-80.
Preston, S. D., Buchanan, T. W., Stansfield, R. B., & Bechara, A. (2007). Effects of anticipatory stress on decision making in a gambling task. Behavioral Neuroscience, 121, 257-263.
Shampanier, K., Mazar, N., & Ariely, D. (2007). Zero as a special price: The true value of free products. Marketing Science, 26, 742-757.
Van Cauter, E., Leproult, R., & Kupfer, D. J. (1996). Effects of gender and age on the levels and circadian rhythmicity of plasma cortisol. Journal of Clinical Endocrinology and Metabolism, 81, 2468-2473.
van den Bos, R., Harteveld, M., & Stoop, H. (2009). Stress and decision-making in humans: Performance is related to cortisol reactivity, albeit differently in men and women. Psychoneuroendocrinology, 34, 1449-1458.
Wang, H., & Hanna, S. (1997). Does risk tolerance decrease with age? Financial Counseling and Planning, 8, 27-31.
Watson, D., Clark, L. A., & Tellegen, A. (1988). Development and validation of brief measures of positive and negative affect: The PANAS scales. Journal of Personality and Social Psychology, 54, 1063-1070.

43
Weber, E. U., Shafir, S., & Blais, A. R. (2004). Predicting risk sensitivity in humans and lower animals: Risk as variance or coefficient of variation. Psychological Review, 111, 430-445.
Wechsler, D. (2001). Wechsler Test of Adult Reading. San Antonio, TX: Psychological Corporation.
Weller, J., Dieckmann, N. F., Tusler, M., Mertz, C. K., Burns, W., & Peters, E. (in press). Development and testing of an abbreviated numeracy scale: A Rasch Analysis approach. Journal of Behavioral Decision Making.
Weller, J. A., Levin, I. P., & Denburg, N. L. (2011). Trajectory of risky decision making for potential gains and losses from ages 5 to 85. Journal of Behavioral Decision Making, 24, 331-344.
Wood, S., Busemeyer, J., Koling, A., Cox, C. R., & Davis, H. (2005). Older adults as adaptive decision makers: Evidence from the Iowa gambling task. Psychology and Aging, 20, 220-225.
Yoon, C., May, C. P., & Hasher, L. (1999). Aging, circadian arousal, and cognition. In N. Schwartz, D. Park, B. Knäuper & S. Sudman (Eds.), Aging, cognition and self reports (pp. 117-143). Washington, DC: Psychological Press.

44
Author Note
Mara Mather, Davis School of Gerontology and Department of Psychology,
University of Southern California; Nina Mazar, Rotman School of Management,
University of Toronto; Marissa Gorlick, Department of Psychology, University of Texas
at Austin; Nichole Lighthall, Davis School of Gerontology, University of Southern
California; Dan Ariely, Fuqua School of Business, Duke University.
This research was supported by National Institutes of Health grants
R01AG038043, K02AG032309 and T32AG000037. Correspondence concerning this
article should be addressed to: Mara Mather, 3715 McClintock Ave., University of
Southern California, Los Angeles, CA 90089, E-mail: [email protected].

45
Footnotes
1 In addition, there are two other studies that examined age differences in choices
with sure-thing options. One had only 12 participants in each age group and found no
significant age differences (Holliday, 1988). Consequently, it is hard to know if the study
simply lacked power. Another relevant paper has a meta analysis of studies of risky
choices (Weber, Shafir, & Blais, 2004), revealing that those they categorized as older
adults were less likely than younger adults to select sure-thing options in choices
involving losses whereas there were no significant age differences for choices involving
gains. But, the samples with “older adults” only came from a few studies (usually from
separate studies than those with younger adults) and checking these studies reveals that
no ages were provided and most of those considered “older” were MBA students. Thus,
this comparison is flawed as it is likely many of those in the older category would be
under 40 and the age comparisons were mostly across different studies with different
designs.
2 Some participants had incomplete information for the pen-and-paper
demographics information. The number of participants missing one or more demographic
scores (e.g., vocabulary, years of education) was six in Experiment 1, three in Experiment
2 and one in Experiment 3. All significant age differences in sure-thing biases remained
significant if analyses were conducted without these participants.
3 Fourteen participants had insufficient saliva on one or both of the samples and
so could not be included in this analysis.

46
4 When conducted separately for the three groups, this correlation was
independently significant only for the older group with r = -.29, p=.04.
5 Repeating these correlations controlling for word count yielded the same pattern
of results. All significant correlations remained significant except the one between the
average positive emotion word score and proportion of sure loss choices that were risky,
which became marginally significant (p=.066).
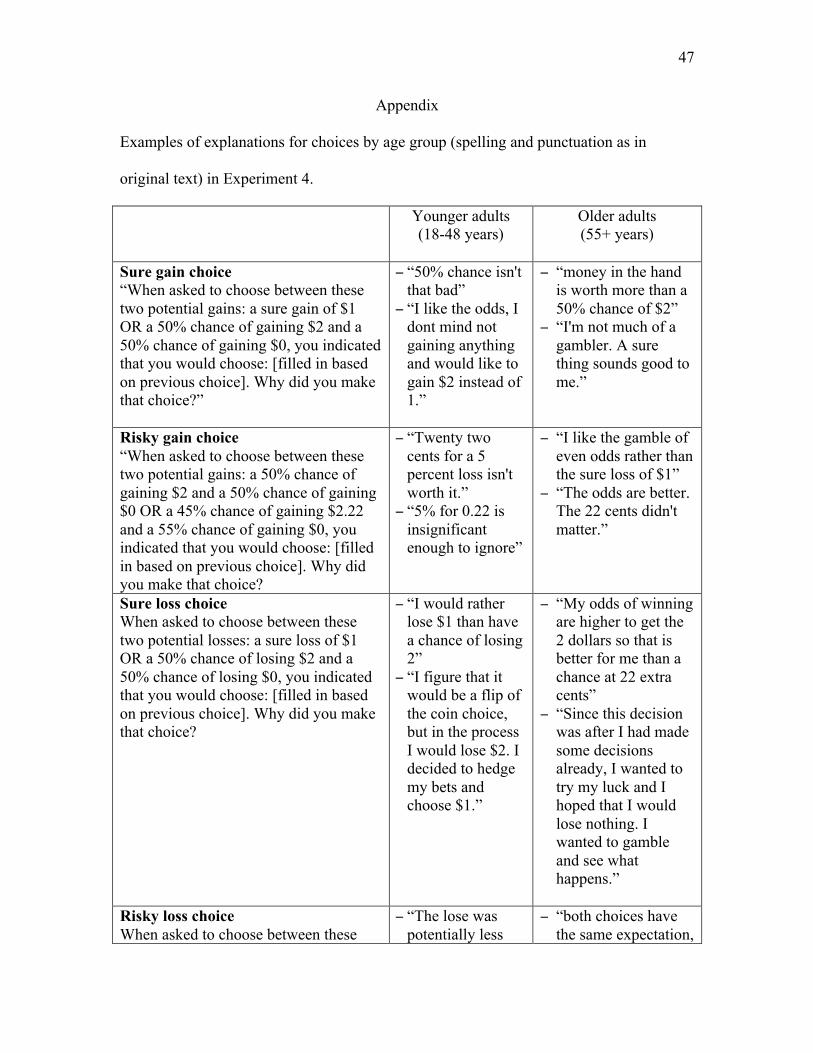
47
Appendix
Examples of explanations for choices by age group (spelling and punctuation as in
original text) in Experiment 4.
Younger adults (18-48 years)
Older adults (55+ years)
Sure gain choice “When asked to choose between these two potential gains: a sure gain of $1 OR a 50% chance of gaining $2 and a 50% chance of gaining $0, you indicated that you would choose: [filled in based on previous choice]. Why did you make that choice?”
− “50% chance isn't that bad”
− “I like the odds, I dont mind not gaining anything and would like to gain $2 instead of 1.”
− “money in the hand is worth more than a 50% chance of $2”
− “I'm not much of a gambler. A sure thing sounds good to me.”
Risky gain choice “When asked to choose between these two potential gains: a 50% chance of gaining $2 and a 50% chance of gaining $0 OR a 45% chance of gaining $2.22 and a 55% chance of gaining $0, you indicated that you would choose: [filled in based on previous choice]. Why did you make that choice?
− “Twenty two cents for a 5 percent loss isn't worth it.”
− “5% for 0.22 is insignificant enough to ignore”
− “I like the gamble of even odds rather than the sure loss of $1”
− “The odds are better. The 22 cents didn't matter.”
Sure loss choice When asked to choose between these two potential losses: a sure loss of $1 OR a 50% chance of losing $2 and a 50% chance of losing $0, you indicated that you would choose: [filled in based on previous choice]. Why did you make that choice?
− “I would rather lose $1 than have a chance of losing 2”
− “I figure that it would be a flip of the coin choice, but in the process I would lose $2. I decided to hedge my bets and choose $1.”
− “My odds of winning are higher to get the 2 dollars so that is better for me than a chance at 22 extra cents”
− “Since this decision was after I had made some decisions already, I wanted to try my luck and I hoped that I would lose nothing. I wanted to gamble and see what happens.”
Risky loss choice When asked to choose between these
− “The lose was potentially less
− “both choices have the same expectation,
48
two potential losses: 50% chance of losing $2 and a 50% chance of losing $0 OR a 45% chance of losing $2.22 and a 55% chance of losing $0, you indicated that you would choose: [filled in based on previous choice]. Why did you make that choice?
with only a slightly higher percent chance of losing money.”
− “I would rather lose some money than risk losing even more money.”
so the choice was arbitrary. I decided to gamble on losing nothing.”
− “better odds; 50% chance seemed good”

49
Table 1
Demographics for participants (standard deviations in parentheses) Younger Adults Older Adults Experiment 1 - Gain
Male/Female N 12/26 10/28 Age 18.7 (1.1) 67.5 (5.4)* Years Education 12.8 (1.2) 15.1 (2.4)* Intellectual Functioning1 15.9 (1.8) 19.0 (3.3)* Negative Mood2 14.7 (4.6) 12.8 (3.9)* Positive Mood2 29.0 (5.4) 34.5 (6.4)*
Experiment 2 - Gain & Stress Male/Female N 24/24 24/24 Age 20.8 (3.5) 72.4 (6.7)* Years Education 13.6 (1.9) 15.9 (2.9)* Intellectual Functioning1 40.4 (6.1) 43.5 (5.6)* Negative Mood2 13.6 (2.9) 12.3 (4.0) Positive Mood2 28.2 (7.2) 34.9 (11.7)*
Experiment 3 - Loss Male/Female N 7/13 7/13 Age 21.1 (2.0) 68.8 (6.8)* Years Education 15.5 (2.0) 15.6 (1.6) Negative Mood2 15.6 (6.3) 12.8 (3.9)* Positive Mood2 27.0 (7.8) 32.8 (6.9)
Experiment 4 - Mixed Male/Female N 58/49 21/29 Age 29.46 (7.17) 59.30 (4.04)* Numeracy3 5.35 (1.66) 5.28 (1.90) Memory4 18.35 (.92) 18.28 (.83) Occupational Status5 58.42 (25.08) 62.14 (25.99)
Table Notes * Younger and older adults’ means differ significantly (t test, p < .05). 1 Wechsler Test of Adult Reading (Wechsler, 2001) 2 PANAS Positive and Negative Affect Scale (Watson et al., 1988) 3 Numeracy scale (Weller et al., in press) 4 Picture recognition memory (Ashford et al., 2011) 5 Nam-Powers-Boyd Occupational Status Scale (Nam & Boyd, 2004)
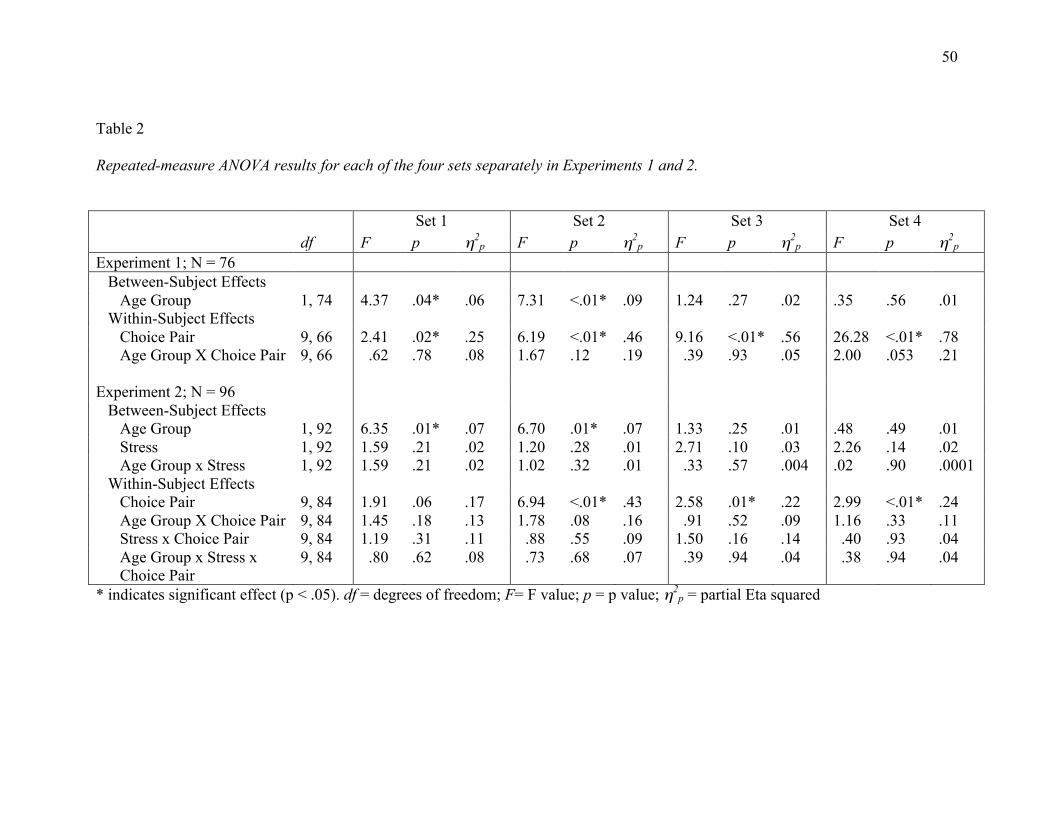
50
Table 2 Repeated-measure ANOVA results for each of the four sets separately in Experiments 1 and 2. Set 1 Set 2 Set 3 Set 4 df F p η2
p F p η2p F p η2
p F p η2p
Experiment 1; N = 76 Between-Subject Effects Age Group 1, 74 4.37 .04* .06 7.31 <.01* .09 1.24 .27 .02 .35 .56 .01 Within-Subject Effects Choice Pair 9, 66 2.41 .02* .25 6.19 <.01* .46 9.16 <.01* .56 26.28 <.01* .78 Age Group X Choice Pair 9, 66 .62 .78 .08 1.67 .12 .19 .39 .93 .05 2.00 .053 .21 Experiment 2; N = 96 Between-Subject Effects Age Group 1, 92 6.35 .01* .07 6.70 .01* .07 1.33 .25 .01 .48 .49 .01 Stress 1, 92 1.59 .21 .02 1.20 .28 .01 2.71 .10 .03 2.26 .14 .02 Age Group x Stress 1, 92 1.59 .21 .02 1.02 .32 .01 .33 .57 .004 .02 .90 .0001 Within-Subject Effects Choice Pair 9, 84 1.91 .06 .17 6.94 <.01* .43 2.58 .01* .22 2.99 <.01* .24 Age Group X Choice Pair 9, 84 1.45 .18 .13 1.78 .08 .16 .91 .52 .09 1.16 .33 .11 Stress x Choice Pair 9, 84 1.19 .31 .11 .88 .55 .09 1.50 .16 .14 .40 .93 .04 Age Group x Stress x Choice Pair
9, 84 .80 .62 .08 .73 .68 .07 .39 .94 .04 .38 .94 .04
* indicates significant effect (p < .05). df = degrees of freedom; F= F value; p = p value; η2p = partial Eta squared
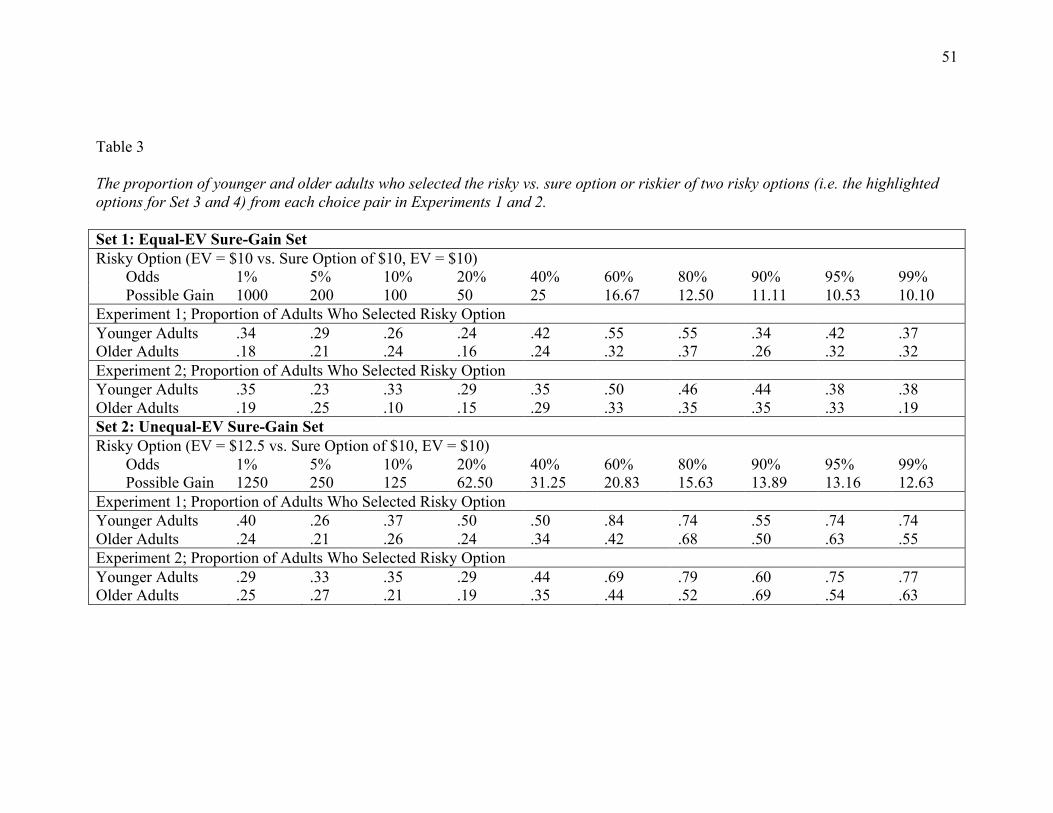
51
Table 3 The proportion of younger and older adults who selected the risky vs. sure option or riskier of two risky options (i.e. the highlighted options for Set 3 and 4) from each choice pair in Experiments 1 and 2. Set 1: Equal-EV Sure-Gain Set Risky Option (EV = $10 vs. Sure Option of $10, EV = $10)
Odds 1% 5% 10% 20% 40% 60% 80% 90% 95% 99% Possible Gain 1000 200 100 50 25 16.67 12.50 11.11 10.53 10.10
Experiment 1; Proportion of Adults Who Selected Risky Option Younger Adults .34 .29 .26 .24 .42 .55 .55 .34 .42 .37 Older Adults .18 .21 .24 .16 .24 .32 .37 .26 .32 .32 Experiment 2; Proportion of Adults Who Selected Risky Option Younger Adults .35 .23 .33 .29 .35 .50 .46 .44 .38 .38 Older Adults .19 .25 .10 .15 .29 .33 .35 .35 .33 .19 Set 2: Unequal-EV Sure-Gain Set Risky Option (EV = $12.5 vs. Sure Option of $10, EV = $10)
Odds 1% 5% 10% 20% 40% 60% 80% 90% 95% 99% Possible Gain 1250 250 125 62.50 31.25 20.83 15.63 13.89 13.16 12.63
Experiment 1; Proportion of Adults Who Selected Risky Option Younger Adults .40 .26 .37 .50 .50 .84 .74 .55 .74 .74 Older Adults .24 .21 .26 .24 .34 .42 .68 .50 .63 .55 Experiment 2; Proportion of Adults Who Selected Risky Option Younger Adults .29 .33 .35 .29 .44 .69 .79 .60 .75 .77 Older Adults .25 .27 .21 .19 .35 .44 .52 .69 .54 .63

52
Set 3: Equal-EV Risky-Gain Set (Experiment 1) Non-50% Option (EV = $5 vs. 50% Option of $10, EV = $5)
Odds 1% 5% 10% 20% 40% 60% 80% 90% 95% 99% Possible Gain 500 100 50 25 12.5 8.33 6.25 5.56 5.26 5.05
Proportion of Adults Who Selected Riskier Option (Non-50% Option for odds <50%, 50% Option for odds >50%) Younger Adults .34 .16 .21 .21 .32 .71 .50 .55 .47 .40 Older Adults .18 .13 .18 .16 .18 .68 .53 .45 .42 .37 Set 3: Equal-EV Risky-Gain Set (Experiment 2) Non-50% Option (EV = $10 vs. 50% Option of $20, EV = $10)
Odds 1% 5% 10% 20% 40% 60% 80% 90% 95% 99% Possible Gain 1000 200 100 50 25 16.67 12.50 11.11 10.53 10.10
Proportion of Adults Who Selected Riskier Option (Non-50% Option for odds <50%, 50% Option for odds >50%) Younger Adults .38 .35 .38 .27 .38 .42 .33 .35 .46 .50 Older Adults .27 .21 .19 .17 .31 .44 .44 .42 .33 .46 Set 4: Unequal-EV Risky-Gain Set (Experiment 1) Non-50% Option (EV = $4 vs. 50% Option of $10, EV = $5)
Odds 1% 5% 10% 20% 40% 60% 80% 90% 95% 99% Possible Gain 400 80 40 20 10 6.67 5 4.44 4.21 4.04
Proportion of Adults Who Selected Riskier Option (Non-50% Option for odds <50%, 50% Option for odds >50%) Younger Adults .29 .16 .16 .13 .00 .71 .76 .63 .61 .53 Older Adults .13 .18 .08 .08 .11 .71 .55 .63 .61 .61 Set 4: Unequal-EV Risky-Gain Set (Experiment 2) Non-50% Option (EV = $12.5 vs. 50% Option of $20, EV = $10)
Odds 1% 5% 10% 20% 40% 60% 80% 90% 95% 99% Possible Gain 1250 250 125 62.50 31.25 20.83 15.63 13.89 13.16 12.63
Proportion of Younger Adults Who Selected Riskier Option (Non-50% Option for odds <50%, 50% Option for odds >50%) Younger Adults .33 .29 .35 .31 .63 .25 .17 .31 .23 .31 Older Adults .25 .25 .19 .31 .42 .25 .27 .29 .29 .31

53
Table 4 Repeated-measure ANOVA results for each of the two sets separately in Experiment 3. Set 1 Set 2 N = 40 df F p η2
p F p η2p
Between-Subject Effects Age Group 1, 38 4.54 .04* .11 19.18 <.01* .34 Within-Subject Effects Choice Pair 9, 30 1.73 .13 .34 0.79 .63 .19 Age Group x Choice Pair 9, 30 2.10 .06 .39 2.63 .02 .44 * indicates significant difference (p < .05) between younger and older adults.

54
Table 5 The proportion of younger and older adults who selected the risky vs. sure option from each choice pair in Experiment 3. Set 1: Equal-EV Sure-Loss Set Risky Option (EV = - $10 vs. Sure Option of -$10, EV = -$10)
Odds 1% 5% 10% 20% 40% 60% 80% 90% 95% 99% Possible Loss 1000 200 100 50 25 16.67 12.50 11.11 10.53 10.10
Proportion of Adults Who Selected Risky Option Younger Adults .70 .80 .75 .45 .55 .60 .55 .65 .75 .70 Older Adults .50 .75 .70 .85 .90 .75 .80 .95 .95 .80 Set 2: Unequal-EV Sure-Loss Set Risky Option (EV = - $12.5 vs. Sure Option of -$10, EV = -$10)
Odds 1% 5% 10% 20% 40% 60% 80% 90% 95% 99% Possible Loss 1250 250 125 62.50 31.25 20.83 15.63 13.89 13.16 12.63
Proportion of Adults Who Selected Risky Option Younger Adults .60 .55 .55 .25 .25 .35 .30 .50 .25 .30 Older Adults .60 .65 .65 .70 .80 .90 .80 .85 .95 .60
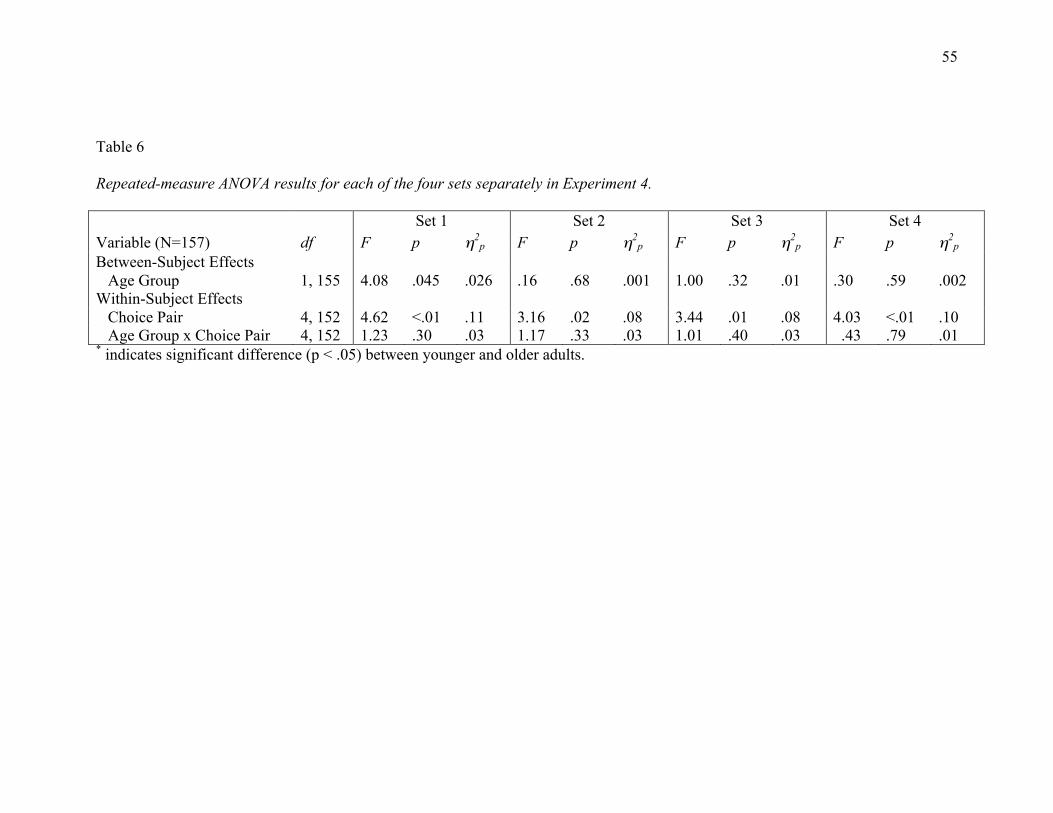
55
Table 6 Repeated-measure ANOVA results for each of the four sets separately in Experiment 4. Set 1 Set 2 Set 3 Set 4 Variable (N=157) df F p η2
p F p η2p F p η2
p F p η2p
Between-Subject Effects Age Group 1, 155 4.08 .045 .026 .16 .68 .001 1.00 .32 .01 .30 .59 .002 Within-Subject Effects Choice Pair 4, 152 4.62 <.01 .11 3.16 .02 .08 3.44 .01 .08 4.03 <.01 .10 Age Group x Choice Pair 4, 152 1.23 .30 .03 1.17 .33 .03 1.01 .40 .03 .43 .79 .01 * indicates significant difference (p < .05) between younger and older adults.
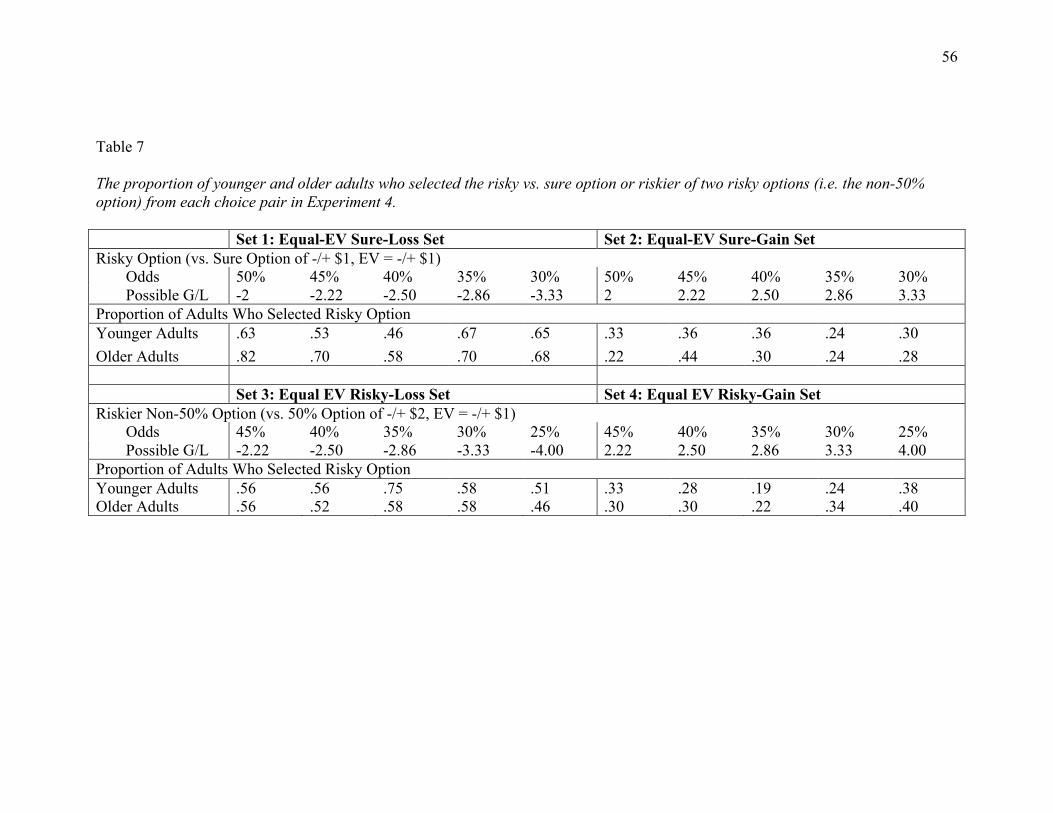
56
Table 7 The proportion of younger and older adults who selected the risky vs. sure option or riskier of two risky options (i.e. the non-50% option) from each choice pair in Experiment 4. Set 1: Equal-EV Sure-Loss Set Set 2: Equal-EV Sure-Gain Set Risky Option (vs. Sure Option of -/+ $1, EV = -/+ $1)
Odds 50% 45% 40% 35% 30% 50% 45% 40% 35% 30% Possible G/L -2 -2.22 -2.50 -2.86 -3.33 2 2.22 2.50 2.86 3.33
Proportion of Adults Who Selected Risky Option Younger Adults .63 .53 .46 .67 .65 .33 .36 .36 .24 .30 Older Adults .82 .70 .58 .70 .68 .22 .44 .30 .24 .28 Set 3: Equal EV Risky-Loss Set Set 4: Equal EV Risky-Gain Set Riskier Non-50% Option (vs. 50% Option of -/+ $2, EV = -/+ $1)
Odds 45% 40% 35% 30% 25% 45% 40% 35% 30% 25% Possible G/L -2.22 -2.50 -2.86 -3.33 -4.00 2.22 2.50 2.86 3.33 4.00
Proportion of Adults Who Selected Risky Option Younger Adults .56 .56 .75 .58 .51 .33 .28 .19 .24 .38 Older Adults .56 .52 .58 .58 .46 .30 .30 .22 .34 .40
57
Figure Captions
Figure 1. Proportion of participants choosing the risky or riskier option in the domain of
gains for each of the four sets in Experiment 1 (bars represent standard errors of the
mean); * significant difference (p < .05) between younger and older adults.
Figure 2. Proportion of participants choosing the risky or riskier option in the domain of
gains for each of the four sets in Experiment 2 (bars represent standard errors of the
mean); * significant difference (p < .05) between younger and older adults.
Figure 3. Proportion of participants choosing the risky option in the domain of losses for
each of the two sets in Experiment 3 (bars represent standard errors of the mean); *
significant difference (p < .05) between younger and older adults.
Figure 4. Proportion of participants choosing the risky or riskier option in the domain of
gain and losses for each of the four sets in Experiment 4 (bars represent standard errors of
the mean); * significant difference (p < .05) between younger and older adults.
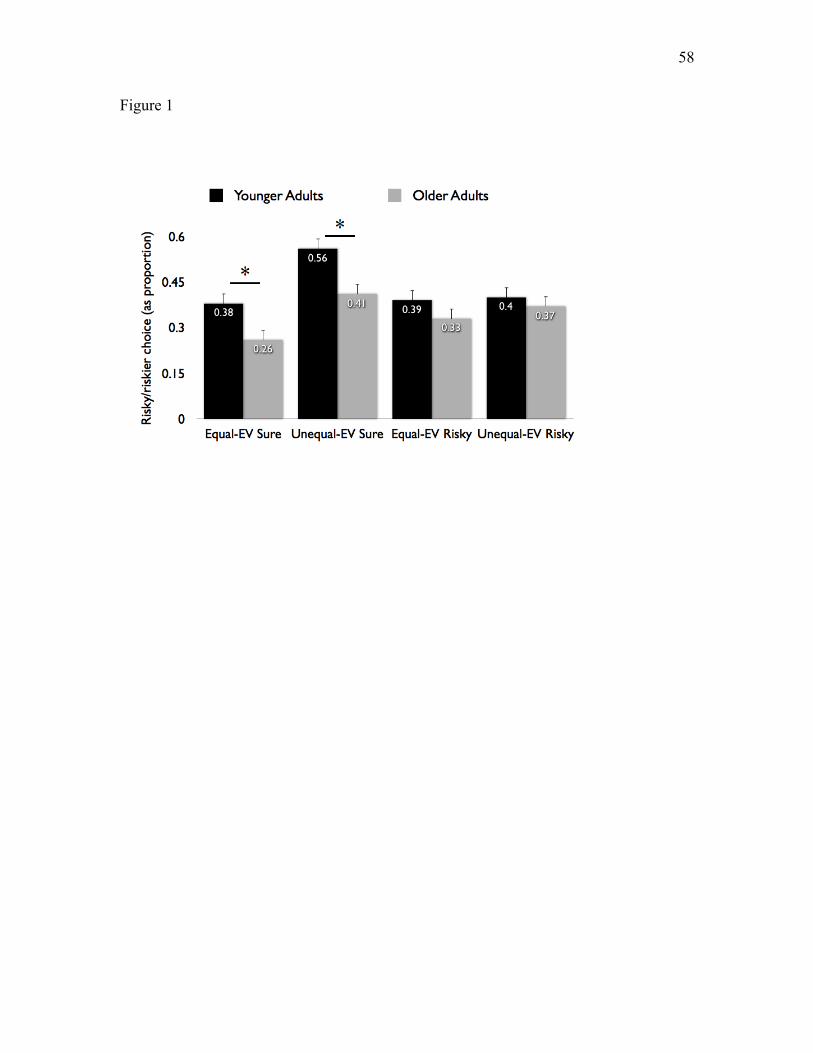
58
Figure 1

59
Figure 2
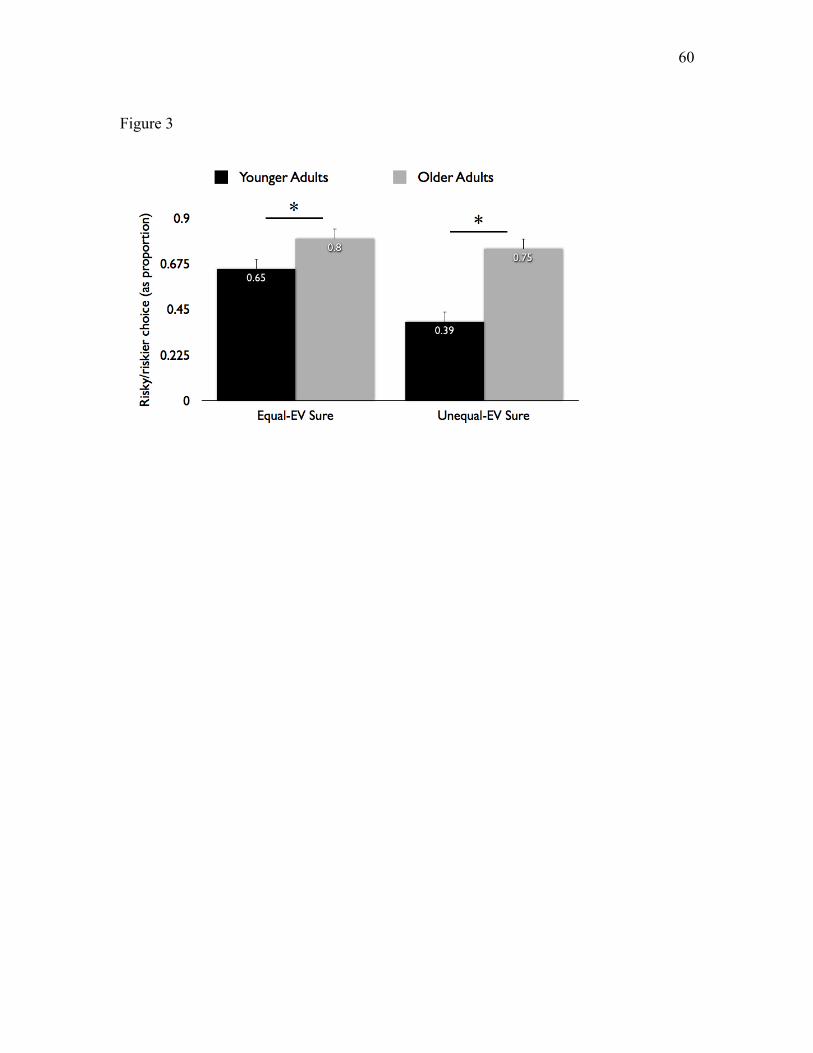
60
Figure 3

61
Fig. 4