1. report no. 2. government accession no. 3. … · 1. report no. tx-9l+957-2f 4. tiue and subtitle...
TRANSCRIPT

1. Report No.
Tx-9l+957-2F
4. TiUe and Subtitle
2. Government Accession No.
AN ANALYSIS OF ROADWAY USER INFORMATION SYSTEMS
7. Author(s) Kjetil Emhjellen, Mark A. Euritt, Shekhar Govind, C. Michael Walton, and William V. Ward
9. Performing Organization Name and Address
Center for Transportation Research The University of Texas at Austin Austin, Texas 78712-1075
Technical Report Documentation Page 3. Recipients Catalog No.
5. Report Date
November 1990 6. Performing Organization Code
8. Performing Organization Report No.
Research Report 957-2F
10. Work Unit No. (TRAIS)
11. Contract or Grant No. Study 2/3-18-90/0-957
~~_~ _____ ~ ___________________ --1 13. Type of Report and Period Covered
12. Sponsoring Agency Name and Address F ina 1 Texas State Department of Highways and Public
Transportation, Transportation Planning Division P.O. Box 5051 Austin, Texas 78763-5051
15. Supplementary Notes
14. Sponsoring Agency Code
Study conducted in cooperation with the Texas State Department of Highways and Public Transportation (SDHPT)
Research Study Title: ''Highway User Operational Information" 16. Abstract
Highway guide signs are used, principally, to direct motorists to different routes, destinations, and other exits along this system. Not surprisingly, some motorists find this system too difficult to navigate and get lost. The basic issue facing the Texas State Deparunent of Highways and Public Transportation (SDHPT) is to develop a roadway infonnation system (guide signs) that enables motorists to drive efficiently, conveniently, and safely. The overall objective of this research is to examine and evaluate guide signing complaints and suggest alternative signing methods or configurations to improve roadway-user infonnation.
Following identification of procedures for inventorying guide sign problems, and the actual inventory, guide sign problems were analyzed categorically for (1) problems that stem from poor or insufficient signing, (2) problems that stem from complex or unusual roadway geometry, and (3) problems that stem from inadequate driver recognition .
. A number of roadway users have confronted ambiguous, confusing or erroneous guide signs. Sometimes signs that seem to infonn clearly, mislead people due to incorrect infonnation, or drivers simply perceive the meaning of the sign differently. It is also possible that incorrect decisions are made by the motorists for reasons not the fault of the system. Some motorists may be uninformed about signing procedures. Additionally, more prevalent use of road maps may lead to better driver response at difficult interchanges, fewer missed exits, etc. A survey of the driver's understanding or perception of the meaning of guide signs was conducted. The survey responses indicate that motorists have greatest difficulty at interchanges with complex or unusual geometry. The signs usually contain too much information for the motorist to quickly comprehend.
Associated with highway guide sign problems are the unique features of airport trailblazing. The problem, simply, is with airline clients who are unfamiliar with airport access routes, and lack adequate route information at major decision points on the way to the airport. Complaints have been received from various sources about trailblazer signs leading to airports that provide commercially scheduled flights in Texas. Accordingly, airport trailblazer signing for the major airports in Austin, Houston, San Antonio, Dallas, and Fort Worth were inventoried and analyzed. Surveys were conducted to identify the major problem areas for airports.
17. Key Words
highway guide signs, roadway information system, signing, driver recognition, routes, destinations, exits, access, airport trailblazing
18. Distribution Statement
No restrictions. This document is available to the public through the National Technical Information Service, Springfield, Virginia 22161.
19 Security Classif. (of this report)
Unclassified
20. SeaJrity Classif. (of thjs page)
Unclassified
21. No. of Pages
106
22. Price
Form DOT F 1700.7 (8-72) Reproduction of completed page authorized

AN ANALYSIS OF ROADWAY USER INFORMATION SYSTEMS
by
Kjetil Emhjellen Mark A. Euritt
Shekhar Govind C. Michael Walton William V. Ward
Research Report Number 957 -2F
Research Project 2/3-18-90/0-957
Highway User Operational Infonnation
conducted for
Texas State Department of Highways and Public Transportation
by the
CENTER FOR TRANSPORTATION RESEARCH
Bureau of Engineering Research
TIIE UNIVERSITY OF TEXAS AT AUSTIN
November 1990

The contents of this report reflect the views of the authors, who are responsible for the facts and the accuracy of the data presented herein. The contents do not necessarily reflect the official views or policies of the Texas State Departtnent of Highways and Public Transportation. This report does not constitute a standard, specification, or regulation.
There was no invention or discovery conceived or first actually reduced to practice in the course of or under this contract, including any art, method, process, machine, manufacture, design or composition of maner, or any new and useful improvement thereof, or any variety of plant which is or may be patentable under the patent laws of the United States of America or any foreign country.
ii

PREFACE
The overall objective of this study was to examine the adequacy of Texas highway guide signs. Guided by this objective, the study team investigated methods for identifying guide sign problems, classification of these problems, and alternative signing methods. Several techniques were used to identify highway signing problems. Field observations of signing and roadway alignment were recorded, both on still photographs and on videotape, along selected segments of highways in Fort Worth, Austin, and San Antonio. Highway signing problems were classified into three major groups: poor or insufficient signing, complex highway geometry, and inadequate driver recognition. Alternatives for each problem category are explored, together with a proposal for a signing system based on a hierarchy of information.
Highway guide signs to airports (trailblazers) were also studied. Inspection and photographic logging of airport trailblazer signs were performed on approaches to Robert Mueller Municipal Airport (Austin), San Antonio International Airport, William P. Hobby Airport (Houston), Houston Intercontinental Airport, Love Field Airport (Dallas), and Dallas-Fort Worth Regional Airport.
Roadway-user surveys were conducted to evaluate alternative highway guide signs. In this study, fourteen signing-problem situations were tested using fullydiagrammatic and partially-diagrammatic signs. In addition, the airport silhouettes used on airport trailblazer signs were tested. Further recommendations for research in highway guide signing and airport trailblazer signs are also discussed
ABSTRACT
Highway guide signs are used, principally, to direct motorists to different routes, destinations, and other exits along the system. Not surprisingly, some motorists fmd this system too difficult to navigate and get lost The basic issue facing the Texas State Department of Highways and Public Transportation (SDHP1) is to develop a roadway information system (guide signs) that enables motorists to drive efficiently, conveniently, and safely. The overall objective of this research is to examine and evaluate guide signing complaints and suggest alternative signing methods or configurations to improve roadway-user information.
Following identification of procedures for inventorying guide sign problems, and after the actual inventory, guide sign problems were analyzed categorically for (1) problems that stem from poor or insufficient signing, (2) problems that stem from complex or unusual roadway geometry, and (3) problems that stem from inadequate driver recognition.
A number of roadway users have confronted ambiguous, confusing, or erroneous guide signs. Sometimes signs that seem to inform clearly, mislead people due to incorrect information, or drivers simply perceive the meaning of the sign differently. It is also
iii
possible that incorrect decisions are made by motorists for reasons not the fault of the system. Some motorists may be uninformed about signing procedures. Additionally, more prevalent use of road maps may lead to better driver response at difficult interchanges, fewer missed exits, etc. A survey of the drivers' understanding or perception of the meaning of guide signs was conducted. The survey responses indicate !hat motorists have greatest difficulty at interchanges with complex or unusual geometry. The signs usually contain too much information for the motorist to comprehend quickly.
Associated with highway guide sign problems are the tmique features of airport trailblazing. The problem, simply, is with airline clients who are unfamiliar with airport access routes and lack adequate route information at major decision points on the way to the airport. Complaints have been received from various sources about trailblazer signs leading to airports that provide commercially scheduled flights in Texas. Accordingly, airport trailblazer signing for the major airports in Austin, Houston, San Antonio, Dallas, and Fort Worth was inventoried and analyzed. Surveys were conducted to identify the major problem areas for airports.

SUMMARY
Generally. roadway signing in Texas is considered adequate. Surveys from visitors' information booths commented on how well Texas is signed. The percentage of problem signs. as compared with total signs. is small; however, given that an improperly signed exit or destination could have serious consequences, it is useful and necessary to monitor potential signing problems.
The use of road maps could greatly reduce potential signing problems. A road map. either local or interstate. could prepare the highway user for what to expect ahead and give him or her more flexibility in finding the necessary road information. Unfortunately, many roadway users do not work with maps; but for those who do use maps, it is important to coordinate the information on maps with that shown on signs.
Whether or not roadway users employ maps, it is evident that there are parts of the existing signing system
that are confusing and could be improved. Improved signing would result from consistency in the type of arrows used in lane assignment; i.e .• the number of arrows should equal the number of lanes. Another important factor is guide signs placed in advance of all exits and lane splits.
The study of trailblazer signs for aiIports indicates that while signing is adequate on highways in close proximity to the airports. signing at major highway interchanges farther away from the airport needs improvement. The solution to this problem, again. could be enhanced by the use of a map. More extensive use of airplane symbol signs for airport trailblazers is recommended.
IMPLEMENTATION STATEMENT
Procedures for identifying guide sign problems are presented and can be used for future research. Guide sign problems have been categorized to assist in development of future signs. Based on the research,
iv
greater utilization of lane assignment arrows, matching the number of lanes. should improve driver recognition and understanding.

TABLE OF CONTENTS
PREFACE. .................................................................................. _ ........... __ . ____ ... _ ..... _ .......... _ .......... _................................................................... iii
ABS1RACf ................................................................................... _. _____ ......... _._ ..... _ ... _____ ... ___ ._ ..... _ .. _ ........ _.......................................... III
SUMMAR Y ............................................................................ _. __________ ._. __ .. __ ._ ... _ .............. _._ ........ _._............................................ IV
llv1PLEMENT A TION STA 1EMENT ......................... _. __ . __ ._. ___ ._ .. ___ . ___ ._._._ ... _ .... __ . ___ .................................................... iv
CHAPTER 1. INTRODUCTION The Basic Problezn ........................................................... _ .......... __ . ___ ...... __ . ___ ._ ..... _._ .. _...................................................................... 1 Literature Review ......................................................... __ . _____ ._. __ ._ .. _._ ...... __ .......... _ .................. _............................................... 1
Contnbutions of This Study ............................................ _._ ..... _._ .... _ .... _._ .............. _._._......................................................................... 2
CHAPTER 2. HIGHWAY SIGNING INVENTORY Identifying Highway Signing Problems .......... ____ ._ .... _ ..... _._._ .. _ ......... _ ... _ .... _ .......... _................................................................ 3
Highway User Surveys ....................................... _ ... __ ... _._ ..... _ ... __ ... _ .......... _. __ ...... __ ._ ..... _.......................................................... 3 Input from Traffic Management Tearns ........................ _ ....... _ ........ _ ................. _ ....... _ ................. _............................................ 3 Input from Officials frp, SDlIPT Districts._ ... _____ ._. __ . _____ . ___ ... _ ........ _._._ .... _ .. _.......................................... 3
Analysis of Accident Data. ....................................... _ .. _._ ..... _ .. _ .. _._ ..... _ .. _._ .. _._ .. _ .. _._ ......... _ ..... _._.......................................... 3 Video Inventory of Highway Signs_ ....... __ ... ______ . ____________ . __ ._. __ .......... _................................................. 3
Vibratioos ............................................................. _________ .. ________________ ... ____ .. _ ............ ___ .......................................... 4
Field of Vision. ......... _ ........................................... _____ . ________ . _______ . ________ . ______ .. _ ....... _ .. _.......................................... 4
Perspective Distortion ........................................ _._._._. __ .... _._._. __ ._._._. __ ._._._._. __ ._._._ ...... _._._._......................................... 4 Lane Position ............. __ .. __ ........ _. __ ._ .. __ . ________________________ . ______ ............ _.............................. 4
Sign Legibility .................................. ___ ..... _ .... __ . _______ • ______ . _______ . ___ .. __ • __ .. ___ ... _ .. ___ ... _............................................ 4 Other Foctors __ ............ __ ............................ _ ...... ________ . ____________ .• __________________ .. _ ............................. _ .. _........... 4 S ummary ................. _._ .... __ . __ . __ .. _ .. _ .......... __________ . __ . ________ ._. ______ ._ .. _ ... _......................................... 4
Classification of Signing Problems_ ......... _ ... __________________ . _______ . ______ ........................................... 5 Problems That S tern from Poor or Insufficient Signing . ________________ ._ ... ___ .......................................... 5
Problems lbat Stem from Complex or Unusual Roadway Geometry............................................................................ 5 Problems That Stem from Inadequate Driver Recognition ___________ . ____ .... __ ........................................ 6
Addressing Signing Problerns .................................... _ .. _._._._ .. _._._._ .. _._._ .. _._._._ .. _._._ .. _._._._ .. _ .... _ .. _ .... _................................... 6 Diagrammatic Signs ....................................... ___ ._ ... ________ .. __ . __ . __ ... ___ ... _ ......... _. __ ................................ __ ..... 6 A Systems Approach to Signing ............ _. _____ . _____ .... _._ ... _______ . ______ . ____ ..... _.................................... 7
CHAPTER 3. USER PERCEPTION OF HIGHWAY SIGNS Discussion of the Problem ..... _ ................. _ .......... _______ . ___ . ___________ ._. _______ ._ ................................... _....... 8 User Surveys. ...... _ ... _ ...................... _ ...... ___ . ___ .... ___________________ .... ______ .. ______ ..... __ .. _ .. _. __ ......................................... 8 Discussion of Results ...... _. ______ . __ . ____________________________ . ____ ... _ ... _ ...................... _................. 8
Conclusions and Recommendations ............ ______ . ________ ._. ____ . ____ ....... _. __ .... _._ ...................................... _.. 9
CHAPTER 4. ROADWAY SIGNING FOR AIRPORTS Discussion of the Problem ................ _ ...... _ .... _ ... _____ ._. ___________ . ________ . ______ .................................. _..... 21
Inventory of Airport Trnilblazer Signs. ....................... _ ..... _ .... _ ..... _ .... _ ..... _ .... _ ..... _ .... _ ..... _ .... _ ........... _............................................ 21
Robert Mueller Municipal AiIport, AusUn ........................... _ ................................... _................................................................ 21 San Antonio International Airport ......... _. _______ . ______ . ______ ._. ____ . ______ .......................................... 23
v

William P. Hobby Airport, Houston ....................... _ ... _ .......... _ ......................... _ ................................. _ .................................... 23
Houston Intercontinental AiIport. ................................ _ ....... _ ............... _ ............... _........................................................................ 26
Dallas Love Field Airport ................................................ _ ............. _ ......... _ .... _............................................................................... 26
Dallas-Fort Worth Regional Airport. ........................ _ ................ _.................................................................................................. 31
Types of Airport Signs ................. _ ......................... _ ..... _ ............ _ .......... _ ......... _ ..................................................................................... 31
Airport Us::r Swveys....................................................................................................................................................................................... 41
Findings and Recornmendations ........ _ ............................................... _.................................................................................................... 44 Trailblazing at Major and Interstate Highways ......... _ ... _ ................ __ ................................................................................ 44
Airport Signing on Local Roads ........................................................ _............................................................................................. 44 Airport Signing at Streets in Central Business Districts ............ ___ ... _._ ...... _._ .. _ ................. OH .................................... 44
Airport Signing Syrnbols. .................................. __ ._ .............. _ .................... _ .... _ .............. _ ............................................ _ ........... _._ .. 45
CHAPTER 5. CONCLUSION Recommendations ..................................................... _._ .. _ ...... _ ... __ ... _ .... _ ... _. __ ................................................................................... 46
FullIre Research ....................................................... _ .............. __ .. _ .............. _ .................. _ ..... _...................................................................... 46
REFERENCES ._ ........................................................................ __ ........... __ .......................................................................................................... 48
APPENDIX A. DIRECTORY OF POTENTIAL HIGHWAY SIGNING PROBLEM LOCATIONS ................................ 49
Appendix A.I. Directory of Potential Highway Signing Problem Locations in Fort Worth ....................................... 50
Appendix A.2. Directory of Potential Highway Signing Problem Locations in San Antonio .................................... 51
Appendix A.3. Directory of Potential Highway Signing Problem Locations in Austin ....... _ ................. _.................. 53
APPENDIX B. DATA AND DEMOGRAPHICS FOR HIGHWAY USER PERCEPTION SURVEYS 1 AND 2 ..... 55
Appendix B.I. Data and Demographics for Highway User Perception Survey 1 ___ ._ ........................................ _ ......... 56
Appendix B.2. Data and Demographics for Highway User Perception Survey 2 ......... _ ...................................... _._._. 61
APPENDIX C. DATA AND TABULATIONS FOR THE AIRPORT GUIDE SIGNING STUDy .................................... 67
Appendix C.l. Airport Survey I>ata and Tabulations from Austin.......................................................................................... 68 Appendix C.2. Airport Survey Data and Tabulations from Dallas-Fort Worth. ____ ._ ....... __ ..................... _ ....... _. 75
Appendix C.3. Airport Survey Data and Tabulations from Houston Intercontinental.................................................... 83 Appendix CA. Airport Survey Data and Tabulations from San Antonio .... __ ... __ . __ ....... _ ........... __ .. _ ... _._._ ....... 90
Appendix C.5. Summary of Airport Survey Tabulations _____ . _________ ........ ___ .................................. _ .............. 97
BffiLIOGRAPHY .............. _ ....................................... _ ... __ ......... ___ ... _ ... __ .. _. __ ._ ....... _ ......... _ ........... _ ..................................... __ ........ 99
vi

CHAPTER 1. INTRODUCTION
THE BASIC PROBLEM The Texas Highway System has over 77,244 miles,
including Farm-to-Market roads. Highway guide signs are used, principally, to direct motorists to different routes, destinations, and other exits along this system. Not surprisingly, some motorists fmd the system too difficult to navigate and get 10SL The basic issue facing the Texas State Department of Highways and Public Transportation (SDHPT) is to develop a roadway information system (guide signs) that enables motorists to drive efficiently, conveniently, and safely. The overall objective of this research is to examine and evaluate guide signing complaints and suggest alternative signing methods or configurations to improve roadway-user information.
Roadway-user information is a broad term that includes signing, delineation, roadway maps, and other user-recognized references. The focus of this research effort is on two related but distinct signing problems. The first relates to highway guide signs-signs that convey route, destination, lane assignment, or exit information. Throughout this report, any references to signing relate to this aspect, and not to advertising signs, etc. The second component is airport trailblazing-a series of signs that motorists follow to reach a particular airport. Trailblazing signs, as the name implies, establish a path for motorists to follow, a path which may cover several different designated roadways. Guideway signs, on the other hand, convey information about upcoming exits and routes and are not intended to establish a route for a particular destination.
LITERATURE REVIEW An extensive literature search and review was under
taken to examine prior research in this area. Most of the relevant papers and reports found were studies completed in the United States and published in the Transportalion Research Record by the Transportation Research Board. A number of research publications by Divisions of the SDHPT were identified. Publications by the Texas Transportation Institute (TfI) were also included, a number of which are technical memorandums and working papers. These, and all other publications relevant to this study, are listed in the bibliography of this report.
In the United States, there has been a perceptioncorrect or otherwise-that signs are not as effective as they could be in conveying needed information to the driver in an efficient and effective manner. Empirical studies by King, on the performances of drivers engaged in highway navigation, suggest that driver demographics
1
and the time of day have linle effect on driver performance (Ref 1). Field studies were performed with drivers who were observed operating and navigating an automobile on a prescribed path both during the day and at night; the distances driven and the travel times were compared with those necessary to accomplish the same tour using optimum routes. Data analysis indicates that both a significant portion of the total vehicle miles traveled and a larger proportion of the total driving time were excessive. While part of the problem was route selection, route planning, and trip sequencing, drivers also indicated an inability to follow routes accurately, which included all aspects of response to, reliance on, and anticipation of highway signing.
The importance of providing the driver with the information needed to perform the driving task has been underscored by researchers in the United States and other countries. Studies conducted in Great Britain in the 1970's suggested that, in 1976 alone, between $390 million and $540 million (1976 U.S. dollars) had been wasted in terms of fuel, time, and operating costs by drivers travelling distances in excess of those that were strictly necessary. This was considered by Wootton to be directly attributable to inadequate or improper highway signs (Ref 2).
Waldeland divides the road traffic system into three major components (Ref 3). The first is the road user, including drivers, passengers, cyclists, and pedestrians. The second component is the vehicle, which includes all types of motorized and non-motorized vehicles. The third component is the road system, which denotes the road and its geometric design, intersections, pedestrian walks, parking lots, and surrounding environment, and which includes traffic signals, signs, and road markings. These three components constitute the traffic system that people deal with daily. Society allocates resources that can be supplied to the road sector, thus indirectly deciding the standards of the road system. Waldeland argues that all road systems are more or less imperfect and test the road user's capabilities.
The American Association of State Highway and Transportation Officials has stated that the driving task depends on how motorists receive and use information (Ref 4). The driving process is a combination of a driver's perception, interpretation, judgment, and reaction; the transmission of information from the road system to the driver is essential during this process. According to Waldeland, a continuous stream of visual sensations or impressions (and to some extent aural impressions) from the roadway, signs, road markings, traffic

2
signals, and other road users should be recognized and evaluated while driving (Ref 3). Faulty or misleading impressions, misunderstandings, and misjudgments may lead to wrong decisions, uncontrolled actions, or accidents. Therefore, the information the motorist gets from the traffic system through geometric design, signing, and road marking should address the driver's needs. It is important that the signs be explicit and easy to understand, so that accidents and stress are avoided.
A study in Melbourne, Australia, by Ambrose and Hoffmann about the necessity for traffic sign installations as judged by local government engineers produced inconsistent responses for most sites (Ref 5). When asked to judge whether the signs at 27 traffic sign locations were required, the engineers were ..... not in agreement as to the need for a sign" (Ambrose and Hoffmann, page 185). As pointed out in the study, this lack of agreement is a cause for concern, because it indicates the use of dissimilar decision-making criteria by the various engineers. These different evaluations of road signing by engineers suggest that average drivers may have even more disagreements about signing.
B. R. Cooper studied the comprehension of traffic signs by drivers and non-drivers in the United Kingdom (Ref 6). Forty-six regulatory, warning, advisory, or information signs, and a number of features of direction signs, were tested through a survey. He said, "Individual signs were correctly identified by between 18 and 100 percent of drivers, the average being 75 percent. In general, signs were best understood by those driving high mileages, by those in lower age groups, and by those in the higher social groups. Non-drivers understandably had lower success rates, about 53 percent overall" (Cooper, p 1).
One major objective of this study is to examine the users' perceptions of the meaning of highway signs. Few studies directly discuss this problem. National Cooperative Highway Research Program Report 123 is the most relevant study found (Ref 7). This report, "Development of Information Requirements and Transmission Techniques for Highway Users," analyzes drivers' information needs and the means for satisfying them, together with the role of fixed-highway signing.
CONTRmUTIONS OF THIS STUDY This sbJdy attempts to provide further insight into the
problem of highway signing. Past researchers have conceived and advocated different systems and techniques for better highway guidance that have included:
(1) improved trip planning and map reading skills, (2) improved accuracy, availability, and legibility of
highway maps, and (3) improved highway information systems.
This sbJdy is organized into five chapters. The major development begins in Chapter 2, where input from traffic management teams and various Texas SDHPT Districts is discussed. A list of problem signing situations in each District as compiled by researchers at the Texas Transportation Institute (TTl) and the Center for Transportation Research (CTR) is included in Appendix A. The problem locations in each District were inspected and videotaped for future reference. Problems related to video logging are also discussed.
Chapter 3 contains a discussion of drivers' understanding and perception of guide signs. Responses from user surveys highlight the perceived differences of the meaning of several different highway signs. Several alternative signing methods, including diagrammatic and partially-diagrammatic signs, are tested.
In Chapter 4, problems associated with airport trailblazer signs are presented. Trailblazer signs in Austin, San Antonio, Houston, Dallas, and Fort Worth were inventoried and reviewed. Shortcomings of each system, as well as suggestions for additional trailblazer signs, are noted. The findings of a survey conducted at DFW, Houston Intercontinental, San Antonio, and Austin Mueller airports are also presented.
The report concludes with Chapter 5, wherein the research findings are assessed and areas are identified where additional work may prove fruitful.
The bibliography lists all relevant publications. Appendix A is a directory of potential problem locations for various areas as defined by motorist surveys and other sources, and Appendix B contains user perception survey data and demographics. Appendix C contains detailed data on the airport surveys.

CHAPTER 2. HIGHWAY SIGNING INVENTORY
IDENTIFYING HIGHWAY SIGNING PROBLEMS
A number of motorists reported problems with various locations. These complaints were the initial basis for a review of highway guide signs. Various sources were used to identify potential problem locations. Highway User Surveys, collected by the Texas Transportation Institute (lTI), contained inputs from officials with different highway districts in Texas and provided important information on problem locations. These problem locations are listed in Appendix A Other problem locations were identified by urban area Traffic Management Teams and analyses of accident data.
Field inspections, where researchers drove on the highways and maneuvered through the identified problem locations, provided valuable insight into the problem of effective signing. Most of the locations were experienced by the researchers for the first time and are good examples of problem signing in Texas. Researchers experienced frustrations similar to those of other motorists by failing to understand the signing and execute actions in a timely and effective manner.
HIGHWAY USER SURVEYS The Highway User Surveys, also referred to as citi
zens' surveys, collected by TTl were the principal source for identification of problem locations. Potential problem locations identified by these surveys in Fort Worth, San Antonio, and Austin were videotaped by teams from the Center for Transportation Research (CTR). Possible problem locations in other cities (Amarillo, Lubbock, Abilene, Houston, Corpus Christi, and Dallas) were videotaped by TIl. These videotapes were used to further analyze the problem and categorize the highway signing problems into common groups.
INPUT FROM TRAFFIC MANAGEMENT TEAMS The Traffic Management Teams in the major urban
areas in Texas are comprised of transportation officials from cities, counties, the State Department of Highways and Public Transportation (SDHPT), police departments, and other agencies in the metropolitan areas. Several meetings with the Traffic Management Teams were held, and these meetings· were generally helpful in validating previously identified problems. As a principal source for identifying problems, however, these meetings did not generate significant results.
3
INPUT FROM OFFICIALS FROM SDHPT DISTRICTS
Separate meetings were held with SDHPT District officials from Austin, Dallas, Fort Worth, San Antonio, and Houston. These discussions were useful in identifying types of problems and reviewing other problem locations. Sites selected for further study were identified by the District officials from three of the cities and are listed in Appendix A. Five problem locations in Fort Worth, three in San Antonio, and five in Austin were identified by District officials. All problem sites were videologged.
Additional meetings were held with a Technical Advisory Committee formed for this study, consisting of various SDHPT District officials and representatives from TTl and erR. The primary focus of these meetings was to review methodology and status reports prepared by TTl and CIR. Additionally, these meetings fostered better coordination among the involved parties and disseminated pertinent information to the SDHPT.
ANALYSIS OF ACCIDENT DATA Accident data for some sections of IH-35 in the San
Antonio District were examined to determine whether or not any correlation existed between problem locations identified by respondents in the Highway User Surveys and accidents in that area. Accident data for some sections of IH-35 were examined, including selected locations with high accident frequencies.
It was determined that detailed. analysis of accident data and their relationships with highway signing was beyond the scope of this study. However, a recent study in California by the Center for Transportation of the Council of State Governments found a positive link between signing and highway fatalities (Ref 8). It is entirely possible that special signing, such as warning signs at locations with high frequencies of accidents, might favorably influence the frequency and/or severity of accidents at problem locations. This is an area worthy of further examination.
VIDEO INVENTORY OF HIGHWAY SIGNS
Visual documentation of the identified signing problem locations on the highways was needed to analyze and classify signing problems. In addition, such a catalog provides an information base useful for further evaluations and studies. Various videotaping techniques were

4
tested for performance and accuracy of recording information. A I5-minute summary tape was compiled by CTR researchers to demonstrate certain aspects to video logging highway signs.
Videotaped results, using both telephoto and wideangle lenses, were examined. Certain trade-offs to videotaping with either of the lenses became clear. Shooting with a telephoto lens tends to make the lettering of highway signs more legible when viewed on a monitor; however, other factors reduce the quality of the video frames. A review of each of these factors is provided in the following sections. These factors were demonstrated in the I5-minute summary videotape noted above.
VIBRATIONS A sign captured with a telephoto lens picks up more
vibrations than a sign taped with a wide-angle lens. Such vibrations are caused by the road surface and vehicle induced vibrations. The vibrations caused by anti-skid grooves and pot holes are worse than periodic expansion joints in the pavement structure. These vibrations make it nearly impossible to read the signs, especially when a zoom lens is used. The use of a wide-angle lens lessens the vibrations and is more effective than a telephoto lens.
FlEW OF VISION
A wide-angle lens has a much wider field of vision than a telephoto lens and is particularly effective at capturing overhead signs. It also captures signs located in the right-of-way, adjacent to the paved surface; the telephoto lens is not effective in recording such highway signs. Furthermore, overhead signs videotaped with a telephoto lens move from the field of vision faster than when a wide-angle lens is used. At 55 miles per hour an overhead sign leaves the field of vision of the telephoto lens almost three seconds before it moves out of the the driver's field of vision. Conversely, signs become visible sooner through a telephoto lens, on a tangent section of highway. H a sign is mounted beyond even a slight curve in the highway, the telephoto lens does not record the sign effectively. The field of vision produced through a wide-angle lens better approximates the driver's actual field of vision. The time lag is only one-half second at 55 miles per hour compared to three seconds for the telephoto lens.
PERSPECTIVE DISTORTION Both telephoto and wide-angle lenses produce a dis
torted perspective with greater distortion in the telephoto mode. This aspect is most evident when the highway segment being taped has an appreciable grade. In general, grades tend to be magnified in a telephoto shot and reduced in a wide-angle shot. H there are any aspects of a combination of signing and highway grades that have to
be taped, it would be most advisable to shoot two separate sequences, one with a wide-angle and one with a telephoto lens, to provide a basis for comparing distortions produced by the different lenses.
LANE POSITION
The field of view provided by a telephoto lens may not cover overhead signs that are very wide or widely separated. In cases where three or more lanes with overhead signs extend along the entire width of the highway, a telephoto lens may not capture details of all of the signs. This is especially true of signs mounted over exit lanes when the camera-mounted vehicle is driven on the outermost (left) lane. For example, along selected routes in Dallas, advanced exit signing is placed along the median while ramp signs are mounted along the right shoulder of the highway. With a telephoto lens it is almost impossible to capture a good view of all the signs which the driver passes.
SIGN LEGIBIUTY
In this category, telephoto lenses provide an advantage over wide-angle lenses; generally, signs become legible much sooner through telephoto lenses than when they are viewed through wide-angle lenses. The small lettering on historic markers and other side-mounted signs is extremely difficult to read with a wide-angle lens.
OTHER FACI'ORS
Lighting is an important factor, as with any photographic enterprise, the intensity of ambient light and the position of the sun with respect to the camera and the subject is important. Signs in the shade are difficult to read, especially when the the camera is not in front of the sun. It is unproductive to tape signs with the sun behind the subject. Not surprisingly, in most situations, if bad lighting conditions exist for one direction of a highway, good lighting conditions exist for the same highway in the opposite direction.
Taping at night has been limited. For a section of US-290 west as it connects to IH-35 in Austin, six separate tapes were made to test combinations of high beam, low beam, telephoto lens, and zoom lens. All variations proved ineffective; very little is visible on any of the tapes.
SUMMARY Effects of using the two lense types are summarized
in Table 2.1. Video taping provides a reasonable catalog of highway signs; however, as a data base for quantitative analyses of highway delineation and signs, its uses are limited.

TABLE 2.1 EFFECT OF FACTORS ON TELEPHOTO AND WIDE ANGLE LENSES
Telephoto Wide Angle Sensitivity to Vibrations Poor Moderate Field of Vision Poor Good Perspective Poor Good Lane Position Poor Good Legibility of Signs Good Poor
CLASSIFICATION OF SIGNING PROBLEMS
The problems of using signs as a means of conveying information to the operator of a motor vehicle are identified in this study and can be listed in three broad categories. These major categories are:
(1) problems that stem from poor or insufficient signing,
(2) problems that stem from complex or unusual roadway geometry, and
(3) problems that stem from inadequate driver recognition.
PROBLEMS THAT STEM FROM POOR OR INSUFFICIENT SIGNING A number of sign problems relate to information de
ficiencies. Based on the research, these deficiencies generally relate to the following items:
(1) information is not available to the user, (2) information is temporarily obstructed, and/or (3) information is confusing, misleading, or erroneous.
The first of these problems, in which the information is not available to the user in time for him to make an appropriate decision, occurs when information on the sign is missing or incomplete or if no sign exists at the location. Inadequate advanced signing and lack of information continuity are in this category. Additionally, a problem occurs when the designation of the highway, e.g., IH-820, is not displayed. Inadequate information also occurs when the sign is obstructed from view by an overpassing bridge, a tree, another sign, etc.
A sign can also be temporarily obscured when the information on the sign is not present for the driver at the appropriate time. Moving trucks, road maintenance, and reconstruction work in the area may temporarily obstruct the driver's view of a sign. Both reconstruction and road maintenance are frequently reported and often difficult to deal with effectively. The sign may be difficult to read due to insufficient illumination of a sign during dark hours or inclement weather.
Many problem locations identified in this study were created by reconstruction work on highway interchanges
5
and are therefore temporary in nature. For example, any number of complaints were received about the signing at the interchange between the south part of loop IH-820 (IH-20) and IH-35W in Fon Worth. This was a temporary problem with several of the complaints remedied prior to the videotaping and inspection of the location. Out of five public complaints at this interchange, only one was identified by the research team as a real problem, and that problem should be rectified following completion of the interchange.
The last group, which involves confusing, misleading, or erroneous signs, has to do with the roadway user's interpretation of the sign. The sign can be confusing when it has too much information or when the information presented is ambiguous. Most lane assignment problems fall into this group. Based on the research, it can be concluded that signing consistency is most apt to reduce driver confusion, particularly with respect to lane arrows.
Concurrent routing, a procedure commonly used in Texas, also contributes to the confusion problem. In urban settings, a single highway may be designated for three or more different routes. This problem becomes magnified at major interchanges and can easily lead to information overload for drivers.
Misleading or erroneous information may also occur on a sign. Some error may have appeared in the design, or information on the sign may be obsolete; changes to a specific location on a sign or to the road system are included in this group. If, for example, Arlington Stadium in Arlington were to change its location, all previous signing with information about Arlington Stadium wou1d have to be corrected and new signs for the new location would have to be provided. If the signs for the old location to the stadium were still there, the information would be incorrect and misleading.
PROBLEMS THAT STEM FROM COMPLEX OR UNUSUAL ROADWAY GEOMETRY This category includes problem locations that relate
more to difficult roadway geometry than to inadequate or improper signing. Because each of these problems is more location-specific than problems due to poor or insufficient signing, categorization is more difficult Still, there are cenain geometric features, especially on urban highways, that are associated with problems related to conveying information to drivers. These features are grouped as follows:
(1) Exit-related problems associated with an accesscontrolled facility-(a) Left-hand exits, (b)
(c)
Optional exit lanes I optional thru lanes (single or multi lanes), Exit ramp lanes that split,

6
(d) Exit ramp within an interchange for local destinations,
(e) Multiple exits within a short distance, and (f) Inconsistency when exit (ramp) is in ad
vance of or beyond the interchange;
(2) Potential sight distance problems due to highway geometry-(a) Crest curve may reduce sight to signs, (b) Overhead structures like bridges block sight
(especially in sag curves), and (c) Horizontal curves where lane assignment ar
rows look like they appear over wrong lane; and
(3) Other geometric features associated with signing problems--(a) Lane drops, for example where the highway
has an upper and a lower level, (b) Major freeway divisions or bifurcations, (c) Merging of lanes, (d) Lanes added near exits, and (e) Tangential off-ramps from curved main
lane.
PROBLEMS THAT STEM FROM INADEQUATE DRIVER RECOGNITION
The fmal category is perhaps the most difficult to address and is beyond the scope of this study. The driver is the most important element in the highway system, as is indicated by the fact that a high percentage of all highway accidents are attributable to driver error. But, however important the driver may be, it is virtually impossible to have a common characterization that would fit a majority of drivers on a highway. The question then becomes, "What are the characteristics of the 'Design Driver?'"
Important variables for identifying the design driver are:
(1) age, (2) education, (3) visual acuity, (4) driving exposure/experience, (5) familiarity with location, (6) economic background, (7) driving while intoxicated, and (8) other demographic characteristics.
In addition, specific information needed by drivers should be identified, as well as factors relating to selection and transmission of information. Visual display of words or symbols is the commonly recognized procedure for conveying information to drivers. Still, even this form of transmission is limited, and there are questions as to the extent of its usefulness. Research in new communication
technologies and navigation procedures, such as invehicle guidance, may provide new avenues for the future. Continued research is also warranted in the area of human factors.
ADDRESSING SIGNING PROBLEMS Included below is a general description of alternate
approaches to problems that stem from poor or insufficient signing and to problems associated with complex or unusual roadway geometry. Alternatives for problems that stem from inadequate driver recognition are beyond the scope of this study. Further study is needed to address the issues derived from inadequate driver recognition.
DIAGRAMMATIC SIGNS
Restated, the driving issue in its most general form, is to define the most effective means of communicating information to drivers, given that, in most cases, there is more information to be communicated than space available. If too much information is presented, it may confuse drivers and cause them to miss the messages they are interested in or need to know.
During meetings with SDHPT District officials, advance diagrammatic signs, giving drivers a full perspective of the layout, were discussed as a means of addressing problems at interchanges. In general, the research fmdings indicate that advance diagrammatic signs for intersections are well understood by users. The 1980 Texas Matwal on Uniform Traffic Control Devices, in fact, encourages the use of diagrammatics at several advance guide sign locations. It notes, "Diagrammatic signs are guide signs that show a graphic view of the exit arrangement in relationship to the main highway. Use of such guide signs has been shown to be superior to conventional guide signs for some interchanges" (Ref 9, pp 2F-34).
There is still resistance, however, from federal authorities, to widespread use of diagrammatic signs. Part of their opposition may be based on research that indicates significant groups of drivers have problems in understanding symbolic information called for in the Manual on Uniform Traffic Control Devices. Dewar's research found that "Recent efforts at developing new symbolic messages indicate that not all (messages for drivers) can be translated into symbols" (Ref 10). A diagrammatic sign is comparable to a symbol sign, where the user perceives a meaning of a sign as ambiguous or simply may not understand.
Further study on the use of symbols or pictographs to convey information could be useful, especially in light of European signing standards that have successfully adopted this type of design approach. If a more extensive use of diagrammatics is found valuable, many complex

highway geometry problems can more easily be addressed.
Examples of diagrammatic signs are found, among other places, in Fon Worth: westbound on 1H-20 at loop 1H-820 west, northbound at IH-35W and state highway (SH) 121, eastbound at the ill-20 and ill-30 split-off, and westbound on IH-635 for state highway 121 south and north. These signs seem to be in accordance with the criteria for a diagrammatic sign in the Manual on Uniform Traffic Control Devices.
A SYSTEMS APPROACH TO SIGNING
From a systems perspective, a hierarchical approach to sharing road information (each level or hierarchy would have its own distinct style and color combination to provide instant recognition of type) would be most appropriate. To a certain extent, this practice is followed in the Texas Manual on Uniform Traffic Control Devices through use of coloring and shapes. Similarly, a hierarchy of information could be devised by separating local destination signs from distant destination signs, not only by their position on the overhead signpost but also by color. For example, all signs for distant destinations could be placed on the extreme left of the overhead
7
boarding with a color different from that of signs identifying local landmarks. All signs for upcoming highway interchange ramps and exit ramps could be placed to the right of distant destination signboards in a color different from that of signs identifying distant destinations.
Drivers presented with information at these two levels (local and distant destinations) could selectively screen out the information that is not of any immediate interest and focus on the pertinent information. This would allow placement of more signs without overloading drivers with too much information to sift through. A comparable practice is used on the European continent, where West Germany and The Netherlands convey local and distant destination information with color codes.
A policy could be developed for constructing a hierarchy for presenting information more systematically. Development of such a policy would require additional research into acuity of driver perception of different colors. (Information from some European countries could be useful in this area) It is also impottant to hierarchically classify all information presented to the driver. Finally, as in every situation, any policy requires periodic assessment to insure that it reflects the state of knowledge and practice.

CHAPTER 3. USER PERCEPTION OF HIGHWAY SIGNS
DISCUSSION OF mE PROBLEM
As mentioned in Chapter 2, a number of roadway users have confronted ambiguous, confusing, or erroneous ~de signs. Sometimes signs that seem to inform clearly, mIslead people due to incorrect information, or drivers simply perceive the meaning of the sign differently. A guide sign that is perceived differently by a number of drivers is unacceptable. The objective of a guide signing system is to assist drivers in navigation to their destinations in "the most simple, direct manner possible" (Ref 9).
Although the guide sign system may convey ambiguous, confusing, or erroneous information, it is also possible that incorrect decisions are made by the motorists for reasons not the fault of the system. Some motorists may be uninformed about signing procedures. Additionally. more prevalent use of road maps may lead to better driver response at difficult interchanges, fewer missed exits, etc.
This chapter presents a discussion the driver's understanding or perception of the meaning of guide signs. Ho~ drivers perceive the meaning of a guide sign is exammed based on results obtained in surveys used to illustrate driver response to different signing problems. The s~eys focus on guide sign problems at exit ramps, the major area of concern identified in the citizens' surveys conducted by the Texas Transportation Institute (TI1).
USER SURVEYS
Moto~sts' perceptions of the meaning of traffIC signs are tested 10 two surveys. Each of the surveys illustrates a section of highway with various guide signs. Survey respondents were given a destination and asked to choose the lane they should be driving in to reach their destination. lllustrations used in the surveys are shown in Figs 3.1 through 3.9B.
Importantly, surveys using illustrated material of highway sections and signing for questions about lane choice and destination do not replicate the real situations people confront while driving on a highway. People may respond differently to a survey as compared to a real situation. Drivers are often given advance signing that warns or prepares them for upcoming interchanges, or have o.ther visual landmarks that cannot be replicated by smgle-frame graphic material. Finally, the survey is based on a sample of convenience and not a random survey. However, given these recognized limitations, the survey responses still provide some useful and interesting information, as well as a methodology for evaluating signing alternatives.
8
The surveys were conducted among students and employees at The University of Texas at Austin. The survey respondents, after furnishing some biographical data were given an explanation of the questions to be asked' together with an example. Each respondent was given ui seconds per roadway problem. Respondents were not allowed any extended time to study, review, or ask questions about the situation.
Illustrations of the highways and guide signs used in the fIrst survey were designed to replicate signing locations in San Antonio and Austin. These locations were identified through in-situ inspections of problem locations identifIed from the citizens' survey conducted by TTl.
The San Antonio problem location tested in the first survey received the most complaints in the citizens' survey. This problem is located at an interchange on the inner loop around San Antonio, where there are splits and mergers of several major highways. The highways involved in this interchange are IH-tO and 35 and US 81, 87, and 90. A map of this location is shown in Fig 3.10.
The second survey tested several options for a problem interchange and airport trailblazing. Survey two was conducted in two versions, A and B. with only the destinations changing. The airport trailblazer sign problem tested the orientation of the airplane symbol used on seve~ airport trailblazer signs. The objective for testing the auport problem was to determine whether or not the airplane symbol implied another message-directional information (see Figs 3.9A and 3.9B).
A number of alternatives were tested for the San Antonio situation. The order of the problems and the names of the destinations were changed in order to focus o? the signi?g ~ethods and not the destination. FullydIagrammatic sIgns (Figs 3.3, 3.4, and 3.8), partiallydiagr~matic signs (Figs 3.7A and 3.7B), signs with arrows 10 an upward direction (Figs 3.2 and 3.6), and signs with lane assignment arrows in a downward direction (Figs 3.1 and 3.5) were used in the survey.
Figures 3.1 through 3.9B illustrate the scenarios used in the roadway user perception surveys. Except for the fIgure text, the lane numbering, and the participants' percentage choice of each lane that is added, these illustrations are identical to those used in the survey.
DISCUSSION OF RESULTS Again, it should be noted that an illustration of a
si~g problem is not equivalent to the real signing situa~on. Howev:r, certain typical misunderstandings or mtstakes made 10 the surveys may be valid in real situations.

In general, when a guide sign has the same number of arrows as the number of lanes, respondents seem to understand the situation and make the correct decision. Guide signs with the number of arrows not equal to the number of lanes seem harder for motorists to comprehend. This was also pointed out several times in meetings with SDHPT officials. The responses made to the illustration shown in Fig 3.1, where there are three lane arrows and four lanes, illustrate this confusion. In Figs 3.5A and B, 3.6A and B, and 3.7A and B, where the number of arrows and lanes are equal, there seems to be less confusion.
It was found, not surprisingly, in the tests of the different types of signs, that fully-diagrammatic signs were confusing when too much information was placed on them. In the fully-diagrammatic signs shown in Figs 3.8A and 3.8B, 80.4 percent and 82.7 percent made the correct lane assignment, respectively. These results contrast with the 97.6 percent correct responses to the existing fully-diagrammatic sign from Austin (Fig 3.3) and the 90.5 percent correct responses to the illustrative sign in the San Antonio problem (Fig 3.4). The problem of information overload, however, is not specific to diagrammatic signs. The difference in results from Fig 3.2 and 3.6A seems to be the result of too much information. Given time to study the guide signs, clearly, the sign in Fig 3.6A is less confusing than that in Fig 3.2. But given the time constraint, more respondents correctly identified lane 4 in Fig 3.2 than in Fig 3.6A. The results indicate that an illustrative or fully-diagrammatic sign becomes more confusing when the amount of information to be conveyed increases. Still, a fully-diagrammatic sign is a good alternative for explaining complicated geometric configurations, particularly when little non-geometric information needs to be conveyed, as demonstrated in Fig 3.3.
The results for the partially-diagrammatic signs are less conclusive (Figs 3.7A and 3.7B). Although 84.6 percent of the respondents chose correctly in Fig 3.7B as opposed to 82.4 percent in Fig 3.6A, respondents continued to choose incorrectly lane 3 in nearly equal amounts (9.8 percent in Fig 3.6A and 9.6 percent in Fig 3.7B). This latter situation is disturbing given that the partially-diagrammatic sign in Fig 3.7B is intended to more accurately convey the optional lane. The results in Fig 3.7A (98 percent correct responses) are a little more distinct, as compared to those in Fig 3.6B (94.2 percent correct responses), although in general the respondents had less difficulty with far right-hand, exit-only lanes.
The use of a downward-pointing arrow at an exit split provided some interesting results. Figure 3.1 attempts to illustrate the current signing problem in San Antonio. Participants in the survey gave varying responses when Laredo was their destination. Only 19.2
9
percent chose the lane that would actually lead them to Laredo, while remaining responses from participants varied. Most of the respondents believed that lane 3 would direct them to Laredo. This is strong evidence of the inadequacy of a single arrow for lane splits.
The last type of sign tested for exit splits uses an upward-pointing arrow, with the arrows tilted 45 degrees against the exit (see Figs 3.2, 3.6A, and 3.6B). Generally, the results and comments received for this type of sign were favorable. In Fig 3.2, 86.0 percent of the respondents made the correct lane decision. (An additional 10.8 percent changed their minds and made the correct decision.) In Fig 3.6A, 94.2 percent chose the correct lane to reach their destination, and in Fig 3.6B, 82.4 percent chose the correct lane. As indicated previously, this difference may be attributable to respondents' ease with right-hand, exit-only lanes.
The results of the airport signing problem were not surprising. The nose of the airplane symbol points left in Fig 3.9A and right in Fig 3.9B. Prior to conducting the survey it was hypothesized that the airplane symbol itself is often perceiVed by motorists as indicating direction, as opposed to a directional arrow also used on the sign. In Fig 3.9B, nearly 35 percent incorrectly chose lane 2, the direction the airplane symbol points rather than the arrow. In the similar problem for Fig 3.9A, all survey participants chose the correct lane. Accordingly, it is recommended that the airplane symbol be used to convey direction, supplemented by the arrows traditionally used to indicate direction. William P. Hobby Airport has several examples of signs where the airplane symbol points in one direction and the arrow in another (sign numbers 4.1 and 4.3 in Fig 4.3 for W. P. Hobby Airport).
CONCLUSIONS AND RECOMMENDATIONS
Overall. respondents seem to be confused when too much information is given on a single sign; this is the major problem associated with the interchange tested in San Antonio. Signing is difficult at complex or unusually designed interchanges. Another factor that complicates this problem is concurrent routing. The highway section on the south part of the inner loop in San Antonio represents five highways (llI-I0, US 90, US 87, US 81, and IH-35), too much information for one sign (see Fig 3.10). It may be advisable to direct some of the highway traffic elsewhere, such as through parts of Loop IH-410 and away from this inner loop, or possibly the state should explore alternatives to concurrent routing.
Some comments noted in the public surveys included complaints about the signing system that are beyond the scope of any signing system. It is evident that a signing system can never satisfy the needs of all highway users.

10
No matter how well the guide sign system is designed, there will always be some complaints about confusing guide signs for specific locations.
Road maps can provide additional information about the roadway system, and it is recommended that highway authorities encourage their use. Local or inter-state road maps can provide the highway user with advance information, and give him/her more flexibility in [mding the necessary route or destination.
AU types of signing tested in the surveys have been successively used in real situations. Therefore it is appropriate to consider these signing types when evaluating options for specific locations. However, evidence from the survey tests shows that the best signing type for exit splits is the sign with tilted arrows pointing upward (see Figs 3.2, 3.6A, and 3.6B). This sign type produced the best survey results and received the most favorable comments from survey respondents.
The research seems to indicate that for a highway sign at an exit split there is need for one arrow per lane. The upward arrows above the exit lanes should be tilted to indicate the direction of the exit and names of destinations should be placed at the tip of the arrow, with the
highway symbols and their directions above these names. The survey also indicates that diagrammatic guide signs are appropriate in advance of an exit with a lane split when a limited amount of information, other than geometric, is to be conveyed. This practice for complete exit signing is recommended in the Manual on Uniform Traffic Control Devices:
Page 20 for Fig 3.1, Page 21 for Fig 3.2, Page 22 for Fig 3.3, Page 23 for Fig 3.4, Page 24 for Fig 3.5A, Page 25 for Fig 3.5B, Page 26 for Fig 3.6A, Page 27 for Fig 3.6B, Page 28 for Fig 3.7A, Page 29 for Fig 3.7B, Page 30 for Fig 3.8A, Page 31 for Fig 3.8B, Page 32 for Fig 3.9A, Page 33 for Fig 3.9B, and Page 34 for Fig 3.10.

West
(ij Del Rio
V · · · · · · · · · · · · · · · · · · · · · ·
7.2 % changed their minds from lane 3 to lane 4
1 : 2 : 3 . . . -- -- -- -- -- -- -- -- -- -- -- -- -: 12.6 : 60.5 :%:0/0 - -- -- -- -- -- -- -- -------. . ---
· -· · · -· • --· -· · -· · ---. .
--------. -. South North
CWCW Laredo Austin
VV
Mark the lane you would drive in if your destination were Laredo.
Fig 3.1. Signing problem 1 in survey 1.
11

12
North
~ Chicago
{7 .. .. .. .. .. .. .. ..
• .. .. . .. .. : .. .. .. • •
10.8% changed their minds from lane 3 to lane 4.
1 : 2 : 3 .. .. .. .. .. .. .. .. .. .. .. .. .. .. .. .. .. .. .. .. .. .. .. .. .. .. = :3.2 .. .. .. .. .. .. .. .. .. .. ..
: % .. .. .. .. .. .. .. .. .. .. .. .. .. .. .. .. .. .. .. .. ..
.. .. .. .. .. .. .. .. .. .. .. ..
.. .. .. .. .. .. .. .. .. .. .. .. .. .. .. .. .. .. .. .. ..
West
~ Peoria
0J
East
~ Danville
0J
Mark the lane you would drive in if yourdeslinalion were PeDria.
Fig 3.2. Signing problem 2 in survey 1.

North
2.4% changed their minds from lane 3 to lane 4. 7.8% said they would be in either lane 4 or lane 5.
1 : · · · · · · · · · · · · · · · · · · · · · · · · · · · · · · · · · · · · · ·
· · · · · · · · · · · · · · · · · · · ·
2 : 3 · · · · · · · · · · · · · · · · · · · · · · · · · · · · · · · · · · · · · ·
Mark the lane you would drive in if your destination were on FM 2222 West.
Fig 3.3. Signing problem 3 in survey 1.
13

14
7.7% changed their minds from lane 3to 4.
N 1 : 2 : 3 -
W~E S
- -- -- -- -- -- -- -- -- -- -- -- -- -- -- -- -- -- -- -- -- -- -- -- -- -- -- -- -- -- -- -- -- -- -- -- -Del Rio EI Paso
Austin
Mark the lane you would be driving in if your destination were EI Paso.
Fig 3.4. Signing problem 4 in survey 1.

N
W~E S
WEST
CW
13.7% said they would be in either lane 1 or 2. ; .. - .. .. .. .. . .. .. . .. .. - .. ..
4 1 .. 2 .. 3 .. . .. .. .. .. .. .. .. .. .. - .. .. .. -.. . .. 33.3% = 47.1% : 3.9% · 2.0% · .. .. .. .. .. .. · .. - .. .. .. .. .. . .. .. .. .. .. .. -.. .. .. .. .. .. .. .. .. . .. .. .. .. . . .. .. - .. .. .. .. .. .. .. .. .. .. .. .. .. .. .. .. .. .. .. .. .. .. .. .. .. .. .. .. .. . .. .. .. .. .. .. . . .. .. .. .. .. .. - .. .. .. .. . .. .. .. . .. .. .. ..
NORTH .~.
SOUTH @.: @ WEST (W if
~ ~ ~!I! New York Newark Erie Boston .~. ... ~ .. .. .. .. .. .. .. .. .. .. . .. .. .. .. .. .. .. .. .. .. .. ..
.. -.. -.. .. : .. .. .. .. .. .. .. .. .. .. .. .. .. .. ..
~ . E Exit Only .. .. .. .. .. .. .. .. .. . .. .. .. .. .. .. .. .. .. ..
3.8% had no answer. .. . -- .. .. .. .. .. .. .. .. .. .. .. 1
.. 2
.. 3 .. 4 .. .. ..
N .. .. .. .. .. . W~E
.. .. .. .. . .. .. . .. .. - 7.7% ..
88.5% . .. .. .. .. -.. .. .. S
.. .. .. .. - .. .. .. .. .. .. . .. .. . .. .. .. .. .. .. .. .. .. .. .. .. .. .. .. . . .. .. . .. .. .. -.. .. .. .. .. .. .. .. .. .. .. .. .. .. .. .. .. .. .. .. .. .. .. .. .. .. .. . .. .. .. . .. .. .. .. .. .. .. .. . .. .. .. . .. .. .. .. .. .. .. . .. .. .. .. .. .. .. NORTH
SOUTH @ WEST @ WEST (W ~
New York ~~~
Newark Erie Boston ......... ... .... .. .. .. .. . .. . .. .. .. .. .. .. . .. . .. .. .. .. .. .. .. ..
.. . .. .. .. .. .. .. .. .. .. .. .. .. . .. .. .. .. --.. .. ..
§ Exit Only .. .. .. .. .. .. .. .. · · · .. · .. .. · .. .. .. ..
15
Draw a line in the lane you would drive in if your destination were New Yorl Draw a line in the lane you would drive in if your destination were New York.
Fig 3.SA. Signing problem 2 in survey 2A. Fig 3.SB. Signing problem 2 in survey 2B.

16
WEST
<i3 Del Rio
- -· . · . · . 1 : 2 : 3 · . · . · . · . · . · . · . · . · -- -· . : : 9.8% · . · . · . .. .. · . · . · .. · .. · . · . .. . .. . .. . .. . .. . .. . .. . · . · . · ..
NORTH
SOUTH (!i) (!i) WEST @ ®~® .. .... La. EI a,Austin
.. . . .. . .. · · · .. .. --.. .. -.. .
· · · · · · .. · · .. --.. -.. .. .. ..
N
W~E s
WEST
~ Del Rio
2.0% had no answer.
· · · · · · · -1 · 2 · 3 · · · .. · .. .. · · · .. -· · .. · · .. .. .. · .. · · · · · · · · .. · · .. .. .. · .. · .. .. .. · .. .. .. · .. · .. · . · .. · .. .. .. .. · .. .. · · .. .. · · · · · .. NORTH
SOUTH @ @ WEST @ ®C1oi®
Laredo EIYaso Austin ~ ... ~ ~
· · • · · · · · · -· .. · · · · · · ·
· · · .. -· · · · · · .. · .. · · .. .. · Draw a line in the lane you would drive in if you wanted to go south on US-I1. Draw a line in the lane you would drive in if your destination were Austin.
Fig 3.6B. Use or upward-pointing arrows in Fig 3.6A. Signing problem 1 in survey lA. problem 1, survey 2B.

N
W~E - -- -- -- -- 2 - 3 - -- -5 - -- -- -- -- -- -- -- -- -- -- -- -- -- -- -- -- -- -- -- -- -- -- -- -- -- -- -- -- -- -- -SOUTH NO~TH WEST
W Missoula
@ WEST ~ ®®® 1t ~~1t8 Seallle ® 1f 1f I ~ ~ Havre
- -- -- -- -- . - -- -- . - -- -- -- -- -- -- -- -- -- --Draw a line in the lane you would drive in if your destination were Havre •..
Fig 3.7 A. Use or partially-diagrammatic sign in problem 3, survey 2A.
17
1.9% said they would be in either lane 3 or 4. 1.9% had no answer.
- -- -- -- 2 - 3 - -- -- -- -- -- -- -- -9.6% - -- -- -- -- -- -- -- -- -- -- -- -- -- -- -- -- -- -- -- -- -- -- -- -- -- -WEST
(iV Missoula
SOUTH NORTH
@ WEST ~
1f 1f ®®®
1'; ~~lIa Seattla ® I ~ ~ Havre
- -- -- -- -- -- -- -- -- -- -- -- -- -- -- -- -- -- -- . Draw a line in the lane you would drive in if you wanted to go south on US-81.
Fig 3.7B. Use or partially-diagrammatic sign in problem 3, survey 2B.

18
- -- -- --- 2 --- -- -- -- -- -2.0%: 13.7%: - -- -- -- -- -- -- -- -- -- -- -- -- -- -- -- -- -- -- -- -- -- -- -WEST SOUTH
@ ~® NORTH Del Rio La d f':.:(
... ®
~ ~"'WEST @ : . ., ® ~ ~ ~ / EI Pa,. AusI~
- -- -- -- -- -- -- -- -- -- -Draw a line in the lane you would be driving in if your destination were Laredo.
Fig 3.SA. A fuDy.diagrammatic sign in problem 5, survey lA.
WEST @
Del Rio .... . . ----------
2.0% had no answer.
- -- -- -- 2 - 3 - -- -- -- -- -- -- 2.0% -- -- -- -- -- -- -- -- -- -- -- -- -- -- -- -- -- -- -- -- -- -- -- -- -- -SO LITH
~® NORTH
~ ®
~rAWEST @ If 10 ~
/ E~.Audm -----------
Draw a line in the lane you would drive in if you wanted to go north on IH-35.
Fig 3.SB. A fuDy·diagrammatic sign in problem 5, survey 2B.

W~E S
I I I I I I I
2
Draw a line in the lane you would drive in if your destination were the airport.
Fig 3.9A. Airport signing problem 4 in survey 2A.
2.0% answered either lane.
2
Draw a line In tile lane you would drive in if your destination were the airport.
Fig 3.9B. Airport signing problem 4 in survey 2B.
19

20
WEST
@ EI Paso
WEST
CW DelRio
NORTH
@®@
m
Concurrent Rout~
~® @@ (W
Fig 3.10. Map of a major problem location in San Antonio.

CHAPTER 4. ROADWAY SIGNING FOR AIRPORTS
DISCUSSION OF THE PROBLEM The researchers in this study have tried to identify
and address some of the problems unique to airport trailblazer signing. The problem, simply, is that an airline client who is unfamiliar with airport access routes, lacks adequate route information at major decision points on the way to the airport. This can lead to incorrect choices of routes and may delay the driver or create the need for assistance. These time-consuming delays are a critical factor for travelers trying to reach scheduled flights. Complaints have been received from various sources about trailblazer signs leading to airports that provide commercially scheduled flights in Texas. Accordingly, airport trailblazer signing for the major airports in Austin, Houston, San Antonio, Dallas, and Fort Worth was selected for further study.
The principal routes to the airport, those routes carrying significant airport-bound traffic, need to be ascertained. Importantly, routes originating from large hotels, central business districts, and convention centers should be included. Many of the trailblazer signs may be off the state highway system; consequently, coordination between the State Department of Highways and Public Transportation (SDHPT) and local officials is essential to developing an effective airport trailblazing system.
INVENTORY OF AIRPORT TRAILBLAZER SIGNS
A field survey resulted in a photo inventory of all the airport trailblazer signs at six major airports in Texas: Robert Mueller Municipal Airport (Austin), San Antonio International Airport, William P. Hobby Airport (Houston), Houston Intercontinental Airport, Love Field (Dallas), and Dallas-Fort Worth Regional Airport.
The following sections provide a general description of the trailblazer sign system for each airport. Airport Boulevard, tenninal, and other signs that may be interpreted by motorists as airport trailblazer signs are also included. The major signed routes, for each airport, are graphically illustrated. The illustrations for each airport identify the location of each airport trailblazer sign. The numbering sequence for these signs relates to one or more particular route(s).
ROBERT MUELLER MUNICIPAL AIRPORT, AUSTIN Interstate Highway 35 (IH-35) is the only portion of
the state highway system that has trailblazer signs to the airport. Other major highways, such as U.S. Highway 290 (US 290) and U.S. Highway 183 (US 183), have no trailblazer signs leading to the airport. Streets within the
21
central business district and under the city's jurisdiction are without trailblazer signs. Signed routes for the airport are graphically illustrated in Fig 4.1 and described below:
Route 1;* Northbound on IH-35 (lower level), exit onto Manor Road, and eastbound to the airport (sign numbers 1.1, 1.3 to 1.11).
Route 2: Northbound on IH-35 (upper level), exit onto Airport Boulevard southbound, and exit to Manor Road eastbound to the airport (sign numbers 1.2, 2.1, 3.6, 3.7, and 1.8 to 1.11).
Route 3: Southbound on IH-35, exit onto Airport Boulevard southbound, and then follow the signs provided in route 2 (sign numbers 3.1 to 3.7 and 1.8 to 1.11).
Route 4: Northbound on access road to IH-35, exit onto Airport Boulevard southbound, and then follow the signs provided in route 3 (sign numbers 4.1, 3.6 and 3.7, and 1.8 to 1.11).
Route 5: Northbound on Airport Boulevard, exit onto Manor Road eastbound to the airport (sign numbers 5.1, 5.2, and 1.8 to 1.11).
Route 6: Westbound on Manor Road to the airport (sign number 6.1).
Route 7: Eastbound on Martin Luther King Boulevard, exit to Pershing Drive northbound to the airport (sign number 7.1).
Figure 4.1 represents the signs and routes at the beginning of this study. Southbound IH-35 traffic was directed by Airport Boulevard signs (sign numbers 3.1 to 3.3 in Fig 4.1). This was confusing to some drivers who were unaware that the airport resides next to Manor Road and not Airport Boulevard. A second, but more important, problem was the northbound IH-35 route to the airport (sign numbers 1.1 to 1.11 in Fig 3.1). This route directed airport traffic to the lower level of IH-35. The exit to Manor Road required motorists to cross three lanes of traffic in a space of 250 feet, potentially a very dangerous maneuver (sign numbers 1.3 to 1.4).
Each of these situations has been corrected by the SDHPT. Additional trailblazer signs, in the form of airplane symbols, have been installed at numerous locations on IH-35. The signs directing airport traffic to Manor
*The new prescribed route for the lower level of IH-35 directs traffic to the Airport Boulevard exit and then continues as Route 4 as shown above.

22
AnChor lane
Ell Locations of Airport Signs
Fig 4.1. Signs for Robert Mueller Municipal Airport.
Robert Mueller Municipal Airport

Road (sign numbers 1.1 and 1.3) have been eliminated. although the trailblazer signs (numbers 1.4 to 1.11) still stand.
SAN ANTONIO INTERNATIONAL AIRPORT
San Antonio International Airport has trailblazer signs from the major highways around the airport, Interstate Highway Loop 410 (IH410) and U.S. Highway 281 (US 281). Five major routes exist. with two variations, for travel to the airport. They are descnbed below and illustrated in Fig 4.2A for central San Antonio and in Fig 4.2B for north San Antonio, where the airport is located.
Route lA: Exiting the central business district on US 281 northbound, exit onto Airport Boulevard northbound, which leads to the Airport Terminal (sign numbers 1.1 to 1.8).
Route IB: US 281 northbound, exit onto Terminal Drive. which leads to the Airport Terminal (sign numbers 1.1 to 1.5, and 1.9 to 1.12).
Route 2A: Southbound on US 281 (north of the airport), exit onto Terminal Drive (sign numbers 2.1 to 2.4).
Route 2B: Southbound on access road adjacent to US 281, exit onto Terminal Drive (sign numbers 2.5 and 2.4).
Route 3: Westbound on Loop IH-410, exit onto Airport Boulevard northbound, which leads to the airport (sign numbers 3.1 to 3.5, 1.7, and 1.8).
Route 4: Eastbound on Loop IH410, exit onto Airport Boulevard northbound, which leads to the airport (sign numbers 4.1 to 4.5, 1.7, and 1.8).
Group 5: Arterial streets, San Pedro Avenue and McCullough Avenue, northbound and enter access road adjacent to IH-410 eastbound until route 4 is reached (sign numbers 5.1 or 5.2,4.5, 1.7, and 1.8).
Similar to those in Austin, Airport Boulevard signs are used as signing for the San Antonio airport (sign numbers 1.4, 1.5. 4.1, and 4.2). Since the airport terminal in San Antonio is really off Airport Boulevard, it is not a major problem. However. as a matter of procedure, signing to Airport Boulevard should be avoided.
WIlliAM P. HOBBY AIRPORT, HOUSTON
William P. Hobby Airport is located in the southeast portion of the Houston metropolitan area, close to the interchange of Interstate Highways 45 (IH45) and Loop 610 (IH-6IO). Most of the signs are located close to the airport Six major routes leading to William P. Hobby Airport are described below and illustrated in Fig 4.3.
~E S
Towards San Antonio International
Airport
Central BUSiness District
LI Locations of Airport Signs
Fig 4.2A. Map 1 for San Antonio International Airport signs.
23
Route 1: Northbound on IH45, exit onto Airport Boulevard. westbound, which leads to the airport terminal (sign numbers 1.1 to 1.5).
Route 2A: Eastbound on south part of loop IH-6IO, exit onto IH-45 southbound, exit onto Broadway Boulevard southbound, which leads to the airport terminal (sign numbers 2.1 to 2.10).
Route 2B: Westbound on south part of loop IH-6IO, exit onto IH45 southbound, exit onto Broadway Boulevard southbound, which leads to the airport terminal (sign numbers 2.11 and 2.5 to 2.10).

24
CI)
~ e "2 a.. c ~
~ .r:. CI ::I
:§ Co) u ::z
San Antonio International
Airport
Terminal Dr
ToCBO
.. [!!J
III Locations of Airport Signs
Fig 4.2B. Map 2 for San Antonio International Airport signs.

288
III Locations of Airport Signs
;sf i'5" "C =
William P. Hobby Airport
~~:::::::::====::::::::.....J ~
Fig 4.3. Signs ror William P. Hobby Airport.
25

26
Route 3A: Eastbound on south part of loop IH-6l0, exit onto llI-45 southbound, exit onto Airport Boulevard westbound (sign numbers 2.1 to 2.4 ,3.1 to 3.4 and l.5).
Route 3B: Westbound on south part of loop IH-6l0, exit onto llI-45 southbound, exit onto Airport Boulevard westbound (sign numbers 2.11,3.1 to 3.4 and l.5).
Route 4A: Southbound on Telephone Road, exit onto Airport Boulevard eastbound, which leads to the airport entrance (sign numbers 4.1 to 4.3).
Route 4B: Northbound on Telephone Road, exit onto Airport Boulevard eastbound, which leads to the airport entrance (sign number 4.4).
Group 5: Other minor routes: (1) Eastbound on Fauna, which leads into Airport Boulevard eastbound, which leads to the airport entrance (sign number 5.1). (2) Northbound on Monroe, enter Airport Boulevard westbound, which leads to the airport entrance (sign number 5.2).
IH-45 and Loop IH-610 are the only state system highways with airport trailblazer signs. There are no trailblazer signs on U. S. Highway 59 (US 59), Interstate Highway 10 (IH-lO), or IH-45 south of Hobby Airport. Trailblazer signs on southbound IH-45 first appear after the motorist negotiates the Loop IH-610 interchange. There are no trailblazer signs leading from any of Houston's central business districts to Hobby Airport.
HOUSTON INTERCONTINENTAL AIRPORT
Houston Intercontinental Airport may be one of the best signed of those airports checked. All major roads close to the airport have adequate trailblazer signs. There are even guide signs beyond the central business district, although the airport is far north of that area. These signs are located on US 59 northbound (sign numbers 1.1 and l.2 in Fig 4.4). None of the other airports studied had guide signs at locations beyond major activity centers. The major routes for Houston Intercontinental Airport are described below and illustrated in Fig 4.4.
Routel: Northbound on US 59 (start south of downtown), stay on US 59 until entering Will Clayton Road, go westbound, which leads to the east entrance to the Airport (sign numbers 1.1 to 1.10).
Route 2 : Southbound on US 59, exit to Will Clayton Road westbound. which leads to the east entrance to the Airport (sign numbers 2.1 to 2.3, 1.9, and 1.10).
Route 3A: Northbound on IH-45/U. S. Highway 75 (US 75), exit onto North Belt Drive eastbound, which leads to the south entrance (Kennedy Boulevard)
(sign numbers 1.1 to 1.11). Route 3B: Northbound on access to IH-45/US 75,
exit onto access to North Belt Drive eastbound, which leads to the south entrance (Kennedy Boulevard) (sign numbers 3.9 to 3.11 and 3.3 to 3.8).
Route 4 : Southbound on IH-45/US 75, exit onto North Belt Drive eastbound, which leads to the south entrance (Kennedy Boulevard) (sign numbers 4.1 to 4.3 and 3.3 to 3.8).
Route 5 : Eastbound on North Belt Drive and exit onto Kennedy Boulevard northbound (south entrance to the airport) (sign numbers 5.1 and 5.2).
It should be mentioned that signing inside the terminal area was difficult to follow and understand. First, the distances between the signs were too short, which resulted in inadequate reading time; second, there was too much information, making it difficult to read and follow. These signs are outside the domain of the SDHPT, although many survey respondents who had difficulty with internal airport signing did not recognize this fact
DALLAS LOVE FlEW AIRPORT Undoubtedly, Dallas Love Field airport is the most
difficult airport to locate for a motorist unfamiliar with the area. There is satisfactory signing close to the airport, but more signs could be provided at key points on the roadway network farther away from the airport. Basically, there are four major routes leading to Love Field Airport. These are outlined below and illustrated in Fig 4.5.
Route 1: Northbound on IH-35 East, exit onto Mockingbird Lane eastbound, which leads to the airport entrance (sign numbers 1.1 to 1.8).
Route 2A: Southbound on IH-35 East, exit onto Mockingbird Lane eastbound, which leads to the airport entrance (sign numbers 2.1, 2.2, and l.3 to 1.8).
Route 2B: Southbound on State Highway 183 (SH 183 or John W. Carpenter Frwy), exit onto Mockingbird Lane eastbound, which leads to the airport entrance (sign numbers 2.3 and 1.3 to 1.8).
Route 3A: Northbound on Harry Hines Boulevard, exit onto Mockingbird Lane eastbound, which leads to the airport entrance (sign numbers 3.1 and 1.5 to 1.8).
Route 3B: Southbound on Harry Hines Boulevard, exit onto Mockingbird Lane eastbound, which leads to the airport entrance (sign numbers 3.2 and 1.5 to l.8).

.. locations of Airport Signs
Houston InlelContinentaJ
Airport
Kennedy Blvd
Fig 4.4. Signs for Houston Intercontinental Airport.
27

28
Dallas Love Reid
l1li locations of Airport Signs
Fig 4.5. Signs for Dallas Love Field Airport.

RQute 4A: NQrthbound Qn Dallas NQrth TQllway, exit QntQ MQckingbird Lane westbQund, which leads to' the airport entrance (sign numbers 4.1 to 4.5 and 1.8).
RQute 4B: SQuthbound Qn Dallas NQrth TQllway, exit QntQ MQckingbird Lane westbQund, which leads to' the airport entrance (sign numbers 4.6, 4.7, 4.3 to 4.5, and 1.8).
Still, there is sufficient signing at the decisiQn points Qn the routes that are currently signed (see Fig 4.5). The highways clQsest to' Love Field are well signed. From, fQr example, IH-35E and Dallas NQrth TQllway, the signing is adequate, but these are the Qnly highways with airport signs. These signs are adequate fQr mQtQrists with a map, Qr with a general idea Qf where LQve Field is 10'cated.
DAllAS·FORT WORTH REGIONAL AIRPORT The size Qf the Dallas-FQrt WQrth RegiQnal AirpQrt
requires a very large signing area, because Qf its locatiQn between twO' metrQpolitan areas and in the general vicinity Qf Qver 100 gQvernmental jurisdictiQns. NO' Qther trailblazing system studied in this research cQvered such a large area. This airport had Qn average mQre than twice as many airport trailblazer signs as any Qf the five Qther airports studied. Trailblazer signs from Dallas and eastward areas are shQwn in Fig 4.6A and include rQutes 1, 2A, 2B, 3, and 4. Trailblazer signs fQr FQrt WQrth and westward areas invQlve rQutes 5 thrQugh 7 and are illustrated in Fig 4.6B.
RQutel: NQrthbound Qn IH-35 East, exit QntQ Carpenter Freeway (SH 183), exit QntQ Airport Freeway westbound, which leads to the SQuth entrance Qf the AirpQrt (sign numbers 1.1 to 1.15).
RQute 2A: NQrthbound Qn IH-35 East, exit Qnto Carpenter Freeway (SH 183), enter SH 114 northbound, which merges with Northwest Highway and leads to the nQrth entrance (sign numbers 1.1 to 1.6 and 2.1 to 2.7).
RQute 2B: NQrthbQund Qn access rQad adjacent to' State Highway 114 (SH-114) nQrthbound (sign numbers 2.8 to' 2.10).
RQute 3: SQuthbQund Qn IH-35 East, exit QntQ State Highway 121 (SH-121) southbQund, which leads to' the nQrth entrance (sign numbers 3.1 to 3.10 and 2.7).
RQute 4: NQrthbQund Qn LemmQn Street (apparently fQr users frQm Dallas LQve Field), enter NQrthwest Highway westbQund, which goes all the way to' the nQrth entrance (sign numbers 4.1, 4.2, and 2.2 to 2.7).
29
RQute 5A: NQrthbQund Qn AirpQrt Freeway (frQm dQwntown FQrt WQrth), which goes all the way to' the south entrance. Airport Freeway merges tempQrarily with east part Qf Interstate Highway LQQP 820 (1H-820) (sign numbers 5.1 to' 5.12 and 1.12 to' 1.15).
RQute 5B: Eastbound Qn nQrth part Qf Loop IH-820, exit QntQ AirpQrt Freeway eastbQund, which leads to' the SQuth entrance (sign numbers 5.13 to' 5.16, 5.7 to 5.12, and 1.12 to 1.15).
RQute 6: NQrthbound Qn SH 121 to' nQrth entrance (sign numbers 6.1 to 6.7 and 2.7).
RQute 7: EastbQund Qn Interstate Highway 30 (lH-30), exit nQrthbQund Qn State Highway 360 (SH-360), enter AirpQrt Freeway eastbQund, which leads to the SQuth entrance (sign numbers 7.1 to 7.7, 5.12, and 1.12 to' 1.15).
MQst Qf the highways in the Dallas and the FQrt WQrth regiQns had trailblazer signs, with Qne majQr exceptiQn, IH-30 between the twO' cities. FrQm Dallas there are nO' signs Qn 1H-30, and frQm FQrt WQrth there is Qnly Qne sign (7.1 in Fig 4.6A), immediately befQre the exit to SH 360 in Arlington.
There were few airpQrt trailblazer signs inside Qf Loop 1H-820 in FQrt WQrth, and nO' trailblazer signs at the majQr interchange between IH-35W and IH-30 (the "mixmaster"). The Qnly highway in FQrt WQrth where airport signs prQvide guidance all the way to the airport is SH 121 (Airport Freeway). The Dallas dQwntown streets are nQt signed, except fQr the sign Qn Elm Street southbound in dQwntQwn Dallas at the access to 1H-35.
TYPES OF AIRPORT SIGNS The types Qf highway signs used fQr airpQrt
trailblazing range frQm textual signs Qn and Qff the state highway system to symbol signs Qn and Qff the system to textual guide signs fQr airpQrt boulevards. The sign types fQr each Qf the numbered signs in the previQus figures are categQrized fQr each Qf the airpQrts in Tables 4.1 thrQugh 4.6. Typical "text highway" signs are illustrated in Figs 4.7 and 4.8. Overall, these represent the largest number Qf highway trailblazer signs. Only HQustQn HQbby AirpQrt uses mQre symbQl signs than text signs Qn highways. "SymbQl highway" signs are illustrated in Figs 4.9 and 4.10. (The new type Qf symbol sign used Qn the highway system in Austin, nQt listed in Table 4.1, is shQwn in Fig 4.11.) Several types Qf "text local rQad" signs are shQwn in Fig 4.12. Nearly all IQcal rQad trailblazer signs use this fQrm. "Symbol local road" signs are similar to the illustratiQns in Fig 4.10 and are fQund in a cQuple Qf IQcatiQns near HQustQn HQbby and twO'

30
121
t c.. n;
.~ ~ ~
DaliaslFt Worth E Regional Airport
------------~----------------~3Dr_----------_mr_---------
II! Locations of Airport Signs
Fig 4.6A. Signs west or Dallas-Fort Worth Regional Airport.

::::l CD 3 ~ o· ::::l ~
~ OaliasIFt Worth -c: Regi onal
Airport
31
Airport Fwy
Em Locations of Airport Signs
Fig 4.6B. Signs east of Dallas-Fort Worth Regional Airport.

32
TABLE 4.1 CATEGORIZATION OF AUSTIN'S MUELLER AIRPORT TRAILBLAZER SIGNS
Sign Text Text Local Symbol Symbol Airport Number Highway Roads Highway Local Road Blvd Other
1.1 X 1.2 X 1.3 X 1.4 X 1.5 X 1.6 X 1.7 X 1.8 X 1.9 X 1.10 X 1.11 X 2.1 X X 3.1 X 3.2 X 3.3 X 3.4 X 3.5 X 3.6 X 3.7 X 4.1 X 5.1 X 5.2 X 6.1 X 7.1 X
All (24) 4 13 2 0 4 2
TABLE 4.2 CATEGORIZATION OF DALLAS LOVE FIELD TRAILBLAZER SIGNS
Sign Text Text Local Symbol Symbol Airport Number Highway Roads Highway Local Road Blvd Other
1.1 X 1.2 X 1.3 X 1.4 X 1.5 X 1.6 X 1.7 X 1.8 X 2.1 X 2.2 X 2.3 X 3.1 X 3.2 X 4.1 X 4.2 X 4.3 X 4.4 X 4.5 X 4.6 X 4.7 X
All (20) 9 10 0 0 0 1

33
TABLE 4.3 CATEGORIZATION OF DFW REGIONAL AIRPORT TRAILBLAZER SIGNS
Sign Text Text Local Symbol Symbol Airport Number Highway Roads Highway Local Road Blvd Other
1.1 X 1.2 X 1.3 X 1.4 X 1.5 X 1.6 X 1.7 X 1.8 X 1.9 X 1.10 X 1.11 X 1.12 X 1.13 X 1.14 X 1.15 X 2.1 X 2.2 X 2.3 X 2.4 X 2.5 X 2.6 X 2.7 X 2.8 X 2.9 X 2.10 X 3.1 X 3.2 X 3.3 X 3.4 X 3.5 X 3.6 X 3.7 X 3.8 X 3.9 X 3.10 X

34
TABLE 4.3 (CONTINUED) CATEGORIZATION OF DFW REGIONAL AIRPORT TRAILBLAZER SIGNS
Sign Text Text Local Symbol Symbol Airport Number Highway Roads Highway Local Road Blvd Other
4.1 X 4.2 X 5.1 X 5.2 X 5.3 X 5.4 X 5.5 X 5.6 X 5.7 X 5.8 X 5.9 X 5.10 X 5.11 X 5.12 X 5.13 X 5.14 X 5.15 X 5.16 X 6.1 X 6.2 X 6.3 X 6.4 X 6.5 X 6.6 X 6.7 X 7.1 X 7.2 X 7.3 X 7.4 X 7.5 X 7.6 X 7.7 X
All (67) 57 4 0 0 5

35
TABLE 4.4 CATEGORIZATION OF HOUSTON HOBBY AIRPORT TRAILBLAZER SIGNS
Sign Text Text Local Symbol Symbol Airport Number Highway Roads Highway Local Road Blvd Other
--1.1 X 1.2 X 1.3 X 1.4 X 1.5 X 2.1 X 2.2 X 2.3 X 2.4 X 2.5 X 2.6 X 2.7 X 2.8 X 2.9 X 2.10 X 2.11 X 3.1 X 3.2 X 3.3 X 4.1 X 4.2 X 4.3 X X 4.4 X 5.1 X
All (24) 2 9 5 2 5 2

36
TABLE 4.5 CATEGORIZATION OF HOUSTON INTERCONTINENTAL AIRPORT TRAILBLAZER SIGNS
Sign Text Text Local Symbol Symbol Airport Number Highway Roads Highway Local Road Blvd Other --
1.1 X X 1.2 X X 1.3 X X 1.4 X X 1.5 X X 1.6 X X 1.7 X X 1.8 X X 1.9 X X 1.10 X X 2.1 X X 2.2 X 2.3 X 3.1 X 3.2 X X 3.3 X X 3.4 X X 3.5 X X 3.6 X X 3.7 X X 3.8 X 3.9 X X 3.10 X 3.11 X 4.1 X 4.2 X 4.3 X 5.1 X 5.2 X
All (29) 23 0 4 0 0 2

37
TABLE 4.6 CATEGORIZATION OF SAN ANTONIO INTERNATIONAL TRAILBLAZER SIGNS
Sign Text Text Local Symbol Symbol Airport Number Highway Roads Highway Local Road Blvd Other
1.1 X X 1.2 X 1.3 X X 1.4 X 1.5 1.6 X 1.7 X 1.8 X 1.9 X 1.10 X 1.11 X 1.12 X 2.1 X 2.2 X 2.3 X 2.4 X 2.5 X X 3.1 3.2 X X 3.3 3.4 3.5 X 4.1 4.2 4.3 X 4.4 4.5 X 5.1 X 5.2 X
All (29) 17 2 0 0 8 2

38
EXPRESS LANES ...........•.•....•.. :;:;.
Airport Blvd
51 s t - Cam e ron R d
Austin
I EXIT 36
CollegeAve
Airport Blvd
1 MILE
, Houston
~ Airport Blvd
NEXT RIGHT
San Antonio
Fig 4.7. Examples of highway airport signs with text prompts.
LBJ Li~rary
Municipal Airport -+
t
Ilill I ~r :::::
IIIII
Austin
L..... IfEXAfl ~ UU
D/FWAIRPORT NEXT LEFT
:::: t
I I
f jill ~~~\
I ~) [~
I r ::~
1:.:
Dallas
Fig 4.8. Other highway airport signs with text prompts.

Airport 7J Blvd
Fig 4.9. Example of airport trailblazing highway symbol sign.
+ II
Austin
+ D/FW Airport
Dallas
+ I.A.H.
t Houston
+ +-
;::"
+ Hobby· Airport
Fig 4.10. Other airplane symbol signs.
39

40
Airport Blvd. 51 st. Street Cameron Rd.
EXIT 1 MILE
Austin
"' ::::::::::::::
~I
Fig 4.11. Example of new Austin trailblazer signs.
MUNICIPAL t AIRPORT
Austin
W.P. HOBBY AIRPORT
t Iii
2 Houston
Dallas Love Field Airport -+
::: Dallas
Fig 4.12. Local airport trailblazing signs.

locations near Austin Mueller as part of the terminal parking signs.
AIRPORT USER SURVEYS Following the inventory of airport trailblazer signs, a
survey of airline passengers was conducted to evaluate the adequacy of the trailblazer signs. Surveys were conducted at Austin Mueller Airport, San Antonio International Airport, DFW Regional Airport, and Houston Intercontinental Airport. There were a total of 891 respondents. A summary of the surveys and responses is shown in Appendix C. The surveys were designed to identify the respondents' experience with the airport (questions 1 and 2), the type of transportation used to the airport (question 3), directional assistance information (question 4), problems with locating the airport (questions 5 and 6), and the respondents sex (question 7). The surveys were completed in two phases. The surveys in the first phase, completed in July and August 1989, were directed at all airline passengers. Nearly 100 passengers from each airport were surveyed. Following completion of this survey, it was determined that the rental car customer should be targeted as a survey respondent. (The phase one surveys generated only 34 responses from persons arriving at the airport by rental car.) This group of motorists is most likely to be unfamiliar with the surrounding area. All surveys conducted in the second phase, completed in July, August, and September 1990, were directed at rental car customers. Total responses for each of the phases are summarized in Table 4.7.
TABLE 4.7 SUMMARY OF AIRPORT SURVEY RESPONSES
Airport
Austin Dallas/Ft. Worth Houston Intercont San Antonio All Airports
Phase I Surveys
100 100 101 99
400
Phasell Surveys
118 131 109 133 491
Total
218 231 210 232 891
As shown in Fig 4.13, the permanent residences of the the respondents were fairly evenly distributed between Texas residents (45 percent) and non-Thxas residents (55 percent), including the 5 percent foreign residents.
As illustrated in Table 4.8, most of the survey respondents have been to the airports more than five times (70 percent), about 17 percent more than once but less than fi ve times, and 13 percent for the first time.
The combined survey results for type of transportation used to arrive at the airport are biased to include a greater number of rental car customers. Consequently,
• From Texas iii Non-Texas State o Foreign Country
Fig 4.13. Residence of survey respondents.
TABLE 4.8 SURVEY PARTICIPANTS' FREQUENCY TO THE AIRPORTS
(PERCENTAGE)
Airport
Austin Dallas/Ft. Worth Houston Intercont San Antonio All AiJports
First Time
13.8 8.6
10.5 17.3 12.6
Less than 5 Times
18.3 14.2 18.1 18.6 17.3
More than 5 Times
67.9 77.2 71.4 64.1 70.1
41
they account for about 59 percent of the total survey responses (see Fig 4.14). The plane response represents airline passengers who were awaiting transfer flights and the airport where they were surveyed was not their intended destination. The other category includes persons arriving by bus, courtesy van, taxi, or limousine, for the most part
Considering only the responses from the phase one surveys produces the distribution shown in Fig 4.15.
Similar to the type of transportation used in the previous question, finding the location of the airport is also biased by rental car responses. Despite this bias,

42
4.5%
11.2%
• Car-Parked
EI Car-Drop off
0 Rental Car Plane ~ Other 0
Fig 4.14. Transportation type used to arrive at the airport.
50 Guidance to Airport • Street Map
40 lEI Oral Directions
- 0 Written Directions
C [21 Highway Signs ~ 30 D Other 0 c.
~ 20 ~
10
• Car-Parked lEI Car-Drop off [2J Rental Car ~ Plane 0 Other
Fig 4.15. Transportation used to arrive at airportPhase I survey.
43.9
Fig 4.16. Methods used to locate airport.

individuals responsible for getting themselves to the airport generally were already familiar with its location. As indicated in Fig 4.16, about 44 percent of the respondents were familiar with the location of the airport. Nearly 22 percent required the use of a map or of written or oral directions. Thirty-four percent depended entirely on road signs. In practice, all respondents used road signs to assist them in finding the airport. Persons familiar with the airport still used airport signs as a reference point
Excluding persons who were on transfer flights and had no prior experience with the airport, most respondents (97 percent) reported no difficulty finding the airport. As shown in Table 4.9, respondents had the least difficulty with DFW Regional Airport and the most difficulty with the Austin Mueller Airport.
TABLE 4.9 PERCENT OF RESPONDENTS HAVING
DIFFICULTY LOCATING THE AIRPORT
Airport Yes No -Austin 5.0 95.0 Dallas/Ft Worth 1.1 98.9 Houston Intercont 4.9 95.1 San Antonio 1.9 98.1 All AiIports 3.2 96.8
Interestingly, while only 3 percent of the respondents had problems locating the airport, slightly more than 12 percent rated the airport trailblazer signs as poor. Respondents' ratings for the airports are shown in Table 4.10. In a manner similar to that in the previous table, DFW Regional Airport received the best ratings (66.5 percent excellent and only 3.8 percent poor). Austin, on the other hand, received the lowest marks (only 14.5 percent excellent and 17.5 percent poor).
TABLE 4.1. RATING OF GUIDE SIGNS FOR AIRPORTS (PERCENTAGE)
Airport
Austin Dallas/Ft Worth Houston Intercont San Antonio All Airports
Poor
17.5 3.8
17.0 11.3 12.3
Adequate
68.0 29.7 60.2 53.8 52.3
Excellent 14.5 66.5 22.8 34.9 35.5
The same percentage of Texas and non-Texas residents rated the trailblazing sign system poor, as shown in Table 4.11. Non-Texas residents, however, gave higher marks for airport trailblazing than Texas residents.
TABLE 4.11 PERCENTAGE RATING OF GUIDE SIGNS BY
RESIDENCY
Texas Non·Texas Rating Residents Residents
Poor 12.1 12.1 Adequate 59.1 46.8 Excellent 28.8 41.1
43
With respect to infrequent users of the airport, overall there was a slight increase in the poor rating and a slight decrease in the excellent rating, as shown in Table 4.12. This was generally true for all of the airports.
TABLE 4.12 RATING OF SIGNS FOR INFREQUENT AIRPORT VISITORS
(PERCENTAGE)
Airport Poor Adequate Excellent Austin 16.9 67.8 15.3 Dallas/Ft Worth 9.1 24.2 66.7 Houston Intercont 24.4 56.1 19.5 San Antonio 13.8 53.9 32.3 All AiIports 16.2 53.5 30.3
Respondents who had difficulty locating the airport were asked to describe the problem they encountered. (A number of persons who had no problem finding the airport still volunteered information about problems they believed motorists unfamiliar with the area would have in locating the airport) Specific comments included the following:
• There are not enough signs, need earlier advance signs, more signs further away from the airport, and more signs in central business districts;
• Signs are too small; and • Signs are confusing and misleading. Additionally,
a number of complaints were received concerning the signing with the airport facility.
A lack of signs in Austin was cited by respondents for some specific areas including northbound traffic on Highway 183, northbound Airport Boulevard prior to Manor Road, and further away from the airport on southbound IH-35. With respect to DFW Regional Airport, some respondents indicated 100 few signs on IH-635, Highway 183 from Fort Worth, IH-30 leading to state highway 360, and from downtown locations. In Houston, complaints were made about a lack of signs on FM 1960, US 59 to Beltway 8, interchanges of IH-610 and US 59, and the downtown area. Finally, some respondents indicated a need for more signs on westbound Loop IH-410 in San Antonio, ill-l0, the

44
IH-41O and IH-lO interchange, and on highway 281 northbound. Several respondents complained about the size of the signs, particularly off the state highway system. Additionally, concern was expressed about inadequate signing near construction areas.
The confusion or misleading information responses related to signing for airports and airport boulevards. Many respondents believe that airport boulevard signs are trailblazers, when in some instances they are not Route lA in San Antonio (Figs 4.2A and 4.2B), for example, begins its signing for the "Intl Airport" (sign numbers 1.1 to 1.3), but at signs number 1.4 and 1.5 there are signs for "Airport Blvd." Many of the respondents indicated they did not know whether this was the proper exit Fortunately, this confusion should not prevent a person from finding the airport If persons exit at Airport Boulevard, sign number 1.6 provides them with a directional sign to the airport. If they do not exit on Airport Boulevard, they encounter an airport trailblazer sign just prior to the IH-410 interchange giving direction to the airport. Prior to the recent changes in Austin, southbound 1H-35 traffic was directed to Airport Boulevard, only. Northbound IH-35 traffic created similar problems. Sign number 1.1 for "Municipal Airport" directs traffic to the middle lane that leads to the lower level. Sign number 1.2, however, is for "Airport Blvd" and directs traffic to the upper level. Sign 1.3, on the lower level, again signs for "Municipal Airport." Similar to the situation in San Antonio, selection of either route will lead the motorist to other signs leading to the airport. Generally, the confusion experienced by the motorist is only temporary but evidently frustrating. The situation is similar for some routes at Houston Hobby Airport.
FINDINGS AND RECOMMENDATIONS TRAILBLAZING AT MAJOR AND INTERSTATE HIGHWAYS Overall, signing on the highways for all the airports
surveyed was adequate, particularly when in close proximity to the airports. Additional signing, however, is needed at major interchanges farther away from the airports. It is hard to create general recommended practices or guidelines for providing airport signs on highways. Judgement must be used to determine which interchanges should be furnished with airport signs. However, if there is a loop around the city the airport is within, the loop should be especially well signed, particularly at major interchanges. An example is Loop IH-4lO in San Antonio. This loop has proper signing close to the airport but needs airport signs at interchanges farther away, such as at interchanges with IH-35 and with IH-I0, as noted previously.
AIRPORT SIGNING ON WCAL ROADS
In general, the major local roads close to the airport are usually signed as a part of the route from the highway to the airport. Local motorists sometimes prefer to use local roads to the airport, since they often are the shortest route to the airport-for example, Harry Hines Boulevard to Love Field (Dallas), and Red River Street combined with Martin Luther King, Jr., Boulevard to Robert Mueller Municipal Airport (Austin).
The trailblazer signs on the local roads are more difficult to observe, principally because of the multitude of other advertising signs. There are some examples of the signs being too small or in an obscure location. Local trailblazer signs need to be in a prominent location, easily visible to a motorist unfamiliar with the area.
AIRPORT SIGNING AT STREETS IN CENTRAL BUSINESS DISTRICTS
A further study of the signing in central business districts (COBs) may be useful. Data from the surveys indicate a need for better signing from downtown areas. An origination and destination study would provide more accurate details for downtown trailblazing.
An efficient system of trailblazers from the COB begins with careful identification of boundary streets based on origination and destination data. These boundary streets, plus a few other major streets, would be the only streets in the central business district with airport trailblazer signs. These streets should be selected in such a way that, whichever direction a motorist goes from the downtown area, he/she would cross or intersect one of the chosen signed streets. The basis for such a system is that a motorist should see an airport sign at least once on his/her way out of the downtown area. Once a sign for an airport appears, there should be continuous signing along the selected route, including every major decision point and some key locations for confmnation signs until the motorist has reached the airport terminal area. It is usually enough to direct traffic into one or two signed routes from the central business district to an airport Using such a methodology for Austin would result in the following boundary designations:
(1) North/south streets-(a) Congress - Direct users into 1st or 11th
Street and then IH-35 (two directional), (b) Guadalupe - Direct users into 1st Street and
then IH-35 (south direction), (c) Lavaca - Direct users into 11th Street and
then IH-35 (north direction), (d) Red River - Direct onto 5th or 11th Street
and then IH-35 (north and some south directions);

(2) East/west streets-(a) 1st Street - Direct traffic onto IH-35 north
bound (east direction). (b) 11th Street - Direct traffic onto IH-35
northbound (east direction). (c) Martin Luther King Boulevard (MLK) - Di
rect traffic eastbound. enter Pershing Drive northbound (two-directional); and
(3) Other Airport Signs-
(a) At 5th Street and Red River. direct users onto the airport route on IH-35 northbound.
(b) At 12th Street and Lavaca. direct users in northern CBD onto the airport route on MLK eastbound. and
(c) At 15th Street and Congress. direct users in northern CBD onto airport route on MLK eastbound.
AIRPORT SIGNING SYMBOLS A more extensive use of symbolic language to con
vey airport routing directional information to roadway users is highly recommended. The most commonly used
45
symbol for airport signs is a silhouette of an airplane. Usually an arrow underneath this icon is used to indicate the direction of the route. It seems that people easily understand and react to these airport signs. Many cities have successfully used these types of signs for their airports. There is a problem. however. when there is more than one airport in the district; but a smaller. supplemental sign with letters identifying the specific airport should eliminate that confusion. In Houston. abbreviations for the airport name are used to distinguish the use of silhouette signs for Hobby from those for Houston Intercontinental Airport.
Another problem with the use of silhouette signs is that drivers frequently interpret the airplane symbol as a directional arrow. This is one of the problems tested in the user perception surveys and was discussed in the previous chapter (see Figs 3.9A and 3.9B).

CHAPTER 5. CONCLUSION
RECOMMENDATIONS Generally, roadway signing in Texas is considered
adequate. Surveys from visitors' information booths commented on how well Texas is signed. The number of problem signs, as a percentage of total signs, is small; however, given that an improperly signed exit or destination could have serious consequences, it is useful and necessary to monitor potential signing problems.
The use of road maps could greatly reduce potential signing problems. A road map, either local or interstate, could prepare the highway user for what to expect ahead and give him or her more flexibility in finding the necessary road infonnation. Unfortunately, many roadway users do not work with maps; but for those who do use maps, it is important to coordinate the information on maps with that shown on signs.
Whether or not roadway users employ maps, it is evident that there are parts of the existing signing system that are confusing and could be improved. Improved signing would result from consistency in the type of arrows used in lane assignment; i.e., the number of arrows should equal the number of lanes. Another important factor is guide signs placed in advance of all exits and lane splits.
The design of a roadway sign should be given careful study. The signing system introduced in Chapter 2, based on a hierarchy of information, should be considered. Each level in this hierarchy could have a unique style and color code to provide instant recognition of type. With this kind of system, it is easier for drivers to distinguish between signs for distant and local destinations. The amount of infonnation the roadway user must respond to would decrease if he or she could easily focus on signs, for example, of a distant location. Related to this, consideration should be given to reductions in concurrent routing. Additional research is needed in this area.
Many of the signing types tested in the surveys should be considered when evaluating options for a specific location. When the geometry is complex and other infonnation is minimal, diagrammatic signs are a good choice in advance of an optional exit lane or an exit lane that splits. When too much information is to be conveyed, the diagrammatic sign loses its informational strength by confusing the roadway user. The research indicates that signs with pointed arrows tilting upward are favored at locations where a lane split occurs, whether it is an optional through lane or a lane on an exit ramp. This type of sign produced favorable results in the survey and received favorable comments from persons completing and discussing the surveys.
46
The study of trailblazer signs for airports indicates that while signing is adequate on highways in close proximity to the airports, signing at major highway interchanges farther away from the airport needs improvement. The solution to this problem, again, could be enhanced by the use of a map. More extensive use of airplane symbol signs for airport trailblazers is recommended.
FUTURE RESEARCH The major objectives of this study were to (1) ana
lyze the roadway user's understanding of existing signing on Texas highways and provide recommendations for improving signing problems and (2) study airport trailblazing for selected metropolitan areas and recommend procedures for improvement, if necessary. Although the study focuses on signing problems, it is important to note that most highway users have few problems with Texas highway signing. The commitment to investigate problems, in light of relatively few complaints, is indicative of the Texas State Department of Highways and Public Transportation's commitment to the best possible highway signing system.
The broad subject of roadway-user infonnation and the infmite number of specific signing problems create a broad range for future studies. Additional researchfrom further user perception analysis of existing signs to studies of the systematical approach to the signing system presented in Chapter 2-may provide important infonnation and is warranted.
A study of the basic signing system would be useful for comparing various guide signing types. The signing system with a hierarchy of infonnation could yield interesting results if it were investigated. Important contributions for a signing system in the U.S. could be obtained from an analysis, for example, of highway signing in West Gennany. European signing was internationalized by the 1968 "International Convention on Signing and Road Marking" in Vienna, Austria. The hierarchical signing system has been implemented and studied in several countries. An analysis of this system may provide infonnation on the strength of, as well as improvements that can be made on, the signing in Texas.
Additional information on road map utilization or future in-vehicle guidance systems may be especially valuable. Research should address basic questions, such as: Are maps frequently used? Can utilization of maps or invehicle guidance systems reduce confusion at complex interchanges? Do maps convey accurate and updated infonnation? These are important questions to address in future research.

A detailed analysis of the relationship between accident data and signing problems is warranted. Recent studies already indicate a link between improper signing and highway fatalities. Is it possible that special signing, such as warning signs at locations with high accident frequencies, may reduce the frequency and severity of accidents at specific locations? This is an important area worthy of further research.
47
Finally, research into concurrent routing may be productive. Much of the information overload associated with complex interchanges is a product of concurrent routing. Eliminating or reducing concurrent routes may be the most cost-effective method for improving roadway information systems.

REFERENCES
1. King, Gerhart E, "Application of Guidance and Navigation Systems," Transportation Research Record 1027, Driver Information Needs and Visibility of Traffic Control Devices, 1985.
2. Wootton, H. J., and R. S. Burton, "Improving the Accuracy of Information on Direction Signs," Transportation Research Record 782, Human Factors and Motorist Information Needs, 1980.
3. Waldeland, Rolv R., Characteristics of Traffic (Trafikantenes Karakteristika), Department of Civil Engineering, Rogaland Regional College, Norway, 1988.
4. American Association of State Highway and Transportation Officials, A Policy on Geometric Design of Highways and Streets, 1984.
5. Ambose, C., and E. R. Hoffmann, "The Necessity for Traffic Sign Installations as Judged by Local Government Engineers in Melbourne," Australian Road Research 17(3), Department of Mechanical and Industrial Engineering, University of Melbourne, Parkville, Australia, September 1987, pp 185-194.
48
6. Cooper, B. R., "Comprehension of Traffic Signs by Drivers and Non-Drivers," Transportation and Road Research Laboratory, Research Report 167, Department of Transport, Berkshire, United Kingdom, 1989.
7. King, G. E, and H. Lunenfeld, "Development of Information Requirements and Transmission Techniques for Highway Users," National Cooperative Highway Research Program Report 123, 1971.
8. Center for Transportation of the Council of State Governments, California, "Study Links Signage and Highway Fatalities," Comments by Center Director Robert A. Krause, Civil Engineering Journal, December 1989, pp 16-17.
9. Texas State Department of Highways and Public Transportation, 1980 Texas Manual on Uniform Traffic Control Devices for Streets and Highways, Revision No.3, Austin, Texas, February 17,1984.
10. Dewar, Robert, "Criteria for the Design and Evaluation of Traffic Sign Symbols," Transportation Research Board, Department of Psychology, University of Calgary, Alberta, Canada, 1988.

APPENDIX A
DIRECTORY OF POTENTIAL HIGHWAY SIGNING PROBLEM LOCATIONS
49

50
APPENDIX A.I. DIRECTORY OF POTENTIAL SIGNING PROBLEM LOCATIONS IN FORT WORTH
IDENTIFIED PROBLEM LOCATIONS IN DISTRICf 2 (Ff.WORTH)
Citizen Survey Input
4 3 3 2 2 2 1 1 1 1 1 1 1 1 1 1 1 1 1 1 1 1 1 1 1 1 1 1 1 1 1 1 1 1
SDHPTlnput
D D D D D
LOCATION
IH-35W NB to US-287 NB IH-35W SB to IH-30 EB US-287(Cont) SB ( @ IH-35W split) IH-35W NB to IH-20 WB j(IH-820) IH-35W NB to IH-30 EB IH-30 EB to IH-820 NB (EL) IH-20 EB to IH-35 W NB IH-20 EB to IH-820 (SL) EB IH-20 EB to SH-183 NB IH-20 WB to IH-35 W NB IH-20 WB to IH-820 (EL) NB IH-20WB to SH-183 IH-30 EB to Camp Bowie NB IH-30 WB to University IH-30 WB to IH-35W NB IH-30 WB to Lamar Blvd IH-30 WB to Mix-master WB IH-30 WB to University IH-30 (Cont) EB @ IH-35 W IH-30 (Cont) WB @ IH-35 W IH-35W NB to IH-820 (NL) EB IH-35W SB to Berry Street IH-35W SB to IH-30 WB lli-35 W SB to lli-820 (NL) EB IH-35W SB to IH-820 (NL) WB IH-35W SB to IH-820 (SL) WB IH-35W (Cont) SB @ IH-30 IH-35W (Cont) SB @ IH-820 (NL) IH-820 (EL) NB to SH-26 EB IH-820 (EL) SB to IH-30WB IH-820 (NL) EB to IH-820 (EL) NB SH-121 SB to IH-35W SB US-287 (Cont) SB @ IH-30 University SB to IH-30 EB IH-20 EB to SH-157 SB IH-35W NB to IH-820 (NL) WB IH-35W NB to IH-30 WB IH-35W NB to SH-121 IH-35W SB to SH-121

APPENDIX A.2. DIRECTORY OF POTENTIAL SIGNING PROBLEM LOCATIONS IN SAN ANTONIO
IDENTIFIED PROBLEM LOCA nONS IN DISTRICf 15 (SAN ANTONIO)
Citizen Survey Input
7 5 3 3 2 2 2 2 2 2 2 2 2 2 1 1 1 1 1 1 1 1 1 1 1 1 1 1 1 1 1 1 1 1 1 1 1 1 1 1 1 1 1 1 1
SDHPT Input LOCATION
1lI-1O (Coot) WB @ US-90 WB 1lI-35 SB to 1lI-41O (NL) WB 1lI-1O EB to 1lI-37 SB 1lI-37 NB to 1lI-41O (SL) EB Downtown to 1lI-1O 1lI-1O WB to 1lI-35 SB 1lI-1O WB to UH-410 (EL) NB 1lI-1O (C ont) WB @ 1lI-35 NB 1lI-35 SB to 1lI-37 SB 1lI-37 NB to 1lI-1O WB 1lI-37 NB to 1lI-41O (EL) NB 1lI-41O (EL) NB to 1lI-35 NB US-281 NB to 1lI-41O (NL) WB US-90 EB to 1lI-35 NB Downtown to 1lI-1O EB FM-151 WB to Sea World FM-471 WB to Loop 1604 NB 1lI-1O WB to 1lI-35 NB 1lI-1O WB to 1lI-35/37 NB 1lI-1O WB to 1lI-37 SB 1lI-1O WB to 1lI-41O (EL) SB 1lI-1O WB to 1lI-41O (NL) WB 1lI-10 WB to US-90 WB 1lI-1O WB to Wurzbach Rd. 1lI-1O (Cont) EB @ 1lI-35 SB 1lI-1O (Cont) EB @ US-90 EB 1lI-1O (Cont) WB @ lli-35 SB 1lI-1O (Cont) WB @ IH-35/US-90 IH-lO (Cont) WB @ Loop 536 1lI-35 NB to Commerce IH-35 NB to IH-410 (SL) EB IH-35 NB to US-87/llI-1O NB IH-35 SB to IH-lO EB IH-35 SB to Loop 1604 WB IH-35 SB to US-90 WB IH-35 NB (Cont) WB @ IH-37 SB 1lI-35/41O SB to IH-41 0 (EL) SB 1lI-37 NB to IH-35 NB IH-37 NB to Old Austin Rd. IH-37 NB to Sab Pedro IH-37 SB to IH-410 (SL) EB IH-410 NB to Wurzbach Rd. IH-410 WB to Sea World IH-410 (EL) NB to IH-410 (NL) WB IH-410 (EL) SB to IH-37 SB
51

52
1 1 1 1 1
Citizen Surv~ Input
1 1 1 1 1 1 1 1 1 1
SDHPT Input
D D D
lli-41O (NL) EB to US-281 SB lli-41O (NL) EB to Whitmore lli-41O (NL) WB to Cullaghan lli-41O (NL) WB to SH-16 NB lli-41O (NL) WB to Sea World
LOCATION
lli-41O (NL) WB to US-281 SB lli-41O (SL) WB to lli-35 SB lli-41O (WL) NB to US-90 EB lli-41O (Cont) NB @ Austin Hwy Sb lli-41O (Cont) NB @ lli-35 (NL) NB lli-41O (Cont) WB @ Austin Hwy SB US-281 NB to lli-41O (SL) EB US-281 SB to lli-41O (SL) US-81 WB to lli-35/37 SB US-90 EB to lli-41O (WL) NB lli-41O (EL) to lli-37 NB lli-41O (SL) to lli-37 SB lli-41O (SL) to lli-37 NB

APPENDIX A.3. DIRECTORY OF POTENTIAL SIGNING PROBLEM LOCATIONS IN AUSTIN
IDENTIFIED PROBLEM LOCATIONS IN DISTRICT 14 (AUSTIN)
Citizen Survey Input
8 4 2 2 2 2 1 1 1 1 1 1 1 1 1 1 1 1 1 1 1 1 1 1 1 1 1 1 1 1 1 1 1 1 1 1 1
SDHPTInput
D
D
D
D D
LOCATION
IH-35 SB @ level split SB US-290 WB to IH-35 SB IH-35 NB to AIRPORT IH-35 NB @ level split NB IH-35 NB to 26th Street WB IH-35 SB to Riverside Dr. EB IH-35 NB to Yager Lane IH-35 NB to 6th Street WB IH-35 SB to 11th Street IH-35 SB to Airport Blvd IH-35 SB to SH-71 EB IH-35 SB to US-290 EB IH-35 SB to US-183 WB Loop 1 Mopac NB to Anderson Ln. Loop 1 Mopac SB to Bull Creek WB Loop 360 NB to RM-2222 Loop 360 SB to US-290 EB Loop 360 SB to Lamar Blvd Loop 360 SB to Loop 1 Mopac Sb Loop 360 SB to SH-71 WB SH-71 WB to Loop 1 Mopac NB SH-71 WB to IH-35 SB SH-71 (Cont) EB @ Loop 360 EB Spur 343 SB to SH-71 WB US-183 NB to Anderson Ln. US-183 NB to IH-35 NB US-183 NB to US-290 NB US-183 NB to Loop 1 Mopac SB US-290 EB to IH-35 SB US-290 WB to Airport Blvd US-290 WB to IH-35 NB US-290 WB to Loop 1 Mopac SB US-290 WB to SH-71 NB US-290 WB to IH-35 SB US-290 WB to SH-360 WB US-290 (Cont) WB @ IH-35 SB US-290/SH-71 WB to US-290 WB SB Loop 1 Mopac to SH-2244
(No signs for Bee Caves) IH-35 NB at Pflugerville exits IH-35 SB at Pflugerville exits
53

54

APPENDIXB
DATA AND DEMOGRAPHICS FOR HIGHWAY USER PERCEPTION SURVEYS 1 AND 2
55

56
APPENDIX B.I. DATA AND DEMOGRAPHICS FOR HIGHWAY USER PERCEPTION SURVEY I
DATA FOR HIGHWAY USER SURVEY 1
Number of Average Age Sex Licence Years Driving Miles Driver/ Problem Numbers
A Year 1 2 3 4 22 M N 0 1 2 4 4 4 23 F Y 6 3500 2 3.5 4 4 30 F Y 15 3500 2 4 4 4 25 M Y 1 3500 2 4 5 4 22 M Y 6 3500 2 4 4 4 23 M Y 8 7500 2 4 4 4 30 M Y 1 0 7500 2 4 4 4 26 M Y 4 12500 2 4 4 4 56 F Y 15 17000 2 3.5 5 3.5 25 M Y 9 17000 2 3.5 5 3.5 1 9 F Y 2 1000 3 4 4 4 22 F Y 4 1000 3 4 4.5 4 30 M Y 1 2 1000 3 4 4 4 32 M Y 1 6 1000 3 4 4 4 1 9 F Y 3 3500 3 4 4 4 21 F Y 6 3500 3 4 4 4 21 M Y 3 3500 3 4 4 4 21 M Y 5 3500 3 4 5 4 27 M Y 1 1 3500 3 4 5 4 20 F Y 2 7500 3 4 4 4 20 F Y 2 7500 3 4 4 4 21 F Y 2 7500 3 4 4.5 4 22 F Y 4 7500 3 4 4 4 20 F Y 5 7500 3 4 4 4 20 F Y 6 7500 3 4 5 4 23 F Y 7 7500 3 4 4 4 24 F Y 7 7500 3 4 4 4 24 F Y 9 7500 3 4 4 4 27 F Y 1 1 7500 3 4 5 4 29 F Y 1 3 7500 3 4 4 4 33 F Y 15 7500 3 4 4.5 4 26 M Y 2 7500 3 4 5 4 23 M Y 5 7500 3 4 4 4 23 M Y 5 7500 3 4 4 4 24 M Y 5 7500 3 4 4 4 25 M Y 9 7500 3 4 4 4 25 M Y 1 3 7500 3 4 5 4 33 F Y 1 7 12500 3 4 4 4 46 F Y 20 12500 3 4 4.5 4 1 9 M Y 2 12500 3 4 4 4 24 M Y 3 12500 3 4 5 4
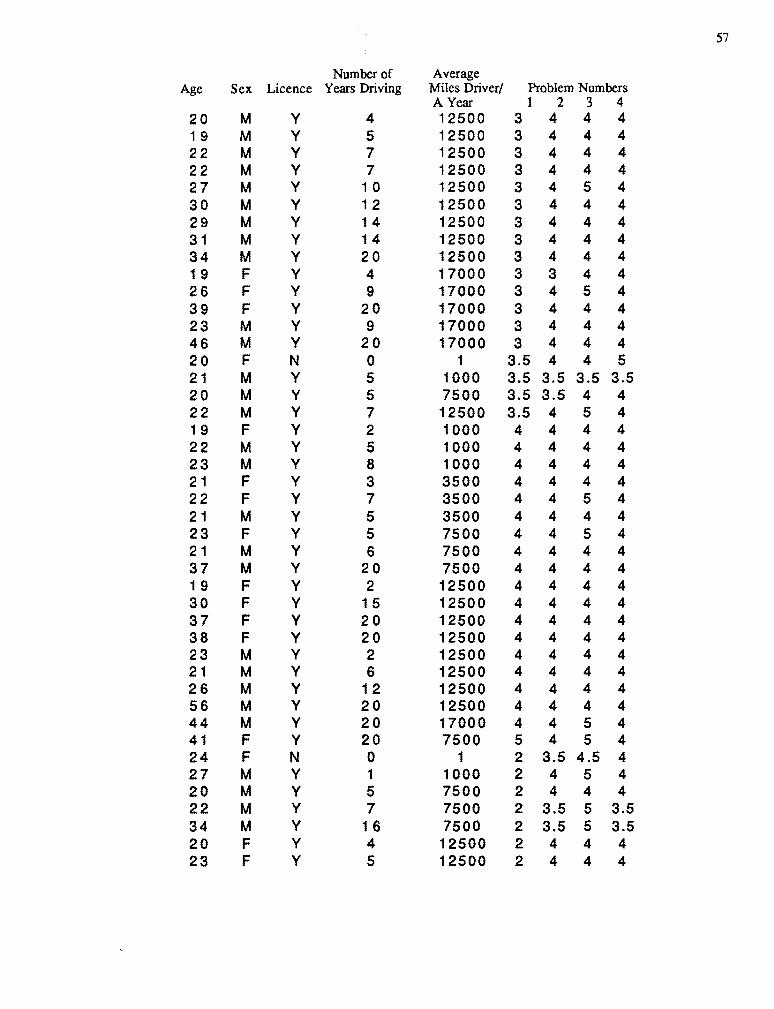
57
Number of Average Age Sex Licence Years Driving Miles Driverl Problem Numbers
A Year 1 2 3 4 20 M Y 4 12500 3 4 4 4 1 9 M Y 5 12500 3 4 4 4 22 M Y 7 12500 3 4 4 4 22 M Y 7 12500 3 4 4 4 27 M Y 1 0 12500 3 4 5 4 30 M Y 1 2 12500 3 4 4 4 29 M Y 14 12500 3 4 4 4 31 M Y 14 12500 3 4 4 4 34 M Y 20 12500 3 4 4 4 19 F Y 4 17000 3 3 4 4 26 F Y 9 17000 3 4 5 4 39 F Y 20 17000 3 4 4 4 23 M Y 9 17000 3 4 4 4 46 M Y 20 17000 3 4 4 4 20 F N 0 1 3.5 4 4 5 21 M Y 5 1000 3.5 3.5 3.5 3.5 20 M Y 5 7500 3.5 3.5 4 4 22 M Y 7 12500 3.5 4 5 4 1 9 F Y 2 1000 4 4 4 4 22 M Y 5 1000 4 4 4 4 23 M Y 8 1000 4 4 4 4 21 F Y 3 3500 4 4 4 4 22 F Y 7 3500 4 4 5 4 21 M Y 5 3500 4 4 4 4 23 F Y 5 7500 4 4 5 4 21 M Y 6 7500 4 4 4 4 37 M Y 20 7500 4 4 4 4 1 9 F Y 2 12500 4 4 4 4 30 F Y 15 12500 4 4 4 4 37 F Y 20 12500 4 4 4 4 38 F Y 20 12500 4 4 4 4 23 M Y 2 12500 4 4 4 4 21 M Y 6 12500 4 4 4 4 26 M Y 12 12500 4 4 4 4 56 M Y 20 12500 4 4 4 4 44 M Y 20 17000 4 4 5 4 41 F Y 20 7500 5 4 5 4 24 F N 0 1 2 3.5 4.5 4 27 M Y 1 1000 2 4 5 4 20 M Y 5 7500 2 4 4 4 22 M Y 7 7500 2 3.5 5 3.5 34 M Y 16 7500 2 3.5 5 3.5 20 F Y 4 12500 2 4 4 4 23 F Y 5 12500 2 4 4 4

58
Number of Average Age Sex Licence Years Driving Miles Driver/ Problem Numbers
A Year I 2 3 4 1 9 F Y 6 12500 2 3.5 5 3.5 23 M Y 8 12500 2 3.5 3.5 3.5 26 M Y 1 0 12500 2 4 4 4 25 F Y 8 17000 2 4 4 4 1 6 F N 0 1 3 4 4.5 4 20 F N 0 1 3 4 4.5 4 25 F N 0 1 3 3 4.5 4 22 F Y 4 1000 3 3 4 4 21 M Y 1 1000 3 4 5 4 1 9 M Y 4 1000 3 4 5 5 23 M Y 5 1000 3 4 5 4 22 M Y 6 1000 3 4 5 4 30 F Y 2 3500 3 4 4 4 24 F Y 4 3500 3 4 4 4 21 F Y 5 3500 3 4 4 4 24 F Y 5 3500 3 4 5 4 27 F Y 1 1 3500 3 4 5 4 1 8 M Y 2 3500 3 4 4 4 1 9 M Y 4 3500 3 4 5 4 22 M Y 4 3500 3 3 4 4 21 M Y 6 3500 3 4 4 4 24 M Y 6 3500 3 4 4 4 26 M Y 9 3500 3 3.5 3.5 3.5 25 M Y 1 0 3500 3 4 5 4 34 M Y 1 9 3500 3 4 5 4 1 9 F Y 4 7500 3 4 4 4 23 F Y 8 7500 3 4 4 4 23 F Y 8 7500 3 4 5 4 25 F Y 9 7500 3 4 4 4 40 F Y 20 7500 3 4 4 4 1 9 M Y 4 7500 3 4 4 4 20 M Y 4 7500 3 4 4.5 4 21 M Y 5 7500 3 4 4 4 23 M Y 5 7500 3 4 4 4 30 M Y 7 7500 3 4 4 4 22 M Y 8 7500 3 4 4.5 4 25 M Y 9 7500 3 4 4 4 28 M Y 1 0 7500 3 4 4 4 30 M Y 1 0 7500 3 4 4 4 26 M Y 13 7500 3 4 5 4 31 M Y 13 7500 3 4 4 4 1 9 F Y 3 12500 3 4 4 4 21 F Y 4 12500 3 4 4 4

59
Number of Average Age Sex Licence Years Driving Miles Driver/ Problem Numbers
A Year 1 2 3 4 22 F Y 6 12500 3 4 2 4 36 F Y 20 12500 3 4 5 4 20 M Y 4 12500 3 4 5 4 20 M Y 5 12500 3 4 4 4 21 M Y 5 12500 3 4 4.5 4 21 M Y 5 12500 3 4 5 4 24 M Y 9 12500 3 4 4 4 26 M Y 1 0 12500 3 4 4 4 30 M Y 1 5 12500 3 4 4 4 1 9 M Y 3 17000 3 4 4 4 28 M Y 1 0 17000 3 4 5 4 26 M Y 1 1 17000 3 4 4.5 4 27 M Y 1 1 17000 3 4 4 4 32 M Y 1 3 17000 3 4 4 4 36 M Y 1 8 17000 3 4 4 4 22 F Y 7 17000 3 4 4 4 56 M Y 20 17000 3 4 4 4 21 F Y 2 1000 3.5 4 4 5 23 M Y 4 1000 3.5 3.5 5 3.5 21 M Y 3 3500 3.5 3.5 4 3.5 25 M Y 4 3500 3.5 3.5 4 3.5 26 M Y 6 3500 3.5 3.5 3.5 3.5 33 F Y 1 5 12500 3.5 4 5 4 26 F Y 1 1 17000 3.5 4 5 4 23 M Y 7 17000 3.5 3.5 4 3.5 1 9 F Y 2 1 4 4 4 4 26 M Y 4 1000 4 4 5 4 22 M Y 4 3500 4 4 4 4 26 M Y 8 3500 4 4 4 4 25 F Y 9 7500 4 4 4 4 24 M Y 6 7500 4 4 4 4 29 M Y 1 1 7500 4 4 5 4 27 M Y 1 3 7500 4 4 4 4 24 M Y 3 12500 4 4 5 4 30 M Y 1 2 12500 4 4 4 4 21 F Y 6 17000 4 3 4 4 23 F Y 7 17000 4 2 4 4 22 M Y 8 17000 4 3.5 4 4 25 M Y 1 0 17000 4 4 4.5 4 29 M Y 1 3 17000 4 4 4 4

60
SUMMARY OF DEMOGRAPHIC DATA FOR PERCEPTION SURVEY 1.
Total Sample: 168
# Males: 103
# of Females: 65
Age:
Median age :
Average age:
23 years
26 years
Number of years of driving experience:
Median: 6 years
Average: 8 years.
Number of miles driven in the last 12 months:
Median: 7,500 miles
Average: 8,500 miles

61
APPENDIX B.2. DATA AND DEMOGRAPHICS FOR HIGHWAY USER PERCEPTION SURVEY 2
DATA FOR SURVEY 2A.
Problem Numbers in Survey 2A
Age Sex Licence Years Driving MileslYear 1 2 3 4 5
23 F Y 5 3500 4 1.2 5 4 1 32 M Y 12 12500 4 2 5 5 1 23 F Y 4 1000 4 1.2 5 4 1 23 M Y 6 7500 4 1.2 5 4 1 25 M Y 6 12500 4 1 5 4 1 23 M N 8 1000 5 1 5 2 1 23 M Y 9 1000 5 4 5 4 1 23 M Y 8 12500 3 3 5 4 1 31 M Y 1 4 12500 4 2 5 4 1 29 M Y 1 7500 3 2 5 4 1 28 M Y 1 5 7500 4 1 5 4 1 43 F Y 20 3500 3 2 5 4 1 42 F Y 20 7500 3 2 5 4 1 30 M Y 4 7500 4 2 5 4 1 71 M Y 20 7500 4 3 5 2 1 20 F Y 3 7500 4 1.2 5 4 1 45 M Y 20 12500 4 2 5 4 1 29 M Y 1 1 12500 4 2 5 4 1 22 M N 0 1 4 2 5 4 1 27 F Y 1 3 12500 4 2 5 4 1 22 M Y 7 12500 4 2 5 4 1 28 M Y 14 12500 5 1.2 5 4 1 22 M Y 6 12500 4 1 5 2 1 24 F Y 6 1000 3 2 5 3 1 24 M Y 8 17000 4 2 5 4 1 24 M Y 6 3500 4 2 5 4 1 27 M Y 7 7500 4 1 5 4 1 22 F Y 4 3500 4 1.2 5 4 1 31 M Y 7 17000 4 1 5 1 1 24 M Y 1 1000 4 2 5 2 1 27 M Y 5 7500 4 2 5 2 1 23 F Y 4 1000 4 1.2 5 4 1 24 M Y 7 3500 4 1 5 2 1 21 F Y 3 3500 4 1 5 4 1 22 M Y 4 1000 4 1 5 4 1 24 M N 0 1 4 1 5 4 1 25 M Y 1 0 17000 4 2 5 4 1

62
Problem Numbers in Survey 2A
Age Sex Licence Years Driving Miles/Year 1 2 3 4 5 25 M Y 8 7500 4 2 5 4 1 25 M Y 9 7500 5 1 4 2 1 24 F Y 9 7500 4 1 5 4 1 22 M Y 6 3500 4 2 5 4 1 21 M Y 6 12500 4 2 5 4 1 21 F Y 6 7500 4 1 5 4 1 20 M Y 5 7500 4 2 5 4 1 36 M Y 20 7500 4 2 5 4 1 21 M Y 5 17000 4 1 5 4 1 24 M Y 6 7500 4 1 5 4 1 21 M Y 1 17000 4 2 5 4 1 22 F Y 7 7500 4 2 5 4 1 24 M Y 7 12500 4 1 5 4 1 35 M Y 20 12500 4 1 5 4 1

63
DATA FOR SURVEY 2B.
Problem Numbers in Survey 2B
Age Sex Licence Years Driving MilesNear 1 2 3 4 5 23 M Y 5 3500 5 4 4 5 1 26 F Y 15 1000 5 4 3 4 2 22 M Y 6 7500 5 4 4 5 1 26 M Y 3 3500 5 3 4 5 2 29 M Y 1 5 17000 5 4 4 5 1 24 M N 9 12500 5 4 4 5 1.5 26 M Y 8 7500 5 4 4 5 1 33 F Y 15 3500 5 4 4 5 1 33 M Y 3 17000 4 4 4 4 2 28 M Y 4 3500 5 4 3 5 1 26 M Y 3 7500 4 4 4 5 1 20 M Y 9 7500 5 4 4 5 1 24 F Y 1 0 1000 5 4 3 5 1 29 M Y 1 0 17000 5 4 4 5 1 26 M Y 8 3500 5 4 4 4 1 25 M Y 9 12500 5 4 4 2 2 26 M Y 3 1000 0 0 0 0 2 28 M Y 1 1 17000 5 4 4 5 1 31 M Y 1 6 7500 5 4 4 5 1 24 F Y 5 3500 5 4 4 5 1 28 M Y 1 4 12500 5 4 4 4 2 75 M Y 20 7500 5 4 3 5 2 22 M Y 6 7500 5 4 4 5 2 28 M Y 1 1 17000 5 4 4 5 1 25 M Y 1 1 3500 5 4 4 5 1
M Y 7 7500 5 4 4 5 1 20 F Y 5 7500 5 4 4 5 1 23 F Y 4 1000 5 4 3 4 1 21 F Y 3 1000 5 4 4 5 2 22 M Y 4 3500 5 4 4 5 1 28 M Y 5 3500 5 0 4 5 1 26 M Y 1 0 3500 5 4 4 5 2 48 M Y 20 12500 5 4 4 5 2 42 M Y 20 12500 5 4 4 5 1 22 M Y 6 3500 5 4 4 5 1 24 F Y 6 7500 5 4 4 5 1 22 M Y 5 3500 5 4 4 5 2

64
Problem Numbers in Survey 2B
Age Sex Licence Years Driving Milestyear 1 2 3 4 5 22 M Y 8 17000 5 4 4 5 1 21 M Y 7 7500 5 4 3.5 4 1 21 M Y 7 17000 5 4 4 5 1 20 M Y 4 12500 5 4 4 5 1 22 M Y 7 17000 5 4 4 5 1 28 M Y 1 0 12500 5 4 4 5 2 23 M Y 6 7500 5 4 4 5 1 21 M Y 7 17000 5 4 4 5 1 26 M Y 1 0 7500 5 4 5 5 1 26 M Y 1 0 12500 5 3 4 5 2 23 F Y 7 12500 5 4 4 5 2 24 M Y 7 7500 5 4 4 5 2 22 M Y 7 7500 5 4 4 5 2 22 M Y 7 12500 5 3 4 4 1 22 F Y 4 3500 5 3 4 5 2

DEMOGRAPHIC DATA FOR THE SECOND PERCEPTION SURVEY
Total Sample: 103
# of Males: 80
# of Females: 23
Sample Size:
# of Males:
# of Females:
Age:
Median age :
Average age:
SUlvey 2A.
51
38
13
24.0 years
26.8 years
Number of years of driving experience:
Median: 8.Oyears
Average: 8.1 years.
Number of miles driven in the last 12 months:
Median: 7,500 miles
Average: 8,000 miles
Survey 2B
52
42
10
25.0 years
26.4 years
7 years
8.3 years
7,500 miles
8,500 miles
65

66

APPENDIXC
DATA AND TABULATIONS FOR THE AIRPORT GUIDE SIGNING STUDY
67

68
APPENDIX C.l. AIRPORT SURVEY DATA AND TABULATIONS FROM AUSTIN
AIRPORT SURVEY DATA FROM AUSTIN
SURVEY NO RESID FREQ TRANS l..OCAT DIFF RATE SEX
1 1 3 1 9 0 2 1 2 1 2 2 8 0 3 0 3 3 2 4 2 0 4 1 4 1 3 2 8 0 3 0 5 1 3 2 8 0 1 0 6 1 3 1 9 0 3 0 7 1 3 2 8 0 3 1 8 2 1 4 6 0 3 1 9 3 1 3 8 2 1 1
1 0 2 1 4 2 1 1 1 1 1 2 3 4 7 0 1 1 1 2 1 3 2 8 0 4 1 1 3 1 3 1 9 0 1 1 14 2 2 4 6 0 3 1 15 1 3 2 8 0 3 0 1 6 1 3 1 9 1 2 1 1 7 2 1 4 3 0 2 1 1 8 1 3 2 8 0 1 1 1 9 2 1 4 3 0 2 1 20 1 1 3 6 1 2 1 21 1 3 1 9 0 1 1 22 1 3 1 7 0 2 1 23 1 3 1 9 0 1 1 24 1 3 2 8 0 1 0 25 2 3 8 8 2 1 0 26 1 3 8 8 0 1 1 27 2 2 2 8 0 1 1 28 1 3 2 8 0 1 0 29 1 3 2 8 0 3 1 30 1 2 2 8 0 4 1 31 1 3 2 8 0 1 1 32 1 3 3 8 2 1 1 33 1 3 1 9 0 3 0 34 1 3 2 8 0 3 0 35 1 3 2 8 0 1 0 36 1 3 1 9 0 1 1 37 1 3 2 8 1 1 1 38 1 1 1 3 0 3 1 39 1 3 1 9 0 3 1 40 1 3 1 9 0 3 1 41 1 3 2 8 0 3 1 42 1 3 2 8 0 1 1 43 1 3 1 9 0 2 1

69
44 1 3 7 8 2 1 1 45 2 1 5 8 2 1 a 46 1 3 1 9 a 1 1 47 1 3 1 9 a 1 a 48 1 3 1 9 a 3 1 49 2 2 4 2 a 3 1 50 1 3 2 8 a 1 a 51 2 2 4 3 a 4 a 52 1 3 1 9 a 1 1 53 1 3 2 8 a 3 1 54 2 3 1 9 a 1 1 55 2 2 4 7 1 2 1 56 1 3 1 9 a 1 1 57 1 3 7 8 2 1 1 58 2 1 3 8 2 1 1 59 1 1 3 8 2 1 1 60 2 2 2 6 1 2 1 61 1 3 1 9 a 2 1 62 1 2 2 7 a 2 a 63 1 3 1 6 a 3 a 64 2 3 5 8 a 1 1 65 1 3 1 9 a 3 a 66 1 2 1 6 a 4 1 67 2 1 3 8 2 1 1 68 1 3 1 9 a 3 1 69 2 1 4 6 1 3 1 70 2 2 6 8 a 3 1 71 1 2 1 7 a 1 a 72 1 3 1 9 a 3 1 73 2 3 4 7 a 3 1 74 2 3 4 7 a 4 1 75 1 3 2 7 a 1 a 76 1 3 7 8 2 1 1 77 1 3 1 9 a 1 1 78 1 3 2 8 a 3 a 79 1 3 2 8 a 2 a 80 2 3 4 7 a 3 1 81 1 3 1 9 2 3 1 82 1 3 1 9 a 4 a 83 2 1 2 8 2 1 1 84 2 1 6 8 2 1 a 85 2 2 4 3 a 3 1 86 2 1 3 8 2 1 1 87 1 3 1 9 a 3 1 88 1 3 1 9 a 3 a 89 2 3 4 6 a 4 1 90 1 3 2 8 a 3 1 91 2 3 4 6 a 3 1 92 1 3 2 8 a 3 1

70
93 1 3 1 9 1 2 1 94 2 1 6 8 2 1 1 95 1 3 1 9 0 1 1 96 1 3 3 8 2 1 1 97 1 3 1 9 0 2 1 98 1 2 1 9 0 3 0 99 1 3 1 9 0 2 0
EndS1 100 1 3 1 9 0 3 1
Start 101 2 3 4 8 0 4 1 S2
102 2 3 4 2 0 2 1 103 2 3 4 8 0 4 1 103 1 3 4 8 0 3 1 105 2 3 4 6 0 3 1 106 2 2 4 6 0 4 1 107 1 3 4 8 0 4 1 108 2 2 4 6 0 3 1 109 2 3 4 3 0 3 1 110 2 3 4 7 0 3 1 111 3 1 4 2 0 4 1 112 2 2 4 7 0 3 1 113 1 3 4 7 0 3 1 114 2 1 4 2 0 3 1 115 3 3 4 6 0 3 1 116 2 1 4 6 0 3 0 117 1 3 4 6 0 3 1 118 1 3 4 6 0 3 1 119 1 3 4 7 0 4 1 120 3 1 4 2 1 3 1 121 2 3 4 6 0 4 0 122 1 2 4 6 0 3 1 123 1 3 4 6 0 3 1 124 2 1 4 2 1 2 1 125 1 3 4 7 0 1 1 126 2 2 4 6 0 3 1 127 1 3 4 6 0 3 0 128 1 3 4 7 0 3 1 129 1 3 4 6 0 3 1 130 1 3 4 7 0 3 1 131 2 3 4 7 0 3 1 132 1 3 4 7 0 3 1 133 2 3 4 7 0 3 1 134 1 3 4 7 0 1 0 135 1 3 4 7 0 2 1 136 1 2 4 6 0 3 1 137 1 2 4 3 0 3 1 138 1 3 4 6 0 3 1 139 1 3 4 7 0 3 1 140 2 2 4 3 0 3 1

71
141 1 3 4 7 0 3 1 142 2 3 4 6 0 3 1 143 1 3 4 7 0 3 1 144 1 3 4 6 0 2 1 145 2 3 4 2 0 2 1 146 2 2 4 2 0 3 1 147 2 3 4 6 0 4 0 148 1 2 4 6 0 3 1 149 2 3 4 6 0 4 1 150 1 2 4 3 0 3 1 151 2 1 4 6 0 4 1 152 1 3 4 3 0 4 1 153 2 3 4 7 0 4 1 154 2 3 4 7 0 4 1 155 1 3 4 6 0 3 1 156 2 2 4 3 0 3 1 157 2 2 4 3 0 4 0 158 1 3 4 6 0 2 1 159 2 2 4 6 0 3 1 160 2 3 4 6 0 3 1 161 1 1 4 2 0 3 1 162 1 3 4 6 0 3 1 163 1 1 4 6 0 3 1 164 2 3 4 7 0 4 1 165 1 3 4 7 0 3 1 166 1 3 4 2 0 3 1 167 1 3 4 3 0 3 1 168 1 3 4 7 0 3 1 169 1 3 4 7 0 3 0 170 1 2 4 6 0 3 1 171 1 3 4 7 0 3 1 172 1 3 4 7 0 3 1 173 1 3 4 7 0 3 1 174 2 3 4 7 0 3 1 175 2 3 4 7 0 3 0 176 2 2 4 3 0 3 1 177 1 2 4 3 0 3 1 178 2 3 4 7 0 3 1 179 1 3 4 7 0 3 1 180 1 3 4 7 0 3 1 181 2 3 4 6 0 1 1 182 2 2 4 6 0 3 1 183 2 3 4 7 0 2 1 184 1 3 4 7 0 2 1 185 1 3 4 6 0 3 1 186 1 2 .4 6 0 3 0 187 2 2 4 6 0 3 1 188 2 3 4 7 0 4 0 189 2 3 4 3 0 3 1

72
190 2 2 4 6 0 3 1 191 1 3 4 7 0 3 1 192 1 3 4 7 0 3 1 193 2 1 4 3 0 3 1 194 3 1 4 2 0 3 1 195 1 3 4 7 0 3 1 196 2 3 4 7 0 3 1 197 1 3 4 7 0 2 1 198 1 3 4 7 0 1 1 199 2 1 4 3 0 3 1 200 2 2 4 3 0 2 1 201 2 2 4 6 0 3 1 202 2 1 4 6 0 3 0 203 3 1 4 6 0 3 1 204 2 3 4 6 0 3 1 205 2 3 4 7 0 3 1 206 3 3 4 6 0 3 1 207 2 3 4 7 0 2 1 208 1 3 4 7 0 2 0 209 1 3 4 7 0 2 1 210 1 3 4 6 0 3 1 211 2 3 4 6 0 3 1 212 2 1 4 6 0 4 1 213 2 3 4 6 0 3 1 214 1 2 4 6 0 2 1 215 1 3 4 3 0 3 1 216 1 3 4 7 0 3 1 217 2 2 4 6 0 3 1 218 2 3 4 6 0 2 1
RESID FREQ TRANS lOCAT DIFF AATE SEX
#of 218 218 218 218 218 218 218 responses

SURVEY RESULTS:
AUSTIN AIRPORT
Total Number of Respondents:
Question number, survey response code and totals are shown below:
1. Where is your permanent Residence?
1 - Texas
2 - non-Texas state
3 - non-U.S.A. country
2. Is this your ftrst time to the Airport?
1 -Yes, ftrst time to AlP 2 -No, have been to AlP less than ftve times
3 -No, have been to AlP more than ftve times
5. What type of transportation did you use to arrive at the airport?
1 - Passenger car - parked
2 - Passenger car - drop off
3 - Hotel or motel van
4 - Rental car
5 - Public Bus
6 - Taxi or limousine
7 - Other
8 - Transfer of flights
6. How did you find the location of the airport?
1 - Street Address
2 - Street Map
3 - Oral Directions
4 - Map by friend or associate
5 - Written directions
218
126
84
8
30
40
148
37
28
8
135
2
3
3
2
o 13
20 o o
73

74
6 - Highway signs 55
7 - Other 52
8 - Not applicable 46
9 - No response 32
7. Did you have any problems fmding the airport?
0- No 192
1- Yes 10
2 - Not applicable 16
8. Overall, how would you rate the signing that guided you to the AlP?
9. Sex
1 - Not applicable 46
2 - Poor 30
3 - Adequate 117
4 - Excellent 25
O-Female
1- Male
39
179

75
APPENDIX C.2. AIRPORT SURVEY DATA AND TABULATIONS FROM DALLAS-FORT WORTH
AIRPORT SURVEY DATA FROM DALLAS / FT. WORTH
D/FW Survey RESID FREQ TRANS LOCAT DIFF AATE SEX
no.
1 3 2 2 8 0 1 1 2 1 3 8 8 2 1 0 3 2 3 8 8 2 1 1 4 1 3 8 8 2 1 0 5 1 3 1 9 0 4 0 6 2 1 3 8 2 1 0 7 2 3 8 8 2 1 0 8 1 2 8 8 2 1 0 9 1 3 1 9 0 1 1
1 0 1 3 1 9 0 4 0 1 1 1 3 2 8 0 3 1 1 2 2 1 4 2 0 3 1 1 3 1 3 8 8 2 1 1 14 1 3 1 9 0 4 0 1 5 1 3 2 8 0 3 0 1 6 1 3 1 9 0 3 0 17 2 3 1 9 0 4- 0 1 8 1 2 8 8 2 1 1 19 1 3 1 9 0 3 0 20 2 3 4 9 0 3 1 21 1 3 8 8 2 1 1 22 1 3 1 9 0 3 0 23 2 3 8 8 2 1 1 24 2 3 8 8 2 1 1 25 2 1 8 8 2 1 0 26 1 3 1 9 0 4 0 27 1 3 2 8 0 4 0 28 1 3 1 9 0 1 1 29 2 3 8 8 2 1 1 30 1 3 7 8 0 3 1 31 2 1 8 8 2 1 1 32 2 2 8 8 2 1 1 33 2 3 8 8 2 1 1 34 2 2 8 8 2 1 1 35 2 3 8 8 2 1 1 36 1 3 1 9 0 3 1 37 2 3 8 8 2 4 1 38 2 3 8 8 2 1 1 39 1 3 1 9 0 4 1 40 2 3 8 8 2 1 1 41 1 3 8 8 2 1 1 42 1 3 2 8 0 3 0

76
43 2 3 8 8 2 1 1 44 1 3 1 9 0 3 0 45 1 3 2 8 0 1 0 46 1 3 2 8 0 4 1 47 2 1 8 8 2 1 0 48 1 3 1 9 0 4 1 49 1 3 8 8 2 1 1 50 1 3 1 9 0 4 1 51 2 1 8 8 2 1 1 52 2 2 8 8 2 1 1 53 2 3 8 8 2 1 1 54 2 3 8 8 2 4 0 55 2 3 3 8 0 1 0 56 2 2 8 8 2 1 0 57 2 1 8 8 2 1 0 58 1 3 1 9 0 4 0 59 1 3 2 8 0 4 0 60 2 3 8 8 2 1 0 61 2 1 4 3 0 2 1 62 1 3 1 9 0 4 1 63 1 3 8 8 2 1 1 64 1 2 1 9 0 1 1 65 2 3 8 8 2 1 0 66 3 3 8 8 2 1 1 67 2 1 8 8 2 1 0 68 2 3 8 8 2 3 0 69 1 3 1 9 0 3 1 70 1 3 1 9 0 4 0 71 1 3 1 9 0 4 1 72 1 3 1 9 0 4 0 73 1 3 1 9 0 3 1 74 1 3 1 9 0 3 0 75 1 3 1 9 0 4 1 76 1 3 1 9 0 4 0 77 2 2 8 8 2 1 0 78 2 3 3 8 2 1 1 79 1 3 6 8 2 3 1 80 1 3 1 9 0 3 1 81 2 3 8 8 2 1 0 82 2 3 8 8 2 1 1 83 2 3 8 8 2 1 1 84 2 3 4 7 0 3 1 85 2 3 4 9 0 4 1 86 2 1 2 8 1 1 1 87 1 3 1 9 0 4 0 88 3 2 6 8 2 1 0 89 1 3 1 9 0 4 0 90 2 2 3 8 2 1 1 91 1 3 8 8 2 1 0

77
92 2 2, 8 8 2 1 0 93 2 l' 2 8 0 4 1 94 1 3 1 9 0 3 1 95 2 3 4 9 0 3 1 96 1 3 8 8 2 1 0 97 1 3 1 9 0 3 0 98 2 3 4 9 0 4 1 99 2 3 3 8 0 4 1
EndS1 100 2 3 2 8 0 4 1
StartS 101 2 2 4 7 0 4 1 2
102 2 3 4 7 0 4 1 103 2 2 4 7 0 3 1 103 2 3 4 7 0 4 1 105 2 3 4 7 0 3 1 106 2 3 4 7 0 3 1 107 2 2 4 2 0 2 0 108 2 3 4 7 0 4 0 109 2 2 4 7 0 4 0 110 2 2 4 2 0 2 1 111 1 3 4 7 0 4 1 112 3 3 4 7 0 4 0 113 2 1 4 3 0 4 1 114 2 3 4 7 0 4 1 115 2 3 4 7 0 4 1 116 2 3 4 2 0 4 0 117 3 3 4 7 0 4 0 118 2 3 4 7 0 4 1 119 2 3 4 7 0 4 1 120 2 3 4 7 0 4 1 121 2 3 4 7 0 3 1 122 2 3 4 7 0 4 1 123 1 3 4 7 0 4 1 124 2 3 4 3 0 3 1 125 2 2 4 6 0 4 1 126 2 3 4 6 0 3 1 127 2 3 4 7 0 4 1 128 2 3 4 7 0 4 1 129 3 3 4 7 0 4 1 130 2 3 4 2 0 4 1 131 3 3 4 7 0 4 1 132 1 3 4 7 0 2 1 133 1 3 4 7 0 4 1 134 2 2 4 6 0 4 0 135 2 2 4 7 0 4 1 136 2 3 4 7 0 4 1 137 2 3 4 7 0 2 1 138 2 3 4 7 0 4 1 139 1 3 4 7 0 4 1

78
140 2 1 4 6 0 4 1 141 2 3 4 6 0 4 0 142 2 3 4 6 0 4 1 143 2 3 4 6 0 4 1 144 2 3 4 6 0 4 1 145 2 3 4 7 0 3 1 146 2 2 4 6 0 4 1 147 2 3 4 6 0 4 1 148 2 3 4 2 0 4 1 149 1 3 4 7 0 4 1 150 2 2 4 3 0 3 1 151 2 3 4 6 0 4 0 152 2 3 4 7 0 4 1 153 2 1 4 6 0 4 0 154 2 3 4 3 0 3 1 155 2 3 4 3 0 2 1 156 2 3 4 7 0 3 1 157 2 3 4 7 0 4 1 158 2 3 4 7 0 4 1 159 2 1 4 7 0 3 1 160 3 2 4 7 0 4 1 161 2 2 4 6 0 4 1 162 2 3 4 7 0 4 1 163 2 3 4 7 0 4 1 164 2 3 4 6 0 4 1 165 2 3 4 7 0 4 1 166 2 3 4 7 0 3 1 167 2 3 -4 7 0 4 0 168 2 3 4 7 0 3 1 169 2 2 4 7 0 3 1 170 3 3 4 7 0 4 0 171 2 3 4 6 0 4 1 172 2 3 4 6 0 3 1 173 2 2 4 3 0 3 1 174 2 3 4 2 0 3 1 175 2 3 4 4 0 4 1 176 2 3 4 4 0 4 0 177 2 3 4 4 0 4 1 178 2 1 4 6 0 4 1 179 2 3 4 7 0 3 1 180 2 3 4 7 0 4 1 181 2 3 4 7 0 4 1 182 2 3 4 7 0 4 1 183 1 3 4 7 0 4 1 184 2 1 4 2 0 4 1 185 2 3 4 7 0 3 1 186 2 3 4 7 0 3 0 187 2 3 4 7 0 3 1 188 1 3 4 7 0 4 1

79
189 3 3 4 7 0 4 1 190 2 3 4 7 0 4 1 191 2 3 4 3 0 4 1 192 2 3 4 7 0 4 0 193 2 2 4 2 0 3 0 194 2 2 4 2 0 3 1 195 2 3 4 7 0 3 1 196 1 3 4 7 0 3 1 197 2 2 4 7 0 4 1 198 2 3 4 7 0 4 1 199 1 3 4 7 0 4 1 200 2 3 4 7 0 4 1 201 2 3 4 6 1 2 0 202 2 3 4 7 0 4 1 203 3 2 4 2 0 4 1 204 2 3 4 7 0 4 1 205 2 2 4 7 0 4 1 206 2 3 4 4 0 4 1 207 2 3 4 7 0 4 1 208 2 3 4 7 0 4 0 209 1 3 4 7 0 4 1 210 3 1 4 4 0 4 1 211 2 3 4 6 0 4 0 212 2 3 4 7 0 4 0 213 2 3 4 7 0 4 1 214 2 1 4 6 0 4 1 215 1 3 4 7 0 4 1 216 2 3 4 7 0 4 1 217 2 3 4 7 0 4 1 218 2 3 4 7 0 4 1 219 2 1 4 3 0 4 1 220 2 3 4 7 0 4 1 221 1 3 4 7 0 4 1 222 2 3 4 7 0 4 1 223 1 3 4 7 0 3 1 224 2 3 4 7 0 4 1 225 2 2 4 2 0 4 1 226 2 2 4 7 0 4 1 227 2 3 4 7 0 4 1 228 2 3 4 3 0 3 1 229 2 3 4 7 0 4 1 230 2 3 4 6 0 3 1 231 2 3 4 7 0 3 1 232 2 3 4 7 0 3 1

80
RESID FREQ TRANS LOCAT DIFF PATE SEX
# 232 232 232 232 232 232 232 responses

SURVEY RESULTS:
DALLAS / FT. WORTH
Total Number of Respondents:
Question number, survey response code and totals are shown below:
1. Where is your permanent Residence?
1 - Texas
2 - non-Texas state
3 - non-U.S.A. country
2. Is this your frrst time to the Airport?
1 -Yes, first time to AlP
2 -No, have been to AlP less than five times
3 -No, have been to AlP more than five times
5. What type of transportation did you use to arrive at the airport?
1 - Passenger car - parked
2 - Passenger car - drop off
3 - Hotel or motel van
4 - Rental car
5 - Public Bus
6 - Taxi or limousine
7 - Other
8 - Transfer of flights
6. How did you find the location of the airport?
1 - Street Address
2 - Street Map
3 - Oral Directions
4 - Map by friend or associate
5 - Written directions
232
64
156
12
20 33
179
31
11
5
139
o 2
1
43
o 12
10
5
o
81

82
6 - Highway signs 21
7 - Other 87
8 - Not applicable 62
9 - No response 35
7. Did you have any problems fmding the airport?
0- No 182
1 - Yes 2
2 - Not applicable 48
8. Overall, how would you rate the signing that guided you to the NP?
9. Sex
1 - Not applicable 51
2 - Poor 7
3 - Adequate 51
4 - Excellent 123
0- Female
1- Male
63
169

83
APPENDIX C.3. AIRPORT SURVEY DATA AND TABULATIONS FROM HOUSTON INTERCONTINENTAL
AIRPORT SURVEY DATA FROM HOUSTON
SURVEY RESID FRED TRANS lOCAT DIFF RATE SEX NO.
1 2 3 8 8 2 1 a 2 1 3 1 9 1 3 a 3 2 3 2 8 a 1 a 4 1 3 2 8 a 4 a 5 1 3 1 9 a 4 a 6 1 3 2 8 a 3 a 7 1 3 2 8 a 3 1 8 1 3 6 8 2 1 1 9 1 3 8 8 2 1 1
1 a 2 3 2 6 a 3 a 1 1 1 3 1 9 a 1 1 1 2 1 3 6 8 1 3 a 1 3 1 3 1 9 a 4 a 1 4 3 2 8 8 2 1 1 1 5 1 3 1 9 a 3 a 1 6 1 3 1 9 a 4 1 1 7 1 2 2 6 a 3 a 1 8 2 3 4 6 a 3 a 1 9 1 3 1 9 a 1 a 20 1 3 1 9 a 1 1 21 1 3 1 9 a 3 1 22 1 2 1 6 a 3 1 23 2 1 4 6 a 2 1 24 1 3 1 9 a 3 1 25 1 3 1 9 a 2 1 26 1 3 8 8 a 4 1 27 1 3 1 9 a 3 1 28 1 3 1- 6 1 2 1 29 1 3 1 9 a 3 1 30 1 2 8 8 2 1 a 31 1 3 1 9 a 4 1 32 1 3 1 9 a 2 1 33 1 2 1 2 a 3 1 34 1 3 1 9 a 3 1 35 2 2 8 8 2 1 a 36 1 3 1 9 a 4 a 37 1 3 1 9 a 4 a 38 1 3 1 9 a 4 a 39 1 3 1 9 a 3 1 40 1 3 2 8 a 4 1 41 1 3 1 9 a 2 1 42 1 3 2 9 a 4 a 43 1 3 1 8 a 3 1

, 84
44 2 3 8 8 0 1 0 45 2 3 3 8 0 1 1 46 1 3 2 8 2 1 1 47 1 3 2 8 0 3 1 48 1 3 2 8 0 3 1 49 1 3 1 9 0 3 0 50 1 3 1 9 0 4 0 51 1 3 1 9 0 3 1 52 1 3 2 8 0 1 1 53 1 3 2 8 0 4 0 54 1 3 1 9 0 3 1 55 2 1 3 8 0 1 1 56 3 2 8 8 2 1 0 57 2 2 8 8 2 1 1 58 1 3 1 9 0 4 0 59 2 1 8 8 2 1 0 60 2 3 1 9 0 2 0 61 1 3 6 6 0 3 1 62 1 3 1 9 0 3 1 63 1 3 1 9 0 1 1 64 2 1 8 8 2 1 1 65 2 3 8 8 2 3 1 66 1 3 1 9 0 4 1 67 1 3 8 8 2 1 1 68 3 1 8 8 2 1 1 69 1 3 1 9 0 3 1 70 2 3 8 8 2 1 1 71 2 3 4 2 0 3 0 72 2 3 8 8 2 1 0 73 1 3 1 9 0 3 0 74 1 1 1 9 0 4 1 75 1 3 1 9 1 3 1 76 1 3 1 9 0 4 1 77 1 3 1 9 0 3 1 78 1 3 2 8 0 3 0 79 1 3 1 9 0 3 1 80 2 2 3 8 2 1 0 81 2 1 8 8 2 1 1 82 1 3 2 8 0 3 1 83 2 1 8 8 2 1 1 84 1 3 1 9 0 1 1 85 2 1 8 8 2 1 1 86 2 2 8 8 2 1 0 87 1 3 1 9 0 3 1 88 2 2 2 8 2 1 0 89 2 2 8 8 2 1 0 90 1 3 1 9 0 3 1 91 1 3 1 9 0 4 0 92 1 3 1 9 0 4 1

85
93 2 2 8 8 2 1 1 94 2 2 2 8 0 1 1 95 1 3 1 9 0 3 0 96 2 3 4 7 0 2 1 97 2 3 1 8 1 3 0 98 1 3 1 9 0 3 1 99 1 3 8 8 2 1 1 100 1 3 8 8 2 1 1
EndS1 101 2 3 8 8 2 1 1
StartS2 102 2 2 4 5 0 4 1 103 2 1 4 6 0 3 1 103 2 1 4 2 0 3 0 105 2 3 4 7 0 3 1 106 2 2 4 2 0 2 1 107 2 3 4 3 1 2 1 108 1 3 4 7 0 3 1 109 1 3 4 6 0 3 1 110 2 3 4 5 0 3 1 111 3 3 4 6 0 3 1 112 2 2 4 6 0 3 1 113 2 2 4 6 0 3 1 114 2 3 4 2 0 3 1 115 2 3 4 6 0 3 1 116 2 2 4 6 0 2 1 117 2 3 4 6 0 3 0 118 1 3 4 7 0 3 1 119 1 3 4 7 0 3 1 120 2 2 4 6 0 2 1 121 2 1 4 3 1 3 1 122 1 3 4 6 0 2 1 123 1 3 4 7 0 2 1 124 1 3 4 7 0 3 1 125 2 3 4 2 0 3 1 126 2 3 4 7 0 2 1 127 2 3 4 7 0 3 1 128 2 3 4 7 0 4 1 129 2 2 4 2 0 3 1 130 1 2 4 2 0 2 0 131 2 3 4 7 0 3 1 132 2 2 4 2 0 2 1 133 2 3 4 6 0 3 1 134 2 3 4 7 0 2 1 135 1 3 4 7 0 1 1 136 2 3 4 7 0 3 1 137 1 3 4 7 0 3 1 138 2 3 4 7 0 3 1 139 1 1 4 7 0 2 1 140 1 3 4 6 0 3 1

86
141 2 3 4 6 0 2 1 142 2 2 4 5 0 1 1 143 2 3 4 6 0 4 1 144 2 3 4 5 0 3 1 145 2 3 4 7 0 4 1 146 2 3 4 7 0 3 1 147 2 3 4 2 0 3 1 148 2 2 4 5 0 2 1 149 2 2 4 2 0 3 1 150 2 1 4 2 0 3 1 151 3 3 4 2 0 4 1 152 3 3 4 2 0 4 0 153 2 3 4 7 0 3 1 154 2 2 4 6 0 3 1 155 3 1 4 2 0 3 1 156 2 1 4 2 0 3 1 157 3 2 4 6 0 3 1 158 1 3 4 7 0 3 1 159 2 2 4 5 0 2 1 160 2 1 4 2 0 3 1 161 1 3 4 7 0 3 1 162 2 3 4 7 0 3 1 163 2 3 4 7 0 3 0 164 2 3 4 7 0 3 1 165 2 3 4 7 0 4 1 166 2 3 4 7 0 3 1 167 2 3 4 7 0 4 1 168 3 2 4 6 0 3 1 169 2 3 4 7 0 2 1 170 2 3 4 6 1 3 1 171 2 3 4 6 0 4 1 172 3 1 4 6 0 3 1 173 1 3 4 6 0 3 1 174 2 3 4 7 0 3 1 175 2 3 4 7 0 3 1 176 2 3 4 6 0 3 1 177 3 3 4 6 0 4 1 178 2 3 4 7 0 2 1 179 2 1 4 7 0 4 1 180 2 3 4 7 0 4 0 181 2 3 4 7 0 4 0 182 2 2 4 6 0 3 1 183 2 3 4 7 0 2 1 184 1 3 4 7 0 4 1 185 1 3 4 7 0 3 1 186 2 3 4 7 0 3 1 187 1 3 4 7 0 4 0 188 2 1 4 7 0 4 1 189 3 3 4 7 1 2 1

87
190 2 2 4 3 0 4 1 191 2 3 4 7 0 3 1 192 2 3 4 6 0 3 1 193 2 2 4 6 0 2 1 194 2 2 4 6 0 3 1 195 2 3 4 7 0 3 1 196 2 1 4 6 0 4 0 197 2 2 4 3 0 3 0 198 2 3 4 7 0 3 1 199 1 3 4 6 0 2 1 200 1 3 4 7 0 3 1 201 2 3 4 7 0 3 1 202 2 3 4 7 0 3 1 203 1 3 4 7 0 2 1 204 2 2 4 2 0 4 1 205 2 3 4 6 0 3 1 206 2 2 4 2 0 4 1 207 2 1 4 6 0 3 1 208 2 3 4 7 0 2 1 209 2 3 4 7 0 3 1 210 2 2 4 3 0 3 1
RESID Am TRANS I..OCAT DIFF RATE s:x
210 210 210 210 210 210 210

88
SURVEY RESULTS:
HOUSTON
Total Number of Respondents:
Question number, survey response code and totals are shown below:
1. Where is your permanent Residence?
1 - Texas
2 - non-Texas state
3 - non-U.S.A. country
2. Is this your fust time to the Airport?
1 -Yes, fust time to AlP 2 -No, have been to AlP less than five times
3 -No, have been to AlP more than five times
5. What type of transportation did you use to arrive at the airport?
1 - Passenger car - parked
2 - Passenger car - drop off
3 - Hotel or motel van
4 - Rental car
5 - Public Bus
6 - Taxi or limousine·
7 - Other
8 - Transfer of flights
6. How did you find the location of the airport?
1 - Street Address
2 - Street Map
3 - Oral Directions
4 - Map by friend or associate
5 - Written directions
210
90 108
12
22
38
150
49 17
3
113
o 3
o 25
o 19
5
o 6
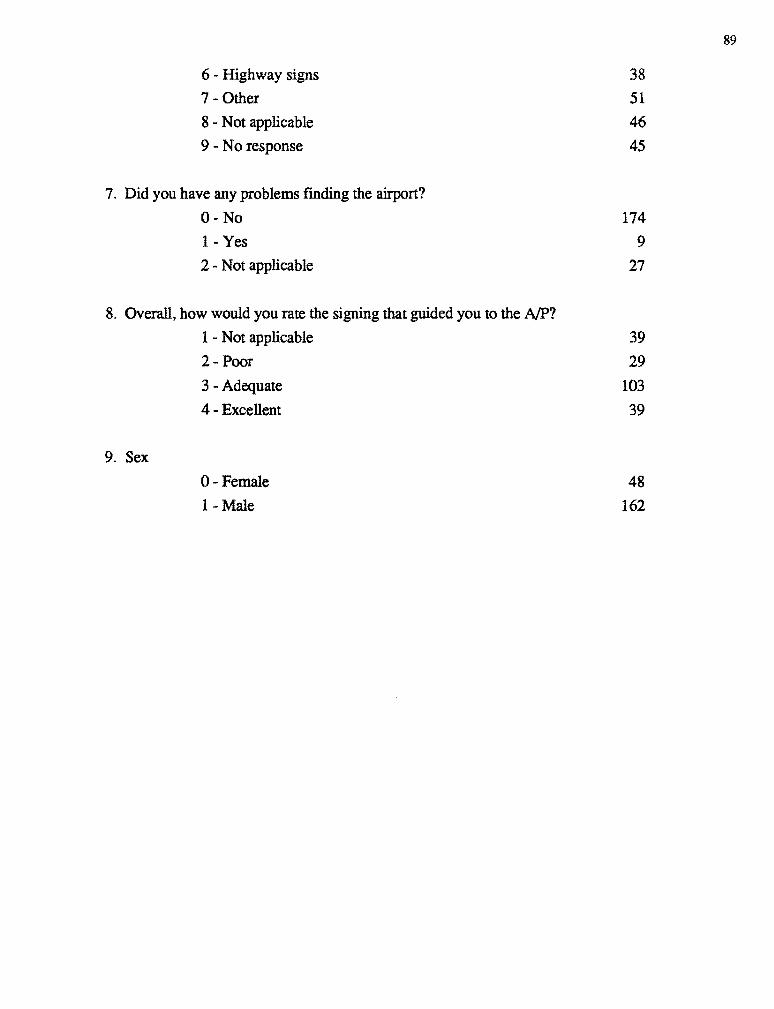
6 - Highway signs 38
7 - Other 51
8 - Not applicable 46
9 - No response 45
7. Did you have any problems rmding the airport?
0- No 174
1- Yes 9 2 - Not applicable 27
8. Overall, how would you rate the signing that guided you to the NP?
9. Sex
1 - Not applicable 39
2- Poor 29
3 - Adequate 103
4 - Excellent 39
O-Female
1- Male
48
162
89

90
APPENDIX C.4. AIRPORT SURVEY DATA AND TABULATIONS FROM SAN ANTONIO
AIRPORT SURVEY DATA FROM SAN ANTONIO
SURVEY RESID FREQ TRANS I..CO\T DIFF RATE SEX NO.
1 1 3 1 9 0 3 1 2 1 3 1 9 0 3 1 3 1 3 1 9 0 3 1 4 1 3 2 8 0 1 1 5 1 3 1 9 0 2 1 6 1 3 1 9 0 3 1 7 1 3 1 9 0 4 0 8 1 3 1 9 0 1 1 9 2 1 8 8 2 1 0
1 0 1 3 1 9 0 4 0 1 1 1 2 1 7 0 4 0 1 2 1 3 1 9 0 3 1 13 1 3 1 9 0 4 1 14 1 3 6 8 2 1 1 1 5 1 3 2 8 0 4 1 1 6 1 3 2 8 0 1 0 17 1 3 2 8 0 4 0 1 8 1 3 2 8 0 2 1 1 9 1 3 1 9 0 1 1 20 1 3 2 8 0 3 0 21 1 3 1 9 0 2 1 22 1 3 1 9 0 3 1 23 1 3 1 9 0 3 1 24 1 3 1 9 0 4 0 25 1 3 2 8 0 1 0 26 1 3 1 9 0 1 1 27 1 3 2 8 0 4 1 28 1 3 2 8 0 1 1 29 1 2 2 8 0 3 0 30 1 3 2 8 0 1 1 31 1 3 1 9 0 1 0 32 1 3 2 8 0 4 0 33 1 2 2 8 0 3 1 34 1 3 2 8 0 3 1 35 1 3 1 9 0 3 1 36 1 3 1 9 0 3 1 37 1 3 1 9 0 1 1 38 1 3 2 8 0 1 1 39 1 3 1 9 0 1 1 40 1 3 2 8 0 1 1 41 1 3 6 8 0 1 1 42 1 3 2 8 0 4 0 43 1 3 1 9 0 4 0

91
44 1 3 1 9 0 4 0 45 1 3 2 8 0 4 1 46 1 3 1 9 0 4 1 47 1 3 1 9 0 3 1 48 1 3 2 8 0 4 1 49 1 3 1 9 0 4 0 50 1 3 1 9 0 1 0 51 1 3 1 9 0 3 0 52 1 3 1 9 0 3 1 53 1 3 1 9 0 1 1 54 1 3 1 9 0 4 1 55 1 2 2 8 0 3 1 56 1 3 4 9 0 4 1 57 2 1 2 8 2 1 0 58 2 2 2 9 2 1 0 59 1 3 6 8 0 1 1 60 2 3 2 8 0 4 1 61 1 3 2 8 0 4 1 62 2 1 2 8 2 1 1 63 2 1 3 8 2 1 1 64 2 1 2 8 2 1 1 65 3 3 2 8 0 4 0 66 3 3 3 8 0 1 1 67 2 3 4 9 0 4 1 68 2 1 4 3 1 2 0 69 3 2 2 8 2 1 0 70 2 1 2 8 0 1 0 71 3 3 2 8 0 1 1 72 2 1 1 8 2 1 0 73 2 1 6 8 2 1 0 74 3 2 2 8 2 1 0 75 3 2 2 8 0 1 1 76 2 2 2 8 0 3 1 77 2 1 4 7 0 1 1 78 2 1 2 2 0 3 0 79 3 1 6 8 2 1 0 80 2 3 1 9 0 3 1 81 1 3 1 9 0 4 0 82 2 3 2 8 2 1 0 83 2 1 1 6 0 3 1 84 1 3 2 8 2 1 1 85 3 2 6 8 2 4 1 86 1 3 2 8 0 3 0 87 2 2 6 8 2 1 1 88 1 3 6 8 2 1 1 89 1 3 1 9 0 4 1 90 1 1 2 8 2 1 1 91 1 3 2 8 0 1 1 92 2 1 8 8 2 1 1

92
93 1 3 2 8 0 1 1 94 2 3 2 8 0 3 0 95 2 3 2 8 0 3 1 96 2 3 4 2 0 4 1 97 2 1 2 8 2 3 1 98 2 1 2 8 2 1 1
EndS1 99 3 2 4 6 0 3 1
StartS2 100 2 3 4 6 0 4 0 101 2 3 4 7 0 4 1 102 1 3 4 6 0 3 1 103 2 3 4 7 0 4 1 103 2 3 4 7 0 4 1 105 1 3 4 6 0 4 1 106 1 3 4 6 0 4 0 107 2 3 4 7 0 3 0 108 2 3 4 7 0 4 1 109 2 3 4 7 0 3 1 110 1 3 4 3 0 3 0 111 2 2 4 2 0 3 1 112 1 3 4 6 0 4 1 113 2 3 4 7 0 1 0 114 3 1 4 2 0 3 1 115 1 2 4 6 0 3 0 116 2 1 4 5 0 4 1 117 1 3 4 6 0 3 1 118 2 3 4 6 0 4 1 119 2 2 4 6 0 3 1 120 2 3 4 7 0 3 0 121 1 3 4 6 0 3 1 122 2 3 4 6 0 3 0 123 3 2 4 2 0 3 1 124 2 3 4 7 0 1 1 125 2 2 4 7 0 3 1 126 2 3 4 6 0 4 1 127 1 3 4 6 0 3 1 128 1 3 4 6 0 3 1 129 3 2 4 6 0 3 1 130 1 3 4 6 0 3 1 131 1 3 4 6 0 3 0 132 2 3 4 6 0 3 1 133 2 2 4 2 0 4 1 134 1 2 4 6 0 3 1 135 2 3 4 6 0 2 1 136 2 3 4 7 0 2 1 137 2 2 4 7 0 3 1 138 1 3 4 7 0 3 1 139 2 3 4 6 0 4 1 140 1 3 4 6 0 3 1

93
141 2 2 4 6 0 2 1 142 2 2 4 6 0 4 0 143 2 3 4 7 0 3 1 144 1 3 4 2 0 3 0 145 1 2 4 6 0 3 1 146 2 1 4 2 0 2 0 147 1 3 4 6 0 3 1 148 1 3 4 7 0 3 1 149 1 1 4 6 0 2 1 150 1 1 4 6 0 4 1 151 2 1 4 6 0 4 1 152 2 3 4 7 0 3 0 153 2 1 4 6 0 4 1 154 1 3 4 6 0 3 1 155 1 3 4 6 0 3 1 156 2 3 4 7 0 3 1 157 1 3 4 3 0 3 1 158 1 3 4 7 0 3 1 159 2 2 4 2 0 3 1 160 2 2 4 6 0 4 1 161 1 3 4 6 0 4 1 162 1 3 4 7 0 3 1 163 1 3 4 2 0 2 1 164 2 1 4 6 0 4 1 165 2 2 4 7 0 2 1 166 1 3 4 6 0 3 1 167 2 3 4 6 0 3 1 168 2 2 4 7 0 4 1 169 1 3 4 7 0 3 1 170 1 3 4 6 0 4 1 171 2 1 4 6 0 3 1 172 2 3 4 6 0 3 1 173 2 3 4 7 0 3 1 174 2 1 4 2 0 3 1 175 2 2 4 6 0 2 1 176 2 3 4 7 0 4 1 177 2 3 4 7 0 3 1 178 2 1 4 6 1 4 1 179 1 3 4 6 0 4 0 180 2 3 4 6 0 4 1 181 1 3 4 2 0 3 1 182 2 3 4 7 0 4 1 183 1 3 4 7 0 4 1 184 2 1 4 2 0 4 1 185 1 3 4 6 0 3 1 186 2 3 4 6 0 3 0 187 2 1 4 6 0 4 1 188 2 3 4 6 0 2 1 189 1 2 4 6 0 3 1

94
190 2 3 4 6 0 2 1 1 91 2 2 4 3 0 4 1 192 1 3 4 7 0 3 0 193 2 2 4 2 0 3 0 194 3 3 4 7 0 3 1 195 1 3 4 7 0 2 1 196 2 3 4 6 0 3 0 197 2 1 4 6 0 3 1 198 2 1 4 6 0 4 1 199 1 3 4 6 0 3 1 200 3 1 4 6 0 4 1 201 1 2 4 2 0 3 1 202 1 3 4 6 0 3 0 203 2 2 4 5 0 2 1 204 2 2 4 2 0 3 1 205 1 2 4 6 0 4 1 206 2 3 4 7 0 3 1 207 1 3 4 7 0 4 1 208 2 2 4 6 0 4 1 209 1 2 4 6 0 3 1 210 2 1 4 6 0 3 0 211 1 3 4 7 0 3 1 212 2 3 4 7 0 3 1 213 2 2 4 3 0 3 1 214 1 3 4 2 0 3 1 215 2 2 4 2 0 3 0 216 1 3 4 7 0 2 1 217 2 1 4 6 0 3 1 218 1 3 4 7 0 3 1 219 2 1 4 6 1 2 0 220 1 3 4 7 0 2 1 221 2 2 4 2 0 3 1 222 2 3 4 7 0 2 1 223 2 2 4 7 0 2 1 224 2 2 4 2 0 4 0 225 2 1 4 2 1 3 1 226 2 1 4 2 0 3 1 227 2 1 4 6 0 3 1 228 1 3 4 7 0 3 1 229 1 3 4 7 0 4 0 230 2 1 4 2 0 4 1 231 1 3 4 7 0 3 1
RESID FRED TRANS ~T DIFF RATE SEX
231 231 231 231 231 231 231

SURVEY RESULTS:
SAN ANTONIO
Total Number of Respondents:
Question number, survey response code and totals are shown below:
1. Where is your permanent Residence?
1- Texas
2 - non-Texas state
3 - non-U.S.A. country
2. Is this your fIrst time to the Airport?
1 -Yes, fIrst time to AlP
2 -No, have been to AlP less than fIve times
3 -No, have been to AlP more than fIve times
5. What type of transportation did you use to arrive at the airport?
1 - Passenger car - parked
2 - Passenger car - drop off
3 - Hotel or motel van
4 - Rental car
5 - Public Bus
6 - Taxi or limousine
7 - Other
8 - Transfer of flights
6. How did you find the location of the airport?
1 - Street Address
2 - Street Map
3 - Oral Directions
4 - Map by friend or associate
5 - Written directions
231
117
100
14
40 43
148
37 44
2
138
o 8
o 2
o 23
5
o 2
95

96
6 - Highway signs 65
7 - Other 44
8 - Not applicable 55
9 - No response 37
7. Did you have any problems fmding the airport?
0- No 206
1- Yes 4
2 - Not applicable 21
8. Overall, how would you rate the signing that guided you to the NP?
9. Sex
1 - Not applicable 45
2 - Poor 21
3 - Adequate 100
4 - Excellent 65
o -Female
1- Male
57
174

APPENDIX C.S. SUMMARY OF AIRPORT SURVEY TABULATIONS
SURVEY RESULTS:
ALL SURVEYS
Total Number of Respondents:
Question number, survey response code and totals are shown below:
1. Where is your pennanent Residence?
1- Texas
2 - non-Texas state
3 - non-U.S.A. country
2. Is this your flrst time to the Airport?
1 -Yes, fIrst time to AlP 2 -No, have been to AlP less than flve times
3 -No, have been to AlP more than flve times
5. What type of transportation did you use to arrive at the airport?
1 - Passenger car - parked 2 - Passenger car - drop off
3 - Hotel or motel van 4 - Rental car
5 - Public Bus
6 - Taxi or limousine
7 - Other
8 - Transfer of flights
6. How did you find the location of the airport?
1 - Street Address
2 - Street Map
3 - Oral Directions
4 - Map by friend or associate
5 - Written directions
891
397
448
46
112
154
625
154
100
18
525 2
16
4
72
o 67
40
5
8
97

98
6 - Highway signs 179
7 - Other 234
8 - Not applicable 209
9 - No response 149
7. Did you have any problems fmding the airport?
0- No 754
1 - Yes 25
2 - Not applicable 112
8. Overall, how would you rate the signing that guided you to the AlP?
9. Sex
1 - Not applicable 181
2 - Poor 87
3 - Adequate 371
4 - Excellent 252
O-Female
1 - Male
207
684

BIBLIOGRAPHY
Ambrose, c., and E. R. Hoffmann (1987). "The Necessity for Traffic Sign Installations, as Judged by Local Government Engineers in Melbourne," Australian Road Research 17(3), pp 185-194, Department of Mechanical and Industrial Engineering, University of Melbourne, Parkville, Australia.
American Association of State Highway and Transportation Officials (1984). A Policy on Geometric Design of Highways and Streets.
American Association of State Highway and Transportation Officials (1972). "Driver Expectancy Checklist: A Design Review Tool," Washington, D.C.
Civil Engineering Journal (December 1989), pp 16-17. "Study Links Signage and Highway Fatalities," Study by Center for Transportation of the Council of State Governments, California; comments by Center Director Robert A. Krause.
Cooper, B. R. (1989). "Comprehension of Traffic Signs by Drivers and Non-Drivers," Transport and Road Research Laboratory: Research Report 167, Department of Transport, Berkshire, United Kingdom.
Dewar, Robert (1988). "Criteria for the Design and Evaluation of Traffic Sign Symbols," Transportation Research Board, Dept. of Psychology, University of Calgary, Alberta, Canada.
Dudek, C. L. (1988). "Guide Sign Coding," Technical Memorandum 957-1-1, Texas Transportation Institute.
Dudek, C. L. (1988). "Guide Signs (Trailblazers) for Arterial Routes," Technical Memorandum 957-1-2, Texas Transportation Institute.
Dudek, C. L. (1988). "Guidance to Major Generators," Technical Memorandum 957-1-3. Texas Transportation Institute.
Hussain. S. E, et al (1989). ''Effect of Light Sources on Highway Sign Color Recognition," Transponation Research Board, 68th Annual Meeting.
Institute of Transponation Studies (1988). ''The Effect of Traffic Safety of the 'Lights Out' Demonstration Project," University of California, Irvine, California.
King, Gerhart E (1985). "Application of Guidance and Navigation Systems," Transportation Research Record 1027, Driver Information Needs and Visibility of Traffic Control Devices.
99
King, G. E. and H. Lunenfeld (1971). "Development of Information Requirements and Transmission Techniques for Highway Users," National Cooperative Highway Research Program Report 123.
McMillan, R. G., and R. N. Smith (1989). "'Lights Out' Overhead Guide Sign Demonstration Project," California Department of Transportation.
National Academy of Sciences (1976). "Motorist Information Systems and Services," Transportation Research Record No. 600.
National Academy of Sciences (1980). ''Transportation Information Systems: Application and Uses," Transportation Research Record No. 779.
National Academy of Sciences (1980). "Improving the Accuracy of Information on Direction Signs," Transportation Research Record No. 780.
National Academy of Sciences (1980). "Human Factors and Motorist Information Needs," Transportation Research Record No. 782.
National Academy of Sciences (1983). "Highway Information Systems, Visibility, and Pedestrian Safety," Transportation Research Record No. 904.
National Academy of Sciences (1983). ''Traffic Delineation, Work-Zone Protection, and Winter Maintenance," Transportation Research Record No. 933.
National Academy of Sciences (1984). "Motorist Information Needs and Visibility Factors," Transportation Research Record No. 996.
National Academy of Sciences (1985). "Driver Information Needs and Visibility of Traffic Control Devices," Transportation Research Record No. 1027.
National Academy of Sciences (1986). "Visibility and Highway Navigation," Transportation Research Record No. 1093.
National Academy of Sciences (1987). "Relation Between Safety and Key Highway Features," Transponation Research Board.
National Academy of Sciences (1987). ''Traffic Control Devices and Rail Highway Grade Crossings," Transportation Research Record No. 1114.
National Academy of Sciences (1987). "Visibility for Highway Guidance and Hazard Detection," Transportation Research Record No. 1149.

100
National Academy of Sciences (1987). "Testing Motorist Understanding of Traffic Control Devices," Transportation Research Circular No. 324, Transportation Research Board.
National Academy of Sciences (1988). "Research Problem Statement on User Information Systems," Transportation Research Circular No. 336, Transportation Research Board.
Norwegian Road Department (1987). 1987 Norwegian Manual on Uniform Traffic Control Devices for Roads (Skiltnormaler: Haandbok 050), Oslo, Norway.
Oeveland, R. (1987). "Traffic Signs: Some Concern on the 1987 Norwegian Manual on Uniform Traffic Control Devices for Roads" (Trafficskilt, Diverse Komentarer til Skiltnormalene), Stavanger, Norway.
Rockwell, T. H. (1971). "Strategies in the Design and Evaluation of Road Signs Through the Measurement of Drivers Eye Movement," Report No. HS-014 348, Ohio State University, Columbus.
Singh, A., and M. Spear (1989). "Road Safety Education in Schools and Colleges: Summary Report," Transportation and Road Research Laboratory: Contractor Report 133, Berkshire, United Kingdom.
Texas State Department of Highways and Public Transportation (1980). 1980 Texas Manual on Uniform Traffic Control Devices for Streets and Highways, Austin, Texas.
Thorp, M. A. (1987). "Interstate Sign Sizing Program: Vax! Graphics Version," Transportation Research Board.
Wootton, H. J., and R. S. Burton (1980). "Improving the Accuracy of Information on Direction Signs," Transportation Research Record No. 782 (Human Factors and Motorist Information Needs).
Waldeland, Rolv R. (1988). Characteristics of Traffic (Trafikantenes Karakteristika), Department of Civil Engineering, Rogaland Regional College, Stavanger, Norway.
Worrall, R. D. (1970). "An Analysis of Driver Preferences for Alternative Visual Information Displays," Highway Reseach Record No. HS-010 525.
Woltman, H. L., and T. J. Szczech (1989). "Sign Luminance as a Methodology for Matching Driver Needs, Roadway Variables and Signing Materials," Transportation Research Board, 68th Annual Meeting.