1 outline: six sigma quality and tools iso 9000 service quality measurement six-sigma quality
TRANSCRIPT

1
Outline:Six Sigma Quality and Tools ISO 9000Service Quality Measurement
Six-Sigma Quality

2
Six-Sigma Quality “Six-sigma” is a philosophy
which reflects the goal of eliminating defects in the products.
Seeks to reduce variation in the processes that lead to product defects
The name, “six sigma” refers to the variation that exists within plus or minus six standard deviations of the process outputs
Statistically speaking a process in “six-sigma” control limits will only produce 2 defects per billion units.

3
Six Sigma Quality: DMAIC Cycle
Define, Measure, Analyze, Improve, and Control DMAICDMAIC Developed by General Electric as a means of focusing
effort on quality using a methodological approach Firms striving to achieve six-sigma generally adopt
DMAIC cycle. DMAIC are the typical steps employed in “continuous
improvement” (a.k.a. Kaizen) concept which seeks to continually improve all aspects of production (parts, machines, labor, processes, etc)
Overall focus of the methodology is to understand and achieve what the customer wants
A 6-sigma program seeks to reduce the variation in the processes that lead to these defects

4
Six Sigma Quality: DMAIC CycleCases/examples from classmates
1. Define (D)
2. Measure (M)
3. Analyze (A)
4. Improve (I)
5. Control (C)
Customers and their priorities
Process and its performance
Causes of defects
Remove causes of defects
Maintain quality

5
Example to illustrate the process…
We are the maker of this cereal. Consumer Reports has just published an article that shows that we frequently have less than 15 ounces of cereal in a box.
What should we do?
Step 1: DefineWhat is the critical-to-quality characteristic?The CTQ (critical-to-quality) characteristic in
this case is the weight of the cereal in the box.

6
Step 2 - Measure
How would we measure to evaluate the extent of the problem?
What are acceptable limits on this measure?Let’s assume that the government says that we
must be within ± 5 percent of the weight advertised on the box.
Upper Tolerance Limit = 16 + .05(16) = 16.8 ounces
Lower Tolerance Limit = 16 – .05(16) = 15.2 ouncesWe go out and randomly buy 1,000 boxes of cereal
and find that they weight an average of 15.875 ounces with a standard deviation of 0.529 ounces.
What percentage of boxes are outside the tolerance limits?

7
Upper Tolerance = 16.8
Lower Tolerance = 15.2
ProcessMean = 15.875Std. Dev. = .529
What percentage of boxes are defective (i.e. less than 15.2 oz)?
Z = (x – Mean)/Std. Dev. = (15.2 – 15.875)/.529 = -1.276
NORMSDIST(Z) = NORMSDIST(-1.276) = 0.100978
Approximately, 10 percent of the boxes have less than 15.2 Ounces of cereal in them!

8
Step 3 - Analyze - How can we improve the capability of our cereal box filling process?
Decrease Variation Line vibration impacts scale Random delays in nozzle open/close
Center the Process Increase Specifications

9
Step 4 – Improve – How good is good enough?Motorola’s “Six Sigma”
Calibrate the equipment more frequently, upgrade process
6-sigma minimum from process center to nearest spec
1 23 1 02 3
12
6
1 23 1 02 3
12

10
Step 5 – Control
Statistical Process Control (SPC)Use data from the actual processEstimate distributionsLook at capability - is good quality possibleStatistically monitor the process over time

11
Analytical Tools for Six Sigma and Continuous Improvement: FlowchartFlowchart

12
Analytical Tools for Six Sigma and Continuous Improvement: RunchartRunchart
Can be used to identify when equipment or processes are not behaving according to specifications
Can be used to identify when equipment or processes are not behaving according to specifications
0.440.460.48
0.50.520.540.560.58
1 2 3 4 5 6 7 8 9 10 11 12Time (Hours)
Dia
me
ter
MEASURE

13
Analytical Tools for Six Sigma and Continuous Improvement: ChecksheetChecksheet
Billing Errors
Wrong Account
Wrong Amount
A/R Errors
Wrong Account
Wrong Amount
Monday
Can be used to keep track of defects or used to make sure people collect data in a correct manner (MEASUREMEASURE)
14
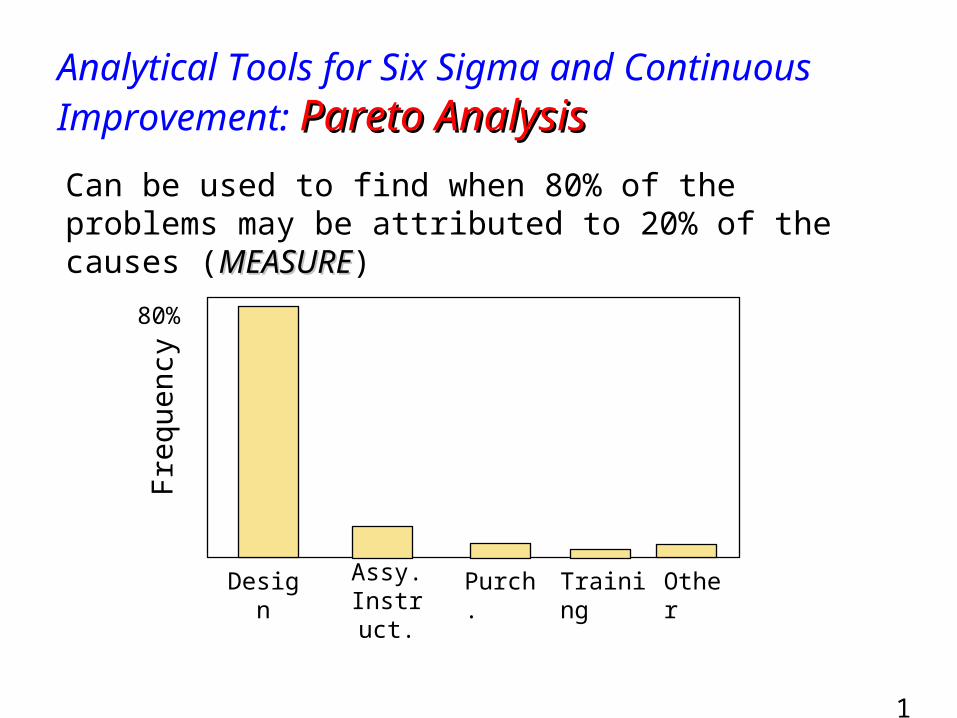
Analytical Tools for Six Sigma and Continuous Improvement: Pareto AnalysisPareto Analysis
Assy.Instruct.
Fre
quen
cy
Design Purch. Training Other
80%
Can be used to find when 80% of the problems may be attributed to 20% of the causes (MEASUREMEASURE)

15
Analytical Tools for Six Sigma and Continuous Improvement: HistogramHistogram
Nu
mb
er
of
Lo
ts
Data RangesDefects
in lot0 1 2 3 4
Can be used to identify the frequency of quality defect occurrence and display quality performance (MEASURE)MEASURE)

16
Analytical Tools for Six Sigma and Continuous Improvement: Cause & Effect Cause & Effect DiagramDiagram

17
Analytical Tools for Six Sigma and Continuous Improvement: Opportunity Flow Diagram
IMPROVE
Value added activities (Vertical steps) vs.
Non-value added activities (horizontal steps)

18
Analytical Tools for Six Sigma and Continuous Improvement: Control ChartsControl Charts
Can be used to monitor ongoing production process quality and quality conformance to stated standards of quality

19
Other Six Sigma Tools
Failure Mode and Effect Analysis (FMEA) is a structured approach to identify, estimate, prioritize, and evaluate risk of possible failures at each stage in the process
Design of Experiments (DOE) a statistical test to determine cause-and-effect relationships between process variables and output a.k.a. multivariate analysis (testing) i.e., testing multiple independent variables (X’s) with
respect to a dependent variable (Y)

20
The Shingo System: Fail-Safe Design
Shingo’s argument: SQC methods do not prevent defects Defects arise when people make errors Defects can be prevented by providing
workers with feedback on errors
Poka-Yoke includes:1. Checklists2. Special tooling that
prevents workers from making errors Gives rapid feedback of abnormalities to worker in
time to correct them
21
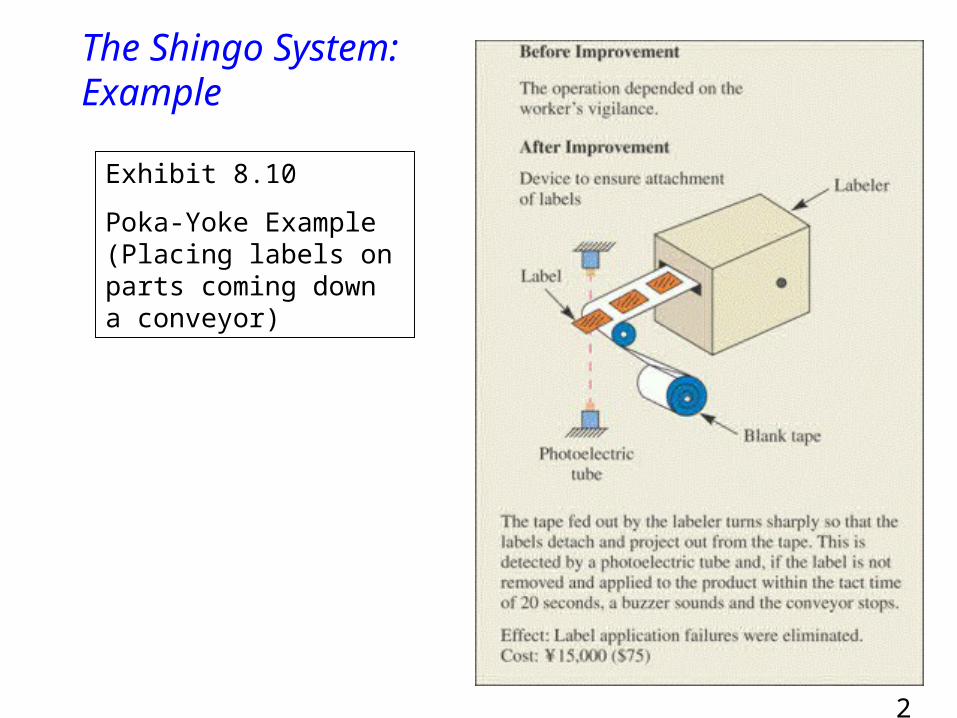
The Shingo System: Example
Exhibit 8.10
Poka-Yoke Example (Placing labels on parts coming down a conveyor)

22
ISO 9000 Series of standards agreed upon by the International
Organization for Standardization (ISO)
Adopted in 1987
More than 100 countries
A prerequisite for global competition?
ISO 9000 directs you to "document what you do and then do as you documented."
1. First party: A firm audits itself against ISO 9000 standards
2. Second party: A customer audits its supplier
3. Third party: A "qualified" national or international standards or certifying agency serves as auditor
Is it important for small or medium sized businesses to have ISO 9000 certification?
23
External Benchmarking Steps
1. Identify those processes needing improvement 2. Identify a firm that is the world leader in
performing the process Obviously not a direct competitor Possibly from another industry
3. Contact the managers of that company and make a personal visit to interview managers and workers
4. Analyze data Compare the processes Compare the results (performance of the processes)