1 microplastics in facial exfoliating cleansers michelle chang
TRANSCRIPT

Michelle Chang Microplastics in Facial Exfoliating Cleansers Spring 2013
1
Microplastics in Facial Exfoliating Cleansers
Michelle Chang
ABSTRACT
Research regarding marine pollution has primarily emphasized macroplastics (>5mm diameter),
but is increasingly focusing on the impacts of microplastics (<5mm) on the marine environment.
In my study, I observed microplastic beads found in nine facial exfoliating cleansers that listed
polyethylene as an ingredient. Three brands of nationally top-grossing facial cleansers available
in American supermarkets (Clean & Clear, L’Oreal, Neutrogena) were used to characterize size,
color, and mass of the polyethylene beads. The beads ranged from 60-800 m in diameter, with a
264 m overall mean, 102 standard deviation and a (254-274) 95% confidence interval. To
determine consumer use habits for these products, I surveyed a population of 175 individuals
over a period of three months via an online survey. I discovered that, though 35% of my sample
population used the microplastic-containing cleansers, 50% used alternatives that did not include
microplastics. Of those that did use microplastic-containing products, I used their usage rates and
frequencies to calculate annual microplastic contribution to the wastewater stream. I found that
Clean & Clear Daily Pore Cleanser contributed most microplastic to the waste stream per
consumer per year (with 2.68g) while Neutrogena Oil-free Acne Wash Pink Grapefruit,
contributed the least (0.539g/year). After modeling my survey results onto the UC Berkeley
student residential hall population, I estimated that a total of 5000 g of microplastic was going
into the waste stream annually. Knowing about microplastic pollution in the environment and
choosing natural alternatives can divert microplastic from the waste stream and mitigate potential
environmental risk.
KEYWORDS
polyethylene, market reports, consumer usage, wastewater stream, marine pollution

Michelle Chang Microplastics in Facial Exfoliating Cleansers Spring 2013
2
INTRODUCTION
Marine debris is any persistent, manufactured or processed solid material discarded,
disposed of or abandoned in the marine and coastal environment (Galgani et al. 1996). A large
proportion of marine debris consists of plastics sourced from land use, wastewater and industrial
treatments, waste disposal, and shipboard dumping (Jeftic et al. 2009, Arthur and Baker 2011).
Microplastics are generally considered to be plastic particles smaller than 5 millimetres in
diameter (Arthur et al. 2009). These particulates are accumulating in habitats and outnumbering
larger debris (Thompson et al. 2004, Browne et al. 2010). While studies have confirmed the
detrimental effects of macroplastics on marine ecosystems, only recently has research started
exploring the impacts of microplastics. The two sources of microplastic are fragments resulting
from the degradation of larger items such as bags and containers, and pellets used as feedstock in
the plastics industry and in certain applications such as abrasive cleansers (Bowmer and Kershaw
2010).
Abrasive scrub cleansers were developed when people realized that mechanical
exfoliation – the process of removing the outermost layer of skin with an abrasive material–
produces smoother skin (Decker and Graber 2012, Draelos 2005). Abrasive scrubs incorporate
natural and synthetic materials including polyethylene beads, aluminum oxide, ground fruit pits,
and sodium tetraborate decahydrate granules to induce various degrees of exfoliation (Mills
1979). According to the American Academy of Dermatology, polyethylene beads are commonly
used because their smoothness causes less redness and damage to the skin than some other
materials, such as ground fruit pits.
Polyethylene is the most commonly used plastic. Beads made of polyethylene in facial
cleansers have been found to be from 4 µm to 1mm in size, which makes them a form of
microplastics (Fendall and Sewell 2009, Piringer and Baner 2008). A 2009 study by the
University of Auckland in New Zealand revealed that because the majority of facial cleansers
now contain polyethylene microplastics, the average person is now likely to use cleansing
products with microplastics on a daily basis. Consumers tend to focus on personal health benefits
or hazards while purchasing products with less focus on the environmental impacts of their
products. Plastic persists in the environment and has a slow degradation rate. If microplastics

Michelle Chang Microplastics in Facial Exfoliating Cleansers Spring 2013
3
from facial cleansers are entering the wastewater stream from consumer usage, whether they are
filtered our may be a concern to the marine environment.
Microplastics that escape filtration have the potential to persist in the environment, travel
long distances, serve as surface on which organisms grow, and attract organic contaminants
(Arthur and Baker 2011). Research has shown that suspension-feeding sea cucumbers along with
range of organisms including mussels, barnacles, lugworms, and tiny crustaceans do ingest
plastic particles, though it is unknown if plastic ingestion adversely affects their physiology or
fitness (Graham et al. 2009). New research also suggests that polyethylene is an excellent
transporter of hydrophobic organic contaminants such as phenanthrene, a byproduct of fossil fuel
burning that is a dangerous ocean pollutant (Teuten et al. 2007). The potential chemical impacts
of the microplastics themselves are still unknown.
To date, no one has detected consumer cleansing product plastic beads in the
environment, yet their presence is almost certain due to existing wastewater treatment filtration
methods and observed sizes of the plastic beads. Barriers to detection lie mainly in the
methodological challenges of quantifying tiny plastic fragments in the environment (Loe 2012,
Browne et al. 2010). Thus, there is a need to take steps toward clarifying the risks on the natural
environment of using products that contain microplastics. To address these gaps in knowledge, I
will attempt to characterize the physical properties of the polyethylene beads, determine how
much polyethylene from facial scrubs enters the wastewater stream by surveying consumer use,
and explore the ramifications of microplastics going unfiltered into the ocean.
METHODS
Selecting Product Samples
I characterized the leading skincare brands from Mintel Reports (academic.mintel.com),
an online database of market reports on the beauty and personal care, drink, food, foodservice,
health and wellbeing, household, lifestyles, retailing and apparel, consumer technology, and
travel industries. Mintel is an independent, award-winning provider of world-leading market
intelligence, delivering robust information, analysis and critical recommendations. I used the
brand share information, which provided the annual top grossing brands of facial cleansers and

Michelle Chang Microplastics in Facial Exfoliating Cleansers Spring 2013
4
acne washes in the U.S., to determine from which brands to sample (Appendix A). I selected the
three top grossing brands, which were Neutrogena, Clean & Clear, and L’Oreal Paris. To narrow
down which products within these brands to sample, I observed the reviews and ratings of
various products on Amazon.com. I also consulted the local Walgreens in Berkeley, CA to
determine which products were available and accessible to the majority of my survey population.
With the assumption that consumers purchased items online that received higher ratings and
reviews, and bought items that were available in stores, I decided on 5 Neutrogena, 3 Clean &
Clear and 1 L’Oreal Paris cleanser for a total of 9 product samples (Table 1). I selected these
particular quantities of products within the three brands to sample according to their relative
rankings in Mintel’s top-grossing brand share report. All sample products listed polyethylene in
their ingredient list.
Table 1. Product information. Selected product brands, names and approximate prices.
Brand Product Price (USD)
Clean & Clear Morning Burst Scrub Oil-free 10
Clean & Clear Deep Action Exfoliating Scrub Oil-free 6
Clean & Clear Daily Pore Cleanser 6
L'Oreal 360 Go Clean 5
Neutrogena Oil-free Acne Wash Daily Scrub 7
Neutrogena Clear Pore Daily Scrub 6
Neutrogena Deep Clean Gentle Scrub 6
Neutrogena Deep Clean Invigorating Foaming Scrub 6
Neutrogena Oil-free Acne Wash Pink Grapefruit 6
Microplastic Bead Quantification
To characterize the polyethylene beads in the cleansers, I separated beads from 3ml
extractions of each product by washing with distilled water and vacuum filtering over coffee
filters cut into 9 cm diameter circles. The microplastic beads characteristics I examined were (a)
size, (b) color, (c) volume, (d) mass, and (e) concentration in product. I used a dissecting scope at

Michelle Chang Microplastics in Facial Exfoliating Cleansers Spring 2013
5
40X magnification with an ocular micrometer with 1000 marks calibrated to 1 mm to observe the
size and colors of the beads. For each brand I measured the diameters in number marks, which I
later converted to microns and millimeters, of the first 10 pieces of microplastic I encountered in
each extraction, and did five measurement repetitions (Total N = 50 pieces per brand). Using R
statistical analysis, I retrieved the mean, median, 95% confidence intervals (CI) and standard
deviations (SD) for the bead sizes examined in each extraction. The bead sizes in microns were
used for comparison to wastewater filter sizes, and the sizes in millimeters were used to calculate
volume of microplastic in each extraction as well as in each entire bottle of product. I made my
calculations with the assumption that each bead was a sphere. I used the mass of beads from each
extraction along with consumer survey results to determine consumer contribution of
microplastic through usage. To determine the concentration of beads in each product, I placed
the filtered beads into a 36 cm2 gridded square petri dish. The petri dish was shaken to distribute
the beads. For each product, I chose three 1 cm2 squares at random, and counted the number of
beads that occurred in each square. I averaged the number of beads from the three counts and
determined the mean number of beads that occurred in one square. I multiplied the mean by the
total number of squares encompassing the petri dish for the number of beads per 3 ml of product.
I scaled up the calculations to attain bead count for the whole bottle of each sample product.
Survey for Consumer Use
To obtain customer usage data, I used SurveyMonkey to compile a nine-question online
survey (Appendix B), which I distributed through email and various social media including
Facebook, Pinterest, Google+, and Twitter. The population consisted of mainly my peers,
friends, family, and acquaintances. I surveyed 175 consumers over a span of 3 months. The
survey asked participants for their demographics, including age, race and income, which brand of
cleanser they used, how much of it they used, how often they used it, and if they knew there were
microplastics in facial cleansers. I used the survey results to model onto a larger population with
similar demographics in order to estimate consumer microplastic contribution into the
wastewater stream.
Modeling Microplastic in Wastewater Stream

Michelle Chang Microplastics in Facial Exfoliating Cleansers Spring 2013
6
To estimate the amount of microplastic entering the East Bay wastewater treatment
facility from consumer cleanser usage, I made calculations using the usage survey results and
bead size data. In the consumer survey, I asked the frequency with which each consumer used
the product, and how much they used during each application. I used photos imbedded in the
survey to demonstrate three various amounts to select from (quarter, nickel, and dime-sized). To
calculate how much microplastic was in each application amount of every sample product, I
divided the mass of microplastic filtered from each 3ml extraction of product by 3, then
multiplied by the volume of product that made up the size of each coin. For each survey
response, I multiplied the selected usage frequency with its respective usage amount and scaled it
up to grams per year for each survey participant’s personal contribution of microplastic. I sorted
all the responses and totaled them by sample types (A-I) to compare microplastic contribution
across the products.
To examine microplastic contribution on a larger scale, I modeled my results onto a
population with similar demographics, the UC Berkeley student housing resident population. The
student dormitories included Clark Kerr with 900 residents, Foothill with 791 residents, Bowles
with 192 residents, Stern with 267 residents, and the Units 1, 2, and 3 with 1434, 1435, and 1240
residents for a total of 6259 residents (housing.berkeley.edu). Using the bootstrapping method in
R, I was able to resample from my survey results data by simulating the sample size to 1000 for
each product sample to estimate a more accurate usage mean (g/yr) to calculate usage from the
entire student housing population. With estimated means for each product, I multiplied the
percentages of my surveyed population who used each product by the total resident hall
population as well as the means. These calculations gave me microplastic contribution from the
resident hall population for a year given the assumption that they used the sampled products at
similar rates and frequencies to my survey population.
RESULTS
Characteristics of Microplastic Beads
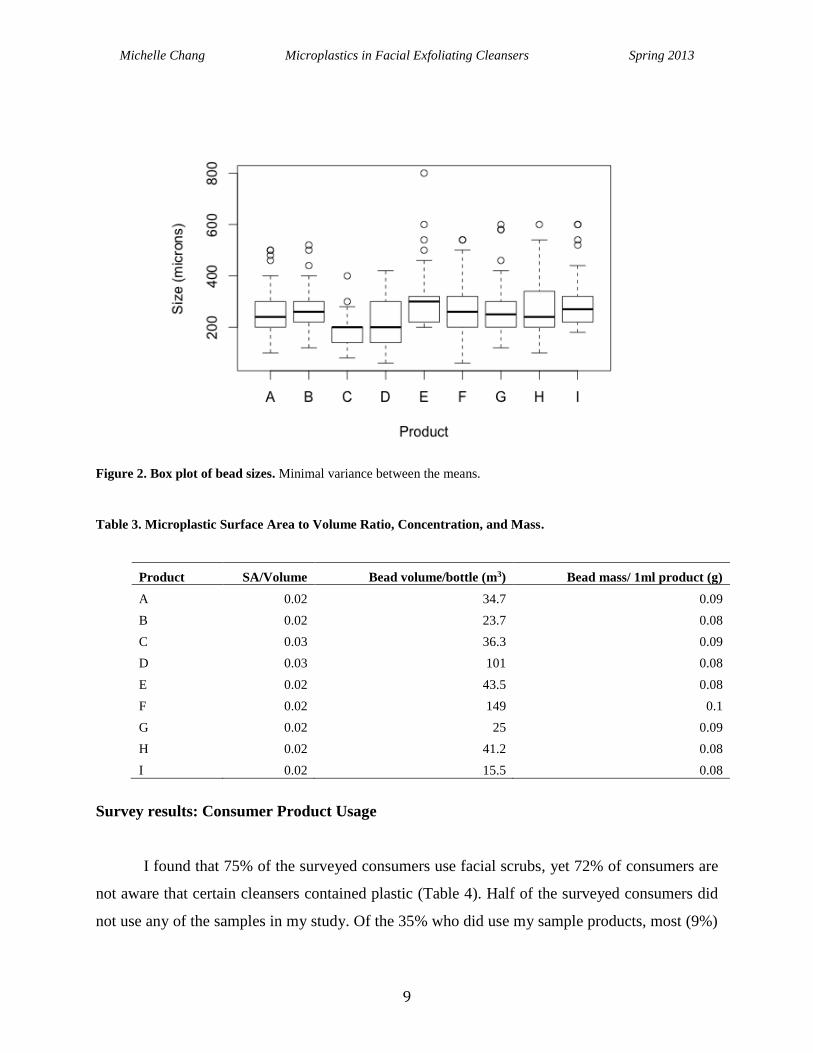
I observed variations in microplastic bead sizes, yet the means and medians of each
product were relatively similar. Microbead sizes ranged from 60-800 µm in diameter, with an

Michelle Chang Microplastics in Facial Exfoliating Cleansers Spring 2013
7
overall mean of 264 microns and standard deviation of 102 microns (Table 2.) Products D,
L’Oreal 360 Go Clean and F, Neutrogena Clear Pore Daily Scrub had the smallest beads at 60
microns, while Product E, Neutrogena Oil-free Acne Wash Daily Scrub had the largest at 800
microns. Product F, Neutrogena Clear Pore Daily Scrub had the largest variation in sizes (60-
540) with a SD of 130 (Table 2, Figure 1, 2).
The SA/Volume ratios were consistently low (0.02-0.03) and bead mass per 1 ml of
product varied little across the products (0.09-1 g). Product F, Neutrogena Clear Pore Daily
Scrub contained the most volume of plastic at 149 m3 per bottle while Product I, Neutrogena Oil-
free Acne Wash Pink Grapefruit contained the least at 15.5 m3 per bottle (Table 3).
Table 2. Microplastic Measurements. Size of microplastic beads in nine facial exfoliating cleansers. N=50 beads
per product sample: (A) Clean & Clear Morning Burst Scrub Oil-free, (B) Clean & Clear Deep Action Exfoliating
Scrub Oil-free, (C) Clean & Clear Daily Pore Cleanser, (D) L'Oreal 360 Go Clean, (E) Neutrogena Oil-free Acne
Wash Daily Scrub, (F) Neutrogena Clear Pore Daily Scrub, (G) Neutrogena Deep Clean Gentle Scrub, (H)
Neutrogena Deep Clean Invigorating Foaming Scrub, (I) Neutrogena Oil-free Acne Wash Pink Grapefruit
Product Mean (microns) SD Range Median 95% CI
A 272 89 100-500 240 247-297
B 271 81 120-520 260 248-294
C 183 58 80-400 200 167-200
D 215 98 60-420 200 187-242
E 317 110 200-800 300 285-350
F 265 130 60-540 260 230-301
G 274 120 120-600 250 241-307
H 286 120 100-600 240 256-316
I 293 120 180-600 270 264-322

Michelle Chang Microplastics in Facial Exfoliating Cleansers Spring 2013
8
Figure 1. Photomicrographs of the microplastics and colored inclusions in facial cleanser products A-I. Scale
bar in all panels 500 µm. All products included white, opaque microplastic beads. Brand D contained walnut husk
fragments as additional abrasive material. Other colored material composition unknown.
Michelle Chang Microplastics in Facial Exfoliating Cleansers Spring 2013
9
Figure 2. Box plot of bead sizes. Minimal variance between the means.
Table 3. Microplastic Surface Area to Volume Ratio, Concentration, and Mass.
Survey results: Consumer Product Usage
I found that 75% of the surveyed consumers use facial scrubs, yet 72% of consumers are
not aware that certain cleansers contained plastic (Table 4). Half of the surveyed consumers did
not use any of the samples in my study. Of the 35% who did use my sample products, most (9%)
Product SA/Volume Bead volume/bottle (m3) Bead mass/ 1ml product (g)
A 0.02 34.7 0.09
B 0.02 23.7 0.08
C 0.03 36.3 0.09
D 0.03 101 0.08
E 0.02 43.5 0.08
F 0.02 149 0.1
G 0.02 25 0.09
H 0.02 41.2 0.08
I 0.02 15.5 0.08

Michelle Chang Microplastics in Facial Exfoliating Cleansers Spring 2013
10
used Product E, Neutrogena Oil-free Acne Wash Daily Scrub, while none used Product D,
L'Oreal 360 Go Clean. A trend I saw in the “Other” products used was that 9.7% of the total
surveyed consumers used St. Ives Apricot scrub cleanser.
Factoring in consumer usage frequencies and rates from the survey, I discovered that on
an average per consumer rate, Product F, Neutrogena Clear Pore Daily Scrub contributed the
most microplastic annually at 2.68 g/yr while Product I, Neutrogena Oil-free Acne Wash Pink
Grapefruit contributed the least at 0.54 g/yr (Figure 3). Summing up all consumer responses for
each product, I found that Product A, Clean & Clear Morning Burst Scrub Oil-free contributed
the most microplastic annually at 10.5 g/yr while Product H, Neutrogena Deep Clean
Invigorating Foaming Scrub contributed the least at 1.83 g/yr (Figure 4).
I determined that my surveyed population demographics (61% Asian race, 31% earning
$0-$24,999/yr, and 69% aged 21-29) were similar to the demographics of the UC Berkeley
student housing population (Table 5). Scaling up my survey responses, I calculated the total
annual microplastic contribution from the student housing to be 5000 g (Table 6).
Table 4. Survey Responses. N=175 participants.
Question Percentage %
Do you use a facial scrub?
Yes 75%
No 20%
Product used
Clean & Clear Morning Burst Scrub Oil-free 6.29%
Clean & Clear Deep Action Exfoliating Scrub Oil-free 4.00%
Clean & Clear Daily Pore Cleanser 1.71%
L'Oreal 360 Go Clean 0.00%
Neutrogena Oil-free Acne Wash Daily Scrub 9.14%
Neutrogena Clear Pore Daily Scrub 1.14%
Neutrogena Deep Clean Gentle Scrub 2.86%
Neutrogena Deep Clean Invigorating Foaming Scrub 1.71%
Neutrogena Oil-free Acne Wash Pink Grapefruit 8.00%
Other 49.7%
NA 15.4%

Michelle Chang Microplastics in Facial Exfoliating Cleansers Spring 2013
11
Figure 3. Average annual microplastic contribution per consumer by product. Product F contributes the most
microplastic annually per individual consumer use.
Figure 4. Total Annual Microplastic Contribution by Product. Sum of annual consumer usage according to
brand.
0 1 2 3
D
I
E
B
H
A
G
C
F
mass (g)
Pro
du
ct
0 2 4 6 8 10 12
D
H
B
C
F
G
I
E
A
Mass (g)
Pro
du
ct
Are you aware that there are plastics in certain facial scrubs?
Yes 28%
No 72%

Michelle Chang Microplastics in Facial Exfoliating Cleansers Spring 2013
12
Figure 5. Box plot Annual Consumer usage rates by brand
Table 5. Survey Demographics
Background Variable Sample Background Variable Sample
%
%
Age
Income
17 and under 1% $0-$24,999 31%
18-20 18% $25,000-$49,999 17%
21-29 69% $50,000-$74,999 13%
30-39 6% $75,000-$99,999 7%
40-49 4% $100,000-$124,999 6%
50-59 2% $125,000-$149,999 5%
$150,000-$174,999 6%
Race
$175,000-$199,999 4%
White 22% $200,000 and up 11%
Asian 61%
Black or African American 2%
Native Hawaiian or Other Pacific Islander 3%
American Indian or Alaska Native 1%
Other 11%
Michelle Chang Microplastics in Facial Exfoliating Cleansers Spring 2013
13
Table 6. Modeling survey usage rates on UC Berkeley student residential hall population.
Total population = 6259 residents. Total annual microplastic contribution 5000 g.
Product Usage rate Dorm users Bootstrap mean Dorm use (g/yr)
A 18.03% 1130 0.95 1070
B 11.48% 718 0.57 412
C 4.92% 308 1.51 465
D 0.00% 0 0 0
E 26.23% 1640 0.57 931
F 3.28% 205 2.66 545
G 8.20% 513 1.14 585
H 4.92% 308 0.61 188
I 22.95% 1440 0.54 783
DISCUSSION
Polyethylene in facial scrubs as a source of microplastic marine pollution is poorly
understood. By characterizing the physical properties of microplastic beads found in a sample of
products, I found little variation in sizes and colors across brands. This suggests that producers
may have a uniform standard. The bead sizes in the products I sampled were all small enough to
bypass filtration in certain wastewater treatment facilities. From my survey, I discovered that
though my sample population was using the microplastic-containing cleansers, many used
alternatives that did not include microplastics. The majority of my survey population did use a
facial scrub, but were not aware that it contained plastic particles. Combining microplastic
characterization with consumer use and opinion, I gathered from this study new insights into an
unexpected source of potential plastic pollution.
Microplastic characterization
The microplastics I found in the facial scrub products had sizes close to the overall mean,
signifying that there is minimal variation across brands. Particle size is most likely kept to a
roughly standard size because an abrasive on the skin that is too large can be too harsh on the
skin, while a one that is miniscule could prove to be ineffective as an abrasive. While measuring
the microplastics size, beads often got caught in the syringe I used; thus the volume of

Michelle Chang Microplastics in Facial Exfoliating Cleansers Spring 2013
14
microplastics may have been underestimated. It was also difficult to replicate exact amounts of
product in each sample as the products differed in viscosity.
I found that the microplastic beads were all white and opaque in colors, which fall under
the color categories of microplastics commonly found in the North Pacific Central Gyre (NPCG).
These colors are similar to those of the area’s plankton, a primary food source for surface
feeding fish (Boerger et al. 2010). In one study, white, opaque spherules were selectively
consumed by 8 species of fish out of 14 species examined (Carpenter et al. 1972); thus, there is a
high likelihood that cleanser microplastics making it to the ocean could be mistaken for plankton
by a number of fish species. Though the exact physiological effects of plastic ingestion still
require further study, ingestion of plastics may lead to intestinal blockage in smaller fish and risk
of polychlorinated biphenyls absorption. (Derraik 2002) The low surface to volume ratio
indicates a slower degradation rate, which is concerning, since polyethylene takes years to break
down.
Consumer Survey
I surveyed 175 individuals through an online survey, which yielded results I did not
anticipate. Forty-nine point seven percent of surveyed consumers did not use any of the products
I chose to sample; instead, these people used alternatives, most of which did not contain
microplastics. My survey population was made up of primarily friends and family as my survey
was distributed through social media. There could have been bias as my target audience mostly
resided in the Bay Area, a community of more environmentally conscious individuals and not
quite an accurate portrayal of the nationwide consumer use. (Svoboda et al. 2008)
From those who did use the products I sampled, I modeled product use onto the UC
Berkeley student residential hall community nationwide scale and found that 5000 g of
microplastic was going into the wastewater stream per year. If consumers switched over to
natural alternative cleansers, 5000 g of microplastic - the equivalent of 2500 Ziploc sandwich
bags (16.5 cm x 14.9 cm) - could be diverted from the wastewater stream every year.
Of the alternatives listed by my survey respondents, St. Ives Apricot Scrub was the most
popular brand used instead of Neutrogena, Lo’real, and Clean & Clear. Instead of microplastic,
St. Ives uses crushed walnut husk as an abrasive material. To explore this trend, I asked several

Michelle Chang Microplastics in Facial Exfoliating Cleansers Spring 2013
15
people why they found St. Ives appealing and they specified that the inviting image of the
apricot, the packaging, and the price seemed attractive to them.
To gather more insight on consumer buying behavior, I conducted a quick follow-up
survey (Appendix C) asking consumers what motivated them towards their purchasing decisions.
Using a Likert scale of importance, I found that the majority of consumers considered price as
moderately important, product effectiveness as very or extremely important, product packaging
as slightly important, and were highly influenced by graphics as well as the bottle shape.
Consumers specified that within the graphics, they paid attention to layout of text, text color
(particularly bright colors), description of effectiveness, pictures, and creative and visually
appealing patterns. They also mostly considered having knowledge of the ingredient list as
slightly important and the environmental impacts of the product as moderately important, while
all consumers considered their products safe to use. Knowing that there is plastic in the product,
most consumers are not at all likely to purchase it, and would very likely stop using a product
that they now know contains plastic.
Cosmetic and personal care product packaging has evolved from simple utilitarian
containers to commercial works of art that entice the consumer to purchase the contents.
Consumers have become more aware of environmental issues and have now become increasingly
aware of the negative impact of superfluous packaging, opting for more “eco-friendly” or “green
packaging”. Not only does the package have to be visually and sensually appealing, but it must
also encompass the essence of naturalness, environmental compatibility, and
healthfulness (Rosette et. al 2012).
Wastewater Treatment
Knowing the potential amount of microplastic that is entering the wastewater stream, I
wanted to know how it would be treated by wastewater facilities. East Bay Municipal Utilities
District’s (EBMUD) provides water and sewage treatment for customers in portions of Alameda
County and Contra Costa County in California, on the eastern side of the San Francisco bay,
which are the primary residential areas of my survey population.
A maximum of 2.2 million gallons per day (MGD) of the annual average daily plant flow
of 62 MGD can be processed through the EBMUD’s East Bayshore Water Recycling Plant,

Michelle Chang Microplastics in Facial Exfoliating Cleansers Spring 2013
16
which includes a microfiltration system in its tertiary treatment process with a filter size of 0.1
microns. The remaining flow receives secondary treatment only and does not undergo filtration
prior to discharge to San Francisco Bay. EBMUD allows 96% of its 62 million gallons to go
unfiltered every day. Therefore, microplastics are highly likely to bypass filtration and go
straight into the wastewater stream; in the Bay Area, most of this wastewater is diverted directly
to the ocean (Vincent De Lange, EBMUD Senior Civil Engineer).
A previous study found that the largest recorded abundance and mass of plastic found in
the surface layer of the Pacific Ocean was 334,271 pieces/km2 and 5114 g/km2 2, respectively.
Plankton abundance was approximately five times higher than that of plastic, but the mass of
plastic was approximately six times that of plankton. (Moore et al. 2001) Clearly, plastics have
been escaping wastewater filtration and going into the ocean.
Future directions
Given the evidence from my current study that a large volume of microplastics may be
entering the environment, further studies should be done to quantify these amounts. The most
easily accessible places to begin would be with urban beaches to determine if any particulates
found are sourced from facial scrubs. These particulates would be analyzed and compared to the
beads I found in my study samples according to size and color. A nationwide survey of product
use would be helpful to determine the volume of plastic being used by a more diverse
demographic. An opinion survey could also be useful to see what motivates consumers to
purchase certain brands and if behavior changes can be made if plastic in facial cleansers is made
more explicit to consumers.
Broader Implications and Conclusions
My study explored a source of plastic pollution and its journey from consumer to
wastewater stream. Now that facial scrubs are recognized as potential sources of microplastics
pollution with the risk of ingestion by marine organisms, wastewater facilities should take note
and adjust their filtering practices accordingly. Consumers should educate themselves and avoid
microplastic-containing cleansers to minimize their contribution to plastic pollution. Plastics

Michelle Chang Microplastics in Facial Exfoliating Cleansers Spring 2013
17
affect marine biota and take a long time to degrade. Perhaps increasing the appeal of alternative
organic facial scrubs and alerting people to the damage microplastics can do to the marine
environment can be used to shift consumer behavior and usage.
ACKNOWLEDGEMENTS
Thank you ES 196 team, Patina Mendez, Kurt Spreyer, Carrie Cizauskas, Anne Murrary and
Rachael Marzion for providing constant guidance throughout the whole process. Special thanks
to my mentor Patina Mendez for helping me develop my methods and analysis and connecting
me with the Resh Lab, where I was able to perform the majority of my methods, as well as
Carrie Cizauskas for painstakingly going over my writing and working with me through the
challenges of shaping my thesis. ES196ers, Katrina Velasco and Janet Hsiao helped me access
the Resh Lab on multiple occasions. Vince de Lange of East Bay Municipal Utility District gave
me specifics on the wastewater treatment process. Thank you Dara O’Rouke and Richard Park,
who answered my numerous questions and fostered my initial interest to analyze cosmetics with
their online database, The GoodGuide. My dear roommate, Diana Li suggested the bootstrap
analysis for my data. Last, but certainly not least, thank you my fellow Mini moles, Toby Haass
Walpert, Jeffrey Wong, Emily Gilson, Robin Kim, and Gabriella Vozza for peer editing as well
as moral support.
REFERENCES
Arthur, C., J. Baker, and H. Bamford, editors. Proceedings of the international research
workshop on the occurrence, effects, and fate of microplastic marine debris. NOAA
Technical Memorandum NOS-OR&R-30.
Arthur, C. and J. Baker, editors. Proceedings of the second research workshop on
microplastic debris. NOAA Technical Memorandum NOS-OR&R-39. University of
Washington, Tacoma, Washington, USA.
Boerger, C. M., Lattin, G. L., Moore, S. L., and Moore, C. J. 2010. Plastic ingestion by
planktivorous fishes in the North Pacific Central Gyre. Marine Pollution Bulletin 60:
2275-2278.

Michelle Chang Microplastics in Facial Exfoliating Cleansers Spring 2013
18
Browne, M. A., T. S. Galloway, and R. C. Thompson. 2010. Spatial patterns of plastic debris
along estuarine shorelines. Environmental Science & Technology 44: 3404-3409.
Browne, M. A., P. Crump, S. J. Niven, E. Teuten, A. Tonkin, T. Galloway, and R. Thompson.
2011. Accumulation of Microplastic on Shorelines Woldwide: Sources and Sinks.
Environmental Science & Technology 45:9175–9179.
Bowmer, T. and Kershaw, P. 2010. Proceedings of the GESAMP International Workshop on
microplastic particles as a vector in transporting persistent, bioaccumulating and toxic
substances in the oceans. 28-30th June 2010, UNESCO-IOC, Paris. GESAMP Reports &
Studies No. 82
Carpenter, E.J., Anderson, S.J., Harvey, G.R., Miklas, H.P., and Peck, B.B. 1972. Polystyrene
spherules in coastal waters. Science 178: 749-750.
Derraik, J. G. B. 2002. The pollution of the marine environment by plastic debris: a review.
Marine Pollution Bulletin 44: 842-852.
Decker, A. and E. M. Graber. 2012. Over-the-counter acne treatments: a review. Journal of
Clinical and Aesthetic Dermatology 5: 36.
Draelos, Z.D. 2005. Reexamining methods of facial cleansing. Cosmetic Dermatology 18: 172–
175.
Fendall, L. S., and M. A. Sewell. 2009. Contributing to marine pollution by washing your face:
Microplastics in facial cleansers. Marine Pollution Bulletin 58:1225–1228.
Galgani, F., A. Souplet, and Y. Cadiou. 1996. Accumulation of debris on the deep sea floor off
the French Mediterranean coast. Marine Ecology Progress Series, 142: 225-234.
Graham, E. R., and J. T. Thompson. 2009. Deposit- and suspension-feeding sea cucumbers
(Echinodermata) ingest plastic fragments. Journal of Experimental Marine Biology and
Ecology 368:22–29.
Jeftic, L., S. Sheavly, and E. Adler. 2009. Marine litter: a global challenge. United Nations
Environment Programme 232.
Loe, V. 2012. What is plastic doing in my face scrub? NOAA’s Response and Restoration Blog.
< http://usresponserestoration.wordpress.com/2012/03/30/what-is-plastic-doing-in-my-
face-scrub/> Accessed 10/4/12
Mills, O. H. and A. M. Kligman. 1979. Evaluation of abrasives in acne therapy. Cutis 23:704-
705.

Michelle Chang Microplastics in Facial Exfoliating Cleansers Spring 2013
19
Mintel Reports
Moore, C. J. 2008. Synthetic polymers in the marine environment: A rapidly increasing, long-
term threat. Environmental Research 108: 131-139.
Piringer, O. T. and A. L. Baner. 2008. Plastic packaging: interactions with food and
pharmaceuticals. John Wiley & Sons. KGaA, Weinheim, Germany.
R Development Core Team (2009). R: A language and environment for statistical computing.
R Foundation for Statistical Computing, Vienna, Austria. ISBN 3-900051-07-0, URL
http://www.R-project.org.
Rosette, J. L., Yablonski, J., Mancuso, S. and Kale, G. 2012. Packaging, Cosmetics and
Pharmaceuticals. Kirk-Othmer Encyclopedia of Chemical Technology. 1–14.
Svoboda, E., E. Mika, and S. Berhie. 2008. America’s 50 Greenest Cities. Popsci.
<http://www.popsci.com/environment/article/2008-02/americas-50-greenest-cities >
Accessed 3/20/13
Teuten, E. L., S. J. Rowland, T. S. Galloway, and R. C. Thompson. 2007. Potential for plastics to
transport hydrophobic contaminants. Environmental Science & Technology 41:7759–
7764.
Thompson, R. C., Y. Olsen, R. P. Mitchell, A. Davis, S. J. Rowland, A. W. G. John, D.
McGonigle, and A. E. Russell. 2004. Lost at sea: where is all the plastic? Science 304:
5672

Michelle Chang Microplastics in Facial Exfoliating Cleansers Spring 2013
20
APPENDIX A: Brand Share Information
Figure 1. Annual top-grossing facial cleansers brands, 2011-12. Data from Mintel Reports.
Company Brand
Rolling 52 weeks ending
February 20, 2011
$million
Rolling 52 weeks
ending February 19,
2012 $million
Johnson & Johnson Total 198 221
Neutrogena 31 39
Neutrogena Deep Clean 32 32
Johnsons Clean & Clear Morning Burst 22 26
Johnsons Clean & Clear 16 15
Johnsons Clean & Clear Deep Action 14 15
Neutrogena Naturals 1 15
Figure 2. Annual top-grossing acne treatment brands, 2011-12
Company Brand
Rolling 52 weeks ending
February 20, 2011 $
million
Rolling 52 weeks
ending February 19,
2012 $ million
Johnson & Johnson Total 196 201
Neutrogena Oil Free Acne Wash 46 49
Aveeno Clear Complexion 20 19
Johnsons Clean & Clear Advantage 16 17
Neutrogena Acne Stress Control 17 16
Neutrogena Rapid Clear 14 14
Neutrogena Clear Pore 10 12

Michelle Chang Microplastics in Facial Exfoliating Cleansers Spring 2013
21
APPENDIX B: Consumer Survey
Figure 1. Online Survey Questions. 9-question survey created with SurveyMonkey and distributed over a period of
3 months to 175 individuals.

Michelle Chang Microplastics in Facial Exfoliating Cleansers Spring 2013
22
Michelle Chang Microplastics in Facial Exfoliating Cleansers Spring 2013
23
Michelle Chang Microplastics in Facial Exfoliating Cleansers Spring 2013
24
APPENDIX C: Follow-up survey
Figure 1. Follow-up online survey on consumer purchasing behavior.

Michelle Chang Microplastics in Facial Exfoliating Cleansers Spring 2013
25

Michelle Chang Microplastics in Facial Exfoliating Cleansers Spring 2013
26