1 growth drivers and population migration. 2 western bay of plenty sub- region includes: western bay...
TRANSCRIPT
1
Growth drivers and population migration
2
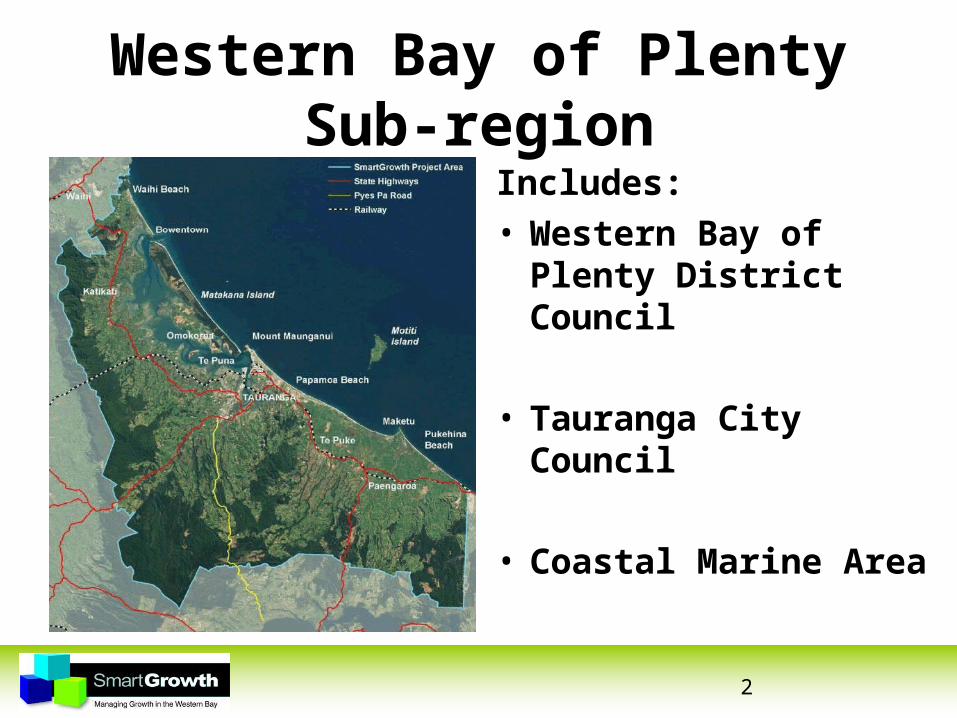
Western Bay of Plenty Sub-region
Includes:• Western Bay of Plenty
District Council
• Tauranga City Council
• Coastal Marine Area
3
SmartGrowth Strategy
• SmartGrowth Strategy sets out the sub-region’s vision for managing future growth
• SmartGrowth Strategy 2051 was based on migration statistics and trends for western Bay of Plenty sub-region 1996-2001
4
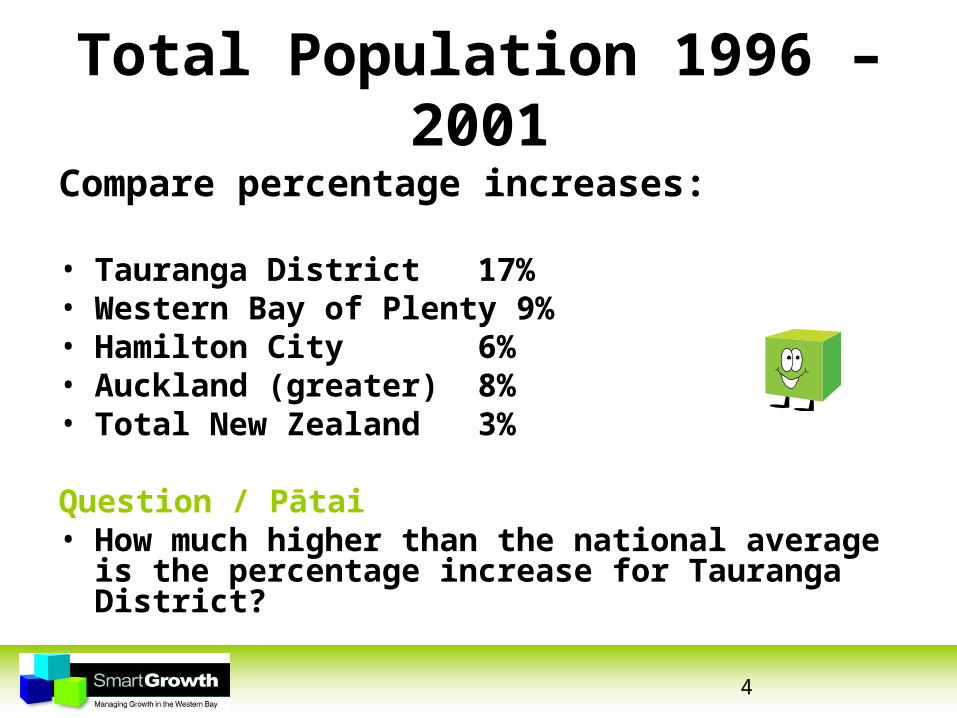
Total Population 1996 – 2001
Compare percentage increases:
• Tauranga District 17%• Western Bay of Plenty 9%• Hamilton City 6%• Auckland (greater) 8%• Total New Zealand 3%
Question / Pātai• How much higher than the national average is the
percentage increase for Tauranga District?
5
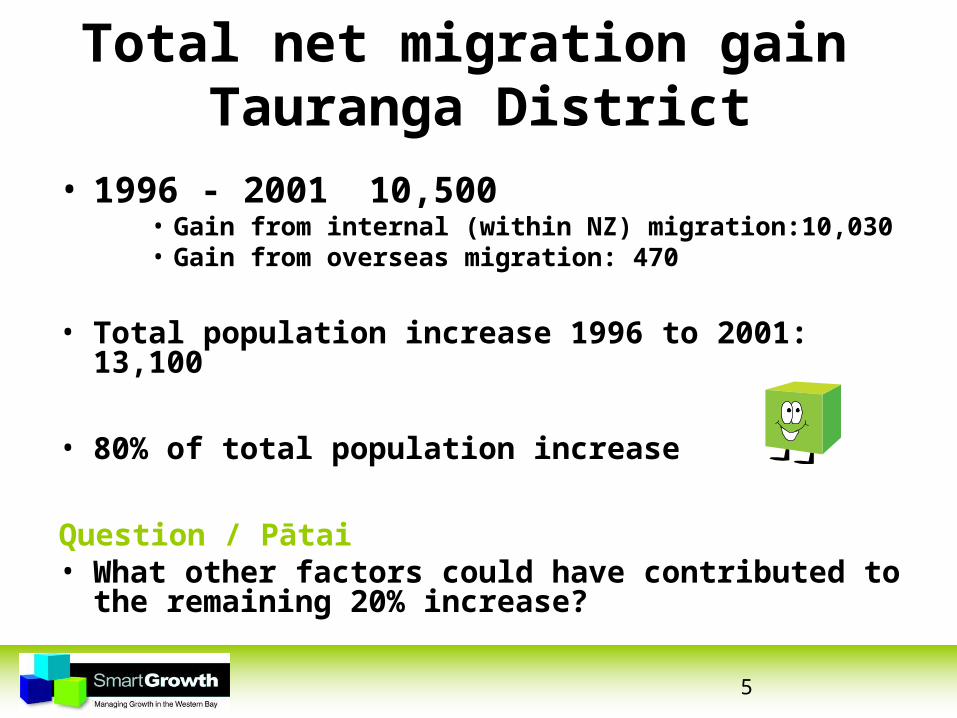
Total net migration gain Tauranga District
• 1996 - 2001 10,500• Gain from internal (within NZ) migration:10,030• Gain from overseas migration: 470
• Total population increase 1996 to 2001: 13,100
• 80% of total population increase
Question / Pātai• What other factors could have contributed to the
remaining 20% increase?
6
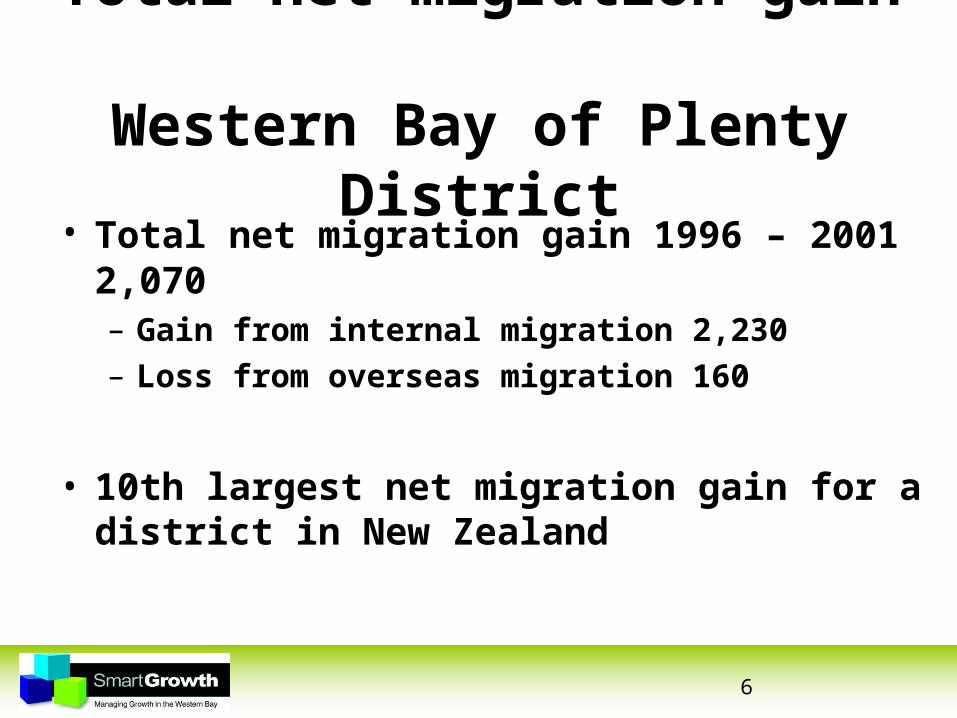
Total net migration gain Western Bay of Plenty District
• Total net migration gain 1996 – 2001 2,070– Gain from internal migration 2,230– Loss from overseas migration 160
• 10th largest net migration gain for a district in New Zealand

7
Estimated net migration -Tauranga
Question / PātaiWhat does this graph tell you about who is moving in and out of Tauranga District?

8
Estimated net migration - WBOP
Question / PātaiHow does this migration pattern differ from the previous graph? Why?
9
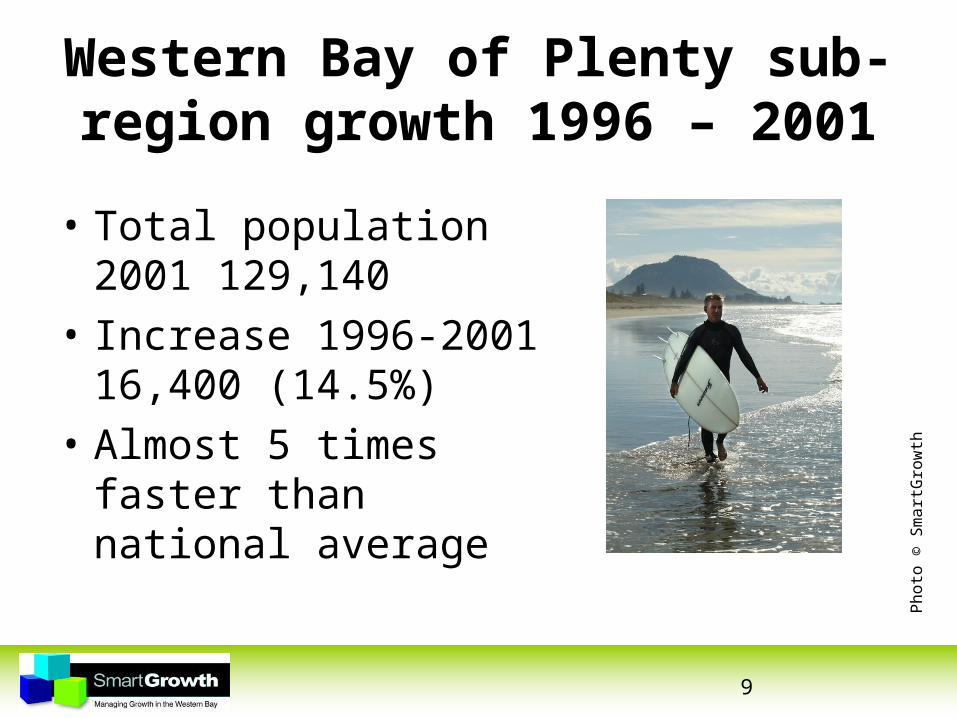
Western Bay of Plenty sub-region growth 1996 – 2001
• Total population 2001 129,140
• Increase 1996-2001 16,400 (14.5%)
• Almost 5 times faster than national average
Ph
oto
© S
ma
rtG
row
th

10
Major growth driver
• Western Bay Sub-Region– Population growth 1996-2001 = 116,400– Net migration gain 1996-2001 = 12,570 – 77% of total growth from migration
• Internal migration major driver
11
Implications• Decline in natural increase (births over
deaths)
• How migration flows change is critical in planning for population size, composition
• Understanding current migration - one way to predict changing migration patterns
12
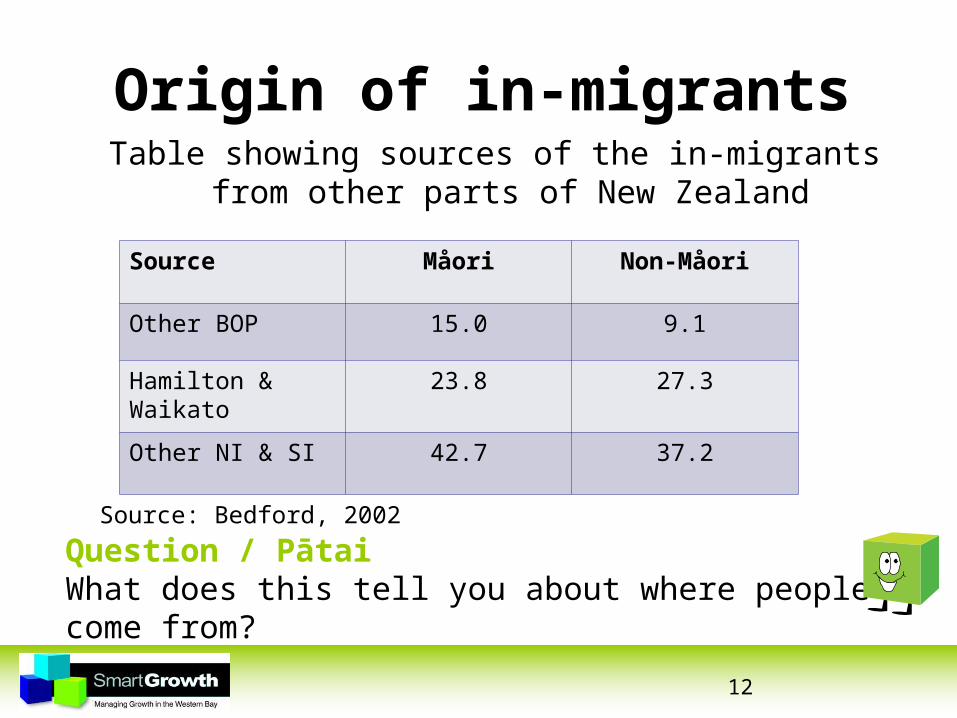
Origin of in-migrants
Question / PātaiWhat does this tell you about where people come from?
Table showing sources of the in-migrants from other parts of New Zealand
Source Måori Non-Måori
Other BOP 15.0 9.1
Hamilton & Waikato
23.8 27.3
Other NI & SI 42.7 37.2
Source: Bedford, 2002
Migration amongst Māori
• The table on the previous slide shows that when Māori move here a large number of them come from other Bay of Plenty areas
• For Māori, cultural understanding of concepts such as tūrangawaewae and whakapapa may influence their movement (or lack of movement) from one place to another
13

Migration amongst Māori
– Tūrangawaewae is the place where one has rights of residence and belonging through kinship and whakapapa
– Whakapapa is geneaology – linking us to our ancestors: people and places
14
Hekenga
• The concept of hekenga is also relevant when talking of migration
• Hekenga – is migration that occurs to meet the needs of Māori at any one time and in response to outside forces
15

16
Age group of in-migrants
Question / PātaiWhat does this tell you about age of Māori / non-Māori?

17
Where do people go?
Question / PātaiWhat does this tell you about where people go to?
Table showing destinations of the out-migrants to other parts of New Zealand
Destination Måori Non-Måori
Other BOP 14.9 8.4
Hamilton & Waikato
26 30
Other NI & SI 35.2 35.7
Source: Bedford, 2002

18
Age group of out-migrants
Question / PātaiWhat does this tell you about the age of Māori and non-Māori who move?
19
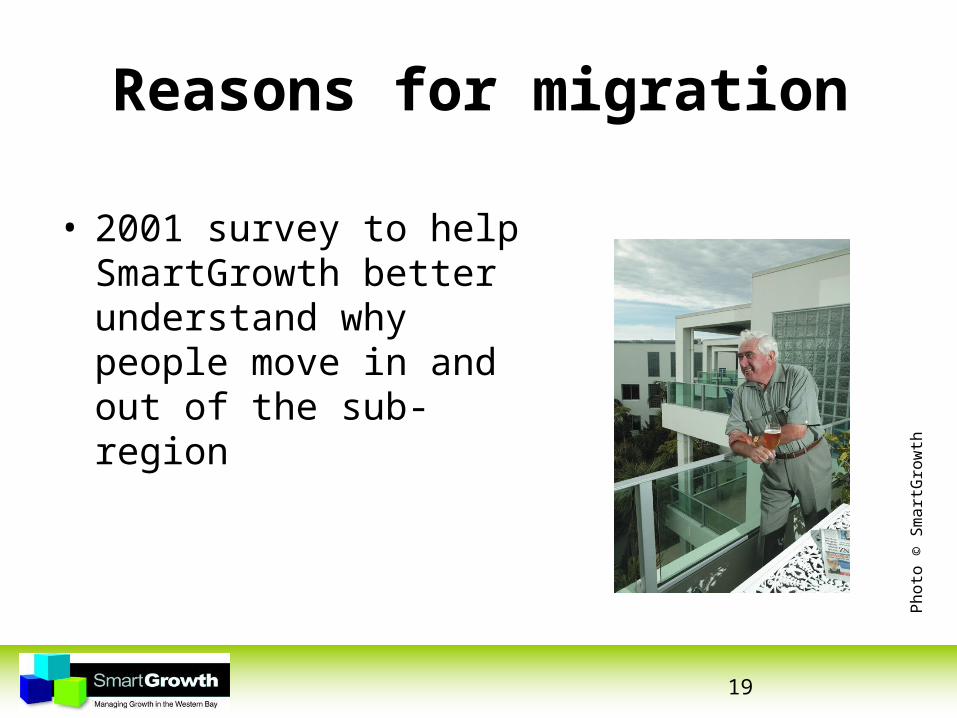
Reasons for migration
• 2001 survey to help SmartGrowth better understand why people move in and out of the sub-region
Ph
oto
© S
ma
rtG
row
th
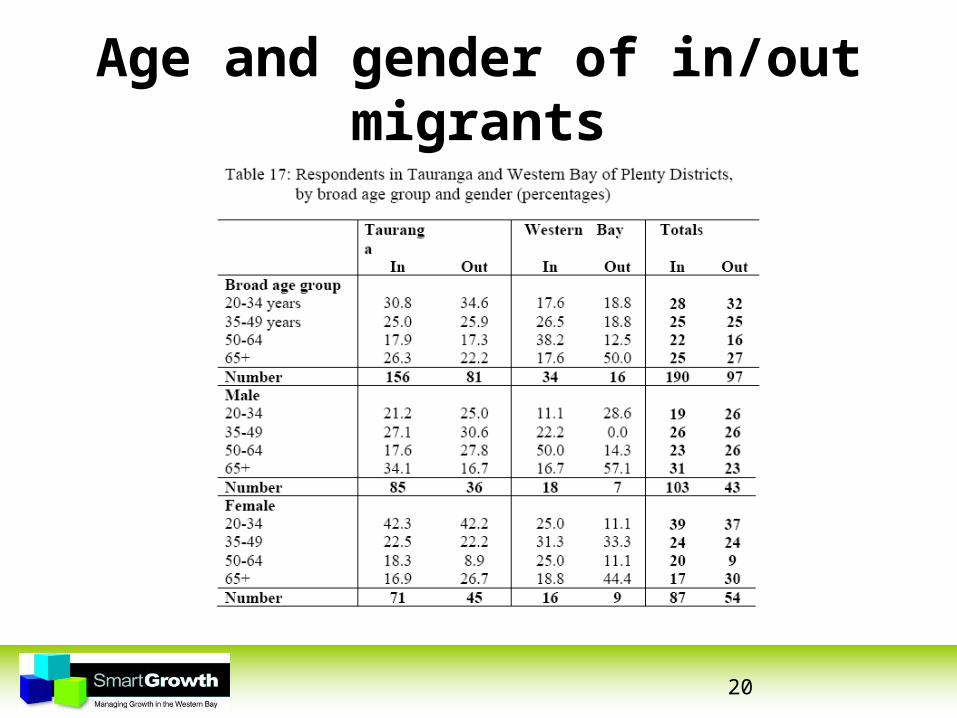
20
Age and gender of in/out migrants
21
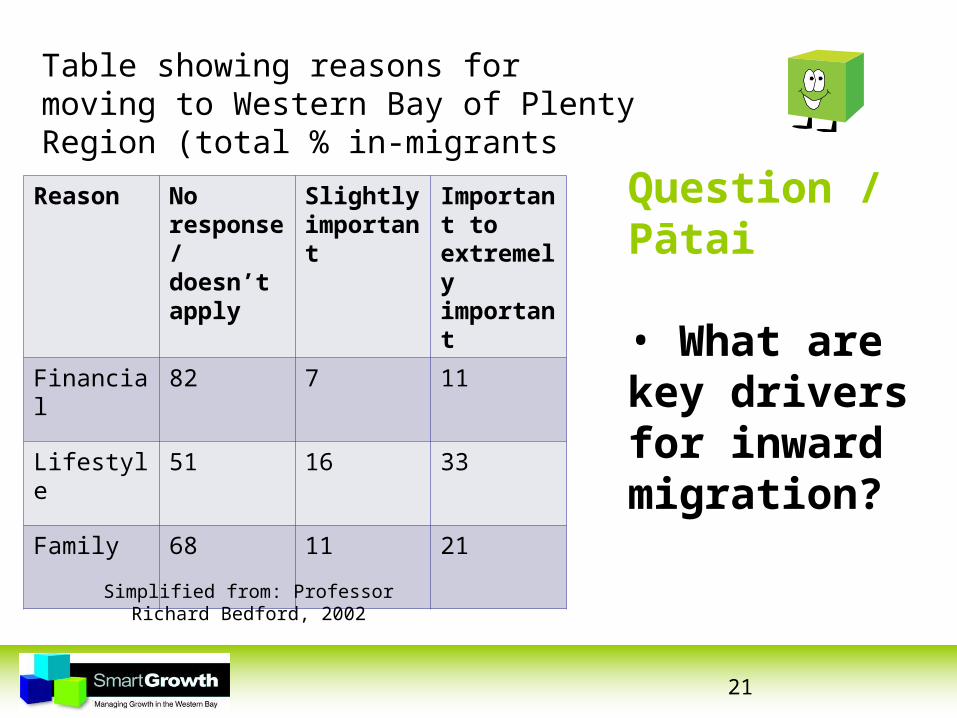
Question / Pātai
• What are key drivers for inward migration?
Reason No response/ doesn’t apply
Slightly important
Important to extremely important
Financial 82 7 11
Lifestyle 51 16 33
Family 68 11 21
Simplified from: Professor Richard Bedford, 2002
Table showing reasons for moving to Western Bay of Plenty Region (total % in-migrants
22
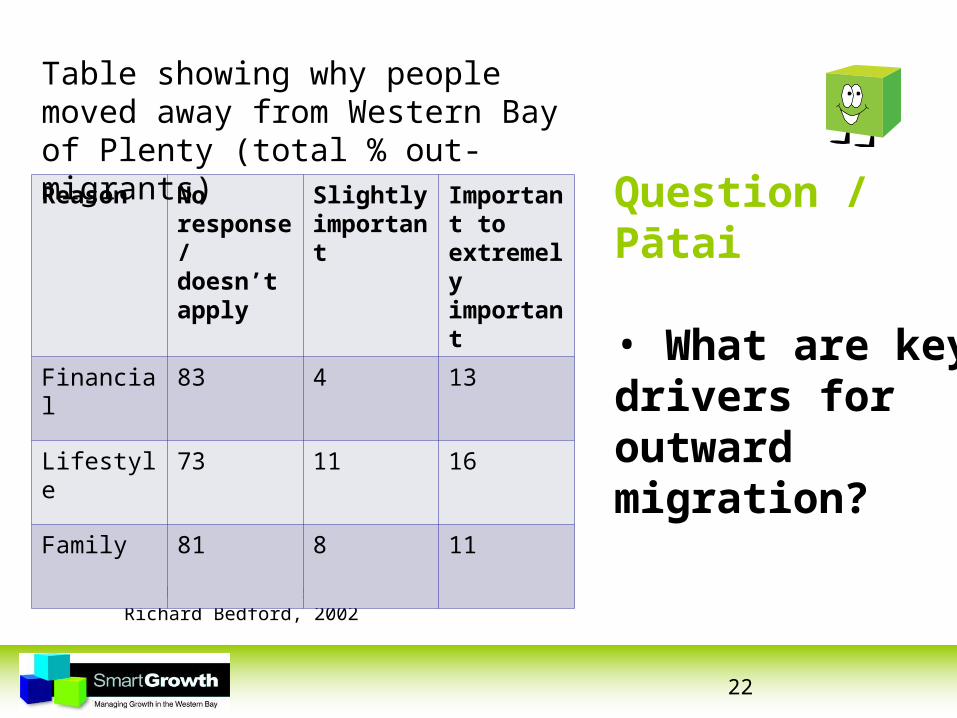
Simplified from: Professor Richard Bedford, 2002
Question / Pātai
• What are key drivers for outward migration?
Reason No response/ doesn’t apply
Slightly important
Important to extremely important
Financial 83 4 13
Lifestyle 73 11 16
Family 81 8 11
Table showing why people moved away from Western Bay of Plenty (total % out-migrants)

23
Migration survey findings
– Upside - Across all age groups, coastal environment, quality of life
– Downside - Lower wage rates and poor job prospects
– Those who moved away - low wages, poor job prospects a major concern
– Proportions of retired people moving out of the region similar to same category moving in

24
Review and Implications
Activity / Mahi
• Review what you have learnt about1. Population growth and its drivers
2. Migration patterns
3. Reasons for inward and outward migration
• Consider - implications of each for the future?

25
True / False Quiz• Increase for western Bay of Plenty 6% higher than
national average?
• Migration - 80% of increase in Tauranga District?
• Western Bay of Plenty District net migration gain largest for a NZ district?
• Employment the major driver in this sub-region?(What would have to happen to make this statement true?)
• Lowest number of in-migrants from South Island?
• Proportions of retired people moving out similar to proportions moving in