1. graphics with pstricks - cs.stanford.edusbansal/tut/latex/pstricks/chap1.pdfand is released under...
TRANSCRIPT

TEXan
d Graphics
TEXan
d Graphics
TEXan
d Graphics
TEXan
d Graphics
TEXan
d Graphics
TEXan
d Graphics
TEXan
d Graphics
TEXan
d Graphics
TEXan
d Graphics
TEXan
d Graphics
TEXan
d Graphics
TEXan
d Graphics
TEXan
d Graphics
TEXan
d Graphics
TEXan
d Graphics
TEXan
d Graphics
TEXan
d Graphics
TEXan
d Graphics
TEXan
d Graphics
TEXan
d Graphics
TEXan
d Graphics
TEXan
d Graphics
TEXan
d Graphics
TEXan
d Graphics
TEXan
d Graphics
TEXan
d Graphics
TEXan
d Graphics
TEXan
d Graphics
TEXan
d Graphics
TEXan
d Graphics
Graphics with PSTricksGetting the points
Drawing Dots
Simple Lines
Ends of Lines
Bent Lines and Polygons
Simple Curves
Online LATEX Tutorial
Part II – Graphics
c©2002, The Indian TEX Users GroupThis document is generated by PDFTEX withhyperref, pstricks, pdftricks and pdfscreenpackages in an intel PC running GNU/LINUX
and is released under LPPL
The Indian TEX Users GroupFloor iii, sjp Buildings, Cotton HillsTrivandrum 695014, india
http://www.tug.org.in
� � � � � �

Getting the points
Drawing Dots
Simple Lines
Ends of Lines
Bent Lines and Polygons
Simple Curves
Online LATEX Tutorial
Part II – Graphics
c©2002, The Indian TEX Users GroupThis document is generated by PDFTEX withhyperref, pstricks, pdftricks and pdfscreenpackages in an intel PC running GNU/LINUX
and is released under LPPL
The Indian TEX Users GroupFloor iii, sjp Buildings, Cotton HillsTrivandrum 695014, india
http://www.tug.org.in
� � � � � �
1. Graphics with PSTricks
LATEX has only limited drawing capabilities, while PostScript is a page de-scription language which has a rich set of drawing commands; and thereare programs (such as dvips) which translate the dvi output to PostScript.So, the natural question is whether one can include PostScript code in a TEXsource file itself for programs such as dvips to process after the TEX compi-lation? This is the idea behind the PSTricks package of Timothy van Zandt.The beauty of it is one need not know PostScript to use it—the necessaryPostScript code can be generated by TEX macros defined in the package.

Graphics with PSTricksGetting the points
Drawing Dots
Simple Lines
Ends of Lines
Bent Lines and Polygons
Simple Curves
Online LATEX Tutorial
Part II – Graphics
c©2002, The Indian TEX Users GroupThis document is generated by PDFTEX withhyperref, pstricks, pdftricks and pdfscreenpackages in an intel PC running GNU/LINUX
and is released under LPPL
The Indian TEX Users GroupFloor iii, sjp Buildings, Cotton HillsTrivandrum 695014, india
http://www.tug.org.in
� � � � � �
1.1. Getting the points
Any picture is drawn by stringing together appropriate points. How do wespecify the points we need? We’ve a method of specifying each point ina plane using a pair of numbers, thanks to the 17th century French math-ematicians Pierre de Fermat and Rene Descartes. The method is to fix apair of perpendicular lines (called axes) and label each point with the num-bers representing its distance from these two points (called coordinates) asshown in the figure below:
���
3 unit
2u
nit
(0,0)
(3,2)
(1.5,0.5)
Note that the meeting point of the axes (called the origin) has coordinates(0,0). In order to associate each pair of numbers with a unique point, wemake the convention that horizontal distances to the left of the origin andvertical distances below the origin are negative as illustrated below:

Graphics with PSTricksGetting the points
Drawing Dots
Simple Lines
Ends of Lines
Bent Lines and Polygons
Simple Curves
Online LATEX Tutorial
Part II – Graphics
c©2002, The Indian TEX Users GroupThis document is generated by PDFTEX withhyperref, pstricks, pdftricks and pdfscreenpackages in an intel PC running GNU/LINUX
and is released under LPPL
The Indian TEX Users GroupFloor iii, sjp Buildings, Cotton HillsTrivandrum 695014, india
http://www.tug.org.in
� � � � � �
�����
(0,0)
(3,2)
(-2,1)
(-1,-1)
(2,-2)
Another fact to note is that the coordinates of points depend on theposition of the axes chosen, so that the same point has different pairs ofcoordinates with respect to different set of axes. This is illustrated in thefigure below, where the point which originally had coordinates (3,2) withrespect to the axes shown in gray has new coordinates (1,1) with respect tonew axes shown in black.
��
(0,0)
(1,1)
(3,2)
(0,0)

Graphics with PSTricksGetting the points
Drawing Dots
Simple Lines
Ends of Lines
Bent Lines and Polygons
Simple Curves
Online LATEX Tutorial
Part II – Graphics
c©2002, The Indian TEX Users GroupThis document is generated by PDFTEX withhyperref, pstricks, pdftricks and pdfscreenpackages in an intel PC running GNU/LINUX
and is released under LPPL
The Indian TEX Users GroupFloor iii, sjp Buildings, Cotton HillsTrivandrum 695014, india
http://www.tug.org.in
� � � � � �
The PSTricks package uses coordinates to specify points to plot and thenvarious other commands to join them.

Graphics with PSTricksGetting the points
Drawing Dots
Simple Lines
Ends of Lines
Bent Lines and Polygons
Simple Curves
Online LATEX Tutorial
Part II – Graphics
c©2002, The Indian TEX Users GroupThis document is generated by PDFTEX withhyperref, pstricks, pdftricks and pdfscreenpackages in an intel PC running GNU/LINUX
and is released under LPPL
The Indian TEX Users GroupFloor iii, sjp Buildings, Cotton HillsTrivandrum 695014, india
http://www.tug.org.in
� � � � � �
1.2. Drawing Dots
Now let’s see how to draw pictures with PSTricks. The basic package touse is pstricks and so we assume in all the codes given below that thispackage has been loaded with the command \usepackage{pstricks} inthe document preamble.
Let’s start with the simplest of graphical objects—a single dot. Type inthe code below in your document:
Look at this dot \psdots(1,0)
and TEX compile the document. To produce the PostScript, you’ll have touse the dvips program or any other dvi to PostScript translator available inyour system. With dvips, this done by the command
dvips filename -o
where filename is the name of your file without any extension (or with theextension .dvi). This creates a PostScript file of the same name but withthe extension .ps which you can view using a PostScript previewer, such asghostview. It looks like this:
Look at this dot�
Some explanations are in order. Evidently the command to draw a dotis \psdots followed by the coordinates of the point where the dot is to beplaced. But we know that the assignment of coordinates to points (and viceversa) makes sense only after fixing the axes. So when we specify coordi-nates such as (0,1) as above, what are the axes used? By default, PSTricksuses the current point in TEX as the origin and horizontal and vertical linesthrough this point as the axes. Again, the default unit is 1 cm. Thus in theabove example, a point is drawn 1 cm. away from the letter t in dot. This is

Graphics with PSTricksGetting the points
Drawing Dots
Simple Lines
Ends of Lines
Bent Lines and Polygons
Simple Curves
Online LATEX Tutorial
Part II – Graphics
c©2002, The Indian TEX Users GroupThis document is generated by PDFTEX withhyperref, pstricks, pdftricks and pdfscreenpackages in an intel PC running GNU/LINUX
and is released under LPPL
The Indian TEX Users GroupFloor iii, sjp Buildings, Cotton HillsTrivandrum 695014, india
http://www.tug.org.in
� � � � � �
illustrated in the figure below, where the (invisible) axes are shown in gray.
Look at this dot
�
(0,0)
�
(1,0)
1 cm.
A single \psdots command can be used to plot any number of points.For example, the input
Look at these dots \psdots(0,0)(2,0)(1,1)
produce the (PostScript) outputLook at these dots
���
Now suppose we try
Look at these dots \psdots(0,0)(2,0)(1,1) forming the vertices(corners) of a triangle.
the output produced is
Look at these dots���forming the vertexes (corners) of a triangle.
What happened? Why were the dots overwritten? What happened ac-tually is that TEX did not reserve any space for the picture (recall that the
Graphics withPSTricksGetting the pointsDrawing DotsSimple LinesEnds of LinesBent Lines and PolygonsSimple Curves
Online LATEX Tutorial
Part II – Graphics
c©2002, The Indian TEX Users GroupThis document is generated by PDFTEX withhyperref, pstricks, pdftricks and pdfscreenpackages in an intel PC running GNU/LINUX
and is released under LPPL
The Indian TEX Users GroupFloor iii, sjp Buildings, Cotton HillsTrivandrum 695014, india
http://www.tug.org.in
� � � � � �
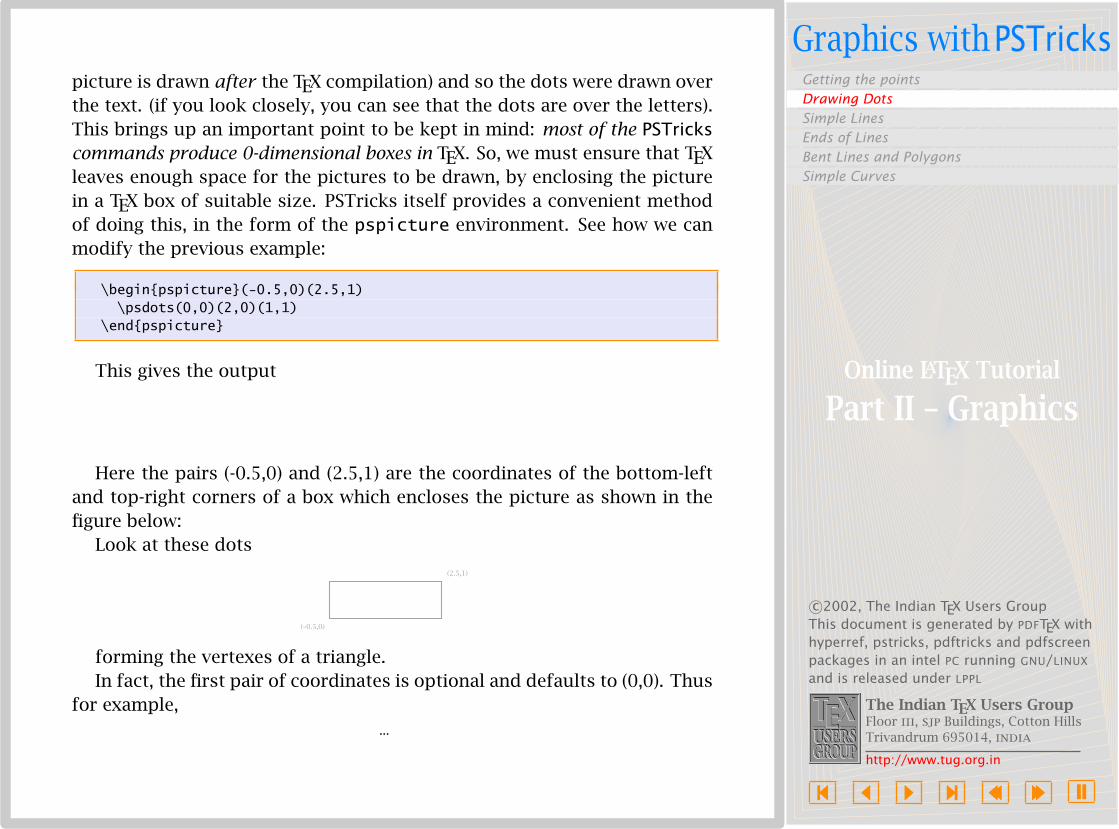
picture is drawn after the TEX compilation) and so the dots were drawn overthe text. (if you look closely, you can see that the dots are over the letters).This brings up an important point to be kept in mind: most of the PSTrickscommands produce 0-dimensional boxes in TEX. So, we must ensure that TEXleaves enough space for the pictures to be drawn, by enclosing the picturein a TEX box of suitable size. PSTricks itself provides a convenient methodof doing this, in the form of the pspicture environment. See how we canmodify the previous example:
\begin{pspicture}(-0.5,0)(2.5,1)\psdots(0,0)(2,0)(1,1)
\end{pspicture}
This gives the output
���
Here the pairs (-0.5,0) and (2.5,1) are the coordinates of the bottom-leftand top-right corners of a box which encloses the picture as shown in thefigure below:
Look at these dots
�����(–0.5,0)
(2.5,1)
forming the vertexes of a triangle.In fact, the first pair of coordinates is optional and defaults to (0,0). Thus
for example,...

Graphics with PSTricksGetting the points
Drawing Dots
Simple Lines
Ends of Lines
Bent Lines and Polygons
Simple Curves
Online LATEX Tutorial
Part II – Graphics
c©2002, The Indian TEX Users GroupThis document is generated by PDFTEX withhyperref, pstricks, pdftricks and pdfscreenpackages in an intel PC running GNU/LINUX
and is released under LPPL
The Indian TEX Users GroupFloor iii, sjp Buildings, Cotton HillsTrivandrum 695014, india
http://www.tug.org.in
� � � � � �
\begin{pspicture}(1,2)...\end{pspicture}
is equivalent to
\begin{pspicture}(0,0)(1,2) ... \end{pspicture}
We can also ‘display’ the picture by
\begin{pspicture}(-0.5,-0.5)(2.5,1.5)\psdots(0,0)(2,0)(1,1)
\end{pspicture}
This produces
���
Can you see why the second coordinate of the ‘box’ is changed to -0.5and 1.5 from its values 0 and 1 in the previous example?
The dots we’ve been drawing so far are all circular and black. How aboutsquare and white dots? Change the input of the previous example as fol-lows:
Look at these dots\begin{center}\begin{pspicture}(-0.5,-0.5)(2.5,1.5)
\psdots[dotstyle=square](0,0)(2,0)(1,1)\end{pspicture}
\end{center}forming the vertices of a triangle.

Graphics withPSTricksGetting the pointsDrawing DotsSimple LinesEnds of LinesBent Lines and PolygonsSimple Curves
Online LATEX Tutorial
Part II – Graphics
c©2002, The Indian TEX Users GroupThis document is generated by PDFTEX withhyperref, pstricks, pdftricks and pdfscreenpackages in an intel PC running GNU/LINUX
and is released under LPPL
The Indian TEX Users GroupFloor iii, sjp Buildings, Cotton HillsTrivandrum 695014, india
http://www.tug.org.in
� � � � � �
We then get the output shown below:Look at these dots
������
forming the vertexes of a triangle.Thus the shape of the dots is controlled by the parameter dotstyle and
it’s to be specified within square brackets after the \psdots command. Thevarious possible values of this parameter and the corresponding shape ofthe dots is shown in the table below:
style example style example
*
���
o
������
+ + + + x × × ×oplus ⊕ ⊕ ⊕ otimes ⊗ ⊗ ⊗
asterisk * * * | | | |
triangle
������
triangle*
���
square
������
square*
���
diamond ♦ ♦ ♦ diamond* ◊ ◊ ◊pentagon
pentagon*���
Also, dots can be scaled using the parameter dotscale and rotated usingthe parameter dotangle. For example

Graphics with PSTricksGetting the points
Drawing Dots
Simple Lines
Ends of Lines
Bent Lines and Polygons
Simple Curves
Online LATEX Tutorial
Part II – Graphics
c©2002, The Indian TEX Users GroupThis document is generated by PDFTEX withhyperref, pstricks, pdftricks and pdfscreenpackages in an intel PC running GNU/LINUX
and is released under LPPL
The Indian TEX Users GroupFloor iii, sjp Buildings, Cotton HillsTrivandrum 695014, india
http://www.tug.org.in
� � � � � �
\begin{pspicture}(-0.5,-0.5)(2.5,2.5)\psdots[dotstyle=+,dotangle=45](0,0)\psdots[dotstyle=+,dotscale=1.5,
dotangle=45](0.5,0.5)\psdots[dotstyle=+,dotscale=2,
dotangle=45](1,1)\psdots[dotstyle=+,dotscale=2.5,
dotangle=45](1.5,1.5)\psdots[dotstyle=+,dotscale=3,
dotangle=45](2,2)\end{pspicture}
gives
++ +++
Instead of scaling, we can explicitly specify the size of dots. But this we’lldiscuss in the next section (with a reason, of course).

Graphics with PSTricksGetting the points
Drawing Dots
Simple Lines
Ends of Lines
Bent Lines and Polygons
Simple Curves
Online LATEX Tutorial
Part II – Graphics
c©2002, The Indian TEX Users GroupThis document is generated by PDFTEX withhyperref, pstricks, pdftricks and pdfscreenpackages in an intel PC running GNU/LINUX
and is released under LPPL
The Indian TEX Users GroupFloor iii, sjp Buildings, Cotton HillsTrivandrum 695014, india
http://www.tug.org.in
� � � � � �
1.3. Simple Lines
Let’s see how we draw lines next. The command is \psline with the coor-dinates of the points to be joined. For example
Look at the line segment below\begin{center}\begin{pspicture}(0,0)(3.5,2.5)
\psline(2,1)(3,2)\end{pspicture}
\end{center}equally slanted to the horizontal and the vertical.
givesLook at the line segment below
equally slanted to the horizontal and the vertical.We can draw dashed or dotted lines using the linestyle parameter.
Thus
\begin{pspicture}(0,0)(2,1)\psline(0,0)(2,0)\psline[linestyle=dashed](2,0)(1,1)\psline[linestyle=dotted](1,1)(0,0)
\end{pspicture}
gives

Graphics withPSTricksGetting the pointsDrawing DotsSimple LinesEnds of LinesBent Lines and PolygonsSimple Curves
Online LATEX Tutorial
Part II – Graphics
c©2002, The Indian TEX Users GroupThis document is generated by PDFTEX withhyperref, pstricks, pdftricks and pdfscreenpackages in an intel PC running GNU/LINUX
and is released under LPPL
The Indian TEX Users GroupFloor iii, sjp Buildings, Cotton HillsTrivandrum 695014, india
http://www.tug.org.in
� � � � � �
0 1 20
1
In this and many of the pictures below, we include a “coordinate grid” forconvenience of reference. It is not produced by the code given alongside.
In the dashed style, the length of the black and white segments is con-trolled by the parameter dash Thus dash=3pt 2pt produces dashed linewith black segments of length 3 pt. and white segments of length 2 pt. Thus
\begin{center}\begin{pspicture}(-0.5,-0.5)(2.5,1.5)\psline[linestyle=dashed,dash=2pt 2pt]
(0,0)(2,0)\psline[linestyle=dashed,dash=2pt 5pt]
(2,0)(1,1)\psline[linestyle=dashed,dash=5pt 5pt]
(1,1)(0,0)\end{pspicture}\end{center}
gives
0 1 20
1
The default value of dash is 5 pt 3 pt. Again, in the dotted style, thedistance between dots is controlled by the parameter dotsep whose defaultvalue is 3 pt.
We can also alter the thickness of the lines by changing the value ofthe parameter linewidth which has a default value of 0.8 pt. Look at theexample below:

Graphics with PSTricksGetting the points
Drawing Dots
Simple Lines
Ends of Lines
Bent Lines and Polygons
Simple Curves
Online LATEX Tutorial
Part II – Graphics
c©2002, The Indian TEX Users GroupThis document is generated by PDFTEX withhyperref, pstricks, pdftricks and pdfscreenpackages in an intel PC running GNU/LINUX
and is released under LPPL
The Indian TEX Users GroupFloor iii, sjp Buildings, Cotton HillsTrivandrum 695014, india
http://www.tug.org.in
� � � � � �
\begin{center}\begin{pspicture}(0,-0.5)(2.5,4.5)\psline[linewidth=0.2pt](0,0)(0,2)\psline[linewidth=0.4pt](0.5,0)(0.5,2)\psline[linewidth=0.6pt](1,0)(1,2)\psline[linewidth=0.8pt](1.5,0)(1.5,2)\psline[linewidth=1pt](2,0)(2,2)\psline[linewidth=1.2pt](2.5,0)(2.5,2)\psline[linewidth=1.4pt](3,0)(3,2)\psline[linewidth=1.6pt](3.5,0)(3.5,2)\psline[linewidth=1.8pt](4,0)(4,2)\psline[linewidth=2pt](4.5,0)(4.5,2)
\end{pspicture}\end{center}
produces

Graphics with PSTricksGetting the points
Drawing Dots
Simple Lines
Ends of Lines
Bent Lines and Polygons
Simple Curves
Online LATEX Tutorial
Part II – Graphics
c©2002, The Indian TEX Users GroupThis document is generated by PDFTEX withhyperref, pstricks, pdftricks and pdfscreenpackages in an intel PC running GNU/LINUX
and is released under LPPL
The Indian TEX Users GroupFloor iii, sjp Buildings, Cotton HillsTrivandrum 695014, india
http://www.tug.org.in
� � � � � �
1.4. Ends of Lines
Lines can be provided with arrowheads. This is done by the arrows param-eter
\begin{center}\begin{pspicture}(0,-0.5)(2,2.5)\psline[arrows=->](0,0)(1,2)\psline[arrows=<->](1,1)(2,1)
\end{pspicture}\end{center}
produces
Instead of arrowheads, lines can be made to terminate with circles, T-barsand so on, using the parameter arrows. The available values of this param-eter and the corresponding line terminators are given in the Table 1.1. Wecan mix and match these terminators as values for the arrows parametersuch as *-> or |-<<.
Certain terminators are clearly seen only for thick lines. For example
\begin{pspicture}(-0.5,-0.5)(2.5,2.5)\psline[linewidth=0.1cm,arrows=|-|]
(1,0)(1,2)\psline[linewidth=0.1cm,arrows=|*-|*]
(2,0)(2,2)\end{pspicture}
gives

Graphics withPSTricksGetting the pointsDrawing DotsSimple LinesEnds of LinesBent Lines and PolygonsSimple Curves
Online LATEX Tutorial
Part II – Graphics
c©2002, The Indian TEX Users GroupThis document is generated by PDFTEX withhyperref, pstricks, pdftricks and pdfscreenpackages in an intel PC running GNU/LINUX
and is released under LPPL
The Indian TEX Users GroupFloor iii, sjp Buildings, Cotton HillsTrivandrum 695014, india
http://www.tug.org.in
� � � � � �
value example name
- none
<-> arrowheads
>-< reverse arrowheads
<<->> double arrowheads
>>-<< double reverse arrowheads
|-| T-bars, flush with end points
|*-|* T-bars, centered on end points
[-] square brackets
(-) rounded brackets
o-o circles, centered on end points
*-* disks, centered on end points
**-** disks, flush to endpoints
c-c extended, rounded ends
cc-cc flush round ends
C-C extended, square ends
Table 1.1: Line terminators
To see some other terminators clearly, thicker lines are needed. Thus

Graphics withPSTricksGetting the pointsDrawing DotsSimple LinesEnds of LinesBent Lines and PolygonsSimple Curves
Online LATEX Tutorial
Part II – Graphics
c©2002, The Indian TEX Users GroupThis document is generated by PDFTEX withhyperref, pstricks, pdftricks and pdfscreenpackages in an intel PC running GNU/LINUX
and is released under LPPL
The Indian TEX Users GroupFloor iii, sjp Buildings, Cotton HillsTrivandrum 695014, india
http://www.tug.org.in
� � � � � �
\begin{pspicture}(-0.5,-0.5)(3.5,2.5)\psline[linewidth=0.5cm](0,0)(0,2)\psline[linewidth=0.5cm,arrows=c-c]
(1,0)(1,2)\psline[linewidth=0.5cm,arrows=cc-cc]
(2,0)(2,2)\psline[linewidth=0.5cm,arrows=C-C]
(3,0)(3,2)\end{pspicture}
gives
The arrows parameter can also be specified as an optional argumentwithin braces after the other options (in square brackets). Thus instead of
\psline[linestyle=dotted,arrows=<->](0,0)(2,0)
we can also write
\psline[linestyle=dotted]{<->}(0,0)(2,0)
Now is the time to talk of (no, not cabbages and kings) the size of dots.The diameter of a circular dot is 2.5 times the current linewidth plus .5 pt.This can be changed by the parameter dotsize. Thus for example

Graphics withPSTricksGetting the pointsDrawing DotsSimple LinesEnds of LinesBent Lines and PolygonsSimple Curves
Online LATEX Tutorial
Part II – Graphics
c©2002, The Indian TEX Users GroupThis document is generated by PDFTEX withhyperref, pstricks, pdftricks and pdfscreenpackages in an intel PC running GNU/LINUX
and is released under LPPL
The Indian TEX Users GroupFloor iii, sjp Buildings, Cotton HillsTrivandrum 695014, india
http://www.tug.org.in
� � � � � �
\begin{center}\begin{pspicture}(0,0)(2,2)
\psdot[linewidth=0.1cm,dotsize=1cm 10](1,1)\end{pspicture}\end{center}
gives
which is a circular disk of diameters 10 × 0.1 + 1 = 2 centimeters. (We’llsoon see better method of drawing such disks). The polygonal dots aresized to have the same area as circles. The dotsize is made to depend onlinewidth since dots are often used in conjunction with lines as in arrows(and showpoints which we will discuss later). Note that the dotsize can beset to any absolute value independent of the linewidth by setting the secondnumber of the dotsize parameter to 0.
There are parameters determining the dimensions of the other types ofline terminators also, which are given in Table 1.2. In this, width refers to adimension perpendicular to the line and length refers to a dimension in thedirection of the line.
The example below illustrates the use of some of these parameters

Graphics with PSTricksGetting the points
Drawing Dots
Simple Lines
Ends of Lines
Bent Lines and Polygons
Simple Curves
Online LATEX Tutorial
Part II – Graphics
c©2002, The Indian TEX Users GroupThis document is generated by PDFTEX withhyperref, pstricks, pdftricks and pdfscreenpackages in an intel PC running GNU/LINUX
and is released under LPPL
The Indian TEX Users GroupFloor iii, sjp Buildings, Cotton HillsTrivandrum 695014, india
http://www.tug.org.in
� � � � � �
parameter value descriptiondefaultvalue
dotsize = dim num num× linewidth+ dimthe diameterof a circle ordisc
0.5 pt 5
tbarsize = dim num num× linewidth+ dim
the width of aT-bar, squarebracket orround bracket
2 pt 5
bracketlength = num number×widththe lengthof a squarebracket
0.15
rbracketlength = num number×widththe length of around bracket
0.15
Table 1.2: Parameters for line terminators
\begin{center}\begin{pspicture}(-1,-1)(9,4)\psline[tbarsize=1cm 0,bracketlength=0.5]{[-|}(0,0)(3,0)\psline[tbarsize=1cm 0]{[-|}(0,3)(3,3)\psline[tbarsize=1cm 0,rbracketlength=0.5]{(-|}(5,0)(8,0)\psline[tbarsize=1cm 0]{(-|}(5,3)(8,3)\end{pspicture}\end{center}
which produces the output below.

Graphics with PSTricksGetting the points
Drawing Dots
Simple Lines
Ends of Lines
Bent Lines and Polygons
Simple Curves
Online LATEX Tutorial
Part II – Graphics
c©2002, The Indian TEX Users GroupThis document is generated by PDFTEX withhyperref, pstricks, pdftricks and pdfscreenpackages in an intel PC running GNU/LINUX
and is released under LPPL
The Indian TEX Users GroupFloor iii, sjp Buildings, Cotton HillsTrivandrum 695014, india
http://www.tug.org.in
� � � � � �
-1 0 1 2 3 4 5 6 7 8 9-1
0
1
2
3
4
Note that the coordinate grid in the picture above is not produced by thegiven code.
The shape of arrowheads is determined by its length, width and insetand the parameters controlling them are arrowsize, arrowlength andarrowinset as shown in the figure below:
wid
th
length
inset
arrowsize = dim num
width = num× linewidth+ dim
length = arrowlength×width
inset = arrowinset× length

Graphics with PSTricksGetting the points
Drawing Dots
Simple Lines
Ends of Lines
Bent Lines and Polygons
Simple Curves
Online LATEX Tutorial
Part II – Graphics
c©2002, The Indian TEX Users GroupThis document is generated by PDFTEX withhyperref, pstricks, pdftricks and pdfscreenpackages in an intel PC running GNU/LINUX
and is released under LPPL
The Indian TEX Users GroupFloor iii, sjp Buildings, Cotton HillsTrivandrum 695014, india
http://www.tug.org.in
� � � � � �
The default values of the parameters are
arrowsize = 2 pt 3 arrowlength = 1.4 arrowinset = 0.4
The example below illustrates the effect of changing these parameters.
\begin{center}\begin{pspicture}(0.5,0.5)(5.5,4.5)\psline[linewidth=2pt,
arrowsize=2pt 2,arrowlength=5,arrowinset=0.1]{->}(1,1)(4,4)
\psline[linewidth=2pt]{->}(2,1)(5,4)
\end{pspicture}\end{center}
We can also draw “double lines” by setting the parameter doubleline totrue (by default, it’s false). For example
\begin{center}\begin{pspicture}(-0.5,-0.5)(2.5,2.5)\psline[linewidth=0.06,
doubleline=true,doublesep=0.05,(0,0)(2,2)
\end{pspicture}\end{center}

Graphics with PSTricksGetting the points
Drawing Dots
Simple Lines
Ends of Lines
Bent Lines and Polygons
Simple Curves
Online LATEX Tutorial
Part II – Graphics
c©2002, The Indian TEX Users GroupThis document is generated by PDFTEX withhyperref, pstricks, pdftricks and pdfscreenpackages in an intel PC running GNU/LINUX
and is released under LPPL
The Indian TEX Users GroupFloor iii, sjp Buildings, Cotton HillsTrivandrum 695014, india
http://www.tug.org.in
� � � � � �
gives

Graphics with PSTricksGetting the points
Drawing Dots
Simple Lines
Ends of Lines
Bent Lines and Polygons
Simple Curves
Online LATEX Tutorial
Part II – Graphics
c©2002, The Indian TEX Users GroupThis document is generated by PDFTEX withhyperref, pstricks, pdftricks and pdfscreenpackages in an intel PC running GNU/LINUX
and is released under LPPL
The Indian TEX Users GroupFloor iii, sjp Buildings, Cotton HillsTrivandrum 695014, india
http://www.tug.org.in
� � � � � �
1.5. Bent Lines and Polygons
As in the case of \psdots we can draw multiple lines with a single \pslinecommand. For example,
\begin{center}\begin{pspicture}(0,0)(5,2)\psline(1,1)(2,2)(3,1)(4,2)(5,1)\end{pspicture}\end{center}
gives
0 1 2 3 4 50
1
2
Note that the coordinate grid is not produced by the code given along-side.
The corners in the above picture can be rounded by giving a positivevalue to the linearc parameter which has default value 0 pt. It is actuallythe radius of the arc drawn at the corners. Thus
\begin{center}\begin{pspicture}(0,0)(5,2)\psline[linearc=0.25]%
(1,1)(2,2)(3,1)(4,2)(5,1)\end{pspicture}\end{center}
gives

Graphics withPSTricksGetting the pointsDrawing DotsSimple LinesEnds of LinesBent Lines and PolygonsSimple Curves
Online LATEX Tutorial
Part II – Graphics
c©2002, The Indian TEX Users GroupThis document is generated by PDFTEX withhyperref, pstricks, pdftricks and pdfscreenpackages in an intel PC running GNU/LINUX
and is released under LPPL
The Indian TEX Users GroupFloor iii, sjp Buildings, Cotton HillsTrivandrum 695014, india
http://www.tug.org.in
� � � � � �
0 1 2 3 4 50
1
2
Now change the value of linearc to 0.5 in the above code and see whathappens.
Polygons can be drawn with \psline by taking the first and the lastpoints same. For example
\begin{center}\begin{pspicture}(0,0)(5,3)\psline(1,1)(2,2)(5,2)(4,1)(1,1)\end{pspicture}\end{center}
gives
0 1 2 3 4 50
1
2
We can also use the command \pspolygon to draw polygons. Here, weneed not repeat the starting point as in \psline. Thus in the last exampleabove, the parallelogram could also be drawn by the command
\pspolygon(1,1)(2,2)(5,2)(4,1)
instead of the command
\psline(1,1)(2,2)(5,2)(4,1)(1,1)
The \pspolygon command also has a “starred” version which draws a

Graphics withPSTricksGetting the pointsDrawing DotsSimple LinesEnds of LinesBent Lines and PolygonsSimple Curves
Online LATEX Tutorial
Part II – Graphics
c©2002, The Indian TEX Users GroupThis document is generated by PDFTEX withhyperref, pstricks, pdftricks and pdfscreenpackages in an intel PC running GNU/LINUX
and is released under LPPL
The Indian TEX Users GroupFloor iii, sjp Buildings, Cotton HillsTrivandrum 695014, india
http://www.tug.org.in
� � � � � �
“filled up” polygon. For example
\begin{center}\begin{pspicture}(0,0)(5,3)\pspolygon*(1,1)(2,2)(5,2)(4,1)\end{pspicture}\end{center}
gives
For drawing rectangles, there’s a simpler command \psframe in whichwe need only specify the bottom-left and top-right coordinates. There’s alsoa \psframe* command for a filled-up version. For example,
\begin{center}\begin{pspicture}(0,0)(6,4)\psframe(1,1)(3,3)\psframe*(1,1)(2,2)\psframe*(2,2)(3,3)\end{pspicture}\end{center}
gives
The corners of a frame can also be rounded. The parameter to set isframearc. If we set framearc=number, then the radius of the rounded cor-ners is half the number times the width or height of the frame, whichever

Graphics with PSTricksGetting the points
Drawing Dots
Simple Lines
Ends of Lines
Bent Lines and Polygons
Simple Curves
Online LATEX Tutorial
Part II – Graphics
c©2002, The Indian TEX Users GroupThis document is generated by PDFTEX withhyperref, pstricks, pdftricks and pdfscreenpackages in an intel PC running GNU/LINUX
and is released under LPPL
The Indian TEX Users GroupFloor iii, sjp Buildings, Cotton HillsTrivandrum 695014, india
http://www.tug.org.in
� � � � � �
is less. Thus
\begin{center}\begin{pspicture}(-0.5,0.5)(5.5,3.5)\psframe[framearc=0.5](0,0)(5,3)\psframe[framearc=0.5](1,1)(4,2)\end{pspicture}\end{center}
gives
Note that the corners of the larger rectangle are more rounded, as shouldbe obvious from the definition of the framearc parameter. The radius ofthe corners can be made he same by setting the parameter cornersize toabsolute (its default setting is relative) and then setting the radius usingthe linearc parameter as in the example below:
\begin{center}\begin{pspicture}(-0.5,-0.5)(5.5,3.5)\psframe[cornersize=absolute,%
linearc=0.5](0,0)(5,3)\psframe[cornersize=absolute,%
linearc=0.5](1,1)(4,2)\end{pspicture}\end{center}

Graphics with PSTricksGetting the points
Drawing Dots
Simple Lines
Ends of Lines
Bent Lines and Polygons
Simple Curves
Online LATEX Tutorial
Part II – Graphics
c©2002, The Indian TEX Users GroupThis document is generated by PDFTEX withhyperref, pstricks, pdftricks and pdfscreenpackages in an intel PC running GNU/LINUX
and is released under LPPL
The Indian TEX Users GroupFloor iii, sjp Buildings, Cotton HillsTrivandrum 695014, india
http://www.tug.org.in
� � � � � �
There are also commands to draw isoceles triangles (that is, triangles inwhich two sides are equal) and rhombuses (diamonds). The command
\pstriangle((x,y)(b,h))
draws an isoceles triangle with its base horizontal, the mid-point of its baseat (x,y), length of base b and height h while the command
\psdiamond((x,y)(d1, d2))
draws a rhombus with its diagonals along the horizontal and the vertical,which meet (x,y) and have lengths 2d1 and 2d2. Thus
\begin{center}\begin{pspicture}(0,0)(5,5)\pstriangle(1,0)(2,3)\pstriangle*(4,1)(2,1.732)\psdiamond(3,4)(2,1)\end{pspicture}\end{center}
gives

Graphics with PSTricksGetting the points
Drawing Dots
Simple Lines
Ends of Lines
Bent Lines and Polygons
Simple Curves
Online LATEX Tutorial
Part II – Graphics
c©2002, The Indian TEX Users GroupThis document is generated by PDFTEX withhyperref, pstricks, pdftricks and pdfscreenpackages in an intel PC running GNU/LINUX
and is released under LPPL
The Indian TEX Users GroupFloor iii, sjp Buildings, Cotton HillsTrivandrum 695014, india
http://www.tug.org.in
� � � � � �
0 1 2 3 4 50
1
2
3
4
5
So far we’ve been drawing only straight lines (except for smoothing somecorners). We’ll discuss curves in the next few sections.

Graphics with PSTricksGetting the points
Drawing Dots
Simple Lines
Ends of Lines
Bent Lines and Polygons
Simple Curves
Online LATEX Tutorial
Part II – Graphics
c©2002, The Indian TEX Users GroupThis document is generated by PDFTEX withhyperref, pstricks, pdftricks and pdfscreenpackages in an intel PC running GNU/LINUX
and is released under LPPL
The Indian TEX Users GroupFloor iii, sjp Buildings, Cotton HillsTrivandrum 695014, india
http://www.tug.org.in
� � � � � �
1.6. Simple Curves
Circles, ellipses, circular arcs and so on can be easily drawn in PSTricks, us-ing preset commands. Let’s start with circles. The command is \pscircle(what else?) and we’ve to specify the coordinates of the center and thelength of the radius. Recall that the default unit is centimeter, so that toproduce a circle of radius 0.5 cm centered at (2,1), we write
\pscircle(2,1){0.5}
Since a circle is only a curved “line”, various line parameters discussedearlier can also be used. There is also a starred version \pscircle* whichgives a “solid” circle. See the example below:
\begin{center}\begin{pspicture}(-1,-1)(3,8)\pscircle*(1,0.25){0.25}\pscircle[linewidth=0.33]%
(1,1){0.5}\pscircle[linewidth=0.25]%
(1,2.25){0.75}\pscircle(1,4){1}\pscircle[linestyle=dotted]%
(1,6.25){1.25}\end{pspicture}
\end{center}

Graphics with PSTricksGetting the points
Drawing Dots
Simple Lines
Ends of Lines
Bent Lines and Polygons
Simple Curves
Online LATEX Tutorial
Part II – Graphics
c©2002, The Indian TEX Users GroupThis document is generated by PDFTEX withhyperref, pstricks, pdftricks and pdfscreenpackages in an intel PC running GNU/LINUX
and is released under LPPL
The Indian TEX Users GroupFloor iii, sjp Buildings, Cotton HillsTrivandrum 695014, india
http://www.tug.org.in
� � � � � �
Pieces of circles can also be easily drawn. For example, the command\psarc draws a circular arc of specified center and radius from a givenangle to another going counterclockwise. Note that the angles are measuredfrom the horizontal. In the example below, we show the radii and the anglesin gray along with the grid. (note that these are not produced by the givencode).
\begin{center}\begin{pspicture}(-1,-1)(3,3)\psarc(0,0){3}{30}{60}\end{pspicture}
\end{center}

Graphics with PSTricksGetting the points
Drawing Dots
Simple Lines
Ends of Lines
Bent Lines and Polygons
Simple Curves
Online LATEX Tutorial
Part II – Graphics
c©2002, The Indian TEX Users GroupThis document is generated by PDFTEX withhyperref, pstricks, pdftricks and pdfscreenpackages in an intel PC running GNU/LINUX
and is released under LPPL
The Indian TEX Users GroupFloor iii, sjp Buildings, Cotton HillsTrivandrum 695014, india
http://www.tug.org.in
� � � � � �
-1 0 1 2 3-1
0
1
2
3
30◦
60◦
There’s also a starred version \psarc* which draws a solid “segment” ofa circle. For example,
\begin{center}\begin{pspicture}(-2,-2)(2,2)\psframe(-1,-1)(1,1)\psarc*(-1,-1){1}{0}{90}\psarc*(1,-1){1}{90}{180}\psarc*(1,1){1}{180}{270}\psarc*(-1,1){1}{270}{360}\end{pspicture}
\end{center}
gives
-2 -1 0 1 2-2
-1
0
1
2

Graphics with PSTricksGetting the points
Drawing Dots
Simple Lines
Ends of Lines
Bent Lines and Polygons
Simple Curves
Online LATEX Tutorial
Part II – Graphics
c©2002, The Indian TEX Users GroupThis document is generated by PDFTEX withhyperref, pstricks, pdftricks and pdfscreenpackages in an intel PC running GNU/LINUX
and is released under LPPL
The Indian TEX Users GroupFloor iii, sjp Buildings, Cotton HillsTrivandrum 695014, india
http://www.tug.org.in
� � � � � �
While making a picture containing circular arcs, it may sometimes be con-venient to “see” the center and radii. If the parameter showpoints is set totrue (its default value is false), then the command \psarc (or \psarc)draws dashed lines from the center to the extremities of the arc. (This set-ting can be used with other commands also, where it will draw appropriatecontrol points or lines). See the example below:
\begin{center}\begin{pspicture}(0,0)(3,3)\psarc[showpoints=true]%
(1,1){2}{30}{60}\end{pspicture}
\end{center}
0 1 2 30
1
2
3
If we want to draw an arc with its bounding radii, we can use the\pswedge command. The starred version \pswedge* draws a solid sectoras shown in the example below:
\begin{center}\begin{pspicture}(-1.5,-1.5)(1.5,1.5)\pswedge(0,0){1}{90}{360}\pswedge*(0.1,0.1){1}{0}{90}\end{pspicture}
\end{center}

Graphics with PSTricksGetting the points
Drawing Dots
Simple Lines
Ends of Lines
Bent Lines and Polygons
Simple Curves
Online LATEX Tutorial
Part II – Graphics
c©2002, The Indian TEX Users GroupThis document is generated by PDFTEX withhyperref, pstricks, pdftricks and pdfscreenpackages in an intel PC running GNU/LINUX
and is released under LPPL
The Indian TEX Users GroupFloor iii, sjp Buildings, Cotton HillsTrivandrum 695014, india
http://www.tug.org.in
� � � � � �
The line terminators discussed earlier can be used with arcs also. If wewant to show the angle between two (thick) intersecting lines using an arcwith an arrowhead, we’d like to have the tip of the arrow would just touchthe line. For this, we can use the parameters arcsepA and arcsepB. If weset arcsepA=dim, then the first angle in the \psarc command would beadjusted so that the arc would just touch a line of width dim from thecenter of the arc in the direction of this angle. The parameter arcsepBmakes a similar adjustment in the second angle. The parameter arcsepadjusts both the angles. The example below illustrates this.
\begin{center}\begin{pspicture}(-2,0)(2,2)\psline[linewidth=2pt]%
(2,2)(0,0)(-2,2)\psarc[arcsepB=2pt]{->}%
(0,0){1}{45}{135}\end{pspicture}
\end{center}
-2 -1 0 1 20
1
2
To see the difference, try the same code without the setting of arcsepB.An ellipse is a sort of a stretched circle and can be drawn much the

Graphics with PSTricksGetting the points
Drawing Dots
Simple Lines
Ends of Lines
Bent Lines and Polygons
Simple Curves
Online LATEX Tutorial
Part II – Graphics
c©2002, The Indian TEX Users GroupThis document is generated by PDFTEX withhyperref, pstricks, pdftricks and pdfscreenpackages in an intel PC running GNU/LINUX
and is released under LPPL
The Indian TEX Users GroupFloor iii, sjp Buildings, Cotton HillsTrivandrum 695014, india
http://www.tug.org.in
� � � � � �
same way as s circle. The command is \psellipse and we have to specifythe center and half the width and height (technically, the “semi-major” and“semi-minor” axes). Thus to draw an ellipse centered at (1,1) with widthwidth 4 cm and height 2 cm, we type
\begin{center}\begin{pspicture}(-1,0)(3,2)\psellipse(1,1)(2,1)\end{pspicture}
\end{center}
which gives
-1 0 1 2 30
1
2
There’s also a \psellipse* which, as you’ve probably guessed, draws asolid black ellipse.
\begin{center}\begin{pspicture}(-2,-1)(2,1)\psellipse(0,0)(2,1)\psellipse*(0,0)(0.5,1)\end{pspicture}
\end{center}
-2 -1 0 1 2-1
0
1

Graphics with PSTricksGetting the points
Drawing Dots
Simple Lines
Ends of Lines
Bent Lines and Polygons
Simple Curves
Online LATEX Tutorial
Part II – Graphics
c©2002, The Indian TEX Users GroupThis document is generated by PDFTEX withhyperref, pstricks, pdftricks and pdfscreenpackages in an intel PC running GNU/LINUX
and is released under LPPL
The Indian TEX Users GroupFloor iii, sjp Buildings, Cotton HillsTrivandrum 695014, india
http://www.tug.org.in
� � � � � �
Another curve for which a preset command is available is a parabola(the path of a stone thrown at an angle, for example). It is drawn by thecommand \parabola (surprise!). We must specify the starting point andthe maximum or minimum. As usual, we have a \parabola* also. Thus
\begin{center}\begin{pspicture}(0,0)(4,2)\parabola(0,0)(2,2)\parabola*(1,1.5)(2,0)\end{pspicture}
\end{center}
gives
0 1 2 3 40
1
2