1 economy - boardsandcommissions.sd.govboardsandcommissions.sd.gov/bcuploads/gcea.102815.pdfthe...
TRANSCRIPT

The State of the SD Economy
Presentation to the Governor’s
Council of Economic Advisors
October 28, 2015
Ralph J. Brown, Professor Emeritus of Economics
University of South Dakota
1

Outline of Presentation
Overview of US economy
US economy forecast
SD economy
Summary & Conclusions
2
US Forecast
Global Insight Forecast – October 9, 2015
Real GDP
Consumption
Housing Starts
Federal Budget
Interest Rates and Inflation
3

GDPGDP growth in the 2nd half of 2015 will be constrained due to large inventory accumulation in the 1st half. GDP growth in 2016 and 2017 will be strong at 2.9% and 3.0%, respectively.Consumption spending will be strong.Business investment and housing will also be strong over the next two years.The strong $ will hold back growth in the foreign sector.
4

Faster Growth 2016 & 20175
-10%
-8%
-6%
-4%
-2%
0%
2%
4%
6%
2006 2008 2010 2012 2014 2016
1997-2007 3.0%
GROSS DOMESTIC PRODUCT
Actual Forecast
Source: BEA and IHS
2014 2.4%Forecast2015 2.5%2016 2.9%2017 3.0%
GDP2011Q3=2007Q4

Components of GDP are:
GDP = Consumption (69%)
Investment (17%)
Government (18%)
Net Export (-4%)
6
Consumption
Consumption spending is expected to remain strong through 2017.
Solid job growth, low inflation, strong HH finances, and lower energy prices all support consumer growth.
Auto sales are expected to be strong.
Low import prices will support consumption as well.
7
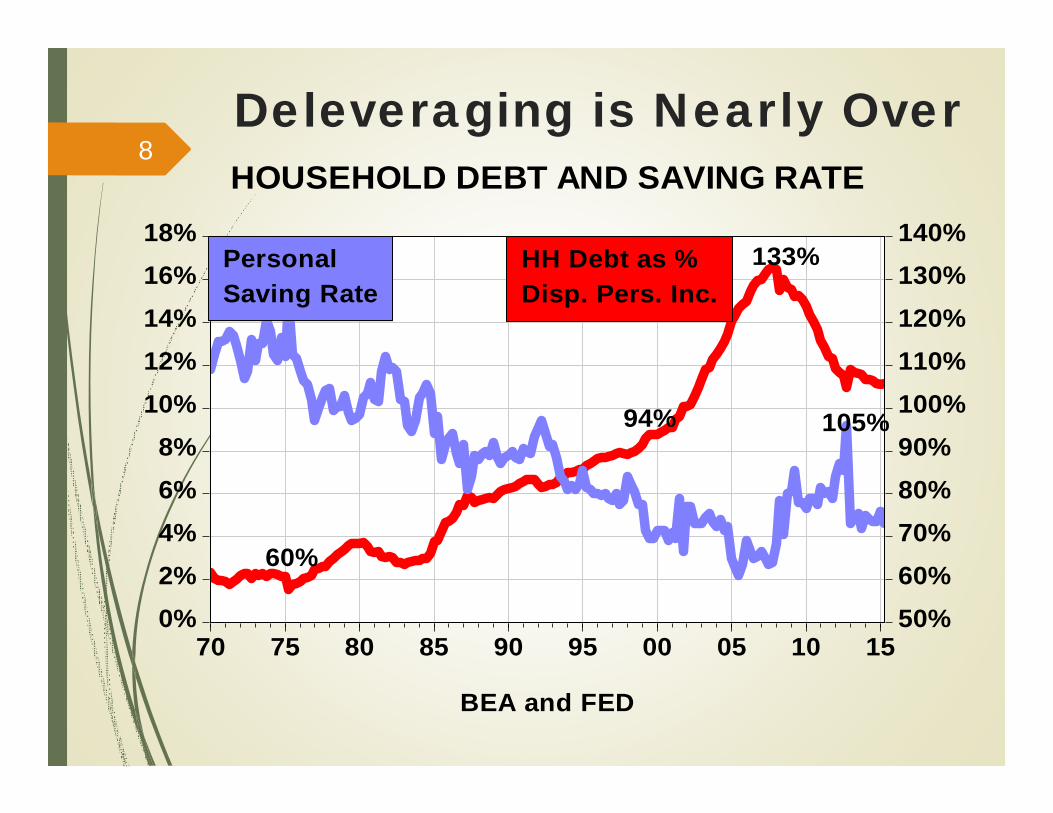
Deleveraging is Nearly Over8
0%2%4%6%8%
10%12%14%16%18%
50%60%70%80%90%100%110%120%130%140%
70 75 80 85 90 95 00 05 10 15
BEA and FED
PersonalSaving Rate
HH Debt as %Disp. Pers. Inc.
133%
105%
60%
94%
HOUSEHOLD DEBT AND SAVING RATE

Good Growth9
-6%
-4%
-2%
0%
2%
4%
6%
-6%
-4%
-2%
0%
2%
4%
6%
2006 2008 2010 2012 2014 2016
Actual Forecast
REAL CONSUMPTION
Source: BEA and IHS
1997-2007 3.6%
2014 2.7%Forecast2015 3.0%2016 3.1%2017 2.9%
Investment Sector
In the energy sector, it looks like the drilling rig count will continue to be negative and bottom out next year.
Housing starts will be strong over the next two years.
Investment in commercial structures is projected for positive growth in 2016 and 2017 after a decline in 2015.
Spending on equipment is projected for good growth in 2016 and 2017.
10
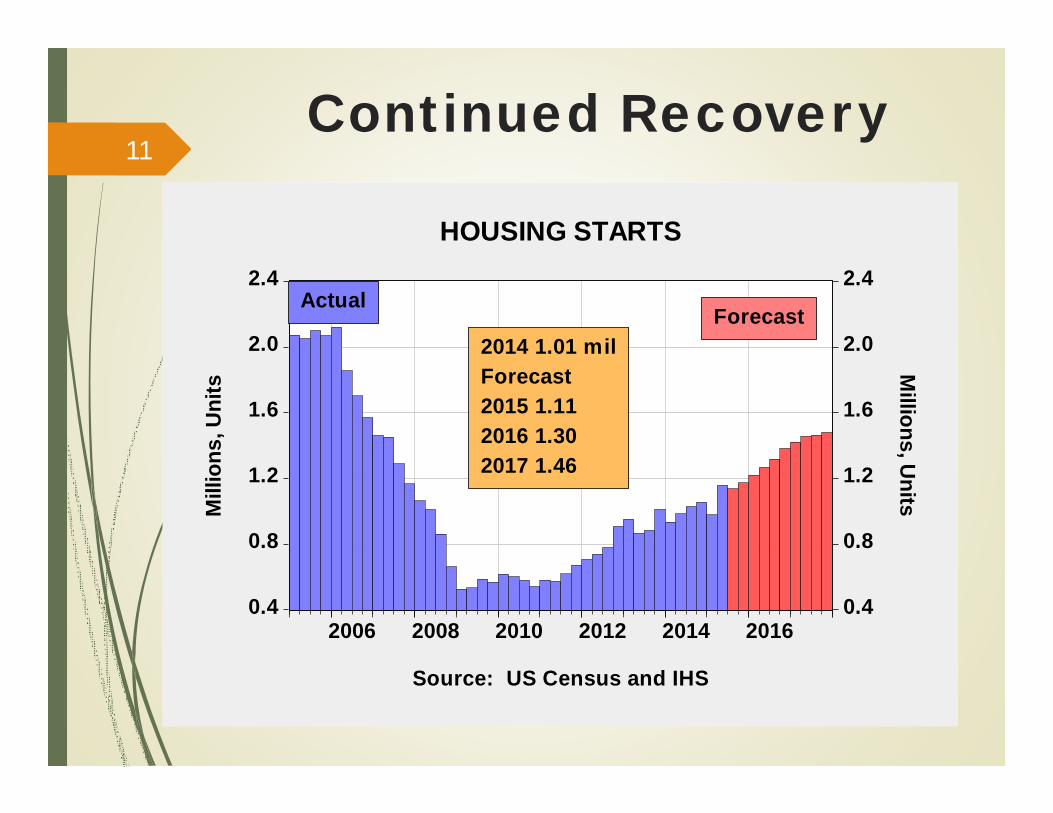
Continued Recovery 11
0.4
0.8
1.2
1.6
2.0
2.4
0.4
0.8
1.2
1.6
2.0
2.4
2006 2008 2010 2012 2014 2016
ActualForecast
2014 1.01 milForecast2015 1.112016 1.302017 1.46
HOUSING STARTS
Source: US Census and IHS
Mill
ions
, Uni
ts
Millions, U
nits
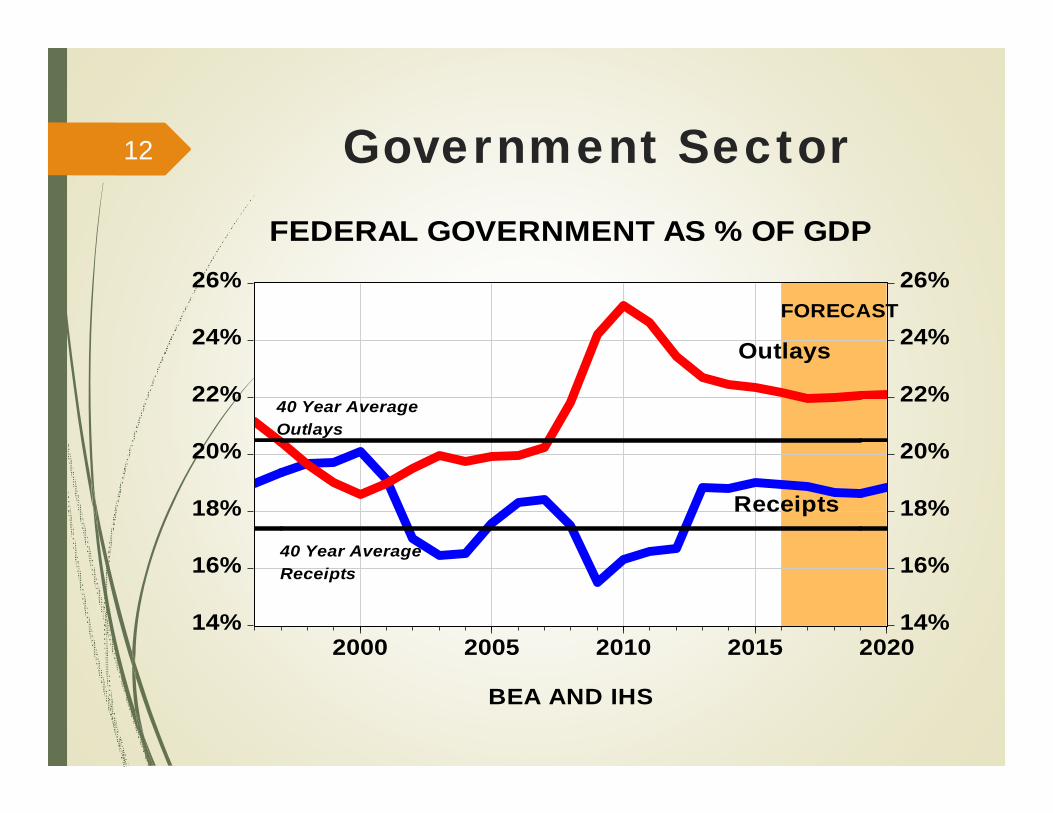
Government Sector12
14%
16%
18%
20%
22%
24%
26%
14%
16%
18%
20%
22%
24%
26%
2000 2005 2010 2015 2020
Receipts
Outlays
40 Year AverageReceipts
40 Year AverageOutlays
FEDERAL GOVERNMENT AS % OF GDP
BEA AND IHS
FORECAST

Debt Held by Public13
30%
40%
50%
60%
70%
80%
30%
40%
50%
60%
70%
80%
00 02 04 06 08 10 12 14 16 18 20
FEDERAL DEBT HELD BY PUBLIC AS % OF GDP
FORECAST
Source: IHS
Debt held by ind, corp, s&l govtforeigners, and Fed Res Syst
The balance ownedby intergovt holdingssuch as Soc Sec
Foreigners holdabout 47% ofpublicly helddebt

Foreign Sector
$ at highest level since 2003 and will continue to be strong through the first half of 2016.
China is no longer the locomotive leading the growth in Asian countries and commodity-exporting countries.
China is undergoing a series of transitions (external to internal demand, rural to urban, industry to services, and fixed investment to consumption).
The US is one of the bright spots in the world economy.
14

Last Month Only 142K15
-1,000
-800
-600
-400
-200
0
200
400
600
-1,000
-800
-600
-400
-200
0
200
400
600
05 06 07 08 09 10 11 12 13 14 15
NONFARM EMPLOYMENT
P to T-8.7 mil-6.3%
Back to PMay 2014
+229,000 mth avglast 12 monthsch
ange
in th
ousa
nds change in thousands
Source: BLS

Employment & Unemployment
After a year of job growth of more than 200,000 per month, there is some evidence that the job market is losing momentum.
Unemployment rate will average 5.3% in 2015 and 5.0% in 2016 and 4.9% in 2017.
Yet, the labor force participation rate is at a 38 year low and wage growth is sluggish.
16
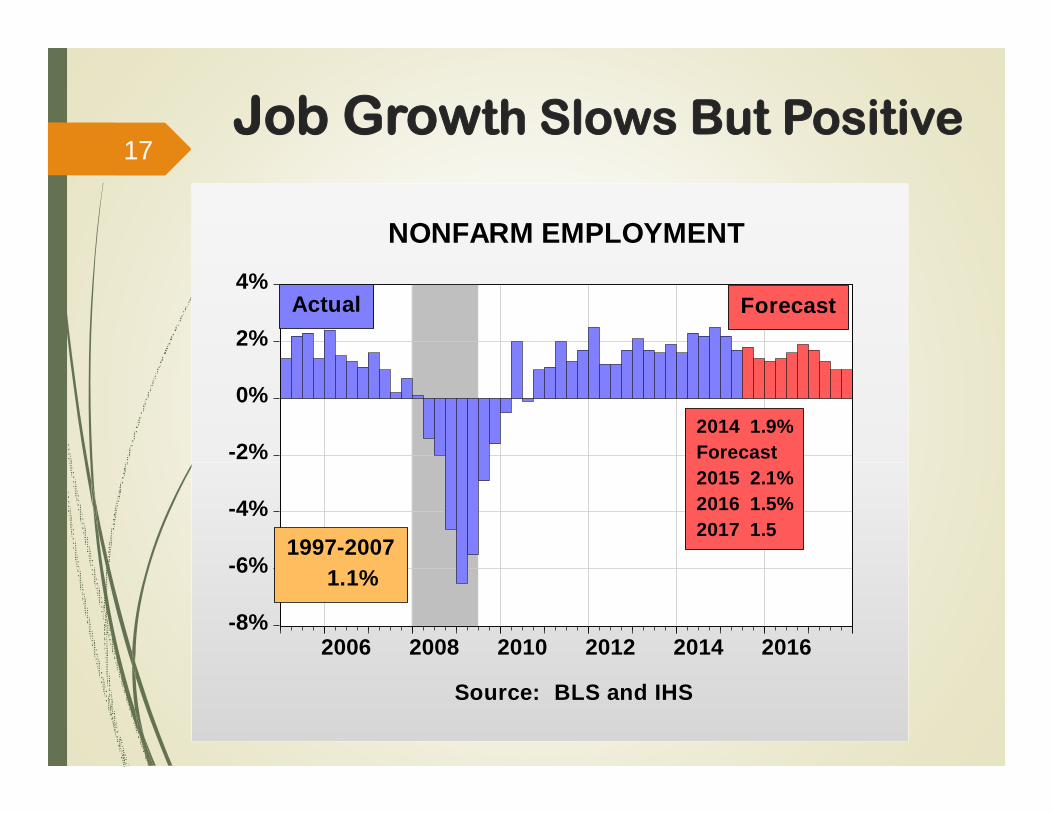
Job Growth Slows But Positive17
-8%
-6%
-4%
-2%
0%
2%
4%
2006 2008 2010 2012 2014 2016
NONFARM EMPLOYMENT
Source: BLS and IHS
Actual Forecast
1997-2007 1.1%
2014 1.9%Forecast2015 2.1%2016 1.5%2017 1.5
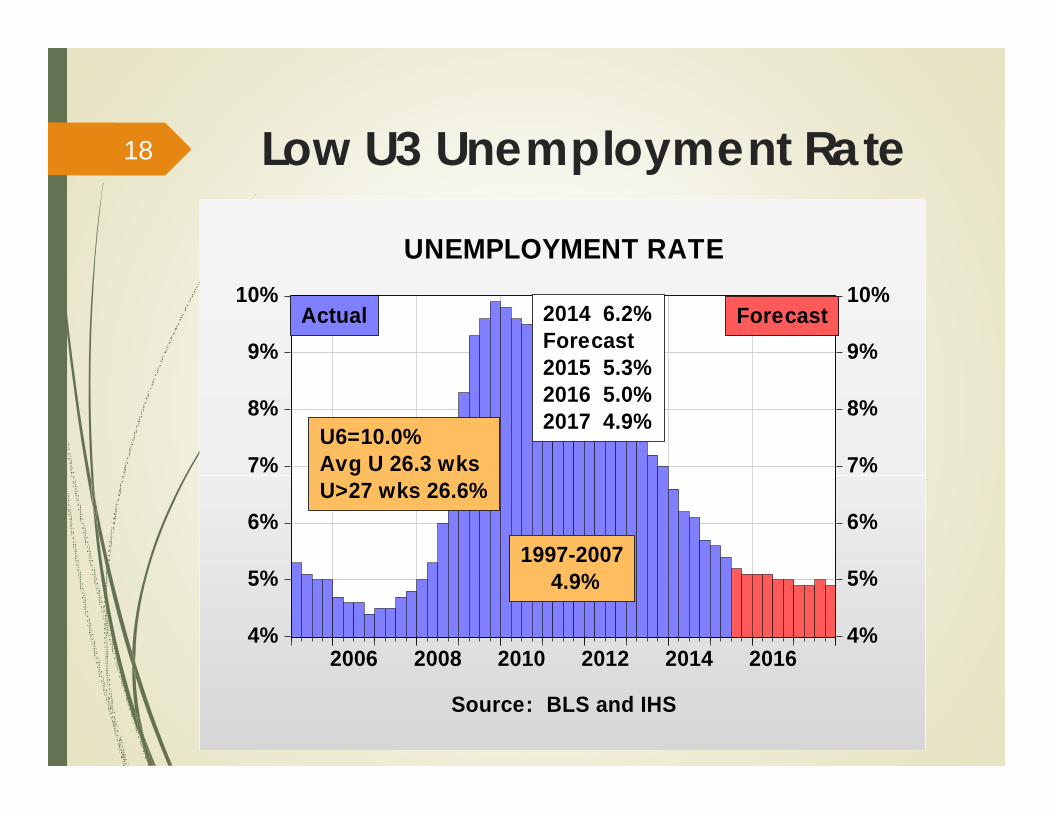
Low U3 Unemployment Rate
4%
5%
6%
7%
8%
9%
10%
4%
5%
6%
7%
8%
9%
10%
2006 2008 2010 2012 2014 2016
Actual Forecast
UNEMPLOYMENT RATE
Source: BLS and IHS
1997-2007 4.9%
U6=10.0%Avg U 26.3 wksU>27 wks 26.6%
2014 6.2%Forecast2015 5.3%2016 5.0%2017 4.9%
18

U3 & U6 Unemployment Rates19
2%
4%
6%
8%
10%
12%
14%
16%
18%
2%
4%
6%
8%
10%
12%
14%
16%
18%
00 02 04 06 08 10 12 14
Unemployment Rates
Source: BLS
U6
U3
U3=Unemployment RateU6=U3+Marginally Attached& Part-Time for Econ. Reasons
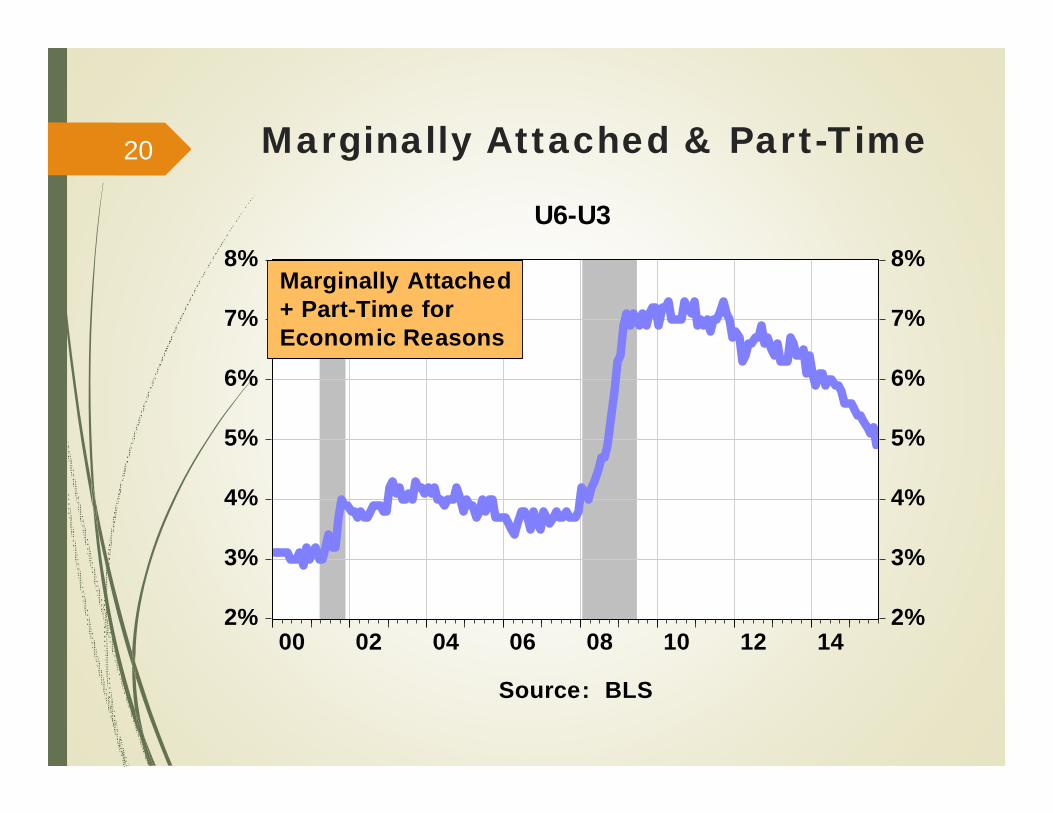
Marginally Attached & Part-Time20
2%
3%
4%
5%
6%
7%
8%
2%
3%
4%
5%
6%
7%
8%
00 02 04 06 08 10 12 14
U6-U3
Source: BLS
Marginally Attached+ Part-Time forEconomic Reasons

US & SD U6 21
6%
8%
10%
12%
14%
16%
18%
6%
8%
10%
12%
14%
16%
18%
2009 2010 2011 2012 2013 2014
US AND SD U6UNEMPLOYMENT RATE
Source: BLS
US
SD

Inflation & Interest Rates
Low energy prices and the strong $ keep inflation under control and well below FED’s 2% target.
Weak international sector and financial market volatility is the reason FED did not raise rates in September.
IHS expects FED to begin raising rates in December 2015. Greater than 50/50.
If the job market loses more momentum and/or a govt shutdown, December rate rise could be delayed again.
22

Still Very Low23
-12%
-8%
-4%
0%
4%
8%
2006 2008 2010 2012 2014 2016
INFLATION: CPI
Source: BLS and IHS
ForecastActual
1997-2007 2.6%
2014 1.6%Forecast2015 0.0%2016 1.8%2017 2.4%
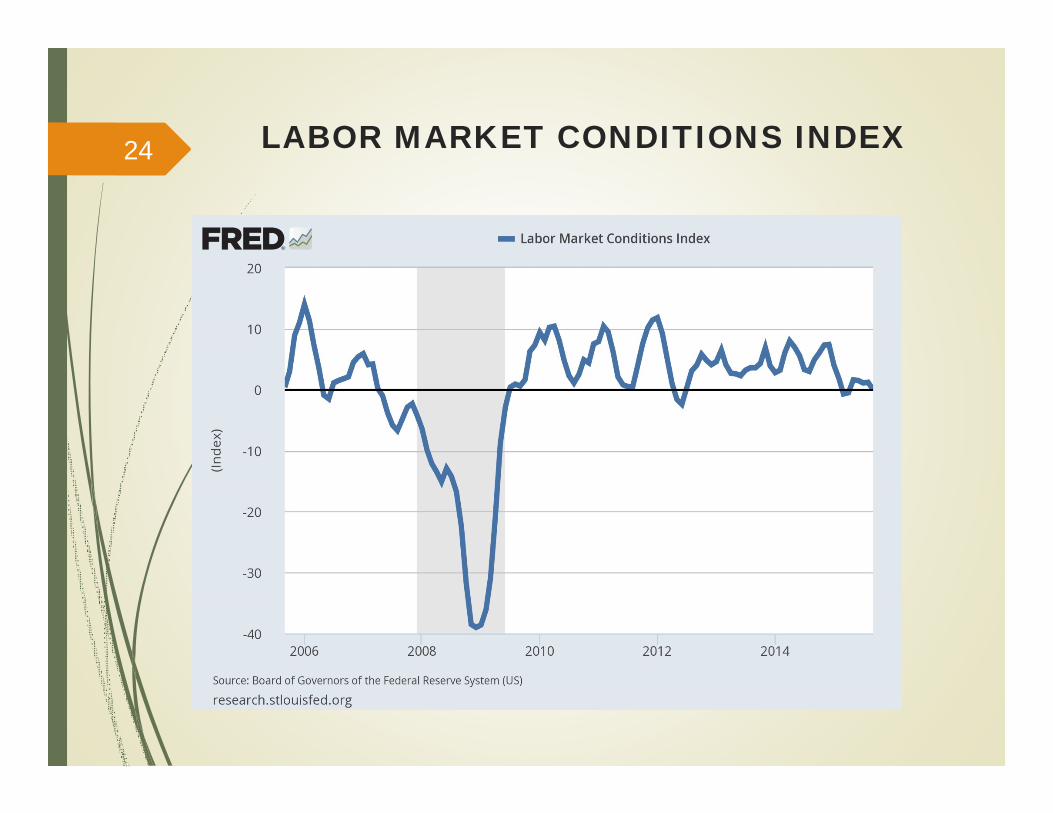
LABOR MARKET CONDITIONS INDEX24

PERSONAL CONSUMPTION EXPENDITURESDEFLATOR LESS FOOD AND ENERGY25

IHS GLOBAL INSIGHT FORECAST 2/6/14
Variable 2014 2015 2016 2017 GDP 2.4% 2.5 % 2.9% 3.0%
NA Emp 1.9% 2.1% 1.5% 1.5%
Oil(Brent) $100 $54 $55 $63
Housing 1.01 1.11 1.30 1.46
CPI 1.6% 0.0% 1.8% 2.4%
Un Rate 6.2% 5.3% 5.0% 4.9%
IHS GLOBAL INSIGHT FORECAST October 201526

Risks to Forecast
20% chance of recession.Risks are:Slowing growth of developing economies
because of low commodity prices.The international weakness causes risk-
averse investors to seek security in US assets driving up the value of the $.
Then US economy slows causing a sharp drop in the stock market. By 2nd qtr of 2016 the S&P 500 down 24% year-over-year.
Consumer confidence drops, etc. etc.
27
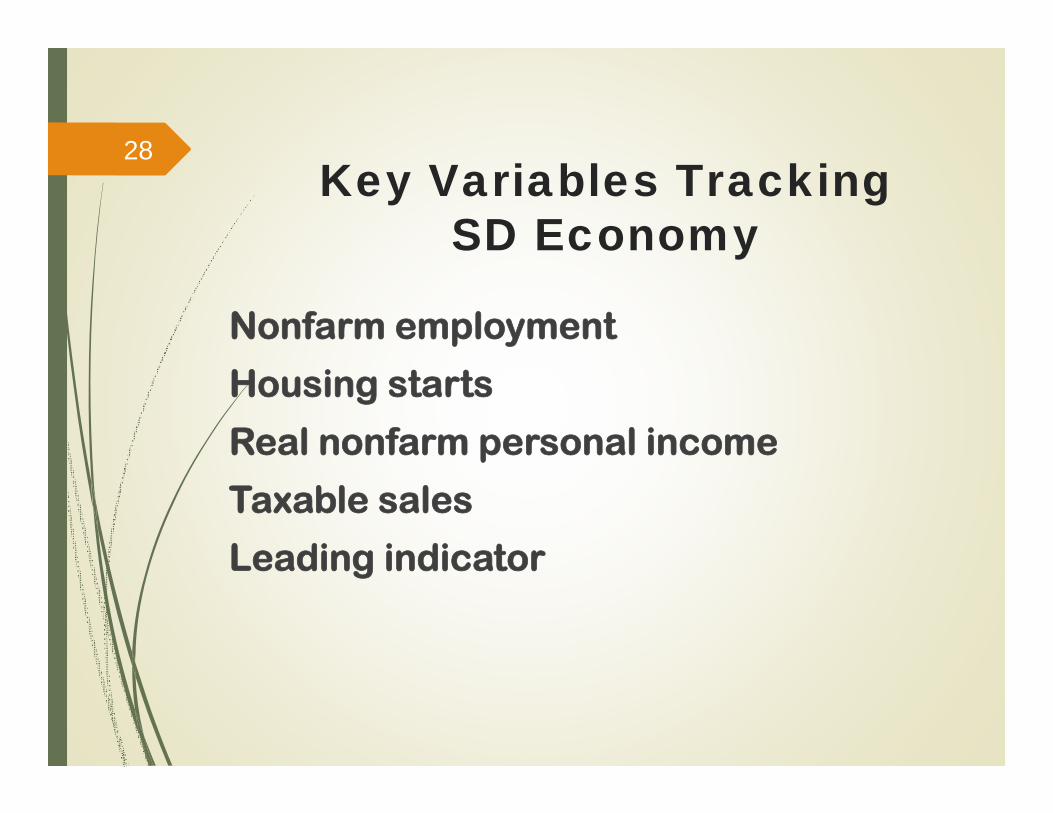
Key Variables Tracking SD Economy
Nonfarm employment
Housing starts
Real nonfarm personal income
Taxable sales
Leading indicator
28

Steady Growth29
144,000
140,000
136,000
132,000
128,000
440
430
420
410
400
390
380
05 06 07 08 09 10 11 12 13 14 15
Thou
sand
s Thousands
Source: BLS
NONFARM EMPLOYMENT
SD
US
RatioScale
Job Loss P to TUS -8.7 mil -6.3%SD -12.7 thous -3.1%
SD RecessionBegins =>
2014 M04
2012 MO2
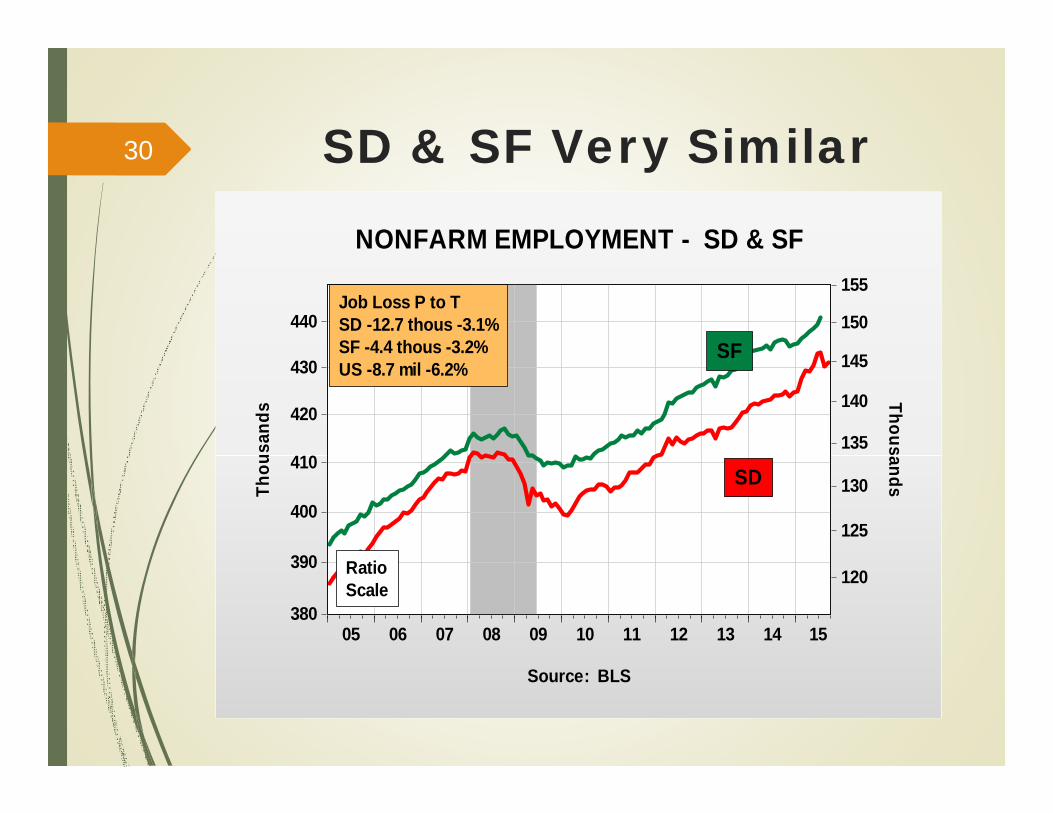
SD & SF Very Similar30
440
430
420
410
400
390
380
155
150
145
140
135
130
125
120
05 06 07 08 09 10 11 12 13 14 15
RatioScale
Thou
sand
s Thousands
Source: BLS
NONFARM EMPLOYMENT - SD & SF
SD
SF
Job Loss P to TSD -12.7 thous -3.1%SF -4.4 thous -3.2%US -8.7 mil -6.2%

Recovery – Almost Back31
8,0007,5007,0006,5006,000
5,500
5,000
25
24
23
22
21
20
05 06 07 08 09 10 11 12 13 14 15
Thou
sand
s Thousands
RatioScale
SD
US
Source: BLS
CONSTRUCTION EMPLOYMENT
P to TUS -29%SD -16%

Which is More Cyclical?32
72
68
64
60
56
370
360
350
340
330
320
05 06 07 08 09 10 11 12 13 14 15
Service EmploymentRight Scale==>
RatioScale
Goods Employment<==Left Scale
Thou
sand
s Thousands
SOUTH DAKOTA SERVICE AND GOODSPRODUCING EMPLOYMENT
Source: BLS
Goods-Producing = Manufacturing+Construction
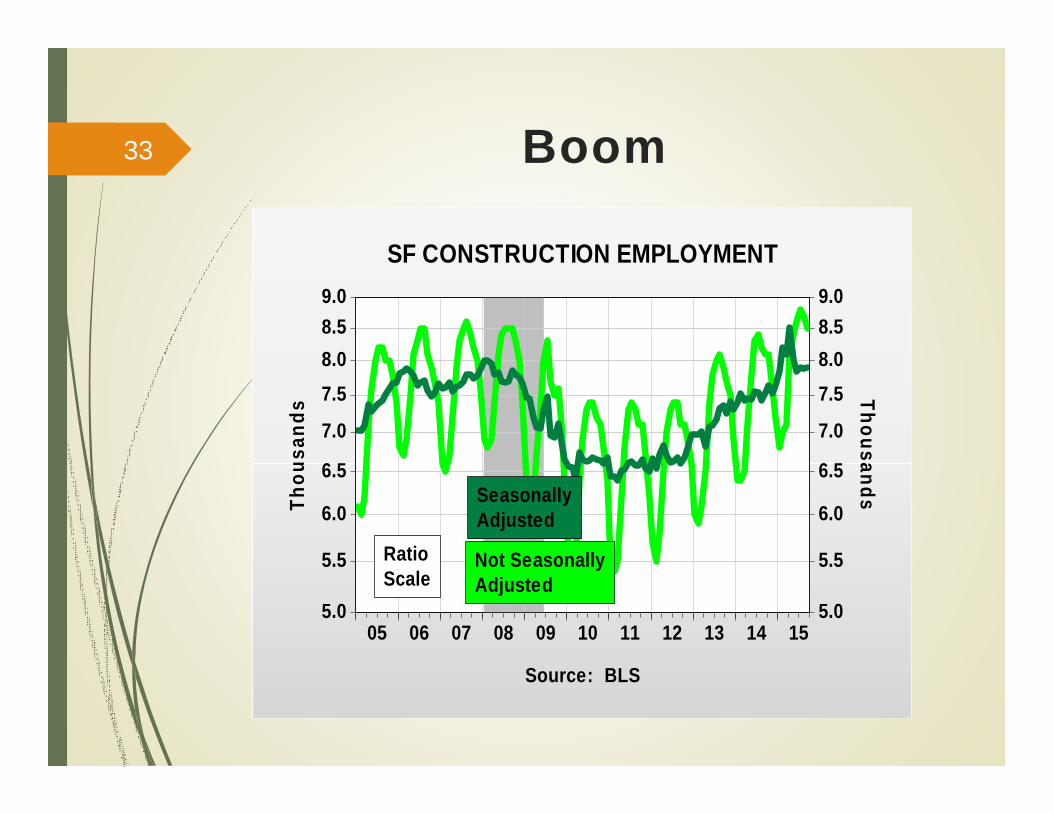
Boom33
9.08.58.07.5
7.0
6.5
6.0
5.5
5.0
9.08.58.07.5
7.0
6.5
6.0
5.5
5.005 06 07 08 09 10 11 12 13 14 15
Thou
sand
s
Source: BLS
Thousands
SF CONSTRUCTION EMPLOYMENT
RatioScale
SeasonallyAdjusted
Not SeasonallyAdjusted

Not Quite Back to Peak34
0100200300400500600700800900
0100200300400500600700800900
05 06 07 08 09 10 11 12 13 14 15
Total, SD
Single, SD
Uni
tsSD Building Permits, Total & Single
12 Month Moving Average
Source: Census Bureau

Booming35
0
100
200
300
400
500
05 06 07 08 09 10 11 12 13 14 15
SF Total
SF Single
12 MonthMoving Avg
12 MonthMoving Avg
Sioux Falls Building Permits
Source: US Census Bureau
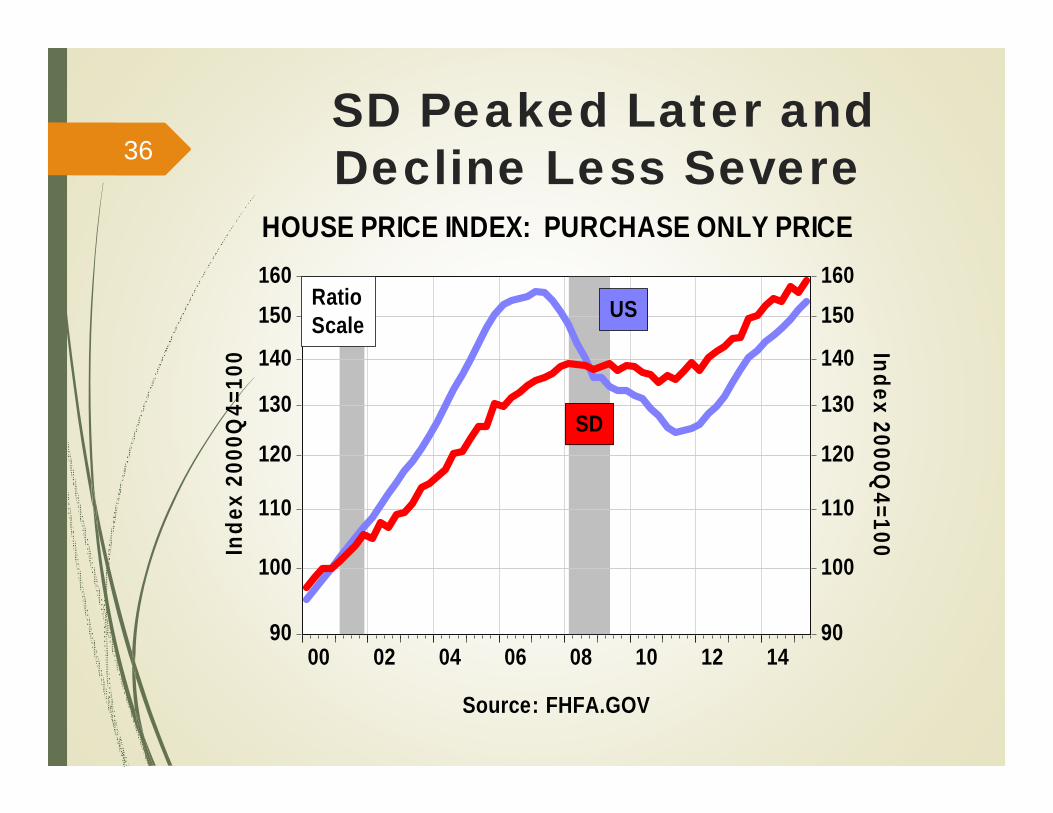
SD Peaked Later and Decline Less Severe36
160150
140
130
120
110
100
90
160150
140
130
120
110
100
9000 02 04 06 08 10 12 14
RatioScale
US
SD
Inde
x 20
00Q
4=10
0 Index2000Q
4=100
HOUSE PRICE INDEX: PURCHASE ONLY PRICE
Source: FHFA.GOV

Mfg Above Peak Fin Not
14,50014,00013,50013,00012,50012,00011,50011,000
4644
42
40
38
36
05 06 07 08 09 10 11 12 13 14 15
MANUFACTURING EMPLOYMENTTh
ousa
nds Thousands
Source: BLS
RatioScale
SD
USSince 12/2007US -13.1%SD -4.8%
MFG %US 8.9%SD 9.4%SF 9.3%
37

SD Not Back to Peak
8,400
8,200
8,000
7,800
7,600
17.216.816.416.015.615.214.8
05 06 07 08 09 10 11 12 13 14 15
SD
USRatioScale
Source: BLS
Thou
sand
s Thousands
FINANCIAL ACTIVITY EMPLOYMENT
P to TUS -8.5%SD -13.0%
Fin %US 5.8%SD 6.7%SF 10.6%
38
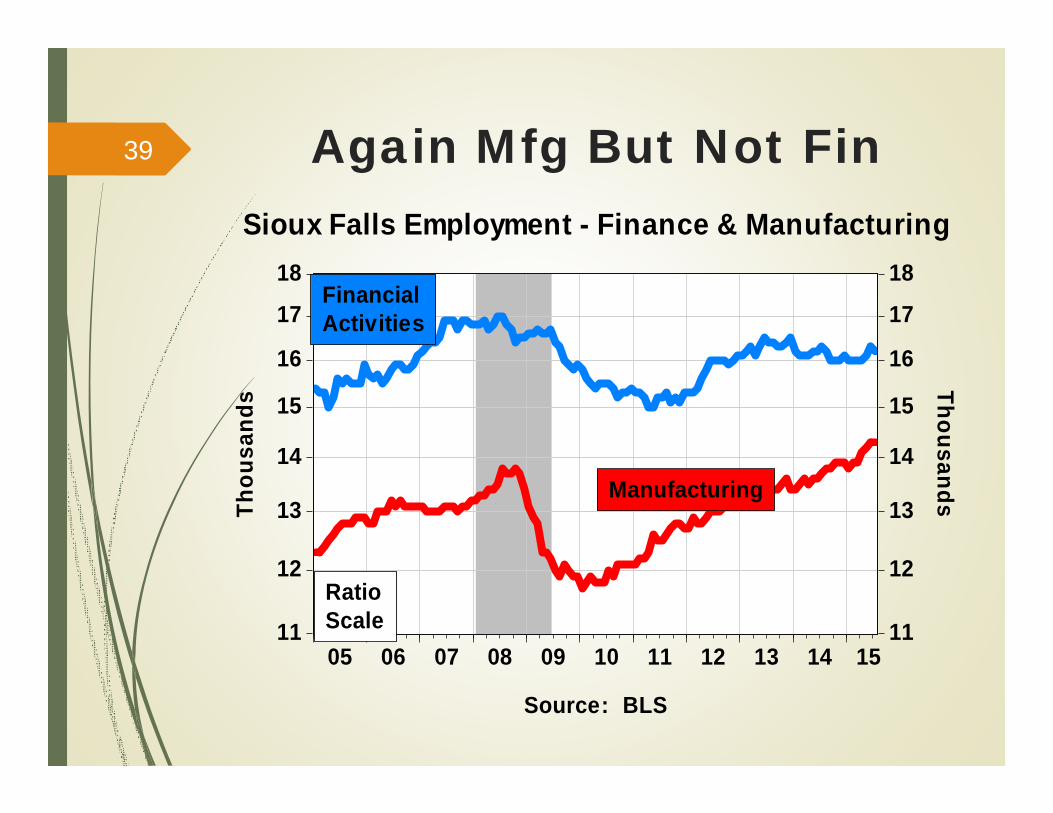
Again Mfg But Not Fin39
18
17
16
15
14
13
12
11
18
17
16
15
14
13
12
1105 06 07 08 09 10 11 12 13 14 15
Thou
sand
s Thousands
RatioScale
FinancialActivities
Manufacturing
Sioux Falls Employment - Finance & Manufacturing
Source: BLS

SD 3.5% SF(SA) 2.7%40
2%3%4%5%6%7%8%9%
10%11%
2%3%4%5%6%7%8%9%10%11%
05 06 07 08 09 10 11 12 13 14 15
UNEMPLOYMENT RATE
U6 (US)=10.0%U6 (SD)= 6.7%
Source: BLS
US
SD
SF
1997-2007US 4.9%SD 3.2%SF 2.5%

SD Smaller Decline – Way Above Previous Peak41
$14,000
$13,500
$13,000
$12,500
$12,000
$11,500
$11,000
$36
$34
$32
$30
$28
$26
05 06 07 08 09 10 11 12 13 14 15
RatioScale
Bill
ions
Billions
Source: BLS
NONFARM PERSONAL INCOME (2009 $S)
SD
US
P to TUS -2.8%SD -1.1%

US and SD Track42
-6%
-4%
-2%
0%
2%
4%
6%
8%
00 02 04 06 08 10 12 14
SD
US
REAL NONFARM PERSONAL INCOME(Year-Over-Year Percent Change)
Souce: BEA

High Prodn Low Prices Low Prices
43
$40
$60
$80
$100
$120
$140
$0
$1
$2
$3
$4
$5
05 06 07 08 09 10 11 12 13 14 15
Bill
ions
Billions
SD
US
Source: BEA
FARM INCOME
5 Year Avg% of PIUS = 0.7%SD = 8.6%
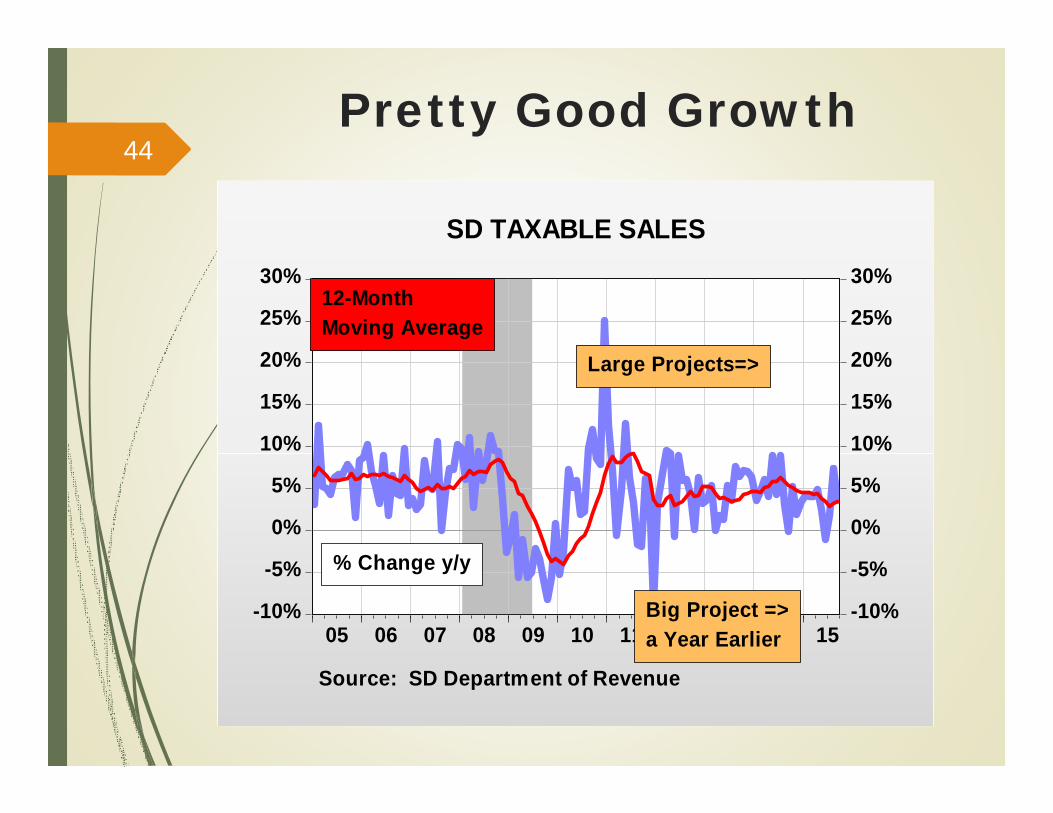
Pretty Good Growth44
-10%
-5%
0%
5%
10%
15%
20%
25%
30%
-10%
-5%
0%
5%
10%
15%
20%
25%
30%
05 06 07 08 09 10 11 12 13 14 15
Large Projects=>
% Change y/y
12-MonthMoving Average
SD TAXABLE SALES
Source: SD Department of Revenue
Big Project =>a Year Earlier
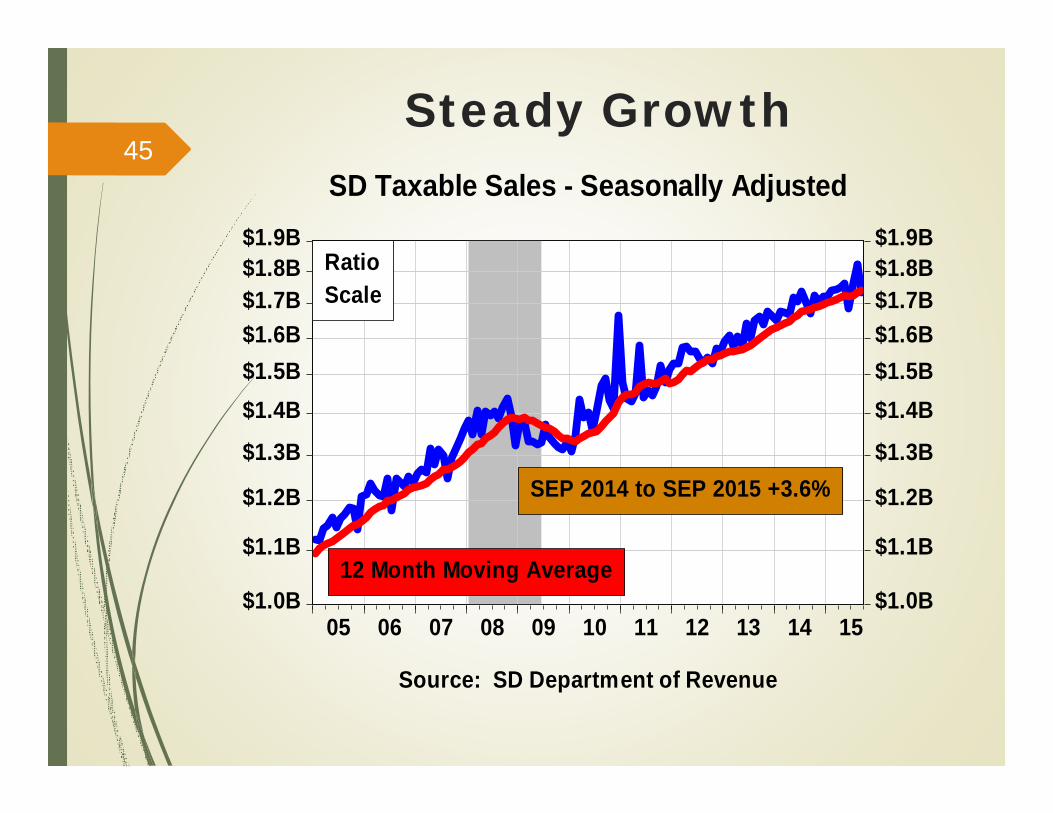
Steady Growth45
$1.9B$1.8B$1.7B$1.6B$1.5B$1.4B
$1.3B
$1.2B
$1.1B
$1.0B
$1.9B$1.8B$1.7B$1.6B$1.5B$1.4B
$1.3B
$1.2B
$1.1B
$1.0B05 06 07 08 09 10 11 12 13 14 15
RatioScale
SD Taxable Sales - Seasonally Adjusted
Source: SD Department of Revenue
12 Month Moving Average
SEP 2014 to SEP 2015 +3.6%
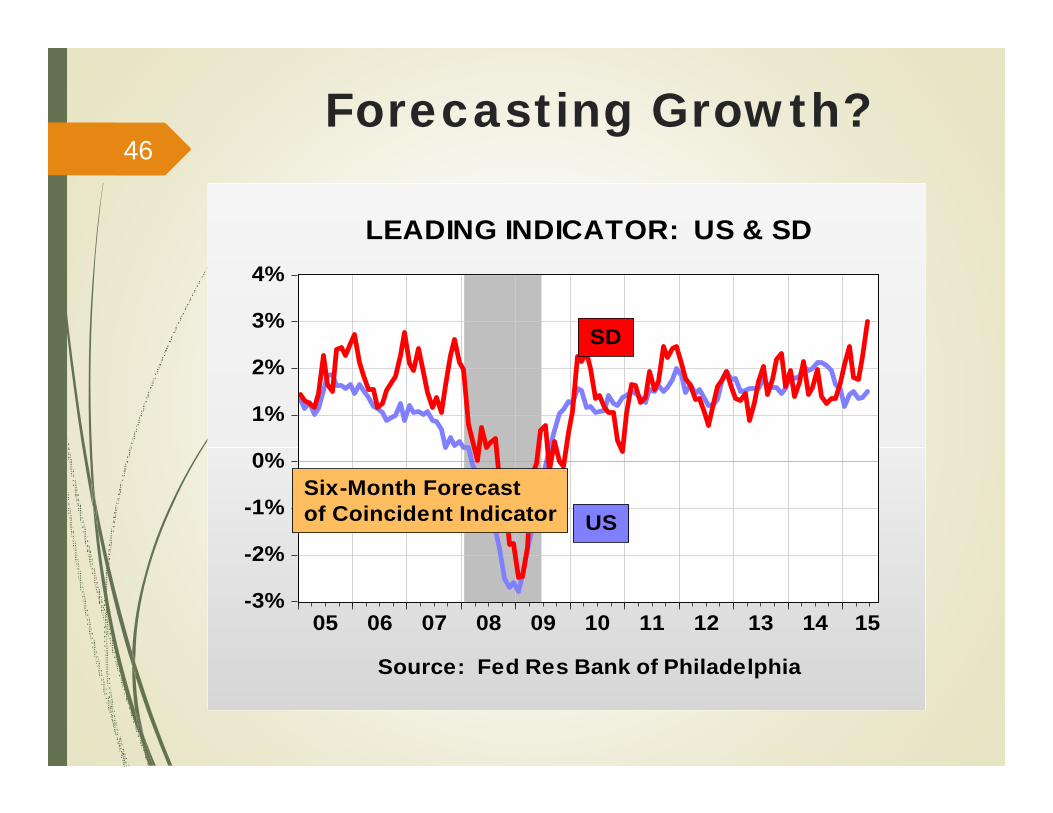
Forecasting Growth?46
-3%
-2%
-1%
0%
1%
2%
3%
4%
05 06 07 08 09 10 11 12 13 14 15
SD
US
LEADING INDICATOR: US & SD
Source: Fed Res Bank of Philadelphia
Six-Month Forecastof Coincident Indicator
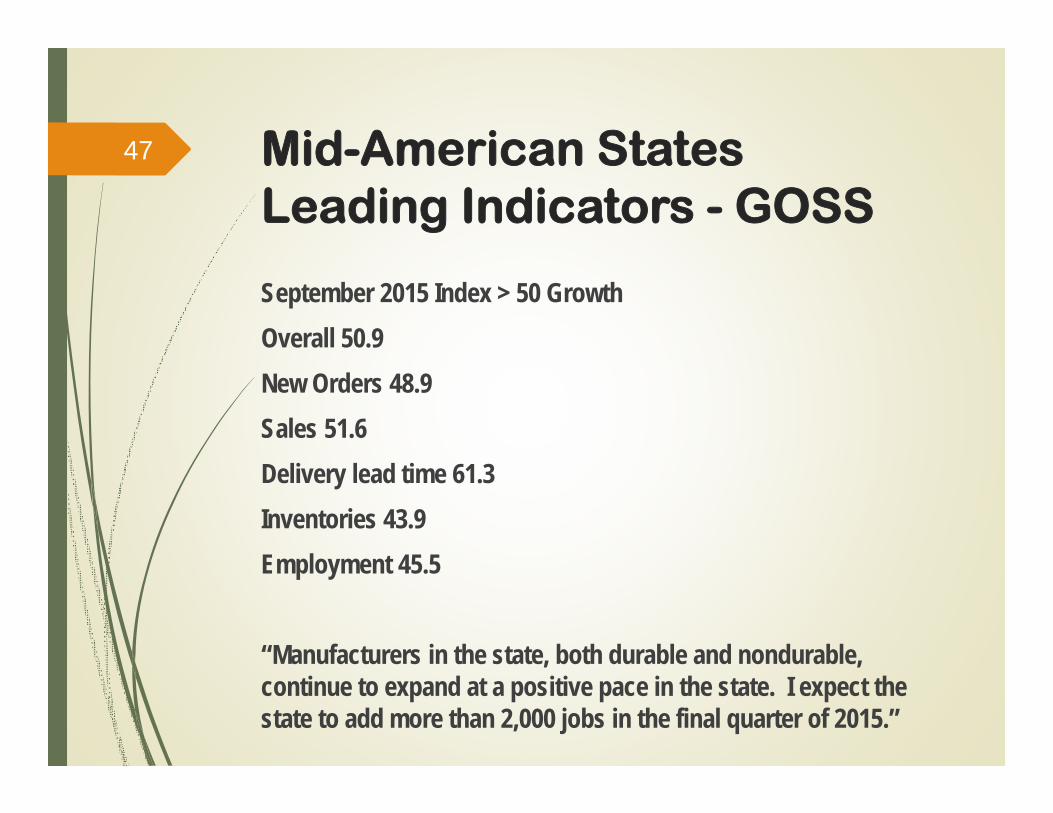
Mid-American States Leading Indicators - GOSS
September 2015 Index > 50 GrowthOverall 50.9New Orders 48.9Sales 51.6Delivery lead time 61.3Inventories 43.9Employment 45.5
“Manufacturers in the state, both durable and nondurable, continue to expand at a positive pace in the state. I expect the state to add more than 2,000 jobs in the final quarter of 2015.”
47
PER CAPITA PERSONAL INCOME
48
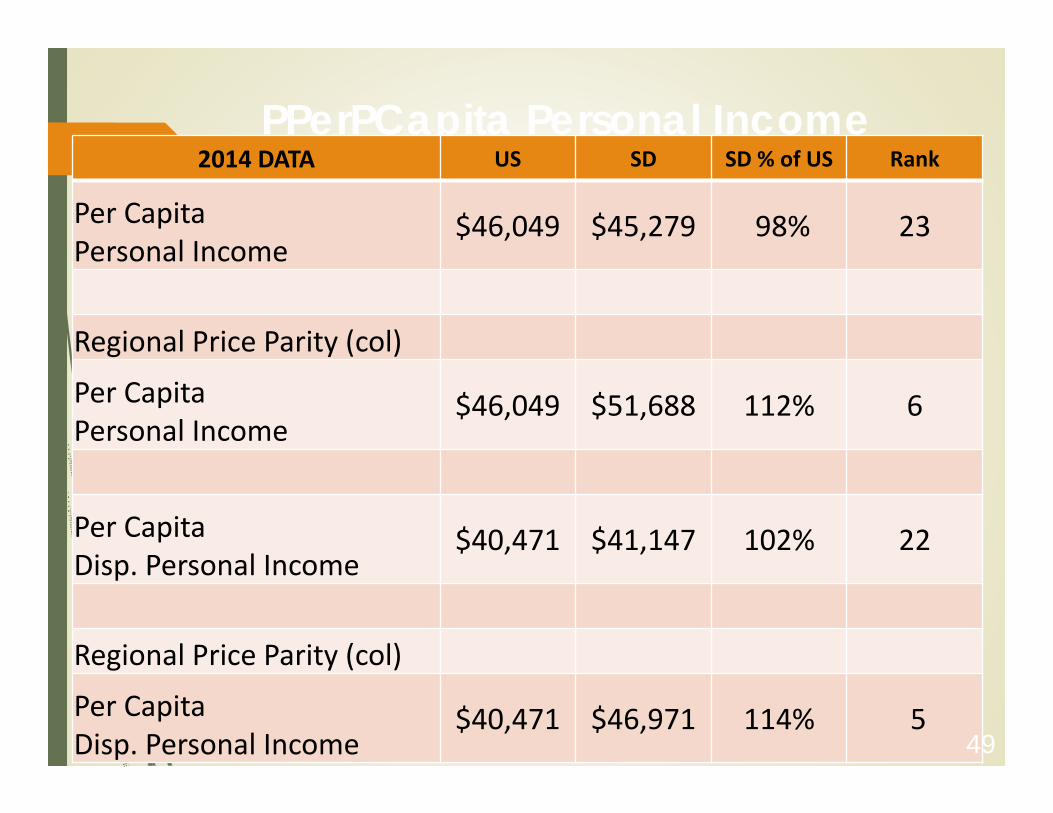
PPerPCapita Personal Income2014 DATA US SD SD % of US Rank
Per Capita Personal Income
$46,049 $45,279 98% 23
Regional Price Parity (col)
Per CapitaPersonal Income
$46,049 $51,688 112% 6
Per Capita Disp. Personal Income
$40,471 $41,147 102% 22
Regional Price Parity (col)
Per Capita Disp. Personal Income
$40,471 $46,971 114% 549

Conclusions
SD economy growing at moderate rate
SF economy growing at faster rate
US economy will speed up
Only 15% chance of recession
50

The End51