1 drivers, consequences, and remedies of biased...
TRANSCRIPT
1
Drivers, Consequences, and Remedies of Biased Size Perceptions in Marketing
Nailya Ordabayeva a,*
Pierre Chandon b
December 14, 2016
a Carroll School of Management, Boston College, 140 Commonwealth Avenue, Chestnut Hill, MA, 02467, USA. Email: [email protected]. Tel.: 617-552-2928.
b L’Oréal Chaired Professor of Marketing, Innovation and Creativity, INSEAD, Boulevard de Constance, 77305 Fontainebleau, France. Email: [email protected]. Tel.: +33160724987.
* Corresponding author. This chapter is based on a publication by the same authors (Ordabayeva & Chandon 2016), updated with the most recent findings in this field of research.

2
Drivers, Consequences, and Remedies of Biased Size Perceptions in Marketing
Abstract
The sizes of packages and portions have changed dramatically in the recent decades, impacting
consumers’ food consumption decisions as well as their health. Understanding – and mitigating –
biases in their perceptions of package and portion sizes is imperative. This chapter discusses five
biases in consumers’ size perceptions: underestimation, dimensionality, directionality, labels,
and affect. We explore the causes of these biases, outline their implications for consumption
decisions, and offer tactics to mitigate these biases and encourage healthier consumption choices.
Unresolved theoretical and practical issues are outlined, as are potential avenues for future
research.
Keywords: Size perception; Estimation; Packaging; Portion Size; Food

3
Drivers, Consequences, and Remedies of Biased Size Perceptions in Marketing
The size of food and beverage portions and packaging has increased significantly in recent
years: by over 60% for salty snacks and by 52% for sodas, for example (Nestle, 2003; Rolls,
Morris, & Roe, 2002; Nielsen & Popkin, 2003). The supersizing trend has been identified as one
of the key drivers of the obesity epidemic and related health concerns (Ledikwe, Ello-Martin, &
Rolls, 2005; Young & Nestle, 2003). Partly in response to these concerns, and partly out of cost
considerations, some marketers have reduced product sizes. Their initiatives have been
successful in some cases, but have backfired in others. For example, TGI Friday’s downsized
“Right Portion, Right Price” menu garnered a positive consumer response, whereas Ruby
Tuesday’s downsized portions led to a sales dip and were discontinued just five months after
introduction (Deutsch 2007; Horovitz, 2007; Martin, 2007). In some instances, marketers have
been accused of deceiving consumers by charging the same price for a smaller size (Grynbaum,
2014).
In view of these developments, it is critical to understand how consumers perceive the sizes
of packages and portions, and how those perceptions shape their consumption decisions. Studies
in health, nutrition science, psychology, and marketing have established that quantity judgments
drive a host of consumption decisions including consumption quantity, product choice, and
willingness to pay (Chandon & Ordabayeva, 2009; Chandon & Wansink, 2012; Raghubir &
Krishna, 1999; Wansink & Van Ittersum, 2003; see Wansink & Chandon, 2014 for a review).
Studies have revealed that consumers often underestimate the importance of quantity judgments
in their food decisions and overestimate that of food quality judgments. A large proportion of
consumers think that monitoring the type rather than the amount of food consumed is more

4
important to lose weight (Collins, 1996; Rozin, Ashmore, & Markwith, 1996). For example, they
believe that weight gain is more likely to occur after consuming a small portion of unhealthy
food (e.g., a mini-Snickers® bar containing 47 calories) than a large portion of healthy food
(e.g., a cup of low-fat cottage cheese, three carrots and three pears totaling 569 calories) (Oakes,
2005).
Yet, a growing body of evidence reports that size perceptions are the primary driver of
portion size decisions, and that biases which hinder the accuracy of consumers’ size perceptions
can lead to unhealthy choices. In this chapter we outline five systematic biases in consumers’
perceptions of package and portion size. We discuss their implications for consumption decisions
and offer effective remedies. We conclude with a discussion of important gaps in the literature
and fruitful avenues for future research.
BIASES IN SIZE PERCEPTION
Despite the increased availability of size information on food packaging and restaurant
menus, upwards of 70% of consumers do not check this information to make quantity judgments
(Lennard, Mitchell, et al., 2001). Various explanations for this have been advanced. Some people
find size information confusing, especially when it contains non-metric information
(Viswanathan, Rosa, & Harris, 2005). Many rely on the packaging as a cue for how much food is
contained inside, using their visual impressions instead of actual size information to make
decisions (Chandon & Wansink, 2012; Wansink & Chandon, 2014).
This presents a significant challenge because research indicates that visual perceptions of
size, and changes in size, are inaccurate. We identify five biases related to the underestimation of

5
package and portion size changes, the dimensionality of size changes, the directionality of size
changes, labeling effects, and affective influences, which hinder the accuracy of size estimations
as well as healthy consumption choices. We describe each of these biases, discuss their
implications for consumption decisions, and offer potential remedies.
Underestimation
Bias. According to the psychophysics literature, perceptions of object size follow a power
function of actual size (Stevens, 1986), a relationship captured by the formula below:
ESTSIZE = a × ACTSIZE b,
where ESTSIZE represents the estimated size of the object, ACTSIZE represents its actual size, a
is a constant term, and b is the power exponent that represents the elasticity (or sensitivity) of
perceived size to actual size. Studies have reported that for physical objects, the power exponent
tends to be lower than 1, indicating that perceived object size grows more slowly than actual
size, implying that the underestimation of object size and size change is more pronounced for
large objects than small ones.
Marketing studies have corroborated these findings for packages and portions, with the
reported power exponent ranging between .5 and .8, suggesting that the changes in package and
portion size are also significantly underestimated, although more accurate estimations (a power
exponent of 1) emerge for one-dimensional objects such as lines (Krishna 2007, 2012). In other
words, consumers underestimate size and size changes in packages and portions, more for large
packages and portions than for small ones.
6
Implications. The underestimation bias has significant implications for consumption
decisions. Consumers’ growing insensitivity to actual size as packages and portions become
larger leads to greater food intake. In short, they eat more because they do not realize just how
much supersized packages and portions actually contain.
Chandon and Wansink (2007a) documented this effect in a series of studies in which
participants’ underestimation of food portions was linked to the size chosen or consumed. In one
study, when patrons of US fast food restaurants in three cities were asked to estimate the calorie
content of meals that they had ordered, diners significantly underestimated the size of their
meals: meals on average contained 744 calories but were believed to contain 544 calories, a 27%
underestimation. The bias was greater for large meals: large meals containing on average 1144
calories were believed to contain 687 calories, a 40% underestimation; small meals containing on
average 484 calories were believed to contain 433 calories, an 11% shortfall. This bias was
found to persist regardless of whether participants were lean or overweight, whether they had a
limited or an extensive interest in nutrition, for foods of different shapes, and whether food was
about to be consumed, already consumed, or stored in the pantry (Chandon & Wansink, 2006a,
2007a; Krider, Raghubir, & Krishna, 2001).
Remedies. Since the underestimation bias occurs regardless of consumers’ weight and
nutrition expertise, even professional dieticians are susceptible to the bias (Chandon & Wansink,
2007a) which would suggest that visual biases are hardwired (Raghubir 2007). Indeed it has been
shown that the underestimation bias cannot be eliminated through manipulations of consumer
attention, motivation, or information. Specifically, studies have shown that providing
information about the underestimation bias does not reduce that bias (Chandon & Wansink,
2007a; Ordabayeva & Chandon, 2013). Neither does boosting consumers’ attention to the

7
estimated object (Folkes & Matta, 2004), nor boosting their intrinsic or extrinsic motivation to be
accurate – by providing a financial reward (Ordabayeva & Chandon, 2013; Raghubir, 2007).
Conversely, recasting the task from estimating an entire meal to estimating its individual
components (e.g., estimating the main course, the side, and the drink, separately) can effectively
reduce the underestimation bias and improve the accuracy of size estimates. As shown in Figure
1, the power exponent describing meal size estimations improves from .38 in the control
condition (in which participants estimated the size of the whole meal) to .83 in the piecemeal
estimation condition (in which they estimated the size of individual meal components prior to
estimating the size of the whole meal), regardless of participants’ weight.
--- Insert Figure 1 about here ---
Since piecemeal estimation – which requires individuals to estimate components that are
individually smaller than the whole meal – produces less underestimation than the meal as a
whole, it also makes consumers less likely to choose large meals, and more likely to make
healthier consumption decisions (Chandon & Wansink, 2007a).
Furthermore, there is evidence that improving the accuracy of consumers’ size estimations
boosts eating enjoyment, which suggests that large portions accelerate sensory satiation and
reduce sensory pleasure (Cornil & Chandon, 2015; Garbinsky, Morewedge, & Shiv, 2014).
Dimensionality
Bias. Perceptions of size are influenced by the shape of the size change. Products can grow or
shrink along a single spatial dimension (e.g., length), along two dimensions (e.g., length and
width or base), or three dimensions (height, width and length). Dimensions may change in the

8
same direction (all dimensions increase simultaneously) or in opposite directions (some
dimensions increase while others decrease – e.g., elongation reduces the base while increasing
length (Raghubir & Krishna, 1999; Wansink & Van Ittersum, 2003). Hence, the accuracy of size
perception depends on the number of changing dimensions as well as the direction in which
those dimensions change.
Psychophysics studies have reported that estimation accuracy is higher for one-dimensional
objects (e.g., lines: power exponent b = 1) than for two-dimensional objects (e.g., squares: b = .7
to .8) or three-dimensional objects (e.g., cubes: b = .6) (see Krishna 2007 for a review).
Similarly, the accuracy of size change estimation is greater when an object changes in a single
dimension (e.g., when a box of crackers grows in length alone) than in two dimensions (e.g.,
when it grows in length and width) or three dimensions (e.g., when it grows in height, width and
length) (Chandon & Ordabayeva, 2009). Estimation accuracy declines even further when the
dimensions of a package change in opposite directions (e.g., when the base shrinks but the length
increases) (Ordabayeva & Chandon, 2013). In a study by Chandon and Ordabayeva (2009), six
candles were perceived to be smaller when they grew in height and diameter from one size to the
next (b = .63) than when they grew in height alone (b = .87), as illustrated in Figure 2.
--- Insert Figure 2 about here ---
The dimensionality bias occurs because estimating volume change requires individuals to
integrate information across three product dimensions – in multiplicative fashion – hence the
estimation task is increasingly complex. Indeed studies have shown that consumers’ size
perceptions are consistent with an additive (rather than multiplicative) model of dimension
integration. Simply put, people tend to add rather than multiply the changes in the individual
dimensions to arrive at their estimate of total volume change (Ordabayeva & Chandon, 2013).

9
For example, a box that proportionately grows by 26% in height, width and length is judged to
have grown by 78% (= 26% + 26% + 26%), instead of 100% (1.26 × 1.26 × 1.26 = 2), in total
volume.
Implications. The dimensionality bias has been found to spill over from consumers’
perceptions of product size to their expectations of product price, product choice, and
consumption volume (Chandon and Ordabayeva, 2009). Consumers expect to pay less for
supersized products (e.g., in our studies they demanded up to 57% larger discounts) when the
package size increases in three (vs. one) dimensions. Interestingly, this tendency mirrors the
lower prices that marketers charge for products supersized along all three (vs. one) dimensions
(e.g., for shaving cream supersized in height and diameter vs. height only). Consumers are (up
to 32%) less likely to choose supersized products when the supersizing occurs in three (vs. one)
dimensions. In another setting – serving drinks – people are more likely to over-serve beverages
(by up to 19%) when they use conical glasses in which liquid volume increases in height and
diameter than when it increases only in height.
Remedies. Because the dimensionality bias is caused by consumers’ inability to
multiplicatively integrate the changes in three dimensions, the bias is reduced when the change
in product volume is linearized from multiple dimensions to just one. Hence, if marketers wish to
increase the appeal of supersized products, boost willingness-to-pay for such products and lower
the risk of overconsumption, they should supersize their products in just one dimension.
Conversely, to boost the appeal of downsized products they should downsize their products in
multiple dimensions since such changes are less likely to be detected. In one study, consumers
were 21% more likely to choose a downsized soda when the bottle shrank in height and diameter
(vs. just height) (Chandon & Ordabayeva, 2009).

10
In an extreme case, product downsizing can go completely undetected if it is implemented
through package elongation when the dimensions change in opposite directions such that the
magnitude of the increase in one dimension perfectly counter-balances that of the decrease in the
other two dimensions. This principle was verified in a study where participants were shown four
candles that shrank by 8% from one size to the next. The downsizing occurred either in height
alone (1D downsizing condition), or through elongation (elongated downsizing condition) such
that the candle’s volume shrank as it became more elongated, with the increase in height
perfectly counter-balanced by the decrease in base. While participants perceived a significant
reduction in volume in the 1D condition (a candle that was 24% smaller than the reference was
perceived to be 20% smaller), they missed the downsizing in the elongated downsizing condition
(the same candle was believed to be just 2% smaller than the reference).
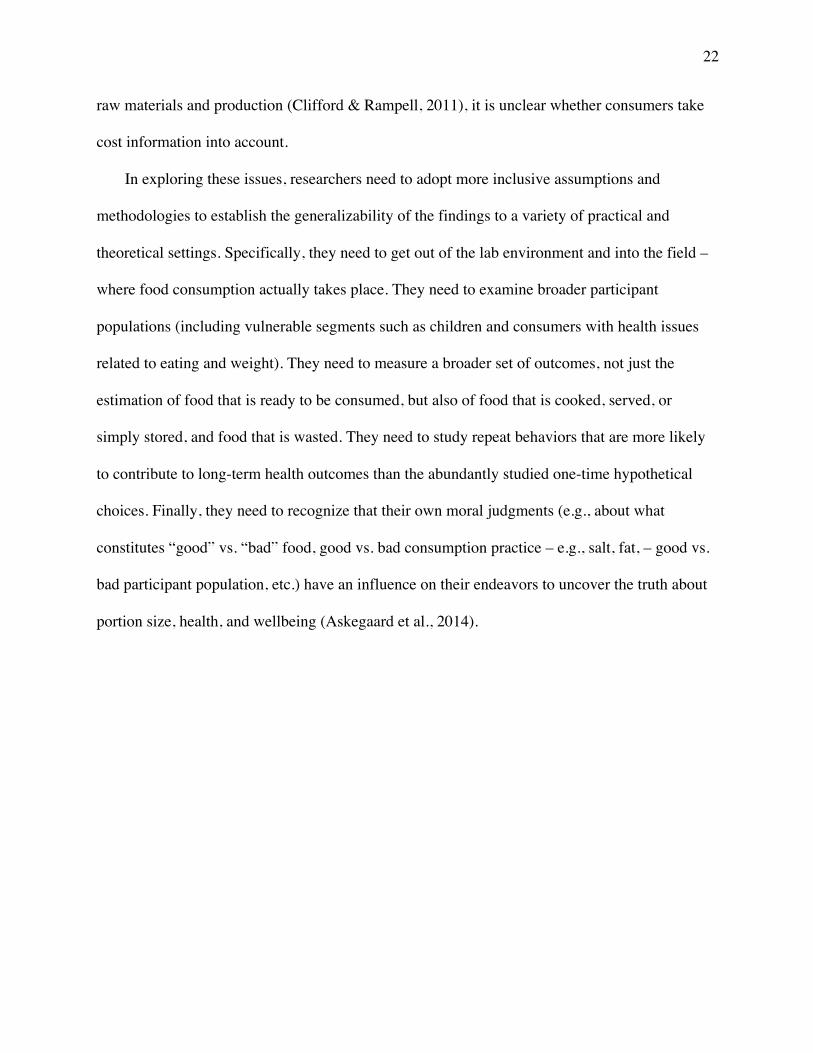
In a different study, the package of an established food brand was downsized through a 1D
change by shrinking its height, or through elongation in height (shrinking the base and increasing
the height) or through elongation in width (shrinking the height and increasing the width). As
shown in Table 1, whereas the appeal of the package compared to the original significantly
dropped when it was downsized in 1D, it did not drop when the package was downsized through
elongation (Ordabayeva & Chandon, 2013).
--- Insert Table 1 about here ---
Another tactic to mitigate the dimensionality bias would be to allow consumers to use
additional senses other than vision, such as touch/feel, to evaluate portion size. Allowing
participants to weigh products by hand, in addition to inspecting products visually, has been
found to minimize the dimensionality bias (Ordabayeva & Chandon, 2013).
11
A final strategy to counteract the dimensionality bias may be to use transparent packages that
make it easier for consumers to see the quantity contained in the package (Deng & Srinivasan,
2013). However, the desirability of transparent packaging depends on the type of product: it may
be an advantage to monitor healthy products but could backfire if unhealthy products appear to
be more tempting when the package is transparent (rather than opaque).
Directionality
Bias. The accuracy of size perceptions depends on the direction of the size change:
consumers are more sensitive to quantity decreases than increases. Whereas they significantly
underestimate quantity increases, they are more accurate (even, in certain cases, perfectly
accurate) when estimating quantity decreases.
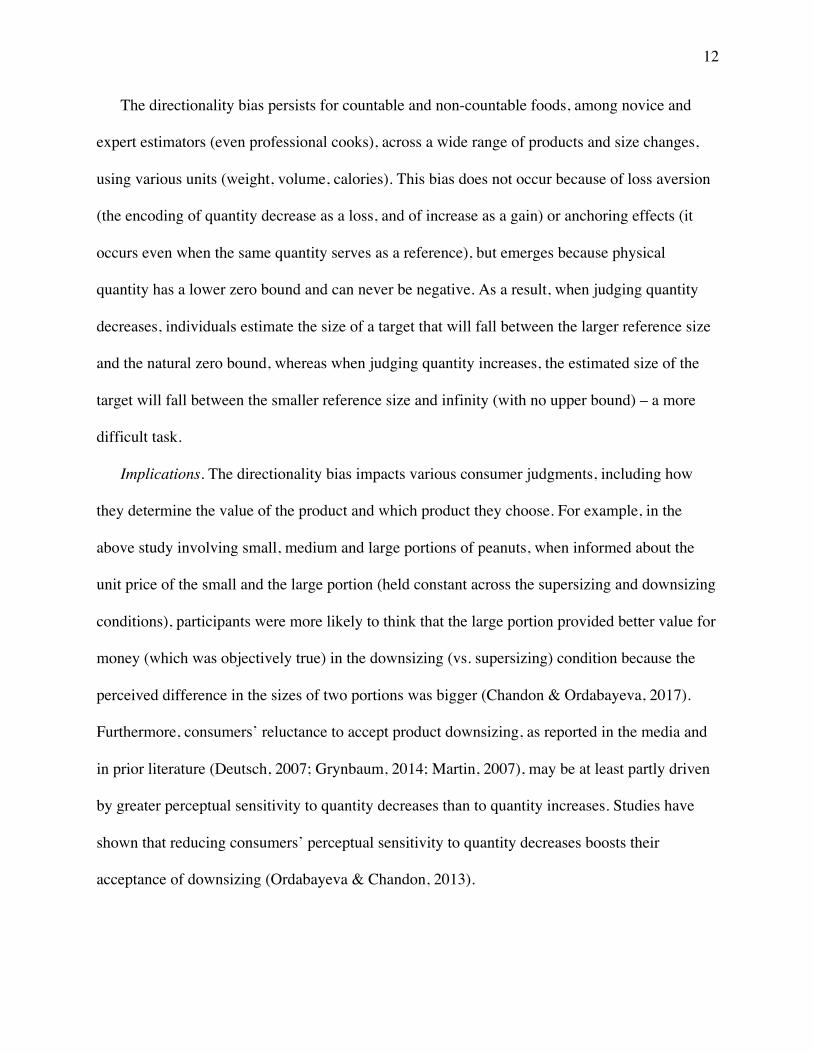
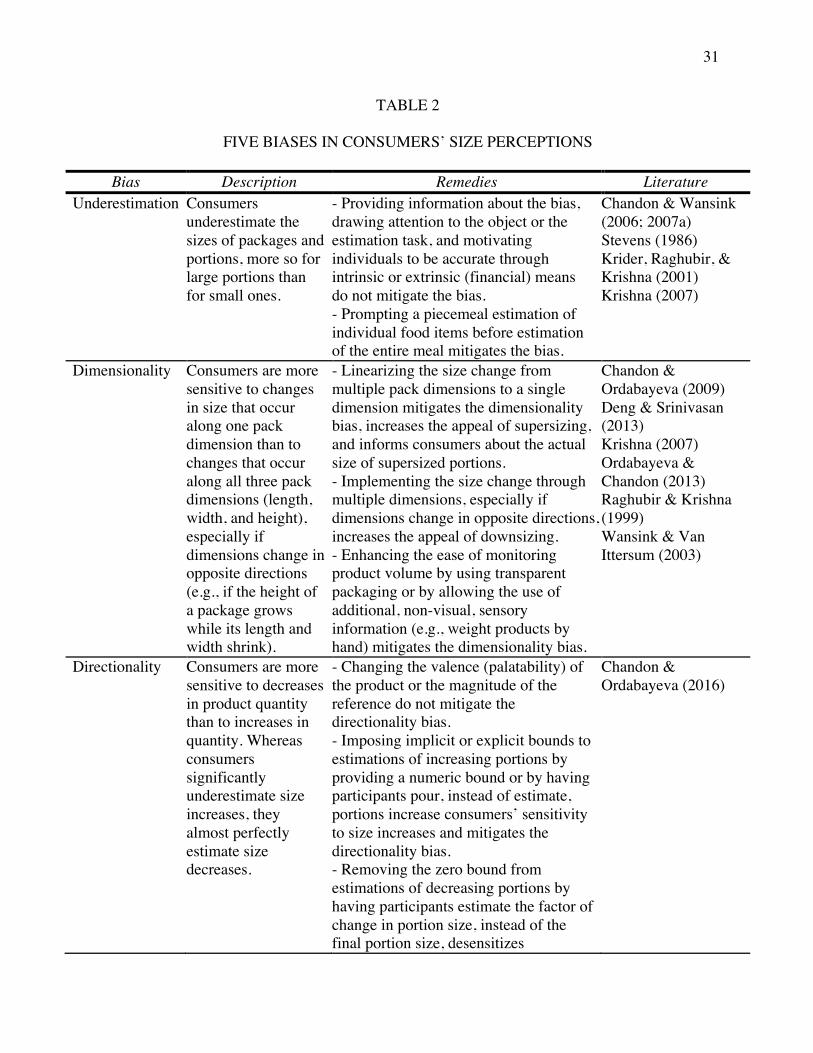
To illustrate: In one study, we prepared three plates with a small (S), medium (M), and large
(L) portion of nuts (Chandon & Ordabayeva, 2017). In the increasing quantity condition,
participants were told the number of nuts in the small portion and asked to estimate the number
of nuts in the medium and large portions. In the decreasing condition, they knew the number of
nuts in the large portion and had to estimate the number of nuts in the medium and small
portions. As shown in Figure 3, portion sizes were strongly underestimated in the supersizing
condition: while portion L (637 nuts) was actually 12.25 times larger than portion S (52 nuts), it
was perceived to be only 4.9 times larger (273 nuts; the corresponding beta was .68). Estimations
were more accurate in the downsizing condition: portion S was perceived to be 7.0 times smaller
than portion L (74 nuts; b = .86).
--- Insert Figure 3 about here ---
12
The directionality bias persists for countable and non-countable foods, among novice and
expert estimators (even professional cooks), across a wide range of products and size changes,
using various units (weight, volume, calories). This bias does not occur because of loss aversion
(the encoding of quantity decrease as a loss, and of increase as a gain) or anchoring effects (it
occurs even when the same quantity serves as a reference), but emerges because physical
quantity has a lower zero bound and can never be negative. As a result, when judging quantity
decreases, individuals estimate the size of a target that will fall between the larger reference size
and the natural zero bound, whereas when judging quantity increases, the estimated size of the
target will fall between the smaller reference size and infinity (with no upper bound) – a more
difficult task.
Implications. The directionality bias impacts various consumer judgments, including how
they determine the value of the product and which product they choose. For example, in the
above study involving small, medium and large portions of peanuts, when informed about the
unit price of the small and the large portion (held constant across the supersizing and downsizing
conditions), participants were more likely to think that the large portion provided better value for
money (which was objectively true) in the downsizing (vs. supersizing) condition because the
perceived difference in the sizes of two portions was bigger (Chandon & Ordabayeva, 2017).
Furthermore, consumers’ reluctance to accept product downsizing, as reported in the media and
in prior literature (Deutsch, 2007; Grynbaum, 2014; Martin, 2007), may be at least partly driven
by greater perceptual sensitivity to quantity decreases than to quantity increases. Studies have
shown that reducing consumers’ perceptual sensitivity to quantity decreases boosts their
acceptance of downsizing (Ordabayeva & Chandon, 2013).
13
Remedies. The psychological source of the directionality bias (individuals’ reliance on
extrapolation to estimate size decreases vs. interpolation to estimate size increase) provides
valuable information about whether strategies to eliminate the bias will succeed. Since the bias is
not driven by loss aversion (Kahneman & Tversky, 1979), strategies that change the valence or
appeal of the product (and hence change the natural encoding of size increases as gains, and of
decreases as losses) will not be effective. In contrast, strategies that change the presence of
bounds (by either providing an upper bound on estimations of increase, or by taking away the
lower zero bound from estimations of size decreases) should effectively reduce the asymmetry
between estimations of supersizing and downsizing.
To test this notion, in one study participants were asked to judge the size increase or decrease
in portions of jellybeans and iced tea (Chandon & Ordabayeva, 2017). To manipulate product
valence, participants tasted sweet (positive valence) or salty (negative valence) iced tea, and
jellybeans of regular (positive valence) or novelty flavors such as pencil shavings, vomit and
baby diapers (negative valence). To manipulate the presence of bounds, participants either had to
estimate the increase or decrease in portions presented on the table (which involved a natural
zero bound for size decreases and no tangible upper bound for size increases), or to pour the
same portions into or out of a glass (which highlighted the lower bound for size decreases – i.e.
the quantity contained in the glass could not go below the bottom of the glass; and the upper
bound for increases – i.e. quantity could not exceed the top of the glass). The results showed that
the directionality bias emerged regardless of the valence of the products, but it disappeared when
estimation bounds were implicitly provided in the pouring task. Specifically, participants were
less sensitive to volume changes when visually estimating increasing portions (than decreasing
portions) but they were just as sensitive to volume changes when pouring increasing portions as
14
when pouring decreasing portions. The role of estimation bounds was corroborated in a follow-
up study, which provided an explicit numeric bound for estimates of increasing sizes.
Labels
Bias. Consumers’ perceptions of package and portion size are further biased by labels
describing food quality and quantity in advertising and packaging. Labels that describe package
and portion size as “small”, “medium”, and “large” significantly bias consumers’ expectations of
how much food is contained inside. Aydınoğlu and Krishna (2011) found that consumers
expected portions to be smaller when they were labeled “small” rather than “medium” or “large”
even if the amount contained in these portions was equal or reversed. This finding is significant
because labels are commonly used to set expectations of portion size, and in the absence of strict
standards they vary significantly across outlets (Young & Nestle, 1998). For example, Regal
Cinemas’ “small” popcorn (800 calories) is larger than AMC Theatres’ “medium” popcorn (680
calories); Burger King’s “small” fries (116 grams) is almost identical to the “medium” fries sold
at McDonald’s (117 grams).
Labels that describe food quality (e.g., describe the ingredients) influence expectations about
food quantity. Generally, labels that highlight a food’s healthiness lower perceptions of its
calorie content. For example, when food is labeled “low-fat”, consumers will think it has fewer
calories (Wansink & Chandon, 2006b). Similarly, consumers expect meals that combine foods
framed as “healthy” and “unhealthy” to contain fewer calories than meals consisting of
“unhealthy” items, even if their actual calorie content is identical or reversed. In one study
Chernev and Gal (2010) showed participants a meal consisting of (i) a hamburger or (ii) a

15
hamburger and broccoli. Participants perceived the meal to have fewer calories when it had
broccoli on the side (665 calories) than when it did not (761 calories), even though the actual
caloric content of the combined meal was higher.
Similar effects emerge when food outlets and restaurant chains emphasize healthiness in
their positioning and advertising. For example, studies have shown that meals at McDonald’s (a
chain that has an unhealthy image) are expected to be larger (more caloric) than comparable
meals at Subway (a chain that tries to position and advertise itself as healthy). In one study, a
1000-calorie meal was believed to contain 744 calories if served at McDonald’s, but 585 calories
if served at Subway (Chandon & Wansink, 2007b).
Beyond quantity and quality labels, the mere design of a package label can change
perceptions of package size. Deng and Kahn (2009) found that a package was perceived to be
larger if its label featured a product image at the bottom, on the right or bottom-right (vs. the top,
on the left, or top-left). This bias is driven by consumers’ intuitive associations between the
physical position of a product and its weight.
Implications. Labeling biases have significant implications for consumption decisions.
Labels that reduce consumers’ expectations of size lead to greater consumption. Aydınoğlu and
Krishna (2011) found that labelling a food portion “small” led to greater consumption than
portions labelled “medium” or “large”, as individuals believe that they are consuming less.
Similarly, a “low-fat” label boosts consumption because it reduces perceptions of portion size as
well as consumption guilt. As a result, hedonic foods and overweight consumers are more
susceptible to the effects of “low-fat” labels because they are more sensitive to manipulations
that change consumption guilt (Wansink & Chandon, 2006b). Healthy restaurant positioning,
too, leads individuals to consume more. Participants on average consumed 1011 calories using a

16
coupon from Subway vs. 648 calories using a coupon from McDonald’s, while believing that
they had consumed less (i.e. 487 calories at Subway vs. 600 calories at McDonald’s) (Chandon
& Wansink, 2007b). Figure 4 summarizes this result.
--- Insert Figure 4 about here ---
Remedies. A number of strategies can be used to counteract labeling biases. Clearly,
reinforcing consumers’ categorization of foods into healthy and unhealthy types exacerbates
labeling effects (Levin & Gaeth, 1988; Raghunathan, Naylor, & Hoyer, 2006). For example, the
averaging bias (the belief that combined meals consisting of healthy and unhealthy components
have fewer calories than meals consisting of purely unhealthy components) becomes stronger if
participants are asked to assess the healthiness of individual meal components prior to estimating
the meal’s calorie content (Chernev & Gal, 2010). Instead, strategies that highlight the quantity,
rather than the quality, of meals, can be effective. For example, having participants assess the
size of individual meal components prior to estimating meal size reduces the averaging bias
(Chernev & Gal, 2010).
Similarly, providing information about the number of servings in a food package or portion
can curb the detrimental effect of “low-fat” labels on consumption. However, this strategy only
works for normal-weight individuals who consume “low-fat” foods mainly because they appear
to contain fewer calories; it does not work for overweight individuals who consume “low-fat”
foods mainly because those reduce consumption guilt (Wansink & Chandon, 2006b).
Strategies that downplay the link between labels and food quality can further reduce labeling
biases. For example, when consumers were asked to think how restaurants’ health claims may
not translate to the healthiness of individual items on the menu, the effect of those claims on
consumption was curbed (Chandon & Wansink, 2007b).

17
Finally, the bias arising from product image positioning (heavy position = bottom-right vs.
light position = top-left) on front-of-pack labels can be curbed if the product is placed next to
other products with similar label design/positioning. In other words, a product with a its image
positioned in the bottom-left (top-right) of its label is perceived to be less heavy (light) if it is
surrounded by other products on the shelf that display the product image in the bottom-left (top-
right) of their labels (Deng & Kahn, 2009).
Affect
Bias. Consumers’ emotional reaction to food can bias their perceptions of size. A number of
classic studies have documented how objects appear to be bigger to those who desire them than
to those who do not. Cigarettes look bigger to smokers, coins look bigger to the powerless, water
looks more proximate to thirsty people, and a muffin looks bigger to restrained eaters (Balcetis &
Dunning, 2010; Brendl, Markman, & Messner, 2003; Dubois, Rucker, & Galisnky 2010; van
Koningsbruggen, Stroebe, & Aarts, 2011). However, new evidence suggests that the biased
impression of desired objects may stem not from just desire alone, but from the combination of
desiring an object and perceiving it as dangerous. In the context of food, consumers are more
sensitive to package and portion size if they desire the food and perceive it to be a potential risk
to their health (Cornil, Ordabayeva, Kaiser, Weber, & Chandon, 2014). This effect likely occurs
because the tension between desire and perceived risk boosts physiological arousal and changes
the way individuals visually process food stimuli, with the result that emotional conflict leads
consumers to be more sensitive – and hence more accurate when estimating package and portion
size. This effect has been documented among adults and also among children, whose estimations

18
of increasing portions of chocolate were more accurate when their desire for chocolate conflicted
with the realization that their parents would scold them for eating it.
Implications. Emotional conflict may have beneficial outcomes for consumption regulation.
Since conflicting emotions towards a food increases sensitivity to its size, then consumers should
make more informed consumption decisions and be less tempted to overeat. Conversely, if
conflicting emotions about unhealthy food are reduced, then vigilance about portion sizes will
drop and consumers will eat more. Accordingly, studies found that “low-fat” labels on unhealthy
foods increased consumption, particularly among overweight individuals, to a large extent
because they reduced the emotional conflict or guilt individuals felt about eating them (Wansink
& Chandon, 2006b).
Remedies. Since the conflict between desire and the perceived health risk sensitizes
consumers to portion size, strategies that heighten this emotion may help consumers regulate
their food intake. Cornil and colleagues (2014), for example, proposed a strategy that
simultaneously heightened consumers’ desire for hedonic food and highlighted the food’s
unhealthy attributes. In one study, researchers had participants evaluate portions of gummy
chews. To manipulate the health risk, the chews were described as “gummy candies” (unhealthy)
or as “nutrition chews with vitamins” (healthy). To manipulate desire, researchers asked
participants to sample the candies prior to estimating their portion size (prior research suggests
that sampling a small amount of a particular food boosts the desire for it, Wadhwa, Shiv, &
Nowlis, 2008). The results revealed that size perceptions were the most accurate when
consumers both perceived the chews as unhealthy and desired them following initial sampling.
This implies that to improve the accuracy of size perceptions, manipulations of desire and
perceived risk need to be implemented at the same time, as emotional conflict only occurs when
19
both are heightened. Interestingly, a similar effect occurred in a different study among
individuals who felt inherently conflicted towards hedonic foods (restrained eaters who felt
conflicted towards potato chips) (Papies, Stroebe, & Aarts, 2008; Scott, Nowlis, Mandel, &
Morales, 2008).
THE ROAD AHEAD
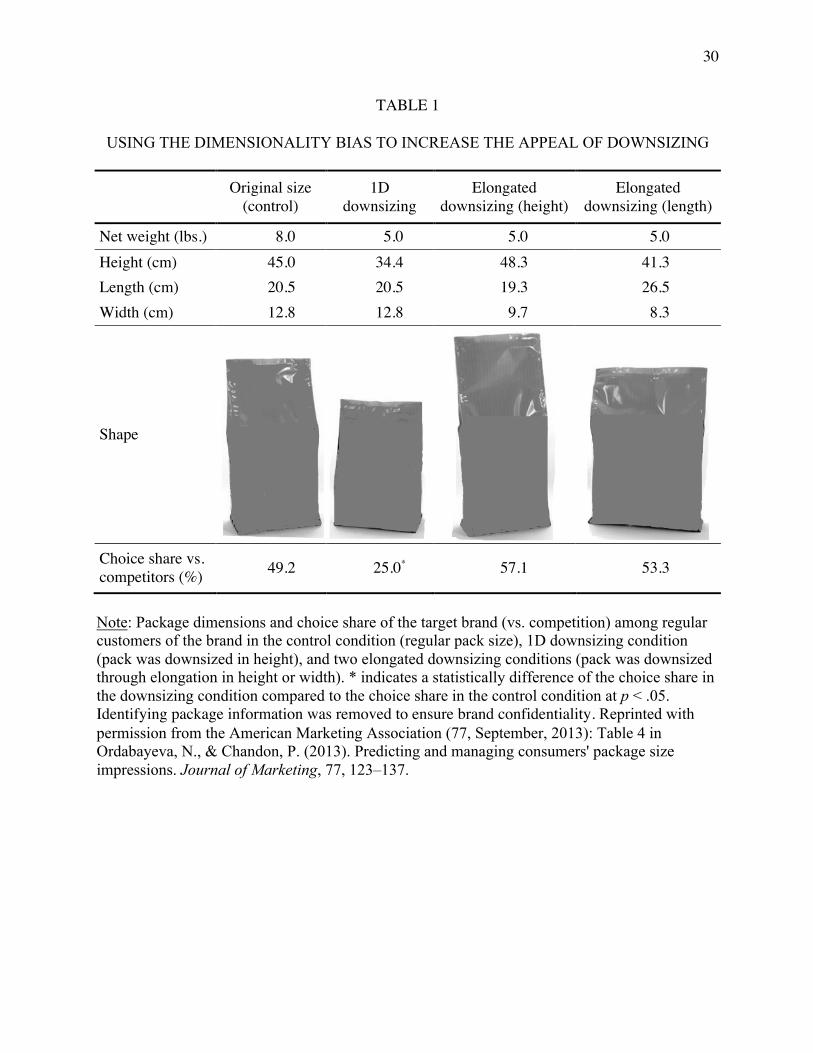
In this chapter we have outlined five biases that shape consumers’ perceptions of size and
consequent consumption decisions, and have proposed a number of strategies to mitigate their
detrimental effects. Table 2 outlines the basic principles discussed in the chapter. Although the
research reviewed in this chapter provides a solid foundation for understanding consumers’ size
perceptions, many theoretical and practical issues are still unresolved.
---Insert Table 2 about here ---
From a theoretical perspective, existing studies have focused on either cognitive or affective
processes in size perception. For example, some focus on the cognitive strategies (additive
integration of package dimensions, bounded vs. unbounded estimation tactics) that consumers
use to estimate package and portion size; others on the role of emotions (desire, fear, conflict).
Yet considerations of how cognition and affect may interact in shaping consumers’ size
perceptions have been largely overlooked, opening up an avenue for future research.
Prior work has shown that mood can change the cognitive strategies that consumers use to
process information (Pham, 2007). Some studies have suggested that positive mood induces
people to use heuristic processing, while negative mood may induce more systematic processing
(Keller, Lipkus, & Rimer, 2002). This raises the question of whether mood can influence the
20
type of cognitive strategies that consumers use to estimate size. Can positive mood lead people to
use heuristic strategies (e.g., additive rules) and negative mood lead people to use more
systematic strategies (e.g., more integrative, multiplicative rules) to estimate size?
Furthermore, little is known about the role of multi-sensory experience and pleasure in
consumers’ perceptions of portion size and consumption choices. The existing evidence suggests
that small portions are associated with higher sensory pleasure (Cornil & Chandon, 2016;
Morewedge, Huh, & Vosgerau, 2010) but it is unclear whether highlighting sensory pleasure can
change perceptions of portion size. If this is indeed the case, there is an opportunity for a win-
win solution to reduce consumers’ food intake while boosting their consumption pleasure. In
pursuing this quest, it would be interesting to find strategies that can effectively enhance sensory
pleasure. One option could be to promote the use of rituals (such as one’s closing eyes before
eating) that have been linked to the heightened pleasure of consuming certain foods (Vohs,
Wang, Gino, & Norton, 2013).
In examining the role of multi-sensory experience, it is important to integrate the roles of
non-visual senses (e.g., sound, touch, smell) in driving size perceptions. Research has found that
consumers associate the texture of food with its calorie content: soft foods are believed to have
more calories (Biswas, Szocs, Krishna, & Lehmann, 2014). It would be interesting to understand
how all five senses (and non-size-related visual product attributes such as color), and their
interactions, influence consumers’ perceptions of package and portion size, and how these
sensory factors drive consumption decisions.
Similarly, scholars should pay more attention to the role of environmental factors (in
contrast to the product-specific factors that have been researched in the past) that have previously
been linked to consumption choices. One study, for example, showed how the contrast between

21
the food and the plate on which it was served influenced perceptions of portion size: portions
appeared to be smaller when served on big plates rather than small plates (Van Ittersum &
Wansink, 2012). Another area of potential interest would be to explore whether other
environmental factors such as background music and store atmospherics can change consumers’
perceptions of the size of packages and portions when shopping.
From a practical perspective, it is essential for future studies to examine potential de-biasing
strategies that can be smoothly integrated in stores and restaurants. For example, does
highlighting the product’s unit price improve the accuracy of consumers’ perceptions of its size?
A significant association between unit price and package size has been documented: large
packages are assumed to have lower unit price (Nason & Della Bitta, 1983; Wansink, 1996),
hence it is possible that highlighting the higher-than-expected unit price of a supersized package
may sensitize consumers to its size. However, the fact that many shoppers do not pay attention to
unit prices displayed in stores, and unit price information is sometimes hard to integrate with
quantity information, presents challenges that need to be overcome (Vanhuele & Drèze, 2002). A
study by Mohan, Chandon, and Riis (2015) found that consumers thought that a 50% increase in
volume for free provided similar value to a 50% reduction in price (even though it is equivalent
to a 33% (vs. 50%) drop in unit price). Clearly there is an opportunity and a need for new
research on strategies that ease the interpretation and integration of unit price information in
consumers’ size judgments and decisions.
Likewise, much remains unknown about how consumers integrate information about
product costs in their assessments of product price and size. While recent downsizing attempts in
the marketplace have largely been motivated by marketers’ desire to absorb rises in the cost of
22
raw materials and production (Clifford & Rampell, 2011), it is unclear whether consumers take
cost information into account.
In exploring these issues, researchers need to adopt more inclusive assumptions and
methodologies to establish the generalizability of the findings to a variety of practical and
theoretical settings. Specifically, they need to get out of the lab environment and into the field –
where food consumption actually takes place. They need to examine broader participant
populations (including vulnerable segments such as children and consumers with health issues
related to eating and weight). They need to measure a broader set of outcomes, not just the
estimation of food that is ready to be consumed, but also of food that is cooked, served, or
simply stored, and food that is wasted. They need to study repeat behaviors that are more likely
to contribute to long-term health outcomes than the abundantly studied one-time hypothetical
choices. Finally, they need to recognize that their own moral judgments (e.g., about what
constitutes “good” vs. “bad” food, good vs. bad consumption practice – e.g., salt, fat, – good vs.
bad participant population, etc.) have an influence on their endeavors to uncover the truth about
portion size, health, and wellbeing (Askegaard et al., 2014).

23
REFERENCES
Askegaard, S., Ordabayeva, N., Chandon, P., Cheung, T., Chytkova, Z., Cornil, Y., Corus, C.,
Edell Britton, J. A., Junghans, A. F., Kristensen, D. B., Mathras, D., Mikkonen, I., Miller, E.
G., Sayarh, N., & Werle, C. (2014). Moralities in food and health research. Journal of
Marketing Management, 30 (17-18), 1800-1832.
Aydinoglu, N., & Krishna, A. (2011). Guiltless gluttony: The asymmetric effect of size labels on
size perceptions and consumption. Journal of Consumer Research, 37 (6), 1095-1112.
Balcetis, E., & Dunning, D. (2010). Wishful seeing: More desired objects are seen as closer.
Psychological Science, 21, 147–152.
Biswas, D., Szocs, C., Krishna, A., & Lehmann, D. R. (2014). Something to chew on: The
effects of oral haptics on mastication, orosensory perception, and calorie estimation. Journal
of Consumer Research, 41 (2), 261-73.
Brendl, C. M., Markman, A. B., & Messner, C. (2003). The devaluation effect: Activating a need
devalues unrelated objects. Journal of Consumer Research, 29, 463–473.
Chandon, P., & Ordabayeva, N. (2009). Supersize in one dimension, downsize in three
dimensions: Effects of spatial dimensionality on size perceptions and preferences. Journal of
Marketing Research, 46 (6), 725–738.
——— (2017). The accuracy of less: Natural bounds explain why quantity decreases are
estimated more accurately than quantity increases. Journal of Experimental Psychology:
General, 146 (2), 250-268.
Chandon, P., & Wansink, B. (2006). How biased household inventory estimates distort shopping
and storage decisions. Journal of Marketing, 70 (October), 118–35.
——— (2007a). Is obesity caused by calorie underestimation? A psychophysical model of meal

24
size estimation. Journal of Marketing Research, 44 (February), 84–99.
——— (2007b). The biasing health halos of fast food restaurant health claims: Lower calorie
estimates and higher side-dish consumption intentions. Journal of Consumer Research, 34
(October), 301–14.
——— (2012). Does food marketing need to make us fat? A review and solutions. Nutrition
Reviews, 70, 571-593.
Chernev, A., & Gal, D. (2010). Categorization effects in value judgments: Averaging bias in
evaluating combinations of vices and virtues. Journal of Marketing Research, 47 (4), 738–
747.
Clifford, S., & Rampell, C. (2011). Food inflation kept hidden in tinier bags. The New York
Times, March 28.
Collins, K. (1996). New Survey on Portion Size: Americans Still Cleaning Plates. Washington,
DC: American Institute for Cancer Research.
Cornil, Y., & Chandon, P. (2016). Pleasure as a substitute for size: How multisensory imagery
can make people happier with smaller food portions. Journal of Marketing Research,
October.
Cornil, Y. Ordabayeva, N., Kaiser, U., Weber, B., & Chandon, P. (2014). The acuity of vice:
Attitude ambivalence improves visual sensitivity to increasing Portion Sizes.” Journal of
Consumer Psychology, 24 (2), 177-87.
Deng, X., & Kahn, B. E. (2009). Is your product on the right side? The “location effect” on
perceived product heaviness and package evaluation. Journal of Marketing Research, 46 (6),
725-738.
Deng, X., & Srinivasan, R. (2013). When do transparent packages increase (or decrease) food

25
consumption. Journal of Marketing, 77 (4), 104-117.
Deutsch, C. H. (2007). Incredible shrinking packages. The New York Times, (May 12), (accessed
August 12, 2009). Available at http://www.nytimes.com/2007/05/12/business/12package.
html.
Dubois, D., Rucker, D. D., & Galinsky, A. D. (2010). The accentuation bias: money literally
looms larger (and sometimes smaller) to the powerless. Social Psychological and Personality
Science, 4, 199–205.
Folkes, V., & Matta, S. (2004). The effect of package shape on consumers’ judgments of product
volume: Attention as a mental contaminant. Journal of Consumer Research, 31 (2), 390-401.
Garbinsky, E. N., Morewedge, C. K., & Shiv, B. (2014). Interference of the end: Why recency
bias in memory determines when a food is consumed again. Psychological Science, 25, 1466-
1474.
Grynbaum, M. M. (2014). New York’s ban on big sodas is rejected by final court. The New York
Times, June 26.
Horovitz, B. (2007). Friday’s, Subway tailor meals for health-conscious. USA Today, March 1.
Kahneman, D., & Tversky, A. (1979). Prospect theory: An analysis of decision under risk.
Econometrica, 47 (March), 263–291.
Keller, P.A., Lipkus, I.M., & Rimer, B.K. (2002). Depressive realism and health risk accuracy:
the negative consequences of positive mood. Journal of Consumer Research, 29, 57-69.
Krider, R. E., Raghubir, P, & Krishna, A. (2001). Pizzas: Pi or square? Psychophysical biases in
area comparisons. Marketing Science, 20 (4), 405–425.
Krishna, A. (2007). Spatial perception research: An integrative review of length, area, volume,
and number perception. In M. Wedel & R. Pieters (Eds.) Visual Marketing: From Attention

26
to Action (167-93). Mahwah, NJ: Lawrence Erlbaum Associates.
——— (2012). An integrative review of sensory marketing: Engaging the senses to affect
perception, judgment and behavior. Journal of Consumer Psychology, 22 (3), 333–51.
Ledikwe, J. H., Ello-Martin, J., & Rolls, B. J. (2005). Modifying the food environment: Energy
density, food costs, and portion size. Journal of Nutrition, 135 (4), 905–909.
Lennard, D., Mitchell, V-W., McGoldrick, P., & Betts, E. (2001). Why consumers under-use
food quantity indicators. International Review of Retail, Distribution & Consumer Research,
11 (2), 177–99.
Levin, I. P., & Gaeth, G. J. (1988). How consumers are affected by the framing of attribute
information before and after consuming the product. Journal of Consumer Research, 15,
374-378.
Martin, A. (2007). Will diners still swallow this? The New York Times, March 25.
Mohan, B., Chandon, P., & Riis, J. (2015). Percentage cost discounts always beat percentage
benefit bonuses: Helping consumers evaluate nominally equivalent percentage changes.
Journal of Marketing Behavior, 1 (1), 75-107.
Morewedge, C. K., Huh, Y. E., & Vosgerau (2010). Thought for food: Imagined consumption
reduces actual consumption. Science, 303, 1530-1533.
Nason, R. W. & Della Bitta, A. J. (1983). The incidence and consumer perceptions of quality
surcharges. Journal of Retailing, 59 (2), 40–54.
Nestle, M. (2003). Increasing portion sizes in American diets: More calories, more obesity.
Journal of the American Dietetic Association, 103, 39–40.
Nielsen, S. J., & Popkin, B. M. (2003). Patterns and trends in food portion sizes, 1977-1998.
Journal of American Medical Association, 289 (4), 450–53.

27
Oakes M. E. Stereotypical thinking about foods and perceived capacity to promote weight gain.
Appetite, 44(3), 317-324.
Ordabayeva, N., & Chandon, P. (2013). Predicting and managing consumers' package size
impressions. Journal of Marketing, 77, 123–137.
Ordabayeva, N., & Chandon, P. (2016). In the eye of the beholder: Visual biases in package and
portion size perceptions. Appetite, 103, 450-457.
Papies, E. K., Stroebe, W., & Aarts, H. (2008). The allure of forbidden food: On the role of
attention in self-regulation. Journal of Experimental Social Psychology, 44, 1283–1292.
Pham, M. (2007). Emotion and rationality: A critical review and interpretation of empirical
evidence. Review of General Psychology, 11 (2), 155-178.
Raghubir, P. (2007). Are visual perception biases hard-wired? In Visual Marketing: From
Attention to Action. In M. Wedel & R. Pieters (Eds.) Visual Marketing: From Attention to
Action (143-66). Mahwah, NJ: Lawrence Erlbaum Associates.
Raghubir, P., & Kirshna, A. (1999). Vital dimensions in volume perception: Can the eye fool the
stomach? Journal of Marketing Research, 36, 313–326.
Raghunathan, R., Naylor, R. W., & Hoyer, W. D. (2006). The unhealthy = tasty intuition and its
effects on taste inferences, enjoyment, and choice of food products. Journal of Marketing,
70, 170–184.
Rolls B. J., Morris E. L., Roe L. S. (200). Portion size of food affects energy intake in normal-
weight and overweight men and women. American Journal of Clinical Nutrition, 76(6),
1207-121.
Rozin, P., Ashmore, M., & Markwith, M. (1996). Lay American conceptions of nutrition: Dose
insensitivity, categorical thinking, contagion, and the monotonic mind. Health Psychology,

28
15 (6), 438–447
Scott, M. L., Nowlis, S. S., Mandel, N., & Morales, A. C. (2008). The effects of reduced food
size and package size on the consumption behavior of restrained and unrestrained eaters.
Journal of Consumer Research, 35 (3), 391–405.
Stevens, S. S. (1986). Psychophysics: Introduction to Its Perceptual, Neural, and Social
Prospects. Oxford: Transaction Books.
Vanhuele, M., & Dreze, X. (2002). Measuring the price knowledge shoppers bring to the store.
Journal of Marketing, 66, 72.
Van Ittersum, K., & Wansink, B. (2012). Plate size and color suggestibility: The Delboeuf
illusion's bias on serving and eating behavior. Journal of Consumer Research, 39, 215–228.
van Koningsbruggen, G. M., Stroebe, W., & Aarts, H. (2011). Through the eyes of dieters:
Biased size perception of food following tempting food primes. Journal of Experimental
Social Psychology, 47, 293–299.
Viswanathan, M., Rosa, J. A., & Harris, J. E. (2005). Decision making and coping of
functionally illiterate consumers and some implications for marketing management. Journal
of Marketing, 69 (January), 15–31.
Vohs, K. D., Wang, Y., Gino, F., & Norton, M. I. (2013). Rituals enhance consumption.
Psychological Science, 24 (9), 1714-1721.
Wadhwa, M., Shiv, B., & Nowlis, S. M. (2008). A bite to whet the reward appetite: The
influence of sampling on reward-seeking behaviors. Journal of Marketing Research, 45,
403–413.
Wansink, B. (1996). Can package size accelerate usage volume? Journal of Marketing, 60 (July),
1–14.

29
Wansink, B., & Chandon, P. (2006a). Meal size, not body size, explains errors in estimating the
calorie content of meals. Annals of Internal Medicine, 145, 326-332.
——— (2006b). Can ‘low-fat’ nutrition labels lead to obesity. Journal of Marketing Research,
43 (November), 605–17.
——— (2014). Slim by design: Redirecting the accidental drivers of mindless overeating.
Journal of Consumer Psychology, 24, 413-431.
Wansink, B., & Van Ittersum, K. (2003). Bottoms up! The influence of elongation on pouring
and consumption volume. Journal of Consumer Research, 30, 455–463.
Young, L. R., & Nestle, M (1998). Variation in perceptions of a ‘medium’ food portion:
implications for dietary guidance. The Journal of American Dietetic Association, 98 (April),
458-59.
——— (2003). Expanding portion sizes in the US marketplace: Implications for nutrition
counseling. The Journal of American Dietetic Association, 103 (February), 231-34.
30
TABLE 1
USING THE DIMENSIONALITY BIAS TO INCREASE THE APPEAL OF DOWNSIZING
Original size (control)
1D downsizing
Elongated downsizing (height)
Elongated downsizing (length)
Net weight (lbs.) 8.0 5.0 5.0 5.0 Height (cm) 45.0 34.4 48.3 41.3 Length (cm) 20.5 20.5 19.3 26.5 Width (cm) 12.8 12.8 9.7 8.3
Shape
Choice share vs. competitors (%) 49.2 25.0* 57.1 53.3
Note: Package dimensions and choice share of the target brand (vs. competition) among regular customers of the brand in the control condition (regular pack size), 1D downsizing condition (pack was downsized in height), and two elongated downsizing conditions (pack was downsized through elongation in height or width). * indicates a statistically difference of the choice share in the downsizing condition compared to the choice share in the control condition at p < .05. Identifying package information was removed to ensure brand confidentiality. Reprinted with permission from the American Marketing Association (77, September, 2013): Table 4 in Ordabayeva, N., & Chandon, P. (2013). Predicting and managing consumers' package size impressions. Journal of Marketing, 77, 123–137.
31
TABLE 2
FIVE BIASES IN CONSUMERS’ SIZE PERCEPTIONS
Bias Description Remedies Literature Underestimation Consumers
underestimate the sizes of packages and portions, more so for large portions than for small ones.
- Providing information about the bias, drawing attention to the object or the estimation task, and motivating individuals to be accurate through intrinsic or extrinsic (financial) means do not mitigate the bias. - Prompting a piecemeal estimation of individual food items before estimation of the entire meal mitigates the bias.
Chandon & Wansink (2006; 2007a) Stevens (1986) Krider, Raghubir, & Krishna (2001) Krishna (2007)
Dimensionality Consumers are more sensitive to changes in size that occur along one pack dimension than to changes that occur along all three pack dimensions (length, width, and height), especially if dimensions change in opposite directions (e.g., if the height of a package grows while its length and width shrink).
- Linearizing the size change from multiple pack dimensions to a single dimension mitigates the dimensionality bias, increases the appeal of supersizing, and informs consumers about the actual size of supersized portions. - Implementing the size change through multiple dimensions, especially if dimensions change in opposite directions, increases the appeal of downsizing. - Enhancing the ease of monitoring product volume by using transparent packaging or by allowing the use of additional, non-visual, sensory information (e.g., weight products by hand) mitigates the dimensionality bias.
Chandon & Ordabayeva (2009) Deng & Srinivasan (2013) Krishna (2007) Ordabayeva & Chandon (2013) Raghubir & Krishna (1999) Wansink & Van Ittersum (2003)
Directionality Consumers are more sensitive to decreases in product quantity than to increases in quantity. Whereas consumers significantly underestimate size increases, they almost perfectly estimate size decreases.
- Changing the valence (palatability) of the product or the magnitude of the reference do not mitigate the directionality bias. - Imposing implicit or explicit bounds to estimations of increasing portions by providing a numeric bound or by having participants pour, instead of estimate, portions increase consumers’ sensitivity to size increases and mitigates the directionality bias. - Removing the zero bound from estimations of decreasing portions by having participants estimate the factor of change in portion size, instead of the final portion size, desensitizes
Chandon & Ordabayeva (2016)

32
consumers to size decreases and mitigates the directionality bias.
Labels Consumers believe that a product is smaller, lighter, or less caloric when it has a label highlighting its small size, healthy components, healthy positioning, or when the product is shown on the top-left (vs. bottom-right) of the package label.
- Highlighting the healthiness (or unhealthiness) of the meal or its components exacerbates the labeling bias. - Highlighting the size of the meal or its components by either having participants evaluate the size of individual meal components or by providing serving size information reduces the labeling bias, but only among normal-weight individuals who pay more attention to the perceived reduction in product size in the result of health labels, but not among overweight individuals who pay more attention the reduction in their consumption guilt in the result of health labels. - Downplaying the healthiness of individual products served at restaurants positioned as healthy (by having participants consider why individual products at these restaurants may not be as healthy as expected) mitigates the bias created by healthy restaurant positioning. - Placing products with “heavy” product image positioning (bottom-right) on the label next to other products with similar labels reduces the positioning bias created by the location of the product image on the label.
Aydinoglu & Krishna (2011) Chandon & Wansink (2007, 2007b) Chernev & Gal (2010) Deng & Khan (2009) Wansink & Chandon (2006)
Affect Consumers are more sensitive to package and portion sizes when they feel conflicted between their desire for the product contained in the package and their perception of the product’s potential health risk.
- Consumers who inherently experience high conflict between desire for hedonic food and fear of its unhealthiness (e.g., dieters) are more accurate in their estimations of portion size. - Simultaneously inducing both desire (by having participants sample the food before consumption) and the perceived danger of food (by highlighting its unhealthy nature or components) can improve the accuracy of size perceptions.
Balcetis & Dunning (2010) Cornil, Ordabayeva, Kaiser, Weber, & Chandon (2014) van Koningsbruggen, Stroebe & Aarts (2011)

33
FIGURE 1
PIECEMEAL ESTIMATION MITIGATES THE UNDERESTIMATION BIAS (OBSERVED
GEOMETRIC MEANS, 95% CONFIDENCE INTERVALS, MODEL PREDICTIONS)
Note: The actual and the estimated size of meals served at a fast-food chain restaurant observed among normal-weight and overweight individuals (classified based on the median split of participants’ body-mass-index) in the control condition (estimation of the size of the entire meal) and the piecemeal condition (estimation of the size of each meal component prior to the estimation of the size of the entire meal). Reprinted with permission from the American Marketing Association (44, 1, 2007): Figure 3 in Chandon, P., & Wansink B. (2007). Is obesity caused by calorie underestimation? A psychophysical model of meal size estimation. Journal of Marketing Research, 44 (1), 84-99.
0
500
1000
1500
2000
0 500 1000 1500 2000
Estim
ated
Num
ber o
f Cal
orie
s
Actual Number of Calories
Control condition,BMI < 25 (observed)
Control condition, BMI ≥ 25 (observed)
Control condition(model)
Piecemeal condition(model)
b = .83
b = .38

34
FIGURE 2
THE DIMENSIONALITY BIAS (OBSERVED GEOMETRIC MEANS, 95% CONFIDENCE
INTERVALS, MODEL PREDICTIONS)
Note: The actual and the estimated size of a candle in the 1D condition (the candle increased in height only) and the 3D condition (the candle increased in diameter and height). Reprinted with permission from the American Marketing Association (46, 6, 2009): Figure 1 in Chandon, P., & Ordabayeva, N. (2009). Supersize in one dimension, downsize in three dimensions: Effects of spatial dimensionality on size perceptions and preferences. Journal of Marketing Research, 46 (6), 725–738.
0
500
1000
1500
2000
0 500 1000 1500 2000
Estim
ated
Num
ber o
f Gra
ms
Actual Number of Grams
1D (observed)
1D (predicted)
3D (observed)
3D (predicted)
b = .87
b = .63
35
FIGURE 3
THE DIRECTIONALITY BIAS (OBSERVED GEOMETRIC MEANS, 95% CONFIDENCE
INTERVALS, MODEL PREDICTIONS)
Notes: The actual and the estimated size of a small, medium, and large portion of nuts in the supersizing condition (given the size of a small portion, participants estimated the size of each remaining portion in ascending order) and the downsizing condition (given the size of a large portion, participants estimated the size of each remaining portion in descending order).
52
127
273
74
204
637
0
200
400
600
0 200 400 600
Estim
ated
Num
ber o
f Nut
s
Actual Number of Nuts
Supersizing condition
Downsizing conditionb = .86
b = .68

36
FIGURE 4
BIASING EFFECT OF HEALTHY RESTAURANT POSITIONING (ESTIMATED AND
ACTUAL CALORIC CONTENT OF A MEAL CONSISTING OF THE MAIN DISH AND
THE SIDE DISH)
Notes: Estimated and actual number of calories contained in a meal (total meal consisting of the main dish and the side dish) consumed when given a coupon from McDonald’s (positioned as unhealthy) and Subway (positioned as healthy). Reprinted with permission from Oxford University Press (34, October, 2007): Figure 3 in Chandon, P., & Wansink, B. (2007b). The biasing health halos of fast food restaurant health claims: Lower calorie estimates and higher side-dish consumption intentions. Journal of Consumer Research, 34 (October), 301–14.
600 648
487
1011
0
200
400
600
800
1000
1200
Estimated calories Actual calories
Cal
orie
s (to
tal m
eal,
side
ord
er, a
nd m
ain
sand
wic
h)
With a coupon for a McDonald's Big Mac
With a coupon for a Subway 12" BMT sandwich
600
900
557
439
48
111
43
48