1 briefing for the president’s commission on the united states postal service january 8, 2003
TRANSCRIPT

1
BRIEFINGfor the
PRESIDENT’S COMMISSIONon the
UNITED STATES POSTAL SERVICE
January 8, 2003

2
Outline
Background Current Overview Transformation Plan
3
Postal Reorganization Act of 1970
Statutory Requirement: “ [The Postal Service] shall provide prompt, reliable, and efficient services to patrons in all areas and shall render postal services to all communities.”
Universal Service Mandate: Access and delivery to virtually everyone, everywhere, everyday.

4
Postal Reorganization Act of 1970
Universal Service Mandate: Access and delivery to virtually everyone, everywhere, everyday.
Business Model Premise: Moderate volume growth and postage rate increases at or below the economy’s rate of inflation would finance universal service and the ever-expanding delivery network.

5
Universal Delivery Service
3,400 New Carrier Routes
4,800 New
Carriers
80 New Delivery Facilities at $5.0 Million
Each
6
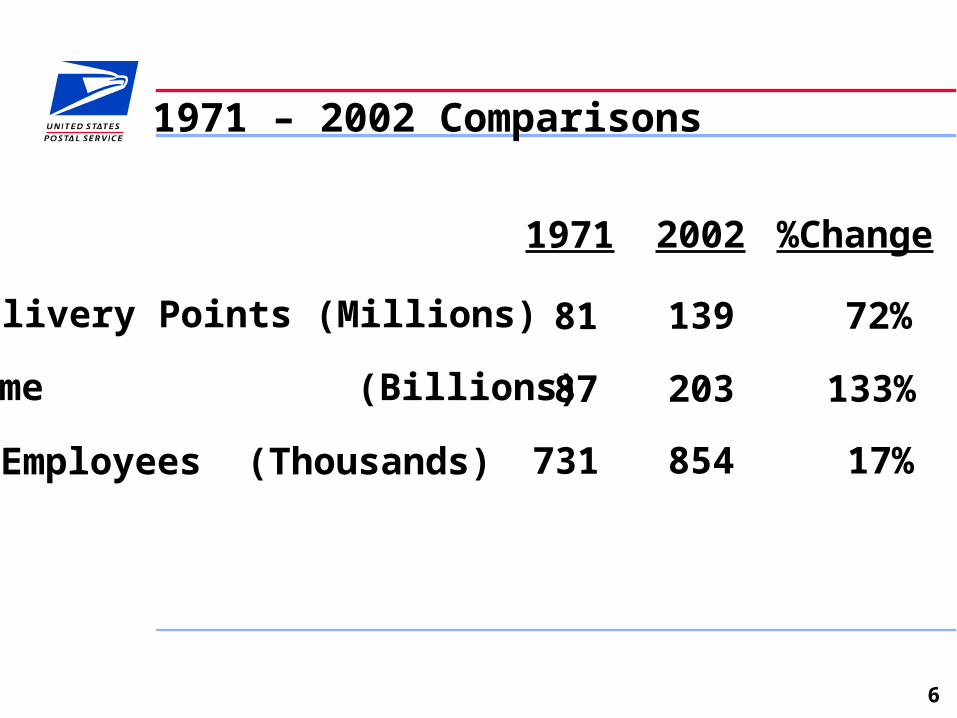
1971 – 2002 Comparisons
1971 2002 %Change
81 139 72%Delivery Points (Millions)
87 203 133%Volume (Billions)
731 854 17%Employees (Thousands)

7
CPI vs. First-Class Postage Rates
First-Class Postage
CPI
0
50
100
150
200
250
300
350
400
Cu
mu
lati
ve %
Ch
ang
e
May718¢
Mar7410¢
Dec7513¢
May7815¢
Mar8118¢
Nov8120¢
Feb8522¢
Apr8825¢
Feb9129¢
Jan9532¢
Jan9933¢
Jan0134¢
Jun0237¢

8
Post Office Department and Postal Service
Revenue $90 $1,108
$Billions
Post Office Department
1942-1971
United States Postal Service
1972-2002(Cumulative)
Financial Results
Expense 109 1,114
Deficit ($19) ($6)
Revenue/Expense 82.6% 99.5%

9
203
207208
202
197
139
138
136
134133
190
192
194
196
198
200
202
204
206
208
210
1998 1999 2000 2001 2002
130
131
132
133
134
135
136
137
138
139
140
Mail Volume
753776788798792
Summary Statistics
Delivery Points
B
B
BB
B
M
M
M
M
M
K K K KK
Career Complement

10
Annual Net Margin
0.9% 0.6%
-0.3%
-2.6%
-1.0%
-5%-4%-3%-2%-1%0%1%2%3%4%5%6%7%8%9%
10%
1998 1999 2000 2001 2002
Net Margin = Net Income (or Loss) / Revenue

11
Growth in Revenue Per Delivery Point
1.9%
3.0%
1.7%
0.5%
-0.7%1998 1999 2000 2001 2002FY
15% Rate Increase: 3%
12
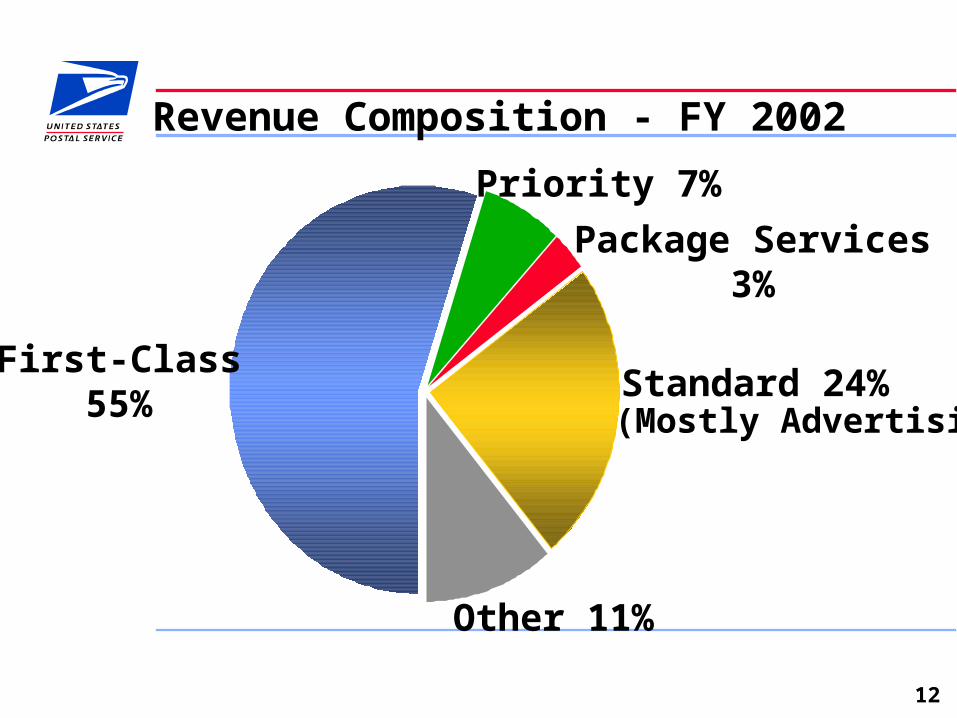
Revenue Composition - FY 2002
First-Class55%
Other 11%
Standard 24%
Package Services 3%
Priority 7%
(Mostly Advertising)

13
Expense Composition - FY 2002
Compensation/Benefits 79%
Transportation 8%
Other 13%

14
57%
Volume Variable$38.4B
43%
"Fixed" $29B
57%
$38B$38B
FY 2001 Expenses

15
“Fixed”vs Volume-Variable Costs FY 2001
Volume-Variable Costs Include: - Transportation
− Mail Distribution Work Hours− Mail Containers− Fuel− Retail Transactions− Delivery Carrier Prep in Office
“Fixed” Costs include: - 38,000 Post Office, Station, and Branch Operations
− Del. Rte. Coverage - 240,000 Delivery Rts.− 215,000 Vehicles− Retirement Costs− Overhead
43%
"Fixed" $29B
FY 2001 ExpensesFY 2001 Expenses
57%
Volume-Variable $38B
16
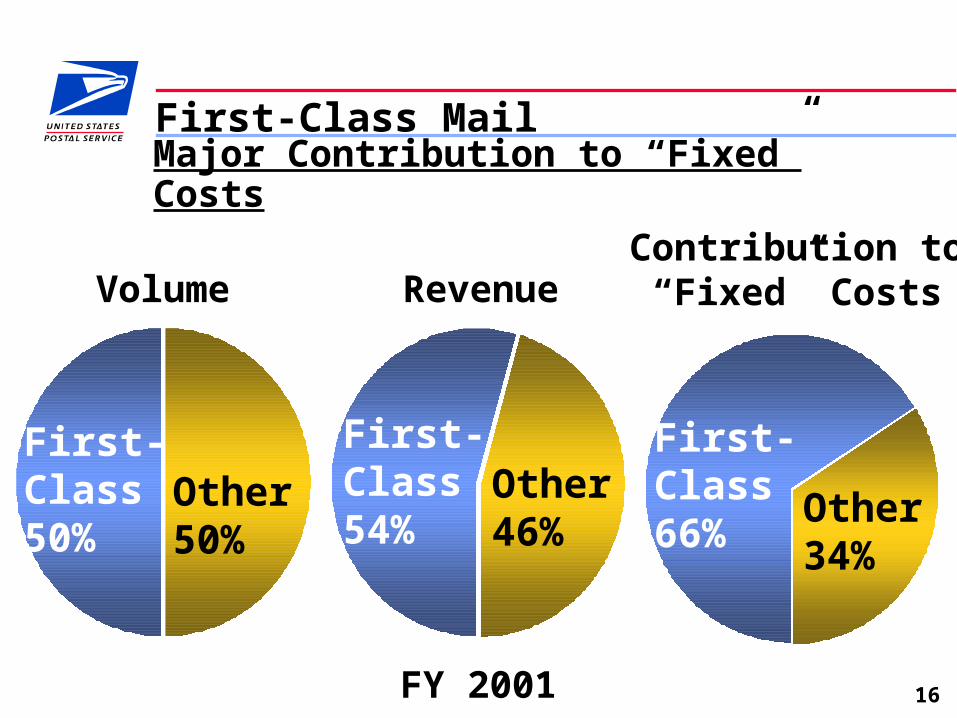
First-Class Mail
Volume RevenueContribution to“Fixed” Costs
Major Contribution to “Fixed” Costs
First-Class50%
Other50%
First-Class54%
Other46%
First-Class66%
Other34%
FY 2001
17
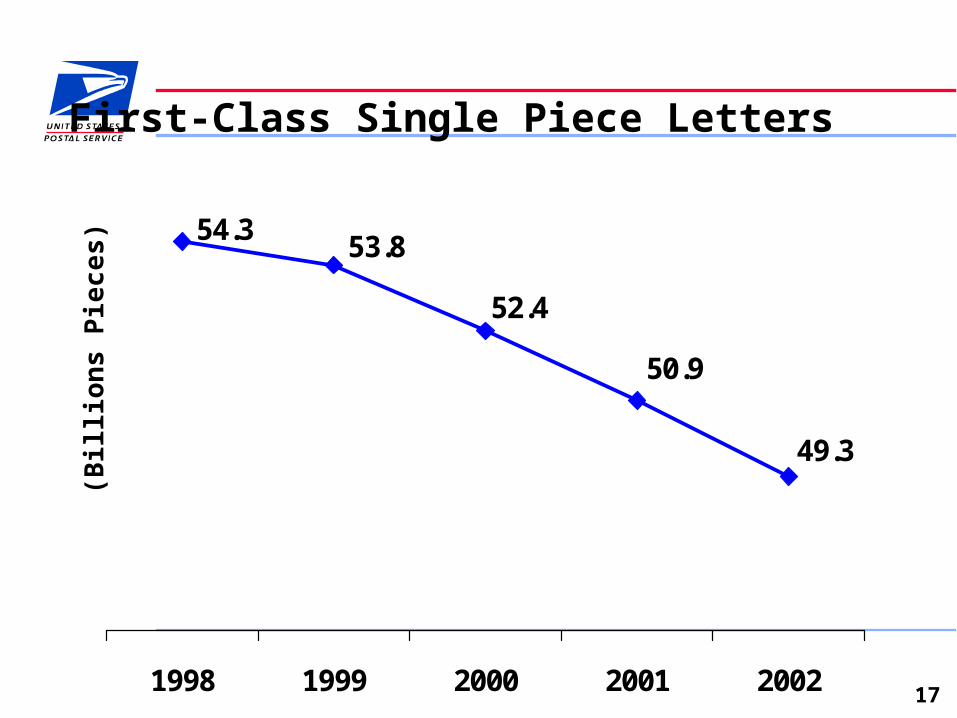
First-Class Single Piece Letters
49.3
50.9
52.4
54.353.8
1998 1999 2000 2001 2002
(Bill
ion
s P
iece
s)

18
First-Class Mail-Sector Analysis
Household to Nonhousehold
Household toHousehold
Nonhousehold to Household
Nonhousehold to Nonhousehold
9% 7%13% 15%
37%
26%
41%
52%19872001
Source: Household Diary Study

19
Standard Mail Volume 1987 and 2001
45
75
15
15
1987 2001
To Households To Nonhouseholds
90B
60BB
B
B
B

20
Standard Mail Volume
82.5
85.7
87.2
89.990.1
1998 1999 2000 2001 2002FY
Bil
lio
ns
of
Pie
ces

21
Standard Mail Volume
20.0% 21.2%
39.7%25.1%
24.6% 28.5%32.1%
14.7% 17.3%
21.0%
34.2%
19.3%
1972 1987 2002
Source: McCann-Erickson WorldGroup
Market Share 1972- 2002
Direct MailDirect Mail
Internet AdvertisingInternet Advertising
Radio & Television/CableRadio & Television/Cable
Newspapers & MagazinesNewspapers & Magazines
OtherOther
(2.3%)
14.7% 17.3% 19.3%
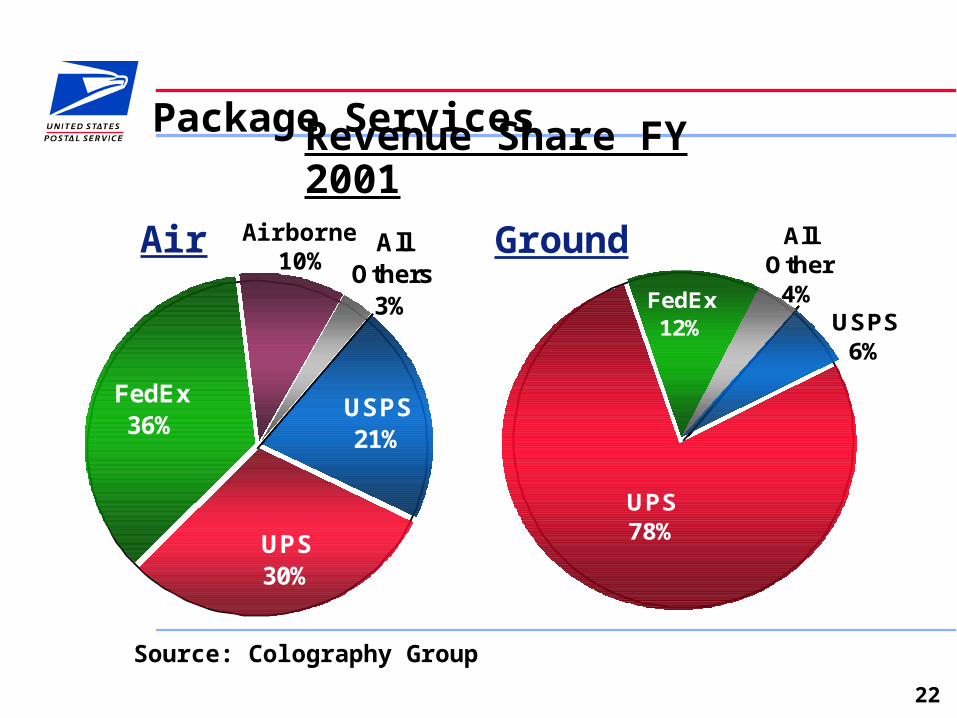
22
UPS78%
FedEx12%
All Other
4%USPS
6%
USPS21%
All Others
3%
FedEx36%
UPS30%
Package Services
Air Ground
Source: Colography Group
Revenue Share FY 2001
Airborne10%
23
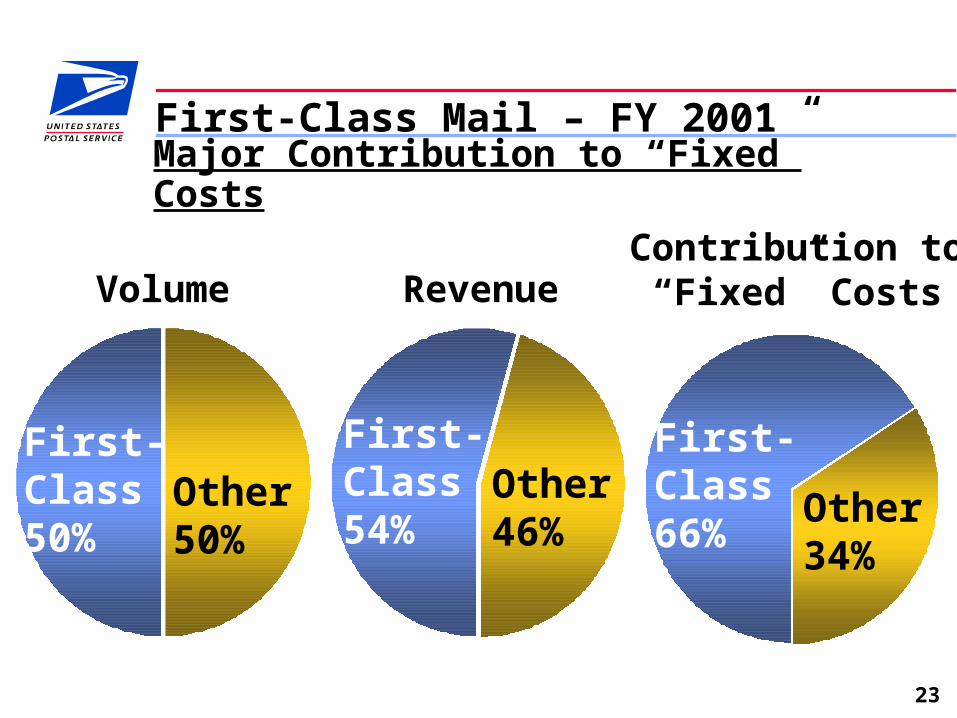
First-Class Mail – FY 2001
Volume RevenueContribution to“Fixed” Costs
Major Contribution to “Fixed” Costs
First-Class50%
Other50%
First-Class54%
Other46%
First-Class66%
Other34%

24
Financial Effect
Standard Mail
or Priority Mail
or Express Mail
or Parcel Post
7.1 B
313 M
50 M
1.5 B
8%
26%
70%
465%
Volume Increase % Growth
From $1 Billion of First-Class Mail RevenueVolume Necessary to Replace Contribution

25
Competition and Technology
First-Class Mail
•Business eMail
•Electronic Bill Payment
Standard Mail
•Print/Broadcast Media
•Internet Advertising
Periodicals
•Internet News Sources
•Lifestyle Changes
Packages
•No Longer the Only Nationwide Package Service

26
Strategy: Achieve Lowest Combined Cost
Progression of Customer Worksharing Options
•Presorted Bundles
•Presorted Bundles
•Prebarcode Pieces
•Presorted Trays
•Prebarcode Pieces
•Dropship
1970’s 1980’s 1990’s
$15 Billion Current Annual Discounts

27
Postal Operations
•Automated Letter Distribution
•Automated Flat and Parcel Processing
•Delivery Point Sequencing
•“Network Optimization”
1970’s 1980’s 1990’s 2000’s
•Mechanized Mail Processing
Strategy: Achieve Lowest Combined Cost
1970 Postal Reorganization• Capital Investment Financing• Self-Directed Research• Longer Term Planning
28
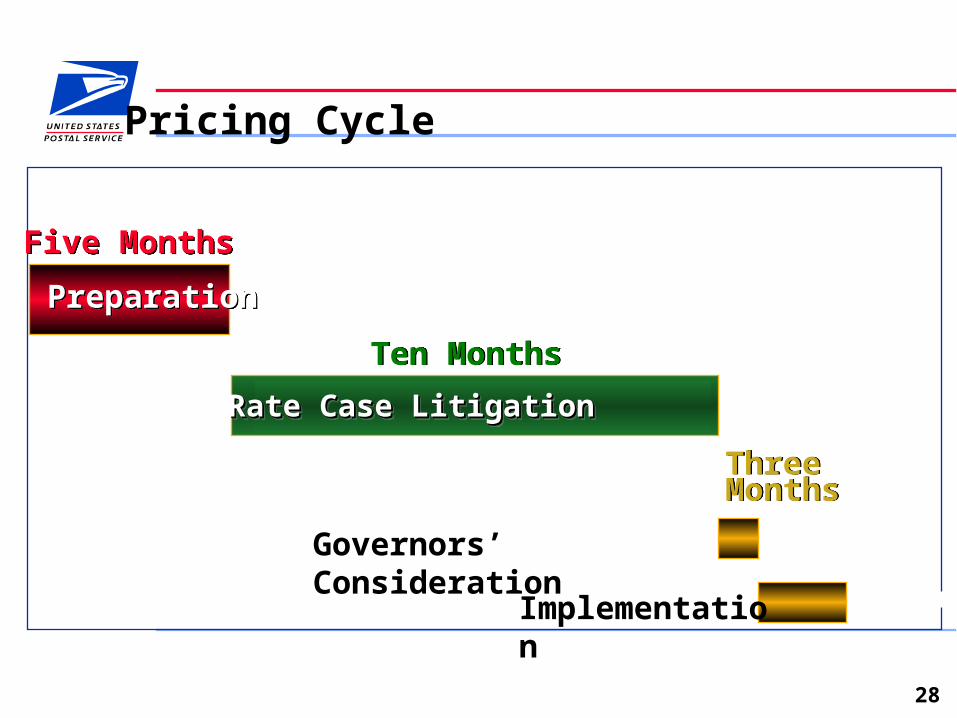
Five MonthsFive Months
Pricing Cycle
Preparation Preparation
Rate Case LitigationRate Case LitigationRate Case LitigationRate Case Litigation
Ten MonthsTen Months
Implementation
Governors’ Consideration
Three MonthsThree
Months

29
Rate Increases & Economic Conditions
RecessionsFirst-Class First Ounce Rate Increase
Average Rate Increase – All Classes – 2001 and 2002 increases implemented in 3 steps
Rate Increases and Economic Conditions
16%18%
10%
3%
15%
25%
30%
15%
33%
10%
33%
0%
5%
10%
15%
20%
25%
30%
35%
40%
19711972197319741975197619771978197919801981198219831984198519861987198819891990199119921993199419951996199719981999200020012002

30
Financial Stress
$ 6 BCumulative Losses
(Since 1971)
($40 – 50 B)Retiree Health
Benefits Obligation
$ 19 BOther Liabilities
(Excluding CSRS)
$ 11 BDebt
31
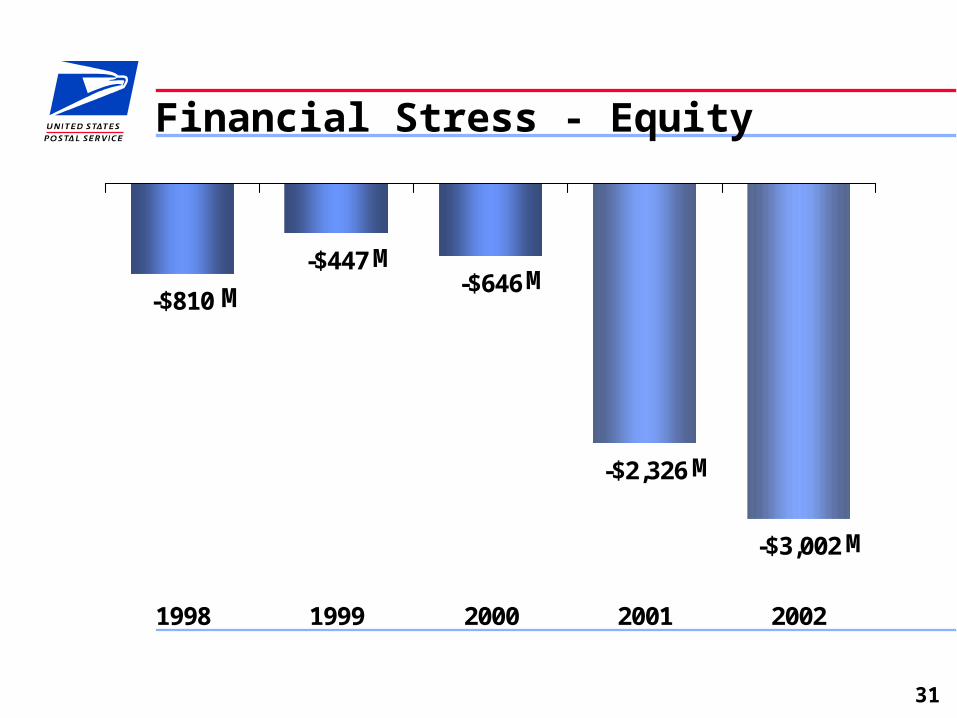
Financial Stress - Equity
-$810
-$447-$646
-$2,326
-$3,002
1998 1999 2000 2001 2002
M
MM
M
M

32
TRANSFORMATION PLAN

33
“Push the Envelope”
Legislation – Short Term
Transformation Plan
– Public Policy Issues

34
Transformation Plan
Growth
Efficiency
Performance Based Culture
“Push the Envelope”

35
Service
Externally Measured
Service At Record Levels
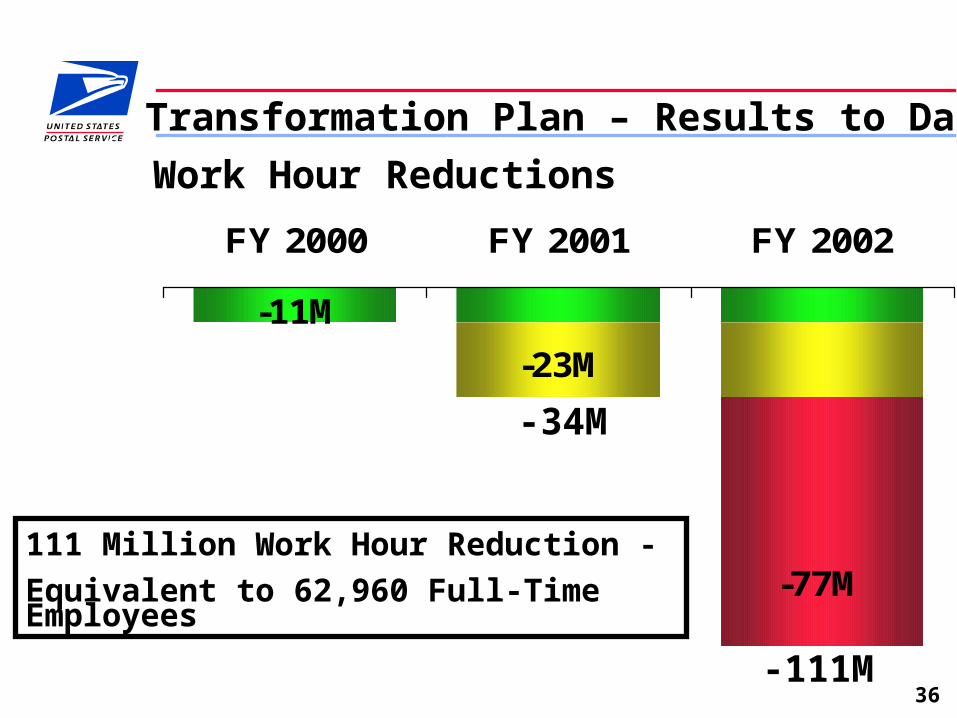
Transformation Plan – Results to Date
36
-11M
-23M
-77M
FY 2000 FY 2001 FY 2002
Cumulative Work Hour Reductions
-34M
-111M
Transformation Plan – Results to Date
Work Hour Reductions
111 Million Work Hour Reduction -
Equivalent to 62,960 Full-Time Employees
37
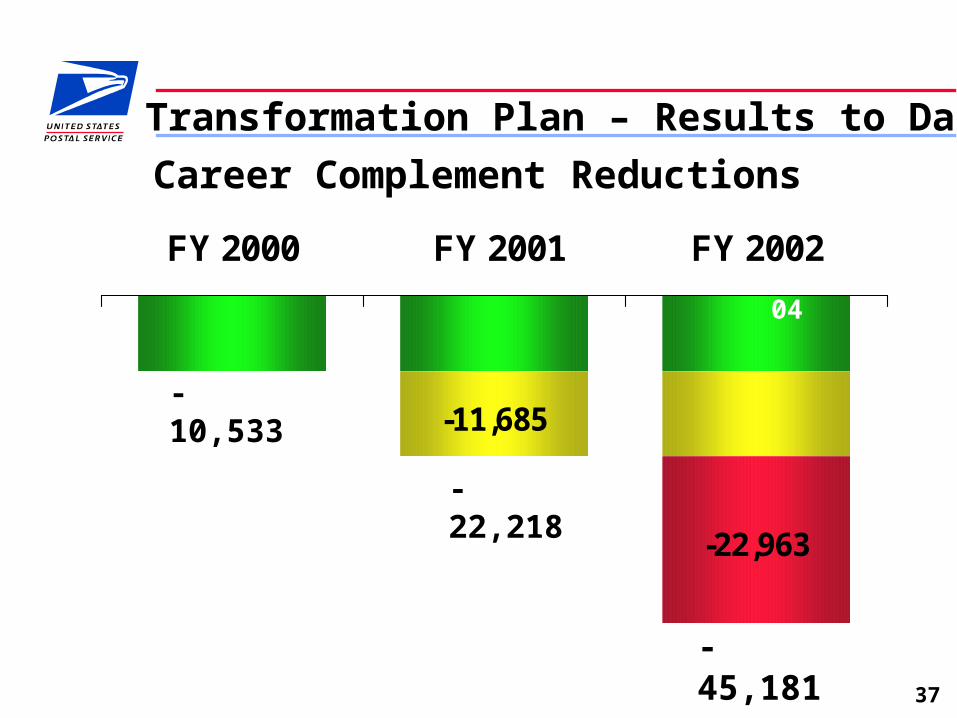
-11,685
-22,963
FY 2000 FY 2001 FY 2002
-10,533
-22,218
-45,181
AP 04
Career Complement Reductions
Transformation Plan – Results to Date

38
First Ever Expense Reduction – $200 Million Below 2001 Level
Labor Contracts – In Place to Provide Stability
Record Setting Safety Performance
Delivered $1.5 Billion of Cost Savings Goal - $5 Billion By 2006
Negotiated Rate Settlement/Expedited Implementation
Transformation Plan - Results to Date
39
BRIEFINGfor the
PRESIDENT’S COMMISSIONon the
UNITED STATES POSTAL SERVICE
January 8, 2003