1. base transceiver station (bts)
TRANSCRIPT
Expanding Rural Cellular Networks
with Virtual Coverage
Kurtis Heimerl
UC Berkeley
Joshua Blumenstock
University of Washington
Kashif Ali
UC Berkeley
Brian Gawalt
UC Berkeley
Eric Brewer
UC Berkeley
Cellular Telephony
• Highest adoption since lightbulb
– ~5B users in ~25 years
• More users than IPv4 addresses!
– Numerous studies showing user benefits
• Jensen showed benefits from installation
(8% profit increase, 4% price fall)
• Waverman et al showed benefits of adoption
(+.1 phones per capita = + .59% GDP growth)
Cellular Telephony
• Highest adoption since lightbulb
• Billions currently not on network
– Some luddites, sure…
– But at least 1B outside of coverage

Why no coverage?
Why no coverage?
1. Cost
– Personal reports of order 500K-1M USD to
do an install in rural Indonesia
– Requires dense population for install
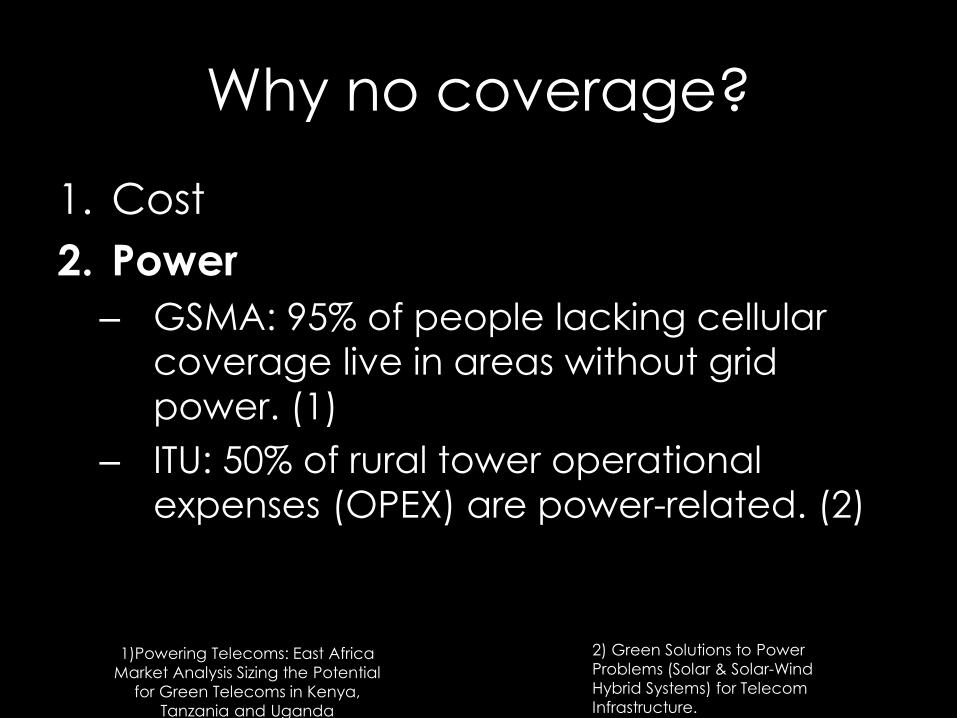
Why no coverage?
1. Cost
2. Power
– GSMA: 95% of people lacking cellular
coverage live in areas without grid
power. (1)
– ITU: 50% of rural tower operational
expenses (OPEX) are power-related. (2)
1)Powering Telecoms: East Africa
Market Analysis Sizing the Potential
for Green Telecoms in Kenya,
Tanzania and Uganda
2) Green Solutions to Power
Problems (Solar & Solar-Wind
Hybrid Systems) for Telecom
Infrastructure.
Goal:
Reduce the cost of rural cell
installations by reducing cell
tower power draw
Plan:
Find the part drawing the most
power and reduce its energy
consumption
So what’s in a rural tower?
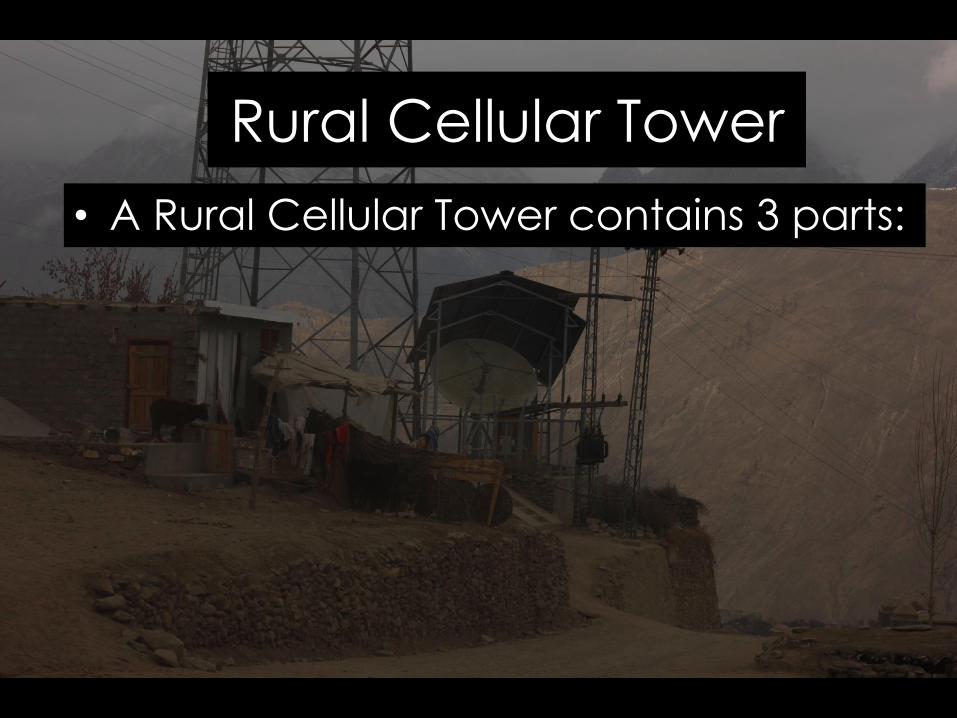
Rural Cellular Tower
• A Rural Cellular Tower contains 3 parts:
Rural Cellular Tower
• A Rural Cellular Tower contains 3 parts:
Rural Cellular Tower
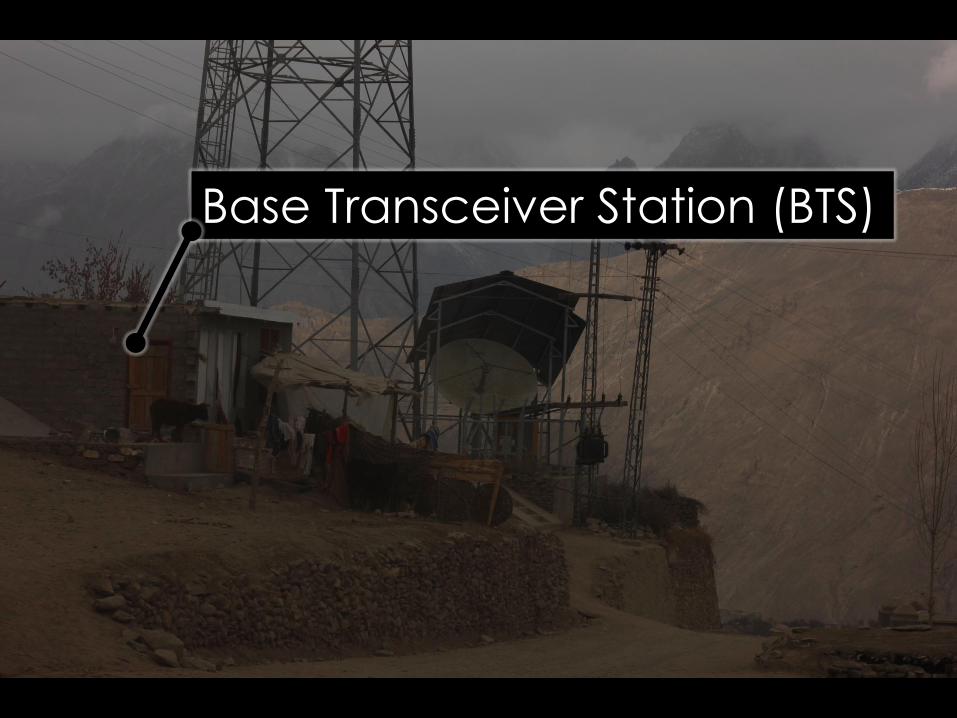
• A Rural Cellular Tower contains 3 parts: Base Transceiver Station (BTS)
Rural Cellular Tower
• A Rural Cellular Tower contains 3 parts:
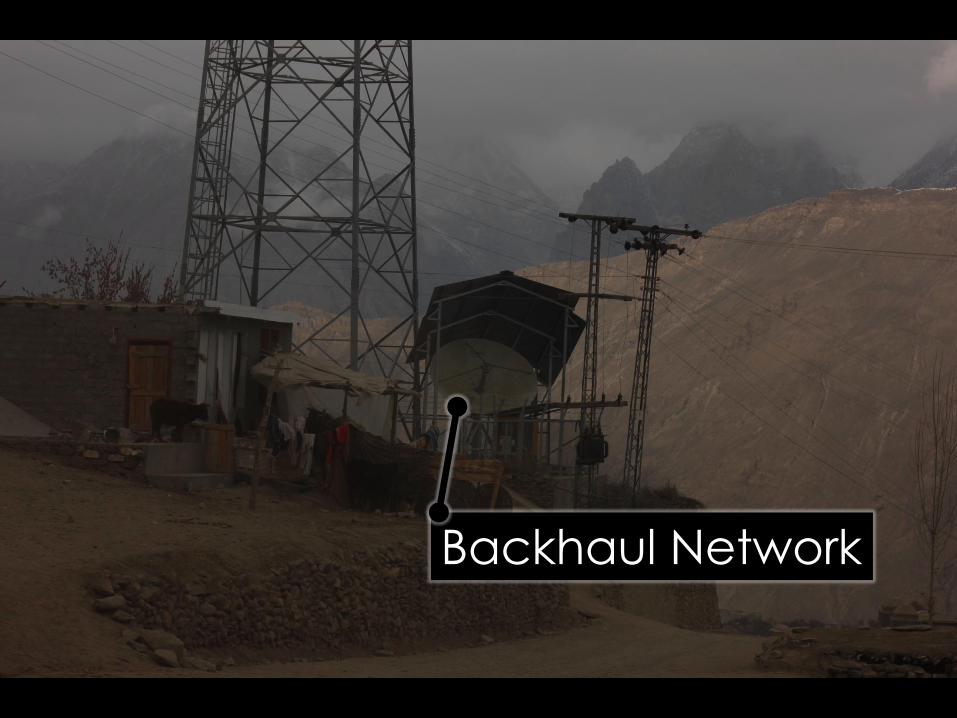
Backhaul Network
Rural Cellular Tower
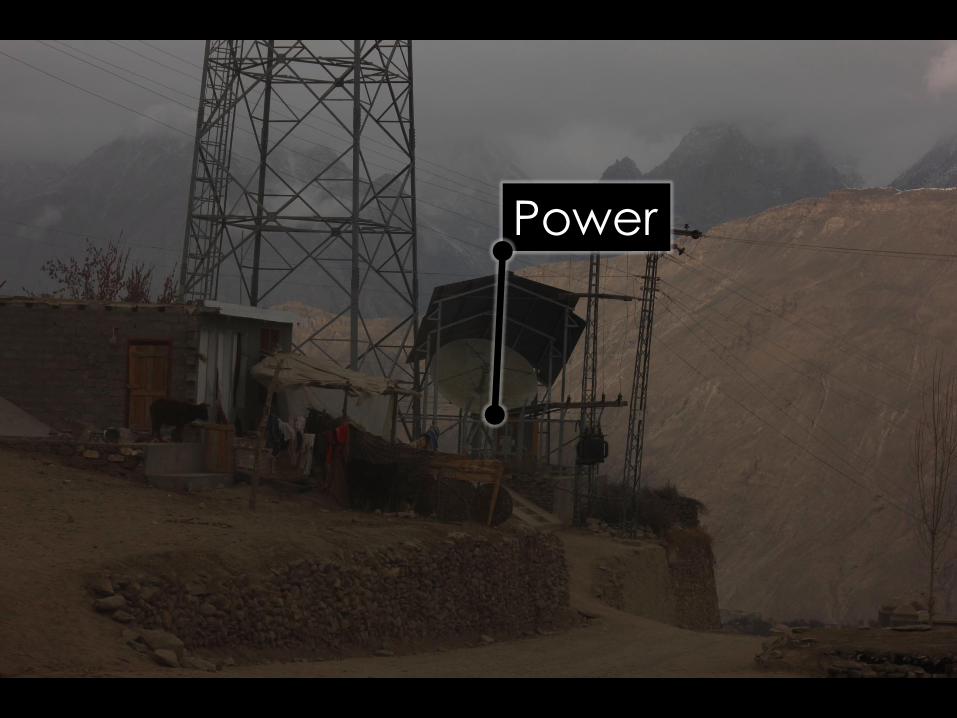
• A Rural Cellular Tower contains 3 parts: Power

Rural Cellular Tower
• A Rural Cellular Tower contains 3 parts:
1. Base Transceiver Station (BTS)
• Traditional Vendor: Siemens BS-240
– 50-100K USD
– 1K+ Watts
Rural Cellular Tower
• A Rural Cellular Tower contains 3 parts:
1. Base Transceiver Station (BTS)
• Traditional Vendor
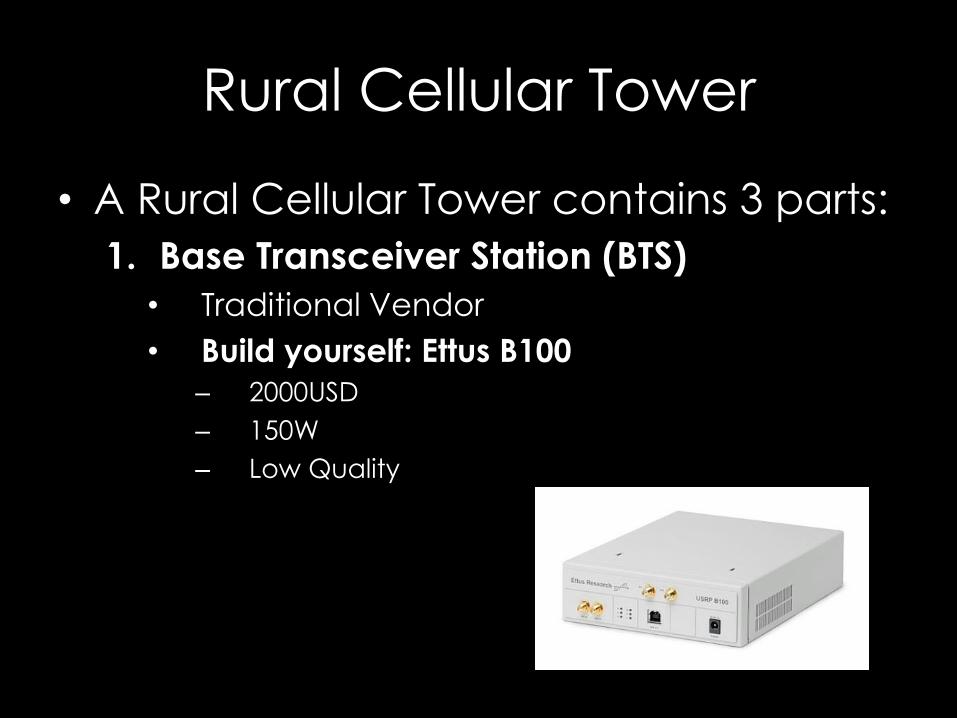
• Build yourself: Ettus B100
– 2000USD
– 150W
– Low Quality
Rural Cellular Tower
• A Rural Cellular Tower contains 3 parts:
1. Base Transceiver Station (BTS)
• Traditional Vendor
• Build yourself: Ettus B100
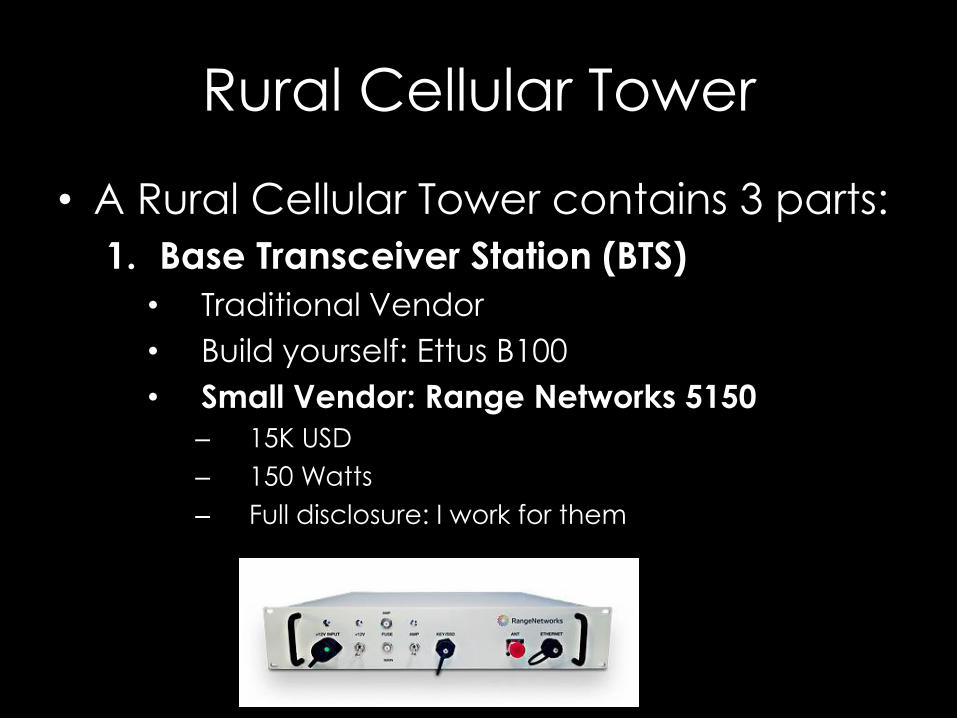
• Small Vendor: Range Networks 5150
– 15K USD
– 150 Watts
– Full disclosure: I work for them
Rural Cellular Tower
• A Rural Cellular Tower contains 3 parts:
1. Base Transceiver Station (BTS)
2. Backhaul Network
• Wired
– Negligible power draw
– Very expensive to install in rural areas
Rural Cellular Tower
• A Rural Cellular Tower contains 3 parts:
1. Base Transceiver Station (BTS)
2. Backhaul Network
• Wired
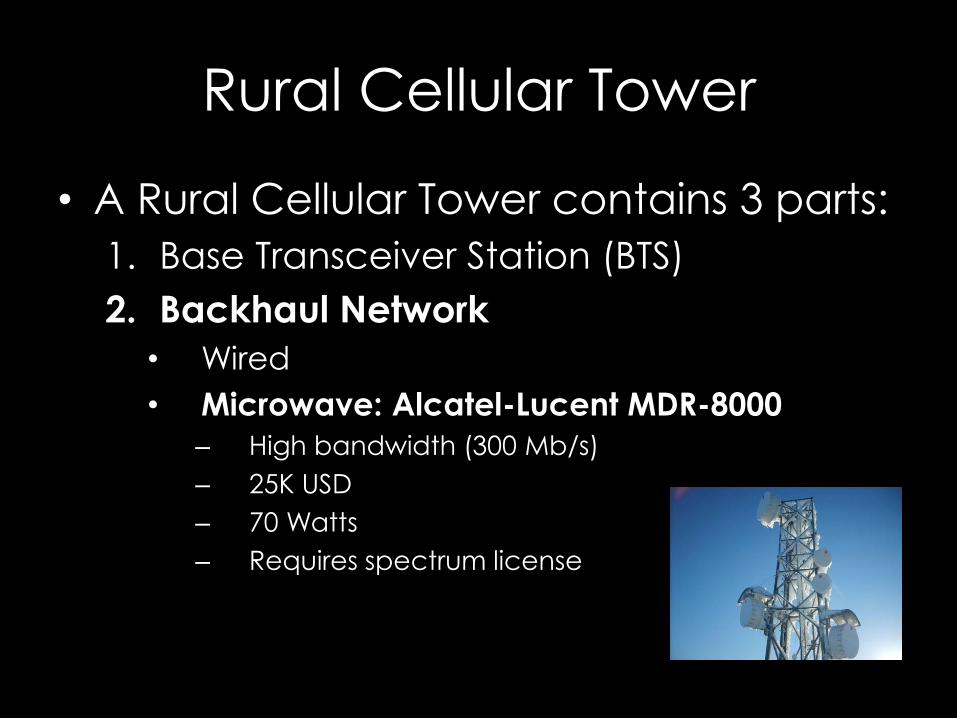
• Microwave: Alcatel-Lucent MDR-8000
– High bandwidth (300 Mb/s)
– 25K USD
– 70 Watts
– Requires spectrum license
Rural Cellular Tower
• A Rural Cellular Tower contains 3 parts:
1. Base Transceiver Station (BTS)
2. Backhaul Network
• Wired
• Microwave
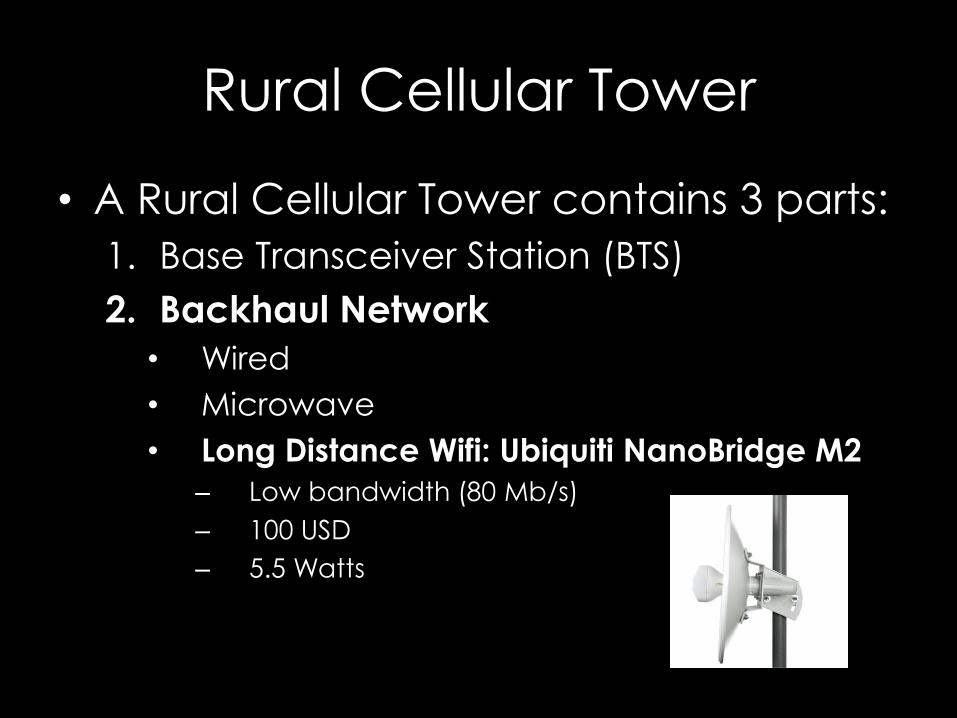
• Long Distance Wifi: Ubiquiti NanoBridge M2
– Low bandwidth (80 Mb/s)
– 100 USD
– 5.5 Watts
Rural Cellular Tower
• A Rural Cellular Tower contains 3 parts:
1. Base Transceiver Station (BTS)
2. Backhaul Network
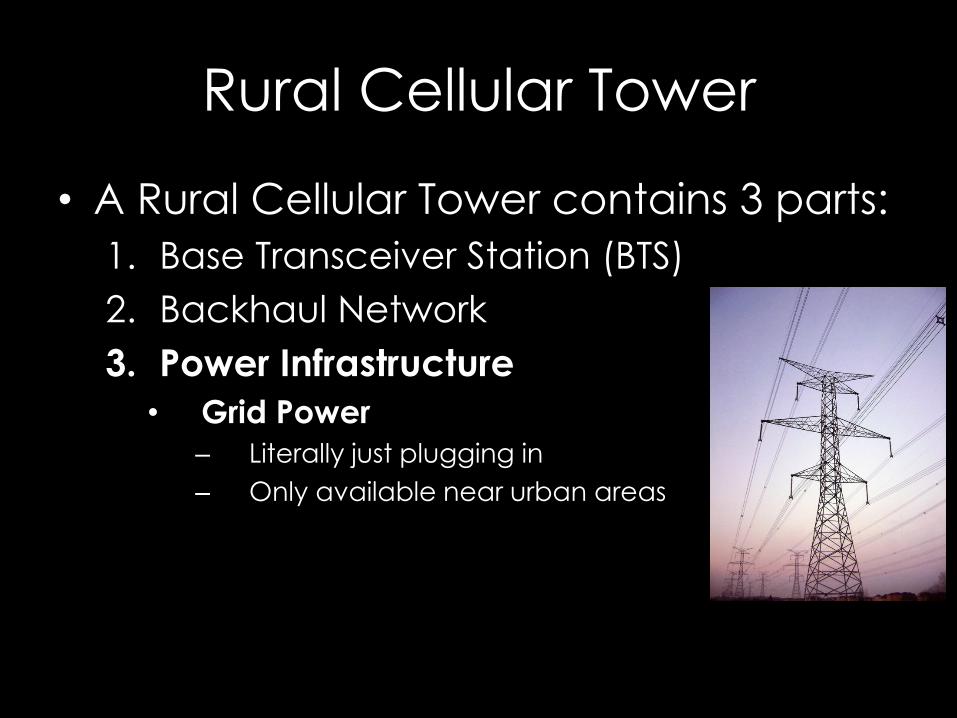
3. Power Infrastructure
• Grid Power
– Literally just plugging in
– Only available near urban areas

Rural Cellular Tower
• A Rural Cellular Tower contains 3 parts:
1. Base Transceiver Station (BTS)
2. Backhaul Network
3. Power Infrastructure
• Grid Power
• Diesel Generator/Batteries
– Requires road for trucking diesel in
– Requires fence for protecting diesel
– Also in urban areas if power unreliable
– 50-100K USD
Rural Cellular Tower
• A Rural Cellular Tower contains 3 parts:
1. Base Transceiver Station (BTS)
2. Backhaul Network
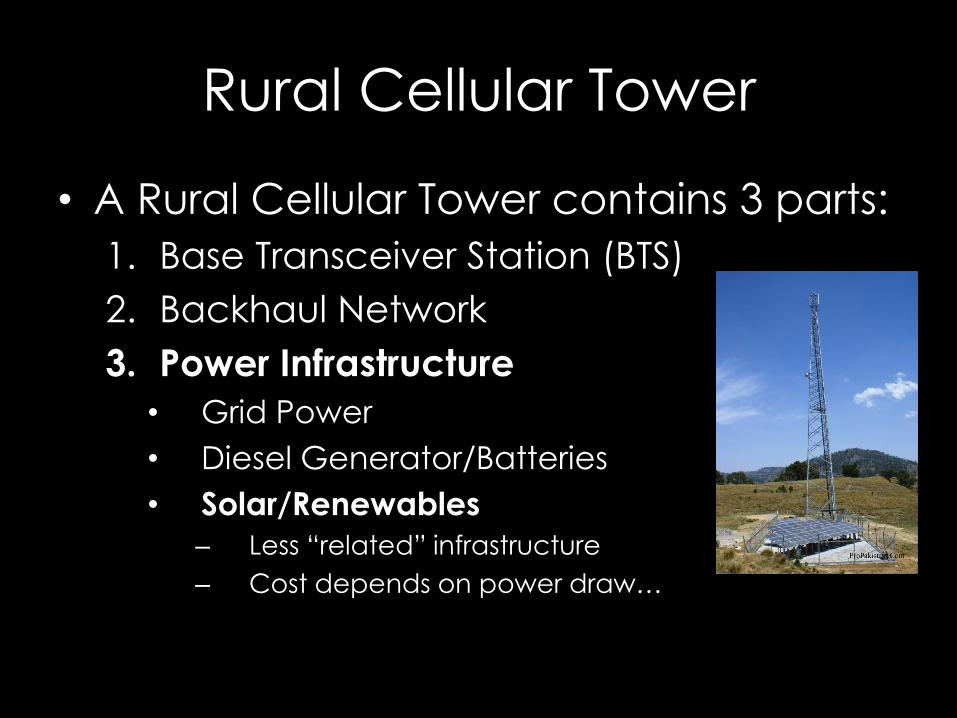
3. Power Infrastructure
• Grid Power
• Diesel Generator/Batteries
• Solar/Renewables
– Less “related” infrastructure
– Cost depends on power draw…
Example: Solar Power
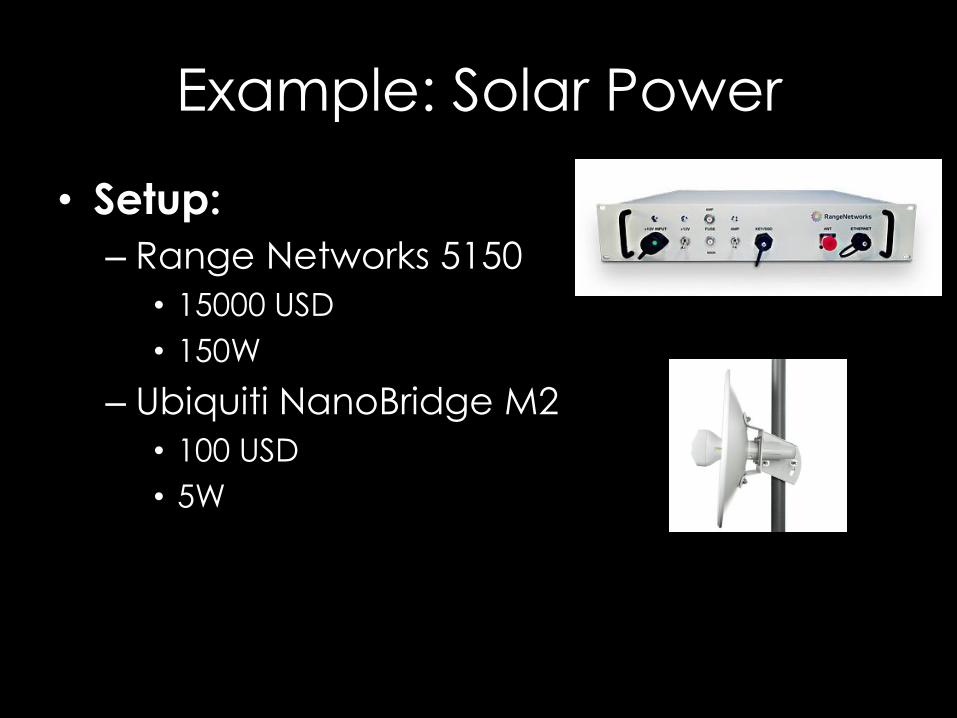
• Setup:
– Range Networks 5150
• 15000 USD
• 150W
– Ubiquiti NanoBridge M2
• 100 USD
• 5W
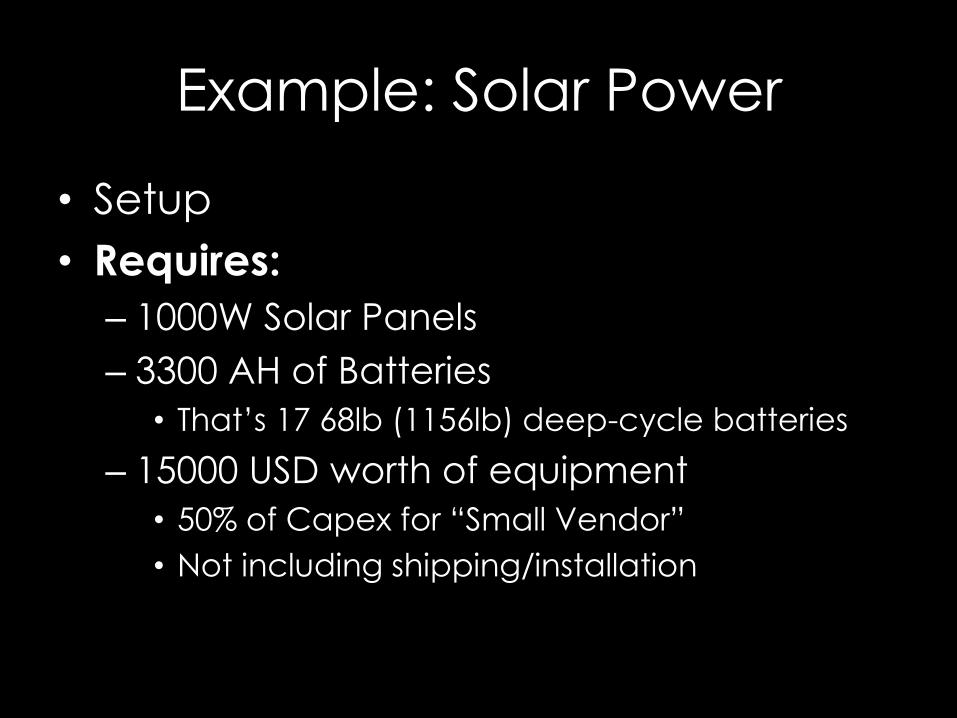
Example: Solar Power
• Setup
• Requires:
– 1000W Solar Panels
– 3300 AH of Batteries
• That’s 17 68lb (1156lb) deep-cycle batteries
– 15000 USD worth of equipment
• 50% of Capex for “Small Vendor”
• Not including shipping/installation
So how do we reduce the
total power draw of a BTS?
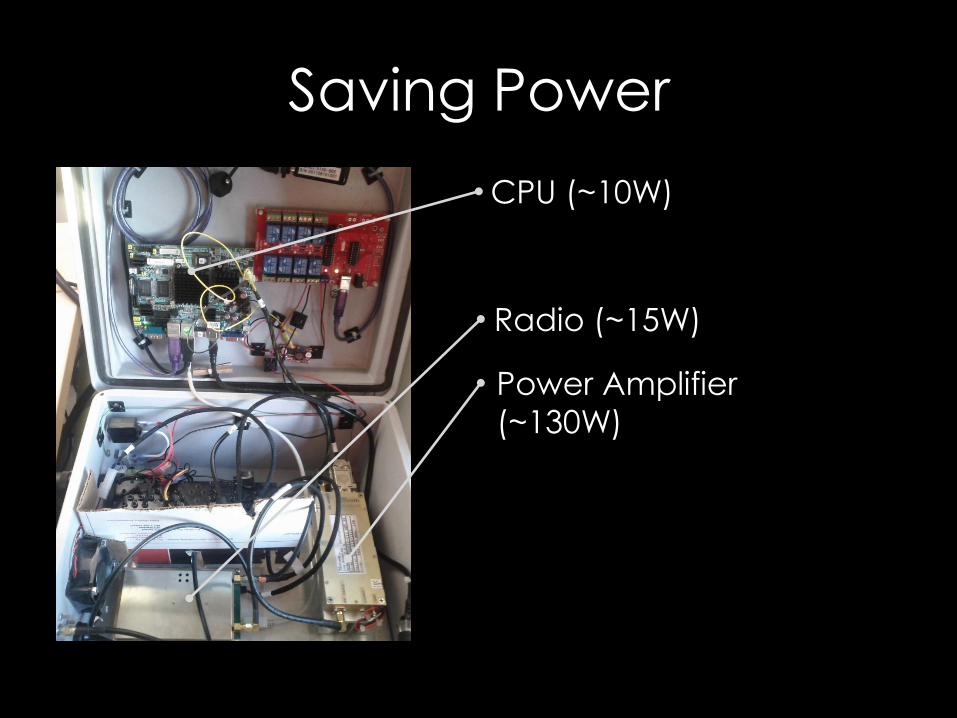
Saving Power

Saving Power
CPU (~10W)
Saving Power
CPU (~10W)
Radio (~15W)
Saving Power
CPU (~10W)
Radio (~15W)
Power Amplifier
(~130W)
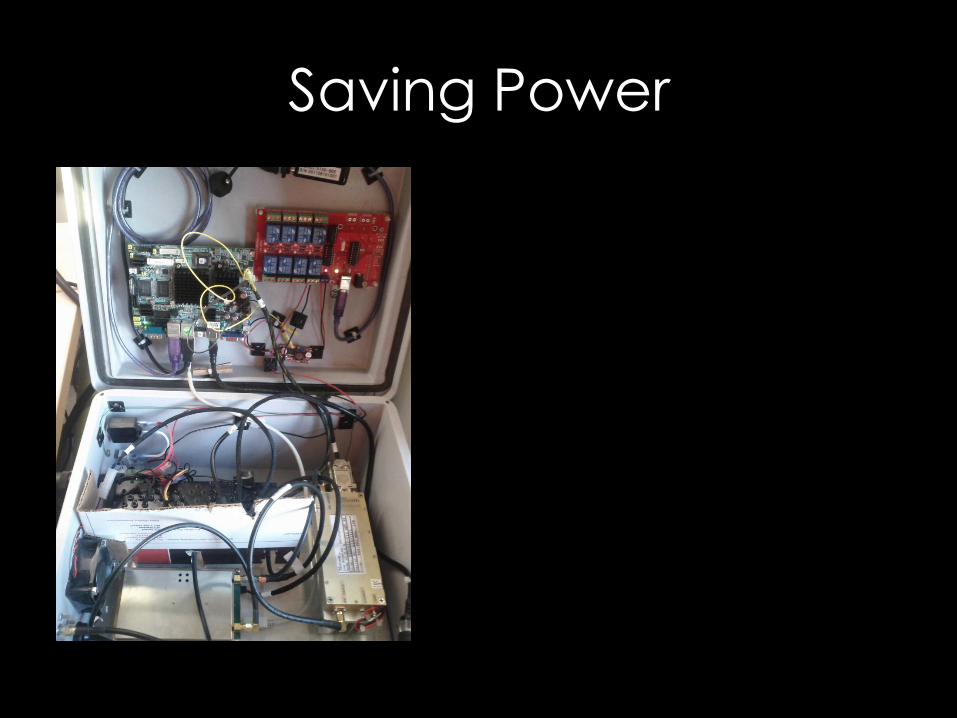
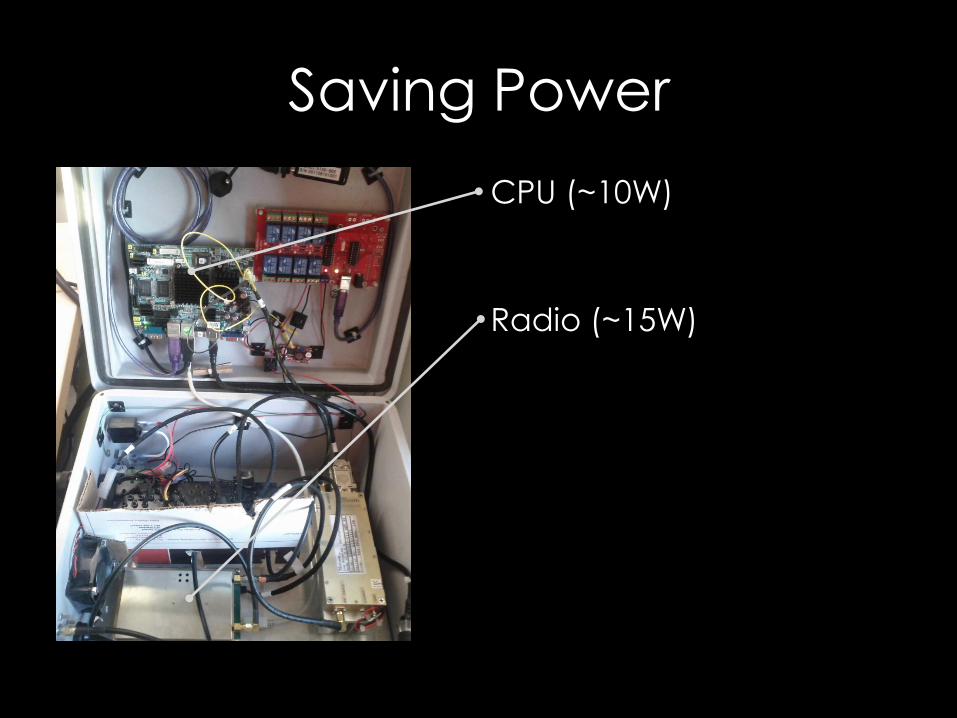
Saving Power
• Parts of a Base Transceiver Station (BTS)
– Computer (~10W)
– Radio (~15W)
– Power Amplifier (130W)
• Constant Draw (beaconing)
Have to touch power amplifier to save
power!
Saving Power
• Power Amplifier (PA)
– Draws the most power
Saving Power
• Power Amplifier (PA)
– Draws the most power
– Determines the coverage radius
• To a point (Eventually limited by 2W handsets)
Saving Power
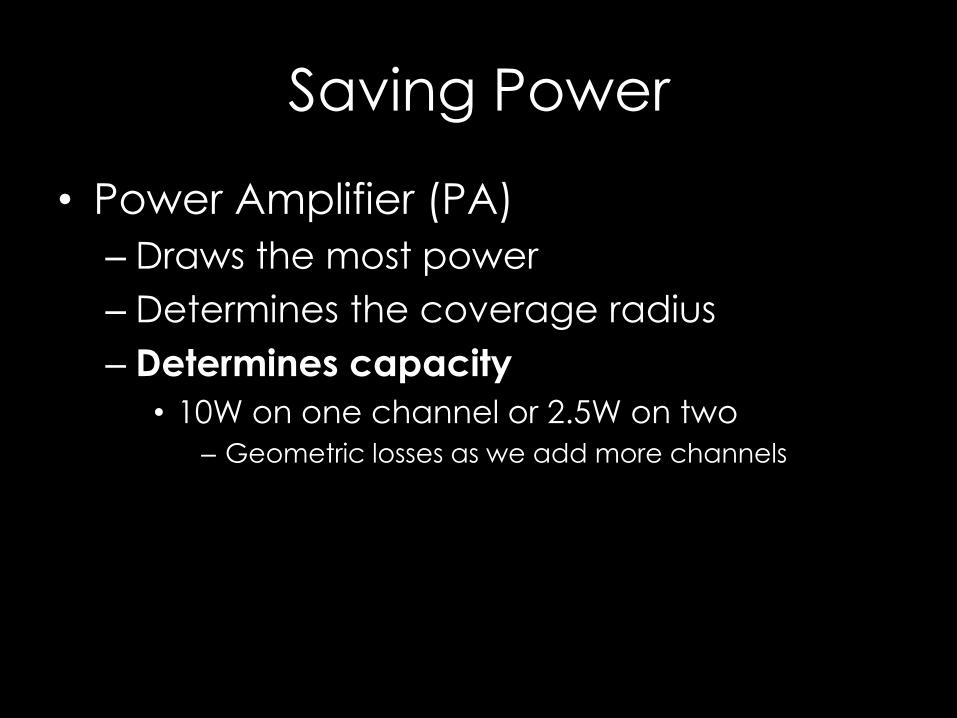
• Power Amplifier (PA)
– Draws the most power
– Determines the coverage radius
– Determines capacity
• 10W on one channel or 2.5W on two
– Geometric losses as we add more channels
Saving Power
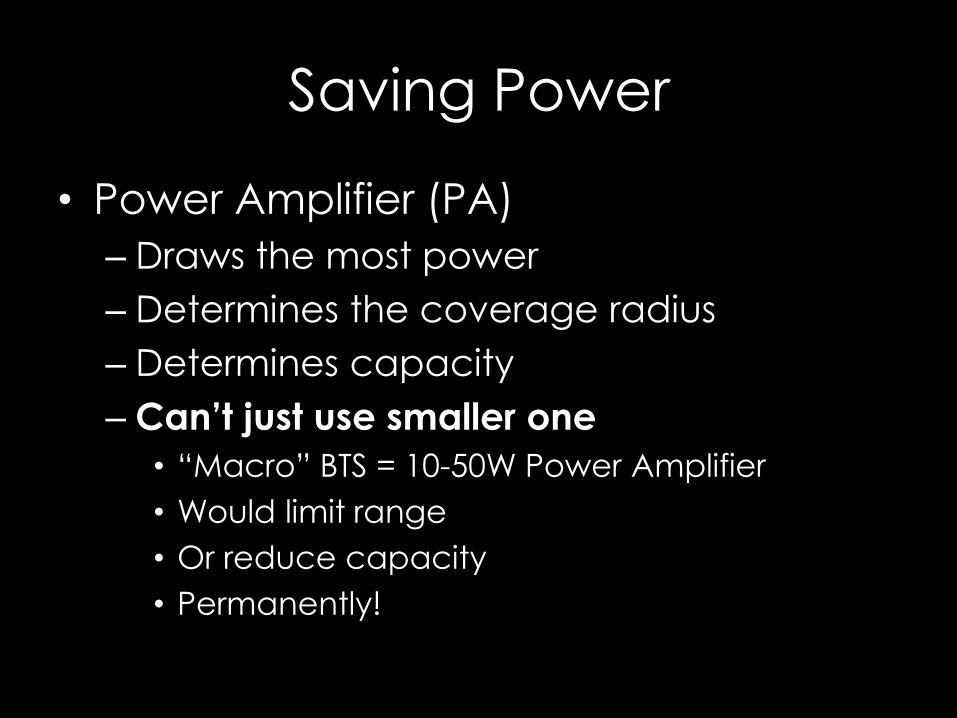
• Power Amplifier (PA)
– Draws the most power
– Determines the coverage radius
– Determines capacity
– Can’t just use smaller one
• “Macro” BTS = 10-50W Power Amplifier
• Would limit range
• Or reduce capacity
• Permanently!
Q: How do we reduce
the PA power draw?
A: Same way you do
everything else; turn it off
when not in use.
A: Same way you do
everything else; turn it off
when not in use.
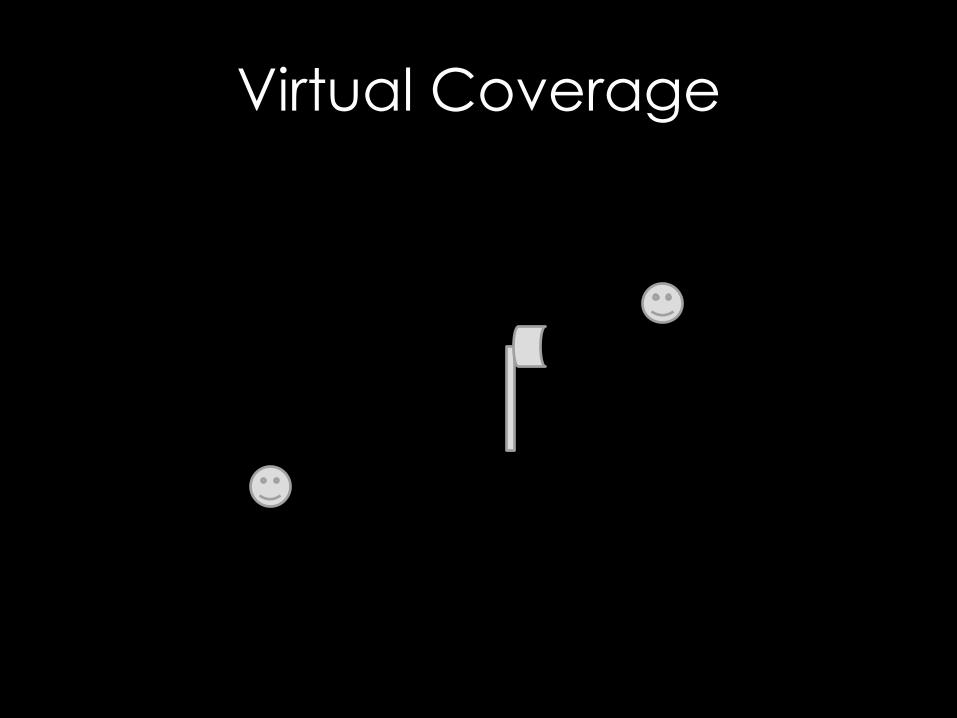
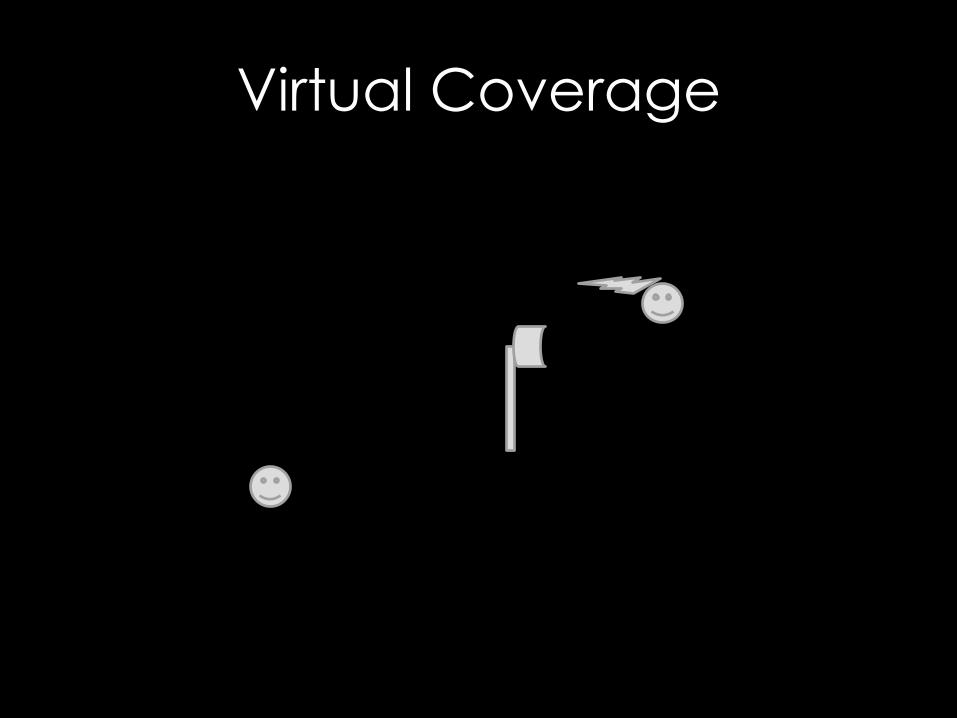
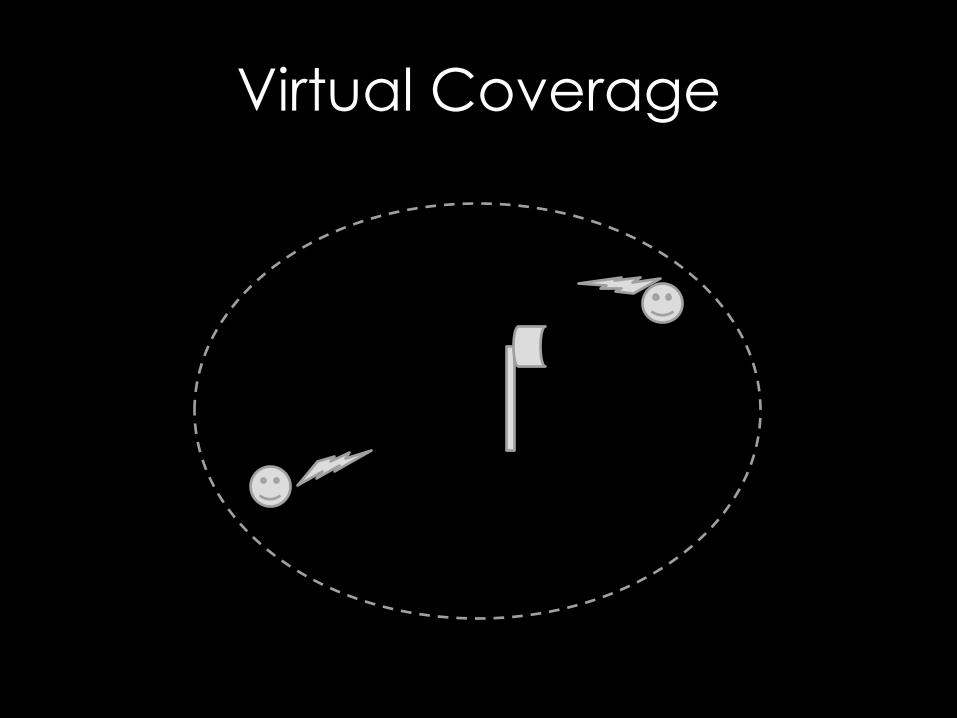
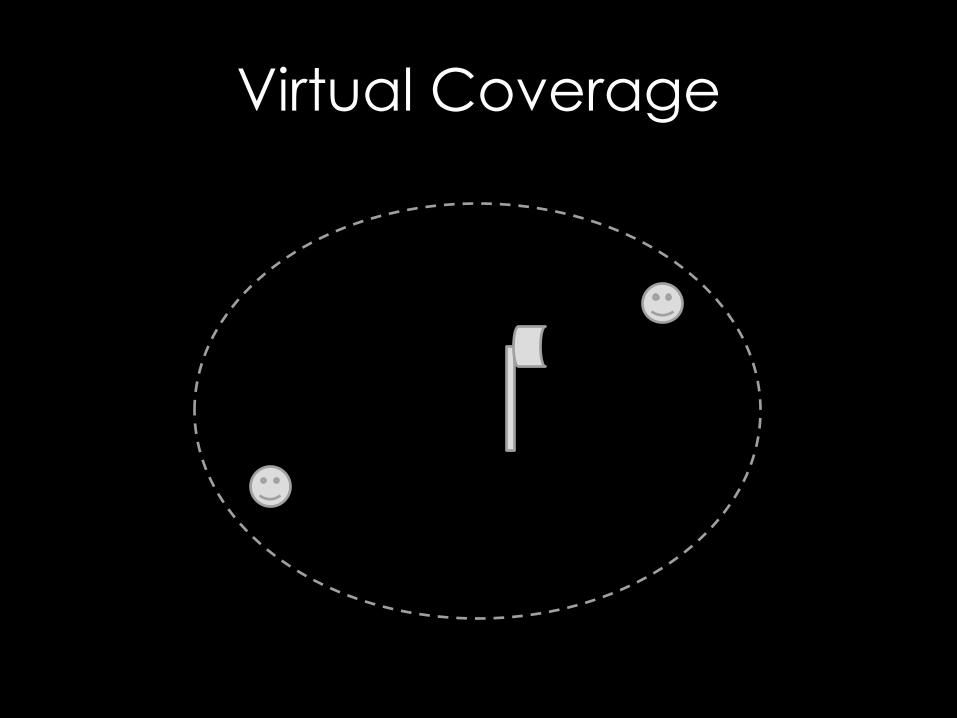
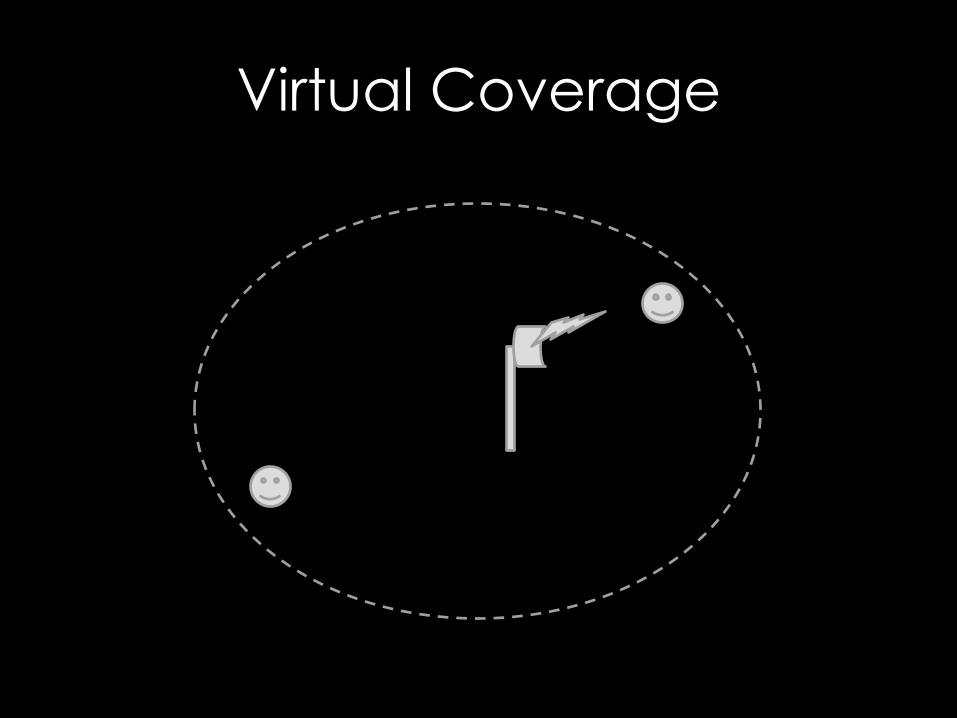
We call this “Virtual Coverage”
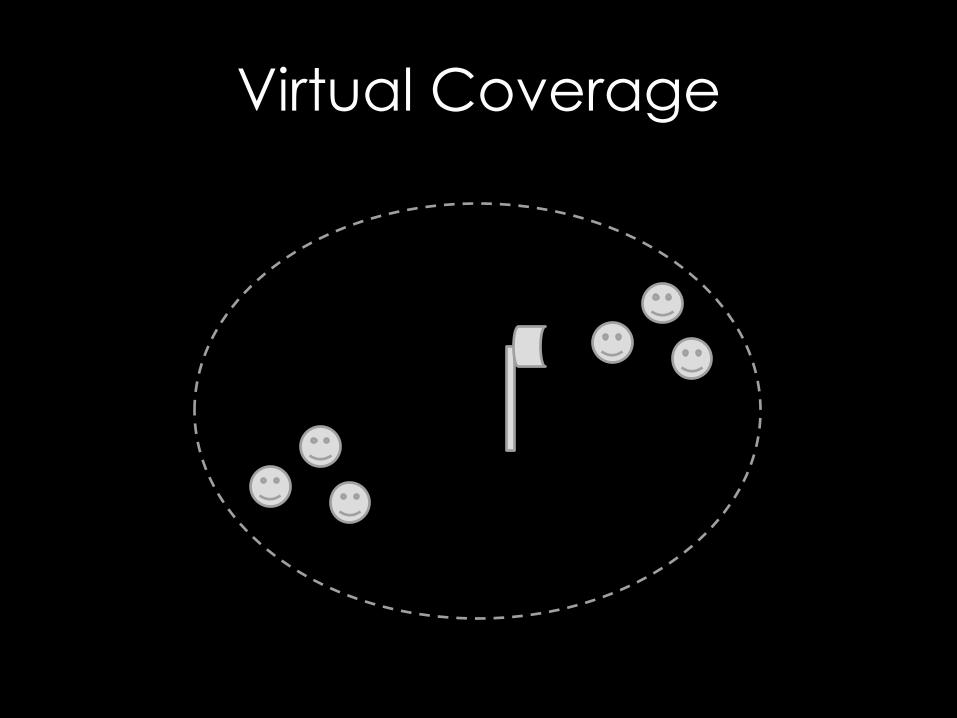
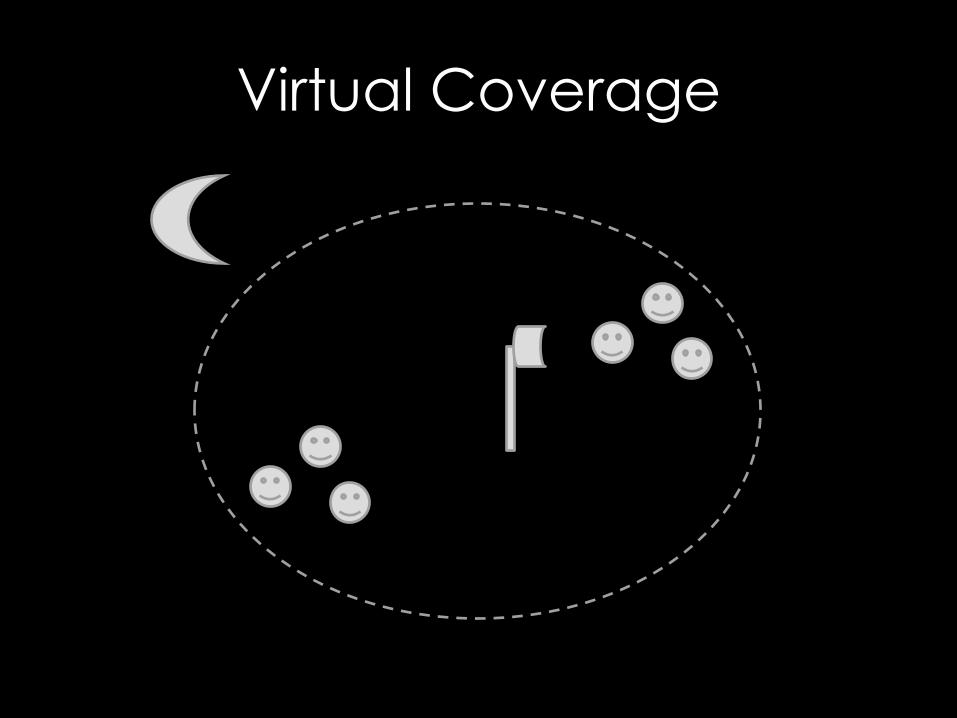
Virtual Coverage
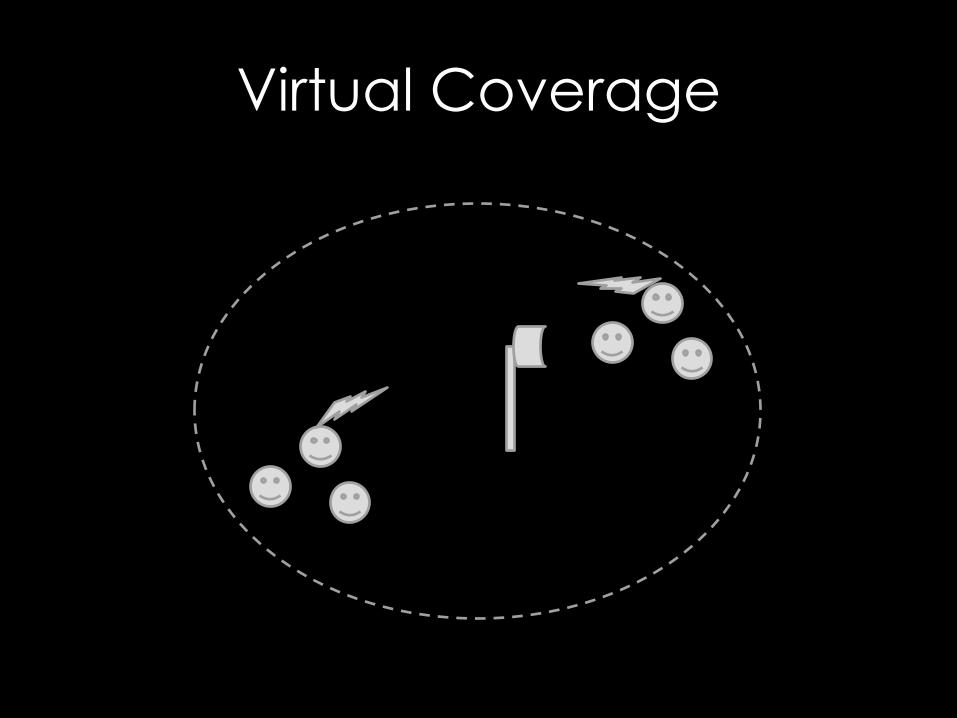
Virtual Coverage
Virtual Coverage

Virtual Coverage
Virtual Coverage
Virtual Coverage

Virtual Coverage
Virtual Coverage
Virtual Coverage

Virtual Coverage

Virtual Coverage
Virtual Coverage
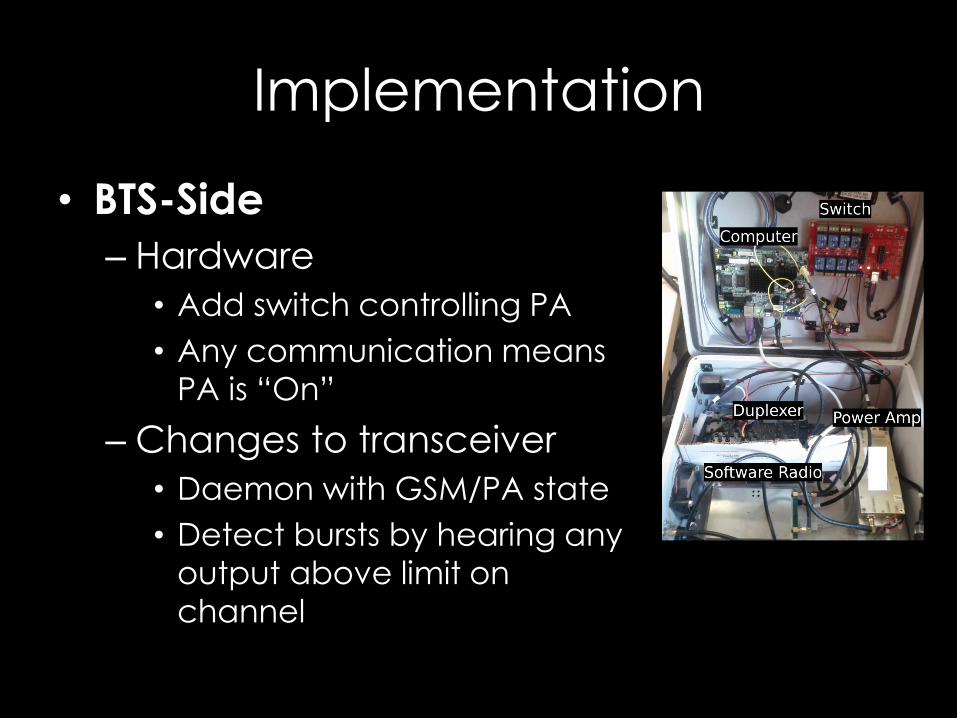
Implementation
• BTS-Side
– Hardware
• Add switch controlling PA
• Any communication means
PA is “On”
– Changes to transceiver
• Daemon with GSM/PA state
• Detect bursts by hearing any
output above limit on
channel

Implementation
• User-side: Outgoing
– How to send burst to BTS?
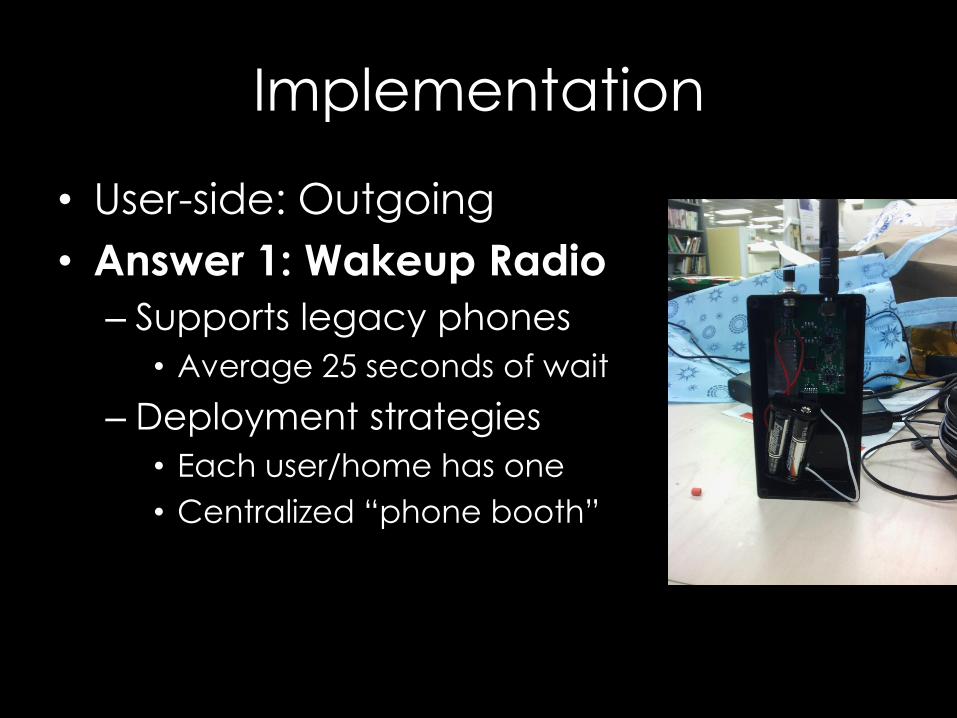
Implementation
• User-side: Outgoing
• Answer 1: Wakeup Radio
– Supports legacy phones
• Average 25 seconds of wait
– Deployment strategies
• Each user/home has one
• Centralized “phone booth”
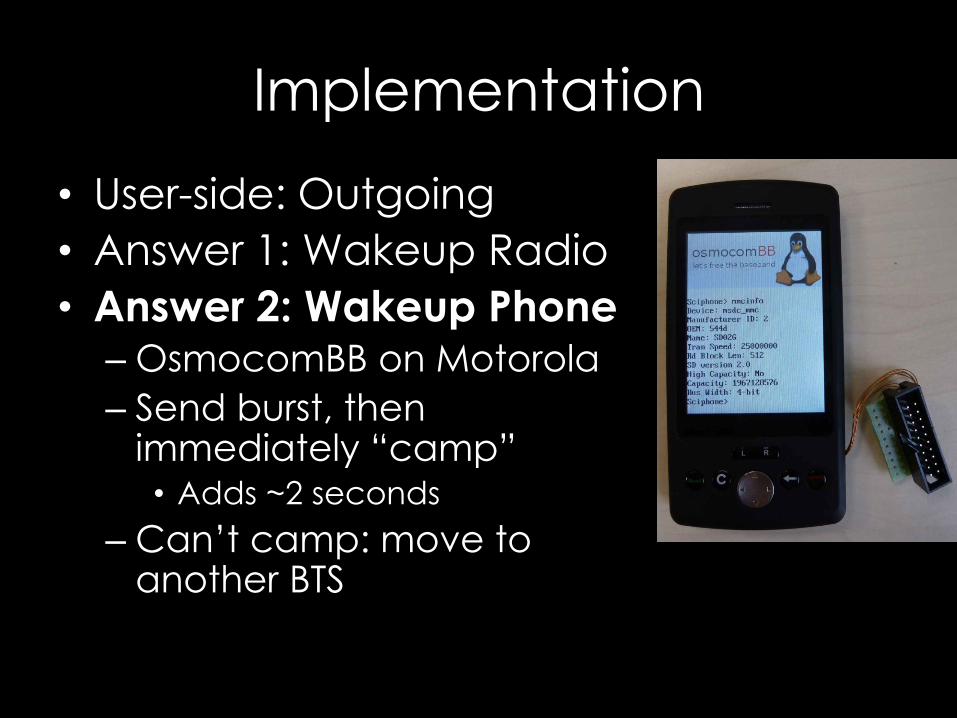
Implementation
• User-side: Outgoing
• Answer 1: Wakeup Radio
• Answer 2: Wakeup Phone – OsmocomBB on Motorola
– Send burst, then immediately “camp” • Adds ~2 seconds
– Can’t camp: move to another BTS
Implementation
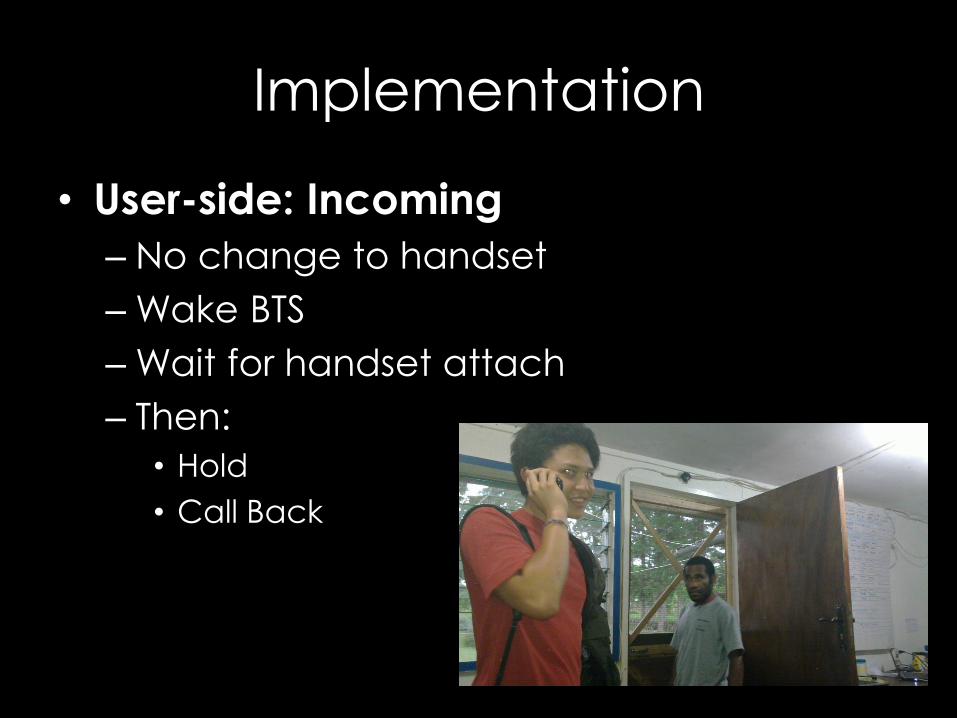
• User-side: Incoming
– No change to handset
– Wake BTS
– Wait for handset attach
– Then:
• Hold
• Call Back
User Impact
• Fundamental change:
– Involve users in power provisioning
– Prior research has shown that users in rural
areas often know more about their
networks (1)
1) K. Heimerl and T. S. Parikh. How
users understand cellular
infrastructure.
Technical Details
There’s a lot of technical details (GSM camping, timings, etc)
we’ve omitted for time/space. Read the paper!
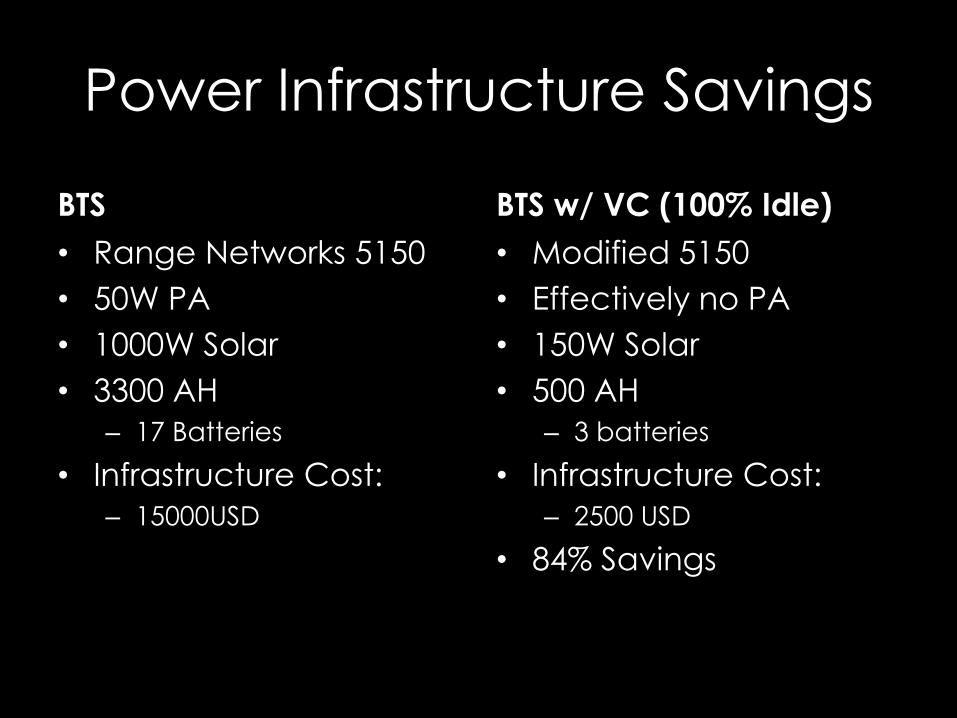
Power Infrastructure Savings
BTS
• Range Networks 5150
• 50W PA
• 1000W Solar
• 3300 AH
– 17 Batteries
• Infrastructure Cost:
– 15000USD
BTS w/ VC (100% Idle)
• Modified 5150
• Effectively no PA
• 150W Solar
• 500 AH
– 3 batteries
• Infrastructure Cost:
– 2500 USD
• 84% Savings
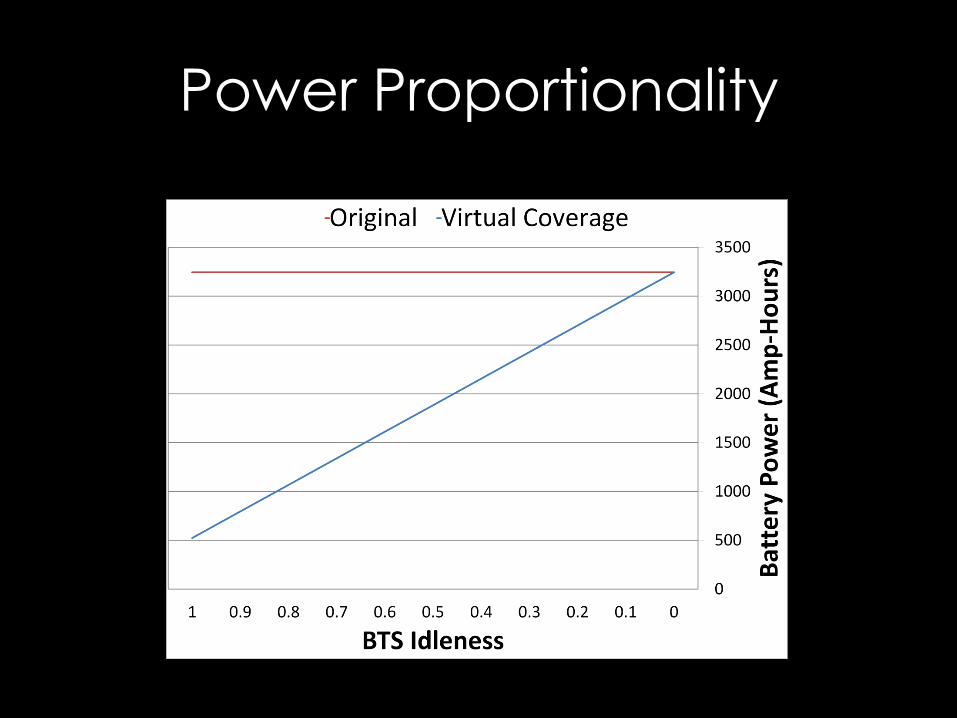
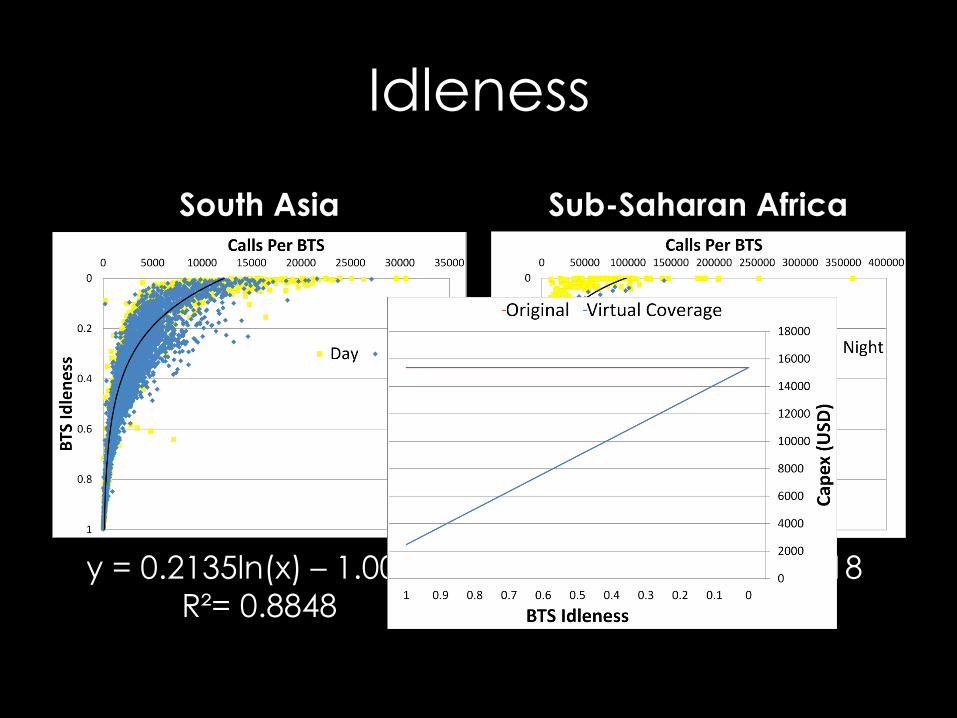
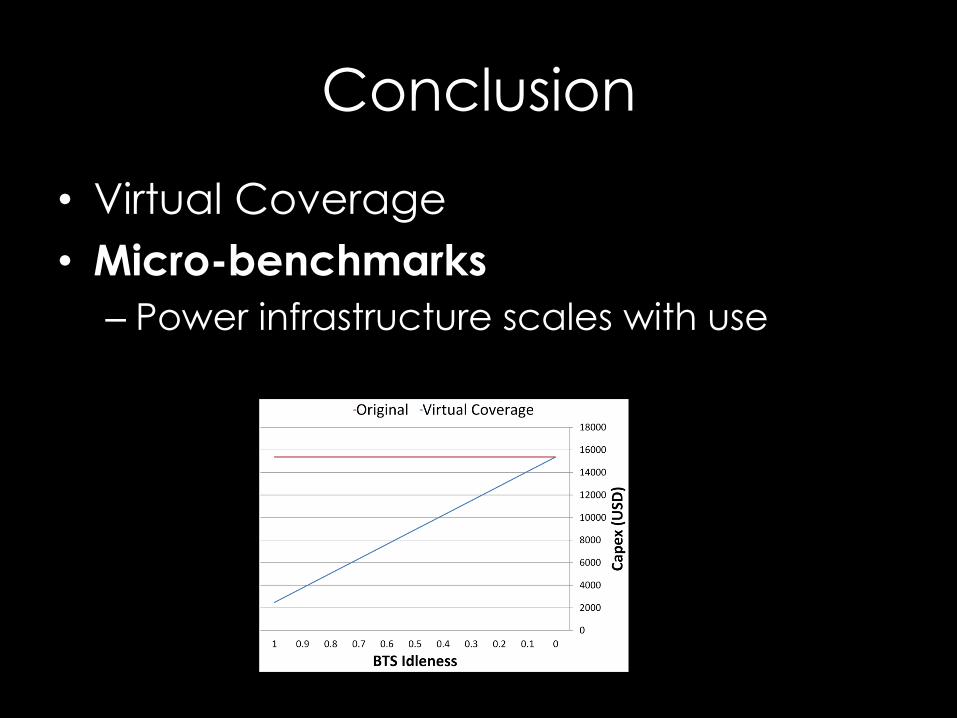
Power Proportionality
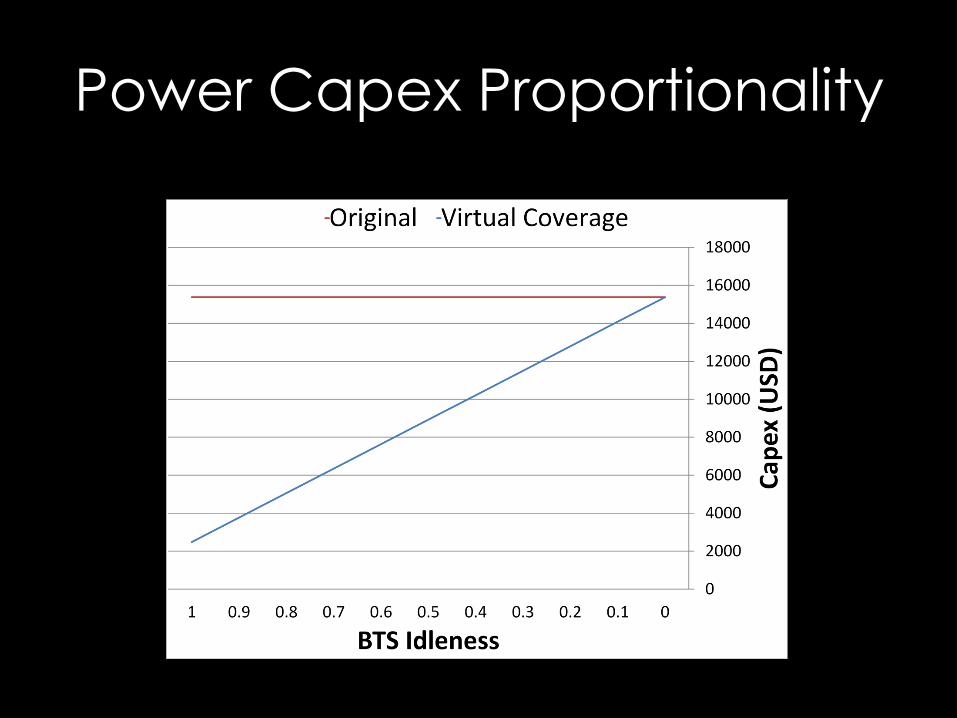
Power Capex Proportionality
How idle are cellular
networks?
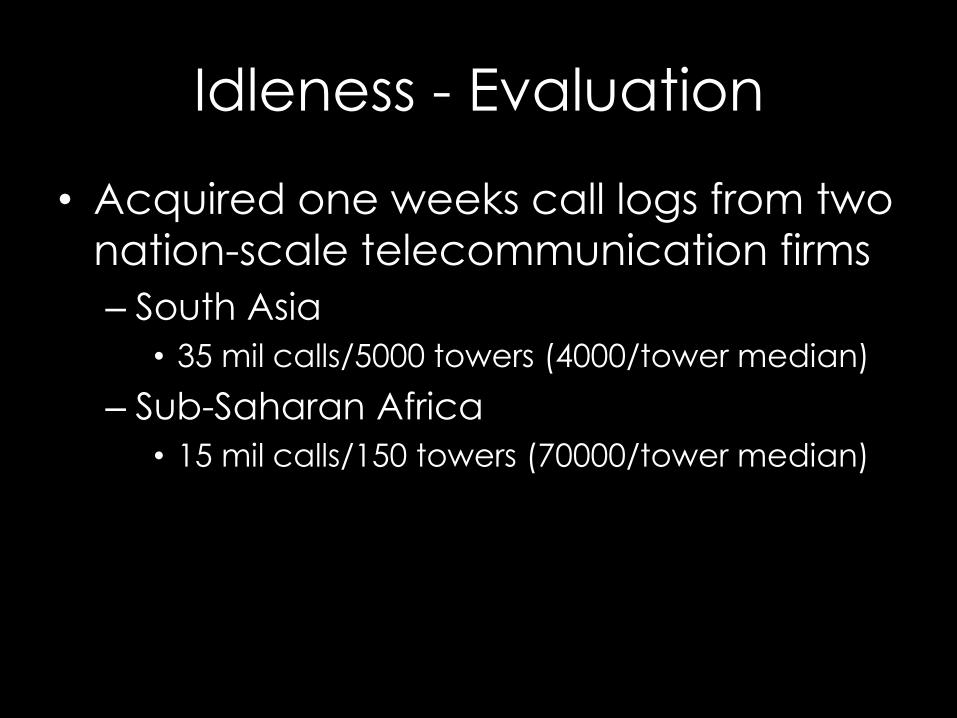
Idleness - Evaluation
• Acquired one weeks call logs from two
nation-scale telecommunication firms
– South Asia
• 35 mil calls/5000 towers (4000/tower median)
– Sub-Saharan Africa
• 15 mil calls/150 towers (70000/tower median)
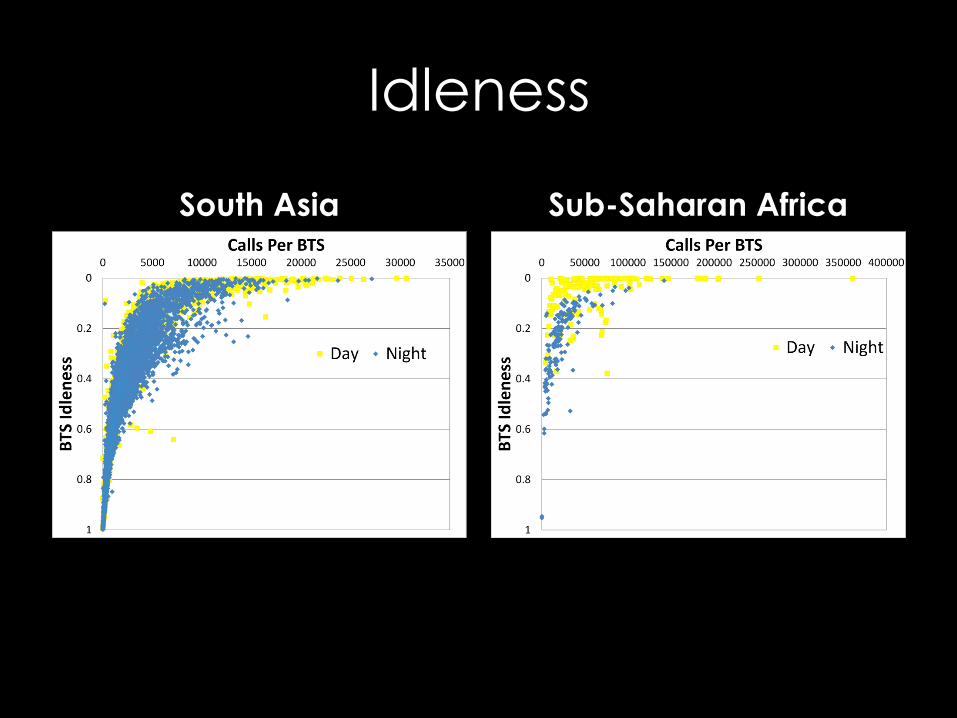
Idleness
South Asia Sub-Saharan Africa
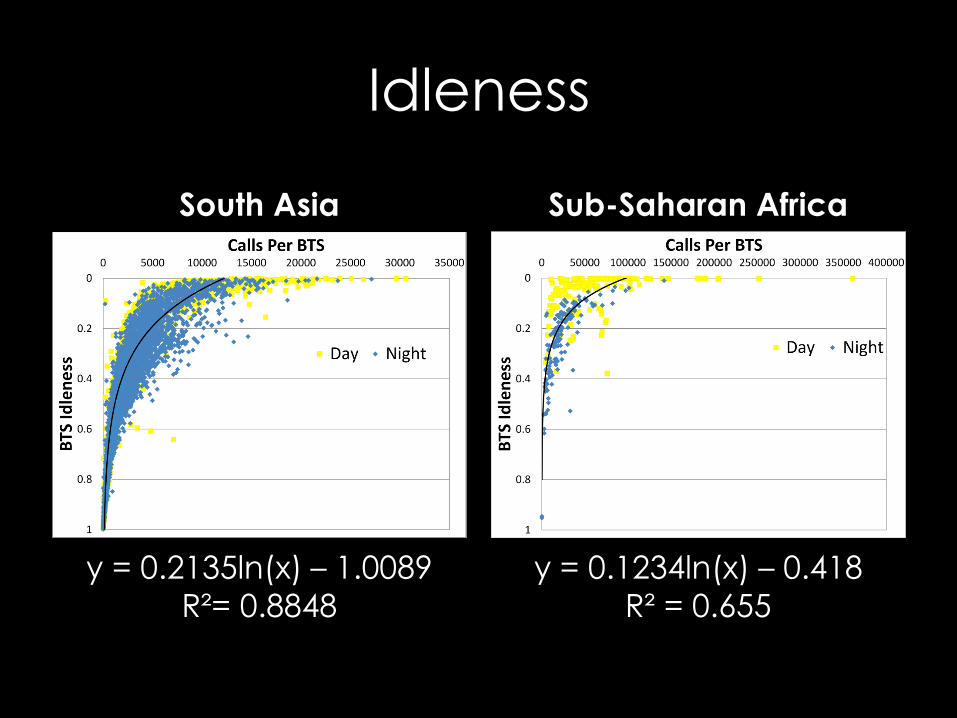
Idleness
South Asia Sub-Saharan Africa
y = 0.2135ln(x) – 1.0089
R²= 0.8848
y = 0.1234ln(x) – 0.418
R² = 0.655
Idleness
South Asia Sub-Saharan Africa
y = 0.2135ln(x) – 1.0089
R²= 0.8848
y = 0.1234ln(x) – 0.418
R² = 0.655
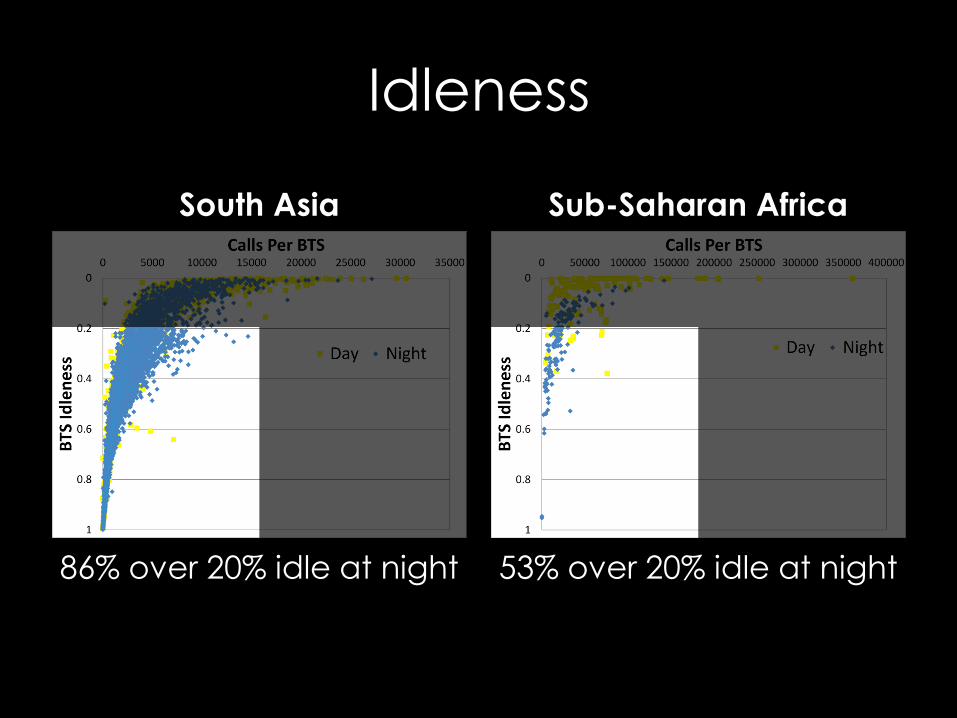
Idleness
South Asia Sub-Saharan Africa
86% over 20% idle at night 53% over 20% idle at night
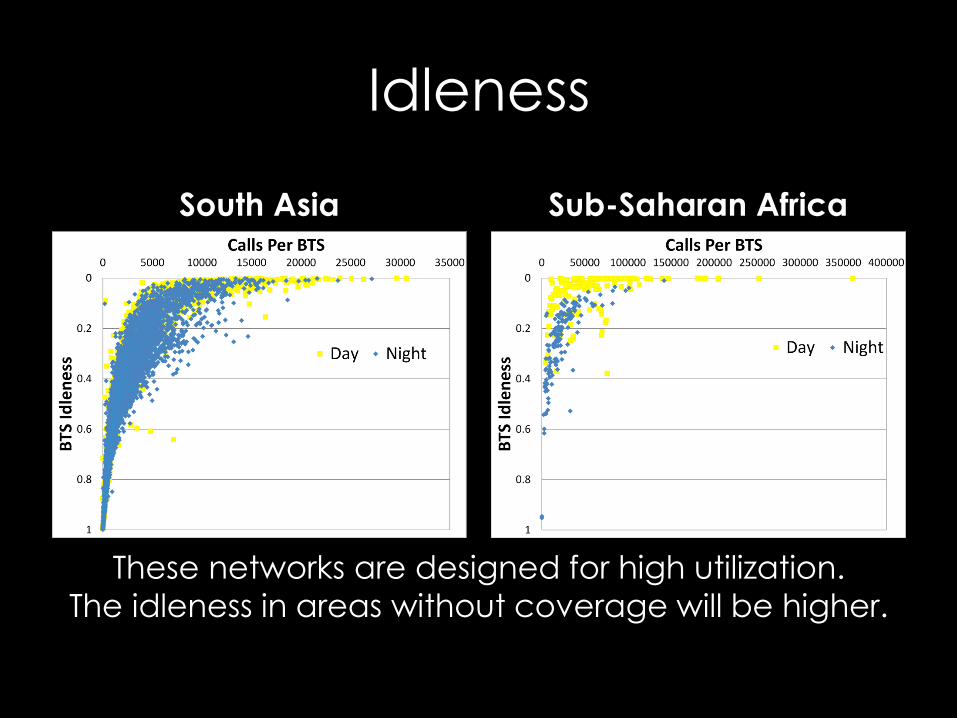
Idleness
South Asia Sub-Saharan Africa
These networks are designed for high utilization.
The idleness in areas without coverage will be higher.
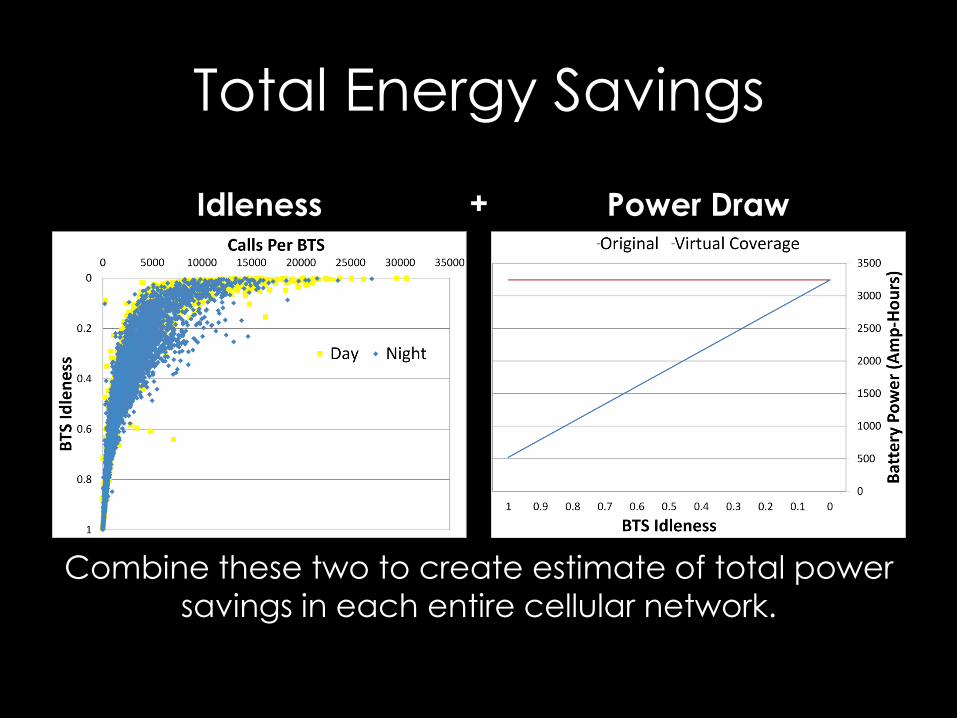
Total Energy Savings
Idleness Power Draw
Combine these two to create estimate of total power
savings in each entire cellular network.
+
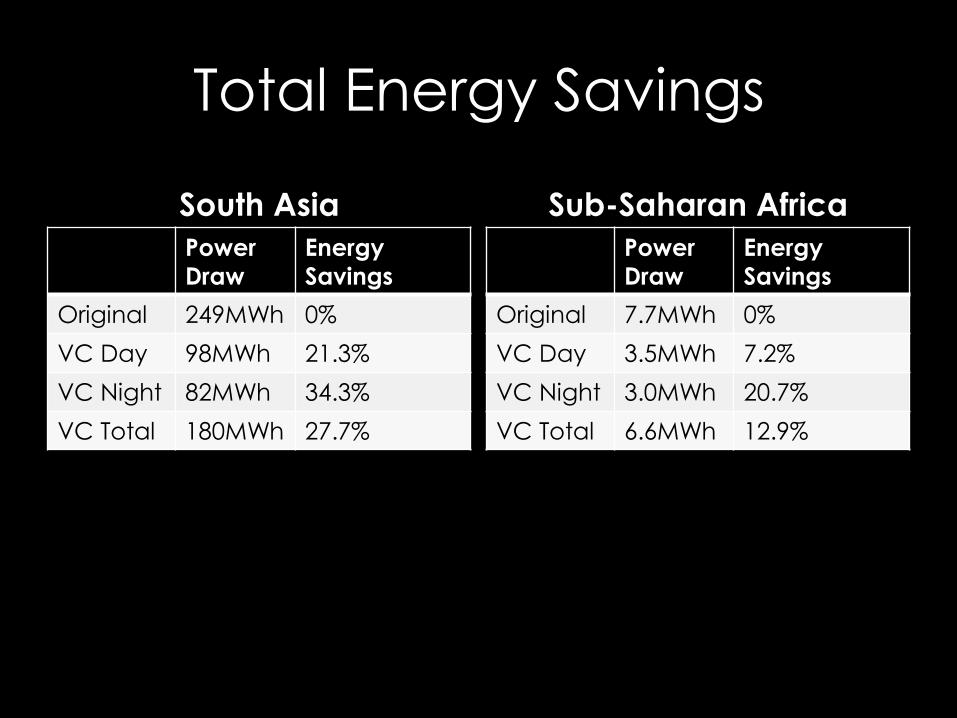
Total Energy Savings
South Asia
Power
Draw
Energy
Savings
Original 249MWh 0%
VC Day 98MWh 21.3%
VC Night 82MWh 34.3%
VC Total 180MWh 27.7%
Sub-Saharan Africa
Power
Draw
Energy
Savings
Original 7.7MWh 0%
VC Day 3.5MWh 7.2%
VC Night 3.0MWh 20.7%
VC Total 6.6MWh 12.9%
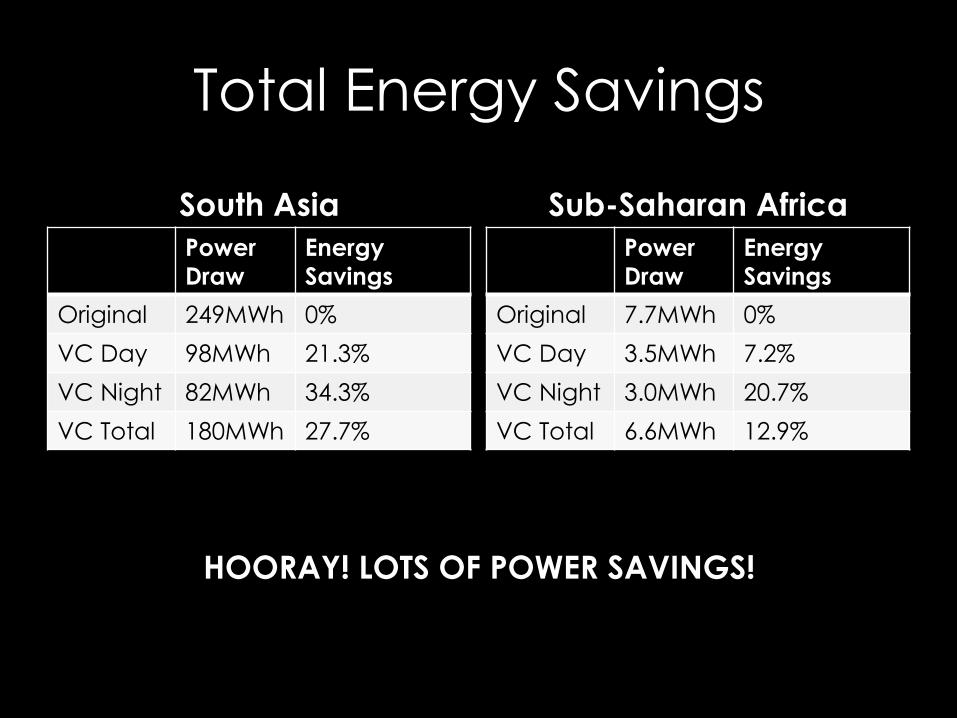
Total Energy Savings
South Asia
Power
Draw
Energy
Savings
Original 249MWh 0%
VC Day 98MWh 21.3%
VC Night 82MWh 34.3%
VC Total 180MWh 27.7%
Sub-Saharan Africa
Power
Draw
Energy
Savings
Original 7.7MWh 0%
VC Day 3.5MWh 7.2%
VC Night 3.0MWh 20.7%
VC Total 6.6MWh 12.9%
HOORAY! LOTS OF POWER SAVINGS!

Bringing it all Together
• 28% power savings for existing network
– Effectively an “lower bound” on idleness
– If you can build a tower with 20% idleness,
you will!
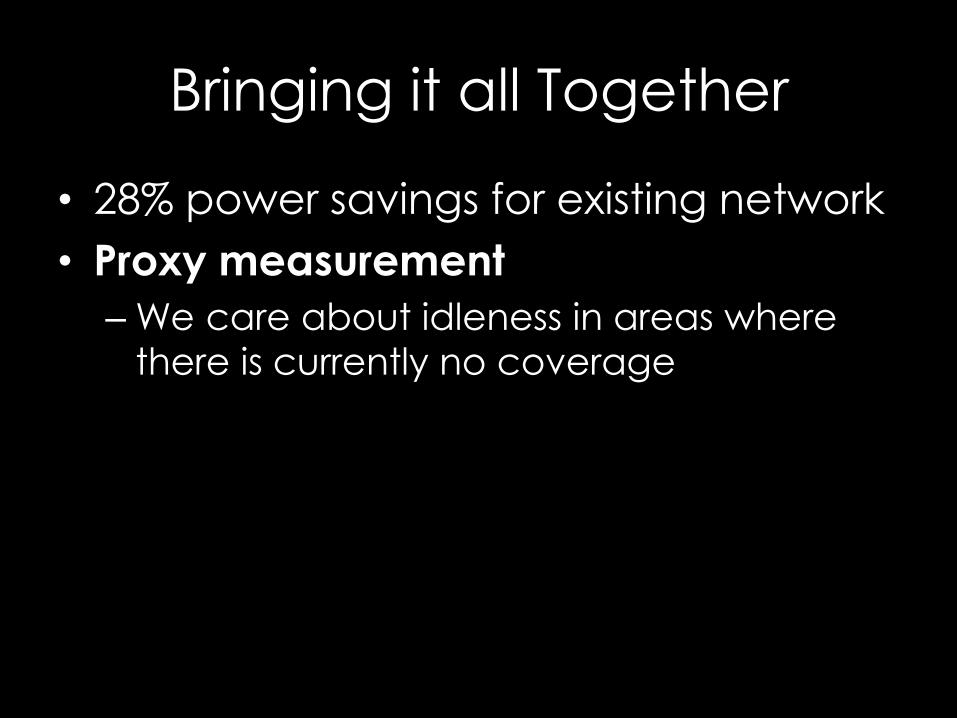
Bringing it all Together
• 28% power savings for existing network
• Proxy measurement
– We care about idleness in areas where
there is currently no coverage
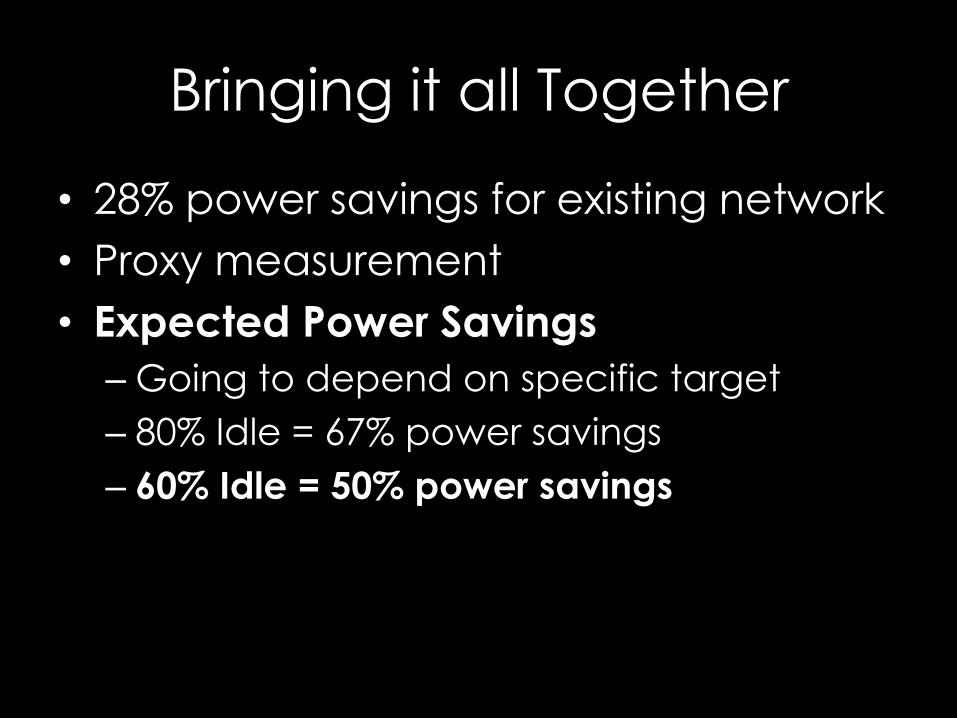
Bringing it all Together
• 28% power savings for existing network
• Proxy measurement
• Expected Power Savings
– Going to depend on specific target
– 80% Idle = 67% power savings
– 60% Idle = 50% power savings
Our Goal:
Reduce GSM base station
(BTS) power draw; reducing
the cost of rural installations
Result:
Virtual coverage reduces the
power of a BTS by up to 84%,
with an expectation of > 50%
Conclusion
• Virtual Coverage
– Involve users in power decisions
– Save power with GSM “idle” mode
Conclusion
• Virtual Coverage
• Micro-benchmarks
– Power infrastructure scales with use
Conclusion
• Virtual Coverage
• Micro-benchmarks
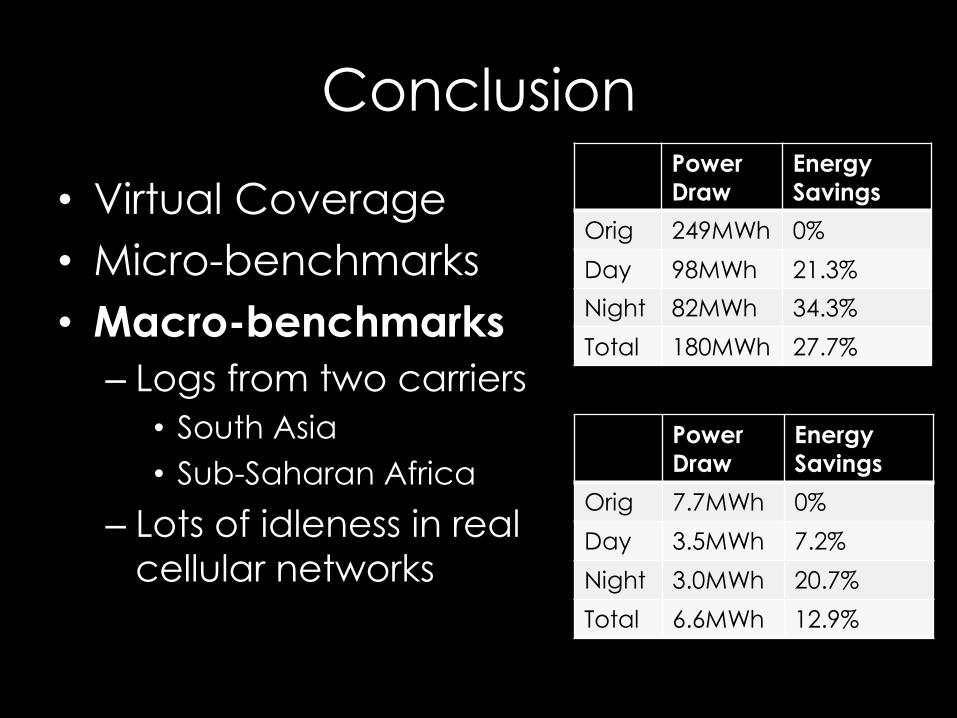
• Macro-benchmarks
– Logs from two carriers
• South Asia
• Sub-Saharan Africa
– Lots of idleness in real
cellular networks
Power
Draw
Energy
Savings
Orig 249MWh 0%
Day 98MWh 21.3%
Night 82MWh 34.3%
Total 180MWh 27.7%
Power
Draw
Energy
Savings
Orig 7.7MWh 0%
Day 3.5MWh 7.2%
Night 3.0MWh 20.7%
Total 6.6MWh 12.9%
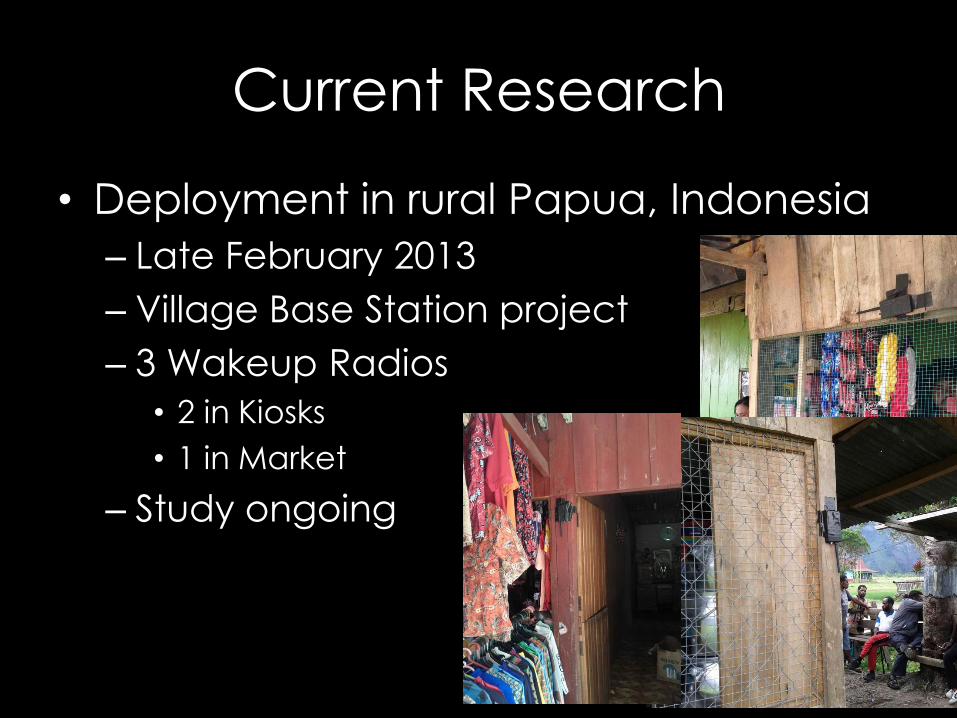
Current Research
• Deployment in rural Papua, Indonesia
– Late February 2013
– Village Base Station project
– 3 Wakeup Radios
• 2 in Kiosks
• 1 in Market
– Study ongoing
Demo Today at 6!
Questions?
Kurtis Heimerl
Email: [email protected]
Twitter: @kheimerl
Web: http://cs.berkeley.edu/~kheimerl
Backup slides
Camping
• Phone scans band
– Finds specific ARFCN
• Sends message
– RACCH
• BTS Responds
– CCCH
• Every N minutes
– Configured by BTS
Implementation
• User-side: SMS/Data
1. Virtual Coverage
• Nothing about our technique depends on
the communications themselves

Implementation
• User-side: SMS/Data
1. Virtual Coverage
2. Sync during other activity
• SMS/Data both Asynchronous
• Periodic updates if no other activity
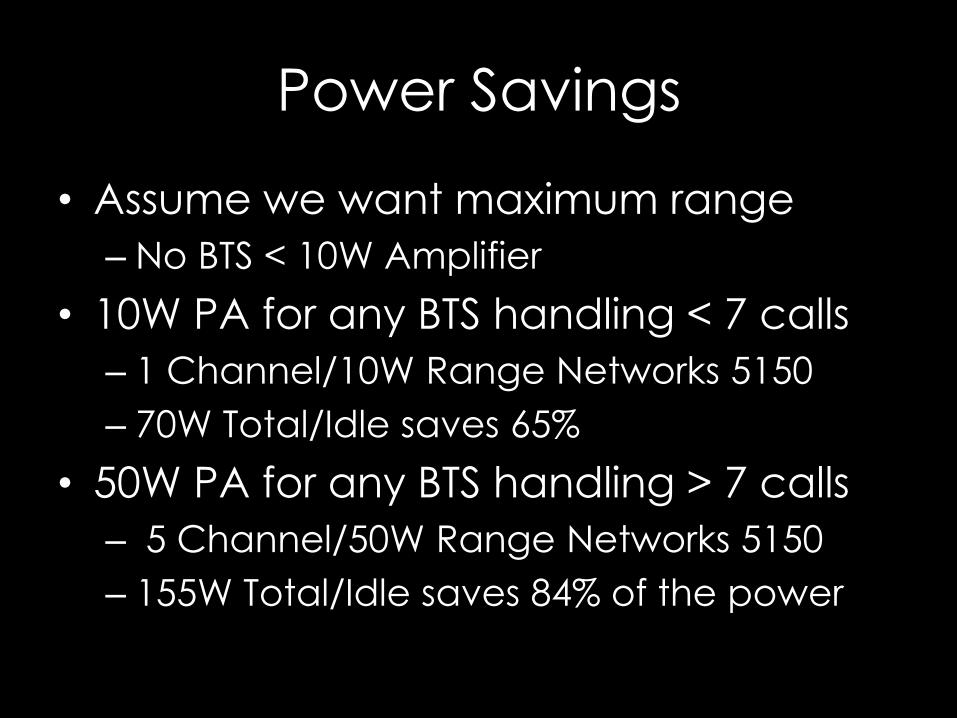
Power Savings
• Assume we want maximum range
– No BTS < 10W Amplifier
• 10W PA for any BTS handling < 7 calls
– 1 Channel/10W Range Networks 5150
– 70W Total/Idle saves 65%
• 50W PA for any BTS handling > 7 calls
– 5 Channel/50W Range Networks 5150
– 155W Total/Idle saves 84% of the power
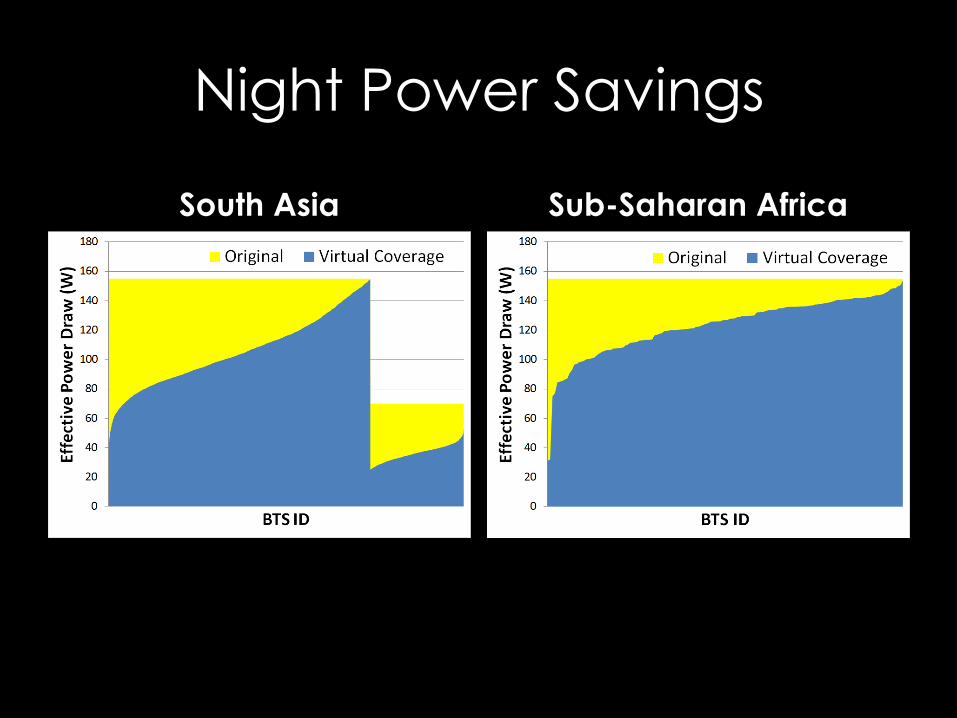
Night Power Savings
South Asia Sub-Saharan Africa
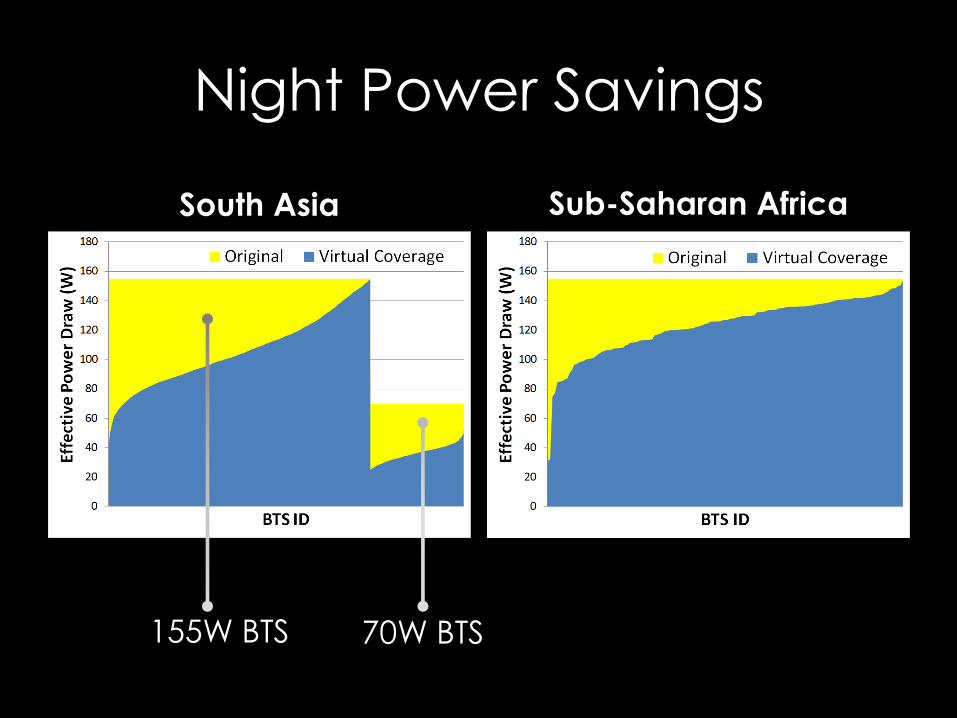
Night Power Savings
South Asia Sub-Saharan Africa
155W BTS 70W BTS
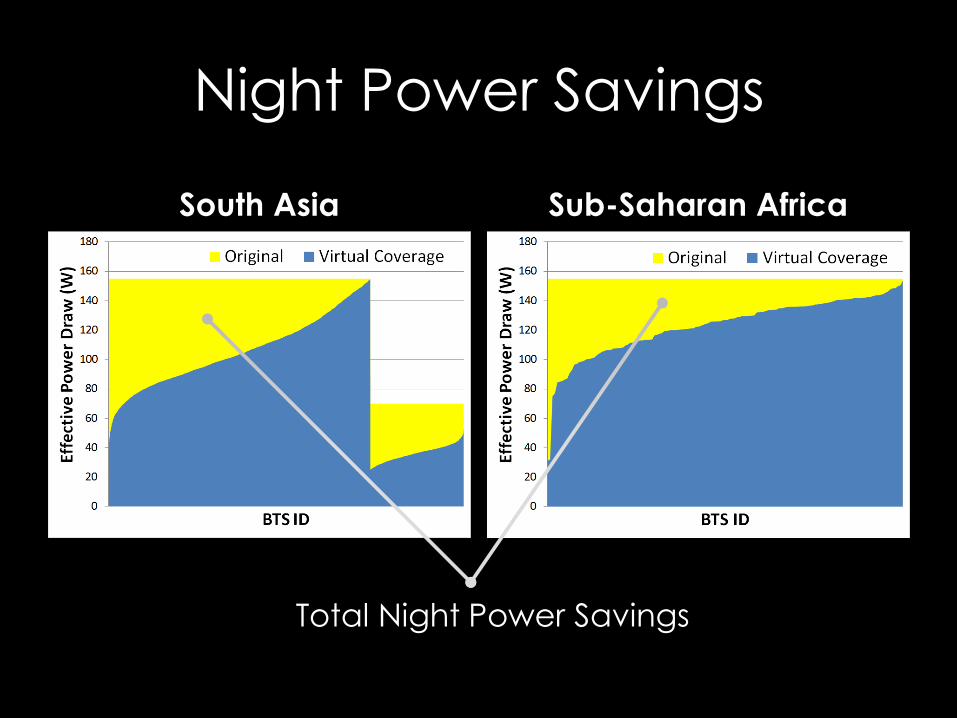
Night Power Savings
South Asia Sub-Saharan Africa
Total Night Power Savings