1 balanced scorecard domain school tracy k. iseler osd – logistics systems management may 1, 2003
TRANSCRIPT

1
Balanced Scorecard Domain School
Tracy K. IselerOSD – Logistics Systems Management
May 1, 2003

2
Agenda
Why is Performance Measurement/Balanced Scorecard important?
What are some tools and techniques to get started?
DoD Logistics Balanced Scorecard
Questions and Discussion
Appendix

3
Agenda
Why is Performance Measurement/Balanced Scorecard important?
What are some tools and techniques to get started?
DoD Logistics Balanced Scorecard
Questions and Discussion
Appendix
4
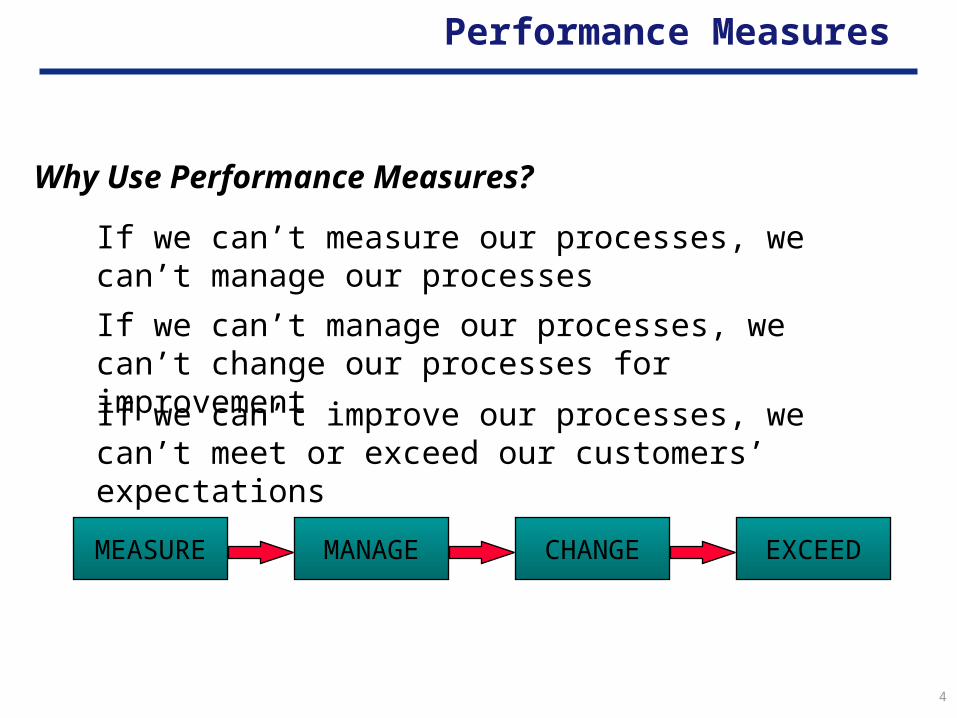
Why Use Performance Measures?
MEASURE MANAGE
If we can’t measure our processes, we can’t manage our processes
CHANGE
If we can’t manage our processes, we can’t change our processes for improvement
If we can’t improve our processes, we can’t meet or exceed our customers’ expectations
EXCEED
Performance Measures
5
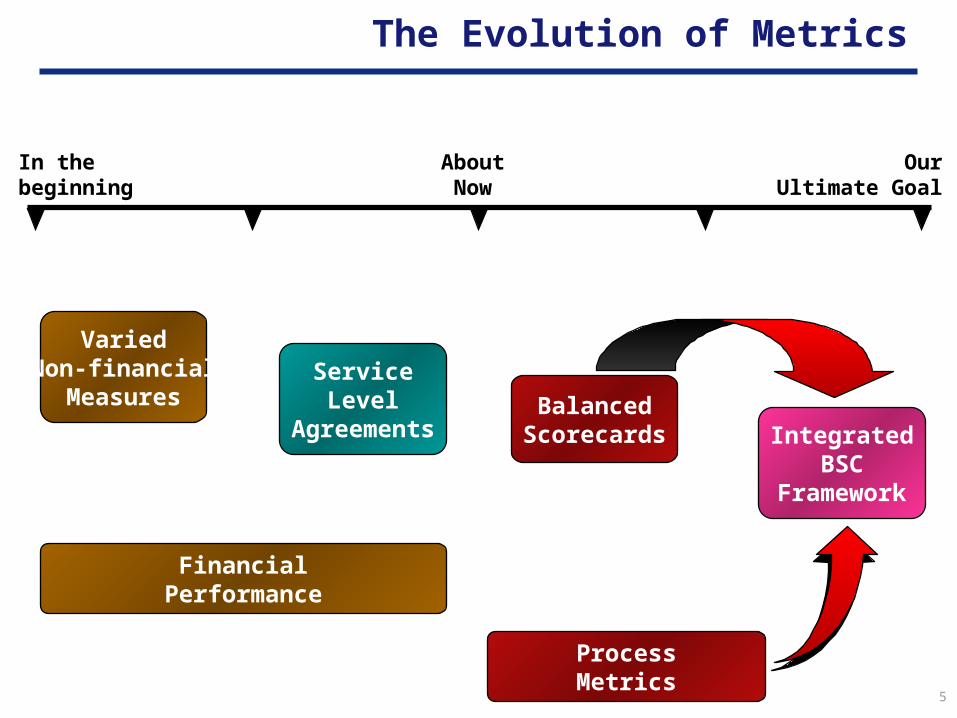
The Evolution of Metrics
In thebeginning
AboutNow
OurUltimate Goal
FinancialPerformance
VariedNon-financial
MeasuresServiceLevel
AgreementsBalanced
Scorecards IntegratedBSC
Framework
ProcessMetrics
6
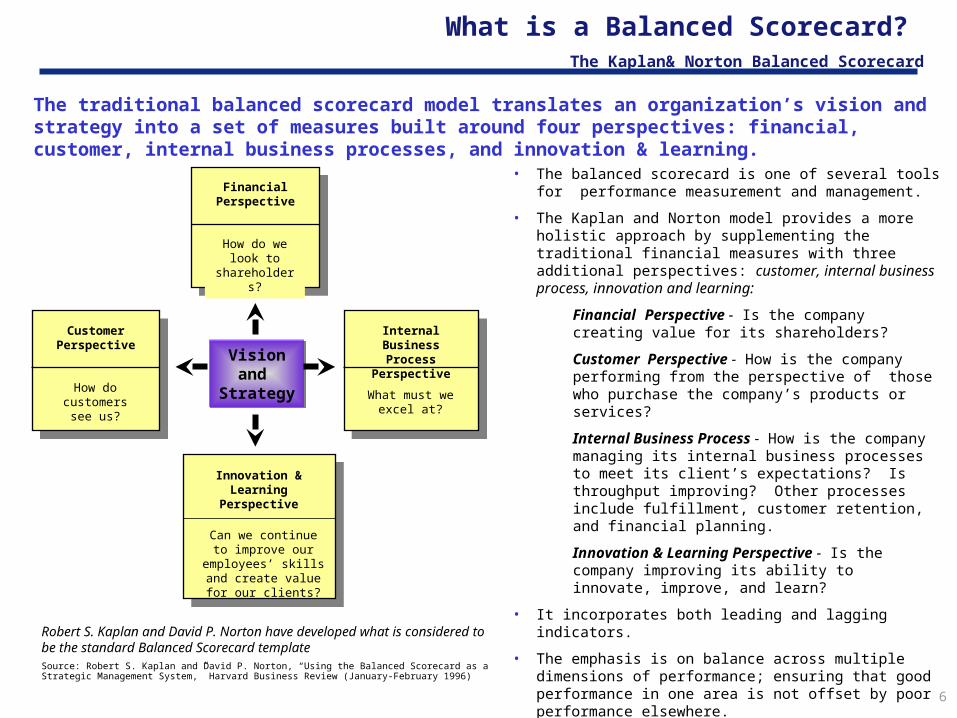
The traditional balanced scorecard model translates an organization’s vision and strategy into a set of measures built around four perspectives: financial, customer, internal business processes, and innovation & learning.
• The balanced scorecard is one of several tools for performance measurement and management.
• The Kaplan and Norton model provides a more holistic approach by supplementing the traditional financial measures with three additional perspectives: customer, internal business process, innovation and learning:
Financial Perspective - Is the company creating value for its shareholders?
Customer Perspective - How is the company performing from the perspective of those who purchase the company’s products or services?
Internal Business Process - How is the company managing its internal business processes to meet its client’s expectations? Is throughput improving? Other processes include fulfillment, customer retention, and financial planning.
Innovation & Learning Perspective - Is the company improving its ability to innovate, improve, and learn?
• It incorporates both leading and lagging indicators.
• The emphasis is on balance across multiple dimensions of performance; ensuring that good performance in one area is not offset by poor performance elsewhere.
• The strategy drives the choice of performance measures. A failure to meet targets could be because the strategy is wrong
What is a Balanced Scorecard? The Kaplan& Norton Balanced Scorecard
Robert S. Kaplan and David P. Norton have developed what is considered to be the standard Balanced Scorecard template
Customer Perspective
How do customers see
us?
Internal Business Process
Perspective
What must we excel at?
FinancialPerspective
How do we look to
shareholders?
Innovation & Learning
Perspective
Can we continue to improve our
employees’ skills and create value for our
clients?
Visionand
Strategy
Visionand
Strategy
Source: Robert S. Kaplan and David P. Norton, “Using the Balanced Scorecard as a Strategic Management System,” Harvard Business Review (January-February 1996)

7
A Balanced Scorecard...• Measures the progress of an organization toward its
strategic goals by translating their vision and objectives into tactics and measures across a balanced set of perspectives
• Captures the expectations of customers and measures the company’s ability to meet them
• Translates Strategy, Mission and Vision into tangible measures for use by decision makers through to line workers
• Is the culmination of a sophisticated data gathering and analysis process and system
• Can and will drive the process of change, so it must be right!
Components of the Balanced Scorecard• Perspectives: Four top-down perspectives on enterprise
performance (Financial, Internal Business Process, Innovation & Learning, Customer)
Objectives: What the company needs to do to accomplish its strategy; one guideline is to have up to sixteen measurable objectives.
Metrics: Actionable and tangible measurements which support achieving objectives; this is what makes it real.
Targets: Performance level expectations set against the strategic plan. For each metric, set a goal or plan so progress against the objective can be evaluated.
A balanced scorecard is a strategic measurement and management system that can motivate breakthrough performance.
Source: Robert S. Kaplan and David P. Norton, “Using the Balanced Scorecard as a Strategic Management System,” Harvard Business Review (January-February 1996)
To satisfy our shareholders and customers, what business processes must we excel at?
Objectives Measures
Internal Business Process Perspective
TargetsTo achieve our strategy, how should we appear to our customers?
Customer Perspective
Objectives TargetsMeasures
To achieve our strategy, how will we sustain our ability to change and improve?
Innovation & Learning Perspective
Objectives TargetsMeasures
To succeed financially, how should we appear to our shareholders?
Financial Perspective
Objectives TargetsMeasures
What is a Balanced Scorecard?Overview of Building a Balanced Scorecard

8
What is a Balanced Scorecard?Overview of Building a Balanced Scorecard
Creating the Balanced Scorecard
Using the Balanced Scorecard
1. Business StrategyStart with the Business Strategy, which should be a bold, future-oriented statement
2. Business ObjectivesDevelop key business objectives that will help you to attain your strategy
3. Measures & MetricsDevelop specific measures and metrics to track progress 4. Implement
Gather measures, create the balanced scorecard and use it to make decisions. Incorporate a continuous improvement philosophy in the process
The process of creating a balanced scorecard starts with the business strategy, and progressively breaks that strategy into tactical measures.
Use strategy to identify the objectives
Use objectives to identify the
measures that will be used
Use measures to build the
balanced scorecard
Use scorecard to determine if targets are met and the right measures are being measured
Use measures/ metrics to evaluate progress against objectives
Use progress against objectives to confirm strategy
9
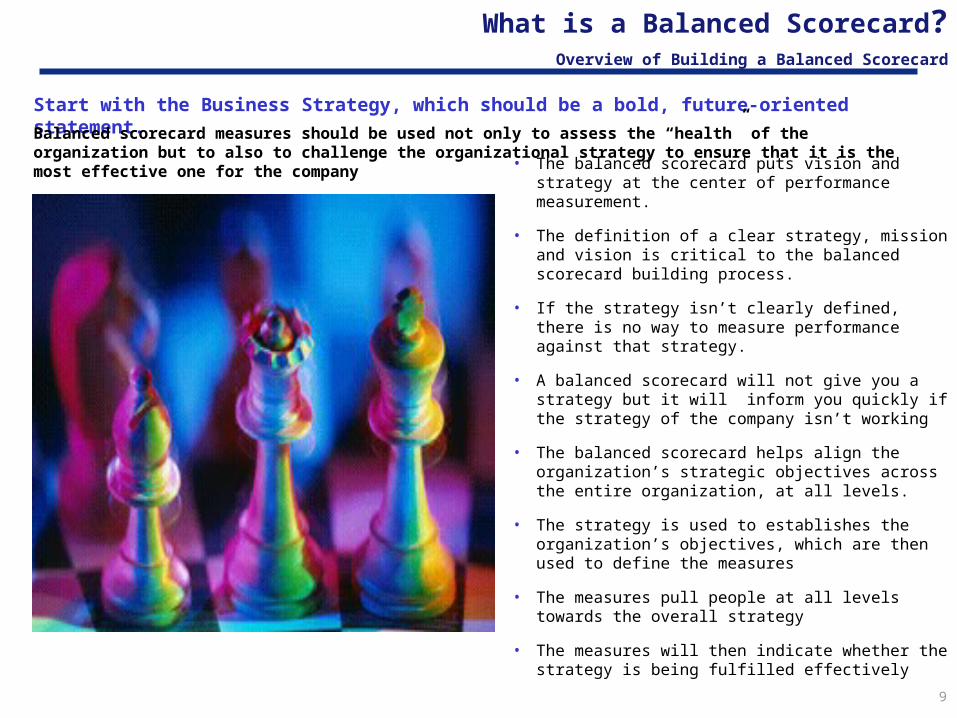
Start with the Business Strategy, which should be a bold, future-oriented statement.
What is a Balanced Scorecard?Overview of Building a Balanced Scorecard
• The balanced scorecard puts vision and strategy at the center of performance measurement.
• The definition of a clear strategy, mission and vision is critical to the balanced scorecard building process.
• If the strategy isn’t clearly defined, there is no way to measure performance against that strategy.
• A balanced scorecard will not give you a strategy but it will inform you quickly if the strategy of the company isn’t working
• The balanced scorecard helps align the organization’s strategic objectives across the entire organization, at all levels.
• The strategy is used to establishes the organization’s objectives, which are then used to define the measures
• The measures pull people at all levels towards the overall strategy
• The measures will then indicate whether the strategy is being fulfilled effectively
Balanced scorecard measures should be used not only to assess the “health” of the organization but to also to challenge the organizational strategy to ensure that it is the most effective one for the company

10
Develop key business objectives that will help you to attain your strategy.
The diagram illustrates an example of organizational objectives. In the balanced scorecard development process, the organizational objectives should provide a balance across the four dimensions of performance.
—Objectives—
1. Drive rapid revenue growth2. Manage operating costs and profitability3. Achieve profitability4. Effectively utilize assets5. Manage risk6. Improved Shareholder Value
Vision and
Strategy
1. Rapidly penetrate market segments2 Sustain significant customer growth3. Retain customers4. Achieve high customer satisfaction5. Provide extremely positive customer on-line
experience6. Achieve customer satisfaction
1. Develop provocative offers2. Build brand awareness3. Expand distribution4. Drive incremental revenues5. Offer leading high-speed Internet service6. Provide compelling internet experience7. Maintain technological leadership
1. Sustain employee satisfaction2. Maintain employee productivity3. Retain employees4. Innovate operationally5. Measure training quantities6. Measure training effectiveness7. Measure and evaluate innovations
Financial Perspective
Customer Perspective Internal Business Process Perspective
Innovation & Learning Perspective
What is a Balanced Scorecard?Overview of Building a Balanced Scorecard
11
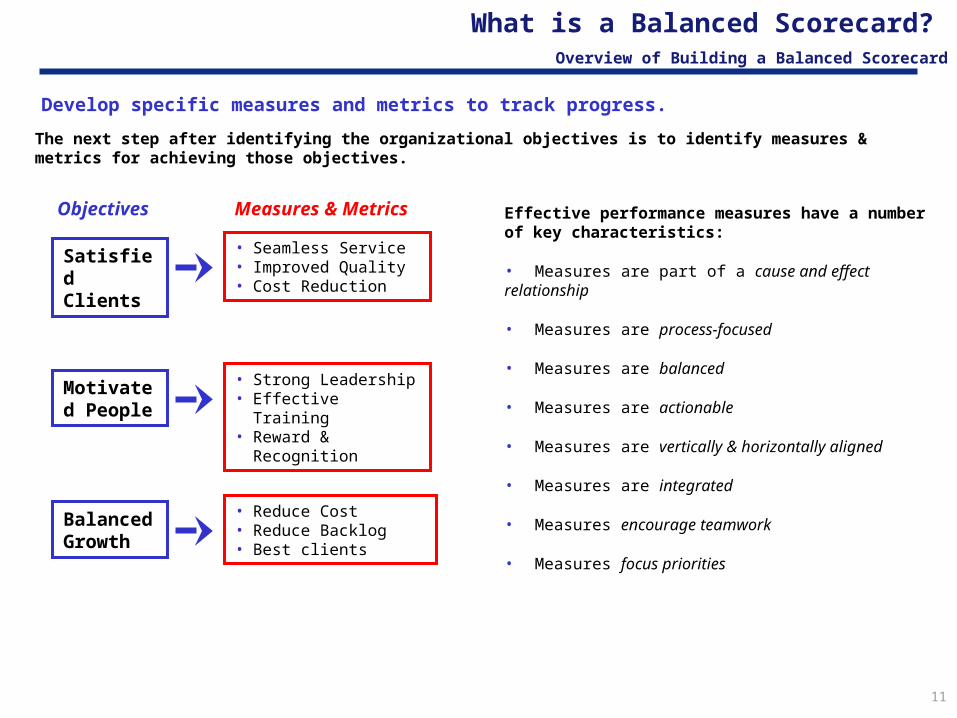
The next step after identifying the organizational objectives is to identify measures & metrics for achieving those objectives.
Develop specific measures and metrics to track progress.
What is a Balanced Scorecard? Overview of Building a Balanced Scorecard
Objectives Measures & Metrics
Satisfied Clients
• Seamless Service• Improved Quality • Cost Reduction
Balanced Growth
• Reduce Cost• Reduce Backlog• Best clients
Motivated People
• Strong Leadership• Effective Training• Reward & Recognition
Effective performance measures have a number of key characteristics:
• Measures are part of a cause and effect relationship
• Measures are process-focused
• Measures are balanced
• Measures are actionable
• Measures are vertically & horizontally aligned
• Measures are integrated
• Measures encourage teamwork
• Measures focus priorities
12
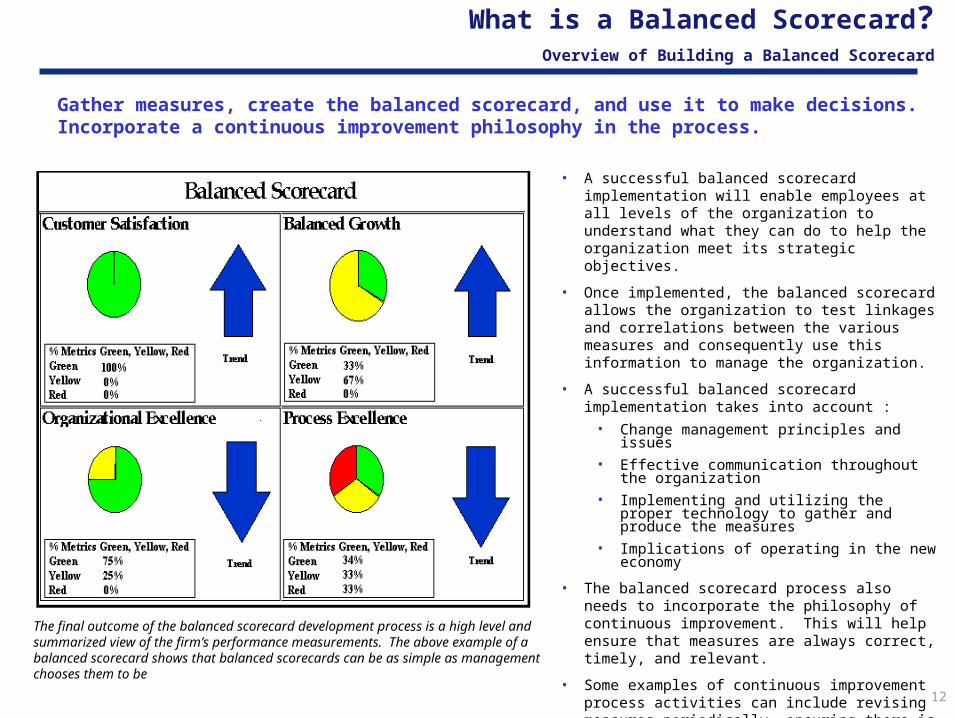
Gather measures, create the balanced scorecard, and use it to make decisions. Incorporate a continuous improvement philosophy in the process.
What is a Balanced Scorecard?Overview of Building a Balanced Scorecard
• A successful balanced scorecard implementation will enable employees at all levels of the organization to understand what they can do to help the organization meet its strategic objectives.
• Once implemented, the balanced scorecard allows the organization to test linkages and correlations between the various measures and consequently use this information to manage the organization.
• A successful balanced scorecard implementation takes into account :
• Change management principles and issues
• Effective communication throughout the organization
• Implementing and utilizing the proper technology to gather and produce the measures
• Implications of operating in the new economy
• The balanced scorecard process also needs to incorporate the philosophy of continuous improvement. This will help ensure that measures are always correct, timely, and relevant.
• Some examples of continuous improvement process activities can include revising measures periodically, ensuring there is a timely feedback, and that there is an effective feedback mechanism in place.The final outcome of the balanced scorecard development process is a high level and
summarized view of the firm’s performance measurements. The above example of a balanced scorecard shows that balanced scorecards can be as simple as management chooses them to be
13
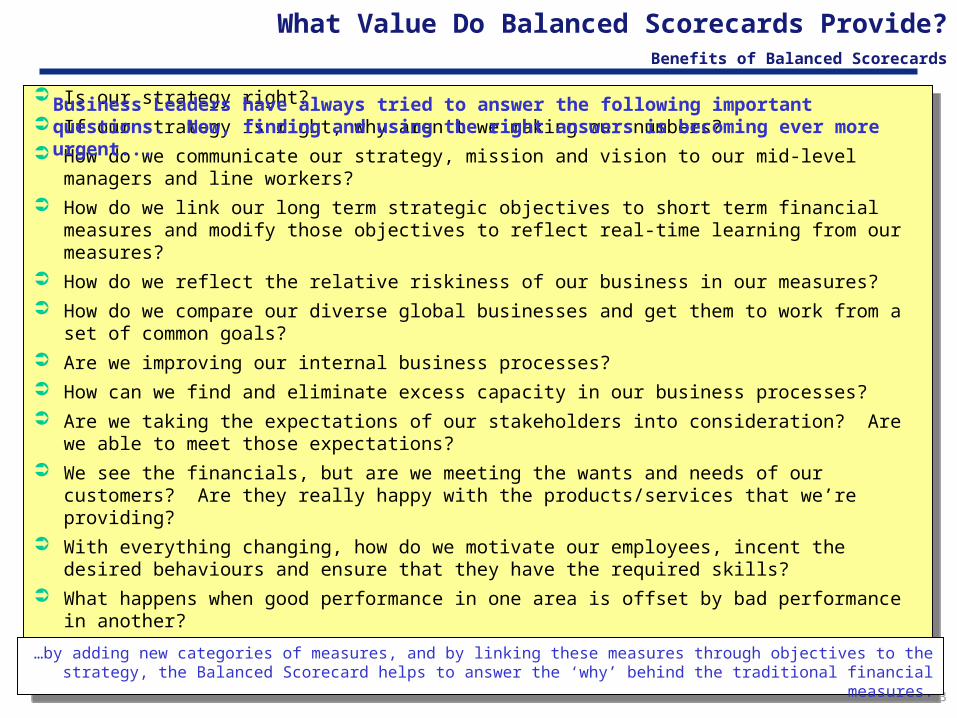
Is our strategy right?
If our strategy is right, why aren’t we making our numbers?
How do we communicate our strategy, mission and vision to our mid-level managers and line workers?
How do we link our long term strategic objectives to short term financial measures and modify those objectives to reflect real-time learning from our measures?
How do we reflect the relative riskiness of our business in our measures?
How do we compare our diverse global businesses and get them to work from a set of common goals?
Are we improving our internal business processes?
How can we find and eliminate excess capacity in our business processes?
Are we taking the expectations of our stakeholders into consideration? Are we able to meet those expectations?
We see the financials, but are we meeting the wants and needs of our customers? Are they really happy with the products/services that we’re providing?
With everything changing, how do we motivate our employees, incent the desired behaviours and ensure that they have the required skills?
What happens when good performance in one area is offset by bad performance in another?
How are my performance measures inter-related?
How do we change our focus to proactive measurement of leading indicators?
…by adding new categories of measures, and by linking these measures through objectives to the strategy, the Balanced Scorecard helps to answer the ‘why’ behind the traditional financial measures.
Business Leaders have always tried to answer the following important questions. Now, finding and using the right answers is becoming ever more urgent...
What Value Do Balanced Scorecards Provide?Benefits of Balanced Scorecards
14
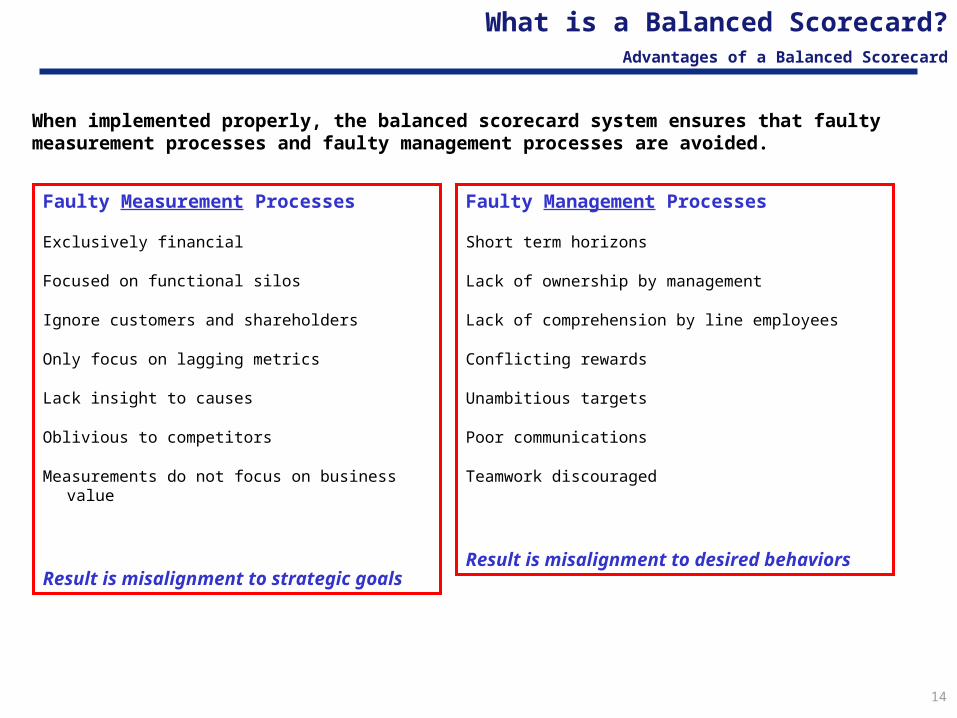
When implemented properly, the balanced scorecard system ensures that faulty measurement processes and faulty management processes are avoided.
Faulty Measurement Processes
Exclusively financial
Focused on functional silos
Ignore customers and shareholders
Only focus on lagging metrics
Lack insight to causes
Oblivious to competitors
Measurements do not focus on business value
Result is misalignment to strategic goals
Faulty Management Processes
Short term horizons
Lack of ownership by management
Lack of comprehension by line employees
Conflicting rewards
Unambitious targets
Poor communications
Teamwork discouraged
Result is misalignment to desired behaviors
What is a Balanced Scorecard?Advantages of a Balanced Scorecard
15
Agenda
Why is Performance Measurement/Balanced Scorecard important?
What are some tools and techniques to get started?
DoD Logistics Balanced Scorecard
Questions and Discussion
Appendix

16
How Do You Build a Balanced Scorecard?Steps in Developing a Balanced Scorecard
Each organization is unique and so ultimately follows its own path for building, implementing, and maintaining a balanced scorecard.
1.0Plan
2.0Design
3.0Build and Test
4.0Deploy
The above chart outlines a step by step process for developing a balanced scorecard. Each organization should custom tailor the process to suit their unique needs.
1.3 Develop an implementation plan & project team
1.1 Develop a clear business strategy
1.2 Identify business objectives
2.2 Identify Measures and Metrics
2.1 Determine Balanced Scorecard architecture
2.3 Define metrics, set targets and identify owners
3.1 Identify linkages and Cause & Effect Relationships
3.2 Review Balanced Scorecard with stakeholders
3.3 Pilot the Balanced Scorecard
4.1 Communicate to organization
4.2 Implement the Balanced Scorecard
4.3 Manage using the Balanced Scorecard
4.4 Maintain and Revise
1. Business Strategy
Start with the Business Strategy, which should be a bold, future-oriented statement
2. Business Objectives
Develop key business objectives that will help you attain your strategy
3. Measures & Metrics
Develop specific measures and metrics to track progress
4. Implement
Gather measures, create the balanced scorecard and use it to make decisions. Incorporate a continuous improvement philosophy in the process
Use strategy to identify the objectives
Use objectives to identify the measures that will be used
Use measures to build the balanced scorecard
Use scorecard to determine if targets are met and the right measures are being measured
Use measures/ metrics to evaluate progress against objectives
Use progress against objectives to confirm strategy
17
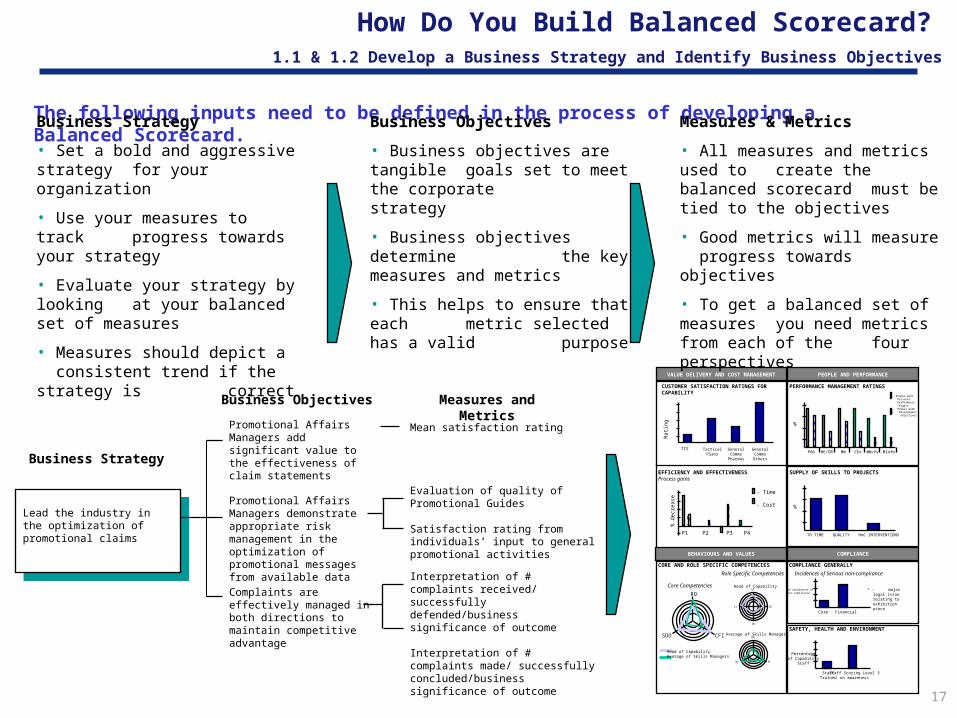
How Do You Build Balanced Scorecard?
1.1 & 1.2 Develop a Business Strategy and Identify Business Objectives
Lead the industry in the optimization of promotional claims
Promotional Affairs Managers add significant value to the effectiveness of claim statements
Promotional Affairs Managers demonstrate appropriate risk management in the optimization of promotional messages from available data
Complaints are effectively managed in both directions to maintain competitive advantage
Mean satisfaction rating
Evaluation of quality of Promotional Guides
Satisfaction rating from individuals’ input to general promotional activities
Interpretation of # complaints received/ successfully defended/business significance of outcome
Interpretation of # complaints made/ successfully concluded/business significance of outcome
Business Strategy
Business Objectives Measures and Metrics
The following inputs need to be defined in the process of developing a Balanced Scorecard.
VALUE DELIVERY AND COST MANAGEMENT
CUSTOMER SATISFACTION RATINGS FOR CAPABILITY
BEHAVIOURS AND VALUES COMPLIANCE
TCS TacticalPlans
GeneralComms
Pharmas
GeneralCommsOthers
Rat
ing
EFFICIENCY AND EFFECTIVENESS Process gains
% d
ecre
ase
P1 P2 P3 P4
- Time
- Cost
PEOPLE AND PERFORMANCE
PERFORMANCE MANAGEMENT RATINGS
PAG HE/OR MW CEx MM/PV
%
MInfo
- People with Personal Performance Targets- People with Development objectives
SUPPLY OF SKILLS TO PROJECTS
TO TIME
%
QUALITY HoC INTERVENTIONS
CORE AND ROLE SPECIFIC COMPETENCIES
RO
CFISDO
Head of CapabilityAverage of Skills Managers
Core Competencies
ST
GCSI
DO
DO
EffGC
Role Specific Competencies
Head of Capability
Average of Skills Managers
COMPLIANCE GENERALLY
No incidences ofnon-compliance
Incidences of Serious non-compliance
Core* Financial
* - major legal issuerelating to exhibition piece
SAFETY, HEALTH AND ENVIRONMENT
StaffTrained
Staff Scoring Level 3on awareness
Percentageof Capability
Staff
Business Strategy
• Set a bold and aggressive strategy for your organization
• Use your measures to track progress towards your strategy
• Evaluate your strategy by looking at your balanced set of measures
• Measures should depict a consistent trend if the strategy is correct
Business Objectives
• Business objectives are tangible goals set to meet the corporate strategy
• Business objectives determine the key measures and metrics
• This helps to ensure that each metric selected has a valid purpose
Measures & Metrics
• All measures and metrics used to create the balanced scorecard must be tied to the objectives
• Good metrics will measure progress towards objectives
• To get a balanced set of measures you need metrics from each of the four perspectives
18
Organization
Group/ Department
Individual
Select CSFsthat the group
can impact
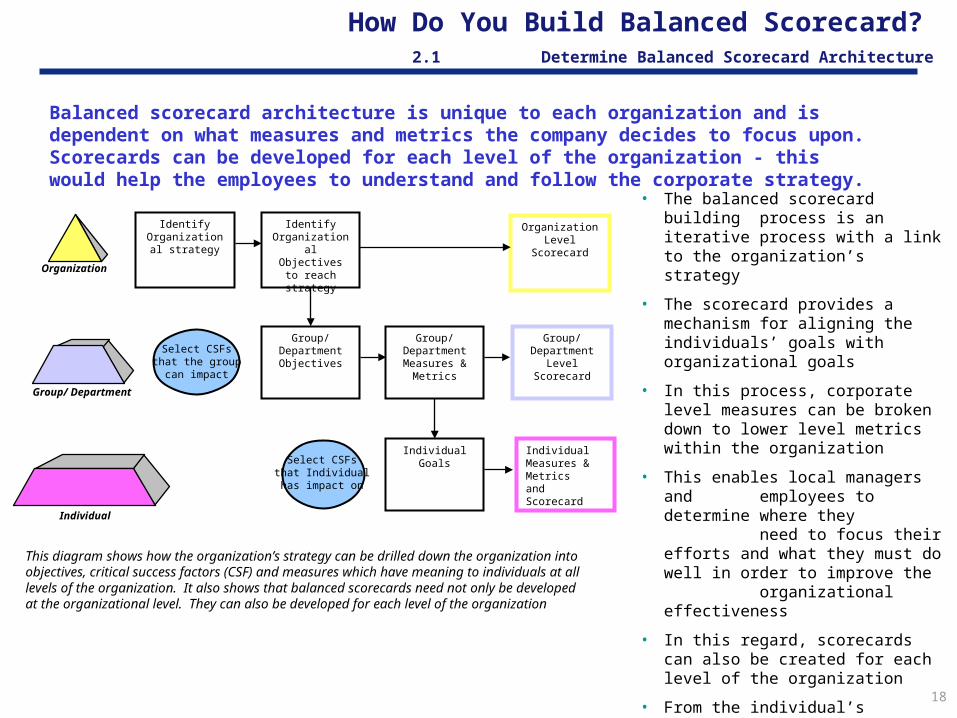
• The balanced scorecard building process is an iterative
process with a link to the organization’s strategy
• The scorecard provides a mechanism for aligning the individuals’ goals with organizational goals
• In this process, corporate level measures can be broken down to lower level metrics within the organization
• This enables local managers and employees to determine
where they need to focus their efforts and what they must do well in order to improve the organizational effectiveness
• In this regard, scorecards can also be created for each level of the organization
• From the individual’s perspective, the balanced scorecard process helps employees to make a connection between their behaviors and their contribution to the business outcome
How Do You Build Balanced Scorecard?
2.1 Determine Balanced Scorecard Architecture
Identify Organizational Objectives to reach strategy
Identify Organizational
strategy
Organization Level Scorecard
Group/ DepartmentMeasures &
Metrics
Group/ Department Objectives
Group/ Department
Level Scorecard
IndividualGoals
IndividualMeasures & Metricsand Scorecard
This diagram shows how the organization’s strategy can be drilled down the organization into objectives, critical success factors (CSF) and measures which have meaning to individuals at all levels of the organization. It also shows that balanced scorecards need not only be developed at the organizational level. They can also be developed for each level of the organization
Select CSFsthat Individualhas impact on
Balanced scorecard architecture is unique to each organization and is dependent on what measures and metrics the company decides to focus upon. Scorecards can be developed for each level of the organization - this would help the employees to understand and follow the corporate strategy.
19
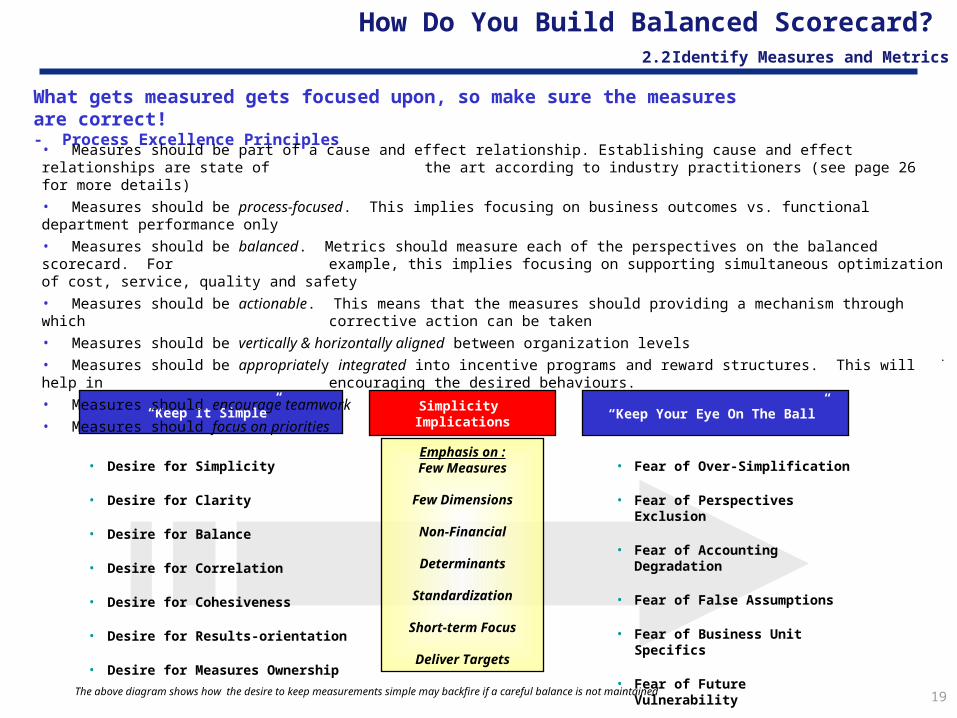
How Do You Build Balanced Scorecard? 2.2 Identify Measures and Metrics
“Keep It Simple”
• Desire for Simplicity
• Desire for Clarity
• Desire for Balance
• Desire for Correlation
• Desire for Cohesiveness
• Desire for Results-orientation
• Desire for Measures Ownership
“Keep Your Eye On The Ball”
• Fear of Over-Simplification
• Fear of Perspectives Exclusion
• Fear of Accounting Degradation
• Fear of False Assumptions
• Fear of Business Unit Specifics
• Fear of Future Vulnerability
• Fear of Accountability (without full control of variables ?)
What gets measured gets focused upon, so make sure the measures are correct! - Process Excellence Principles
Emphasis on :Few Measures
Few Dimensions
Non-Financial
Determinants
Standardization
Short-term Focus
Deliver Targets
Simplicity Implications
The above diagram shows how the desire to keep measurements simple may backfire if a careful balance is not maintained
• Measures should be part of a cause and effect relationship. Establishing cause and effect relationships are state of the art according to industry practitioners (see page 26 for more details)
• Measures should be process-focused. This implies focusing on business outcomes vs. functional department performance only
• Measures should be balanced. Metrics should measure each of the perspectives on the balanced scorecard. For example, this implies focusing on supporting simultaneous optimization of cost, service, quality and safety
• Measures should be actionable. This means that the measures should providing a mechanism through which corrective action can be taken
• Measures should be vertically & horizontally aligned between organization levels
• Measures should be appropriately integrated into incentive programs and reward structures. This will help in encouraging the desired behaviours.
• Measures should encourage teamwork
• Measures should focus on priorities

20
Guiding principles for selecting measures & metrics
What gets measured gets done
• People will do what they are measured on and rewarded to do
• Performance measures should focus on measuring results and encouraging the behavior we want -correlating directly with the competencies required for a particular job
• People should not be held accountable for what is not measured and reported
Keep it simple
• Performance measures need to be simple and easy to understand and communicate
• The information required should be collected honestly and at reasonable cost, considering factors such as the measurement tool used and time required to track and analyze the data at each organization level
Measures must be meaningful
• Performance measures must be meaningful to the people who use them
• Performance measures must be related to business objectives and critical success factors
• Performance measures must be comparable over time so that improvements can be charted
• Performance measures must be comparable across peer groups, where similar behavior is expected
• Measures must be objective and quantifiable
• People must be able to visualize and act on the measures. Too often measures are developed but never used because they are not presented in an appropriate way
Measures must be controllable
• The person or people being measured must be able to control the outcome of the performance
• The activity for which data is sought must be within the control of the employee
How Do You Build Balanced Scorecard?
2.3 Define Metrics, Set Targets, and Identify Owners
You get what you measure, so make sure what you measure is what you want.
21
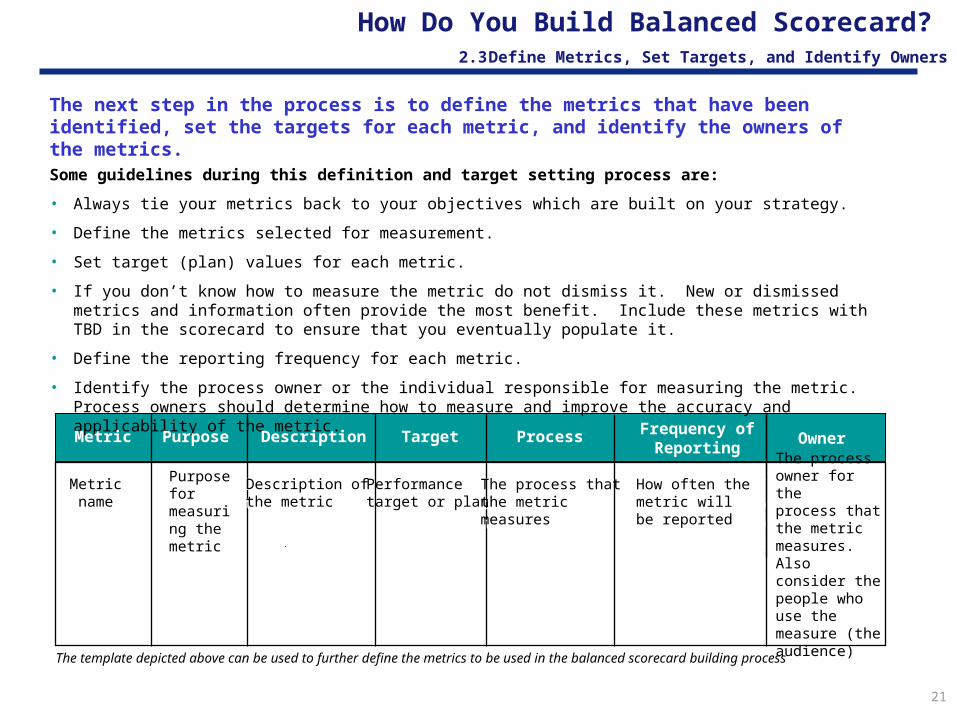
The next step in the process is to define the metrics that have been identified, set the targets for each metric, and identify the owners of the metrics.
Some guidelines during this definition and target setting process are:
• Always tie your metrics back to your objectives which are built on your strategy.
• Define the metrics selected for measurement.
• Set target (plan) values for each metric.
• If you don’t know how to measure the metric do not dismiss it. New or dismissed metrics and information often provide the most benefit. Include these metrics with TBD in the scorecard to ensure that you eventually populate it.
• Define the reporting frequency for each metric.
• Identify the process owner or the individual responsible for measuring the metric. Process owners should determine how to measure and improve the accuracy and applicability of the metric.
The template depicted above can be used to further define the metrics to be used in the balanced scorecard building process
How Do You Build Balanced Scorecard? 2.3 Define Metrics, Set Targets, and Identify Owners
Metric name
Driver orenabler
Description of the metric
Performancetarget
The process thatthe metricmeasures
How often themetric willbe reported
The processowner for the process thatthe metricmeasures
Metric name
Purpose for measuring the metric
Description of the metric
Performancetarget or plan
The process thatthe metricmeasures
How often themetric willbe reported
The processowner for the process thatthe metricmeasures. Also consider the people who use the measure (the audience)
Metric Purpose Description Target Process Frequency of Reporting
Owner

22
Increased Productivity
Every measure on the balanced scorecard should be an element in a chain of cause and effect relationships that will achieve the strategic objectives.
An example of a cause and effect relationship can be outlined as follows:
• IF we improve Leadership Capability AND give employees the Skills and Training they need to perform their jobs, THEN we will improve Employee Satisfaction & Motivation
• Consequently, IF we improve Employee Satisfaction & Motivation, THEN Productivity will increase since Employee Satisfaction & Motivation is a driver of Productivity
• IF we increase Productivity, THEN Cost will Decrease which will ultimately result in an Increased Return on Investment
How Do You Build Balanced Scorecard? 3.1 Identify Linkages and Cause & Effect Relationships
Skills and Training Leadership Capability
Employee Satisfaction& Motivation
ImprovedCycle Time
ReducedRework
Progress Towards CMM Level 2
Process Maturity/Assessment
Satisfied ClientsSatisfied End- Users/
Customers
Increase Sales Cost DecreaseIncreased Margin
Reduce IS Cost/% Sales Increased Return on Investment Meet/ Exceed Targets
Innovation and Learning Perspective
Internal Business ProcessPerspective
CustomerPerspective
Financial Perspective
SPR CapabilityTool Usage
An example of a cause and effect linkages between measures. The goal here is to ensure that all measures are consistent, coherent, and related to each other. This hypothesis can be tested upon implementation.
23
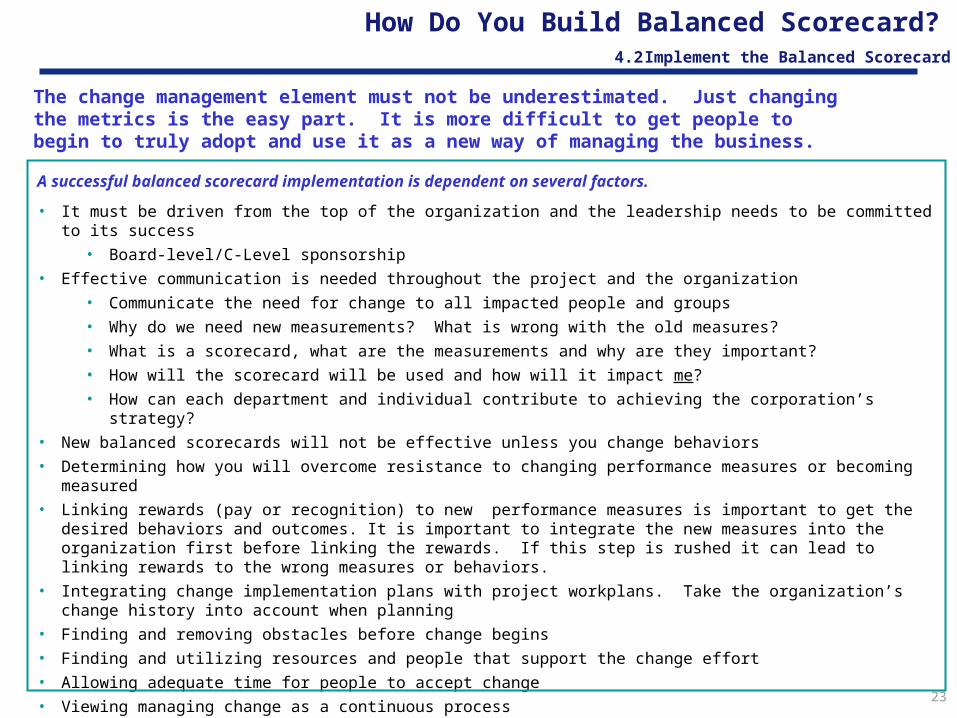
A successful balanced scorecard implementation is dependent on several factors.
• It must be driven from the top of the organization and the leadership needs to be committed to its success
• Board-level/C-Level sponsorship
• Effective communication is needed throughout the project and the organization
• Communicate the need for change to all impacted people and groups
• Why do we need new measurements? What is wrong with the old measures?
• What is a scorecard, what are the measurements and why are they important?
• How will the scorecard will be used and how will it impact me?
• How can each department and individual contribute to achieving the corporation’s strategy?
• New balanced scorecards will not be effective unless you change behaviors
• Determining how you will overcome resistance to changing performance measures or becoming measured
• Linking rewards (pay or recognition) to new performance measures is important to get the desired behaviors and outcomes. It is important to integrate the new measures into the organization first before linking the rewards. If this step is rushed it can lead to linking rewards to the wrong measures or behaviors.
• Integrating change implementation plans with project workplans. Take the organization’s change history into account when planning
• Finding and removing obstacles before change begins
• Finding and utilizing resources and people that support the change effort
• Allowing adequate time for people to accept change
• Viewing managing change as a continuous process
• Empowering people to change through information, participation & training
• Preparing for temporary downturn in attitudes and productivity at first
How Do You Build Balanced Scorecard?
4.2 Implement the Balanced Scorecard
The change management element must not be underestimated. Just changing the metrics is the easy part. It is more difficult to get people to begin to truly adopt and use it as a new way of managing the business.
24
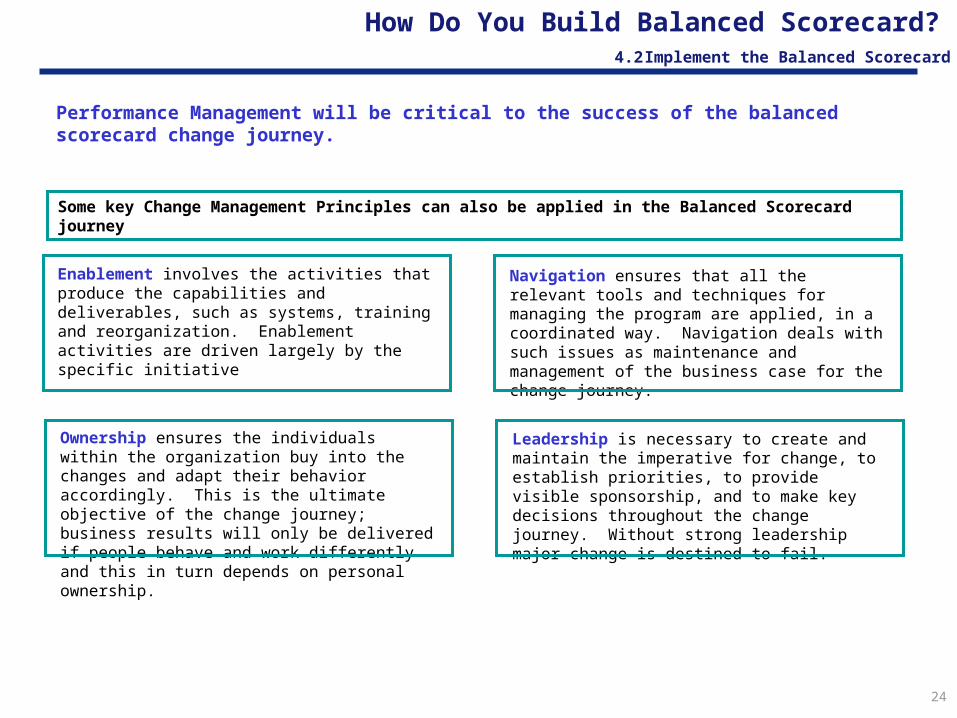
Performance Management will be critical to the success of the balanced scorecard change journey.
Some key Change Management Principles can also be applied in the Balanced Scorecard journey
How Do You Build Balanced Scorecard?
4.2 Implement the Balanced Scorecard
Ownership ensures the individuals within the organization buy into the changes and adapt their behavior accordingly. This is the ultimate objective of the change journey; business results will only be delivered if people behave and work differently and this in turn depends on personal ownership.
Enablement involves the activities that produce the capabilities and deliverables, such as systems, training and reorganization. Enablement activities are driven largely by the specific initiative
Leadership is necessary to create and maintain the imperative for change, to establish priorities, to provide visible sponsorship, and to make key decisions throughout the change journey. Without strong leadership major change is destined to fail.
Navigation ensures that all the relevant tools and techniques for managing the program are applied, in a coordinated way. Navigation deals with such issues as maintenance and management of the business case for the change journey.

25
How Do You Build a Balanced Scorecard?4.3 & 4.4 Manage Using the Balanced Scorecard and Maintain and Revise the Balanced
• Support of Strategic Objectives
• Investments linked to measures
• Capital Plan/Targets
• Links to long term plans and initiatives
• Link to supply chain strategy
• Business Results Achieved
• Actual vs. Target - Improvement targets met
• Review of lessons learned
• Behavioral changes achieved
• Aligned with Financial results
AnnualScorecard
Review
AnnualScorecard
Review
• Routine Review of Actual Results
• Root cause analysis
• Behavior review
• Corrective actions
• Lessons learned
• Review of supporting activity measures by department
Ongoing Results Review
Ongoing Results Review
• Regular data collection
• Emphasize timeliness
• Publication of scorecard results
• Accuracy of measures
• Distribution of scorecard results
• Single point of contact
• Assist with drill down into supporting activity measures
Scorecard Administration
Scorecard Administration
Long term sustainability and improvement of the balanced scorecard and its processes will be achieved by incorporating a continuous improvement philosophy throughout the organization and by linking the ongoing scorecard review process to the annual strategic planning process.
• Use the results from the balanced scorecard to mange the business
• The balanced scorecard process needs to be maintained, monitored, and continuously improved if it is to remain effective:
• Review the results or measures being recorded,
• Monitor the scorecard administration process, and
• Perform an annual review of the entire balanced scorecard. This step may have to be done more frequently in the eCommerce word where strategies and objectives change more rapidly
• A continuous improvement philosophy is required throughout the balanced scorecard process. This will ensure that the balanced scorecard and its measures are always relevant
The above diagram illustrates some activities associated with managing and maintaining the balanced scorecard process
26
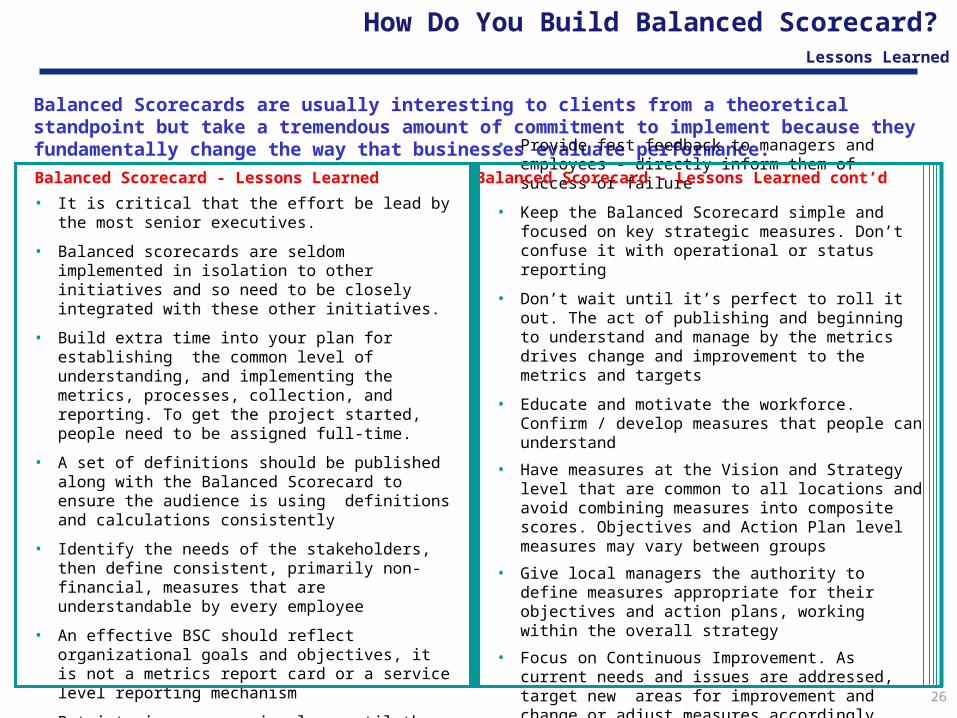
• It is critical that the effort be lead by the most senior executives.
• Balanced scorecards are seldom implemented in isolation to other initiatives and so need to be closely integrated with these other initiatives.
• Build extra time into your plan for establishing the common level of understanding, and implementing the metrics, processes, collection, and reporting. To get the project started, people need to be assigned full-time.
• A set of definitions should be published along with the Balanced Scorecard to ensure the audience is using definitions and calculations consistently
• Identify the needs of the stakeholders, then define consistent, primarily non-financial, measures that are understandable by every employee
• An effective BSC should reflect organizational goals and objectives, it is not a metrics report card or a service level reporting mechanism
• Put interim measures in place until the Balanced Scorecard is implemented
• Focus on trends and improvement not on the actual numbers
How Do You Build Balanced Scorecard?
Lessons Learned
Balanced Scorecards are usually interesting to clients from a theoretical standpoint but take a tremendous amount of commitment to implement because they fundamentally change the way that businesses evaluate performance.
• Provide fast feedback to managers and employees - directly inform them of success or failure
• Keep the Balanced Scorecard simple and focused on key strategic measures. Don’t confuse it with operational or status reporting
• Don’t wait until it’s perfect to roll it out. The act of publishing and beginning to understand and manage by the metrics drives change and improvement to the metrics and targets
• Educate and motivate the workforce. Confirm / develop measures that people can understand
• Have measures at the Vision and Strategy level that are common to all locations and avoid combining measures into composite scores. Objectives and Action Plan level measures may vary between groups
• Give local managers the authority to define measures appropriate for their objectives and action plans, working within the overall strategy
• Focus on Continuous Improvement. As current needs and issues are addressed, target new areas for improvement and change or adjust measures accordingly
Balanced Scorecard - Lessons Learned Balanced Scorecard - Lessons Learned cont’d
27
Agenda
Why is Performance Measurement/Balanced Scorecard important?
What are some tools and techniques to get started?
DoD Logistics Balanced Scorecard
Questions and Discussion
Appendix

28
Progress to Date
Objective Define, develop and document common DoD-wide KPI’s and Metrics to support end-
to-end log processes
Status Established working group (July 2002) Surveyed applicable “umbrella” documents (September 2002)
Quadrennial Defense Review Future Logistics Environment
Developed initial strategic objectives (October 2002) Confirmed approval for strategic Objectives (November 2002) Drafted metrics for inclusion in phase I BSC (January 2003) Outlined requirements for development and build of a BSC dashboard (January 2003) Finalizing DoD Logistics BSC white paper (May 2003) Gained BBP approval of Level 1 metrics (April 2003) Incorporated metrics into EI Toolkit (On-going)
Next Steps Distribute DoD Logistics BSC white paper Kick-off build phase for the DoD Logistics BSC dashboard Include in the Architecture Compliance -- linkage to Component scorecards Document as part of the Operational Architecture

29
BSC as a Management Tool
Provides a cross enterprise view of DoD Logistics at an OSD level
Measures the performance of DoD Logistics Enterprise not the implementation of any one initiative
Aligns with the individual BSC from each Service and Agency
Provides guidelines for transformation projects and programs
Evolves metrics as transformation takes hold -- TLCSM, E2E Customer Support, Enterprise Integration, etc.
Contributes to other relevant measurement programs
Maps directly to the Operational Architecture and will follow the same process for compliance
The DoD Logistics Balanced Scorecard what it is and how it works:
30
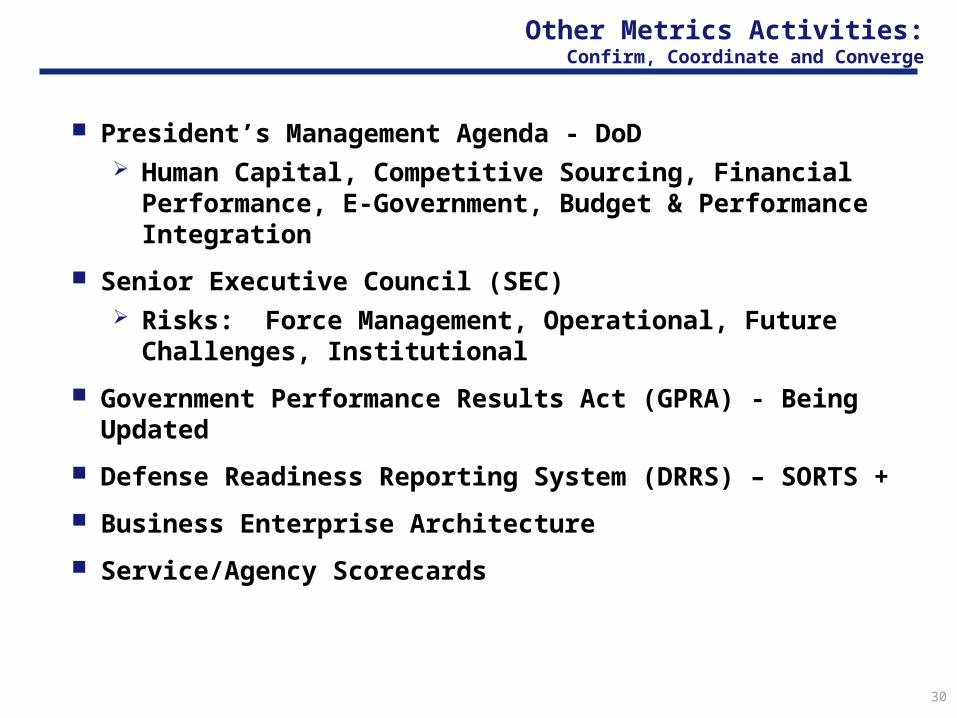
Other Metrics Activities:Confirm, Coordinate and Converge
President’s Management Agenda - DoD Human Capital, Competitive Sourcing, Financial
Performance, E-Government, Budget & Performance Integration
Senior Executive Council (SEC) Risks: Force Management, Operational, Future
Challenges, Institutional
Government Performance Results Act (GPRA) - Being Updated
Defense Readiness Reporting System (DRRS) – SORTS +
Business Enterprise Architecture
Service/Agency Scorecards
31
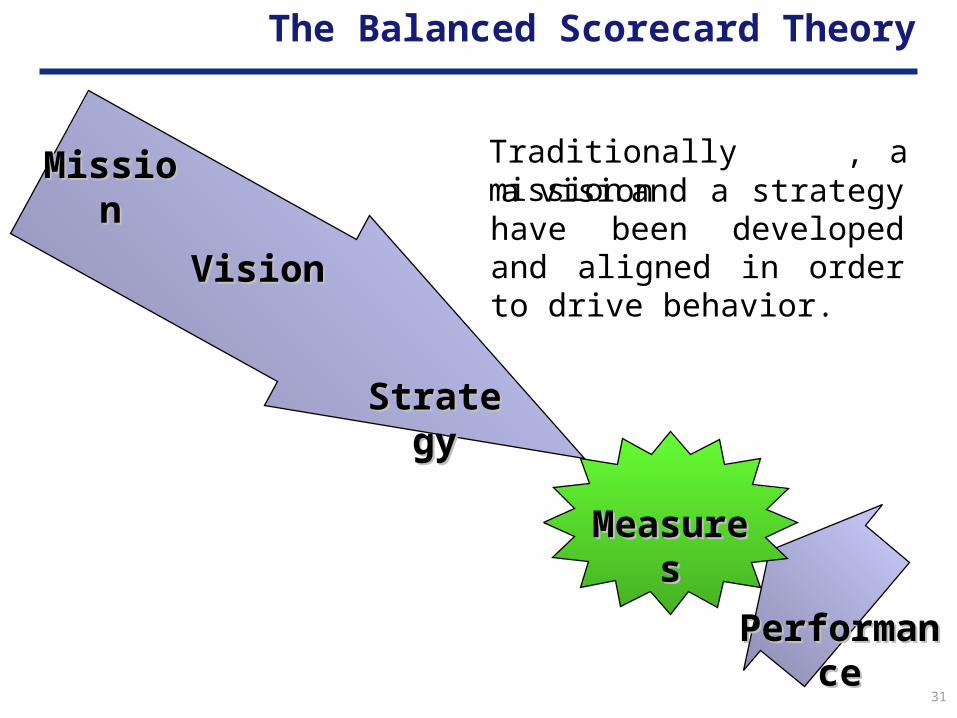
The Balanced Scorecard Theory
MissioMissionn
VisionVision
StrateStrategygy
PerformaPerformancence
MeasurMeasureses
and a strategy have been developed and aligned in order to drive behavior.
Traditionally a mission , a vision
32
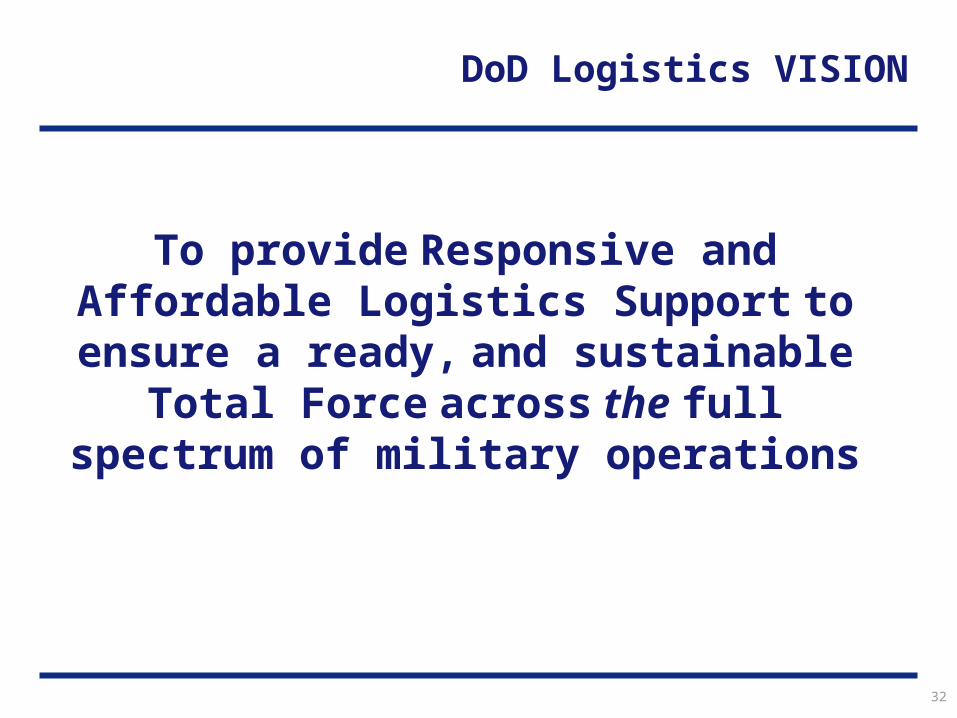
To provide Responsive and Affordable Logistics Support to ensure a ready,
and sustainable Total Force across the full spectrum of military operations
DoD Logistics VISION
33
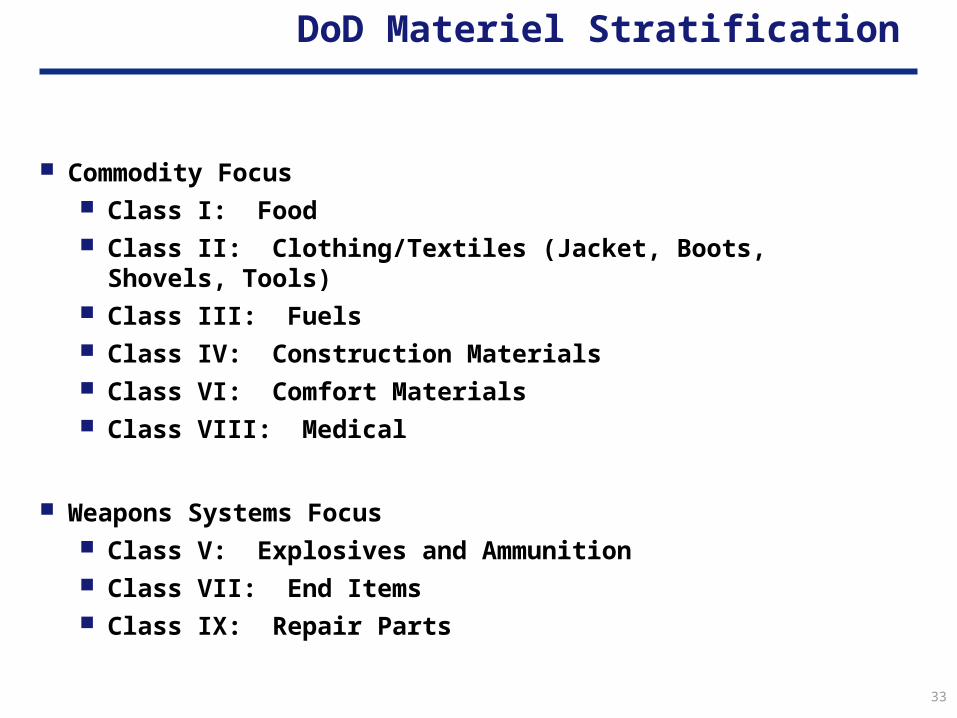
DoD Materiel Stratification
Commodity Focus Class I: Food Class II: Clothing/Textiles (Jacket, Boots, Shovels, Tools) Class III: Fuels Class IV: Construction Materials Class VI: Comfort Materials Class VIII: Medical
Weapons Systems Focus Class V: Explosives and Ammunition Class VII: End Items Class IX: Repair Parts
34
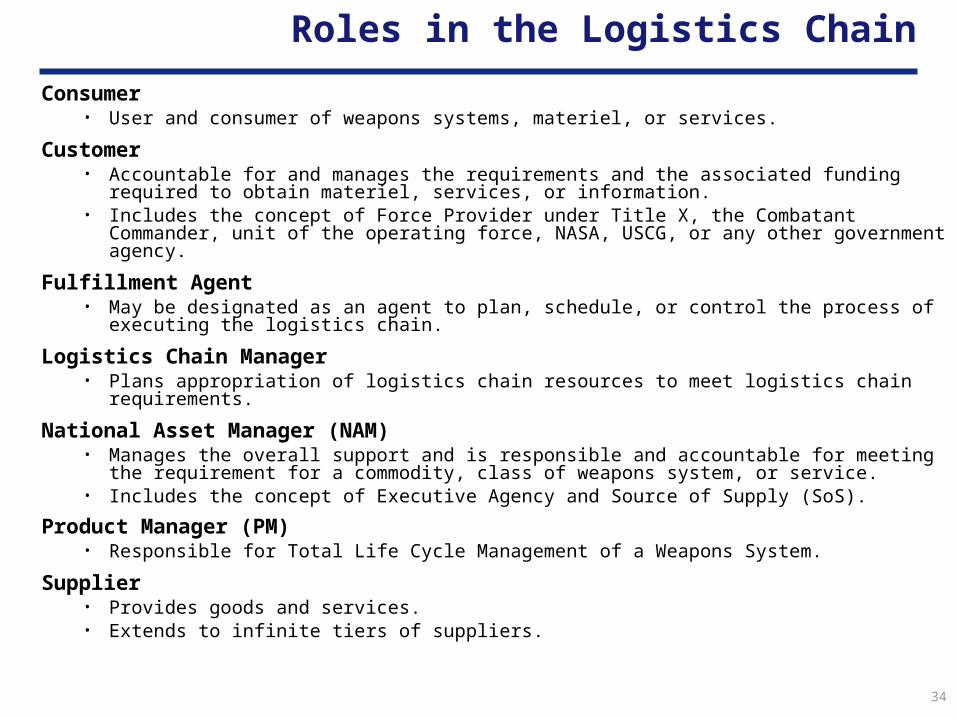
Roles in the Logistics Chain
Consumer• User and consumer of weapons systems, materiel, or services.
Customer • Accountable for and manages the requirements and the associated funding required to
obtain materiel, services, or information. • Includes the concept of Force Provider under Title X, the Combatant Commander, unit of
the operating force, NASA, USCG, or any other government agency.
Fulfillment Agent• May be designated as an agent to plan, schedule, or control the process of executing the
logistics chain.
Logistics Chain Manager • Plans appropriation of logistics chain resources to meet logistics chain requirements.
National Asset Manager (NAM)• Manages the overall support and is responsible and accountable for meeting the
requirement for a commodity, class of weapons system, or service. • Includes the concept of Executive Agency and Source of Supply (SoS).
Product Manager (PM) • Responsible for Total Life Cycle Management of a Weapons System.
Supplier• Provides goods and services. • Extends to infinite tiers of suppliers.
35
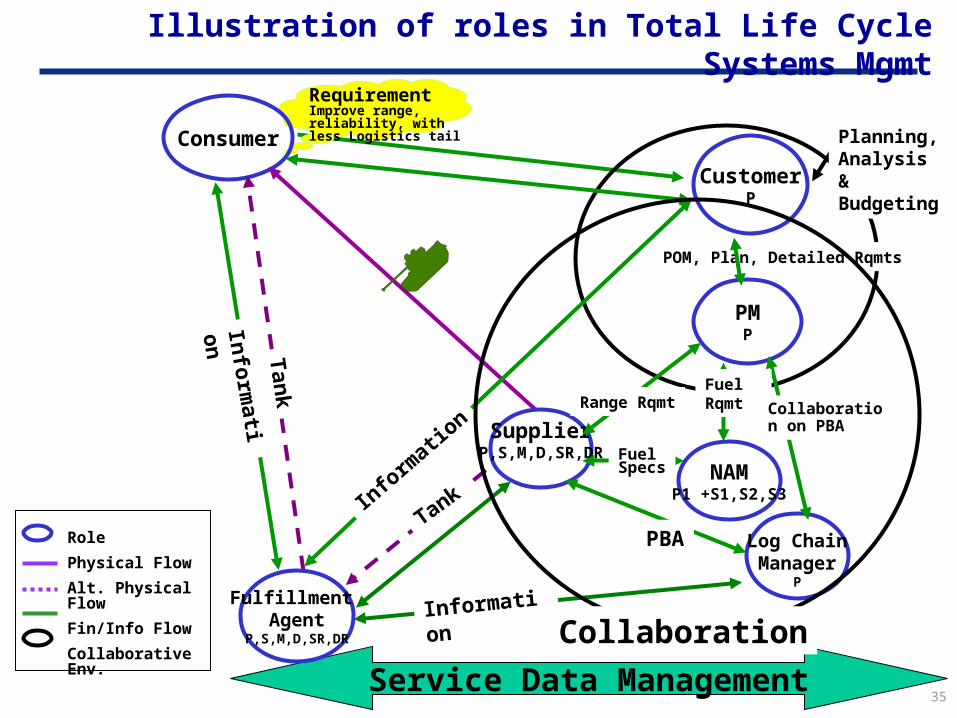
Illustration of roles in Total Life Cycle Systems Mgmt
Service Data Management
Requirement Improve range, reliability, with less Logistics tailConsumer Planning,
Analysis & Budgeting
POM, Plan, Detailed Rqmts
PMP
CustomerP
Tan
k
Tank
SupplierP,S,M,D,SR,DR
NAMP1 +S1,S2,S3
Log ChainManager
P
Range Rqmt
Fuel Specs
Fuel Rqmt Collaboratio
n on PBA
PBA
Fulfillment Agent
P,S,M,D,SR,DR
Info
rmat
ion
Info
rmati
on
Informati
on Collaboration
Role
Physical Flow
Alt. Physical Flow
Fin/Info Flow
Collaborative Env.

36
The Consumer (Warfighter) Point of View
Consumer
CustomerP
SupplierP,S,M,D,SR,DR
Fulfillment Agent
P,S,M,D,SR,DR
Role
Physical Flow
Alt. Physical Flow
Fin/Info Flow
Collaborative Env.
ImpactConsumer/Warfighter sets requirements for the Logistics ChainThese requirements not only define the planning and budgeting cycle, but also kick-off the Logistics Chain Process…
Level 1 Metrics•Force Closure•Force Readiness
Combat Capability
37
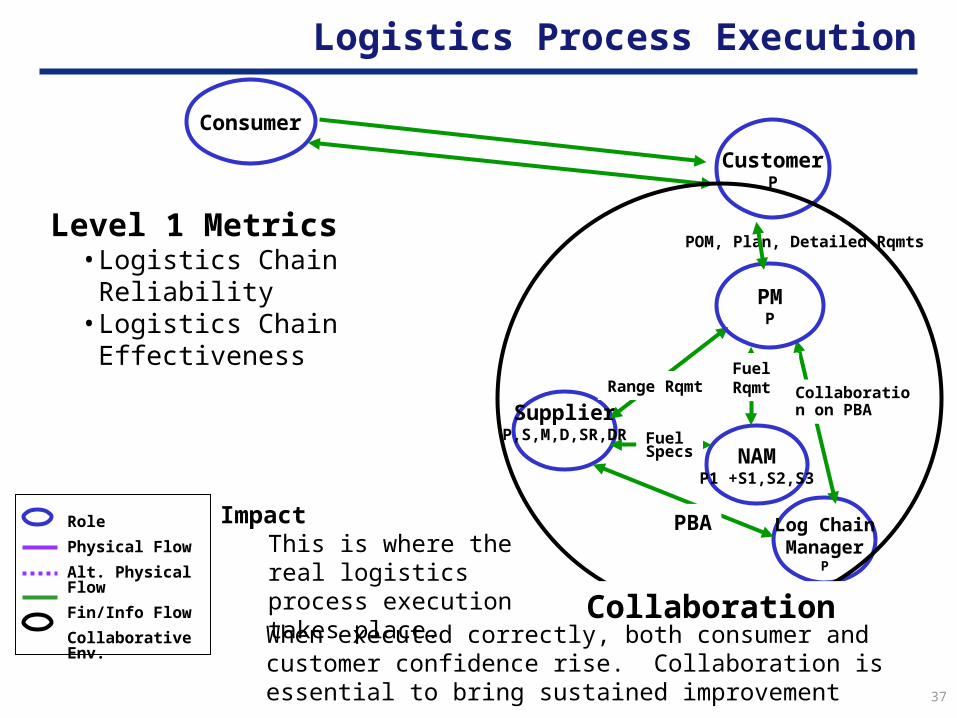
Logistics Process Execution
SupplierP,S,M,D,SR,DR
NAMP1 +S1,S2,S3
Log ChainManager
P
Range Rqmt
Fuel Specs
Fuel Rqmt Collaboratio
n on PBA
PBA
Consumer
POM, Plan, Detailed Rqmts
PMP
CustomerP
Collaboration
Role
Physical Flow
Alt. Physical Flow
Fin/Info Flow
Collaborative Env.
Level 1 Metrics•Logistics Chain Reliability•Logistics Chain Effectiveness
ImpactThis is where the real logistics process execution takes place.When executed correctly, both consumer and customer confidence rise. Collaboration is essential to bring sustained improvement

38
Materiel Execution
Consumer
SupplierP,S,M,D,SR,DR
Tan
k
Tank
Fulfillment Agent
P,S,M,D,SR,DR
Role
Physical Flow
Alt. Physical Flow
Fin/Info Flow
Collaborative Env.
Physical Distribution
Level 1 Metrics•Force
Sustainment
ImpactThis is where the physical flow of materiel and services to the Consumer are delivered and measured against expectations.
39
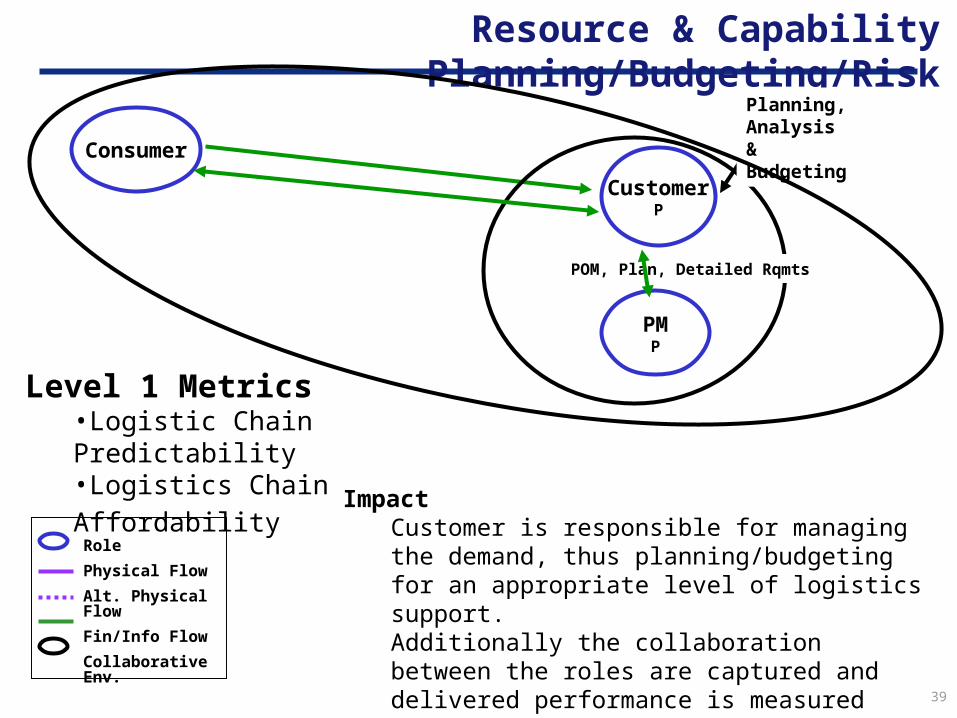
Resource & Capability Planning/Budgeting/Risk
Consumer
Planning, Analysis & Budgeting
POM, Plan, Detailed Rqmts
PMP
CustomerP
Role
Physical Flow
Alt. Physical Flow
Fin/Info Flow
Collaborative Env.
ImpactCustomer is responsible for managing the demand, thus planning/budgeting for an appropriate level of logistics support.Additionally the collaboration between the roles are captured and delivered performance is measured against SLA/PBA -- setting the foundation for future improvements.
Level 1 Metrics•Logistic Chain Predictability•Logistics Chain Affordability
40
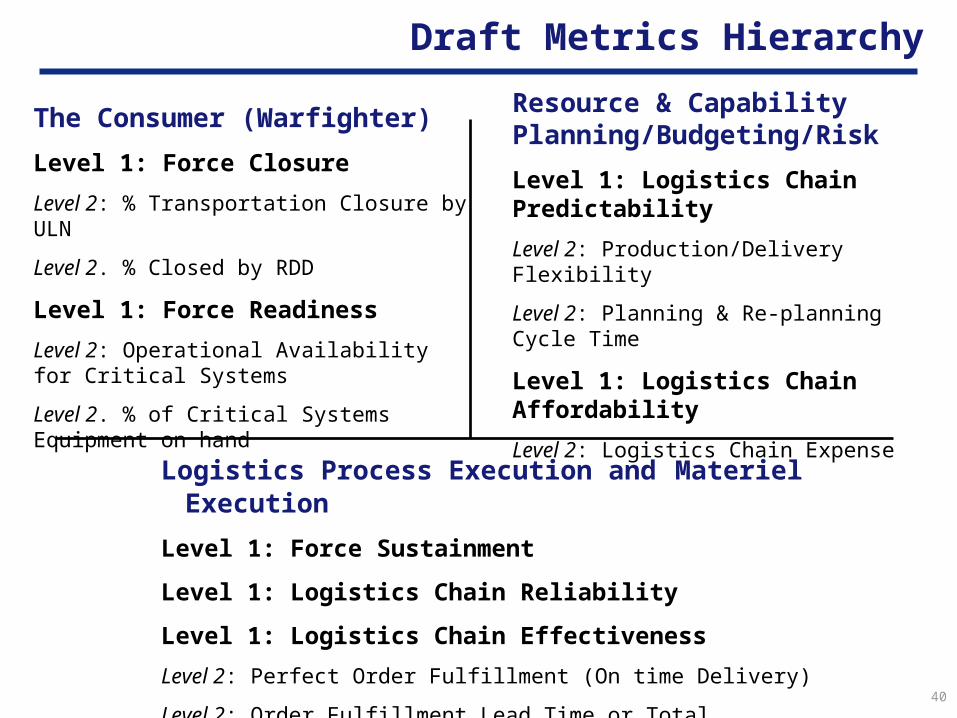
Draft Metrics Hierarchy
The Consumer (Warfighter)
Level 1: Force Closure
Level 2: % Transportation Closure by ULN
Level 2. % Closed by RDD
Level 1: Force Readiness
Level 2: Operational Availability for Critical Systems
Level 2. % of Critical Systems Equipment on hand
Logistics Process Execution and Materiel Execution
Level 1: Force Sustainment
Level 1: Logistics Chain Reliability
Level 1: Logistics Chain Effectiveness
Level 2: Perfect Order Fulfillment (On time Delivery)
Level 2: Order Fulfillment Lead Time or Total Pipeline Time
Resource & Capability Planning/Budgeting/Risk
Level 1: Logistics Chain Predictability
Level 2: Production/Delivery Flexibility
Level 2: Planning & Re-planning Cycle Time
Level 1: Logistics Chain Affordability
Level 2: Logistics Chain Expense
41
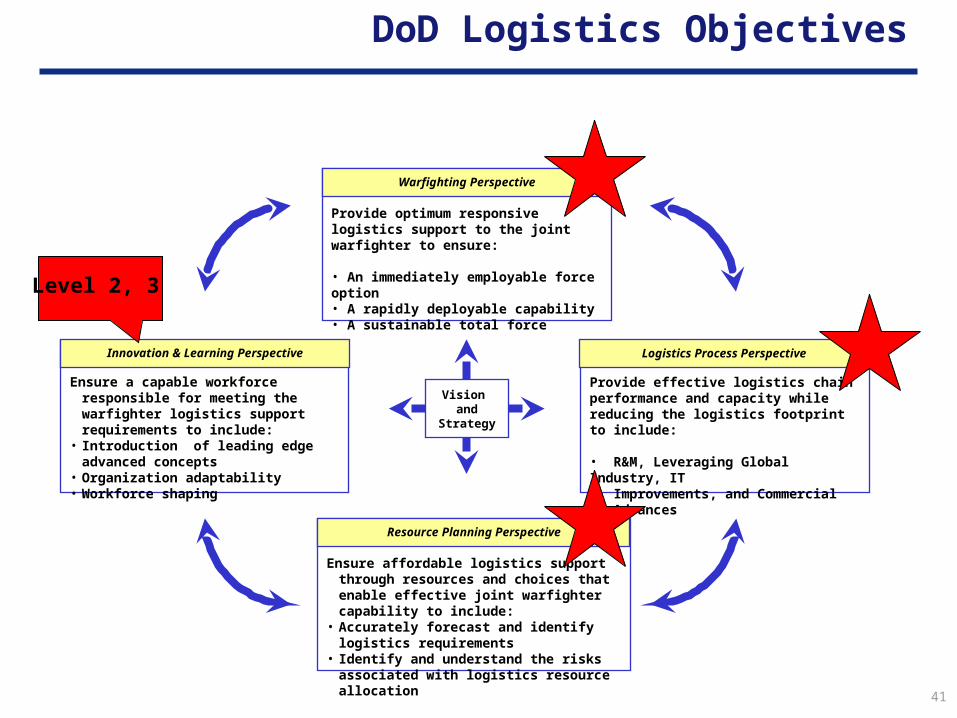
Ensure a capable workforce responsible for meeting the warfighter logistics support requirements to include:
• Introduction of leading edge advanced concepts
• Organization adaptability• Workforce shaping
Innovation & Learning Perspective
Provide optimum responsive logistics support to the joint warfighter to ensure:
• An immediately employable force option • A rapidly deployable capability• A sustainable total force
Warfighting Perspective
Ensure affordable logistics support through resources and choices that enable effective joint warfighter capability to include:
• Accurately forecast and identify logistics requirements
• Identify and understand the risks associated with logistics resource allocation
Resource Planning Perspective
Vision and
Strategy
Provide effective logistics chain performance and capacity while reducing the logistics footprint to include:
• R&M, Leveraging Global Industry, IT Improvements, and Commercial Advances
Logistics Process Perspective
DoD Logistics Objectives
Level 2, 3
42
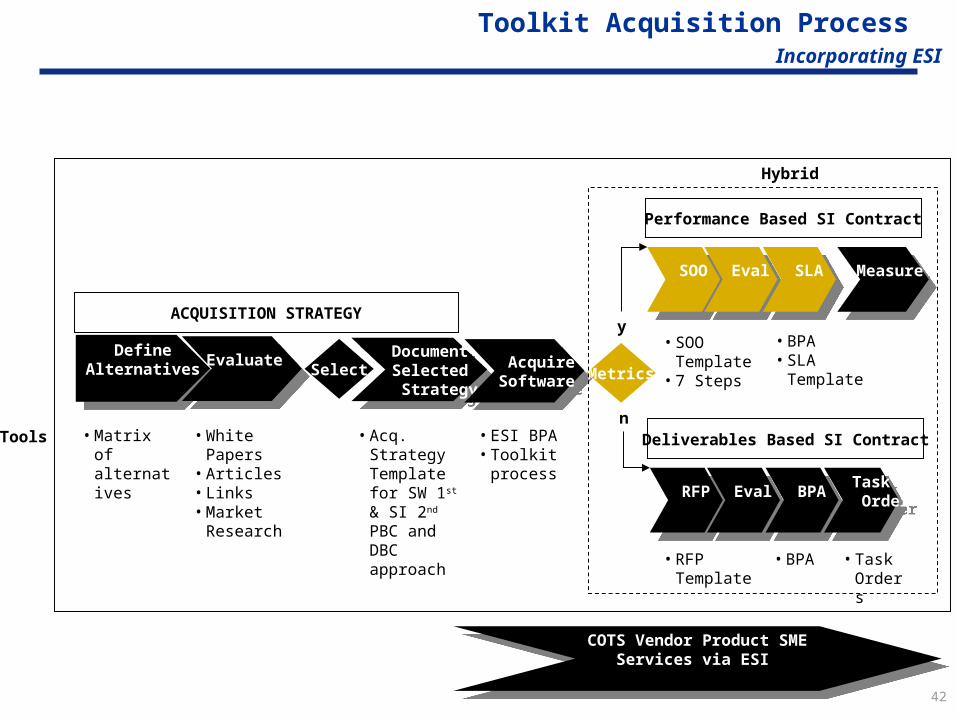
Toolkit Acquisition Process Incorporating ESI
• Matrix of alternatives
ACQUISITION STRATEGY
DefineAlternatives
DefineAlternatives Evaluate Evaluate
SOO SOO
Document Selected Strategy
Document Selected Strategy
AcquireSoftware
AcquireSoftware
Select
Tools • White Papers• Articles• Links• Market
Research
• Acq. Strategy Template for SW 1st & SI 2nd PBC and DBC approach
• ESI BPA• Toolkit
process
Metrics
y
n
Performance Based SI Contract
Eval Eval SLA SLA Measure Measure
RFP RFP
Deliverables Based SI Contract
Eval Eval BPA BPA Task Order
Task Order
• SOO Template
• 7 Steps
• BPA • SLA Template
COTS Vendor Product SMEServices via ESI
COTS Vendor Product SMEServices via ESI
• RFP Template
• BPA • Task Orders
Hybrid
43
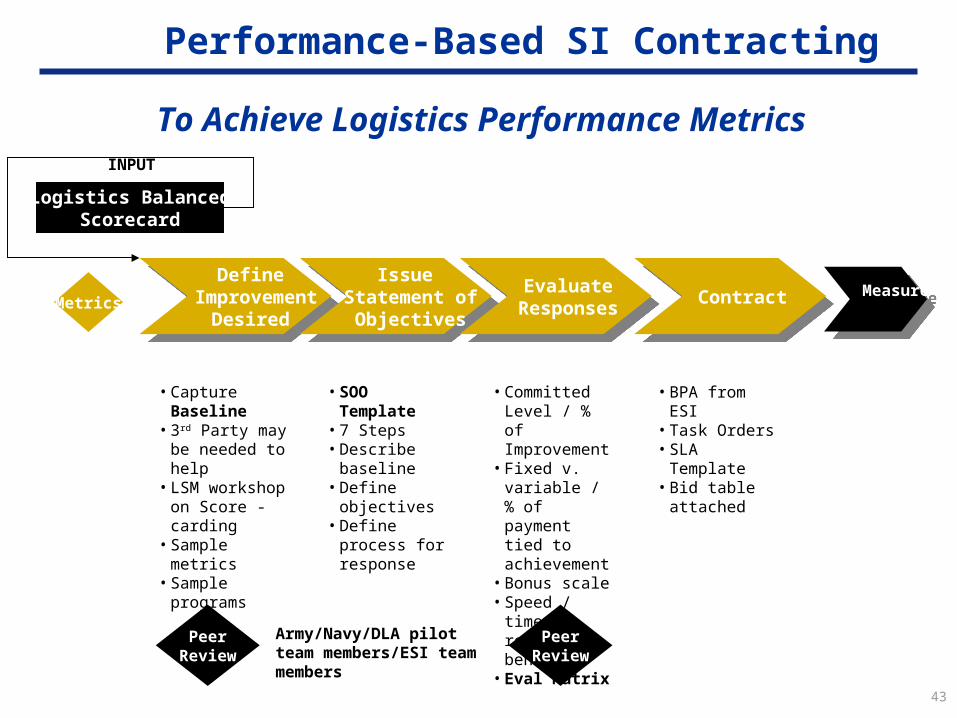
Performance-Based SI Contracting
Define Improvement
Desired
Define Improvement
Desired Metrics
Logistics BalancedScorecard
Issue Statement ofObjectives
Issue Statement ofObjectives
Evaluate Responses
Evaluate Responses
Measure Measure
• SOO Template • 7 Steps• Describe
baseline• Define
objectives• Define process
for response
• Capture Baseline
• 3rd Party may be needed to help
• LSM workshop on Score -carding
• Sample metrics• Sample
programs
• Committed Level / % of Improvement
• Fixed v. variable / % of payment tied to achievement
• Bonus scale• Speed / time to
realize benefits• Eval Matrix
• BPA from ESI• Task Orders• SLA Template • Bid table
attached
ContractContract
PeerReview
PeerReview
Army/Navy/DLA pilot team members/ESI team members
INPUT
To Achieve Logistics Performance Metrics
44
Summary
DoD Logistics BSC is based on a proven methodology
DoD Logistics BSC is anchored by the Warfighter (customer) perspective
DoD Logistics BSC is consistent with other performance measurement initiatives Encompasses FLE Coordinated with SEC, MID 901, Business Enterprise
Architecture, etc.
DoD Logistics BSC maps directly to the FLE operational architecture
Created project team and kicking-off DoD Log BSC DII project
Define and document level 2,3 metrics
Identify data sources and extraction methods
Design and build a portal-based BSC dashboard

45
Agenda
Why is Performance Measurement/Balanced Scorecard important?
What are some tools and techniques to get started?
DoD Logistics Balanced Scorecard
Questions and Discussion
Appendix

46
Agenda
Why is Performance Measurement/Balanced Scorecard important?
What are some tools and techniques to get started?
DoD Logistics Balanced Scorecard Process
Questions and Discussion
Appendix

47
7/99 9/998/99 1/0012/9911/99
Scorecard Design Review with Key Process Owners
Baseline, Establish Targets and Develop Feedback Mechanism
Develop and Conduct Scorecard Training and Communication
Automate scorecard data collection
Update / Review/Align PMI’s
Revise Daily Scorecard
Turnover Scorecard Management to Operations
10/99
- Scorecard Design Approved
Period and Daily Scorecard Implemented -
Proposed Time Line
Key milestone dates and activities need to be
confirmed with Director/Sponsor team
Y2000 Measurement Targets Set -
Balanced Scorecards take a significant amount of time and effort to setup and administer. Detailed planning should start right from the beginning of the process.
Sample Deliverables
The above deliverable illustrates a sample workplan for balanced scorecard implementation. The activities and time required for each workplan will be different.
48
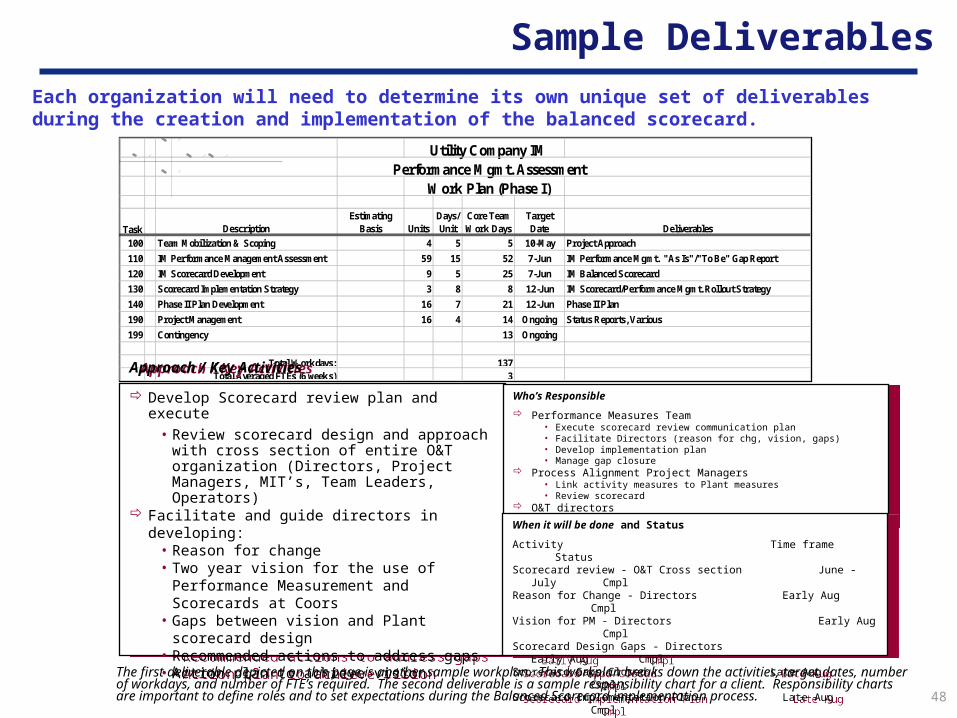
Utility Company IMPerformance Mgmt. Assessment
Work Plan (Phase I)
Task DescriptionEstimating
Basis UnitsDays/ Unit
Core Team Work Days
Target Date Deliverables
100 Team Mobilization & Scoping 4 5 5 10-May Project Approach
110 IM Performance Management Assessment 59 15 52 7-Jun IM Performance Mgmt. "As Is"/"To Be" Gap Report
120 IM Scorecard Development 9 5 25 7-Jun IM Balanced Scorecard
130 Scorecard Implementation Strategy Development
3 8 8 12-Jun IM Scorecard/Performance Mgmt. Rollout Strategy
140 Phase II Plan Development 16 7 21 12-Jun Phase II Plan
190 Project Management 16 4 14 Ongoing Status Reports, Various
199 Contingency 13 Ongoing
Total Workdays: 137Total Averaged FTEs (6 weeks) 3
Approach / Key Activities
Develop Scorecard review plan and execute
• Review scorecard design and approach with cross section of entire O&T organization (Directors, Project Managers, MIT’s, Team Leaders, Operators)
Facilitate and guide directors in developing:• Reason for change• Two year vision for the use of Performance
Measurement and Scorecards at Coors• Gaps between vision and Plant scorecard design• Recommended actions to address gaps• Action plan to achieve vision
Who’s Responsible
Performance Measures Team• Execute scorecard review communication plan • Facilitate Directors (reason for chg, vision, gaps)• Develop implementation plan• Manage gap closure
Process Alignment Project Managers• Link activity measures to Plant measures• Review scorecard
O&T directors• Develop reason for change and vision• Own and actively support implementation plan• Identify and help resolve gaps
When it will be done and Status
Activity Time frame Status
Scorecard review - O&T Cross section June - JulyCmpl
Reason for Change - Directors Early Aug Cmpl
Vision for PM - Directors Early Aug Cmpl
Scorecard Design Gaps - Directors Early Aug Cmpl
Scorecard Gaps Closed Late AugCmpl
Scorecard Implementation Plan Late AugCmpl
completed and time frame approvedScorecard Design Approved Early Sept
Cmpl
Each organization will need to determine its own unique set of deliverables during the creation and implementation of the balanced scorecard.
Sample Deliverables
The first deliverable depicted on this page is another sample workplan. This workplan breaks down the activities, target dates, number of workdays, and number of FTE’s required. The second deliverable is a sample responsibility chart for a client. Responsibility charts are important to define roles and to set expectations during the Balanced Scorecard implementation process.
49
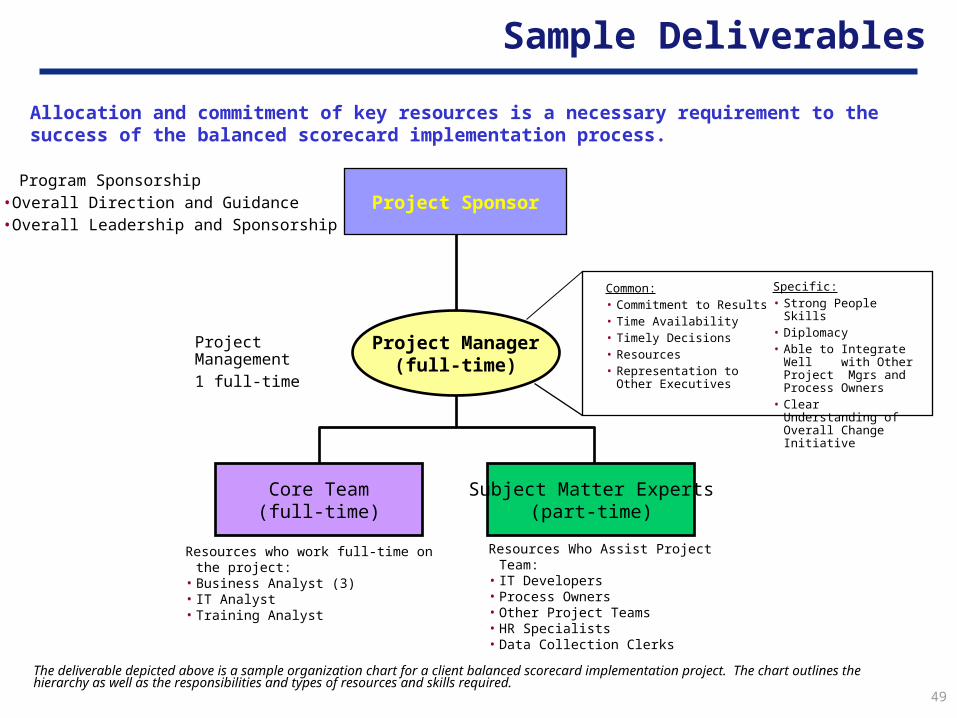
Core Team(full-time)
Subject Matter Experts(part-time)
Project Manager(full-time)
Resources Who Assist Project Team:• IT Developers• Process Owners• Other Project Teams• HR Specialists• Data Collection Clerks
Project Sponsor
Resources who work full-time on the project:• Business Analyst (3)• IT Analyst• Training Analyst
Project Management 1 full-time
Program Sponsorship• Overall Direction and Guidance• Overall Leadership and Sponsorship
Common:• Commitment to Results• Time Availability• Timely Decisions• Resources• Representation to Other
Executives
Specific:• Strong People Skills• Diplomacy• Able to Integrate Well
with Other Project Mgrs and Process Owners
• Clear Understanding of Overall Change Initiative
Allocation and commitment of key resources is a necessary requirement to the success of the balanced scorecard implementation process.
Sample Deliverables
The deliverable depicted above is a sample organization chart for a client balanced scorecard implementation project. The chart outlines the hierarchy as well as the responsibilities and types of resources and skills required.
50
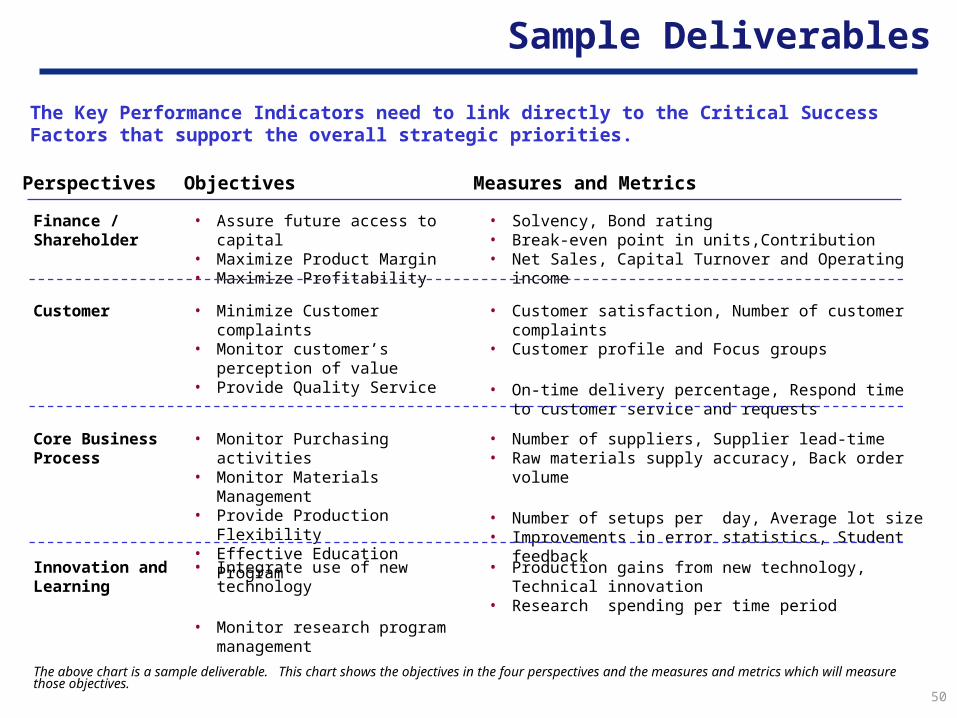
The Key Performance Indicators need to link directly to the Critical Success Factors that support the overall strategic priorities.
Sample Deliverables
Perspectives Objectives Measures and Metrics
Finance / Shareholder
• Assure future access to capital• Maximize Product Margin• Maximize Profitability
• Solvency, Bond rating • Break-even point in units,Contribution• Net Sales, Capital Turnover and Operating income
Customer • Minimize Customer complaints• Monitor customer’s perception of
value• Provide Quality Service
• Customer satisfaction, Number of customer complaints• Customer profile and Focus groups
• On-time delivery percentage, Respond time to customer service and requests
Core Business Process
• Monitor Purchasing activities• Monitor Materials Management• Provide Production Flexibility• Effective Education Program
• Number of suppliers, Supplier lead-time• Raw materials supply accuracy, Back order volume
• Number of setups per day, Average lot size• Improvements in error statistics, Student feedback
Innovation and Learning
• Integrate use of new technology
• Monitor research program management
• Production gains from new technology, Technical innovation
• Research spending per time period
The above chart is a sample deliverable. This chart shows the objectives in the four perspectives and the measures and metrics which will measure those objectives.
51
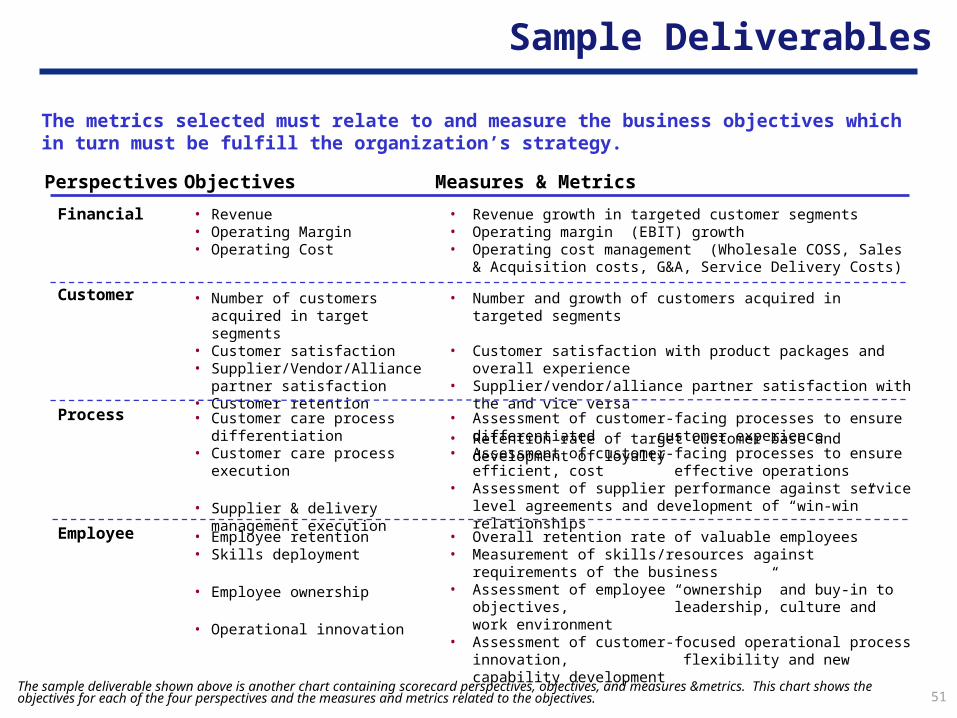
The metrics selected must relate to and measure the business objectives which in turn must be fulfill the organization’s strategy.
Perspectives Objectives Measures & Metrics
Financial • Revenue• Operating Margin• Operating Cost
• Revenue growth in targeted customer segments • Operating margin (EBIT) growth• Operating cost management (Wholesale COSS, Sales &
Acquisition costs, G&A, Service Delivery Costs)
Customer • Number of customers acquired in target segments
• Customer satisfaction• Supplier/Vendor/Alliance partner
satisfaction• Customer retention
• Number and growth of customers acquired in targeted segments
• Customer satisfaction with product packages and overall experience• Supplier/vendor/alliance partner satisfaction with the and vice versa
• Retention rate of target customer base and development of loyalty
Process • Customer care process differentiation
• Customer care process execution
• Supplier & delivery management execution
• Assessment of customer-facing processes to ensure differentiated customer experience
• Assessment of customer-facing processes to ensure efficient, cost effective operations
• Assessment of supplier performance against service level agreements and development of “win-win” relationships
Employee • Employee retention• Skills deployment
• Employee ownership
• Operational innovation
• Overall retention rate of valuable employees• Measurement of skills/resources against requirements of the
business• Assessment of employee “ownership” and buy-in to objectives,
leadership, culture and work environment• Assessment of customer-focused operational process innovation,
flexibility and new capability development
Sample Deliverables
The sample deliverable shown above is another chart containing scorecard perspectives, objectives, and measures &metrics. This chart shows the objectives for each of the four perspectives and the measures and metrics related to the objectives.
52
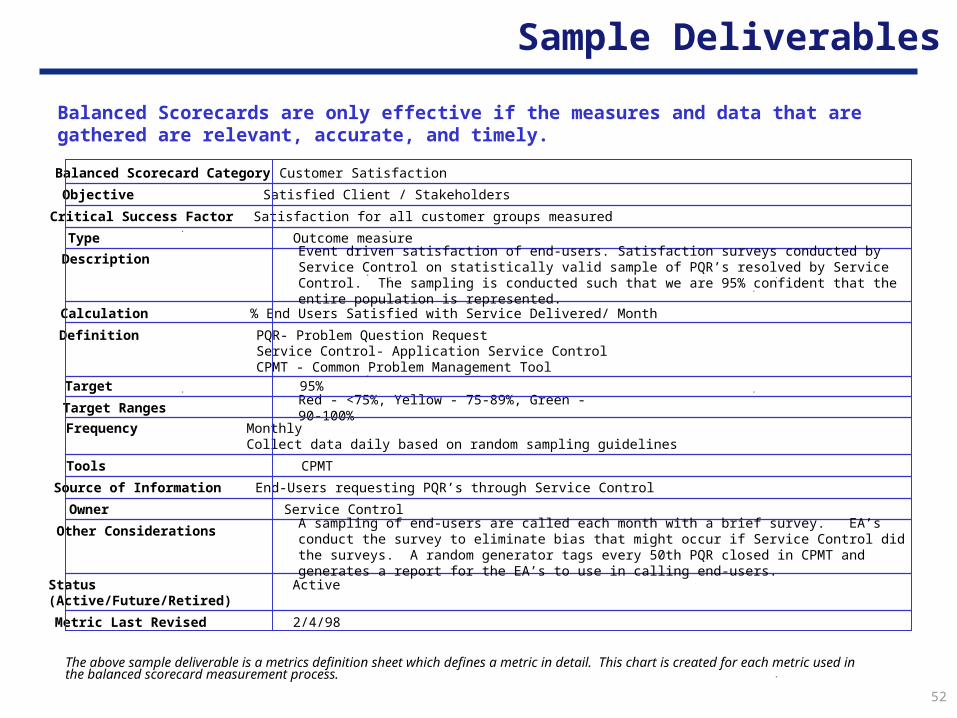
Balanced Scorecards are only effective if the measures and data that are gathered are relevant, accurate, and timely.
Sample Deliverables
Metric Last Revised 2/4/98
Balanced Scorecard Category Customer Satisfaction
Objective Satisfied Client / Stakeholders
Critical Success Factor Satisfaction for all customer groups measured
Type Outcome measure
Calculation % End Users Satisfied with Service Delivered/ Month
Definition PQR- Problem Question RequestService Control- Application Service ControlCPMT - Common Problem Management Tool
Target 95%
Target Ranges Red - <75%, Yellow - 75-89%, Green - 90-100%
Frequency MonthlyCollect data daily based on random sampling guidelines
Source of Information End-Users requesting PQR’s through Service Control
Owner Service Control
Tools CPMT
Status(Active/Future/Retired)
Active
Description Event driven satisfaction of end-users. Satisfaction surveys conducted by Service Control on statistically valid sample of PQR’s resolved by Service Control. The sampling is conducted such that we are 95% confident that the entire population is represented.
Other Considerations A sampling of end-users are called each month with a brief survey. EA’s conduct the survey to eliminate bias that might occur if Service Control did the surveys. A random generator tags every 50th PQR closed in CPMT and generates a report for the EA’s to use in calling end-users.
The above sample deliverable is a metrics definition sheet which defines a metric in detail. This chart is created for each metric used in the balanced scorecard measurement process.
53
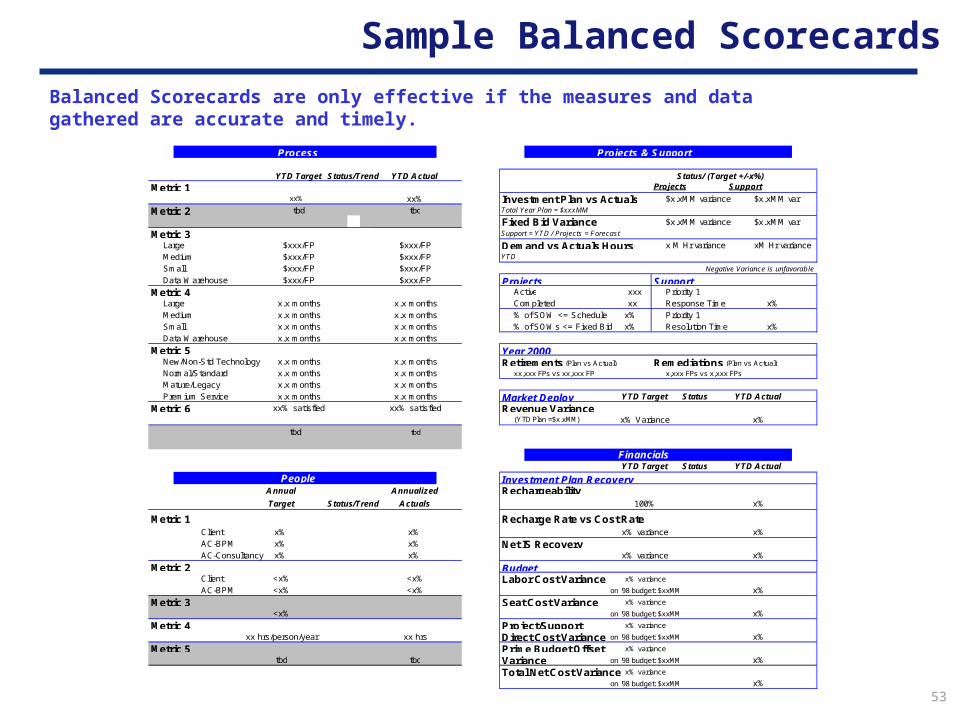
Process Projects & Support
YTD Target Status/Trend YTD Actual Status/ (Target +/-x%)
Metric 1 Projects Support
xx% xx% Investment Plan vs Actuals $x.xMM variance $x.xMM var
Metric 2 tbd tbd Total Year Plan = $xxxMM
Fixed Bid Variance $x.xMM variance $x.xMM var
Metric 3 Support = YTD / Projects = Forecast
Large $xxx/FP $xxx/FP Demand vs Actuals Hours x M Hr variance xM Hr varianceMedium $xxx/FP $xxx/FP YTD
Small $xxx/FP $xxx/FP Negative Variance is unfavorable
Data Warehouse $xxx/FP $xxx/FP Projects SupportMetric 4 Active xxx Priority 1
Large x.x months x.x months Completed xx Response Time x%Medium x.x months x.x months % of SOW <= Schedule x% Priority 1Small x.x months x.x months % of SOWs <= Fixed Bid x% Resolution Time x%Data Warehouse x.x months x.x months
Metric 5 Year 2000New/Non-Std Technology x.x months x.x months Retirements (Plan vs Actual) Remediations (Plan vs Actual)
Normal/Standard x.x months x.x months xx,xxx FPs vs xx,xxx FP x,xxx FPs vs x,xxx FPs
Mature/Legacy x.x months x.x monthsPremium Service x.x months x.x months Market Deploy YTD Target Status YTD Actual
Metric 6 xx% satisfied xx% satisfied Revenue Variance(YTD Plan =$x.xMM) x% Variance x%
tbd tbd
FinancialsYTD Target Status YTD Actual
People Investment Plan RecoveryAnnual Annualized RechargeabilityTarget Status/Trend Actuals 100% x%
Metric 1 Recharge Rate vs Cost RateClient x% x% x% variance x%AC-BPM x% x% Net IS RecoveryAC-Consultancy x% x% x% variance x%
Metric 2 BudgetClient <x% <x% Labor Cost Variance x% variance
AC-BPM <x% <x% on '98 budget: $xxMM x%
Metric 3 Seat Cost Variance x% variance
<x% on '98 budget: $xxMM x%
Metric 4 Project/Support x% variance
xx hrs/person/year xx hrs Direct Cost Variance on '98 budget: $xxMM x%
Metric 5 Prime Budget Offset x% variance
tbd tbd Variance on '98 budget: $xxMM x%
Total Net Cost Variance x% variance
on '98 budget: $xxMM x%
Balanced Scorecards are only effective if the measures and data gathered are accurate and timely.
Sample Balanced Scorecards