09 - the hindu
TRANSCRIPT

Services Sector09CHAPTER
The services sector with a share of 55.2 per cent in India’s gross value added continued to be the key driver of India’s economic growth contributing almost 72.5 per cent of gross value added growth in 2017-18. While the growth of this sector in 2017-18 is expected to be at 8.3 per cent, the growth in services exports and net services were robust at 16.2 per cent and 14.6 per cent respectively in H1 of 2017-18. The Government has taken many initiatives in the different services which include digitization, e-visas, infrastructure status to Logistics, Start-up India, schemes for the housing sector, etc. which could give a further fillip to this sector.
INTERNATIONAL COMPARISON
9.1 As per the UN National Accounts Statistics data, India’s ranking improved from 14th position in 2006 to 7th position in 2016, among the world’s 15 largest economies in terms of overall GDP. Among these top 15 economies, China (9.8 pp) recorded the highest increase in services share to Gross Value Added (GVA) during 2006-16, followed by India (7.1 pp) and Spain (7.0 pp). In 2016, services GVA growth rate
(at constant prices), was highest in India at 7.8 per cent followed by China at 7.4 per cent. As per the ILO’s estimates, among the top 15 economies, the services sector accounted for more than two-thirds of total employment in 2016 in most of them except India and China, with India’s share of 30.6 per cent being the lowest. While China had the highest increase in the share of services employment (10.2 pp) during the period 2006 to 2016, increase in India was 5.2 pp (Figure 1).
Figure 1: Increase in Share of Services in Employment and GVA during 2006-16
Figure 1: Increase in Share of Services in Employment and GVA during 2006-16
Source: Computed from UN National Accounts Statistics database for GVA and World Bank database for Employment.
-2
0
2
4
6
8
10
12
-2
0
2
4
6
8
10
12
Wor
ld
USA
Chin
a
Japa
n
Ger
man
y
UK
Fran
ce
Indi
a
Italy
Braz
il
Cana
da
S. K
orea
Austr
alia
Russ
ia
Spain
Mex
ico
Incr
ease
in S
hare
(p
erce
ntra
ge p
oint
s)
Employment GVA Services GVA Growth 2016 (RHS)
Gro
wth
(%)
Source: Computed from UN National Accounts Statistics database for GVA and World Bank database for Employment.

9.2 Services export growth, both for World and India, which had dipped to negative territory in 2015 after an interregnum of 6 years from 2009, returned to positive territory in 2016. As per the latest World Trade Organization (WTO) data for first half of 2017, services export growth for the World was 4.3 per cent (average of Q1 and Q2) and robust at 9.9 per cent for India, though the highest growth was registered by Russia at 18.4 per cent. China’s growth was at 0.2 per cent. (Figure 2)
9.3 As per the World Investment Report 2017 published by United Nations Conference on Trade and Development (UNCTAD), following a surge in foreign investment in 2015, global FDI flows fell by 2 per cent in 2016, to US $1.75 trillion, amid weak economic growth. Global FDI flows are projected to increase by about 5 per cent in 2017. The services sector accounted for two thirds of global FDI stock in 2015, though a large part of this relates to affiliates of primary sector and manufacturing multinational enterprises (MNEs) that perform services-like activities, and fall under services as a default category. The share of services in total value of announced Greenfield projects increased to 58.2 per cent in 2016 from 54.1 per cent in the previous year.
INDIA’S SERVICES SECTOR
Services GVA
9.4 As per the First Advance estimates of national income 2017-18 released by Central Statistics Office (CSO), services sector growth (GVA at constant (2011-12) basic prices) is expected to be 8.3 per cent during 2017-18, higher than the growth of 7.7 per cent in 2016-17. The growth in trade, hotels, transport, communication and services related to broadcasting category is expected to be 8.7 per cent during 2017-18 as compared to 7.8 percent during 2016-17 and growth in the ‘financial, real estate & professional services’ category is likely to accelerate to 7.3 percent during 2017-18 from 5.7 percent in 2016-17. The ‘public administration, defence & other services’ category registered a growth of 11.3 per cent in 2016-17 as against 6.9 per cent in 2015-16, owing to higher payments of wages and salaries to government staff due to the implementation of recommendations of Seventh Pay Commission. This growth is expected to decelerate to 9.3 per cent in 2017-18, on a high base of 2016-17 (Table 1).
Figure 2: Commercial Services Export Growth Y-o-Y ( Per cent)
Figure 2: Commercial Services Export Growth Y-o-Y (Per cent)
Source: World Bank and WTO data Note: H1 = average of Q1 and Q2 for world.
-10
0
10
20
30
40
50
2010 2011 2012 2013 2014 2015 2016 2017 H1China India World
Per c
ent
Source: World Bank and WTO dataNote: H1 = average of Q1 and Q2 for world.
Services Sector | 153

154 | Economic Survey 2017-18 Volume 2
Table 1: Share and Growth of India's Services Sector (GVA at basic prices)
Share (Per cent)
Growth (Per cent)
2015-16 2015-16 2016-17@ 2017-18#
Total Services 52.9 9.7 7.7 8.3
Trade, repair, hotels and restaurants 11.4 11.2 7.8* 8.7*
Trade & repair services 10.4 10.9 -- --
Hotels & restaurants 1.0 14.4 -- --
Transport, storage, communication & services related to broadcasting
7.0 9.3 -- --
Railways 0.8 7.0 -- --
Road transport 3.2 6.7 -- --
Air transport 0.2 16.8 -- --
Financial services 5.8 6.8 5.7^ 7.3^
Real estate, ownership of dwelling & professional services 15.3 12.5 -- --
Public Administration and defence & Others 13.4 6.9 11.3 9.4
Construction 8.1 5.0 1.7 3.6
Total Services ( including Construction) 61.0 9.1 6.9 7.7
TOTAL GVA at basic prices 100.0 7.9 6.6 6.1
GDP Market Prices ( Constant Prices) Y-o-Y 8.0 7.1 6.5
Source: Computed from CSO data. Note: Shares are in current prices and growth in constant 2011-12 prices; @ Provisional Estimates for 2016-17; # First Advance estimates, * Also includes transport, storage, communication & services related to broadcasting; ^ Also includes Real estate, ownership of dwelling & professional services.
State-wise Comparison of Services 9.5 Out of the 32 States and Union Territories(UTs) for which data are released for new base 2011-12 series by CSO, the services sector is the dominant sector, contributing to more than half of the gross state value added (GSVA) in 15 states and UTs. The major services in most of the states are trade, hotels and restaurants, followed by real estate, ownership of dwellings and business services. However, there is wide variation in terms of share and growth of
services GSVA. Out of the 32 states and UTs for which data are available for 2016-17 (or latest year for which data are available), in terms of services GSVA share, Delhi and Chandigarh are at the top with over 80 per cent share, while Sikkim is at the bottom with 31.7 per cent share. In terms of services GSVA growth, Bihar is at the top and Uttar Pradesh at the bottom with 14.5 per cent and 7.0 per cent growth respectively in 2016-17 (Figure 3).

Services Sector | 155
Figure 3 : Share and Growth of Services in States (2016-17)
Figure 3: Share and Growth of Services in States (2016-17)
Source: Computed from CSO data. Note: * 2014-15, ^-2015-16, Share in current prices and growth at constant prices (2011-12).
0
5
10
15
20 Services GVA Growth Overall GVA Growth
Grow
th (%
)
0
15
30
45
60
75
90
Sikkim
Arun
acha
l Prad
esh^
Gujar
at^Ch
hatti
sgarh
Goa^
Uttar
akha
ndM
adhy
a Prad
eshOd
isha
Hima
chal
Prad
eshM
izoram
^Jh
arkha
ndRa
jasth
an^
Andh
ra Pr
adesh
Punja
bAs
sam^
Uttar
Prad
eshHa
ryana
Tripu
ra*M
egha
laya^
Pudu
cherr
yIN
DIA
Tami
l Nad
uNa
galan
d^M
ahara
shtra
^J &
K^
Biha
rKe
rala^
Telan
gana
Man
ipur^
A &
N Is
lands
^Ka
rnata
kaDe
lhiCh
andig
arh^
Share of Services GVA
Share
(%)
Source: Computed from CSO data. Note: * 2014-15, ^-2015-16, Share in current prices and growth at constant prices (2011-12).
FDI in India’s Services Sector
9.6 Though there is ambiguity in the classification of FDI in services, it is the combined FDI share of the top 10 service sectors such as financial and non-financial services falling under the Department of Industrial Policy & Promotion (DIPP)’s services sector definition; as well as telecommunications; trading; computer hardware & software; construction; hotels & tourism; hospital & diagnostic centres; consultancy services; sea transport; and information & broadcasting that can be taken as the best estimate of services FDI. However, these could include some non-service elements. The share of these services is 56.6 per cent of the cumulative FDI equity inflows during the period April 2000-October 2017 and 65.8 per cent of FDI equity inflows during 2017-18 (April-October). If the shares of another 5 services or service-related sectors like retail trading, agriculture services, education, book printing and air transport are included, then the total share of FDI equity inflows to the services sector would increase to 58.5 per cent and 69.6 per cent respectively for the above two periods. In 2016-17, FDI equity inflows to the services sector
(top 10 sectors including construction) declined by 0.9 per cent to US$ 26.4 billion, though the overall FDI equity inflows grew by 8.7 per cent. However, during 2017-18 (April-October), the FDI equity inflows to these services sector grew by 15.0 per cent, as compared to 0.8 per cent growth in total FDI equity inflows, mainly due to higher FDI in two sectors i.e. Telecommunications and Computer Software and Hardware (Table 2).
9.7 In the last three years, the Government has undertaken a number of reforms to ensure that India remains an increasingly attractive investment destination, which include announcement of National Intellectual Property Rights (IPR) policy, implementation of GST, reforms for ease of doing business that resulted in improving India’s ranking by 30 position. The scale of reforms can be gauged from the fact that during this period, 25 sectors also including services activities and covering 100 areas of FDI policy have undergone reforms. FDI policy provisions were radically overhauled across sectors such as construction development, broadcasting, retail trading, air transport, insurance and pension. At present, more than 90 per cent of FDI

156 | Economic Survey 2017-18 Volume 2
Table 2: FDI Equity Inflows to the Services Sector
Value (in US$ Billion)
Share in Total (%)
Growth Rate (%)
Sr Sector 2016-17 2017-18 (Apr-Oct)
Apr 2000 to Oct 2017
2016-17 2017-18(Apr-Oct)
1 Services Sector * 8.7 3.4 17.6 26.0 -45.8
2 Construction # 2.0 1.4 9.9 -57.5 22.0
3 Telecommunications 5.6 6.1 8.4 320.1 115.9
4 Computer Software & Hardware 3.7 3.3 7.8 -38.2 116.0
5 Trading 2.3 1.6 4.4 -39.2 -1.2
6 Hotel & Tourism 0.9 0.6 3.0 -31.3 -4.1
7 Information & Broadcasting 1.5 0.5 2.0 50.3 -48.9
8 Hospital & Diagnostic Centres 0.7 0.6 1.4 0.7 6.9
9 Consultancy Services 0.3 0.4 1.1 -49.5 137.6
10 Sea Transport 0.7 0.6 0.9 71.2 71.1
Top 10 services (1-10) 26.4 18.4 56.6 -0.9 15.0
Top 15 services 27.2 19.5 58.5 -1.7 17.5
Total FDI 43.5 28.0 100.0 8.7 0.8
Source: Based on Department of Industrial Policy and Promotion (DIPP) data.
Note: * Financial, banking, insurance, non-financial business, outsourcing, R&D, courier, technology testing and analysis; #Combined with infrastructure activities and townships, housing, built-up infrastructure and construction-development projects.
inflows are through automatic route. After the successful implementation of the e-filing and online processing of FDI applications by the Foreign Investment Promotion Board (FIPB), the Government announced to phase out the FIPB in the Union Budget 2017-18. Recently, on 10th January 2018, Union Cabinet approved amendments in FDI policy allowing 100 per cent FDI under automatic route for Single Brand Retail Trading. Foreign airlines also have been allowed to invest up to 49 per cent in Air India.
India’s Services Trade
9.8 India remained the eighth largest exporter of commercial services in the world in 2016 (WTO, 2017) with a share of 3.4 per cent, which is double the share of India’s merchandise exports in the world at 1.7 percent. Moreover, the ratio of services exports to merchandise exports increased from 35.8 per cent in 2000-01 to 58.2 per cent
in 2016-17 indicating the growing importance of the services sector in India’s exports. While, India’s services exports registered a CAGR of 8.3 per cent during 2006-07 to 2016-17, in 2015-16 it registered negative growth of (-) 2.4 per cent. Services sector export growth returned to positive territory with 5.7 per cent growth rate in 2016-17. Services exports recorded a robust growth of 16.2 per cent during April-September 2017-18, with a turnaround in some major sectors like travel and software services (Table 3). With significant rise in foreign tourist arrivals, travel receipts, witnessed a robust growth of 27.7 per cent in the first half 2017-18 as compared to a growth of 7.6 per cent in the corresponding period of the previous year. Notwithstanding the pricing pressure on traditional services and a challenging global business environment facing domestic software companies, software services exports increased by 2.3 per cent, a mild improvement over the previous period.

Services Sector | 157
9.9 India’s services imports exhibited growth of 17.4 per cent in April-September 2017-18 as payments on transport sector increased by 15.0 per cent. Among the other major services imports, travel grew by 12.0 per cent and business services by 11.3 per cent (Table 3). The rise in business services payments was primarily led by higher payments for import of research and development services, professional & management consulting services and technical, trade related and other business services. Though the software services imports had a share of only 4.3 per cent, its growth was 47.6 per cent.
9.10 Lower growth in services exports than in imports led to a decline in net services receipts in 2015-16 and 2016-17. Net services receipts rose by 14.6 per cent during April-September of 2017-18. Net surplus in services financed about 49 per cent of India’s merchandise deficit in 2017-18 H1 and cushioned the current account deficit.
Table 3: Trade Performance of India’s Major Services
Value (US $ Billion)
Share (%)
Growth(%)
2016-17 2016-17 2015-16 2016-17 2016-17 H1 2017-18 H1
Services Exports 163.1 100.0 -2.4 5.7 4.2 16.2
Travel 23.2 14.2 4.6 9.3 7.6 27.7
Transportation 15.9 9.7 -19.9 13.2 9.6 6.9
Miscellaneous 121.2 74.3 -0.9 4.1 3.1 15.6
Software Services 73.7 45.2 1.4 -0.7 0.0 2.3
Business Services 32.9 20.2 2.0 13.6 8.4 7.6
Financial Services 5.1 3.1 -12.7 3.1 -4.1 -13.4
Services Imports 95.7 100.0 3.7 13.0 16.5 17.4
Travel 16.4 17.2 -3.4 11.1 15.7 12.0
Transportation 14.1 14.8 -6.8 -6.3 -10.0 15.0
Miscellaneous 63.0 65.9 9.8 19.5 26.5 19.3
Software Services 3.6 3.7 -0.3 32.9 25.9 47.6
Business Services 32.3 33.7 12.5 3.7 8.3 11.3
Financial Services 5.9 6.1 -12.4 86.7 69.3 -0.2
Net Services Exports 67.5 100.0 -9.0 -3.2 -10.0 14.6
Source : Based on RBI’s Balance of Payments (BoP) data (BPM-5).
9.11 To boost services exports, the Government in its mid-term Review of Foreign Trade Policy 2015-2020, has increased incentives under Services Exports from India Scheme (SEIS) by 2 per cent, leading to an additional annual incentive of Rs. 1,140 crore which could help services exports including Hotel & Restaurant, Hospital, Educational services, etc. Although world trade volume of goods and services is projected to accelerate in 2018, enhanced global uncertainty, protectionism and stricter migration rules would be key factors in shaping India’s services exports.
MAJOR SERVICES: OVERALL PERFORMANCE
9.12 Some available indicators of the different services in India for 2016-17 (Table 4) along with the CMIE data (Table 5) show reasonably good performance of Tourism, Aviation, and Telecom sectors. The limited data available for 2017-18 also indicate good performance of these three sectors.

158 | Economic Survey 2017-18 Volume 2
Table 4: Performance of India’s Services Sector: Some Indicators
Sector Indicators UnitPeriod
2009-10 2015-16 2016-17 2017-18 IT –BPM** IT-BPM service revenues US $ billion 64.0 129.4 139.9 150-152P
Exports US $ billion 49.7 107.8 116.1 124-125P
Domestic US $ billion 14.3 21.6 23.8 26-26.5P
Aviation* Airline passengers (Total) Million 77.4 135.0 158.4 (76.1)86.7#
Domestic Million 45.3 85.2 103.7 (49.5)57.5#
International Million 32.1 49.8 54.7 (26.6)29.2#
Telecom Telecom connections (wireline and wireless)b
Billion 0.6 1.0 1.2 (1.1)1.2~
Tourism Foreign tourist arrivalsa Million 5.2 8.0 8.8 10.2
Foreign exchange earnings from tourisma
US $ billion 11.1 21.1 22.9 27.7
Shipping Gross tonnage of Indian shippingb Million GT 9.6 10.9 11.6 12.7@
No. of shipsb Numbers 998 1273 1316 1374@
Ports Port traffic Million tonnes 850.0 1071.9 1133.1 574.7#
Sources: Compiled from Telecom Regulatory Authority of India (TRAI), Ministry of Tourism, Ministry of Shipping, Directorate General of Civil Aviation, NASSCOM.
Note: a calendar years, for example 2009-10 for 2009; b As on 31 March of the financial year; @ data is as on 31 December 2017, # data is for April to September 2017, GT=gross tonnage; MT=metric tonnes; ** excluding hardware. p Range Projected for 2017-18. *Domestic Passengers carried by scheduled Indian carriers on scheduled domestic services only and International Passengers carried by scheduled Indian as well as foreign carriers to and from the Indian territory; data in parentheses is for same period of previous year.
9.13 The Baltic Dry Index, a freight index and a good proxy for the robustness of trade and shipping services which fell from a peak of 11,793 on 20 May 2008 to a low of 663 on
8 December 2008 and was in the red at 290 on 11 February 2016, improved since then and was at 1,164 on 17 January 2018 (Figure 4).
Figure 4: Baltic Dry Index
Figure 4: Baltic Dry Index
Source: https://in.investing.com/indices/baltic-dry-historical-data
0
2000
4000
6000
8000
10000
12000
14000
01-Jan-0802-M
ay-0801-Sep-0801-Jan-0903-M
ay-0902-Sep-0902-Jan-1004-M
ay-1003-Sep-1003-Jan-1105-M
ay-1104-Sep-1104-Jan-1205-M
ay-1204-Sep-1204-Jan-1306-M
ay-1305-Sep-1305-Jan-1407-M
ay-1406-Sep-1406-Jan-1508-M
ay-1507-Sep-1507-Jan-1608-M
ay-1607-Sep-1607-Jan-1709-M
ay-1708-Sep-1708-Jan-18
663 on 8 Dec 2008
290 on 11 Feb 2016
1164 on 17 Jan 2018
1 11793 on 20 May 2008
Source: https://in.investing.com/indices/baltic-dry-historical-data

Services Sector | 159
9.14 An analysis of the sales results of services sector firms in the last few quarters, shows that the only sector which has been showing signs of stress is the Construction and Real Estate sector. In the first two quarters of 2017-18, all sectors are performing well except Hotel & Restaurant and Construction & Real Estate sectors, in Q2.
Table 5: Growth in Net Sales of Select Services: Company Based Data
Services
Net Sales
2015-16 2016-172016-17 2017-18
Q1 Q2 Q3 Q4 Q1 Q2
Transport Logistics 1.0 7.3 4.9 6.7 9.8 7.7 6.6 4.3
Shipping -1.6 -18.7 -25.2 -29.2 -12.8 -4.7 5.1 4.4
Aviation 6.7 9.1 6.0 14.1 9.5 34.6 18.7 12.6
Retail trading 23.0 19.5 29.7 29.5 0.8 23.7 24.4 9.6
Health services 15.4 12.8 12.1 14.4 13.6 11.2 10.8 10.5
Hotel & Restaurant 8.1 2.7 2.0 4.3 3.9 0.8 4.8 -2.6
ITES 17.8 9.5 18.8 8.2 7.1 5.2 5.2 0.7
Software 11.2 7.2 10.7 6.8 7.3 4.5 3.0 4.7
Construction & Real Estate 7.6 -1.9 4.9 -6.5 -3.5 -1.9 7.4 -3.6
Source: Exim Bank of India Research (Data derived from CMIE).Note: Annual Data refers to Gross Sales.
MAJOR SERVICES: SECTOR-WISE PERFORMANCE AND SOME RECENT POLICIES
9.15 This section covers some of the important services for India based on their significance in terms of GDP/GVA, employment, exports and future prospects. Some important services covered in other chapters have been excluded to avoid duplication.
Tourism
9.16 As per the latest World Tourism Barometer of the United Nation’s World Tourism Organization (December, 2017 edition) international tourist arrivals reached a total of 1.2 billion in 2016, 46 million more than in the previous year, though the growth rate of 3.9 per cent was lower than in 2015 (4.6 per cent). In India, the Tourism sector has been performing well with Foreign Tourist Arrivals (FTAs) growing at 9.7 per cent to 8.8 million and Foreign Exchange Earnings (FEEs) at 8.8 per cent to US$ 22.9 billion in 2016. As per the provisional data of Ministry of Tourism, FTAs during 2017 were 10.2 million, with a growth of 15.6 per cent, while, the FEEs from tourism were US$ 27.7 billion, with a growth of 20.8 per cent over 2016 (Figure 5).

160 | Economic Survey 2017-18 Volume 2
Figure 5: Growth of FTAs, FEEs and Domestic Tourist VisitsFigure 5: Growth of FTAs, FEEs and Domestic Tourist Visits
Source: Based on data from Ministry of Tourism data.
-20
-10
0
10
20
30
40
5020
00
2001
2002
2003
2004
2005
2006
2007
2008
2009
2010
2011
2012
2013
2014
2015
2016
2017
Per c
ent
FTAs in India FEE ($ terms) Domestic Tourist Visits
Source: Based on data from Ministry of Tourism data.
9.17 Outbound tourism has also picked up in recent years, with the number of departures of Indian nationals from India growing at 7.3 per cent during 2016 to 21.9 million from 20.4 million, in 2015. This is more than double the foreign tourist arrivals in India. Domestic tourist visits grew by 12.7 per cent to 1,614 million in 2016 from 1,432 million in 2015. In terms of number of domestic tourist visits, Tamil Nadu, Uttar Pradesh, Andhra Pradesh, Madhya Pradesh, and Karnataka were the top 5 destination States, accounting for 61.3 per cent of total number of tourist visits in 2016. Amongst centrally protected ticketed monuments, for domestic visitors, Taj Mahal was the most visited monument in 2016 followed by Qutub Minar and Red Fort, while for foreign visitors Taj Mahal was the most visited monument, followed by Agra Fort and Qutub Minar.
9.18 Various initiatives have been taken by the Government to promote tourism. Recent measures include the introduction of the e-Visa facility under three categories of Tourist, Medical and Business for the citizens of 163 countries; launch of Global Media Campaign for 2017-18 on various Channels; launch of ‘The Heritage Trail’ to promote the World Heritage Sites in India, launch of International Media Campaign on various international TV channels; Celebration
of ‘Paryatan Parv’ having 3 components namely ‘Dekho Apna Desh’ to encourage Indians to visit their own country, ‘Tourism for All’ with tourism events at sites across all states in the country, and ‘Tourism & Governance’ with interactive sessions & workshops with stakeholders on varied themes. FTAs on e-Tourist Visa grew by 143 per cent to 10.8 lakh in 2016, and further grew by 57.2 per cent to 17.0 lakh during 2017.
IT –BPM Services
9.19 India’s Information Technology - Business Process Management (IT-BPM) industry grew by 8.1 per cent in 2016-17 to US$ 139.9 billion (excluding e-commerce and hardware) from US$ 129.4 billion in 2015-16, as per NASSCOM data. IT-BPM exports grew by 7.6 per cent to US$ 116.1 billion from US$ 107.8 billion during the same period. E-commerce market is estimated at US$ 33 billion, with a 19.1 per cent growth in 2016-17. However as per the RBI data, software exports registered a growth of (-) 0.7 per cent in 2016-17. In 2017-18 H1, it grew by 2.3 per cent. USA, UK and EU account for around 90 per cent of the total IT-ITES exports. While, there are new challenges surfacing in these traditional geographies, demand from APAC, Latin America and Middle East Asia is growing and new opportunities are emerging for expanding in continental Europe, Japan, China and Africa.
Services Sector | 161
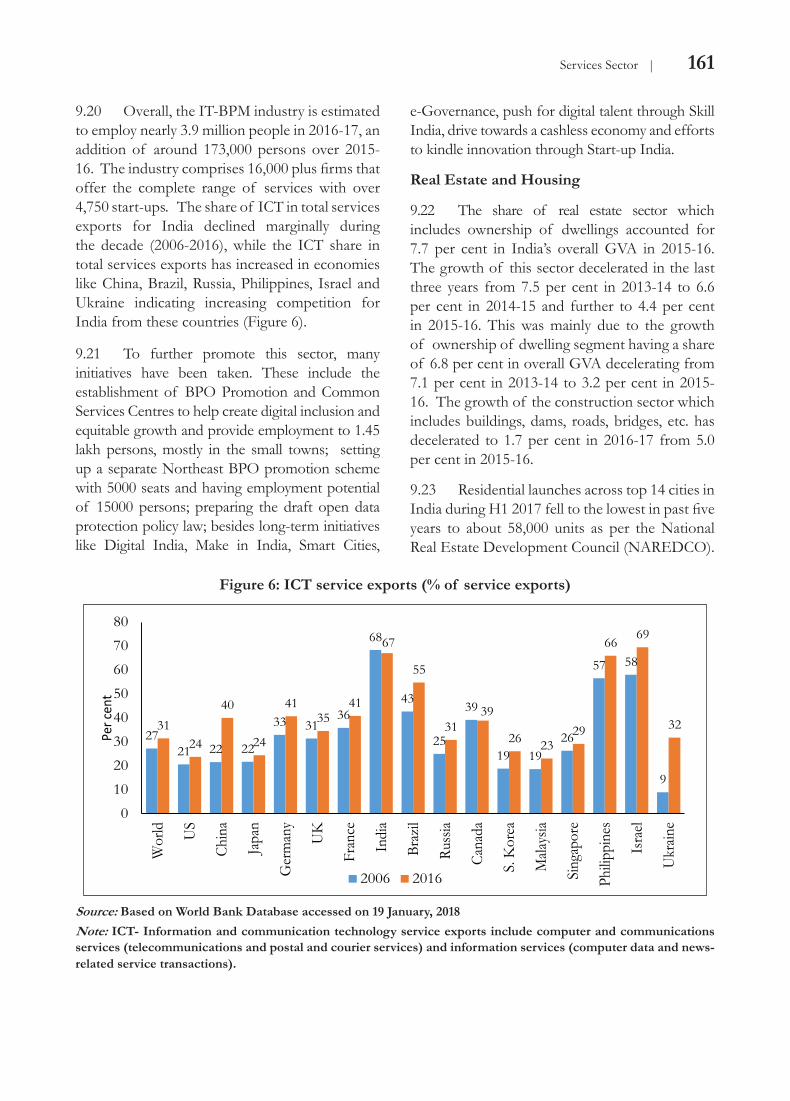
9.20 Overall, the IT-BPM industry is estimated to employ nearly 3.9 million people in 2016-17, an addition of around 173,000 persons over 2015-16. The industry comprises 16,000 plus firms that offer the complete range of services with over 4,750 start-ups. The share of ICT in total services exports for India declined marginally during the decade (2006-2016), while the ICT share in total services exports has increased in economies like China, Brazil, Russia, Philippines, Israel and Ukraine indicating increasing competition for India from these countries (Figure 6).
Figure 6: ICT service exports (% of service exports)
Figure 6: ICT service exports (% of service exports)
Source: Based on World Bank Database accessed on 19.01.2018, Note: ICT- Information and communication technology service exports include computer and communications services (telecommunications and postal and courier services) and information services (computer data and news-related service transactions).
2721 22 22
33 3136
68
43
25
39
19 1926
57 58
9
3124
40
24
4135
41
67
55
3139
26 2329
6669
32
01020304050607080
Wor
ld US
Chin
a
Japa
n
Ger
man
y
UK
Fran
ce
Indi
a
Braz
il
Russ
ia
Cana
da
S. K
orea
Mala
ysia
Sing
apor
e
Philip
pine
s
Isra
el
Ukr
aine
2006 2016
Per c
ent
Source: Based on World Bank Database accessed on 19 January, 2018 Note: ICT- Information and communication technology service exports include computer and communications services (telecommunications and postal and courier services) and information services (computer data and news-related service transactions).
9.21 To further promote this sector, many initiatives have been taken. These include the establishment of BPO Promotion and Common Services Centres to help create digital inclusion and equitable growth and provide employment to 1.45 lakh persons, mostly in the small towns; setting up a separate Northeast BPO promotion scheme with 5000 seats and having employment potential of 15000 persons; preparing the draft open data protection policy law; besides long-term initiatives like Digital India, Make in India, Smart Cities,
e-Governance, push for digital talent through Skill India, drive towards a cashless economy and efforts to kindle innovation through Start-up India.
Real Estate and Housing
9.22 The share of real estate sector which includes ownership of dwellings accounted for 7.7 per cent in India’s overall GVA in 2015-16. The growth of this sector decelerated in the last three years from 7.5 per cent in 2013-14 to 6.6 per cent in 2014-15 and further to 4.4 per cent in 2015-16. This was mainly due to the growth of ownership of dwelling segment having a share of 6.8 per cent in overall GVA decelerating from 7.1 per cent in 2013-14 to 3.2 per cent in 2015-16. The growth of the construction sector which includes buildings, dams, roads, bridges, etc. has decelerated to 1.7 per cent in 2016-17 from 5.0 per cent in 2015-16.
9.23 Residential launches across top 14 cities in India during H1 2017 fell to the lowest in past five years to about 58,000 units as per the National Real Estate Development Council (NAREDCO).

162 | Economic Survey 2017-18 Volume 2
Similarly, new residential sales, fell to five years low of about 101,850 units during this period. While sales during H1 2017 were down by over 38 per cent compared with H1 2016, unit launches were down by over 56 per cent during the same period. Though some recent reforms might have affected the residential market in the short term, these reforms helped in bringing down the unsold inventory levels from 888,373 units witnessed in April 2016, to about 807,903 units in October 2017. Private equity investments in the real estate sector have increased from US$ 0.9 billion in 2013 to over US$ 5.9 billion in 2016, recording more than six fold jump during this period. The year 2017 is on its course to witness the highest annual investment in Indian realty in the past decade, with about US$5 billion worth of funds already been invested between January and June 2017. The strength of the Indian economy and favorable demographics, coupled with the introduction of several growth oriented reforms are aiding the real estate sector to attract higher investments. Indian real estate has attracted institutional investments (excluding bank credit to commercial real estate) of over US$ 10.7 billion, since the beginning of 2016, which is more than half of the total investments witnessed since 2013. FDI into construction development sector declined to US$ 107 million in 2016. The reason for the substantial and continuous decline in FDI investments in this sector over the past five years was that the offshore investors have been deploying majority of their funds through debt or structured debt route. This protects their investments by providing certain fixed returns on the debt provided to developers and at the same time reduces the risk of investments. However, it has began to show signs of improvement with the total FDI of US$257 million in H1 2017, which is more than double the total FDI in 2016 full year. This positive sentiment was attributed to a host of factors including regulatory environment, enhanced infrastructure, and amendments to Real Estate Investment Trusts (REITs). These policy initiatives are expected to lead to higher transparency, accountability and make the sector better organised and structured, thereby increasing the investment. On demand side,
the individual housing loan disbursements of Public Sector Banks (PSBs) and Housing Finance Companies (HFCs) have shown an increase of nearly 11 per cent in 2016-17 over 2015-16. However, increasing non-performing assets (NPAs) of individual housing loan portfolios of PSBs and HFCs is a cause for concern.
9.24 As per NHB RESIDEX, housing price index has shown increasing annual trend in 36 cities during April-June 2017 out of 50 major cities, with Vizag recording the highest increase of 15.7 per cent, Delhi recording 8.1 per cent, and NOIDA recording the lowest increase of 0.9 per cent. Among the 13 cities witnessing a fall in index, the highest decline was recorded in Bhiwadi (-10.6 per cent), followed by Coimbatore (-6.6 per cent), and Chandigarh (-5.9 per cent).
9.25 Rising NPAs, higher risk provisioning assigned to real estate sector and dwindling profits in the real estate sector, have made banks reluctant to lend to the sector. As a result, share of bank lending for organized funding to real estate sector has dropped significantly from over 68 per cent in 2013, to 17 per cent in 2016. Interestingly, Private Equity (PE) funds and financial institutions such as pension funds and sovereign wealth funds have replaced banks as the largest source of this sector. The share of PE funds and these institutions in real estate funding has gone up significantly from 14 per cent in 2013 to over 82 per cent in 2016. On a cumulative basis for the 2013-16 period, PE funds have been the highest source of funding accounting for 57 per cent share, followed by bank lending with 34 per cent share, while the remaining 9 per cent is funded through FDI inflows.
9.26 Real estate and construction together, is the second largest employment provider in the country, next only to agriculture. It employed over 40 million workforce in 2013, and as per projections is slated to employ over 52 million workforce by 2017, and 67 million workforce by 2022. This implies that it will generate over 15 million jobs over the next five years, which will translate to about three million jobs annually.

Services Sector | 163
Nearly 90 per cent of the workforce employed in the real estate and construction sector are engaged in construction of buildings. The remaining 10 per cent workforce is involved in building completion, finishing, electrical, plumbing, other installation services, demolition and site preparation. Over 80 per cent of the employment in real estate and construction constitutes minimally skilled workforce, while skilled workforce account for over 9 per cent share, and the remaining are spread across work classes such as clerical, technicians, and engineers. As per the National Skill Development Council (NSDC), Real estate and construction is expected to require over 66 million people by 2022.
9.27 Some of the recent reforms and policies related to Real Estate sector include the Pradhan Mantri Awas Yojana (PMAY) with the government sanctioning over 3.1 million houses for the affordable housing segment in urban regions till November 2017. Of this, about 1.6 million houses have been grounded and are at various stages of construction, and about 0.4 million houses have been built under the mission. PPP policy for affordable housing was also announced on 21 September 2017 for affordable housing segment to provide
further impetus to the ambitious ‘Housing for all by 2022’ mission. Credit Linked Subsidy Scheme (CLSS) under PMAY was extended to the Middle Income Group (MIG) segment, which got included in the scheme from 01 January 2017. With the enactment of Real Estate (Regulation & Development) Act, 2016, it is anticipated that accountability would lead to higher growth across the real estate value chain, while compulsory disclosures and registrations would ensure transparency.
Research and Development
9.28 As per the CSO’s new method, there is no separate head for Research and Development (R&D), which is now a part of the professional scientific & technical activities. These services grew by 17.5 per cent and 41.1 per cent in 2014-15 and 2015-16 respectively. India-based R&D services companies, which account for almost 22 per cent of the global market, grew at 12.7 per cent. However, India’s gross expenditure on R&D has been low at around 1 per cent of GDP. India currently ranks 60th out of 127 on the Global Innovation Index (GII) 2017, though this ranking has improved from 66th rank in 2016. Among the BRICS countries only South Africa is behind India in R & D expenditure ranking.
Table 6: Global Innovation Index of some select economies
Global Innovation Index
2017
Human capital and research
Research and development
(R&D)Researchers
Gross expenditure on R&D (GERD)
(Rank) (Score) (Rank) (Score) (Rank) (Score) (Rank) (Score) (Rank) (Score)
Brazil 69 33.1 50 35.9 29 37.2 55 8.3 32 26.9
China 22 52.5 25 49.2 17 58.5 45 14.1 17 48.5
India 60 35.5 64 32.3 32 35.9 81 1.8 43 19.1
South Korea 11 57.7 2 66.2 1 88.2 3 85.8 2 98.4
Russia 45 38.8 23 50 25 41.5 29 37.8 34 26.1
South Africa 57 35.8 60 32.8 39 27.1 65 5.2 48 16.6
UK 5 60.9 6 63.3 10 69.5 18 54.1 21 39.5
USA 4 61.4 13 57.2 4 78.8 20 51.2 10 65
Source: Global Innovation Index 2017

164 | Economic Survey 2017-18 Volume 2
9.29 According to the global rankings of service providers in the Engineering R&D segment for 2016, the R&D spend by global top 500 R&D spenders is growing consistently at 1.5 per cent over the last two years with focus on building digital first R&D organizations. The total R&D Globalization & Services opportunity in 2016 was estimated at US$ 232 billion, and is projected to reach US$ 289 billion by 2021. Embedded and Software engineering constitute 76 per cent of the R&D outsourcing market. On the geographical spread, India, Western Europe and North America capture 75 per cent of the global Engineering R&D Services market. India’s Engineering R&D (ER&D) globalization and services market, which currently stands at about US$ 22 billion, is expected to reach US$ 38 billion by 2020.
9.30 However, according to the Global Competitiveness Report 2017-18, India’s capacity for innovation has been lower than that of many countries like the USA, the UK, South Korea, but better than China’s. In terms of university–Industry collaboration on R&D, India ranks better than all other BRICS countries and in terms of availability of scientists and engineers, it ranks
better than other BRICS countries except China. However, in terms of patents applications per million population, India significantly lags behind other BRICS countries and in terms of company spending on R&D, India ranks marginally below China (Table 7).
9.31 The government has taken many initiatives to promote the R&D sector in India, which include among others establishing the Atal Innovation Mission (AIM) in the National Institution for Transforming India (NITI) Aayog. Some other initiatives related to R&D include the following. The agreement between India and Israel in 2016 to enhance bilateral cooperation in science and technology provides US$ 1 million from each side in the next two years to support new R&D projects in the areas of big data analytics in healthcare and cyber security. The Ministry of Environment, Forest and Climate Change (MoEFCC) has announced an R&D initiative to develop next generation sustainable refrigerant technologies as alternatives to the currently used refrigerant gases like hydrofluorocarbons (HFCs), in order to mitigate its impact on the ozone layer and climate. The Department of Industrial Policy and Promotion (DIPP) aims at lowering the time
Table 7: Global Competitiveness Index: R&D Innovation
Country Capacity for innovation
Quality of scientific research
institutions
Company spending on
R&D
University – Industry
collaboration on R&D
Availability of scientists
and engineers
PCT patents granted/million
population
Overall Innovation
Score Rank Score Rank Score Rank Score Rank Score Rank Score Rank Score Rank
USA 6.0 2 6.0 5 5.9 2 5.7 2 5.7 2 176.5 10 5.8 2
UK 5.5 11 6.3 2 5.1 14 5.4 6 4.9 17 99.1 18 5.1 12
South Korea 4.7 35 4.8 32 4.4 28 4.4 27 4.5 38 249.5 5 4.8 18
India 4.5 42 4.7 35 4.5 23 4.4 26 4.6 32 1.7 63 4.1 29
China 4.5 44 4.6 36 4.6 21 4.4 28 4.7 29 17.7 30 4.1 28
South Africa 4.9 30 4.4 42 4.3 32 4.4 29 3.5 100 5.8 49 3.8 39
Russia 4.2 65 4.4 41 3.5 54 3.9 42 4.3 50 7.8 46 3.5 49
Brazil 4.1 73 3.7 77 3.4 62 3.4 70 3.6 90 3.4 53 3.2 85
Source: Global Competitiveness Report 2017-18, World Economic Forum. Note: PCT- Patent Cooperation Treaty.

Services Sector | 165
taken to clear pending Intellectual Property Rights (IPR) applications. The Department of Scientific & Industrial Research (DSIR) is operating a scheme for granting recognition & registration to in-house R&D units established by corporate sector, such as, development of new technologies, design & engineering, process/product/design improvements, developing new methods of analysis & testing, research for increased efficiency in use of capital equipment, materials & energy, pollution control, effluent treatment, recycling of waste products etc. As on 31st December 2016, in-house R&D units of 1900 firms were recognized by DSIR. Out of these, about 60 companies are offering R&D services, in the areas of Information Technology, Telecom, Healthcare, Power, Engineering, Biotechnology, Defence, etc. The Council of Scientific and Industrial Research, an autonomous body of DSIR is known for its cutting edge R&D knowledge base in diverse S&T areas and has a pan India presence through its network of 38 national laboratories, which undertake focused basic as well as applied research. CSIR has also established 39 outreach centres and 3 Innovation Complexes. CSIR’s R&D expertise and experience is embodied in around 3700 active scientists supported by around 6000 scientific and technical personnel. National Research Development Corporation (NRDC), a Public Sector Enterprise (PSE) of DSIR offers comprehensive technology transfer services for licensing of technologies and know-how to industries, which are assigned to NRDC by R&D institutions, universities, etc.
9.32 Buoyed by the government’s support, the R&D sector in India is all set to witness robust growth in the coming years. According to a study by management consulting firm Zinnov, engineering R&D market in India is estimated to grow at a CAGR of 14 per cent to reach US$ 42 billion by 2020. India is also expected to witness strong growth in its agriculture and pharmaceutical sectors as the government is investing large sums to set up dedicated research centres for R&D in these sectors. The Indian IT industry is also expected to add to the development of the R&D sector.
Space Services
9.33 Indian Space Programme contributes to national development, through the application of space technology, comprising communication, navigation and earth observation to address issues related to societal development and strategic requirements. Satellite based mapping and launching services are the two areas in which India is making a mark and has huge potential for the future. In Satellite Mapping, there has been a decline in the foreign exchange earnings in recent years, primarily due to free and open data policy adopted by many space agencies. India is negotiating with the customers for renewal of contracts. Further, Indian Space Research Organisation (ISRO) is pursuing a project to support ASEAN Member states including Myanmar to receive and process data from Indian remote sensing satellites (Resourcesat-2 and Oceansat-2) and also to provide training in space science, technology and applications for the benefit of the ASEAN member countries. Antrix currently enables direct reception and processing of data from Indian Remote Sensing (IRS) Satellites namely Resourcesat-2, Oceansat-2 and Cartosat-1 at International Ground Stations/ processing facilities outside India. There is further potential for exports and Antrix is working to increase the International Ground Station (IGS) and negotiations in this regard are in advanced stages. During 2017-18, Antrix has been working with various resellers across the globe for distribution of IRS data, including Europe, USA, Latin America, Africa and South Eastern Countries. During 2018-19, these efforts would be strengthened. New products and services released by ISRO would be marketed by Antrix. 9.34 In the case of Satellite Launching, as on March 2017, PSLV had successfully launched 254 satellites. This includes 37 National Satellites, 8 student satellites built by universities/ academic institutions, one re-entry mission and 209 foreign satellites from 29 Countries. Foreign exchange earnings of India from export of satellite launch services increased noticeably in 2015-16 and 2016-

166 | Economic Survey 2017-18 Volume 2
17 to Rs 394 crore and Rs 275 crore from Rs 149 crore in 2014-15. Consequently, India’s share in global satellite launch services revenue has also increased to 1.1 per cent in 2015-16 from 0.3 per cent in 2014-15. Foreign Exchange earnings in 2015-16 were higher due to two dedicated PSLV missions for launching international customer satellites, while in 2016-17 there was launching of international customer satellites only as co-passengers to the Indian national satellite missions. Antrix foresees greater utilization of PSLV, GSLV and GSLV-Mk-III launch services by the international community for launching their Low Earth orbit (LEO) satellites.
Conclusion9.35 The growth of India’s services sector is expected to improve in 2017-18 vis-a-vis 2016-17. This improvement is also reflected in the Nikkei/IHS Markit Services Purchasing Manager’s Index (PMI) which was 48.5 in November 2017 but improved to 50.9 in December 2017. The prospects look bright with good performance of sub sectors like Tourism, Aviation, and Telecom, robust services trade performance with even growth of major services like software returning to positive territory. The downward risk, however, lies in the external environment for software and business services.