08chapter4 4.pdf
TRANSCRIPT

4.4-1
4.4 RECYCLED CONCRETE (RC) AGGREGATE
4.4.1 Introduction
The coarse aggregates chosen for this research project included:
• 14/10mm RC Aggregate manufactured by Recycling Industries Pty Ltd at the
Laverton North recycling plant and;
• 14/10mm N (natural) Aggregate, a locally available basalt supplied by Boral
Resources Pty Ltd and used as a control aggregate
Both aggregates are commercially available products. The Class1, 14/10mm RC
Aggregate is a ready to use concrete aggregate of a fixed grading. However, in the case
of the 14/10mm N Aggregate, in order to keep the grading as a constant parameter in
both aggregate, two single size aggregates; the 14mm and 10mm basalt aggregate were
mixed to a required particle size distribution. In standard industry operations, similar or
any other desired grading, is produced from a single sized aggregate, which is dozed
and combined in the concrete batching process. Figure 4.4.1 presents the 14/10mm RC
Aggregate in a stockpile at the Laverton North recycling plant.
Figure 4.4.1 Stockpile of RC Aggregate
As a general rule, the suitability of coarse aggregate as a material for concrete
production is decided mainly due to its physical and mechanical properties. The
Australian Standard AS2758.1-1998 ‘Aggregates and rock for engineering purposes,
Part 1: Concrete aggregates’ specifies these properties and refers to testing procedures
800mm

4.4-2
for a specific property. Thorough knowledge of the basic engineering properties of
coarse aggregate is fundamental, as it allows concrete technologists to design concrete
mixes.
This section of the report presents outcomes of the characterisation of selected recycled
concrete aggregate and differentiates the aggregate from comparable natural coarse
aggregate in a range of properties including: composition of aggregate particles, content
of foreign materials, particle and bulk densities, water absorption, and porosity. In
addition, the re-cementing potential of RC Aggregate is reported.
4.4.2 Composition – Cement Paste Residue Content
Pertinent to its composition, commonly used coarse aggregate (including basalt) used in
the production of concrete can be seen as a homogeneous material. However, the
composition of RC Aggregate is not so uniform, as the feedstock material used in its
production is already a composite in nature; cement paste and aggregate, and it may
consist of other waste.
To optimise the effectiveness of waste recovery and to minimise the variations of
recycled products, the concrete waste is separated at source from other C&D waste, and,
preferably delivered to recycling plants with minimal content of other waste materials.
The bulk of the concrete waste is crushed into smaller particles of specified size and in
the process, during particular stages, electromagnets or manual pickers remove any
foreign material including steel reinforcement. In general, variability of the raw
material does not affect the aggregate’s grading, however, the content of foreign
material in recycling products (RC Aggregate) depends strongly on the degree of
contamination of the feedstock material, and on the effectiveness of segregation of those
materials at various stages of the production process.
Uncontaminated, 14/10mm RC Aggregate consists of some particles of natural
aggregate (fine and coarse fraction), of particles of natural aggregate coated with some
cement paste residue (cpr), and of particles of pure cpr. The size of these particles
ranges from sporadic 19mm aggregate pieces, though majority of them are of 14 and
4.4-3
10mm in size, to an insignificant percentage of particles smaller than 75 microns. In the
uncontaminated particles, the relative content of natural aggregate and cpr particles has
considerable bearing on the basic engineering properties of RC Aggregate. The
differences between natural aggregate and cpr in crushing value, water absorption, and
porosity, might be quite substantial, therefore, the relative content of those components
in RC Aggregate has potential to significantly impact the aggregate properties.
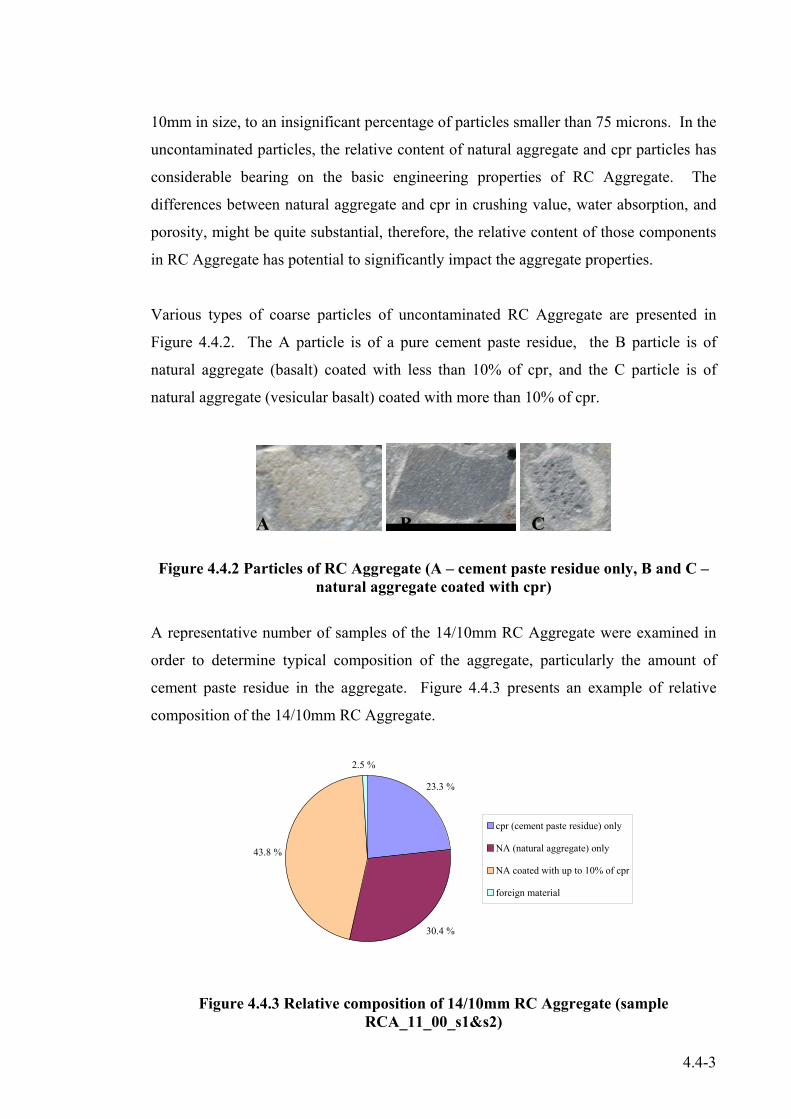
Various types of coarse particles of uncontaminated RC Aggregate are presented in
Figure 4.4.2. The A particle is of a pure cement paste residue, the B particle is of
natural aggregate (basalt) coated with less than 10% of cpr, and the C particle is of
natural aggregate (vesicular basalt) coated with more than 10% of cpr.
Figure 4.4.2 Particles of RC Aggregate (A – cement paste residue only, B and C – natural aggregate coated with cpr)
A representative number of samples of the 14/10mm RC Aggregate were examined in
order to determine typical composition of the aggregate, particularly the amount of
cement paste residue in the aggregate. Figure 4.4.3 presents an example of relative
composition of the 14/10mm RC Aggregate.
43.8 %
2.5 %
30.4 %
23.3 %
cpr (cement paste residue) only
NA (natural aggregate) only
NA coated with up to 10% of cpr
foreign material
Figure 4.4.3 Relative composition of 14/10mm RC Aggregate (sample
RCA_11_00_s1&s2)
A CB

4.4-4
Test results indicated that about 70% of the aggregate consists of natural aggregate
particles, and up to 30% of cement paste residue. The amount of foreign materials
shown in Figure 4.4.3 of 2.5% is an example of extremely high content, considering that
on average, foreign material accounts for approximately 1.18% by weight.
Figure 4.4.4 presents data on composition of the 14/10mm RC Aggregate over a period
of three years. The composition of cement paste residue content in the aggregate seems
to be in a well defined range with a standard deviation (STDEV) of 2.8% in 1999, 1.7%
in 2000, and 3.0% in 2001.
1.5
44.2
22.2
32.1
0.0
5.0
10.0
15.0
20.0
25.0
30.0
35.0
40.0
45.0
50.0
cpr (cement pasteresidue) only
NA (natural aggregate)only
NA coated with up to10% of cpr
foreign material
RC Aggregate constituents
Con
tent
[%]
199920002001
Figure 4.4.4 Composition of 14/10mm RC Aggregate (after additional segregation)
In the course of mechanical segregation of cpr from natural aggregate, it has been
observed that other than a small number of particles, the majority of natural aggregate
within RC Aggregate has not been crushed during the manufacturing process. The less
common cases of broken natural aggregate part were associated with a very high
compressive strength of original concrete (Recycling Industries, 1999). This confirms
the presumption that the majority of cement paste residue in currently produced RC
Aggregate has a lower strength in comparison to that of natural aggregate.

4.4-5
4.4.3 Content of Physical Contaminants
The Australian Standard AS 2758.1-1998 ‘Part 1. Concrete aggregates’ sets the content
limits for some impurities in aggregate, which include sugars, soluble salts, organic
mater and clay minerals. The content limits in both fine and coarse aggregate set
control measures to eliminate any adverse effects of these impurities on the strength,
abrasion resistance, surface finish and durability of concrete. Organic matter, sugar, or
any other carbohydrates influence setting time by delaying or suspending the set of
cement in concrete. A higher than permitted level of soluble salts in aggregate can
cause disintegration of concrete and corrosion of steel reinforcement, whereas, clay
minerals in aggregate cause strength reduction and volume changes.
The content of impurities in alternative concrete aggregate also has its limitations.
Commercial specifications for 14/10mm RC Aggregate set the maximum content of all
foreign materials of 1% by mass in Class 1A, and 2% in Class 1B aggregate. The
specifications do not take into account soluble salts or sugar content, but rather high
density materials such as steel reinforcement; and low density materials such as wood
and other organic matter. Figure 4.4.5 presents a breakdown by standard particle sizes
of a sample of the 14/10mm RC Aggregate into foreign materials and uncontaminated
aggregate.
Figure 4.4.5 Sample of 14/10mm RC Aggregate with segregated foreign materials
Pure 14/10mm RC Aggregate
Segregated foreign material

4.4-6
The amount of foreign materials in the 14/10mm RC Aggregate was determined from a
number of representative samples weighing 5kg that were randomly selected from
monthly batches of the aggregate. The RC Aggregate was dried in a laboratory oven at
a temperature of 103 ±2°C, sieved, then any organic and inorganic materials other than
clean pieces of the aggregate were isolated and their mass determined. Figure 4.4.6
presents the average percentages of all foreign materials in Class1, 14/10mm RC
Aggregate determined over a period of three years.
1.23
1.51
0.81
0.00
0.20
0.40
0.60
0.80
1.00
1.20
1.40
1.60
Jan-Dec 1999 Jan-Dec 2000 Jan-Aug 2001
Period of time
Perc
enta
ge b
y w
eigh
t
Figure 4.4.6 Average content of foreign materials in 14/10mm RC Aggregate
The results show that the average total content of all physical contaminants in RC
Aggregate range between 0.81% and 1.51% with a few extreme cases where the highest
content of 5% in sample RCA_08_00 was noted. In general, the total level of foreign
material in the aggregate is below the limit indicated in the manufacturer’s
specification.
Furthermore, the amount of low density particles within RC Aggregate was determined.
After the segregation of uncontaminated particles and any foreign materials in RC
Aggregate, the aggregate was immersed in water to identify low density particles. The
low density particles were then dried and weighed. The test results show an average
content of 0.025%, which is considered as insignificant. It was observed that in
majority of tested aggregate, low density particles were not present. Figure 4.4.7

4.4-7
presents the average content of particles lighter that 1,000kg/m3 in 14/10mm RC
Aggregate measured over a period of three years.
0.04
0.01
0.03
0.00
0.01
0.01
0.02
0.02
0.03
0.03
0.04
0.04
0.05
0.05
Jan-Dec 1999 Jan-Dec 2000 Jan-Aug 2001
Period of time
Perc
enta
ge b
y w
eigh
t
Figure 4.4.7 Average content of low density (<1,000kg/m3) particles in 14/10mm
RC Aggregate
The number and amount of different types of foreign materials in RC Aggregate is
highly dependent on the concrete waste stream, which is instigated by the choice of
demolition method and whether significant separation of concrete waste from other
C&D debris is employed. The content of foreign materials also depends on the
handling of feedstock at the recycling plant and on the effectiveness of their removal
during the crushing process.
The production of 14/10mm RC Aggregate at the Laverton North recycling plant is
governed by quality assured (QA) procedures. The manufacturer makes every effort to
minimise the amount of different categories of foreign materials in the aggregate,
especially those which contribute to volume instability such as; bricks, gypsum, wood,
clay lumps, and plate glass. Figure 4.4.8 presents the average number of different types
of physical contaminants in the aggregate.

4.4-8
7.5
4.9
5.6
0.0
1.0
2.0
3.0
4.0
5.0
6.0
7.0
8.0
Jan-Dec 1999 Jan-Dec 2000 Jan-Aug 2001
Period of time
Perc
enta
ge b
y w
eigh
t
Figure 4.4.8 Average number of foreign materials in 14/10mm RC Aggregate
It is interesting to note that over the three year testing period, the number of different
categories of foreign materials has decreased from an average of 7.5 to just below 5.
This illustrates the effectiveness of the QA procedures, and demonstrates improvements
in the quality of 14/10mm RC Aggregate.
Although the presence of some inert physical contaminants such as plastics and metals
can have a lesser impact on new concrete, the degradable organic matter or reactive
C&D waste such as gypsum in plasterboard, plate glass, and to some extend bricks, can
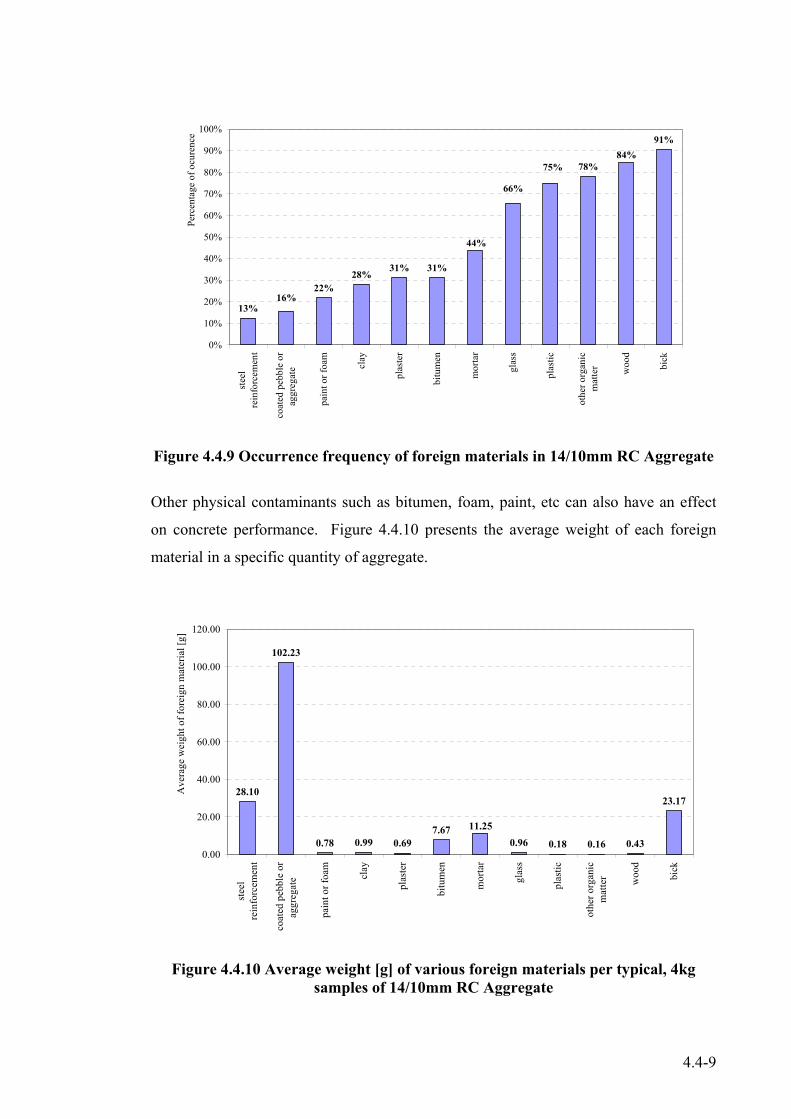
lead to deleterious reactions. The rate of recurrence of different types of foreign
materials in the aggregate was examined to identify the most frequently present physical
contaminants. Figure 4.4.9 presents data on the rate occurrence of different types of
impurities in 14/10mm RC Aggregate.
It has been noticed that in the majority of examined samples; bricks, wood, other
organic matter (leaves, grass, twigs, etc), plastics and glass were present. These
materials have a potential to activate localised internal expansion or impair the surface
finish of concrete, consequently reducing its strength and/or durability. Reoccurrence,
and an above the limit content of plate glass and brick particles can lead to an alkali
silica reaction or the slaking of some types of bricks.
4.4-9
13%
22%28%
31% 31%
78%
91%84%
75%
66%
44%
16%
0%
10%
20%
30%
40%
50%
60%
70%
80%
90%
100%
stee
lre
info
rcem
ent
coat
ed p
ebbl
e or
aggr
egat
e
pain
t or f
oam
clay
plas
ter
bitu
men
mor
tar
glas
s
plas
tic
othe
r org
anic
mat
ter woo
d
bick
Perc
enta
ge o
f ocu
renc
e
Figure 4.4.9 Occurrence frequency of foreign materials in 14/10mm RC Aggregate
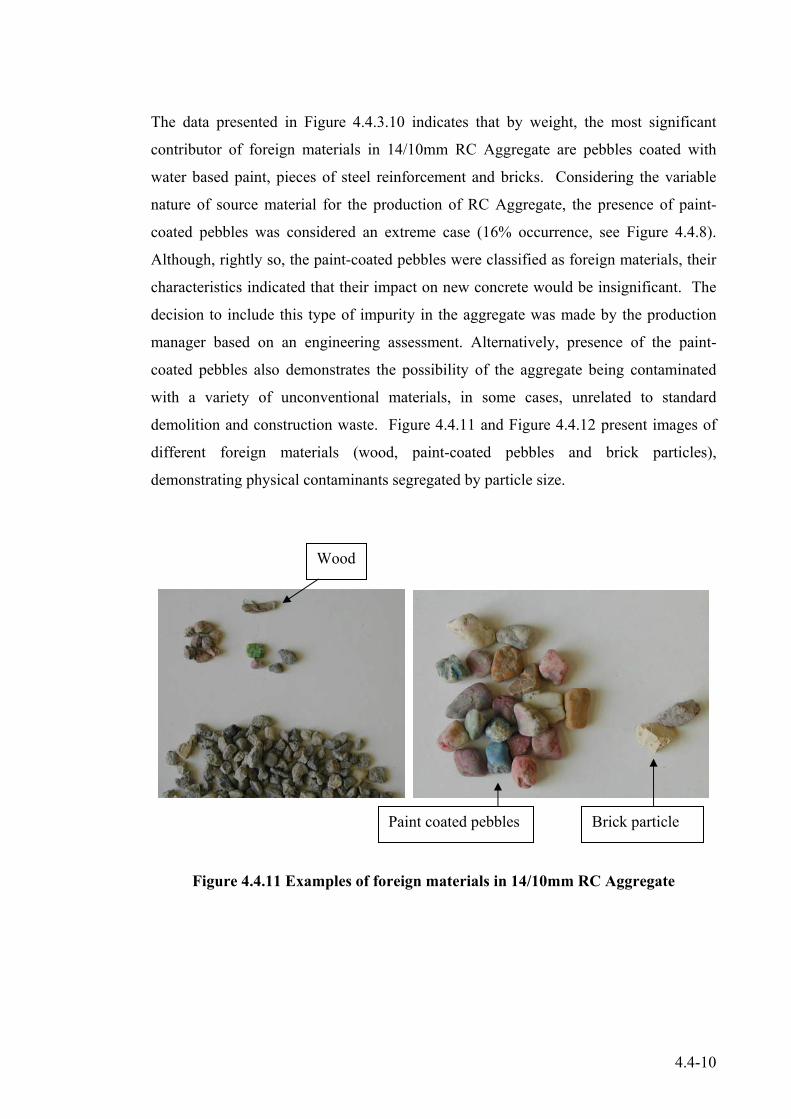
Other physical contaminants such as bitumen, foam, paint, etc can also have an effect
on concrete performance. Figure 4.4.10 presents the average weight of each foreign
material in a specific quantity of aggregate.
28.10
102.23
0.78 0.99 0.697.67
0.96 0.18 0.16 0.43
23.17
11.25
0.00
20.00
40.00
60.00
80.00
100.00
120.00
stee
lre
info
rcem
ent
coat
ed p
ebbl
e or
aggr
egat
e
pain
t or f
oam
clay
plas
ter
bitu
men
mor
tar
glas
s
plas
tic
othe
r org
anic
mat
ter woo
d
bick
Ave
rage
wei
ght o
f for
eign
mat
eria
l [g]
Figure 4.4.10 Average weight [g] of various foreign materials per typical, 4kg samples of 14/10mm RC Aggregate
4.4-10
The data presented in Figure 4.4.3.10 indicates that by weight, the most significant
contributor of foreign materials in 14/10mm RC Aggregate are pebbles coated with
water based paint, pieces of steel reinforcement and bricks. Considering the variable
nature of source material for the production of RC Aggregate, the presence of paint-
coated pebbles was considered an extreme case (16% occurrence, see Figure 4.4.8).
Although, rightly so, the paint-coated pebbles were classified as foreign materials, their
characteristics indicated that their impact on new concrete would be insignificant. The
decision to include this type of impurity in the aggregate was made by the production
manager based on an engineering assessment. Alternatively, presence of the paint-
coated pebbles also demonstrates the possibility of the aggregate being contaminated
with a variety of unconventional materials, in some cases, unrelated to standard
demolition and construction waste. Figure 4.4.11 and Figure 4.4.12 present images of
different foreign materials (wood, paint-coated pebbles and brick particles),
demonstrating physical contaminants segregated by particle size.
Figure 4.4.11 Examples of foreign materials in 14/10mm RC Aggregate
Brick particle Paint coated pebbles
Wood
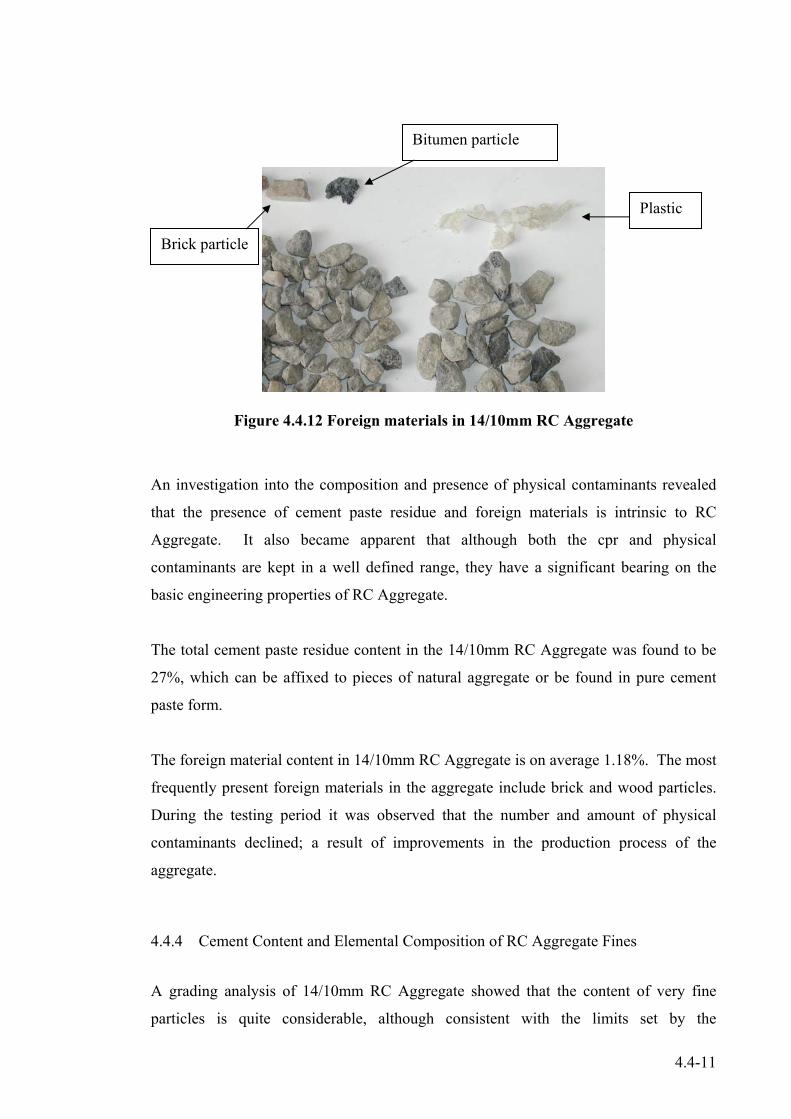
4.4-11
Figure 4.4.12 Foreign materials in 14/10mm RC Aggregate
An investigation into the composition and presence of physical contaminants revealed
that the presence of cement paste residue and foreign materials is intrinsic to RC
Aggregate. It also became apparent that although both the cpr and physical
contaminants are kept in a well defined range, they have a significant bearing on the
basic engineering properties of RC Aggregate.
The total cement paste residue content in the 14/10mm RC Aggregate was found to be
27%, which can be affixed to pieces of natural aggregate or be found in pure cement
paste form.
The foreign material content in 14/10mm RC Aggregate is on average 1.18%. The most
frequently present foreign materials in the aggregate include brick and wood particles.
During the testing period it was observed that the number and amount of physical
contaminants declined; a result of improvements in the production process of the
aggregate.
4.4.4 Cement Content and Elemental Composition of RC Aggregate Fines
A grading analysis of 14/10mm RC Aggregate showed that the content of very fine
particles is quite considerable, although consistent with the limits set by the
Brick particle
Plastic
Bitumen particle

4.4-12
manufacturer. The nature of the raw material and processes involved in the production
of the aggregate make the fines an integral part of the aggregate. The average content of
particles smaller than 75μm in the aggregate was found to be 2%. This was determined
by dry (see section 4.4.7) and wet sieve processes.
Observations made during the examination of elemental composition of the solid
particles of cement paste residue of RC Aggregate’s prompted further investigation into
the aggregate’s fines. Studies on the elemental and mineral composition of the fines
were conducted in addition to an assessment of re-cementing characteristic of the fines.
The re-cementing value of the fines was expressed as an equivalent of GB cement in the
aggregate. A calibration curve was devised based on the increase in temperature of
accelerated hydration of 0.5% to 1.5% of cement in the aggregate. In addition, the GB
cement was substituted with fines of the 14/10mm RC Aggregate and rise in
temperature was recorded. Figure 4.4.13 shows the calibration curve and an increase in
temperature due to accelerated hydration of some of the aggregate’s fines.
6
7
8
9
10
11
12
13
14
0 0.1 0.2 0.3 0.4 0.5 0.6 0.7 0.8 0.9 1
Cement content [%]
Tem
pera
ture
rise
[0 C]
Figure 4.4.13 Equivalent GB cement content in 14/10mm RC Aggregate
The results indicate that a 2% inclusion of cement paste residue particles smaller than
75μm, causes a temperature rise, which is characteristic of the hydration of cements.
Based on the temperature rise and SEM results that indicate a high calcium content in
4.4-13
the fines, it can be concluded that a 2% content of particles smaller than 75μm in
14/10mm RC Aggregate, could have an equivalent cementing potential of
approximately 0.57% of GB cement.
More extensive studies using XRD and methodology similar to that described in this
section are currently being undertaken to further investigate the influence of cement
paste residue on chemical bonding in concrete made from RC Aggregate.
The Scanning Electron Microscopy was used to investigate the differences in elemental
(oxide) composition between natural and RC Aggregate, and to analyse mechanically
induced cracks in recycled aggregate.
Examination of the elemental composition aimed at supplementing the study of the re-
cementing potential of the fines and of cement paste residue of 14/10mm RC
Aggregate. Representative powder samples, mainly derived from the aggregate’s fines
(some powder samples were obtained from crushed cpr) and solid samples purposely
prepared or cut from RA Concrete were used. Areas as large as possible of powder and
solid samples were analysed using Energy Dispersive X-ray facilities to determine
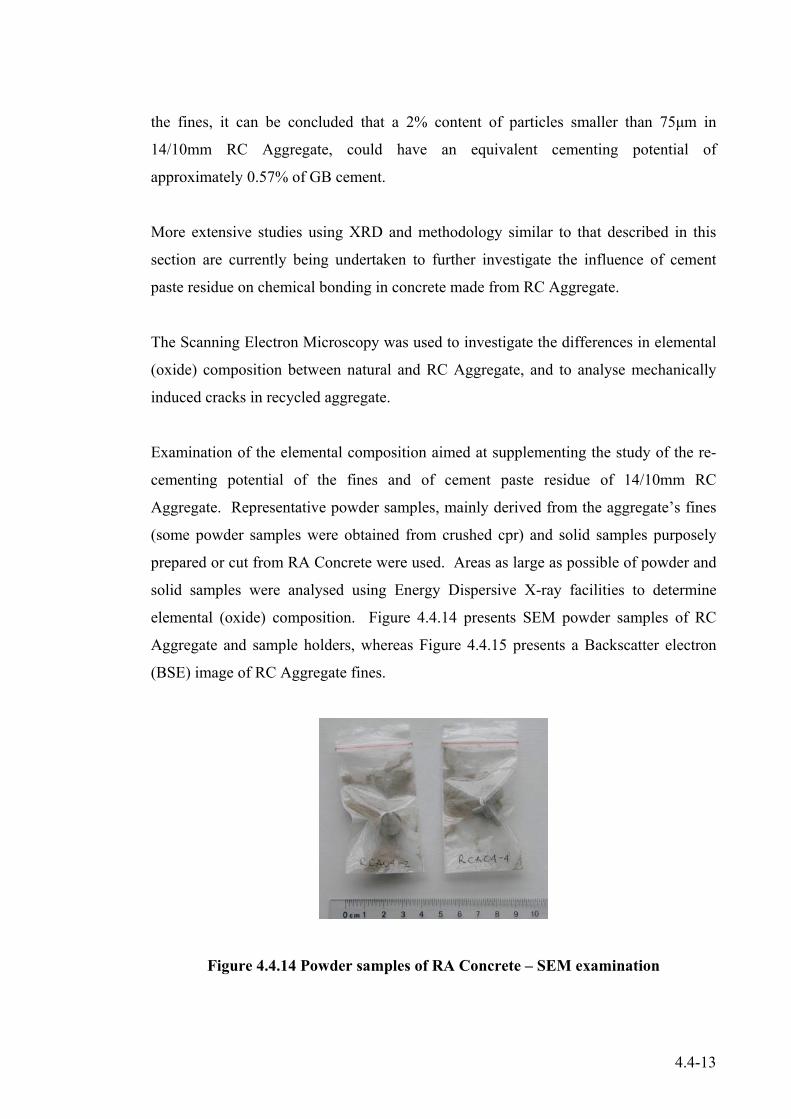
elemental (oxide) composition. Figure 4.4.14 presents SEM powder samples of RC
Aggregate and sample holders, whereas Figure 4.4.15 presents a Backscatter electron
(BSE) image of RC Aggregate fines.
Figure 4.4.14 Powder samples of RA Concrete – SEM examination

4.4-14
Figure 4.4.15 BSE image of RC Aggregate fines
In each powder sample that was examined by the use of SEM, a number of
representative areas were selected to perform an elemental composition analysis. Figure
4.4.16 presents a plot of the Energy Dispersive X-ray analysis results of one of the areas
representing RC Aggregate fines.
Figure 4.4.16 ED X-ray analysis of RC Aggregate fines
The analysis of the BSE images of the RC Aggregate fines indicate relatively well-
distributed particles of various sizes smaller then 75µm, which could indicate presence
of partially hydrated cement particles or particles of pozzolanic materials. An
apparently equal distribution of lighter grey and darker grey areas indicates presence of
calcium and silica elements respectively. The results of the ED X-ray analysis (Figure

4.4-15
4.4.16) indicate that two equally dominant elements present in RC Aggregate fines are
silica and calcium. Apart from that, there are also traces of other elements present
including; aluminium, iron, potassium, sulphate, magnesium, chloride, titanium and
sodium. When compared with a standard natural aggregate which does not contain
those elements to such an extent; the elements could be considered as contaminants, and
their influence on hydration of cement should be investigated and taken into account
(section 2.7.3 Table 12 in this document).
In order to gain a thorough understanding of basic characteristics of RC Aggregate
fines, two similar materials were chosen to provide the basis for comparison; fines of
basaltic aggregate and GB cement. Figure 4.4.17 shows an example of a BSE image of
fines of natural aggregate (basalt), and Figure 4.4.18 shows the Energy Dispersive X-
ray analysis of the basalt fines passing through a 75µm sieve.
Figure 4.4.17 BSE image of natural aggregate (basalt) fines

4.4-16
Figure 4.4.18 ED X-ray analysis of natural aggregate (basalt) fines
The particular shape of basaltic fines is more elongated and angular than those of RC
Aggregate fines, which is attributed to less handling and to the structural makeup of
natural aggregate. The fines of basalt aggregate are less round and have relatively high
content of very fine particles. In comparison, the fines of RC Aggregate, which are
made from cement paste residue (relatively softer and structurally weaker material),
have more rounded particles.
Observations based on numerous visual inspections revealed that the basalt fines
contain approximately 50% of 75µm particles and 50% of particles smaller than 75µm.
Observations based on colour differentiation indicate that in most samples
approximately 70% of particles are of silica (darker grey) and that there is a relatively
high content of metallic elements (brighter colours).
Samples of the GB cement particles were also investigated using the BSE and EDX
analysis. Figure 4.4.19 presents an example of typical BSE images and Figure 4.4.20
shows the EDX of GB cement.

4.4-17
Figure 4.4.19 BSE image of GB cement
Figure 4.4.20 ED X-ray analysis of GB cement
An analysis of BSE images reveals that approximately 95% of GB cement particles are
significantly smaller than 75µm, and that the predominant particle size is approximately
15µm. The slightly lighter colour of the cement particles seen on the BSE images is
indicative of calcareous elements. The ED X-ray analysis plot of the GB shows that
approximately 75% of the total content of the cement is calcium, in one of its oxide
forms.
Solid samples of RC Aggregate were analysed using the same procedures and testing
environment. Figure 4.4.21 shows a typical example of a Backscatter Electron image of
highly weathered cement paste residue.
4.4-18
Figure 4.4.21 BSE image of cement paste residue
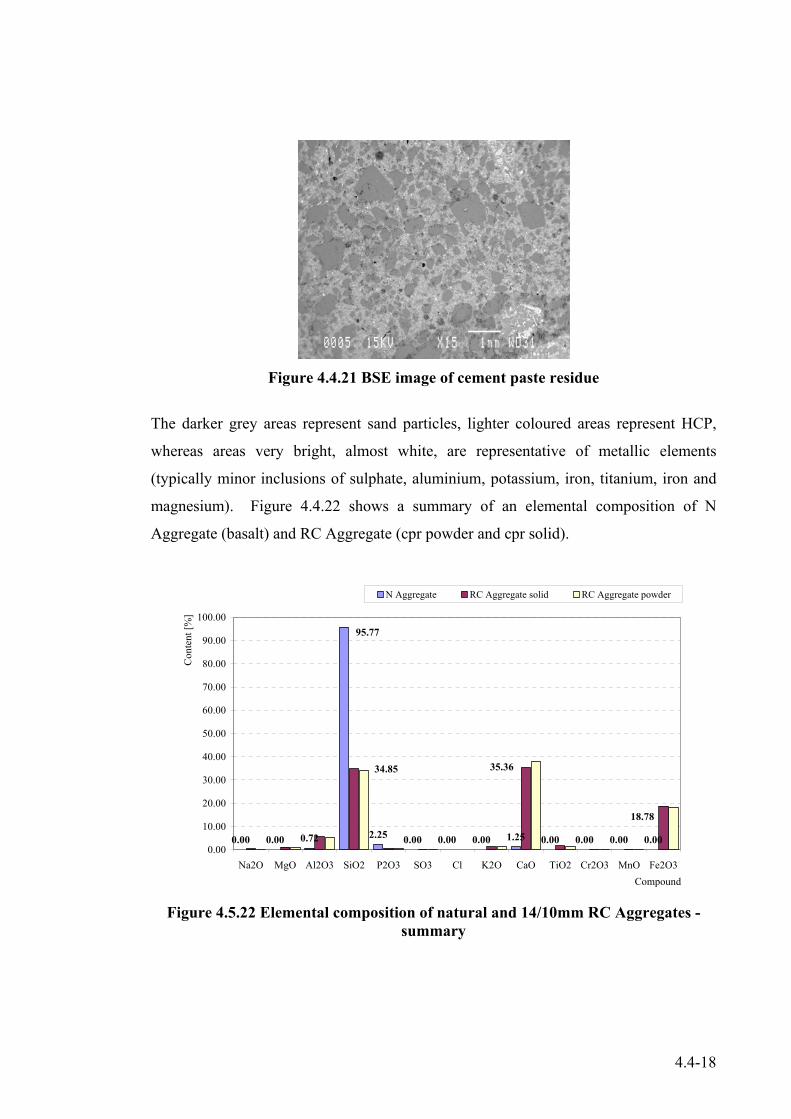
The darker grey areas represent sand particles, lighter coloured areas represent HCP,
whereas areas very bright, almost white, are representative of metallic elements
(typically minor inclusions of sulphate, aluminium, potassium, iron, titanium, iron and
magnesium). Figure 4.4.22 shows a summary of an elemental composition of N
Aggregate (basalt) and RC Aggregate (cpr powder and cpr solid).
0.00 0.00 0.72 2.25 0.00 0.00 0.00 1.25 0.00 0.00 0.00 0.00
95.77
18.78
34.85 35.36
0.00
10.00
20.00
30.00
40.00
50.00
60.00
70.00
80.00
90.00
100.00
Na2O MgO Al2O3 SiO2 P2O3 SO3 Cl K2O CaO TiO2 Cr2O3 MnO Fe2O3Compound
Con
tent
[%]
N Aggregate RC Aggregate solid RC Aggregate powder
Figure 4.5.22 Elemental composition of natural and 14/10mm RC Aggregates -
summary

4.4-19
4.4.5 Particle Density
The saturated surface dry (SSD), apparent and dry particle densities of the 14/10mm RC
Aggregate were examined to enable the author to make a comparison with the natural
reference aggregate and to allow accurate concrete mix design. A representative (36
reduced to 12) number of samples were examined over a period of three years. The
total number of samples and testing frequency was decided on the basis of low
variability of the tested aggregate. Figures 4.4.23 present surface dry particle density of
the 14/10mm RC Aggregate.
2.25
2.30
2.35
2.40
2.45
2.50
2.55
2.60
1 2 3 4 5 6 7 8 9 10 11 12
Sample group
Satu
rate
d dr
y su
rfac
e de
nsity
[t/m
3]
Figure 4.4.23 Saturated surface dry density of 14/10mm RC Aggregate
The average SSD particle density of 14/10mm RC Aggregate is well above the limit
specified by both the Australian Standard (AS 2758.1-1998) and the aggregate
manufacturer. The average of 2,450kg/m3 exceeds the specified minimum of
2,100kg/m3. The relatively small variation (STDEV of 40kg/m3) which, combined with
a relatively high density of the aggregate, makes it a suitable concrete aggregate. This
in turn increases the confidence of concrete technologists that basic properties such as
SSD particle density of aggregate are in a well defined range, which subsequently
assists in accurate concrete mix design.
2,450kg/m3
4.4-20
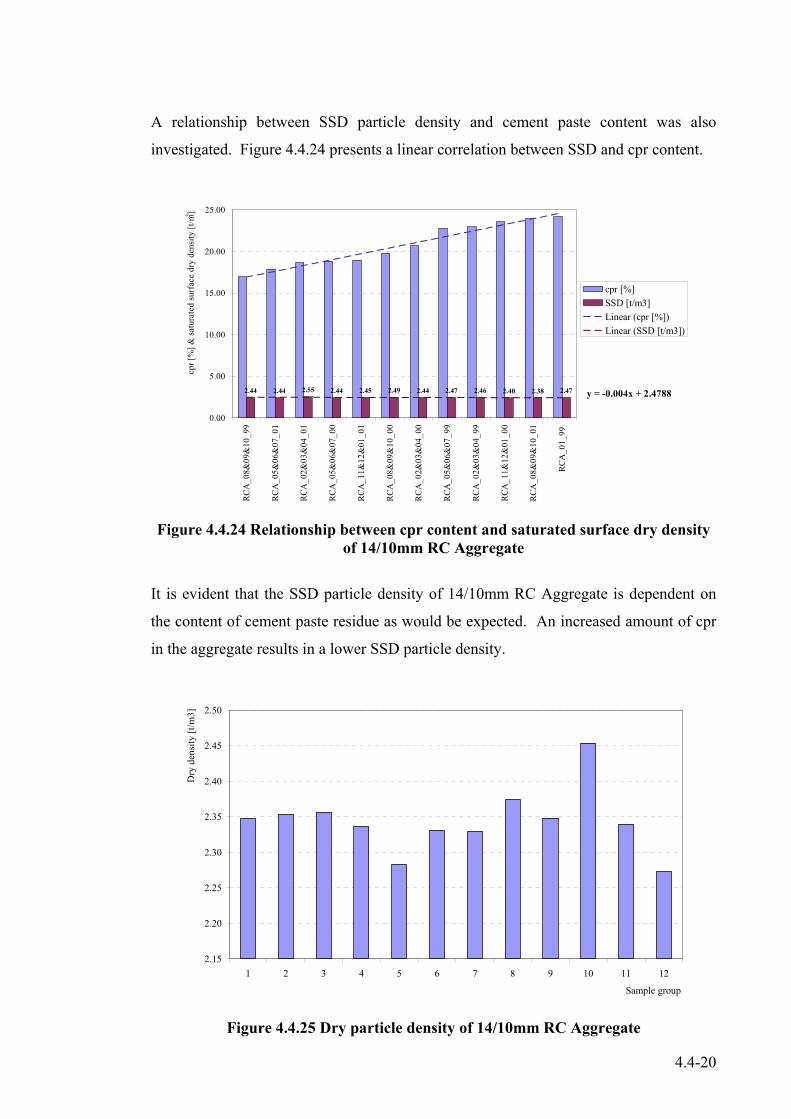
A relationship between SSD particle density and cement paste content was also
investigated. Figure 4.4.24 presents a linear correlation between SSD and cpr content.
2.44 2.44 2.55 2.44 2.45 2.49 2.44 2.47 2.46 2.40 2.38 2.47 y = -0.004x + 2.4788
0.00
5.00
10.00
15.00
20.00
25.00
RCA
_08&
09&
10_9
9
RCA
_05&
06&
07_0
1
RCA
_02&
03&
04_0
1
RCA
_05&
06&
07_0
0
RCA
_11&
12&
01_0
1
RCA
_08&
09&
10_0
0
RCA
_02&
03&
04_0
0
RCA
_05&
06&
07_9
9
RCA
_02&
03&
04_9
9
RCA
_11&
12&
01_0
0
RCA
_08&
09&
10_0
1
RCA
_01_
99
cpr [
%] &
satu
rate
d su
rfac
e dr
y de
nsity
[t/m
3 ]
cpr [%]SSD [t/m3]Linear (cpr [%])Linear (SSD [t/m3])
Figure 4.4.24 Relationship between cpr content and saturated surface dry density
of 14/10mm RC Aggregate
It is evident that the SSD particle density of 14/10mm RC Aggregate is dependent on
the content of cement paste residue as would be expected. An increased amount of cpr
in the aggregate results in a lower SSD particle density.
2.15
2.20
2.25
2.30
2.35
2.40
2.45
2.50
1 2 3 4 5 6 7 8 9 10 11 12
Sample group
Dry
den
sity
[t/m
3]
Figure 4.4.25 Dry particle density of 14/10mm RC Aggregate

4.4-21
Experimental procedures of the Australian Standard 1141.6.1 were also used to
determine dry particle and apparent densities. Figure 4.4.25 presents the dry particle
density of 14/10mm RC Aggregate.
The dry particle density of 14/10mm RC Aggregate ranges from 2,270kg/m3 to
2,450kg/m3 with a standard deviation of STDEV 45kg/m3. The results are consistent
with those reported in various publications. For example, Soutos et al (2004) reports on
the dry particle density of coarse RC Aggregate of 2,220kg/m3 and on SSD particle
density of 2,410kg/ m3. The aggregate was produced from precast concrete elements of
demolished high-rise buildings. In comparison, conventional, natural aggregates used
in concrete technology typically have a particle density ranging from 2,100kg/ m3 to
2,700kg/ m3.
A relationship between the content of cement paste residue and dry particle density was
also investigated. As in the other types of particle density, the results indicate that the
dry particle density of the aggregate decreases as the cpr content increases (see Figure
4.4.26).
2.34 2.34 2.45 2.33 2.35 2.37 2.33 2.36 2.35 2.28 2.27 2.35 y = -0.0055x + 2.3793
0.00
5.00
10.00
15.00
20.00
25.00
RC
A_0
8&09
&10
_99
RC
A_0
5&06
&07
_01
RC
A_0
2&03
&04
_01
RC
A_0
5&06
&07
_00
RC
A_1
1&12
&01
_01
RC
A_0
8&09
&10
_00
RC
A_0
2&03
&04
_00
RC
A_0
5&06
&07
_99
RC
A_0
2&03
&04
_99
RC
A_1
1&12
&01
_00
RC
A_0
8&09
&10
_01
RC
A_0
1_99
cpr [
%] &
par
ticle
den
sity
[t/m
3 ]
cpr [%]Particle density [t/m3]Linear (Particle density [t/m3])Linear (cpr [%])
Figure 4.4.26 Relationship between cpr content and dry particle density in
14/10mm RC Aggregate
4.4-22
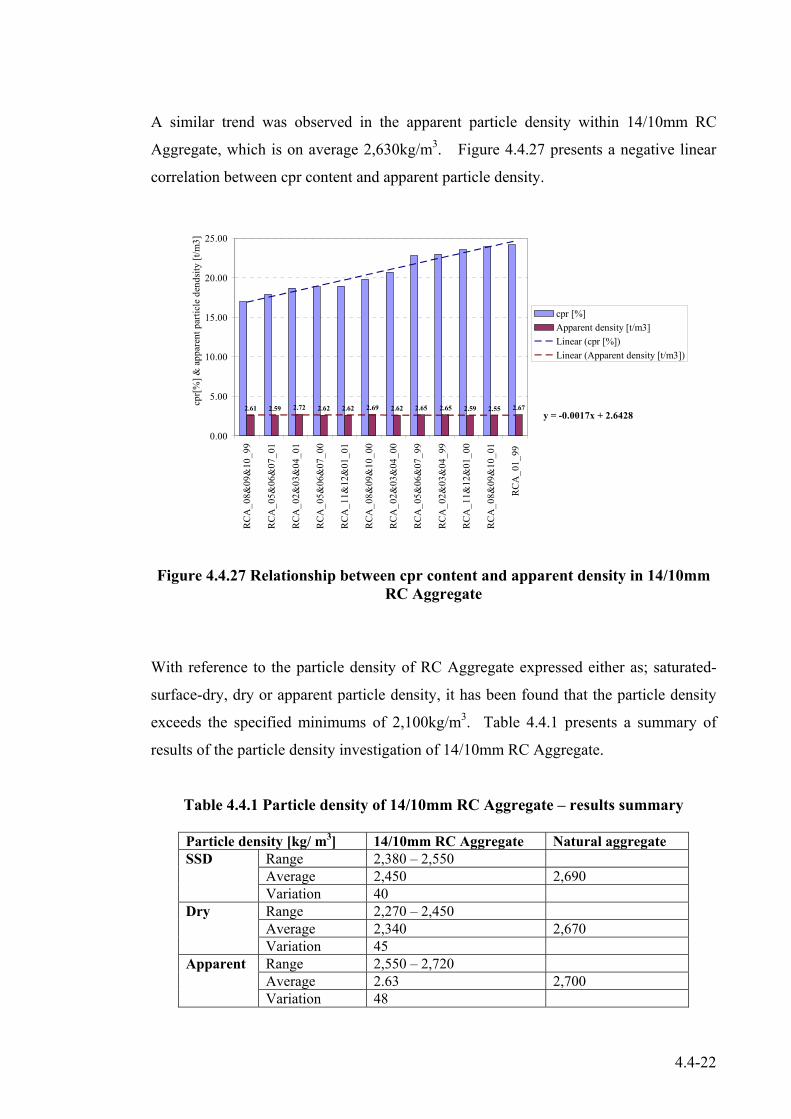
A similar trend was observed in the apparent particle density within 14/10mm RC
Aggregate, which is on average 2,630kg/m3. Figure 4.4.27 presents a negative linear
correlation between cpr content and apparent particle density.
2.61 2.59 2.72 2.62 2.62 2.69 2.62 2.65 2.65 2.59 2.55 2.67y = -0.0017x + 2.6428
0.00
5.00
10.00
15.00
20.00
25.00R
CA
_08&
09&
10_9
9
RC
A_0
5&06
&07
_01
RC
A_0
2&03
&04
_01
RC
A_0
5&06
&07
_00
RC
A_1
1&12
&01
_01
RC
A_0
8&09
&10
_00
RC
A_0
2&03
&04
_00
RC
A_0
5&06
&07
_99
RC
A_0
2&03
&04
_99
RC
A_1
1&12
&01
_00
RC
A_0
8&09
&10
_01
RC
A_0
1_99
cpr[
%] &
app
aren
t par
ticle
den
dsity
[t/m
3]
cpr [%]Apparent density [t/m3]Linear (cpr [%])Linear (Apparent density [t/m3])
Figure 4.4.27 Relationship between cpr content and apparent density in 14/10mm RC Aggregate
With reference to the particle density of RC Aggregate expressed either as; saturated-
surface-dry, dry or apparent particle density, it has been found that the particle density
exceeds the specified minimums of 2,100kg/m3. Table 4.4.1 presents a summary of
results of the particle density investigation of 14/10mm RC Aggregate.
Table 4.4.1 Particle density of 14/10mm RC Aggregate – results summary
Particle density [kg/ m3] 14/10mm RC Aggregate Natural aggregate Range 2,380 – 2,550 Average 2,450 2,690
SSD
Variation 40 Range 2,270 – 2,450 Average 2,340 2,670
Dry
Variation 45 Range 2,550 – 2,720 Average 2.63 2,700
Apparent
Variation 48

4.4-23
An investigation into the particle density of 14/10mm RC Aggregate, one of the basic
engineering properties, allowed the generation of accurate input data to design concrete
mixes. Although the minimum value of particle density of 2,100kg/m3 specified by the
aggregate manufacturer is correct, it has been found that it is quite conservative and not
specific enough.
The variation in particle density of 14/10mm RC Aggregate is relatively low, indicating
that the feedstock used to manufacture the aggregate is of a relatively consistent
composition. In the course of the three year investigation period, it was found that
particle density is not affected by any seasonal variations or a continuously improving
production process of the aggregate.
Further to a fundamental determination of basic engineering properties such as SSD, dry
and apparent particle density, the influence of cement paste residue on the particle
density was also examined. A relationship has been established that density is inversely
affected by the content of cement paste residue as was expected. The increase in cpr
content in the aggregate lowers its density.
4.4.6 Bulk Density
The bulk of the density of 14/10mm RC Aggregate and basalt aggregate was examined
in their compacted state. Figure 4.4.28 presents the average bulk densities of recycled
and controlled natural aggregate.

4.4-24
1,430
1,700
0
200
400
600
800
1,000
1,200
1,400
1,600
1,800
2,000
14/10mm RC Aggregate 14/10mm N Aggregate
Bul
k de
nsity
[kg/
m3]
Year 1999Year 2000Year 2001Year 2003
Figure 4.4.28 Bulk density of the 14/10mm natural and RC Aggregates
The compacted bulk density of the aggregate is influenced by particle size distribution
and density of the aggregate particles. The average compacted bulk density of the
14/10mm RC Aggregate is 1,420kg/m3, which is approximately 15–20% lower than the
control basalt aggregate, however, it is still well above the minimum (1,200kg/m3)
specified by the manufacturer. The variability of bulk density expressed as the average
STDEV of 31kg/m3 is very low, which indicates that particle density and particle size
distribution were very consistent.
4.4.7 Particle Size Distribution
Particle size distribution (PSD) was identified as one of the most noticeable and
important properties in this research project, as it is directly linked with a development
of void networks in acoustic barriers. Figure 4.4.29 shows a sample of the 14/10mm RC
Aggregate segregated by various sizes corresponding to standard sieve apertures.

4.4-25
Figure 4.4.29 Particles of 14/10mm RC Aggregate retained on 13.2mm, 9.5mm, 6.7mm, 4.75mm, 2.36mm and 75μm sieves (from right to left)
Table 4.4.2 shows the yearly average PSD of 14/10mm RC Aggregate determined over
the four (4) year period.
Table 4.4.2 Particle size distribution of 14/10 mm RC Aggregate – percentage passing
Sieve aperture [mm]
19.0 13.2 9.5 6.7 4.75 2.36 pan Testing period
Percentage passing sieve aperture [%] Year 1999 100 72.9 25.3 10.1 2.3 1.0 1.0 Year 2000 100 87.3 30 9.8 2.4 0.8 0.8 Year 2001 100 81.9 25.1 7.4 2.7 0.8 0.8 Year 2003 100 79.5 34.4 12.6 7.1 4.1 0.5
The majority of the aggregate remained on the 10mm sieve, and only 1% of the particles
have particles smaller than 75 micrometers when determined by dry sieving. The
amount of fines (<75μm) determined by the wet sieve analysis is on average 2%.
Variations in the aggregate grading were within the limits specified by the
manufacturer. Figure 4.4.30 presents a comparison between upper and lower limits
specified in the Australian Standard 2758.1-1998 for concrete aggregate and the average
yearly PSD of 14/10mm RC Aggregate.

4.4-26
0
10
20
30
40
50
60
70
80
90
100
0.01 0.1 1 10 100
Sieve aperture [mm]
Perc
enta
ge p
assi
ng
Lower limitUpper limitYear 1999Year 2000Year 2001Year 2003
Figure 4.4.30 Particle size distribution of 14/10mm RC Aggregate – average of 1999 – 2003 samples
Control samples were prepared from single-size aggregates; 10mm and 14mm. Firstly,
volumes of RC Aggregate of a particular size were measured. Test portions of natural
aggregates were determined using identical volumes of comparable RC Aggregate.
This was consistent with the approach that is taken when concrete mixes are designed;
however, it also resulted in a very small deviation in the grading of the natural aggregate
compared with those of the 14/10mm RC Aggregate. The difference in the particle size
distribution of the two aggregates was deemed as negligible, therefore not requiring any
adjustments. Table 4.4.3 presents the grading of some of the basalt samples used as a
control aggregate.
Table 4.4.3 Particle size distribution of 14/10 mm Natural Aggregate – percentage passing
Sieve aperture [mm]
19.0 13.2 9.5 6.7 4.75 2.36 pan Sample Percentage passing sieve aperture [%] NA-99-04 100 89 33.5 5.8 0.6 0.1 0.1 NA-00-03 100 92 48.6 14 2.6 0.3 0.3 NA-01-07 100 91.6 42.9 5.8 0.6 0.1 0.1

4.4-27
Figure 4.4.31 presents a comparison between the 14/10mm natural aggregate and RC
Aggregate. It can be noticed that natural aggregate has a lower amount of aggregate
fraction retaining on the 4.75mm and 2.36mm sieves.
0
10
20
30
40
50
60
70
80
90
100
0.01 0.1 1 10 100
Sieve aperture [mm]
Perc
enta
ge p
assi
ng
Lower limitUpper limitRC AggregateNatural aggregate
Figure 4.4.31 Comparison of particle size distribution of natural aggregate and
14/10mm RC Aggregate Although there was some dissimilarity in particle size distribution between the
14/10mm RC Aggregate and those of the natural aggregate, the difference was within an
acceptable limit. The difference resulted from the variations in aggregate shape and
aggregate bulk density.
4.4.8 Water Absorption If not accounted for, highly absorptive aggregate can significantly alter the hydration
process by reducing the amount of available water for the chemical reaction,
subsequently leading to presence of un-hydrated cement in concrete matrix. This has
potential to reduce strength of concrete and makes it less durable. Water absorption in
coarse RC Aggregate can be as high as 8.5%, and in the natural coarse aggregate is
typically about 1% (Soutsos, 2004; CSIRO, 2002). A representative number of test
4.4-28
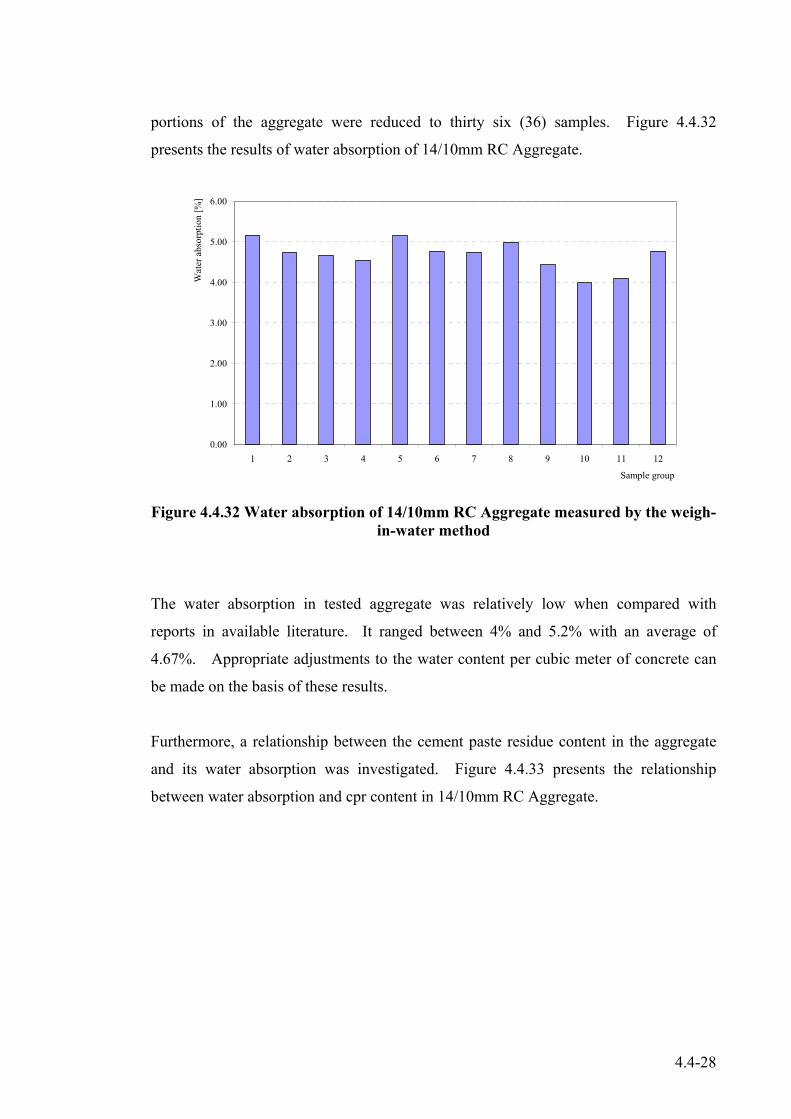
portions of the aggregate were reduced to thirty six (36) samples. Figure 4.4.32
presents the results of water absorption of 14/10mm RC Aggregate.
0.00
1.00
2.00
3.00
4.00
5.00
6.00
1 2 3 4 5 6 7 8 9 10 11 12
Sample group
Wat
er a
bsor
ptio
n [%
]
Figure 4.4.32 Water absorption of 14/10mm RC Aggregate measured by the weigh-
in-water method
The water absorption in tested aggregate was relatively low when compared with
reports in available literature. It ranged between 4% and 5.2% with an average of
4.67%. Appropriate adjustments to the water content per cubic meter of concrete can
be made on the basis of these results.
Furthermore, a relationship between the cement paste residue content in the aggregate
and its water absorption was investigated. Figure 4.4.33 presents the relationship
between water absorption and cpr content in 14/10mm RC Aggregate.

4.4-29
y = 0.0751x + 4.1806
0.00
5.00
10.00
15.00
20.00
25.00
RC
A_0
8&09
&10
_99
RC
A_0
5&06
&07
_01
RC
A_0
2&03
&04
_01
RC
A_0
5&06
&07
_00
RC
A_1
1&12
&01
_01
RC
A_0
8&09
&10
_00
RC
A_0
2&03
&04
_00
RC
A_0
5&06
&07
_99
RC
A_0
2&03
&04
_99
RC
A_1
1&12
&01
_00
RC
A_0
8&09
&10
_01
RC
A_0
1_99
cpr [
%] &
wat
er a
bsor
ptio
n [%
]cpr [%]WA [%]Linear (WA [%])Linear (cpr [%])
Figure 4.4.33 Relationship between cement paste residue (cpr) content and water
absorption in 14/10mm RC Aggregate
It has been observed that a positive correlation exists between cpr content and water
absorption. A relative increase of cement paste residue leads to increased water
absorption of the aggregate.
4.4.9 Porosity
The basic engineering properties of RC Aggregate including particle and bulk density,
and water absorption, are also dependent on the porosity of cement paste residue of the
aggregate. Various testing techniques were used to examine the porosity of 14/10mm
RC Aggregate ranging from absorption of water, adsorption of nitrogen to a neutron
scattering method. Control samples were first established to allow a subsequent
comparison of results of the aggregate porosity. Figures 4.4.34 and 4.4.35 present
examples of the BET porosity standards.

4.4-30
Figure 4.4.34 Example of powder (<150μm) samples of neat cement pastes of various cement/water ratios (0.2w/c, 0.4w/c and 0.8w/c)
Figure 4.4.35 Example of solid sample of cement paste residue of RC Aggregate obtained from concrete of known w/c ration of 0.4
A representative number of cement paste residue test portions of the 14/10mm RC
Aggregate were selected. The sample suite of the cpr collected and examined
corresponds to a testing period of four (4) years. The test portions were selected from
aggregate samples that were mechanically broken at the compositional examination of
14/10mm RC Aggregate. According to a degree of possible carbonation, the cement
paste residues were classified into three categories; LOW (slightly weathered cpr, and
of or corresponding to, a good quality, very low w/c ratio of approximately 0.2 or to
natural aggregate), MODERATELY (reasonably weathered cpr, and of or
corresponding to, an average quality cement paste w/c ratios of approximately 0.4 to
0.6) and HIGHLY (distinctly weathered cpr, and of, or corresponding to a poor quality
of cement paste, of w/c ration of approximately 0.8). Tables 4.4.4 and 4.4.5 present the

4.4-31
sample suite, control standard, and classification of the BET nitrogen adsorption
porosity examination.
Table 4.4.4 RC Aggregate samples examined by the BET nitrogen adsorption
RC Aggregate samples – BET designation
Assumed control standards 0.2w/c paste -natural aggregate
0.4w/c paste
0.8w/c paste
s_142 to s_149 & s_171, to s_173 & s_201, to s_209, s_213 & s_216 & s_224 to s_232 S_174 s_214 s_215
Table 4.4.5 RC Aggregate samples examined by the BET nitrogen adsorption – classification by degree of weathering
HIGHLY weathered samples of cpr
MODERATELY weathered samples of cpr
Slightly (LOW) weathered samples of cpr
s_142, s_144, s_147, s_149, s_201, s_228, s_231,
s_146, s_148, s_172, s_207, s_208, s_209, s_213, s_216, s_225, s_227, s_230, s_229, s_232
s_143, s_145, s_171, s_173, s_202, s_203, s_204, s_205, s_206, s_224, s_226
BET porosity is expressed in terms of total pore volume, pore size distribution, pore
surface area, and pore diameter. Figure 4.4.36 shows an adsorption isotherm of the
reference 0.4 w/c ratio paste. The isotherm is characteristic of porous solids and the
hysteresis loop created by the adsorption and desorption branches indicate a uniform
distribution of pores of different sizes in the pore size range ranging between 17Å and
3μm. A similar pattern and shape of isotherms in all samples of the cement paste
residue have been observed. This confirms that the microstructure of cement paste
consists of a reasonably evenly distributed network of pores as was expected.

4.4-32
0.4 neat cement paste (sample s_214) - adsorption isotherm
0
10
20
30
40
50
60
0 0.1 0.2 0.3 0.4 0.5 0.6 0.7 0.8 0.9 1
Relative pressure [p/po]
Vol
ume
adso
rbed
[cc/
g]
Figure 4.4.36 BET isotherm – 0.4 w/c ratio, neat cement paste
Figure 4.4.37 presents an adsorption-desorption isotherm of the porosity reference
created for highly weathered cement paste residue. The reference standard was
developed using neat new cement paste of w/c with a ratio of 0.8.
0.8 neat cement paste (sample s_215) - adsorption isotherm
0
10
20
30
40
50
60
70
80
0 0.1 0.2 0.3 0.4 0.5 0.6 0.7 0.8 0.9 1
Relative pressure [p/po]
Vol
ume
adso
rbed
[cc/
g]
Figure 4.4.37 BET isotherm – 0.8w/c ratio, neat cement paste

4.4-33
Figure 4.4.38 presents an example of an isotherm of one of the cement paste residue
samples, which has been classified as highly weathered.
HIGHLY weathered sample of cpr (s_147) , adsorption isotherm
0
5
10
15
20
25
30
35
40
45
50
0 0.1 0.2 0.3 0.4 0.5 0.6 0.7 0.8 0.9 1
Relative pressure [p/po]
Vol
ume
adso
rbed
[cc/
g]
Figure 4.4.38 BET isotherm of HIGHLY weathered cpr (s_147)
The highly weathered cement paste residues of 14/10mm RC Aggregate have pore size
distribution spread relatively evenly over the whole porosity range measured by BET
nitrogen adsorption. It could also be concluded that the shape of the isotherm is similar
to the isotherms produced by other referenced samples or of the cpr samples.
Figure 4.4.39 shows the BET isotherm of one of the moderately weathered cement paste
residue samples, which has a porosity characteristic of standard concrete with a design
water/cement ratio of between 0.4 and 0.6. Prior to the BET nitrogen adsorption
examination, this sample (s_229) was subjected to a non-destructive SANS porosity
investigation.
4.4-34
MODERATELY weathered cpr (d2o-cp-0.4 + cpr), (sample s_229), adsorption isotherms
0
5
10
15
20
25
30
0 0.1 0.2 0.3 0.4 0.5 0.6 0.7 0.8 0.9 1
Relative pressure [p/po]
Vol
ume
adso
rbed
[cc/
g]
Figure 4.4.39 Example of MODERATELY weathered cpr (BET sample s_229) Cement paste residue samples obtained from concrete of a relatively short in-service life
were classified as slightly (LOW) weathered cpr. Predominantly, the identification and
classification of samples was based on the information provided by the aggregate
manufacturer on the source material, and classification was based on a visual
assessment (colour and hardness). A number of the samples were first examined using
the SANS method before being subjected to the BET examination. Figure 4.4.40
presents the adsorption-desorption isotherm of the LOW weathered sample of cement
paste residue of the 14/10mm RC Aggregate.
Slightly (LOW) weathered cpr (d2o-cp-0.4), (sample s_226), adsorption isotherm
0
5
10
15
20
25
0 0.1 0.2 0.3 0.4 0.5 0.6 0.7 0.8 0.9 1
Relative pressure [p/po]
Vol
ume
adso
rbed
[cc/
g]
Figure 4.4.40 Example of LOW weathered cpr (BET sample s_226)

4.4-35
The analysis of the BET isotherms and hysteresis produced by the adsorption and
desorption branches prompted the following major conclusions.
• The shape of the isotherm confirms that cement pastes are porous solids and that the
pores are distributed consistently over the entire pore size range, between 17Å and
3μm.
• The hysteresis loops indicate that the shape of pores is either in the form of parallel
plates, ink-bottle-shaped pores or the pores are spheroidal.
Apart from the capability to classify porous solids and characterise pore structure in
solids, the BET nitrogen adsorption allows the measurement of the total porosity, total
pore volume, volume of micropores, pore surface area, and an average pore diameter.
Initially, the reference porosity parameters of the three different categories of cement
paste residue were established. A total porosity standard of 17.5% for the highly
weathered paste was determined. Figure 4.4.41 presents the BET total porosity.
17.5
7.3
9.9
15.3
19.8
27.9
14.413.5
0.00
5.00
10.00
15.00
20.00
25.00
30.00
control 0.8 cp*[s_215]
HW cpr[s_228]
HW cpr[s_231]
HW cpr[s_201]
HW cpr[s_149]
HW cpr[s_142]
HW cpr[s_144]
HW cpr[s_147]
BET
por
osity
[%]
Figure 4.4.41 BET porosity of HIGHLY weathered cement paste residue of 14/10mm RC Aggregate

4.4-36
Test results of the BET nitrogen adsorption examination of the total porosity of highly
weathered cpr of 14/10mm RC Aggregate defined a range of porosity from 7.3% to
27.9%. The total porosity in majority of the samples is below the reference porosity of
17.5%. The average total porosity of significantly weathered cpr is 15.4%.
The total porosity reference standard established for moderately weathered cpr was
8.1%. Figure 4.4.42 presents results of the BET examination of total porosity of
moderately weathered cpr of the 14/10mm RC Aggregate.
8.1
4.2
7.1
8.2
6.8
4.8
8.4
6.5
5.75.55.55.4
5.34.7
0.00
1.00
2.00
3.00
4.00
5.00
6.00
7.00
8.00
9.00
cont
rol 0
.4 c
p*[s
_214
]
MW
cpr
[s_1
72]
MW
cpr
[s_2
25]
MW
cpr
[s_2
27]
MW
cpr
[s_2
13]
MW
cpr
[s_2
30]
rca_
04_1
*[s
_207
]
MW
cpr
[s_2
32]
MW
cpr
[s_1
48]
rca_
04_3
*[s
_208
]
MW
cpr
[s_1
46]
rca_
04_2
*[s
_216
]
MW
cpr
[s_2
29]
rca_
04_4
*[s
_209
]
BET
por
osity
[%]
Figure 4.4.42 BET porosity of MODERATELY weathered cement paste residue of
14/10mm RC Aggregate
The results indicate that the majority of samples have a total porosity lower than the
reference porosity of 8.1% and that the average total porosity of moderately weathered
cpr is 6%.
In order to assume a classification system, cement pastes that required a much higher
energy input in segregating cpr from natural aggregate were classified as slightly
weathered even though the weathering was not measured . Some of the samples (s_145,
s_171, s_173) also had pieces of natural aggregate, which were difficult to isolate. A

4.4-37
porosity standard of 0.9% was established for the LOW weathered cpr (sample s_174).
Figure 4.4.43 presents total porosity of slightly weathered cement paste residues.
0.9
2.31.9
1.4
2.9 3.03.5
5.85.7
3.93.73.7
0.00
1.00
2.00
3.00
4.00
5.00
6.00
7.00
cont
rol c
p +
na[s
_174
]
cont
rol c
p +
na[s
_145
]
cont
rol c
p +
na[s
_171
]
LW c
pr [s
_173
]
LW c
pr [s
_206
]
LW c
pr [s
_143
]
LW c
pr [s
_203
]
LW c
pr [s
_205
]
LW c
pr [s
_224
]
LW c
pr [s
_204
]
LW c
pr [s
_202
]
LW c
pr [s
_226
]
BET
por
osity
[%]
Figure 4.4.43 BET porosity of slightly (LOW) weathered cement paste residue of 14/10mm RC Aggregate
Test results show that the total porosity in all of the cement paste residue samples
exceeded the reference porosity. The average BET porosity in slightly weathered cpr of
14/10mm RC Aggregate is 4% and of cement paste residue containing some natural
aggregate is 1.87%.
Furthermore, the pore volume was analysed in terms of the total pore volume (BET
range from 17Å to 3μm) and volume of micropores. All samples of the cement paste
residue of 14/10mm RC Aggregate were categorised as ‘old cpr’ and an average of all
the data is presented in the following figures. Figure 4.4.44 shows an average total pore
volume in cpr and compares it against the three reference standards (e.g. ‘0.2w/c cp’ -
0.2 water/cement ratio new cement paste)
An average total volume of pores in the cement paste residue of 0.036cm3/g is
characteristic of slightly weathered pastes. A relatively low total volume of pores in the
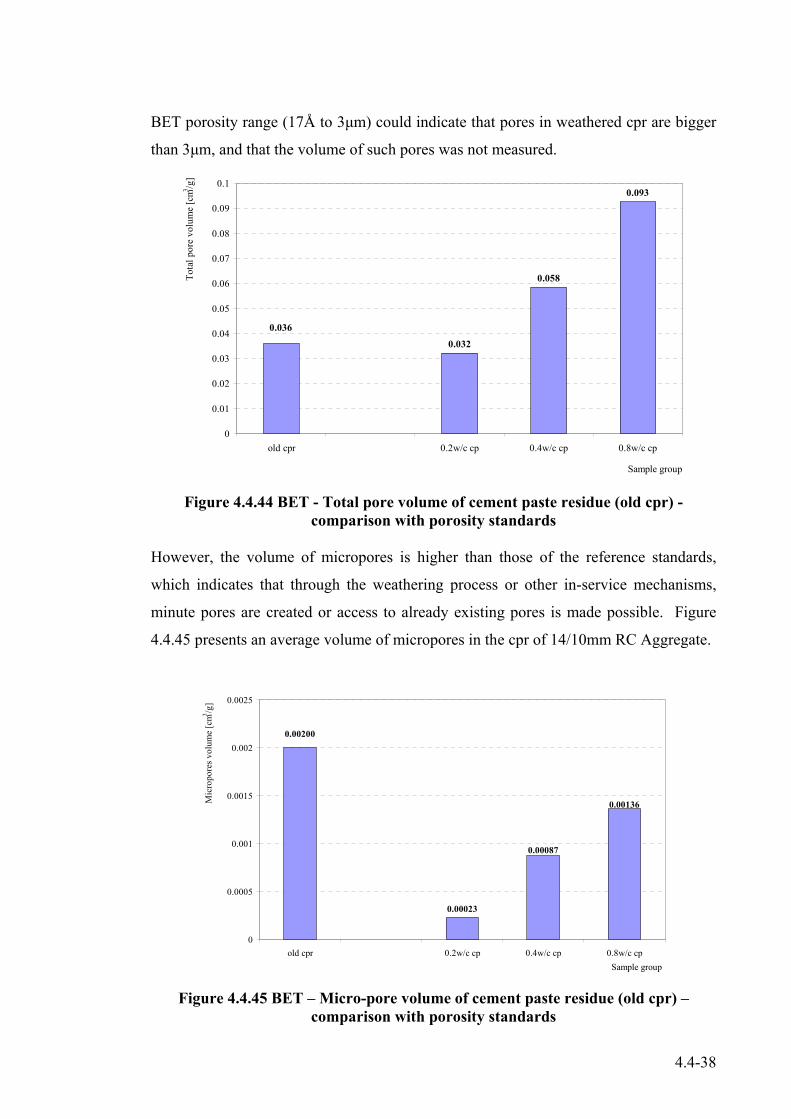
4.4-38
BET porosity range (17Å to 3μm) could indicate that pores in weathered cpr are bigger
than 3μm, and that the volume of such pores was not measured.
0.032
0.058
0.093
0.036
0
0.01
0.02
0.03
0.04
0.05
0.06
0.07
0.08
0.09
0.1
old cpr 0.2w/c cp 0.4w/c cp 0.8w/c cp
Sample group
Tota
l por
e vo
lum
e [c
m3 /g]
Figure 4.4.44 BET - Total pore volume of cement paste residue (old cpr) -
comparison with porosity standards However, the volume of micropores is higher than those of the reference standards,
which indicates that through the weathering process or other in-service mechanisms,
minute pores are created or access to already existing pores is made possible. Figure
4.4.45 presents an average volume of micropores in the cpr of 14/10mm RC Aggregate.
0.00023
0.00087
0.00136
0.00200
0
0.0005
0.001
0.0015
0.002
0.0025
old cpr 0.2w/c cp 0.4w/c cp 0.8w/c cpSample group
Mic
ropo
res v
olum
e [c
m3 /g]
Figure 4.4.45 BET – Micro-pore volume of cement paste residue (old cpr) –
comparison with porosity standards

4.4-39
Further to the total porosity and volume examinations, the surface area of pores in the
cpr was analysed and compared with established standards. A relatively high total pore
surface area of 15.73m2/g, which is characteristic of moderately to highly weathered
pastes, is caused by a high content of micropores in tested samples. A large amount of
very small pores increases surface area. Figure 4.4.46 presents the BET total surface
area of pores in a range between 17Å and 3μm, whereas Figure 4.4.47 shows the surface
area of micropores.
15.73
6.41
12.03
19.61
0
5
10
15
20
25
old cpr 0.2w/c cp 0.4w/c cp 0.8w/c cp
Sample group
Tota
l por
e su
rfac
e ar
ea [m
2 /g]
Figure 4.4.46 BET – Total pore surface area of cement paste residue (old cpr) – comparison with porosity standards

4.4-40
0.40
1.85
4.73
2.89
0
0.5
1
1.5
2
2.5
3
3.5
4
4.5
5
old cpr 0.2w/c cp 0.4w/c cp 0.8w/c cp
Sample group
Mic
ropo
res s
urfa
ce a
rea
[m2 /g
]
Figure 4.4.47 BET – Micropore surface area of cement paste residue (old cpr) –
comparison with porosity standards A relatively high content of micropores in cement paste residue decreases the average
pore diameter. The average diameter of pores in the cpr is 94Å whereas in the reference
porosity standards is in the vicinity of 195Å. Figure 4.4.48 presents the pore diameter
of reference samples and the average pore diameter of cement paste residue of the
14/10mm RC Aggregate.
200
94
189194
0
50
100
150
200
250
old cpr 0.2w/c cp 0.4w/c cp 0.8w/c cp
Sample group
Ave
rage
por
e di
amet
er [Å
]
Figure 4.4.48 BET – Average pore diameter of pores in cement paste residue (old
cpr) – comparison with porosity standards

4.4-41
A simple regression analysis of the BET nitrogen adsorption porosity results was
performed. Relationships between various parameters of the BET porosity such as total
porosity, total pore volume, volume of micropores, pore surface area, and pore average
diameter were investigated. Figure 4.4.49, Figure 4.4.50 and Figure 4.4.51 present
examples of the relationship between total porosity, total surface, and micropores area
in three categories of cement paste residue; highly weathered, moderately weathered,
and slightly weathered.
0.00
5.00
10.00
15.00
20.00
25.00
30.00
35.00
40.00
HW cpr[s_228]
HW cpr[s_231]
HW cpr[s_201]
HW cpr[s_149]
HW cpr[s_142]
HW cpr[s_144]
HW cpr[s_147]
poro
sity
[%],
SSA
[m2/
g]
porosity SSA [17-3,000A] SSA microporesLinear (porosity) Linear (SSA [17-3,000A]) Linear (SSA micropores)
Figure 4.4.49 BET porosity of HIGHLY weathered RC Aggregate
In the highly weathered RC Aggregate, an increase in the surface area of micropores is
positively correlated with the increase in total porosity of the cement paste residue.
There is also a positive correlation between the surface area of micropores and the
surface area of all pores in the 17Å and 3μm range.

4.4-42
0.00
5.00
10.00
15.00
20.00
25.00
MW
cpr
[s_1
72]
MW
cpr
[s_2
25]
MW
cpr
[s_2
27]
MW
cpr
[s_2
13]
MW
cpr
[s_2
30]
rca_
04_1
*[s
_207
]
MW
cpr
[s_2
32]
MW
cpr
[s_1
48]
rca_
04_3
*[s
_208
]
MW
cpr
[s_1
46]
rca_
04_2
*[s
_216
]
MW
cpr
[s_2
29]
rca_
04_4
*[s
_209
]
poro
sity
[%],
SSA
[m2/
g]
porosity SSA [17-3,000A] SSA microporesLinear (SSA [17-3,000A]) Linear (SSA micropores) Linear (porosity)
Figure 4.4.50 BET porosity of MODERATLY weathered RC Aggregate
The moderately weathered cement paste residue that is present in most of the RC
Aggregate has shown the strongest relationship between various porosity parameters
including total porosity and surface area of pores. The increase in porosity correlates
strongly with the increase of micropores, which subsequently contributes to the increase
of surface area of micropores and pores in a BET range of 17Å and 3μm as was
expected.
On the other hand, the slightly weathered RC Aggregate, which has a relatively small
volume of micropores, or where there is a possibility that nitrogen molecules cannot
access the micropores, exhibit different relationships. The increase in total porosity is
only slightly affected by the increase in amount of micropores. The contribution to the
overall surface area of all pores by the micropores is negligible.

4.4-43
0.00
1.00
2.00
3.00
4.00
5.00
6.00
7.00
LW cpr[s_173]
LW cpr[s_206]
LW cpr[s_143]
LW cpr[s_203]
LW cpr[s_205]
LW cpr[s_224]
LW cpr[s_204]
LW cpr[s_202]
LW cpr[s_226]
poro
sity
[%],
SSA
[m2/
g]
porosity SSA [17-3,000A] SSA microporesLinear (porosity) Linear (SSA [17-3,000A]) Linear (SSA micropores)
Figure 4.4.51 BET porosity of LOW weathered RC Aggregate
Further to the BET nitrogen adsorption investigation of cement paste residue of the
14/10mm RC Aggregate, the SANS examination was used to extend and supplement
porosity range accessible to the BET method. Initially, irregularly shaped samples of
cpr, similar to those used in the BET investigation were analysed, which were followed
by cubic 6 x 6 x 6mm samples.
At that stage, the analysis of cement paste residue using the SANS results was non
conclusive due to multiple and incoherent scattering from samples that were thicker
than 3mm.
Investigation of the porosity of cement paste residue of 14/10mm RC Aggregate
identified that the pores are either in the form of parallel plates, ink-bottle-shaped pores
or are spheroidal in shape. The total porosity and other porosity parameters depend on
the quality of cpr and on the in-service life of concrete used in the production of RC
Aggregate. Table 4.4.6 presents a summary of the porosity parameters of the 14/10mm
RC Aggregate.

4.4-44
Table 4.4.6 Porosity of 14/10mm RC Aggregate – summary results
Porosity parameter Unit cpr of 14/10mm RC Aggregate
Reference
Range % 1.36 – 27.91 Average % 7.22 0.86
Total porosity
Variation % 5.67 Range cm3/g 0.0037 – 0.07 Average cm3/g 0.03 0.032
Total pore volume
Variation cm3/g 0.019 Range cm3/g 0.00011 – 0.0057 Average cm3/g 0.0012 0.00023
Volume of micropores
Variation cm3/g 0.0012 Range m2/g 2.99 – 34.72 Average m2/g 10.45 6.41
Total surface area
Variation m2/g 7.29 Range m2/g 0.17 – 13.58 Average m2/g 2.79 0.4
Micropores surface area
Variation m2/g 2.99 Range Å 46 – 984 Average Å 142.19 200
Average pore diameter Variation Å 165.28
4.4.10 Discussion of the Results
This section presented results of the examination of 14/10mm RC Aggregate. The
properties examined included; cement paste residue content, physical contaminants
content, content and re-cementing qualities of fines, particle size distribution, particle
and bulk density, water absorption, and porosity.
The results indicate that the selected 14/10mm RC Aggregate has a specific set of well
defined unique properties. Some of the physical properties of the aggregate are specific
to the material. For example, content of cement paste residue and content of various
remnants of other waste material in the aggregate are intrinsic to the waste material used
in production, and to RC Aggregate.
A relatively high content of fine particles smaller than 75μm in 14/10mm RC Aggregate
is another unique property of the material. The fines appear to have some re-cementing
potential, which can contribute to hydration of cement in concrete made from RC

4.4-45
Aggregate. Another property of the aggregate that has potential to be beneficial from a
concrete technology view point is its shape.
However, some of the aggregate’s properties including inconsistent water absorption
and higher porosity have to be closely monitored and controlled if the aggregate is used
in concrete.
Table 4.4.7 presents a summary of the basic engineering properties of 14/10mm RC
Aggregate.
Table 4.4.7 Average engineering properties of 14/10mm RC Aggregate – summary
Property Unit 14/10mm RC Aggregate
Reference / basalt
Cement paste residue content % 27 0 Foreign material content % 1.18 0 Fines (<75μm) content % 2 0 Re-cementing potential % of GB 0.5 0 Particle density (SSD) kg/m3 2,450 2,750 Bulk density (compacted) kg/m3 1,420 1,700 Water absorption % 4.67 0.5 Total porosity (range 17Å - 3μm) % 7.22 0.86 Total pore volume(range 17Å - 3μm) cm3/g 0.036 0.32 Total volume of micropores cm3/g 0.002 0.00023 Total surface area(range 17Å - 3μm) m2/g 10.73 6.41 Total surface area of micropores m2/g 2.79 0.4 Pore average diameter (range 17Å - 3μm) Å 142.2 200 Particle size distribution 14/10mm 14/10mm Elemental composition Calcium rich Silica rich
The test results generated at this stage of the experimental program defined the basic
engineering properties of 14/10mm RC Aggregate. The majority of the data was
subsequently used in other stages of the experimental and developmental program of
this research project. The next section reports on an examination of concrete made from
the 14/10mm RC Aggregate.

4.4-46
4.4 RECYCLED CONCRETE (RC) AGGREGATE .............................................1 4.4.1 Introduction...............................................................................................1 4.4.2 Composition – Cement Paste Residue Content.........................................2 4.4.3 Content of Physical Contaminants ............................................................5 4.4.4 Cement Content and Elemental Composition of RC Aggregate Fines ...11 4.4.5 Particle Density .......................................................................................19 4.4.6 Bulk Density ...........................................................................................23 4.4.7 Particle Size Distribution ........................................................................24 4.4.8 Water Absorption....................................................................................27 4.4.9 Porosity ...................................................................................................29 4.4.10 Discussion of the Results ........................................................................44
Figure 4.4.1 Stockpile of RC Aggregate...........................................................................1 Figure 4.4.2 Particles of RC Aggregate (A – cement paste residue only, B and C –
natural aggregate coated with cpr) ............................................................................3 Figure 4.4.3 Relative composition of 14/10mm RC Aggregate (sample
RCA_11_00_s1&s2) .................................................................................................3 Figure 4.4.4 Composition of 14/10mm RC Aggregate (after additional segregation)......4 Figure 4.4.5 Sample of 14/10mm RC Aggregate with segregated foreign materials .......5 Figure 4.4.6 Average content of foreign materials in 14/10mm RC Aggregate ...............6 Figure 4.4.7 Average content of low density (<1,000kg/m3) particles in 14/10mm RC
Aggregate ..................................................................................................................7 Figure 4.4.8 Average number of foreign materials in 14/10mm RC Aggregate...............8 Figure 4.4.9 Occurrence frequency of foreign materials in 14/10mm RC Aggregate......9 Figure 4.4.10 Average weight [g] of various foreign materials per typical, 4kg samples
of 14/10mm RC Aggregate .......................................................................................9 Figure 4.4.11 Examples of foreign materials in 14/10mm RC Aggregate......................10 Figure 4.4.12 Foreign materials in 14/10mm RC Aggregate..........................................11 Figure 4.4.13 Equivalent GB cement content in 14/10mm RC Aggregate.....................12 Figure 4.4.14 Powder samples of RA Concrete – SEM examination.............................13 Figure 4.4.15 BSE image of RC Aggregate fines ...........................................................14 Figure 4.4.16 ED X-ray analysis of RC Aggregate fines................................................14 Figure 4.4.17 BSE image of natural aggregate (basalt) fines .........................................15 Figure 4.4.18 ED X-ray analysis of natural aggregate (basalt) fines ..............................16 Figure 4.4.19 BSE image of GB cement.........................................................................17 Figure 4.4.20 ED X-ray analysis of GB cement .............................................................17 Figure 4.4.21 BSE image of cement paste residue .........................................................18 Figure 4.5.22 Elemental composition of natural and 14/10mm RC Aggregates -
summary..................................................................................................................18 Figure 4.4.23 Saturated surface dry density of 14/10mm RC Aggregate .......................19 Figure 4.4.24 Relationship between cpr content and saturated surface dry density of
14/10mm RC Aggregate .........................................................................................20 Figure 4.4.25 Dry particle density of 14/10mm RC Aggregate......................................20 Figure 4.4.26 Relationship between cpr content and dry particle density in 14/10mm RC
Aggregate ................................................................................................................21 Figure 4.4.27 Relationship between cpr content and apparent density in 14/10mm RC
Aggregate ................................................................................................................22 Figure 4.4.28 Bulk density of the 14/10mm natural and RC Aggregates .......................24

4.4-47
Figure 4.4.29 Particles of 14/10mm RC Aggregate retained on 13.2mm, 9.5mm, 6.7mm, 4.75mm, 2.36mm and 75μm sieves (from right to left) .........................................25
Figure 4.4.30 Particle size distribution of 14/10mm RC Aggregate – average of 1999 – 2003 samples...........................................................................................................26
Figure 4.4.31 Comparison of particle size distribution of natural aggregate and 14/10mm RC Aggregate .........................................................................................27
Figure 4.4.32 Water absorption of 14/10mm RC Aggregate measured by the weigh-in-water method...........................................................................................................28
Figure 4.4.33 Relationship between cement paste residue (cpr) content and water absorption in 14/10mm RC Aggregate ...................................................................29
Figure 4.4.34 Example of powder (<150μm) samples of neat cement pastes of various cement/water ratios (0.2w/c, 0.4w/c and 0.8w/c) ...................................................30
Figure 4.4.35 Example of solid sample of cement paste residue of RC Aggregate obtained from concrete of known w/c ration of 0.4 ................................................30
Figure 4.4.36 BET isotherm – 0.4 w/c ratio, neat cement paste .....................................32 Figure 4.4.37 BET isotherm – 0.8w/c ratio, neat cement paste ......................................32 Figure 4.4.38 BET isotherm of HIGHLY weathered cpr (s_147) ..................................33 Figure 4.4.39 Example of MODERATELY weathered cpr (BET sample s_229)..........34 Figure 4.4.40 Example of LOW weathered cpr (BET sample s_226) ............................34 Figure 4.4.41 BET porosity of HIGHLY weathered cement paste residue of 14/10mm
RC Aggregate..........................................................................................................35 Figure 4.4.42 BET porosity of MODERATELY weathered cement paste residue of
14/10mm RC Aggregate .........................................................................................36 Figure 4.4.43 BET porosity of slightly (LOW) weathered cement paste residue of
14/10mm RC Aggregate .........................................................................................37 Figure 4.4.44 BET - Total pore volume of cement paste residue (old cpr) - comparison
with porosity standards ...........................................................................................38 Figure 4.4.45 BET – Micro-pore volume of cement paste residue (old cpr) – comparison
with porosity standards ...........................................................................................38 Figure 4.4.46 BET – Total pore surface area of cement paste residue (old cpr) –
comparison with porosity standards........................................................................39 Figure 4.4.47 BET – Micropore surface area of cement paste residue (old cpr) –
comparison with porosity standards........................................................................40 Figure 4.4.48 BET – Average pore diameter of pores in cement paste residue (old cpr) –
comparison with porosity standards........................................................................40 Figure 4.4.49 BET porosity of HIGHLY weathered RC Aggregate...............................41 Figure 4.4.50 BET porosity of MODERATLY weathered RC Aggregate.....................42 Figure 4.4.51 BET porosity of LOW weathered RC Aggregate.....................................43
4.4-48
Table 4.4.1 Particle density of 14/10mm RC Aggregate – results summary..................22 Table 4.4.2 Particle size distribution of 14/10 mm RC Aggregate – percentage passing
.................................................................................................................................25 Table 4.4.3 Particle size distribution of 14/10 mm Natural Aggregate – percentage
passing.....................................................................................................................26 Table 4.4.4 RC Aggregate samples examined by the BET nitrogen adsorption.............31 Table 4.4.5 RC Aggregate samples examined by the BET nitrogen adsorption –
classification by degree of weathering....................................................................31 Table 4.4.6 Porosity of 14/10mm RC Aggregate – summary results .............................44 Table 4.4.7 Average engineering properties of 14/10mm RC Aggregate – summary....45