0800. comparing carbon options for dbp control. casey · pdf filegranular activated carbon ......
TRANSCRIPT
Comparing Carbon Options for DBP Control
Bret Casey, P.E., BCEEMark Bishop, PEErik Rosenfeldt, PE, PhDAllison Reinert, EIT

Motivation
Stage 2 Disinfectant/Disinfection Byproduct (D/DBP) Rule• More stringent TTHM and HAA levels• Locational Running Annual Average (LRAA) monitoring
Options for Compliance• Changing residual disinfectant (chloramines)• Remove more organic matter (OM)
Coagulant / IX /Membranes Powdered activated carbon (PAC) Granular activated carbon (GAC)

Some PAC vs GAC Considerations
PAC
• One time use• Less expensive capital• Initial treatment process (raw water)• Daily dose/operating decisions• Sludge management /disposal impacts
GAC
• Can be regenerated• Passive technology• Final treatment process• Ease of operation/reliable without daily
dose changes• No impact to raw water• Takes advantage of preceding process
TOC removal

Benchmark to Achieve Compliance
What level of risk is acceptable?• Seasonality of DBPs• Source WQ variability• Extreme weather impacts
Possible Design Benchmarks• All LRAA < MCL• No Operational Evaluation (OEL) Violations• All LRAA < 80% of MCL• Maybe Lower – equivalent to chloramines (~ 40THM /30 HAA)

• Likely need 30 days storage. • Can be stored dry (40,000 pound silo or
900 lb super sack) or in slurry tanks.• May require construction of contact basin
for adequate contact time.• Jar test or full scale data to assess dose
and TOC /DBP reduction data• Performance/cost of PAC varies
significantly.• Dose could range from 20-60 mg/l
depending on raw water quality.
PAC for DBP Control – Design Considerations
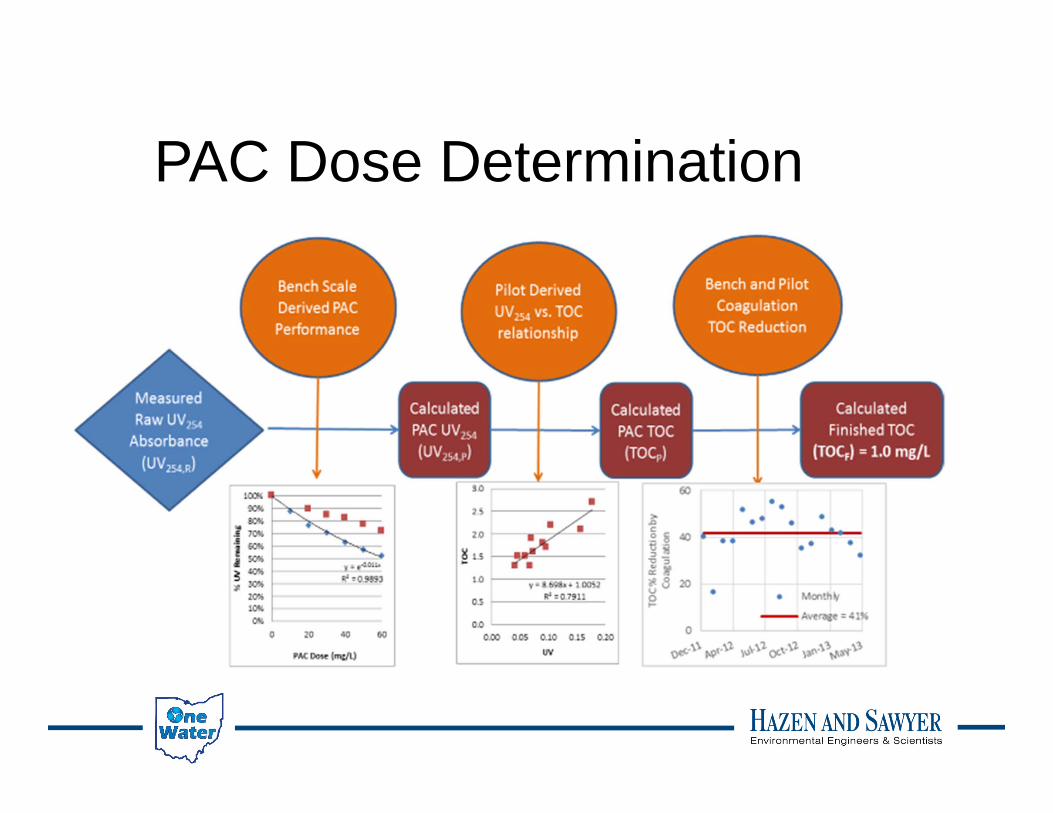
PAC Dose Determination
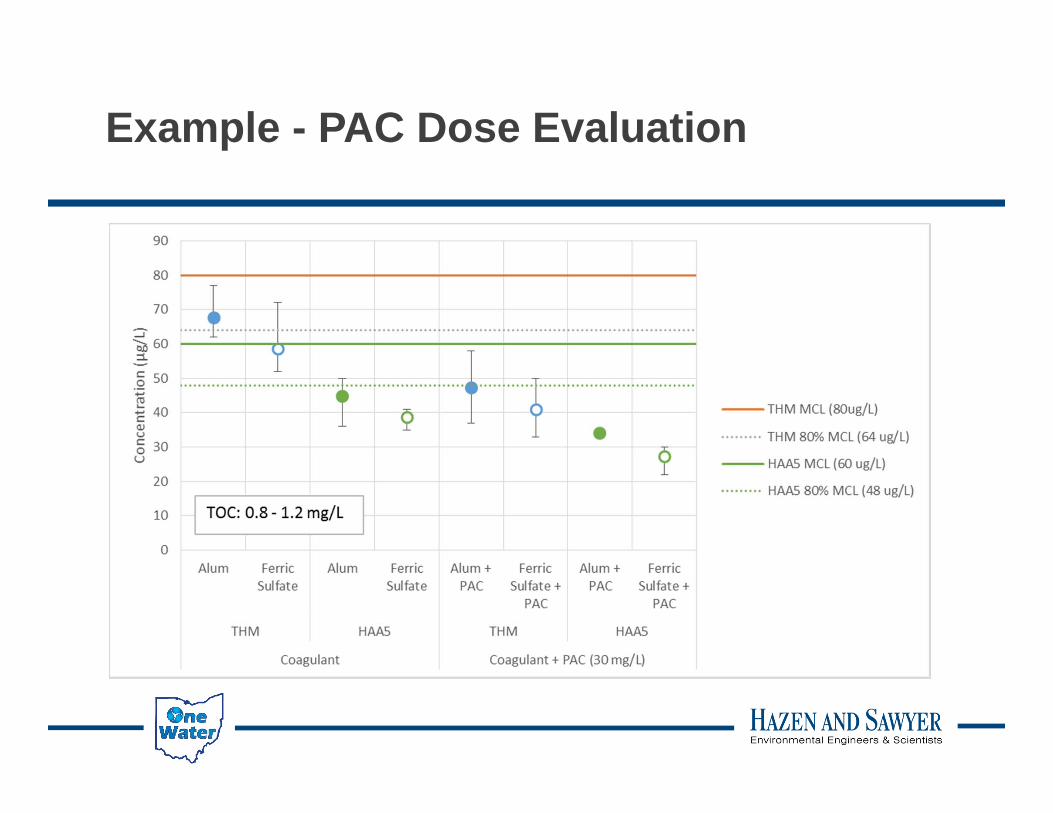
Example - PAC Dose Evaluation

40,000 lb. system• Approximate cost (silo or slurry tank) -
$1,000,000.• 30 days storage, 20 mg/l dose – up to 8
MGD (average day)• Range for capital $0.125-0.25/gal (feed
system only)• Potential additional cost for contact basin
(> 15 min) and sludge handling
PAC Cost Example - Capital

Columbus Hap Cremean WTP• PAC cost ~ $0.48/lb.• Fed 6 months per year (May-Oct)• Dose of 20 mg/l to achieve 15-20% TOC
reduction• Cost of treatment (chemical only) -
$80/mgal However, PAC cost of $1/lb., dose of 60
mg/l - $500/mgal Additional O&M costs
• Sludge disposal • Storage and feed equipment
PAC Cost Example – O&M

Important Questions -Possible GAC Treatment Options and Costs
Wat
er S
ourc
e
Water Treatment
PlantGAC
Distribution System
Chlorine Contact
Intermediate Pump Station
Bypass
DBP Compliance Points
Options:• Full Treatment – All Water All the Time• Blending = Partial GAC Treated /
Untreated• Seasonal Use of GAC• Treat to a TOC Goal – “Trigger TOC”
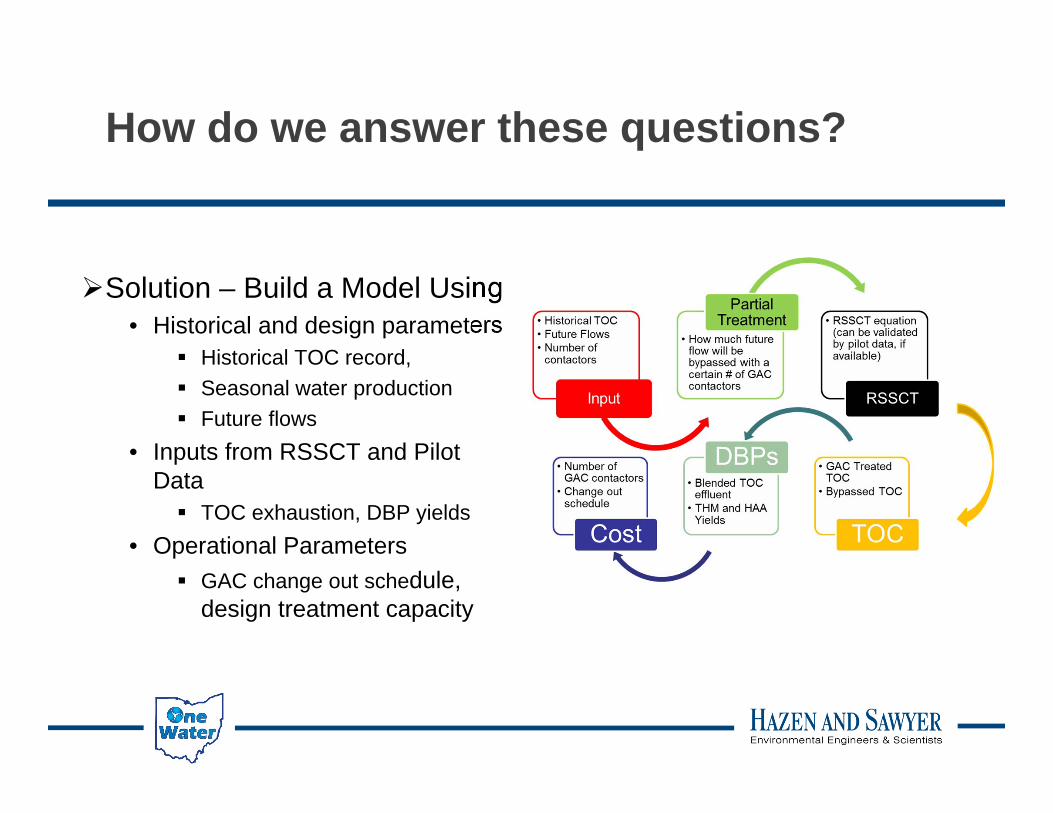
How do we answer these questions?
Solution – Build a Model Using• Historical and design parameters
Historical TOC record, Seasonal water production Future flows
• Inputs from RSSCT and Pilot Data TOC exhaustion, DBP yields
• Operational Parameters GAC change out schedule,
design treatment capacity

GAC Performance Model Overview

Example Evaluation for GAC TreatmentAll LRAAs < 80%; and Robustness Test of High Yields
GAC Hybrid Decision Logic
Hybrid GAC Treatment Option
No OELs?
NO
YES All LRAA <80% MCL?
YES
NO
Preferred and
Possible Options
Scenario Not Considered
Scenario Not Considered
Robustness Analysis
All LRAA<MCL
YES
NO
Scenario Not Considered

Example RSSCT and Pilot Data Breakthrough
0.0
0.2
0.4
0.6
0.8
1.0
1.2
1.4
0 5000 10000 15000 20000 25000 30000
TOC Breakthrou
gh (m
g/L)
Bed Volumes Treated
RSSCT BreakthroughPilot Data ‐ 10 minPilot Data ‐ 15 minPilot Data ‐ 20 min
Comparison of TOC breakthrough for RSSCT and pilot data

Total Organic Carbon Record Example
0.00
0.50
1.00
1.50
2.00
2.50
3.00
3.50
4.00
TOC
(mg/
L) 99th percentile = 2.34
Historical record of post‐filtered TOC

Example SDS DBP YieldsTests Option Viability (< 80% MCL); and Robustness (Hi Yield)
Date of Sampling
Treated Water DBP Yields (ug/mg)
THM HAA
SDS Testing 71 59
Winter 52 59
Spring Early 61 54
Spring Late 81 73
Summer 91 54
Facility Average 71 60

Example of Some Evaluated Scenarios

Example Scenarios That Can Meet Objective - Can Change with Criteria

Advantages of using HSGAC Model
Capture potential benefits of GAC treatment• Site specific• Control DBPs and precursors
Compare treatment goals (or risks) with comparative costs
Allows for informed decisions about how much GAC treatment is needed • Number of contacts• Change out frequency vs contactors in service• Amount of treatment (seasonal versus year round)

GAC - Cost Considerations
Capital Costs • GAC capital costs vary greatly• EPA cost curves factored to 2014 – 20 min EBCT
200 mgd - $0.50/gal 10 mgd - $1/gal 1 mgd - $1.90/gal
• Likely will require intermediate pumping• Plant size will determine whether gravity or
pressure filters are most cost effective.
O&M Costs• Primarily GAC change out/regeneration• GAC regeneration costs vary regionally

CCWSD Bob McEwen Water Plant• 2009, 10 min EBCT – 18 mgd gravity
contactors with transfer pumps • Capital $0.37/gal ($6.66 million) -
$376,000/year for 25 yr. at 3%• O&M – 12 month GAC changeout, 3.77
MGD average $585,000/year, $425/mgal for GAC
regen ($0.86/lb.) $23,000/year, $17/mgal for electric
• Annual O&M cost much greater than amortized capital cost.
GAC Cost Example
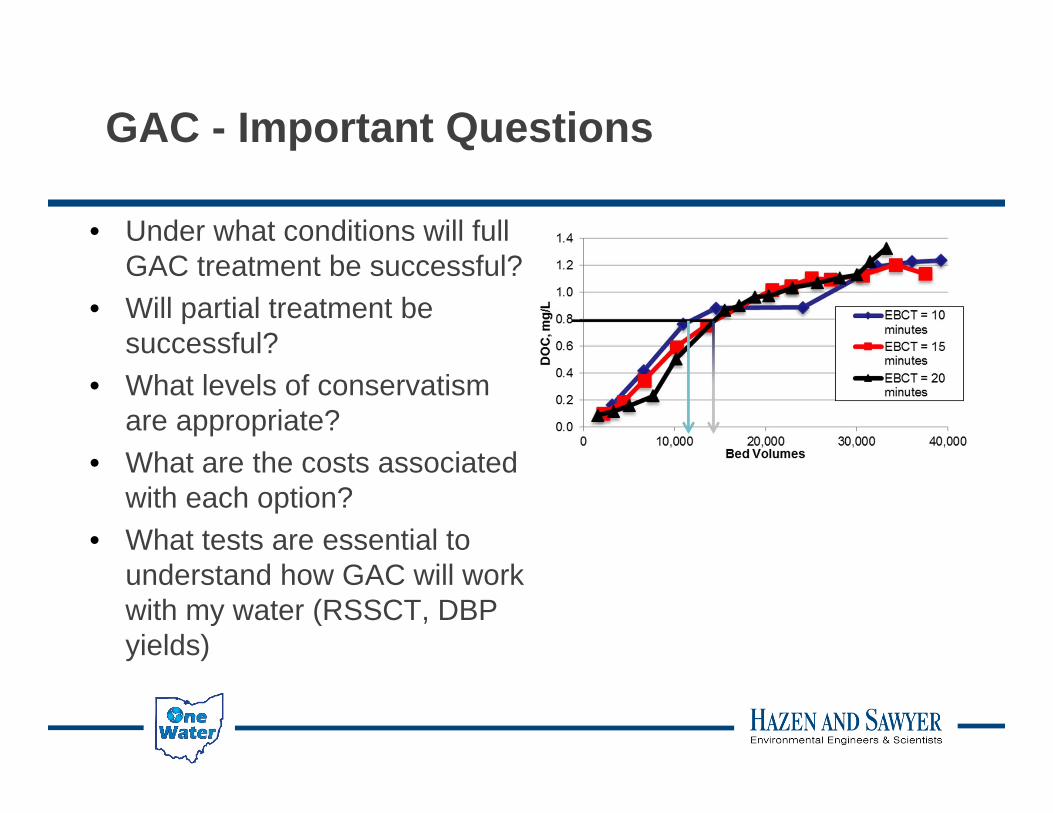
• Under what conditions will full GAC treatment be successful?
• Will partial treatment be successful?
• What levels of conservatism are appropriate?
• What are the costs associated with each option?
• What tests are essential to understand how GAC will work with my water (RSSCT, DBP yields)
GAC - Important Questions

PAC - potentially less cost (capital and O&M). However…• Not just a low dose for T&O anymore – for
compliance which will require a higher dose• Need to understand dose/response to TOC
reductions and DBP formation at Stage 2 sites
• Where to feed to optimize performance/cost? May require additional infrastructure.
• Can (will) impact plant operations and costs from treatment through sludge management and disposal
PAC – Final Considerations

• Design/operations of GAC will impact cost.
• Passive control strategy, much less impact to operations.
• Custom regeneration considered sustainable practice.
• Potential to improve public perception / consumer confidence.
• Design needs to consider if GAC is being used for multiple WQ issues (T&O, atrazine, LT2 compliance, future emerging contaminants).
GAC – Final Considerations
