08 lecture monday week 6 design phase 3 - evaluating the deisgn
DESCRIPTION
lots of good stuffTRANSCRIPT

Lecture Monday Week 6Lecture Monday Week 6
Design AnalysisDesign Analysis
(Lecture notes based on those developed by Dr Evatt Hawkes)

Design ProcessDesign Process
Big Decision
Choose a DesignBut How?But How?Need to Analyse our generated designs

Ho to e al ate alternati es?How to evaluate alternatives?• Previously you generated alternative• Previously you generated alternative
solutions. How will you evaluate them?A i t d i l• Assess against design goals– Prioritize the goals – Formulate a scheme to rate each design
concept relative to goals– Compare scores of each design concept
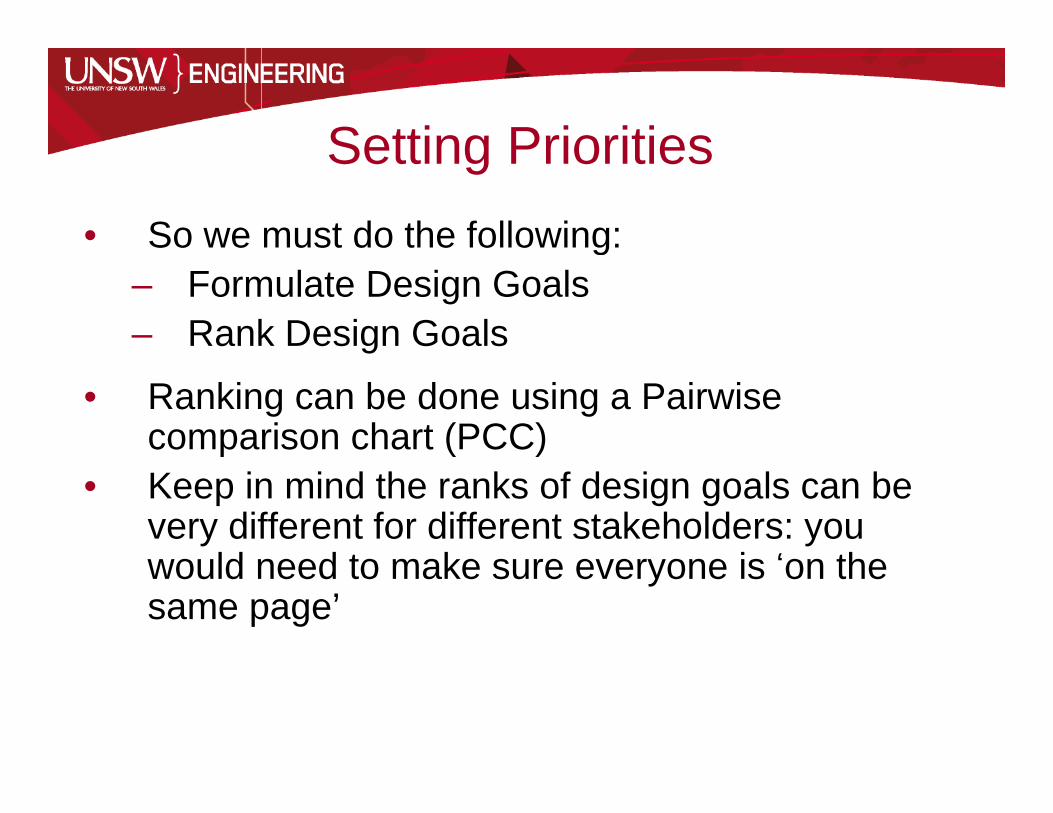
Setting PrioritiesSetting Priorities• So we must do the following:g
– Formulate Design Goals– Rank Design Goals
• Ranking can be done using a Pairwise comparison chart (PCC)
• Keep in mind the ranks of design goals can be very different for different stakeholders: you would need to make sure everyone is ‘on thewould need to make sure everyone is on the same page’

Pairwise ComparisonPairwise Comparison• Side by side comparison of design objectives y p g j
with a simple binary result i.e. 1 if it is deemed more important and 0 if less so
• Construct a table summarising the results of each comparison and then add up the 1’s
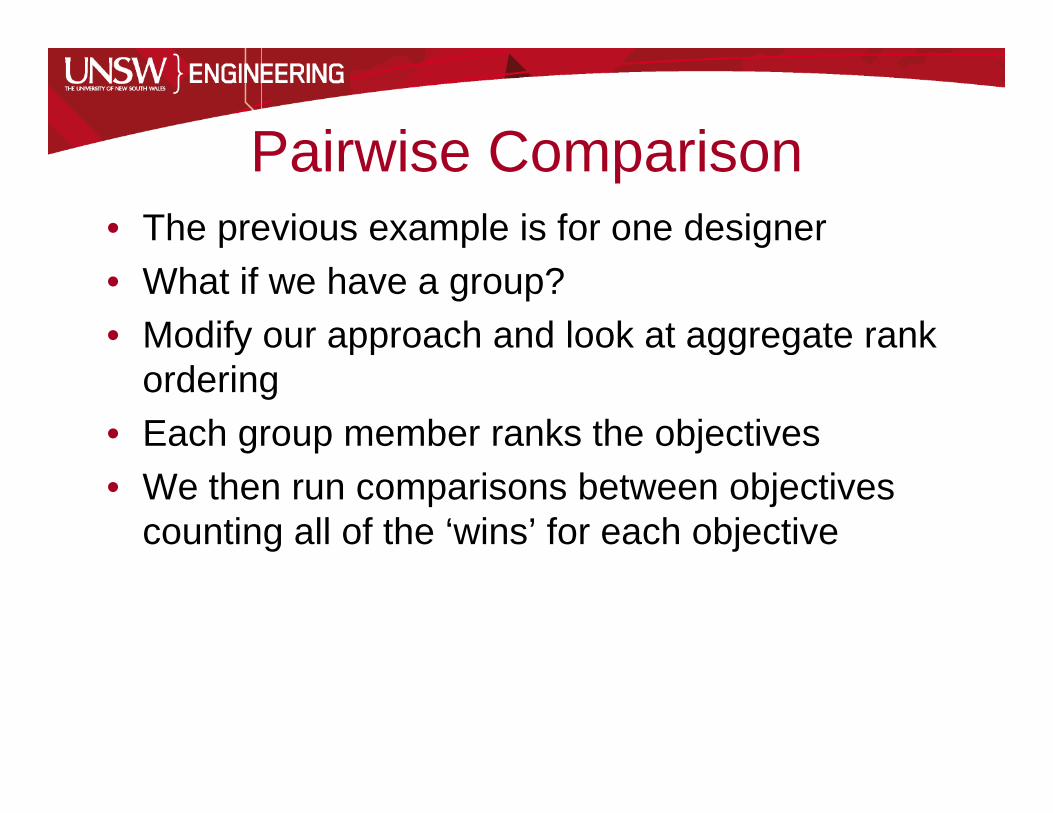
Pairwise ComparisonPairwise Comparison• The previous example is for one designer• What if we have a group?• Modify our approach and look at aggregate rank
ordering• Each group member ranks the objectives • We then run comparisons between objectives
counting all of the ‘wins’ for each objective
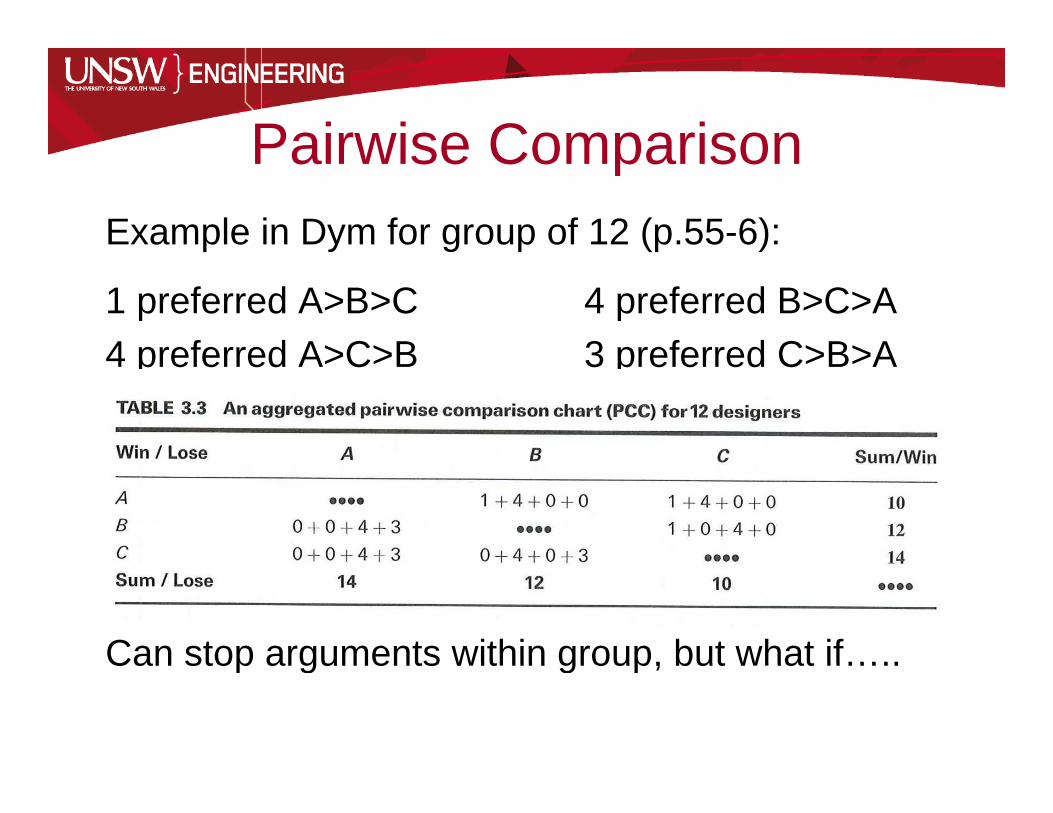
Pairwise ComparisonPairwise ComparisonExample in Dym for group of 12 (p.55-6):
1 preferred A>B>C 4 preferred B>C>A4 preferred A>C>B 3 preferred C>B>A4 preferred A>C>B 3 preferred C>B>A
Can stop arguments within group, but what if…..Can stop arguments within group, but what if…..
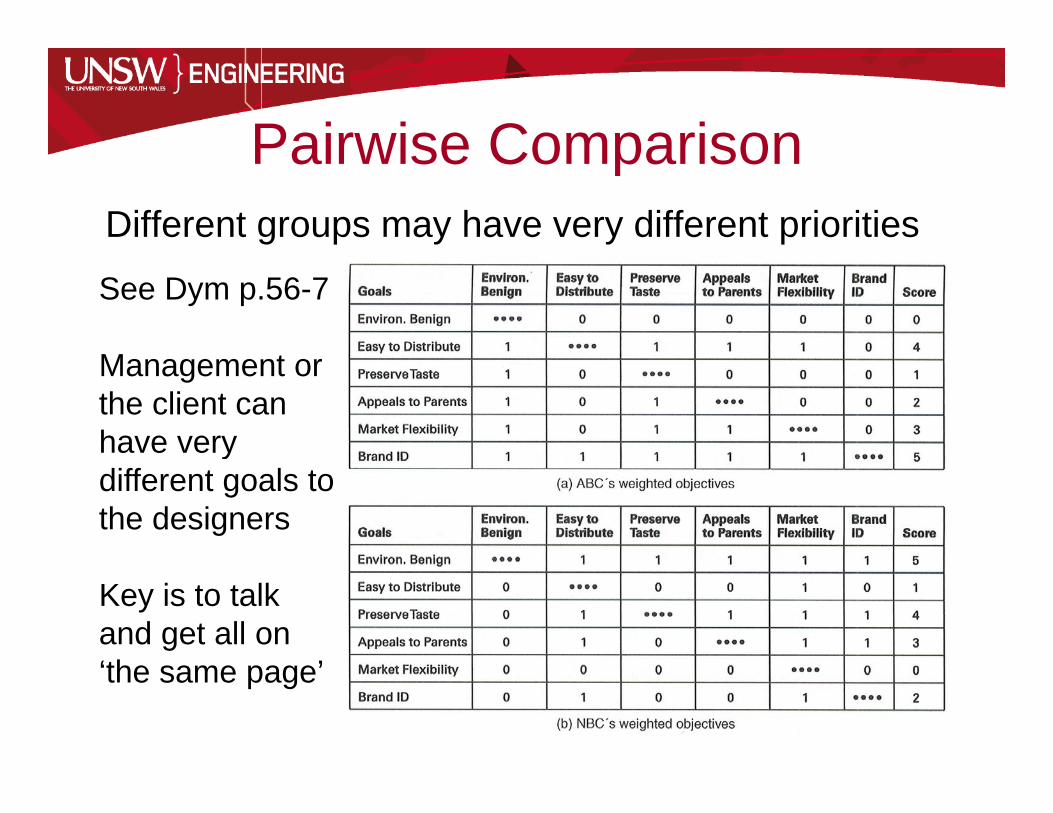
Pairwise ComparisonPairwise ComparisonDifferent groups may have very different priorities
See Dym p.56-7
M tManagement or the client can have very ydifferent goals to the designers
Key is to talk and get all on ‘th ’‘the same page’

Ho m ch more important?How much more important?It is very tempting to assign numerical weights of
significance to each of the goals…– Use a range of values, eg 1-100.
Separate range into general significance categories– Separate range into general significance categoriesMaybe you assign this way:• Critical? (Pointless building if this isn’t in it) -- 100-75Critical? (Pointless building if this isn t in it) 100 75• Important? (Can dump if in a bind) -- 70-35• Optional? (It would be nice) -- 35-0Dym strongly cautions against this approach, can you see
why?DON’T ASSIGN NUMBERS TO YOUR OBJECTIVESDON’T ASSIGN NUMBERS TO YOUR OBJECTIVES

C i Diff t D iComparing Different Designs• Established importance of objectives need to• Established importance of objectives, need to
compare how well different designs achieve these objectivesj
• Need to establish metric for how well objective may be achieved by a particular designy y g
• What units are appropriate? What if we can’t directly measure how well an objective is achieved
• Eg. simplicity is a key design objective, we might use the numbers of parts as a ‘surrogate’ metric

C i Diff t D iComparing Different Designs• Problem is how can we compare different• Problem is, how can we compare different
objectives with different units?• Define scale of points awarded for level ofDefine scale of points awarded for level of
performance of an objective• Ideally we want to have some way of measuringIdeally we want to have some way of measuring
using our metric, these would include lab tests, field tests etc..
• Sometimes these tests are not feasible and we need to simply estimate (guesstimate)
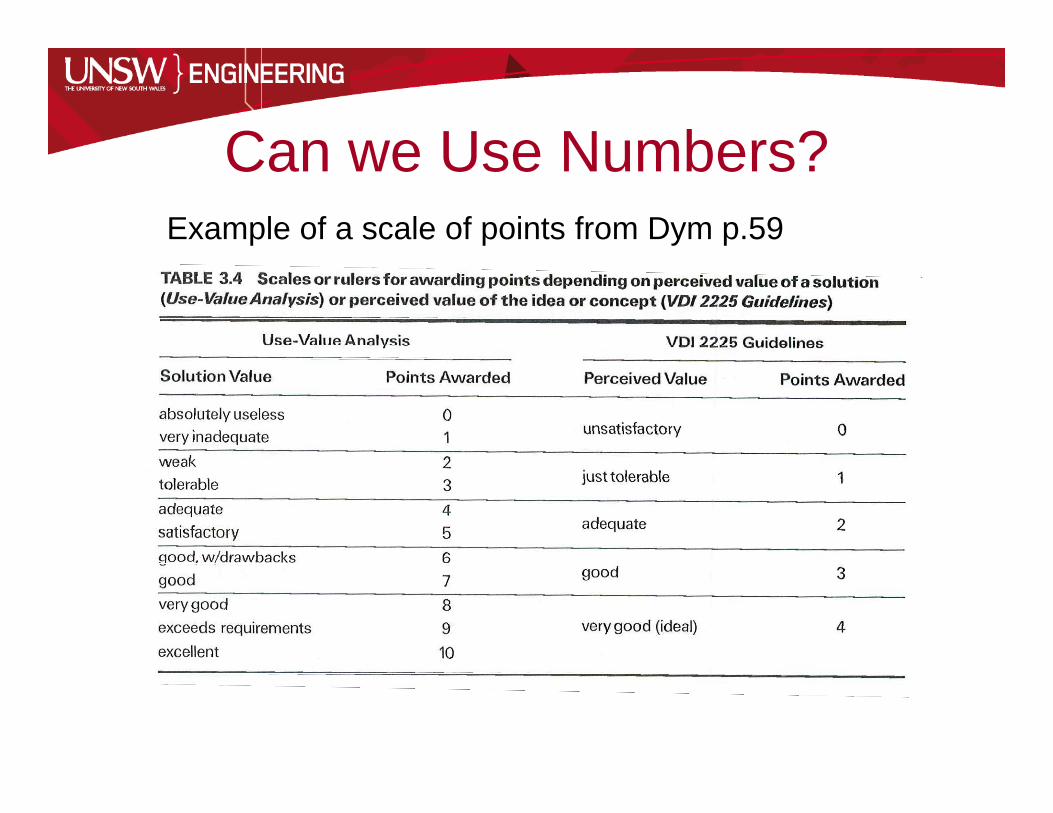
Can we Use Numbers?Can we Use Numbers?Example of a scale of points from Dym p.59

Can we Use Numbers?Can we Use Numbers?Example of a scale of points developed from measured and
ti t d l ll d fi d t i f D 60estimated values on well defined metrics from Dym p. 60
No metric?No metric?• Some of the design goals/objectives will have
t i i t d ith th thno metric associated with them, they are completely subjective
• How do we handle this?How do we handle this?• Can develop a scale like before only this time
the points awarded is negotiated within the p ggroup
• Need to be extremely careful with bias in our i hti i ht b i lweightings, we might be consciously or
subconsciously ‘cooking the books’ to get a certain resultce ta esu t

Qualitative MetricsQualitative MetricsExamples
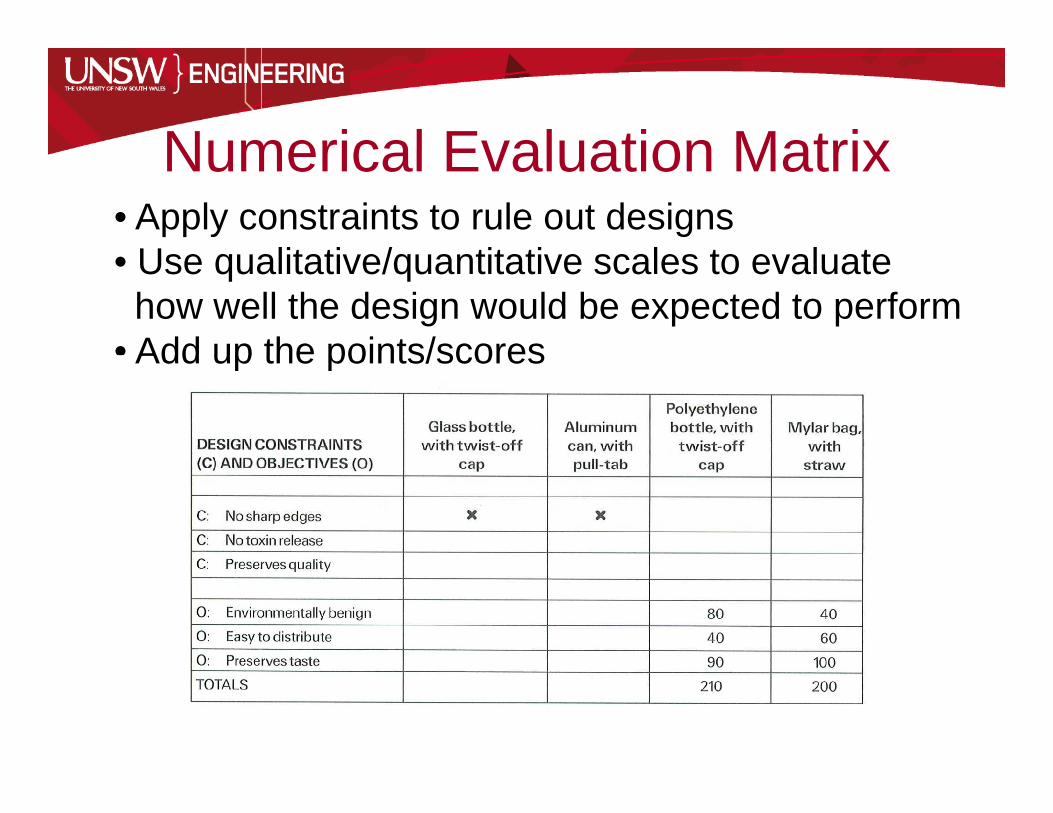
Numerical Evaluation MatrixNumerical Evaluation Matrix• Apply constraints to rule out designs
U lit ti / tit ti l t l t• Use qualitative/quantitative scales to evaluate how well the design would be expected to perform
• Add up the points/scoresAdd up the points/scores

Priority Checkmark MethodPriority Checkmark Method• Rank objectives as high, medium or low priority• 5 ticks for high, 3 for medium, 1 for low• Is it met satisfactorily? Yes, multiply by 1, no,
th bthen by zero

Best-of ClassBest-of Class• Give each design a ranking for each objective,
ie 1 for best 2 for second best etcie. 1 for best, 2 for second best etc.• Design with lowest score is selected
Can have ties but each gets the average i e if• Can have ties but each gets the average i.e. if both are considered ‘best’ they get (1+2)/2 = 1.5
• Improvement over priority checkmark since it• Improvement over priority checkmark since it allows us to rank designs rather than a binary
• Comes with a warning about it encouraging• Comes with a warning about it encouraging opinion rather than fact, look out for the moral hazard of ‘cooking the books’g
Caution• Since we are all human (a big assumption in
some cases) and the design is not yet builtsome cases), and the design is not yet built, estimates will be subjective and biased. Always keep this in mind when using tools like this.keep this in mind when using tools like this.
• Revisit your assumptions, try to remove any subjective bias (fresh eyes?).j ( y )
• Use past experience. Use common sense! • Keep in mind constraints that are presentKeep in mind constraints that are present
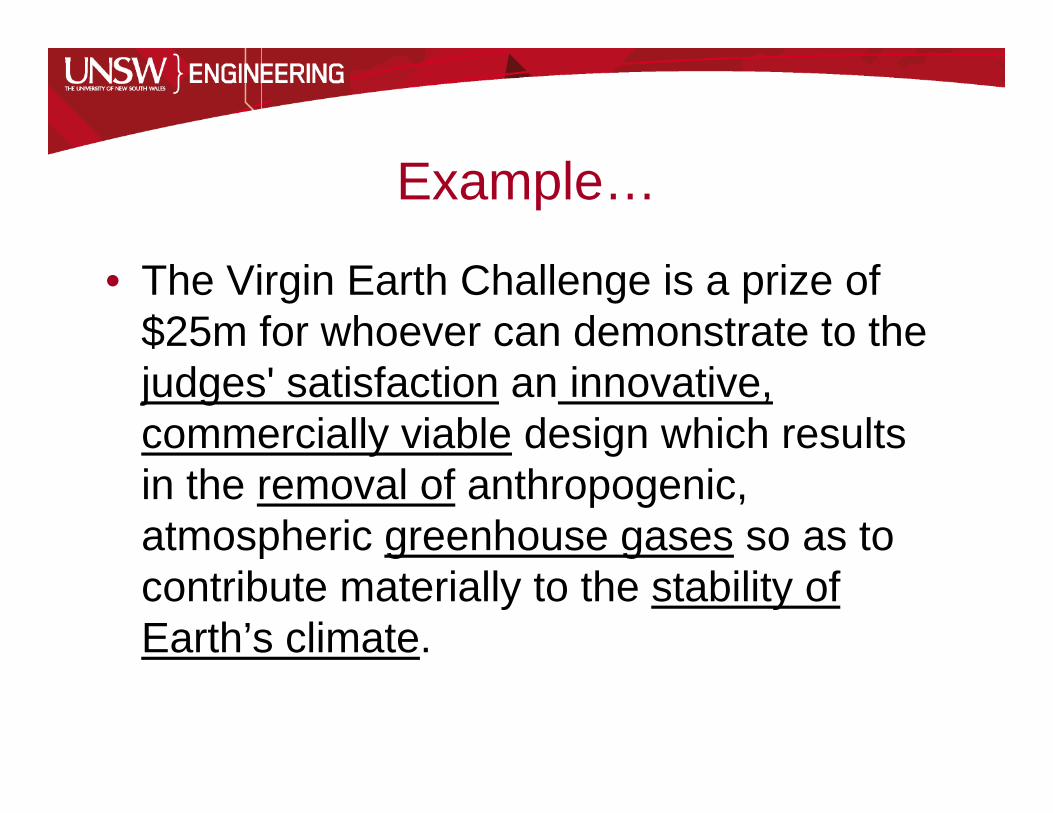
Example…
• The Virgin Earth Challenge is a prize of $25m for whoever can demonstrate to the judges' satisfaction an innovative,commercially viable design which results in the removal of anthropogenic, atmospheric greenhouse gases so as to contribute materially to the stability of Earth’s climate.
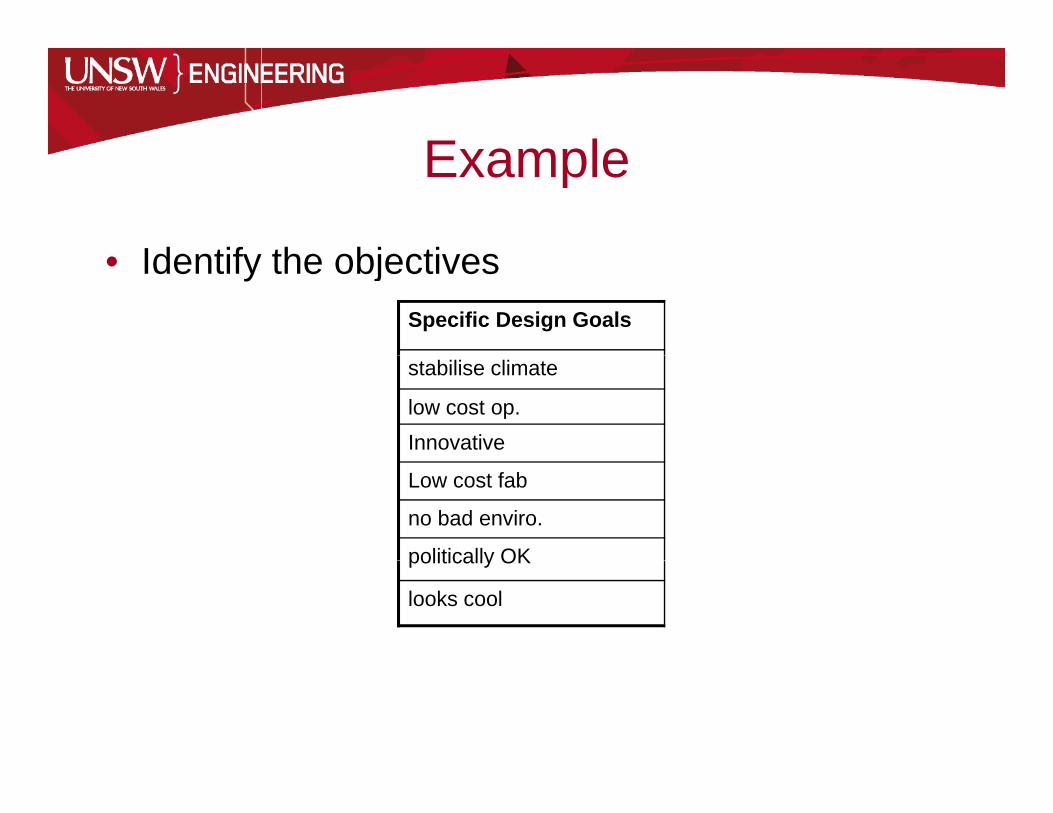
ExampleExample
Id tif th bj ti• Identify the objectivesSpecific Design Goals
stabilise climate
low cost op.Innovative
Low cost fab
no bad enviro.
politically OKpolitically OK
looks cool

R ti Alt ti D iRating Alternative Designs• Use measurable parameters if possible (eg• Use measurable parameters if possible (eg
minimizing op. cost, use $/CO2 removed), relative to other designsrelative to other designs.
• Otherwise use an arbitrary scale, decided yand agreed upon by the design team
• We have both scales as 1 10• We have both scales as 1-10.
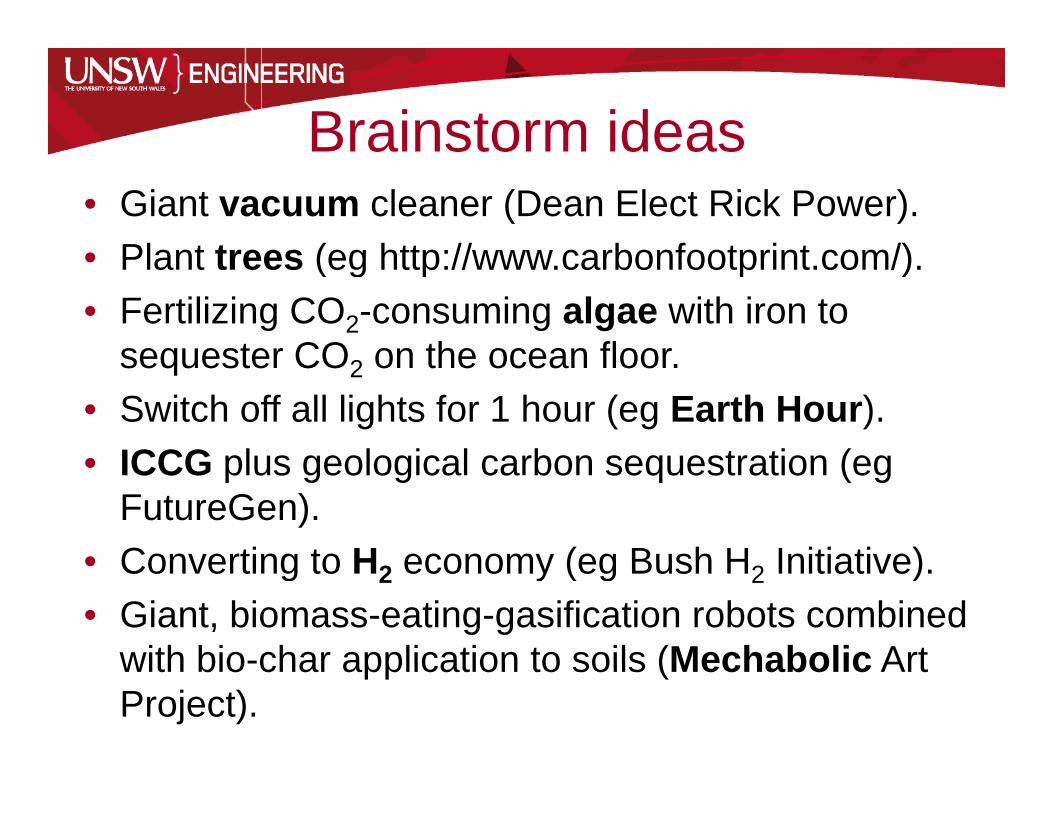
Brainstorm ideasBrainstorm ideas• Giant vacuum cleaner (Dean Elect Rick Power).• Plant trees (eg http://www carbonfootprint com/)• Plant trees (eg http://www.carbonfootprint.com/).• Fertilizing CO2-consuming algae with iron to
sequester CO on the ocean floorsequester CO2 on the ocean floor.• Switch off all lights for 1 hour (eg Earth Hour).• ICCG plus geological carbon sequestration (eg• ICCG plus geological carbon sequestration (eg
FutureGen).• Converting to H economy (eg Bush H Initiative)• Converting to H2 economy (eg Bush H2 Initiative).• Giant, biomass-eating-gasification robots combined
with bio-char application to soils (Mechabolic Artwith bio-char application to soils (Mechabolic Art Project).
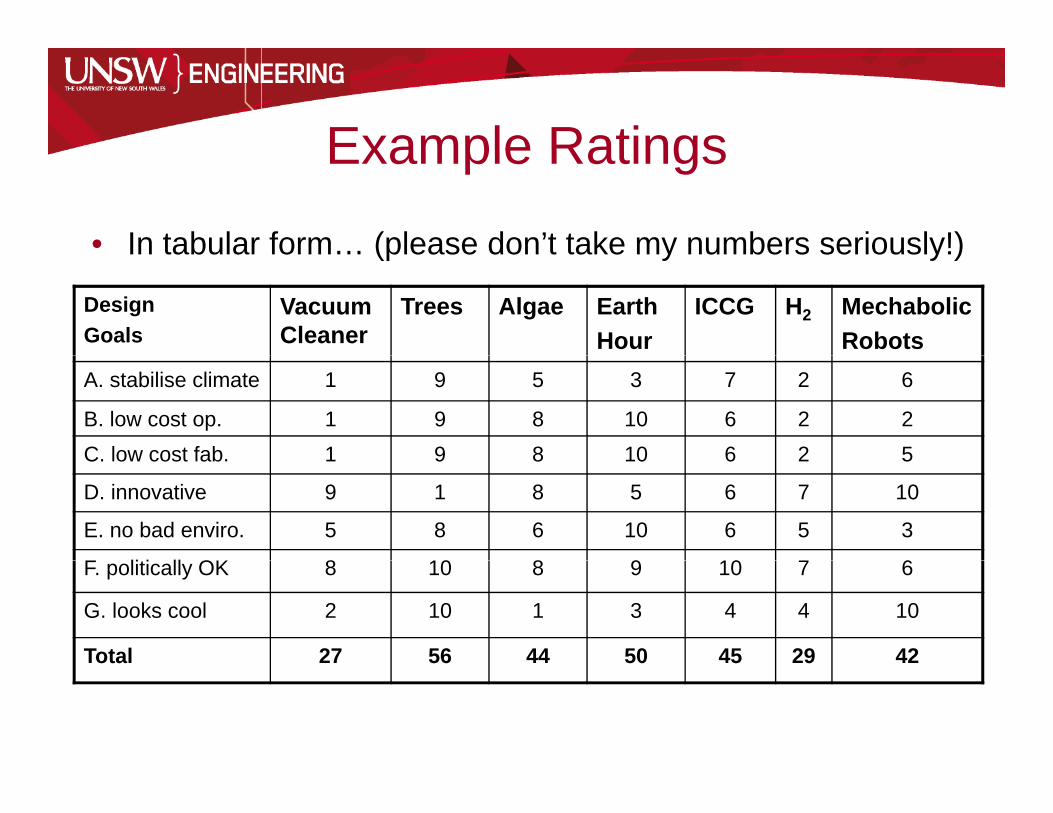
Example RatingsExample Ratings
• In tabular form… (please don’t take my numbers seriously!)In tabular form… (please don t take my numbers seriously!)
Design Goals
Vacuum Cleaner
Trees Algae EarthHour
ICCG H2 MechabolicRobots
A. stabilise climate 1 9 5 3 7 2 6
B. low cost op. 1 9 8 10 6 2 2C low cost fab 1 9 8 10 6 2 5C. low cost fab. 1 9 8 10 6 2 5
D. innovative 9 1 8 5 6 7 10
E. no bad enviro. 5 8 6 10 6 5 3
F liti ll OK 8 10 8 9 10 7 6F. politically OK 8 10 8 9 10 7 6
G. looks cool 2 10 1 3 4 4 10
Total 27 56 44 50 45 29 42ota 56 50 5 9
DecisionDecision• Trees are the winner!
• Or are they?y
Ranking ObjectivesRanking Objectives• Some objectives are must haves, others are
i t h b t t ti lnice to have, but not essential• Use the Pairwise comparison approach to
decide which are critical important or optionaldecide which are critical, important or optional• Fairly easy to see Politically OK and ‘looks
cool’ are at the bottom of the rankingscool are at the bottom of the rankings• Concentrate on the other objectives• We have a group of five so let’s do our• We have a group of five so let s do our
pairwise comparison
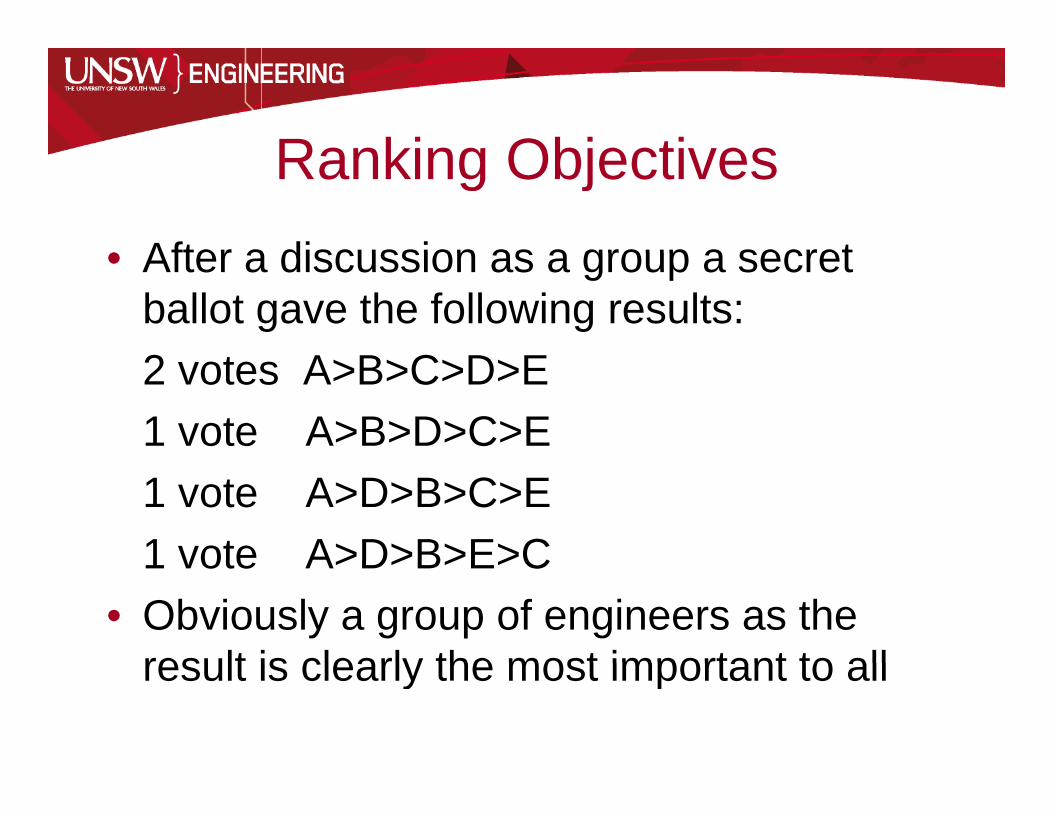
Ranking ObjectivesRanking Objectives• After a discussion as a group a secret• After a discussion as a group a secret
ballot gave the following results:2 t A B C D E2 votes A>B>C>D>E1 vote A>B>D>C>E1 vote A>D>B>C>E1 vote A>D>B>E>C1 vote A>D>B>E>C
• Obviously a group of engineers as the result is clearly the most important to allresult is clearly the most important to all
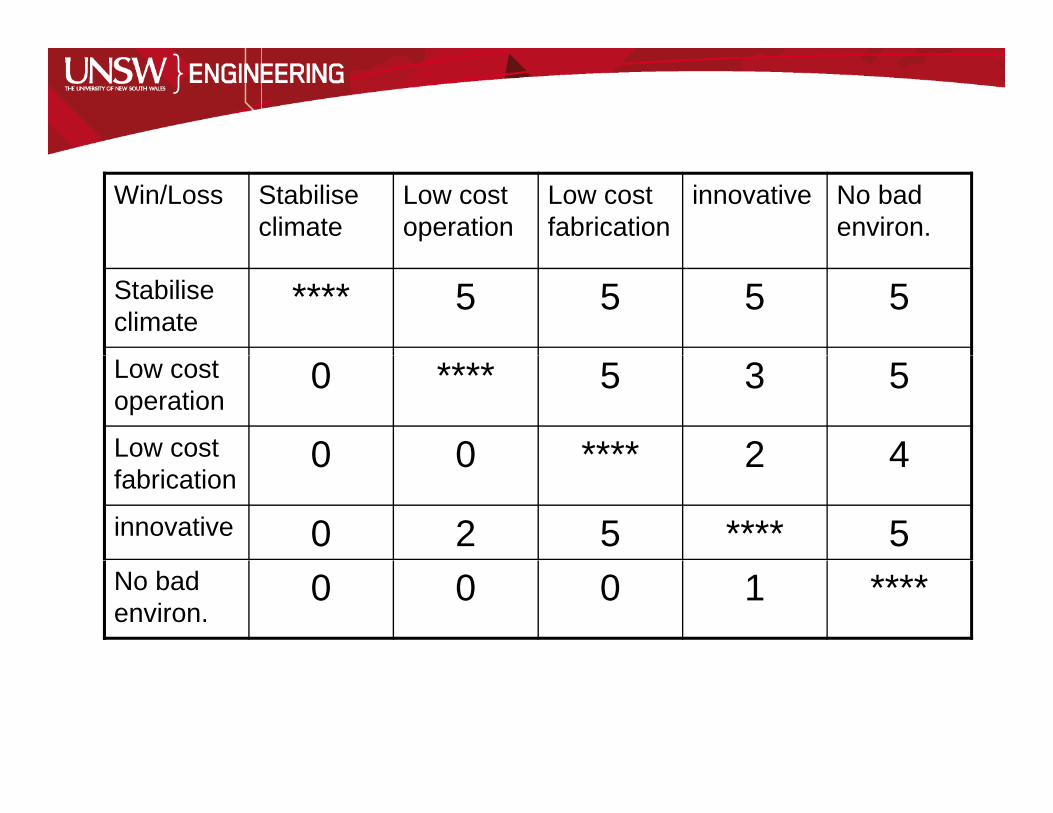
Win/Loss Stabilise climate
Low cost operation
Low cost fabrication
innovative No bad environ.
Stabilise climate
**** 5 5 5 5
Low cost operation
0 **** 5 3 5
Low cost 0 0 **** 2 4fabrication
0 0 2 4
innovative 0 2 5 **** 5No bad environ.
0 0 0 1 ****
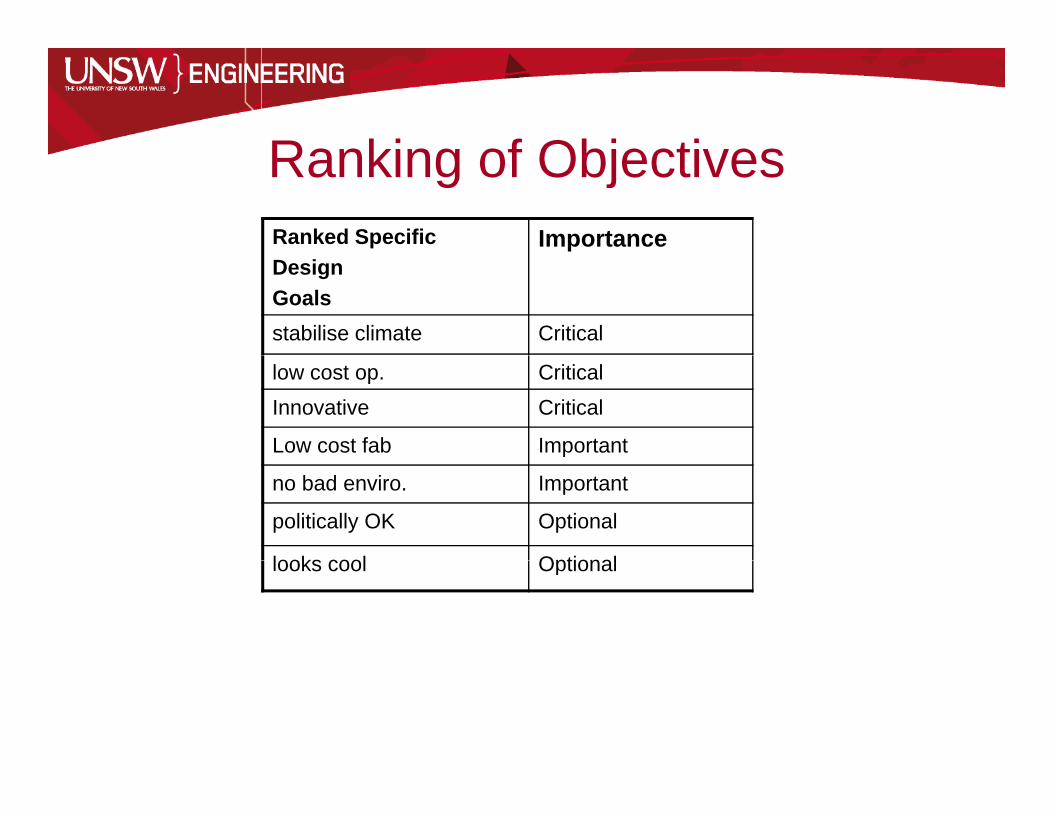
Ranking of ObjectivesRanking of ObjectivesRanked Specific ImportanceDesign Goalsstabilise climate Critical
low cost op. CriticalInnovative Critical
Low cost fab Important
no bad enviro. Important
politically OK Optional
looks cool Optionallooks cool Optional

Evaluation Matrix RevisitedDesign Goals
Vacuum Cleaner
Trees Algae EarthHour
ICCG H2 MechabolicRobots
stabilise 1 9 5 3 7 2 6stabilise climate
1 9 5 3 7 2 6
low cost op. 1 9 8 10 6 2 2innovative 9 1 8 5 6 7 10
Total 11 19 21 18 19 11 18
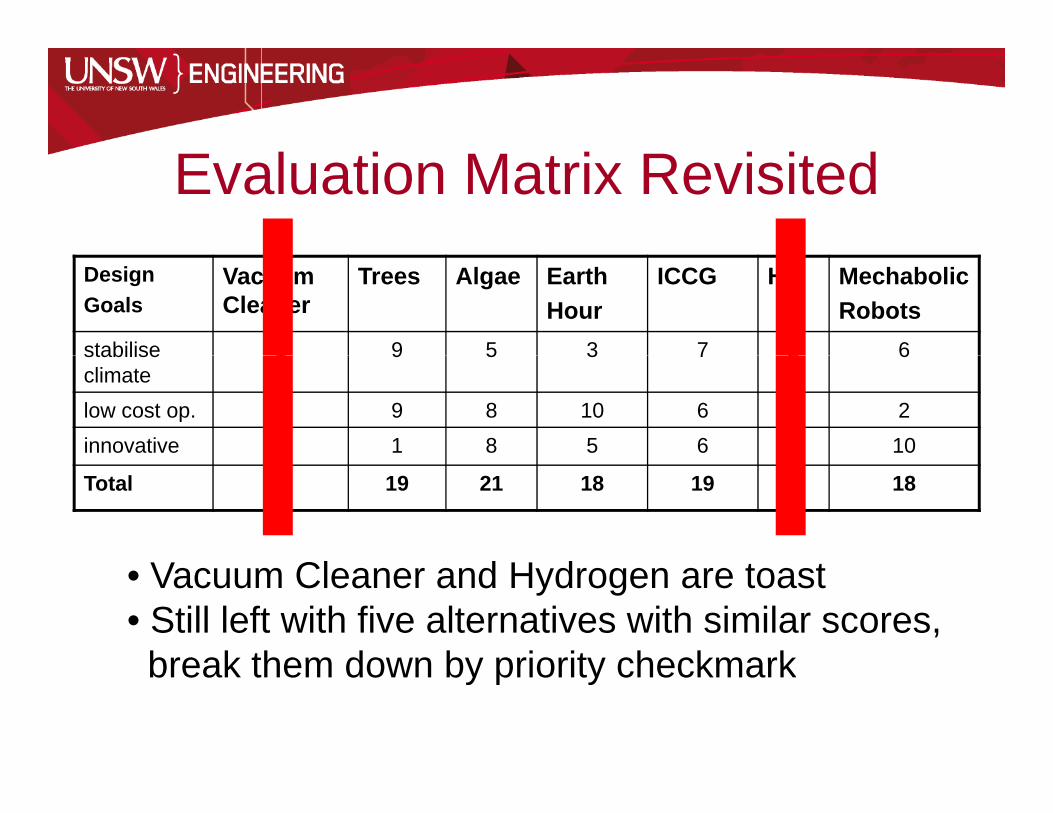
Evaluation Matrix RevisitedDesign Goals
Vacuum Cleaner
Trees Algae EarthHour
ICCG H2 MechabolicRobots
stabilise 1 9 5 3 7 2 6stabilise climate
1 9 5 3 7 2 6
low cost op. 1 9 8 10 6 2 2innovative 9 1 8 5 6 7 10
Total 11 19 21 18 19 11 18
• Vacuum Cleaner and Hydrogen are toast• Still left with five alternatives with similar scores,break them down by priority checkmarkbreak them down by priority checkmark
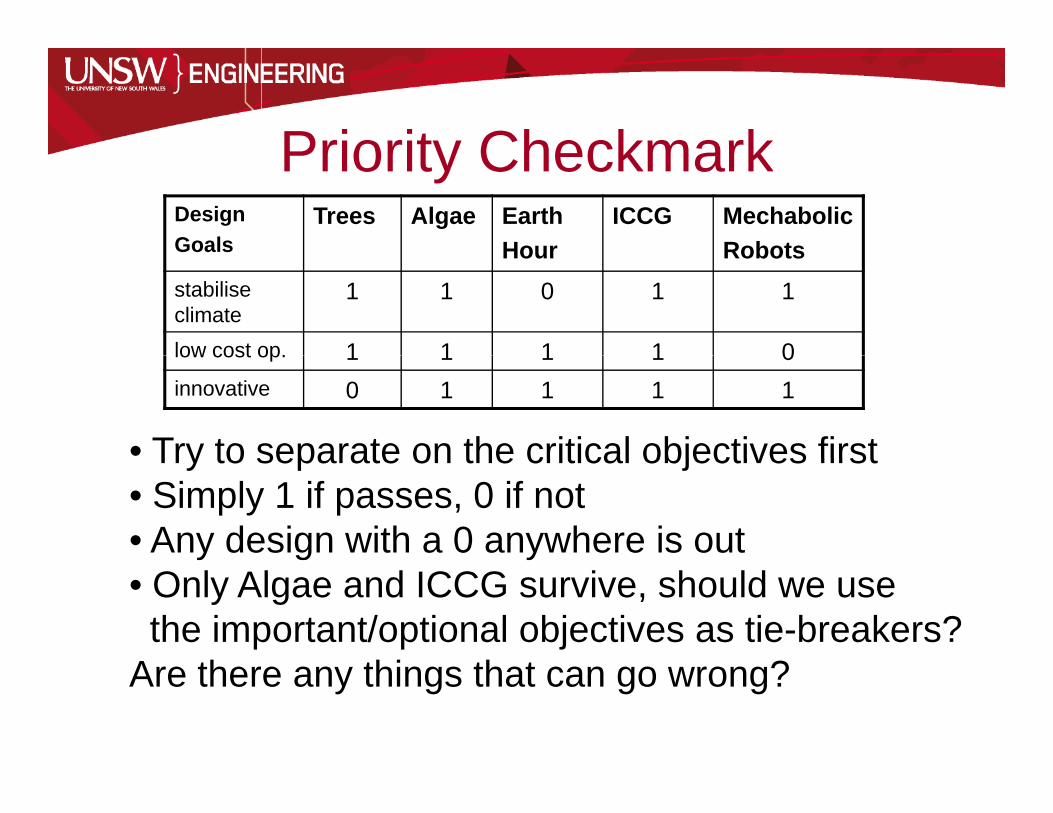
Priority CheckmarkPriority CheckmarkDesign Goals
Trees Algae EarthHour
ICCG MechabolicRobotsHour Robots
stabilise climate
1 1 0 1 1
low cost op. 1 1 1 1 0low cost op. 1 1 1 1 0innovative 0 1 1 1 1
• Try to separate on the critical objectives firstTry to separate on the critical objectives first• Simply 1 if passes, 0 if not• Any design with a 0 anywhere is out• Only Algae and ICCG survive, should we usethe important/optional objectives as tie-breakers?
A th thi th t ?Are there any things that can go wrong?

P t ti l P bl A l iPotential Problem Analysis• Iron-fertilised algae g
– May require too much iron (Fe) dust– Carbon may be re-released– Might cause other environmental problems (harmful
algal blooms -HABs)
• ICCG – May be too expensive (cost of complex plant)– May be too inefficient (piping and pumping of CO2)– CO2 may later escape (evidence of this exists)

Evaluating ThreatsEvaluating Threats• Threat = Severity (S) X Probability (P)
PotentialProblem
P S Threat
AlgaeAlgae•Too much Fe•CO2 escape
HAB
0.10.30 2
578
0.50.210 16•HAB 0.2 8 0.16
0.87 TotalICCG
•Too costly•Inefficient
•CO2 escape
0.40.10 3
557
0.20.5
0 21•CO2 escape 0.3 7 0.210.91 Total

Final DecisionW ll hi h ld ith?Well, which would you go with?
Some other points:We perhaps could have innovative as aWe perhaps could have innovative as a
constraint – it is called outWould using a best-of-class approachWould using a best-of-class approach
yielded a different result?
Economics• Most times we need to make a profit on what we
are building For an investor this is summarisedare building. For an investor this is summarised by the Return On Investment (ROI)
• Investors typically have a return threshold, if ROIInvestors typically have a return threshold, if ROI falls below this value it won’t get funded.
• Modifications to design to increase worth or glower manufacturing costs may be needed –shouldn’t sacrifice the must-haves in our design….
• Money’s value changes over time, think about h hi f i d i iwhat this means for investment decisions…

SummarySummary• When deciding on a design, we need tools to g g
help us make a rational choice• Important to identify which objectives are more
i t t th th i i iimportant than others – use pairwise comparison• Need to score designs on how they achieve
objectives- try for measurable metrics whenobjectives- try for measurable metrics when possible
• Look out for any bias in your decisionsy y• These tools help us make decisions, they don’t
make them for us

What next?• Performance test instructions (week 9) are on
Moodle, make sure you know what is required!, y q• Design presentation in week 11, start thinking
about it! Instructions on Moodle.• Learning Portfolio 3a
– Do the preparation before Thursday’s workshop• Learning Portfolio 2
– Need to submit text by Friday• Start building! (If you haven’t already….)