05hdm 4deteriorationbituminousroads2008!10!22
DESCRIPTION
DeteriorationBituminousRoadsTRANSCRIPT
Deterioration of Bituminous Roads

2Sur
face
Tre
atm
ent
• Granular Base• Asphalt Base• Asphalt Pavement
Base• Stabilized Base
• Asphalt Concrete• Hot Rolled Modified Asphalt• Rubberized Asphalt• Polymer Asphalt Concrete• Soft Bitumen Mix (Cold Mix)• Porous Asphalt• Stone Mastic
• Cape Seal• Double Bituminous Surface Dressing• Single Bituminous Surface Dressing• Slurry Seal• Penetration Macadam
Base, Surface and Material Types
Asp
halt
Mix
3
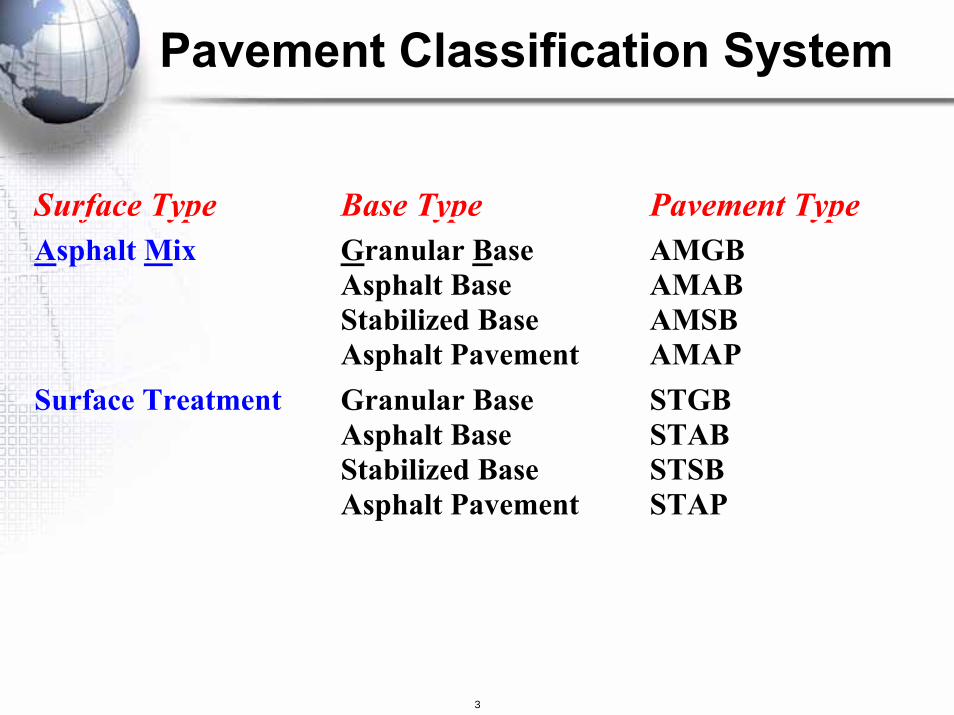
Surface Type Base Type Pavement TypeAsphalt Mix Granular Base
Asphalt BaseStabilized BaseAsphalt Pavement
AMGBAMABAMSBAMAP
Surface Treatment Granular BaseAsphalt BaseStabilized BaseAsphalt Pavement
STGBSTABSTSBSTAP
Pavement Classification System
4
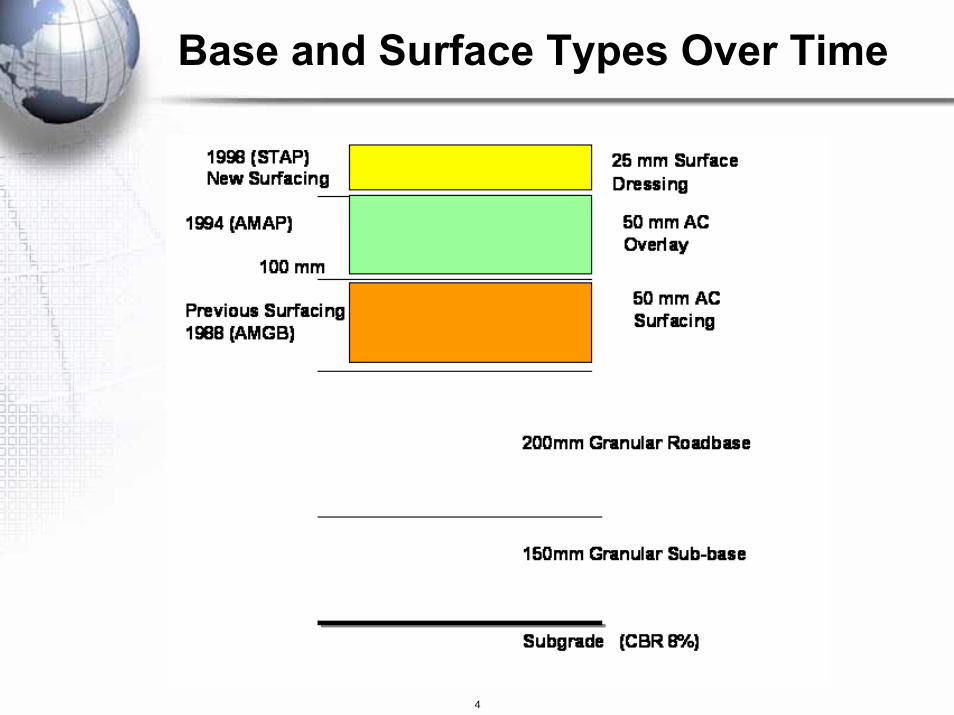
Base and Surface Types Over Time

5
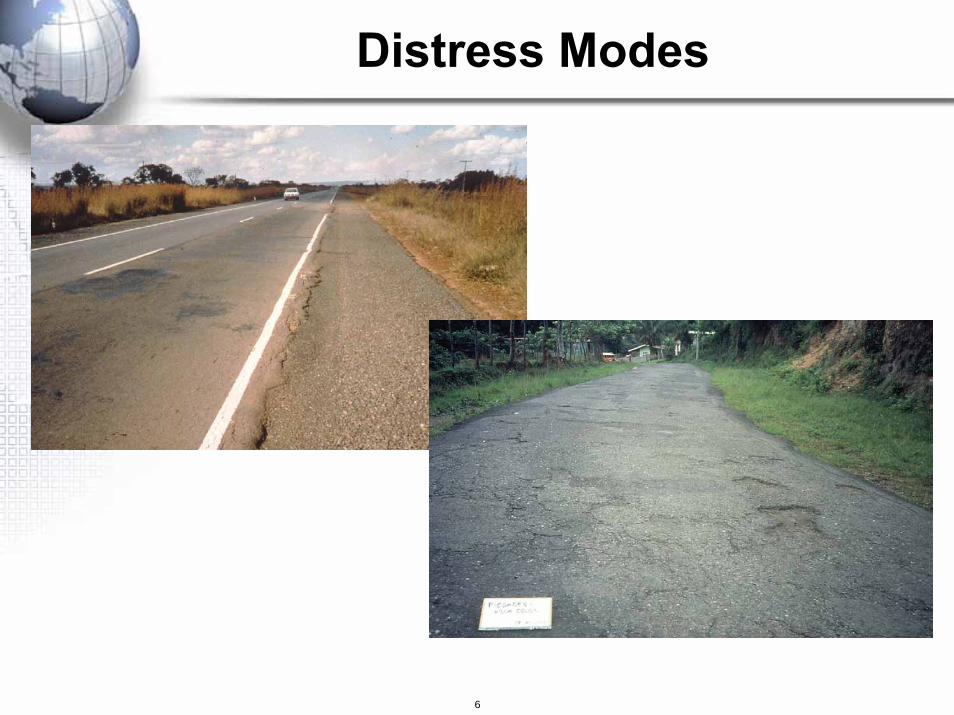
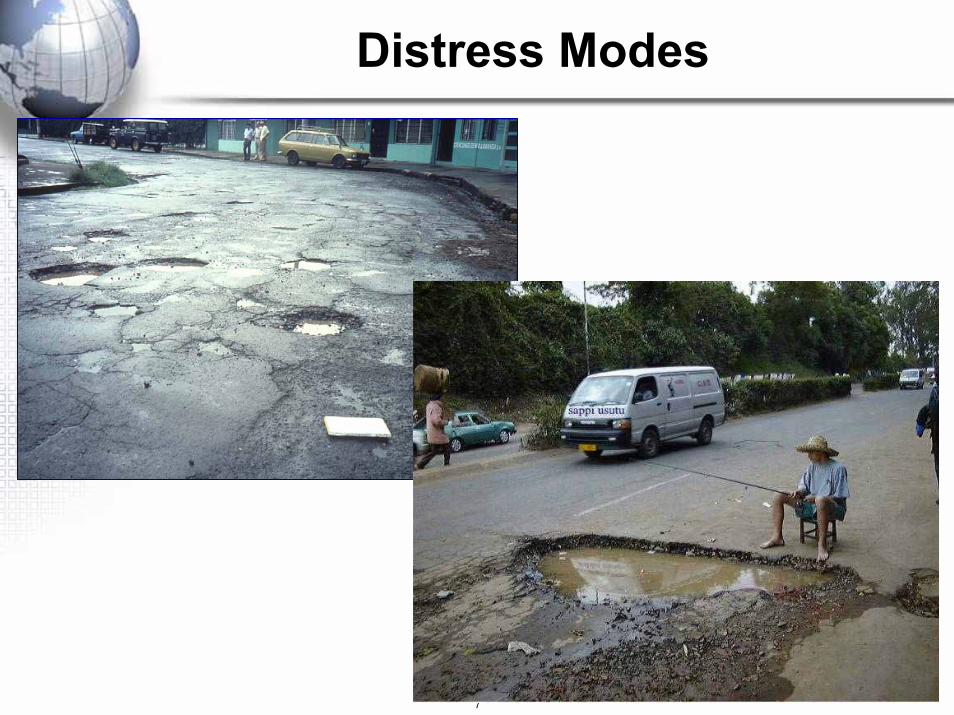
Distress Modes
• Surfacing DistressCrackingRavellingPotholingEdge-Break
• Deformation DistressRuttingRoughness
• Pavement Surface Texture DistressTexture DepthSkid Resistance
• Drainage DistressDrainage
6
Distress Modes
7
Distress Modes

8
Surfacing Distress
• Cracking Area: Sum of rectangular areas circumscribing manifest distress (line cracks are assigned a width of 0.5 m), expressed as a percentage of carriageway area.
Structural Crackingo Narrow Cracking (1-3 mm crack width)o Wide Cracking (> 3 mm crack width)
Thermal Transverse Cracking• Ravelling Area: Area of loss of material from
wearing surface, expressed as a percentage of carriageway area.
9
Surfacing Distress
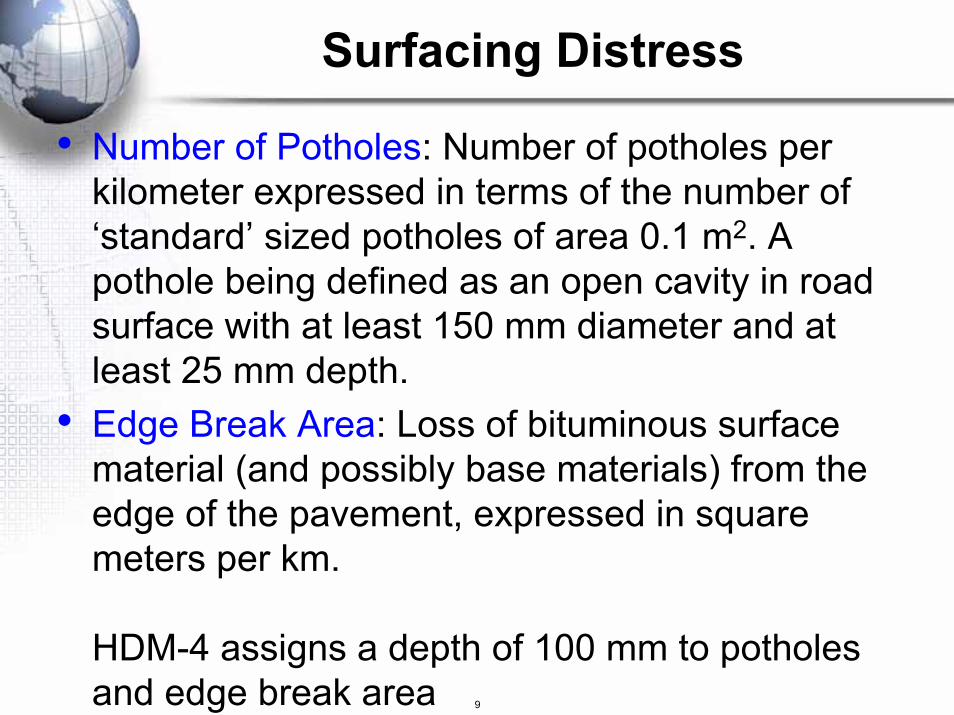
• Number of Potholes: Number of potholes per kilometer expressed in terms of the number of ‘standard’ sized potholes of area 0.1 m2. A pothole being defined as an open cavity in road surface with at least 150 mm diameter and at least 25 mm depth.
• Edge Break Area: Loss of bituminous surface material (and possibly base materials) from the edge of the pavement, expressed in square meters per km.
HDM-4 assigns a depth of 100 mm to potholes and edge break area
10
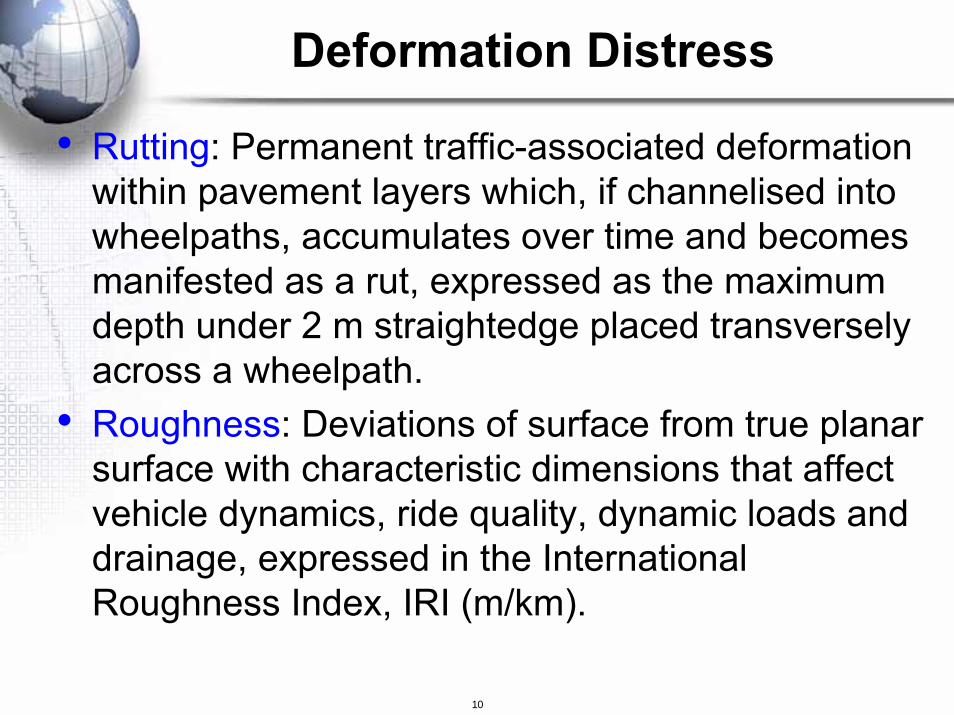
Deformation Distress
• Rutting: Permanent traffic-associated deformation within pavement layers which, if channelised into wheelpaths, accumulates over time and becomes manifested as a rut, expressed as the maximum depth under 2 m straightedge placed transversely across a wheelpath.
• Roughness: Deviations of surface from true planar surface with characteristic dimensions that affect vehicle dynamics, ride quality, dynamic loads and drainage, expressed in the International Roughness Index, IRI (m/km).
11
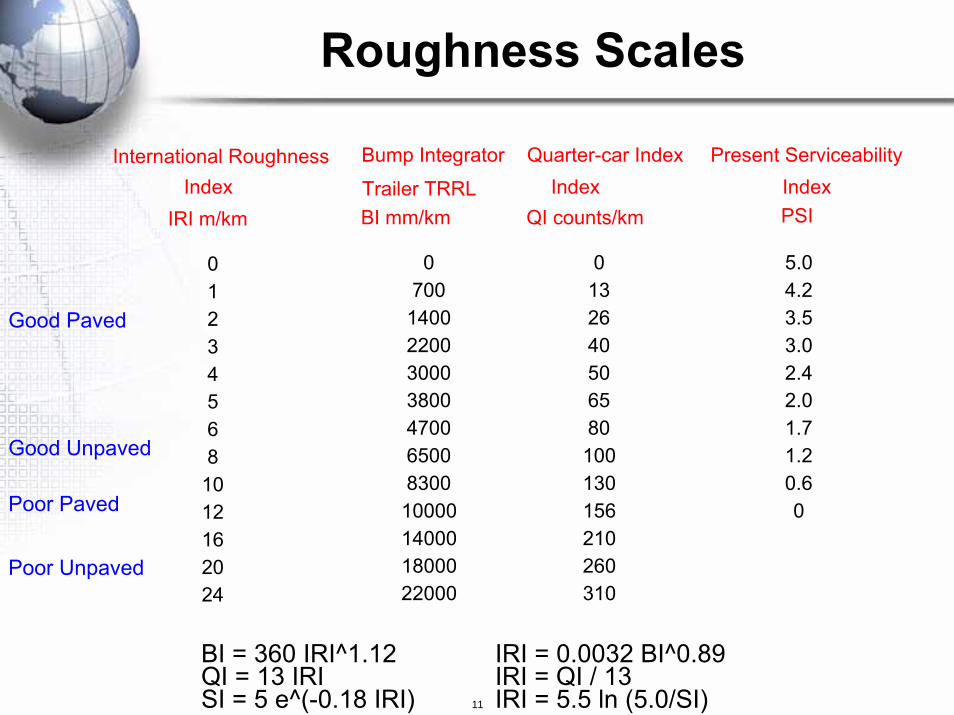
International RoughnessIndex
Bump Integrator
Trailer TRRL
Quarter-car IndexIndex
Present ServiceabilityIndex
IRI m/km BI mm/km QI counts/km PSI
0 0 0 5.01 700 13 4.22 1400 26 3.53 2200 40 3.04 3000 50 2.45 3800 65 2.06 4700 80 1.78 6500 100 1.2
10 8300 130 0.612 10000 156 016 14000 21020 18000 26024 22000 310
BI = 360 IRI^1.12QI = 13 IRISI = 5 e^(-0.18 IRI)
IRI = 0.0032 BI^0.89IRI = QI / 13IRI = 5.5 ln (5.0/SI)
Good Paved
Poor Paved
Poor Unpaved
Good Unpaved
Roughness Scales
12
• Texture Depth: Average depth of the surface of a road expressed as the quotient of a given volume of standardized material (sand) and the area of that material spread in a circular patch on the surface being tested.
• Skid Resistance: Resistance to skidding expressed by the sideways force coefficient (SDF) at 50 km/h measured using the Sideways Force Coefficient Routine Investigation Machine (SCRIM).
Pavement Surface Texture Distress
13
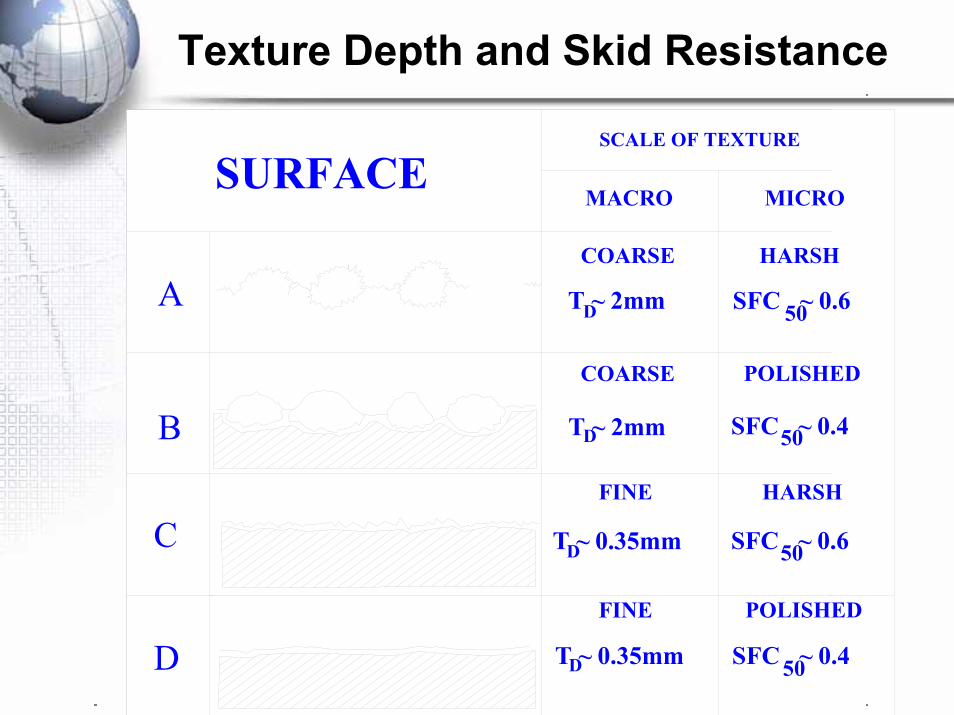
SURFACE
A
B
C
D
HARSH
HARSH
POLISHED
POLISHED
T ~ 0.35mm
T ~ 2mm
SCALE OF TEXTURE
MICROMACRO
COARSE
D
COARSE
T ~ 2mmD
FINE
D
DT ~ 0.35mm
FINE
SFC ~ 0.4
SFC ~ 0.6
SFC ~ 0.4
SFC ~ 0.650
50
50
50
Texture Depth and Skid Resistance
14
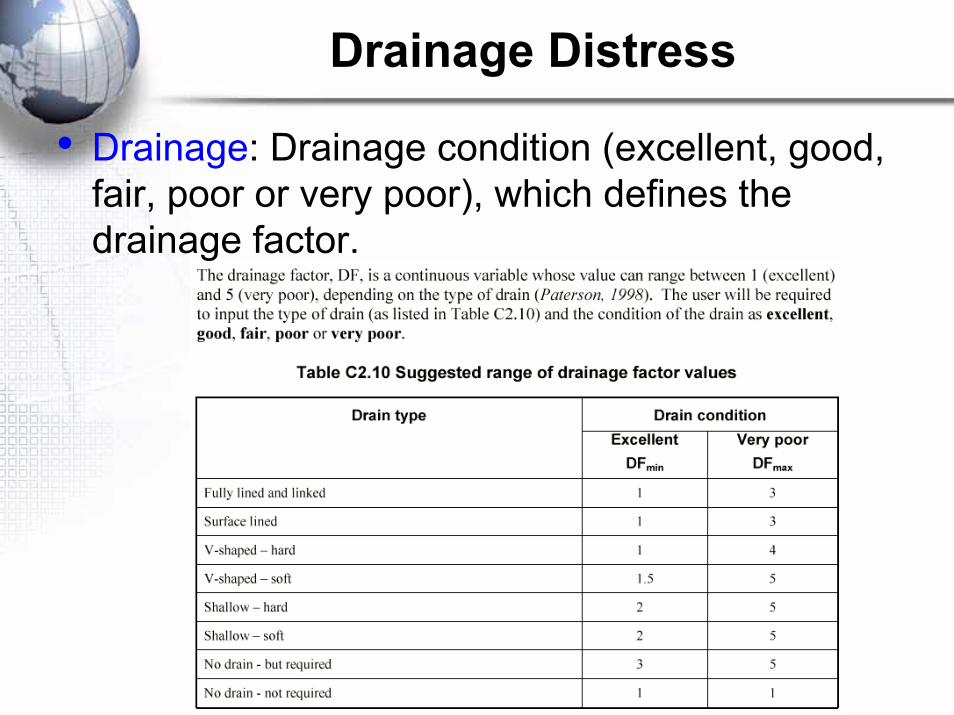
• Drainage: Drainage condition (excellent, good, fair, poor or very poor), which defines the drainage factor.
Drainage Distress
15
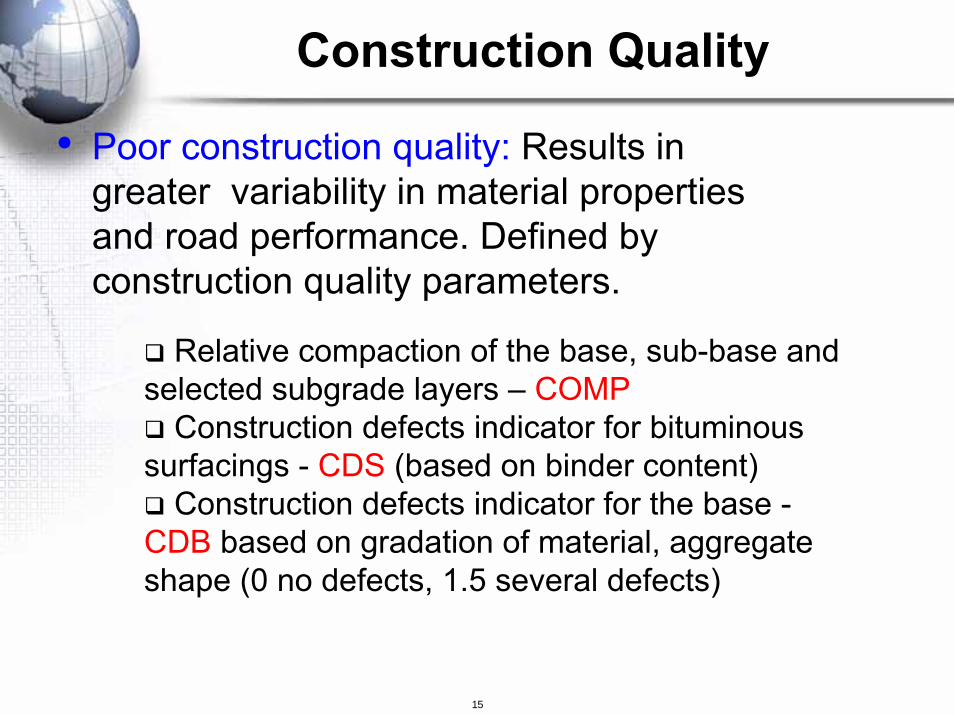
• Poor construction quality: Results in greater variability in material properties and road performance. Defined by construction quality parameters.
Relative compaction of the base, sub-base and selected subgrade layers – COMP
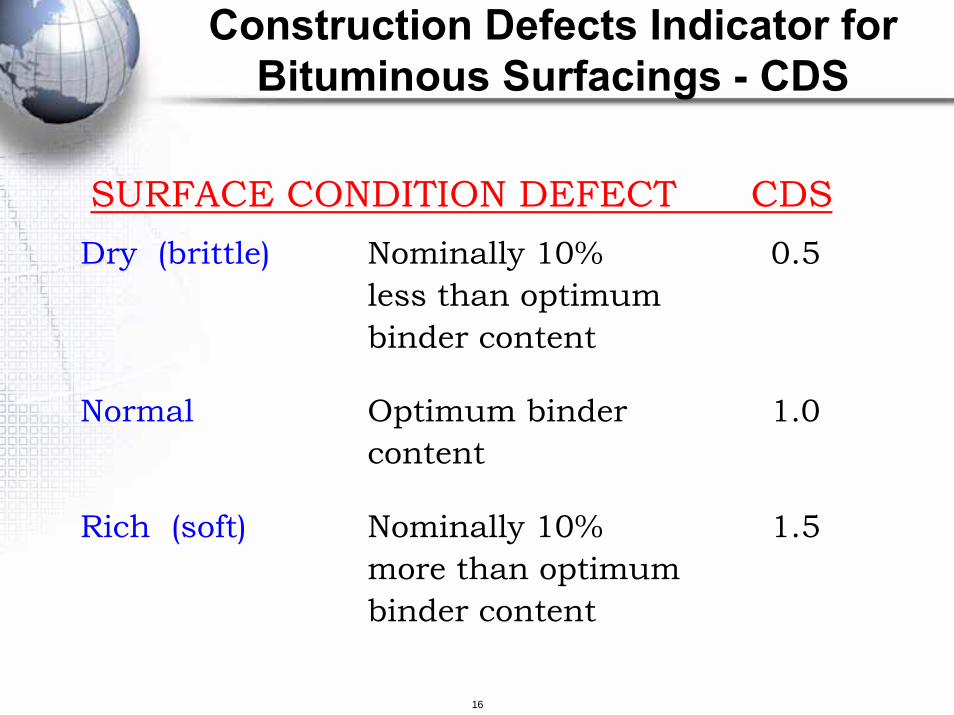
Construction defects indicator for bituminous surfacings - CDS (based on binder content)
Construction defects indicator for the base -CDB based on gradation of material, aggregate shape (0 no defects, 1.5 several defects)
Construction Quality
16
SURFACE CONDITION DEFECT CDSDry (brittle) Nominally 10% 0.5
less than optimumbinder content
Normal Optimum binder 1.0content
Rich (soft) Nominally 10% 1.5more than optimumbinder content
Construction Defects Indicator for Bituminous Surfacings - CDS
17
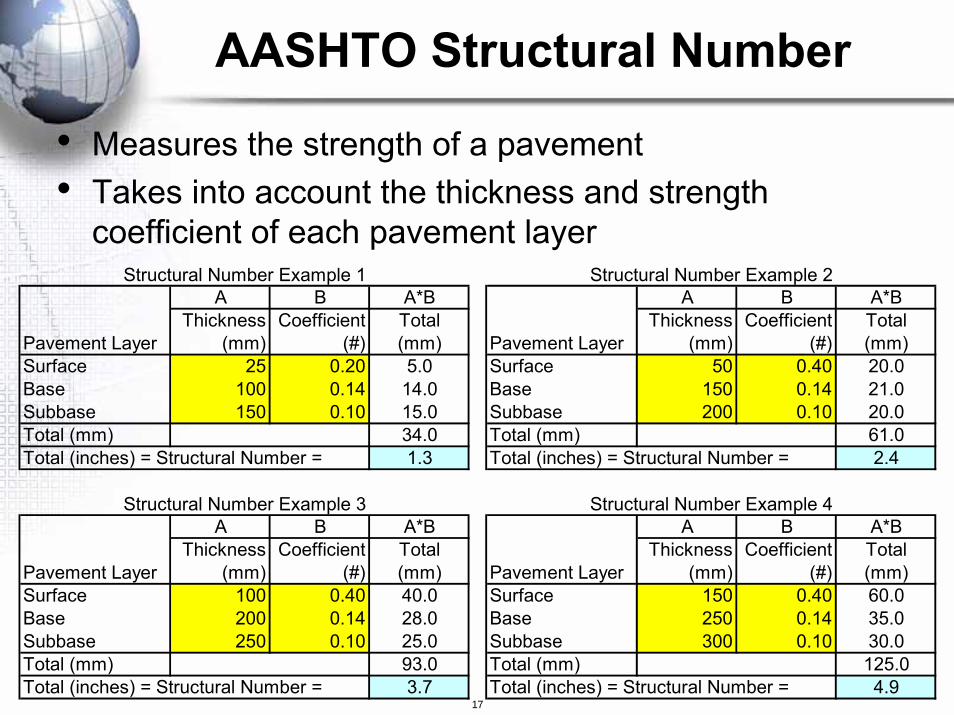
• Measures the strength of a pavement• Takes into account the thickness and strength
coefficient of each pavement layerStructural Number Example 1 Structural Number Example 2
A B A*B A B A*BThickness Coefficient Total Thickness Coefficient Total
Pavement Layer (mm) (#) (mm) Pavement Layer (mm) (#) (mm)Surface 25 0.20 5.0 Surface 50 0.40 20.0Base 100 0.14 14.0 Base 150 0.14 21.0Subbase 150 0.10 15.0 Subbase 200 0.10 20.0Total (mm) 34.0 Total (mm) 61.0Total (inches) = Structural Number = 1.3 Total (inches) = Structural Number = 2.4
Structural Number Example 3 Structural Number Example 4A B A*B A B A*B
Thickness Coefficient Total Thickness Coefficient TotalPavement Layer (mm) (#) (mm) Pavement Layer (mm) (#) (mm)Surface 100 0.40 40.0 Surface 150 0.40 60.0Base 200 0.14 28.0 Base 250 0.14 35.0Subbase 250 0.10 25.0 Subbase 300 0.10 30.0Total (mm) 93.0 Total (mm) 125.0Total (inches) = Structural Number = 3.7 Total (inches) = Structural Number = 4.9
AASHTO Structural Number

18
∑=
=n
1iiihaSN
SNC = SN + SNSG
• The HDM-III Modified Structural Number includes the strength contribution of the sub-grade that is a function of the sub-grade CBR
ASSHTOStructuralNumber
43.1)(log85.0)(log51.3 21010 −−= CBRCBRSNSG
HDM-III Modified Structural Number
19
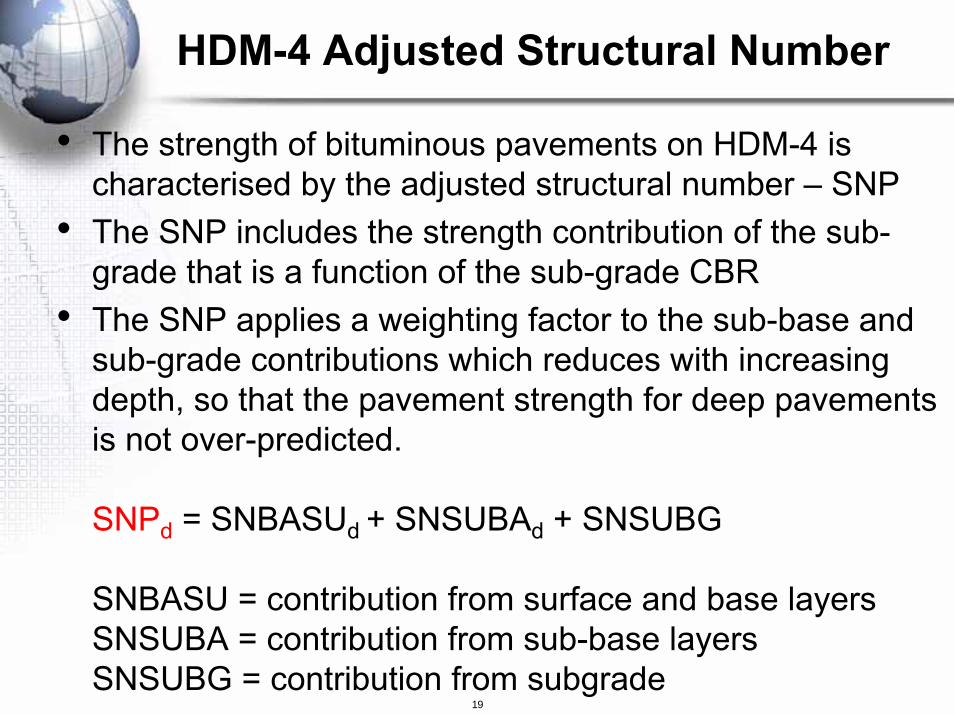
• The strength of bituminous pavements on HDM-4 is characterised by the adjusted structural number – SNP
• The SNP includes the strength contribution of the sub-grade that is a function of the sub-grade CBR
• The SNP applies a weighting factor to the sub-base and sub-grade contributions which reduces with increasing depth, so that the pavement strength for deep pavements is not over-predicted.
SNPd = SNBASUd + SNSUBAd + SNSUBG
SNBASU = contribution from surface and base layersSNSUBA = contribution from sub-base layersSNSUBG = contribution from subgrade
HDM-4 Adjusted Structural Number
20
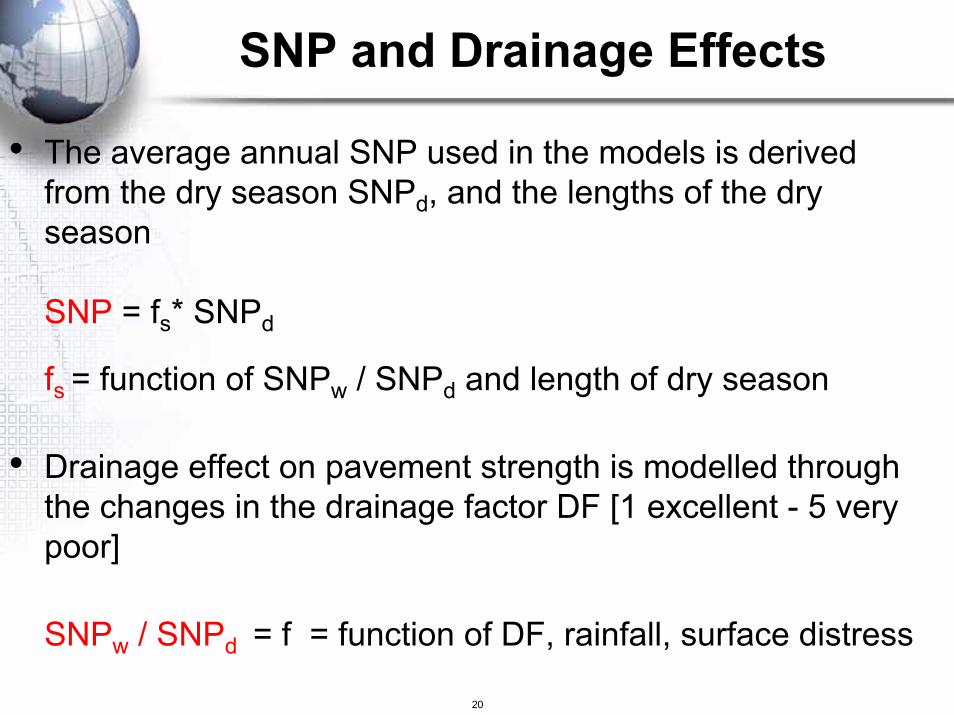
• The average annual SNP used in the models is derived from the dry season SNPd, and the lengths of the dry season
SNP = fs* SNPd
fs = function of SNPw / SNPd and length of dry season
• Drainage effect on pavement strength is modelled through the changes in the drainage factor DF [1 excellent - 5 very poor]
SNPw / SNPd = f = function of DF, rainfall, surface distress
SNP and Drainage Effects

21
Benkelman or FWD
Deflection
if base is not cementedSNPk = 3.2 DEF^-0.63
if base is cementedSNPk = 2.2 DEF^-0.63
if base is not cementedDEF = 6.5 SNPk^-1.6
if base is cementedDEF = 3.5 SNPk^-1.6 Adjusted
StructuralNumber
Adjusted Structural Number andBenkelman or FWD Deflection
22
• Road investment decision support systems must have some form of pavement deterioration modelling capability
• Objective is to predict the future condition and the effects of maintenance
Road Deterioration Modelling

23
ASSETCONDITION
EXCELLENT
POOR TIME
Minimum Acceptable Standard(TRIGGER)
Decay in Condition(DETERIORATION)
Treatment Applied
What We are Trying to Predict (1)
• Predict asset condition
24
What We are Trying to Predict (2)
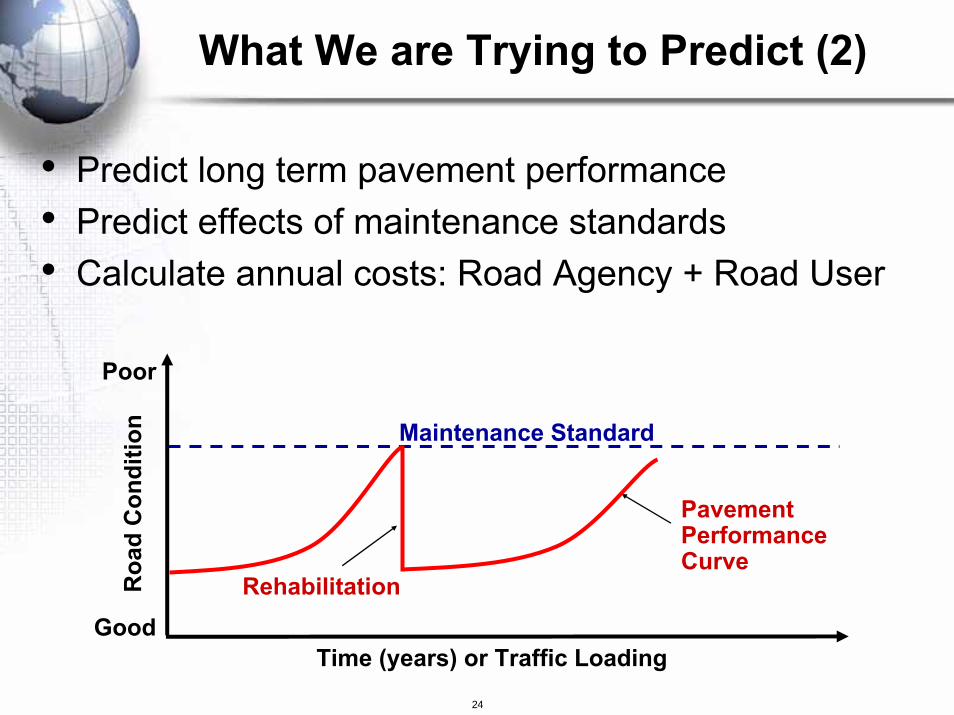
• Predict long term pavement performance• Predict effects of maintenance standards• Calculate annual costs: Road Agency + Road User
Roa
d C
ondi
tion
Rehabilitation
Maintenance Standard
Time (years) or Traffic Loading
PavementPerformanceCurve
Good
Poor
25
Road Deterioration Depends On
• Original design• Material types• Construction quality• Traffic volume and axle loading• Road geometry and alignment• Pavement age• Environmental conditions• Maintenance policy
26
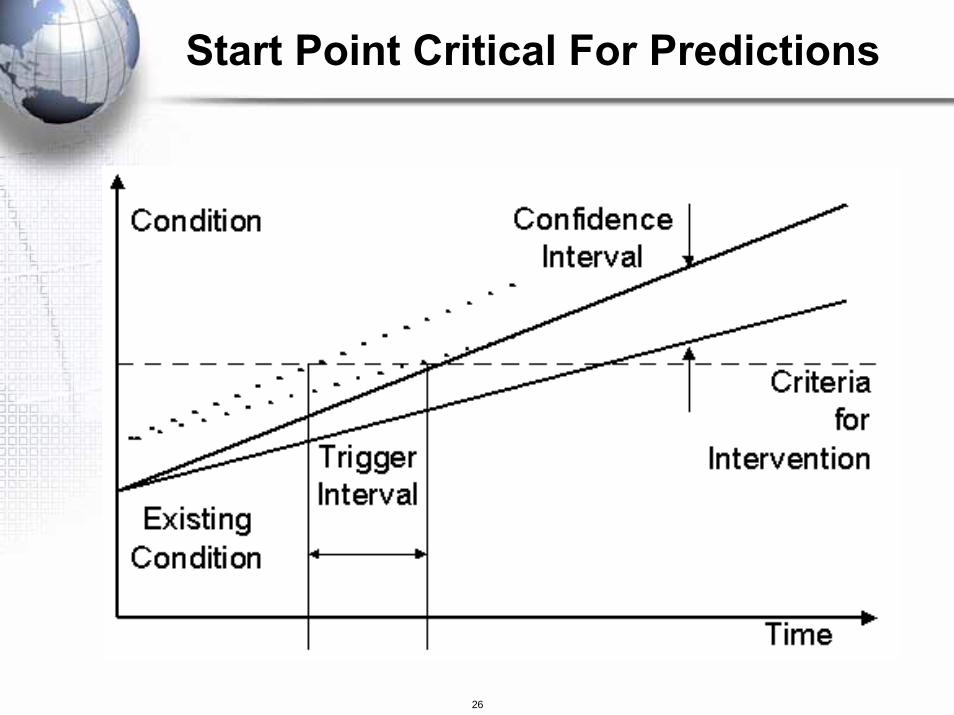
Start Point Critical For Predictions
27
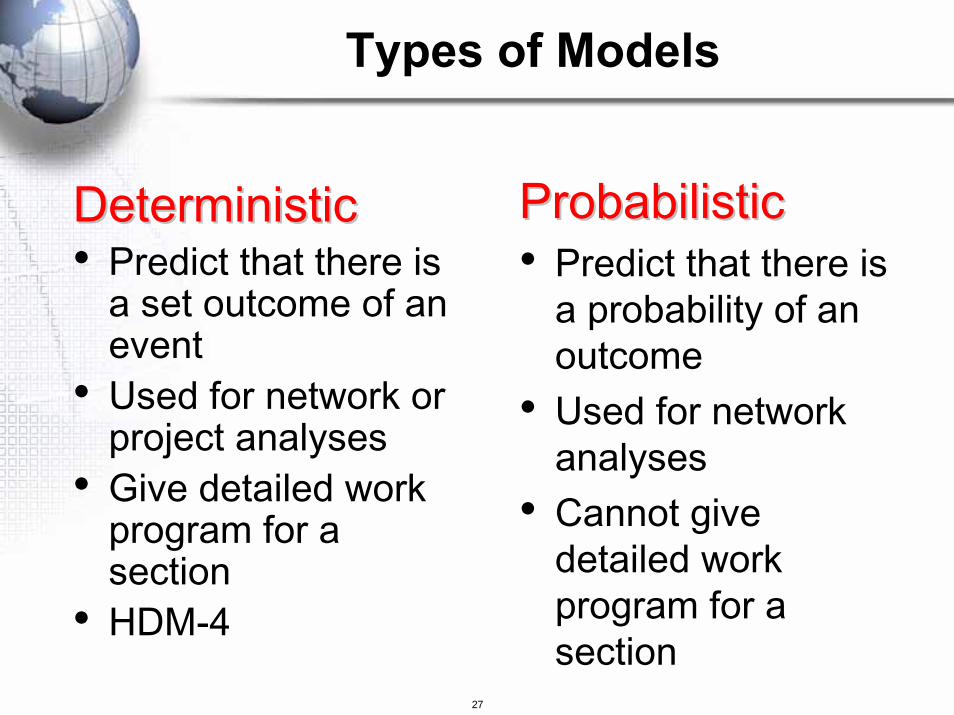
DeterministicDeterministic• Predict that there is
a set outcome of an event
• Used for network or project analyses
• Give detailed work program for a section
• HDM-4
ProbabilisticProbabilistic• Predict that there is
a probability of an outcome
• Used for network analyses
• Cannot give detailed work program for a section
Types of Models
28
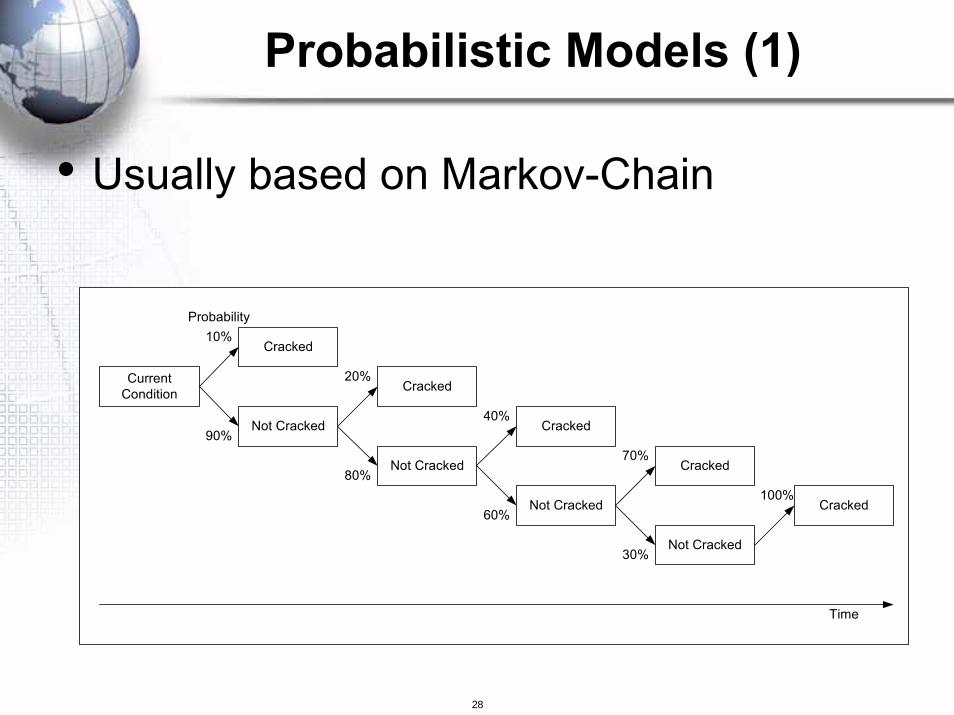
• Usually based on Markov-Chain
CurrentCondition
Cracked
Not Cracked
Not Cracked
Cracked
Not Cracked
Cracked
Not Cracked
Cracked
10%
90%
20%
80%
40%
60%
70%
30%
Cracked100%
Probability
Time
Probabilistic Models (1)
29
• Good for getting overall network investment needs
• Cannot be used for planning investments on specific roads i.e.Link X needs treatment Y in year Z
Probabilistic Models (2)
30
• Empiricalbased on statistical analysis of locally observed deterioration trends
• Mechanisticuses fundamental theories of pavement behaviour for their development
• Structural mechanistic-empirical approachbased on identifying the functional form and primary variables and then applying various statistical techniques to quantify their impacts using empirical data (HDM-4Models)
Deterministic Models (1)
31
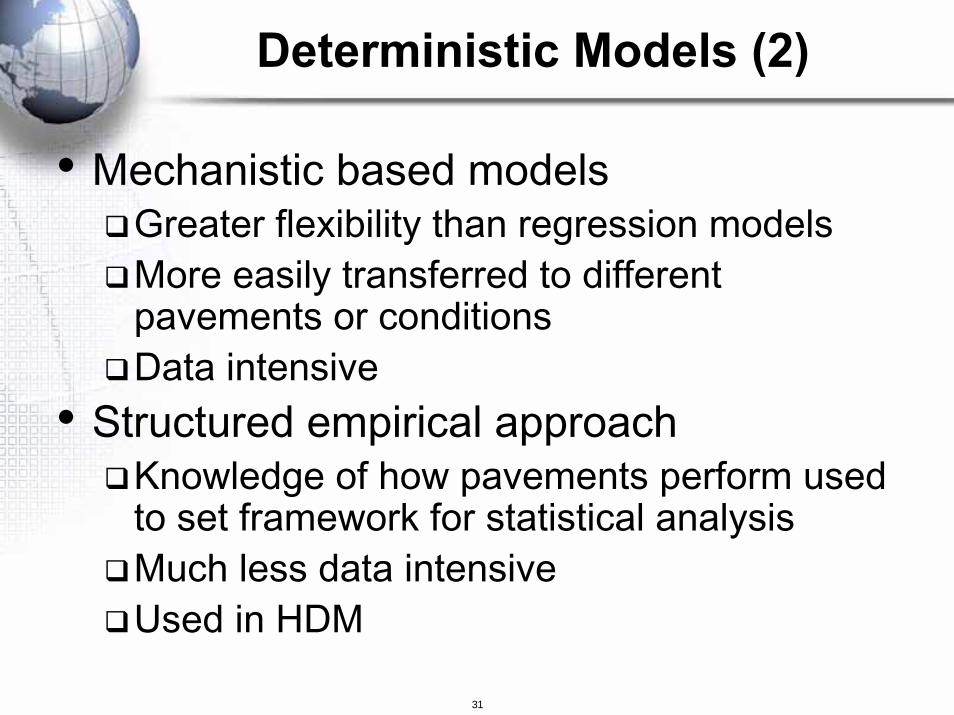
• Mechanistic based models Greater flexibility than regression modelsMore easily transferred to different pavements or conditions Data intensive
• Structured empirical approachKnowledge of how pavements perform used to set framework for statistical analysisMuch less data intensiveUsed in HDM
Deterministic Models (2)
32
Types of Deterministic Models (1)
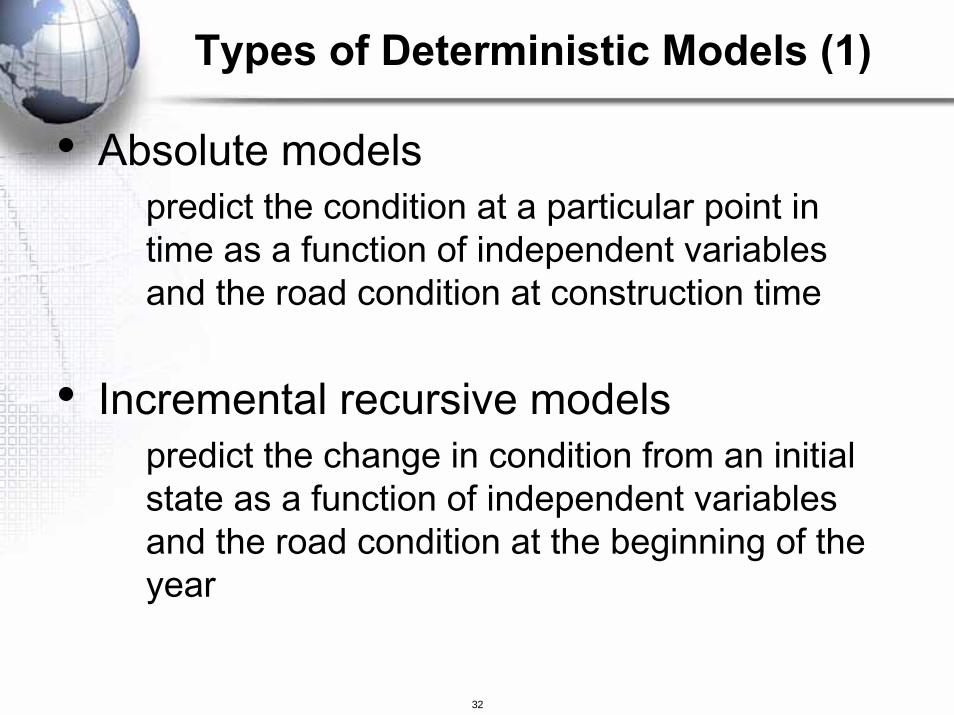
• Absolute modelspredict the condition at a particular point in time as a function of independent variables and the road condition at construction time
• Incremental recursive modelspredict the change in condition from an initial state as a function of independent variables and the road condition at the beginning of the year

33
• AbsolutePredicts the future condition
o CONDITION = f(a0, a1, a2)Limited to conditions model developed forProblems with calibrationUsed on HDM-4 for concrete roads
• IncrementalPredicts the change in condition from the current condition:
o Δ CONDITION = f(a0, a1, a2)Can use any start point so much more flexibleUsed in HDM-4 for Bituminous Roads
Types of Deterministic Models (2)

34
Bituminous Concrete Block* Unsealed
CrackingRuttingRavellingPotholingRoughness
Edge breakSurface textureSkid resistance
CrackingJoint spallingFaultingFailuresServiceability ratingRoughness
RuttingSurface textureRoughness
*not in current release
Gravel lossRoughness
Plus deterioration of drains
Pavement Defects Modelled in HDM-4
35
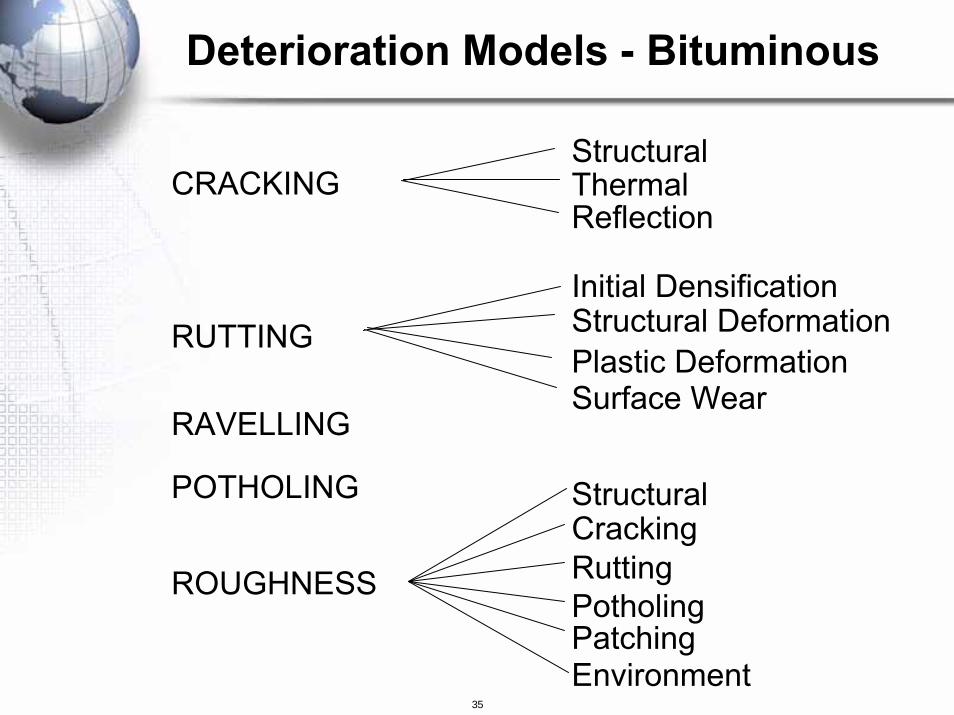
POTHOLING
CRACKINGStructuralThermalReflection
ROUGHNESS
CrackingRuttingPotholing
Structural
PatchingEnvironment
RAVELLING
RUTTING Structural DeformationPlastic DeformationSurface Wear
Initial Densification
Deterioration Models - Bituminous
36
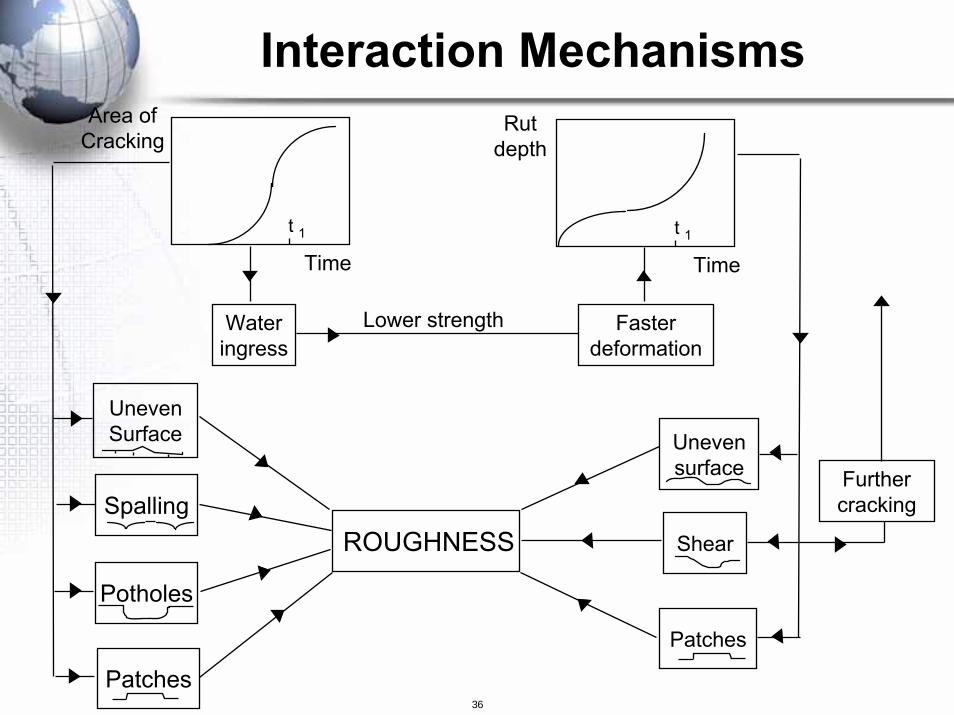
t 1 t 1
Wateringress
Furthercracking
Patches
Shear
Unevensurface
Spalling
Fasterdeformation
ROUGHNESS
Potholes
Patches
Time Time
UnevenSurface
Lower strength
Area ofCracking
Rutdepth
Interaction Mechanisms
37
• Models are structured empirical • Individual distresses modelled separately• Relationships are incremental and
recursivedY = K a0 f(X1, X2, X3, etc)
• Modelled sequentially through to roughness
• Maintenance intervention at end of each year
Principles Of Deterioration Models

38
Input pavement strength,condition, age for initialanalysis year
Compute traffic loading
Compute roughness increment
Compute surface distress increment
Scheduled maintenance?YN
Condition responsive?Y
N
Patching?Y
NCompute post-maintenance condition, strength, age
Compute maintenance effects
Year Loop
Paved Roads Deterioration Sequence
39
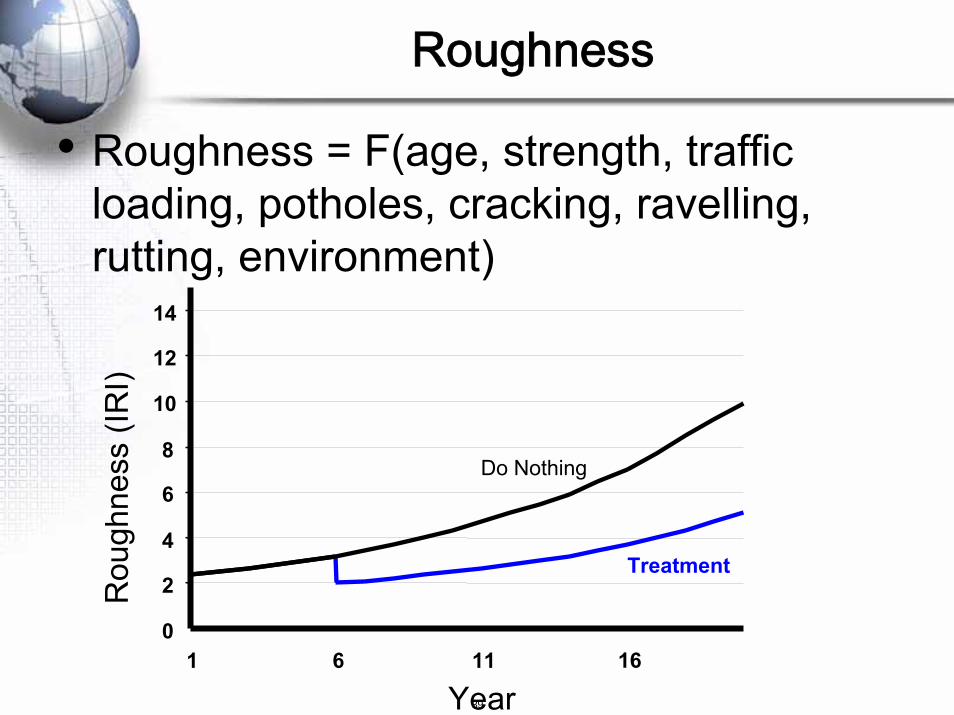
• Roughness = F(age, strength, traffic loading, potholes, cracking, ravelling, rutting, environment)
0
2
4
6
8
10
12
14
1 6 11
Year16
Rou
ghne
ss (I
RI)
Treatment
Do Nothing
Roughness
40
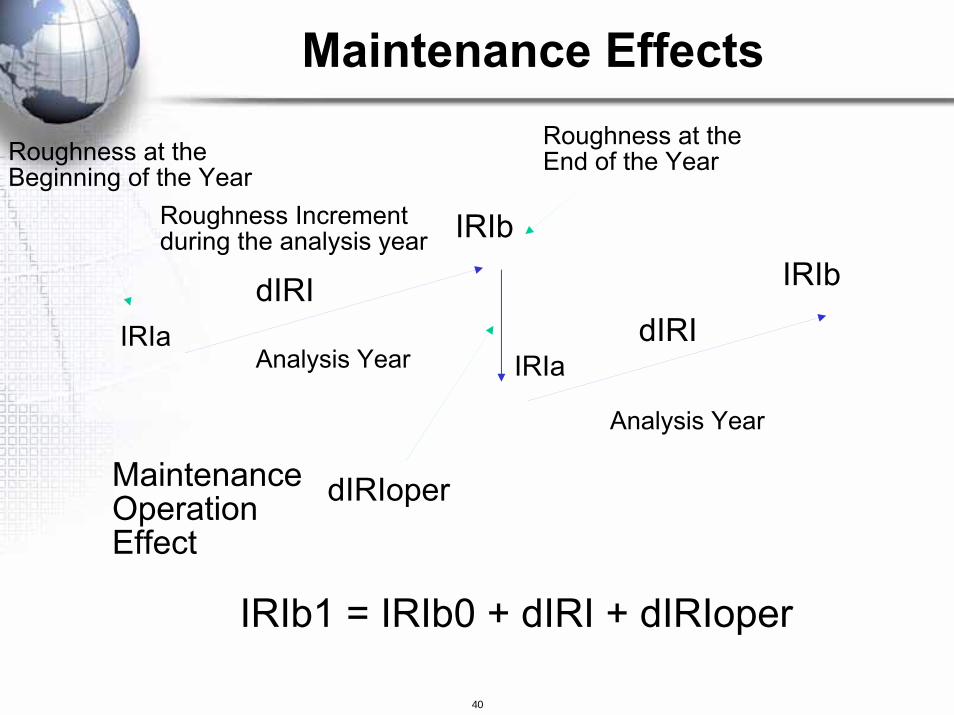
Roughness at theBeginning of the Year
Roughness at theEnd of the Year
IRIaIRIa
dIRI
Analysis Year
IRIbIRIb
IRIb1 = IRIb0 + dIRI + dIRIoper
Roughness Incrementduring the analysis year
dIRI
Analysis Year
MaintenanceOperationEffect
dIRIoper
Maintenance Effects
41
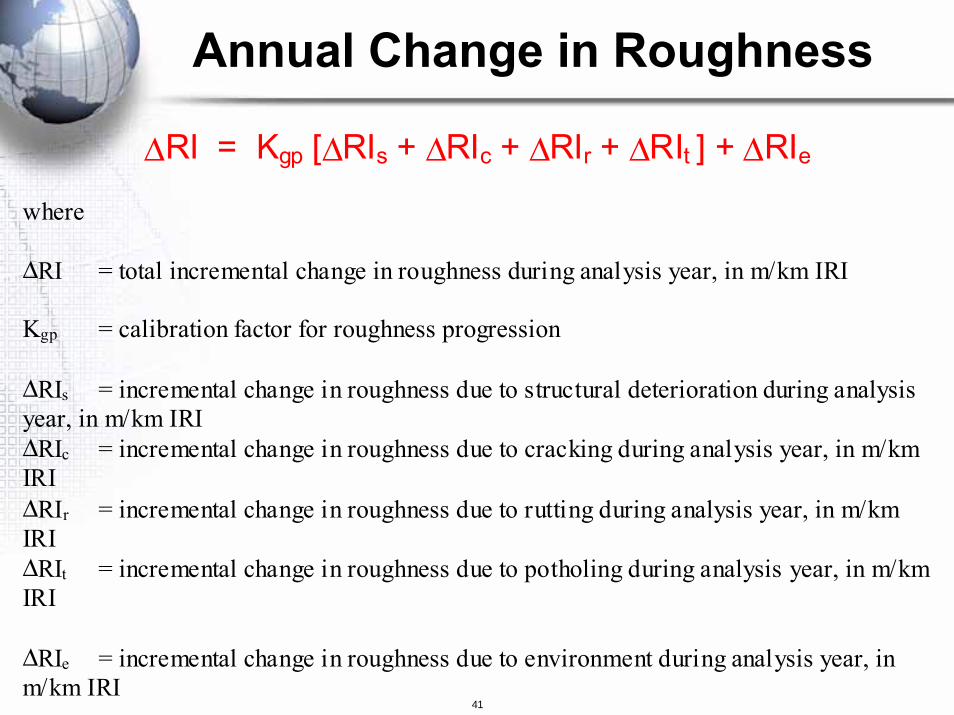
ΔRI = Kgp [ΔRIs + ΔRIc + ΔRIr + ΔRIt ] + ΔRIewhere
ΔRI = total incremental change in roughness during analysis year, in m/km IRI
Kgp = calibration factor for roughness progression
ΔRIs = incremental change in roughness due to structural deterioration during analysisyear, in m/km IRIΔRIc = incremental change in roughness due to cracking during analysis year, in m/kmIRIΔRIr = incremental change in roughness due to rutting during analysis year, in m/kmIRIΔRIt = incremental change in roughness due to potholing during analysis year, in m/kmIRI
ΔRIe = incremental change in roughness due to environment during analysis year, inm/km IRI
Annual Change in Roughness

42
dRI = 134 * Exp (m * Kgm * AGE3) * [1 + SNPKb]^-5 * YE4
m = environmental coefficient (#)Kgm = calibration factor (#)AGE3 = pavement age (years)SNPKb = adjusted structural number function
of surface distress (#)YE4 = annual number of equivalent standard
axles (million ESA/lane/year)
Roughness Increment Due toStructural Deterioration
43
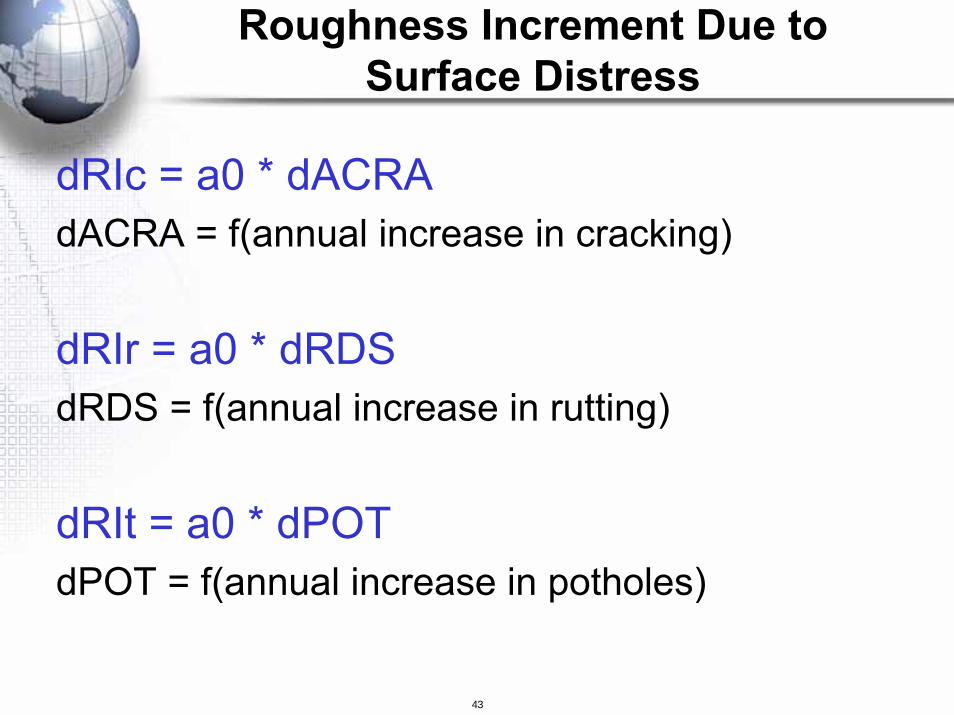
dRIc = a0 * dACRAdACRA = f(annual increase in cracking)
dRIr = a0 * dRDSdRDS = f(annual increase in rutting)
dRIt = a0 * dPOTdPOT = f(annual increase in potholes)
Roughness Increment Due toSurface Distress

44
dRIe = Kgm * m * RIaKgm = calibration factor (#)m = environmental coefficient (#)RIa = Roughness at start of the year (IRI,
m/km)
Roughness Increment Due toEnvironment
Temperature Classification
Moisture
Classification
Tropical Sub-
tropical hot
Sub-tropical
cool
Temperatecool
Temperatefreeze
Arid 0.005 0.010 0.015 0.025 0.040 Semi-arid 0.010 0.015 0.025 0.035 0.060
Sub-humid 0.020 0.025 0.040 0.060 0.100 Humid 0.025 0.030 0.060 0.100 0.200
Per-humid 0.030 0.040 0.070
45
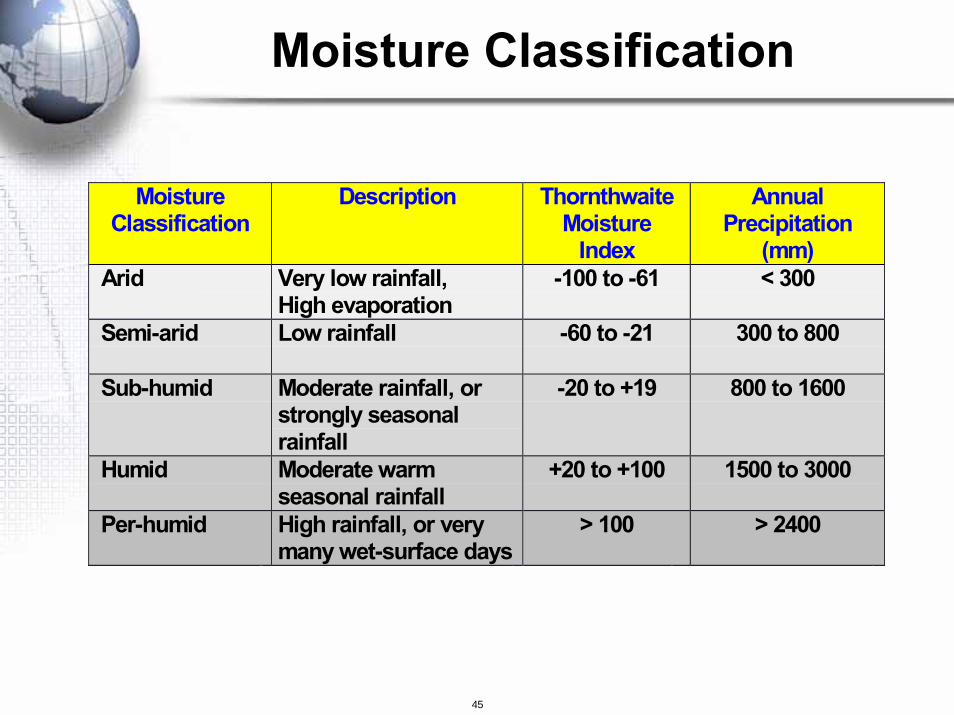
MoistureClassification
Description ThornthwaiteMoisture
Index
AnnualPrecipitation
(mm) Arid Very low rainfall,
High evaporation-100 to -61 < 300
Semi-arid Low rainfall -60 to -21 300 to 800
Sub-humid Moderate rainfall, orstrongly seasonalrainfall
-20 to +19 800 to 1600
Humid Moderate warmseasonal rainfall
+20 to +100 1500 to 3000
Per-humid High rainfall, or verymany wet-surface days
> 100 > 2400
Moisture Classification
46
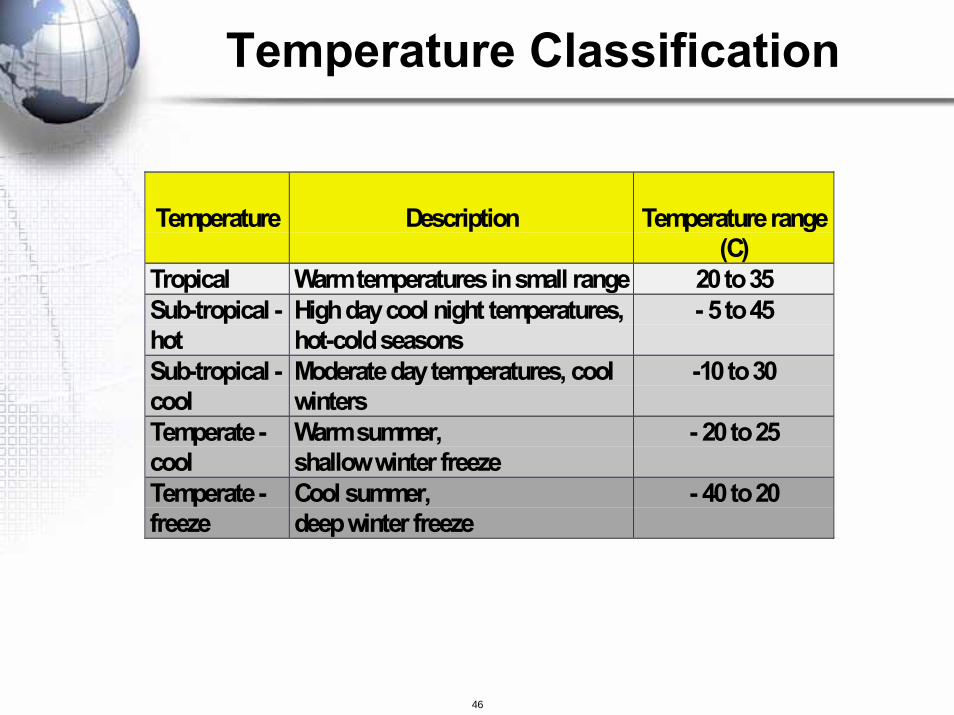
Temperature Description Temperature range(C)
Tropical Warm temperatures in small range 20 to 35Sub-tropical -hot
High day cool night temperatures,hot-cold seasons
- 5 to 45
Sub-tropical -cool
Moderate day temperatures, coolwinters
-10 to 30
Temperate -cool
Warm summer,shallow winter freeze
- 20 to 25
Temperate -freeze
Cool summer,deep winter freeze
- 40 to 20
Temperature Classification

47
• Structural Cracking: This is effectively load and age/environment associated cracking.
• Transverse Thermal Cracking: This is generally caused by large diurnal temperature changes or in freeze/thaw conditions, and therefore usually occurs in certain climates.
For each type of cracking, separate relationships are given for predicting the time to initiation and the rate of progression.
Cracks Modeling
48
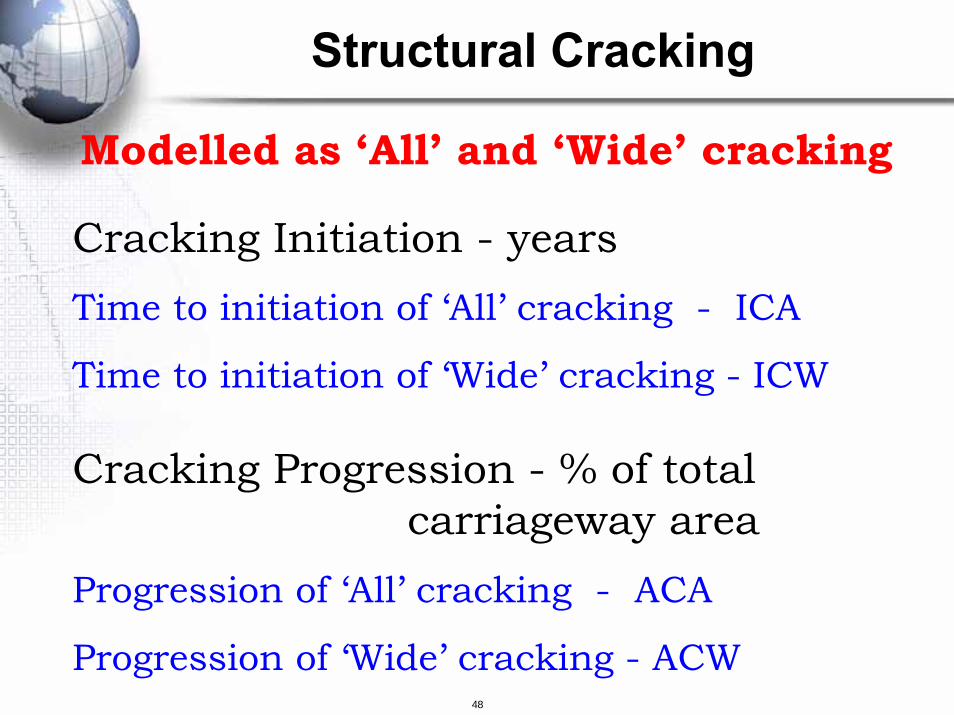
Modelled as ‘All’ and ‘Wide’ cracking
Cracking Initiation - yearsTime to initiation of ‘All’ cracking - ICA
Time to initiation of ‘Wide’ cracking - ICW
Cracking Progression - % of total carriageway area
Progression of ‘All’ cracking - ACA
Progression of ‘Wide’ cracking - ACW
Structural Cracking

49
0
20
40
60
80
100
120
0 5 10 15 20 25
Year
Are
a (%
)
InitiationProgression
Cracking Initiation and Progression

50
Cracking Initiation Model (1)
ICA=Kcia{CDS2*a0exp[a1SNP+a2(YE4/SN2)+CRT}
ICA time to cracking initiation, in yearsCDS construction quality
SNP structural number of pavement
YE4 traffic loading
Kcia calibration factor
CRT effect of maintenance

51
0
2
4
6
8
10
12
14
0.0 0.2 0.4 0.6 0.8 1.0
Axle Loading (MESAL/year)
All
Cra
ck In
itiat
ion
Perio
d (y
ears
)
SNP = 5
SNP = 2
CDS = 1.25
CDS = 1.00
CDS = 0.75
Cracking Initiation Model (2)
52
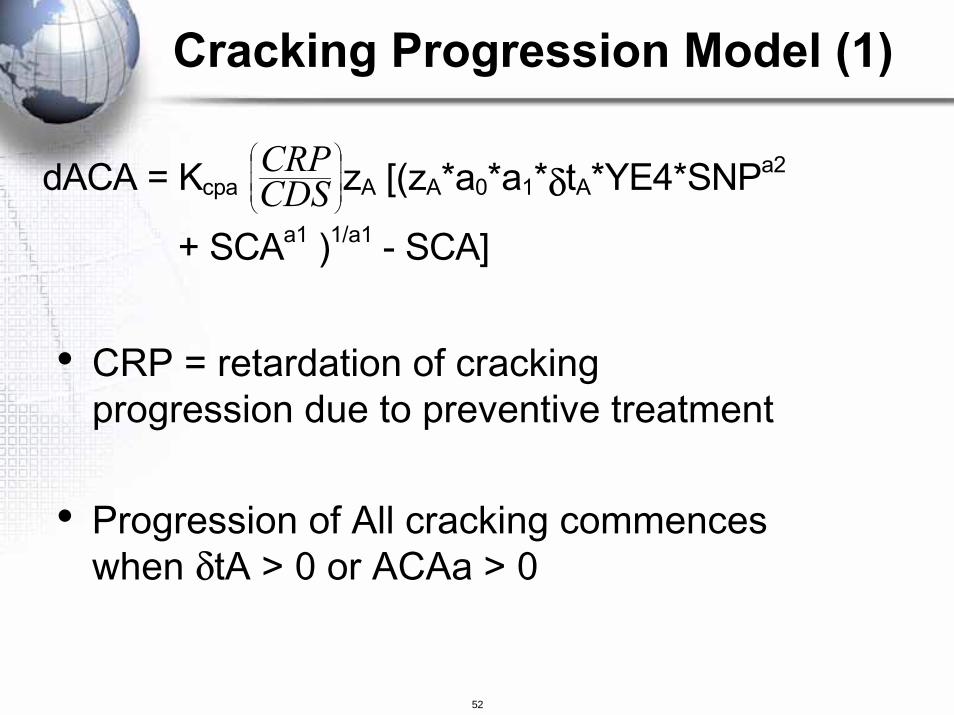
• CRP = retardation of cracking progression due to preventive treatment
• Progression of All cracking commences when δtA > 0 or ACAa > 0
dACA = Kcpa
Cracking Progression Model (1)
⎟⎟⎟
⎠
⎞
⎜⎜⎜
⎝
⎛
CDSCRP zA [(zA*a0*a1*δtA*YE4*SNPa2
+ SCAa1 )1/a1 - SCA]
53
0
20
40
60
80
100
0 2 4 6 8 10 12 14 16 18
Time Since Crack Initiation (years)
Are
a of
Stru
ctur
al C
rack
ing
(%)
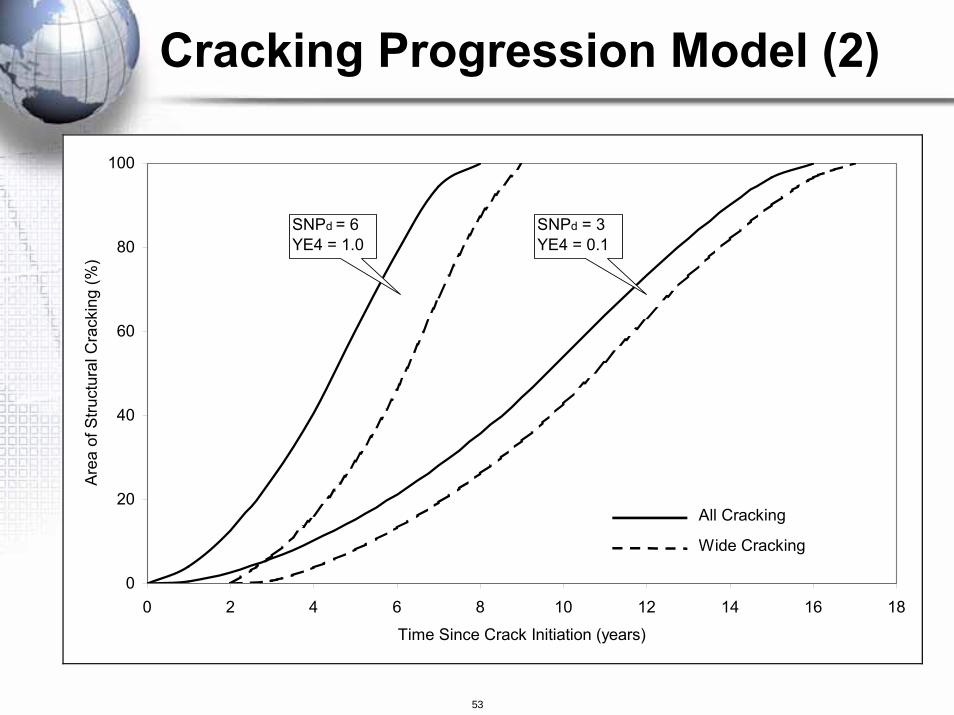
All Cracking
Wide Cracking
SNPd = 6YE4 = 1.0
SNPd = 3YE4 = 0.1
Cracking Progression Model (2)
54
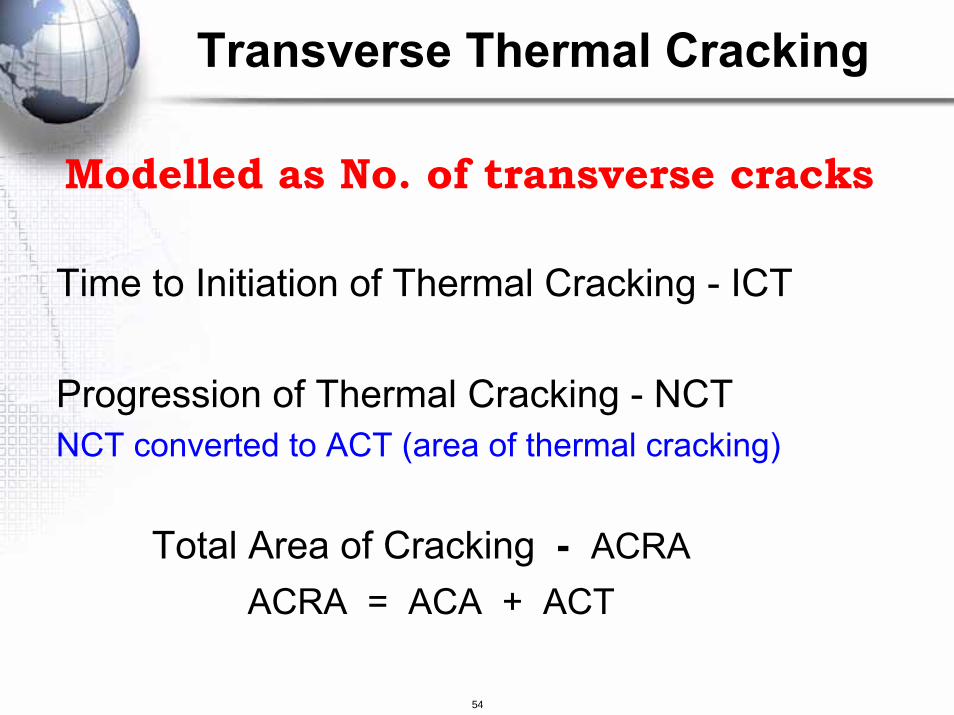
Time to Initiation of Thermal Cracking - ICT
Progression of Thermal Cracking - NCTNCT converted to ACT (area of thermal cracking)
Total Area of Cracking - ACRAACRA = ACA + ACT
Modelled as No. of transverse cracks
Transverse Thermal Cracking
55
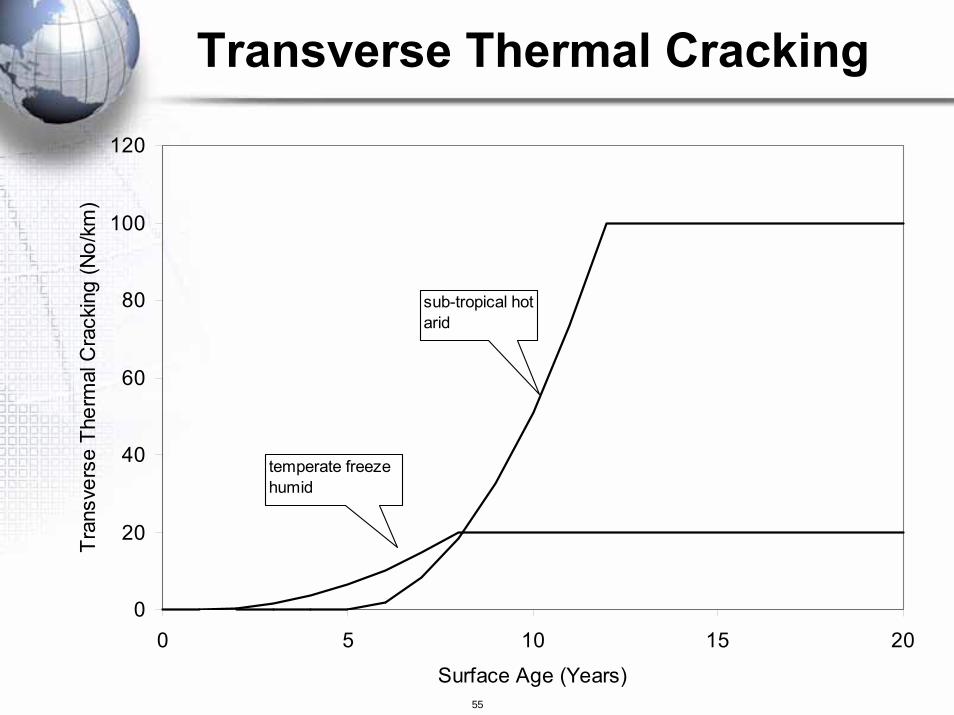
Transverse Thermal Cracking
0
20
40
60
80
100
120
0 5 10 15 20
Surface Age (Years)
Tran
sver
se T
herm
al C
rack
ing
(No/
km)
temperate freezehumid
sub-tropical hotarid
56
HDM-4 Rut Depth model based on four components
• Initial Densification - RDO
• Structural Deformation - RDST
• Plastic Deformation - RDPD
• Wear from Studded Tyres -RDW
Rut Depth Progression (1)

57
Age
Rut
Dep
th
Initial Densification (First Year)
Densification - No Cracking
Structural Deterioration - With Cracking
Rut Depth Progression (2)

58
• Rutting = F(age, traffic, strength, compaction)
Pavement Age (Years)
Rut
ting
(mm
) Weak PavementWeak Pavement
Strong PavementStrong Pavement
Rut Depth Progression (3)
59
Time to Initiation of Ravelling
(years)
IRV
Progression of Ravelling
(area of carriageway)
ARV
Ravelling
60
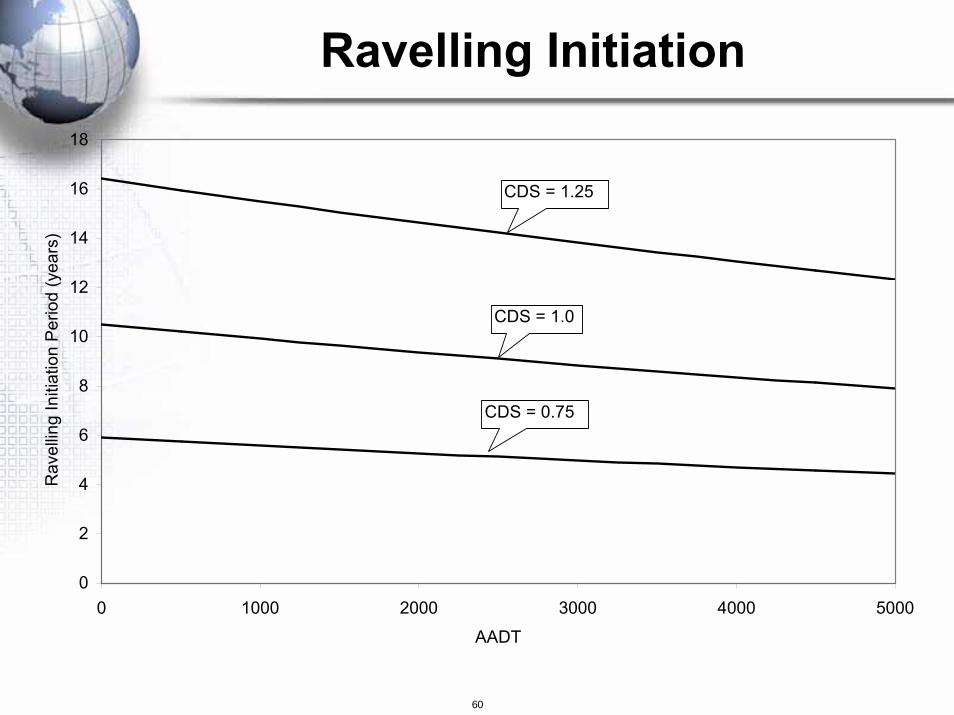
Ravelling Initiation
0
2
4
6
8
10
12
14
16
18
0 1000 2000 3000 4000 5000
AADT
Rav
ellin
g In
itiat
ion
Per
iod
(yea
rs)
CDS = 1.0
CDS = 0.75
CDS = 1.25

61
Ravelling Progression
0
10
20
30
40
50
60
70
80
90
100
0 2 4 6 8 10 12 14 16
Time Since Ravelling Initiation (years)
Are
a of
Rav
ellin
g (%
)
CDS = 1.25CDS = 0.75 CDS = 1.0
62
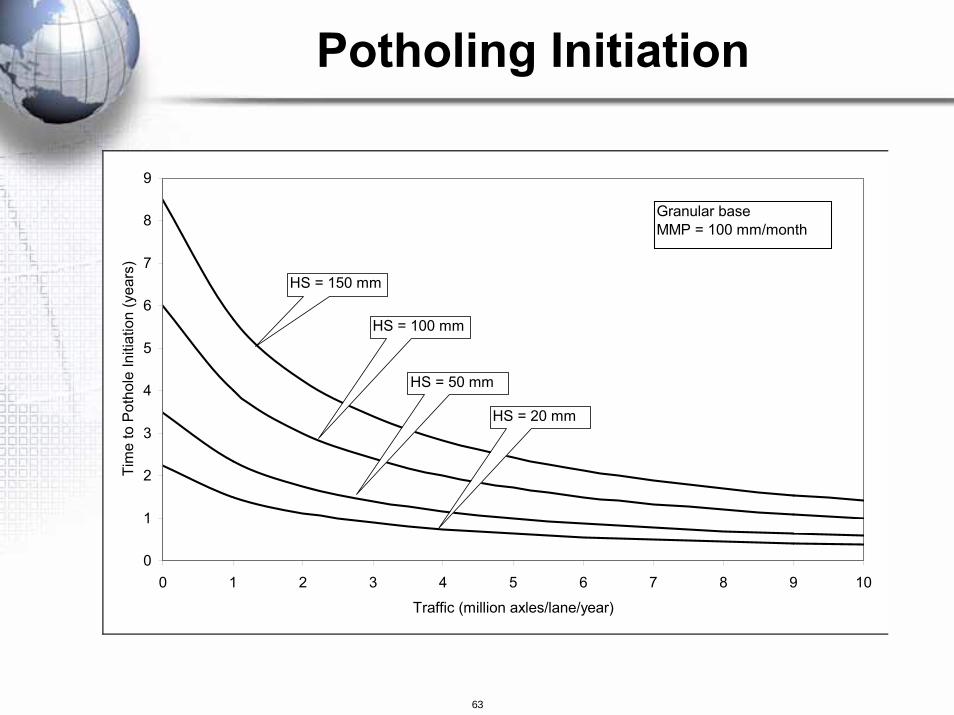
Time to Initiation of Potholes
(years)
IPT
Progression of Potholing
(number of potholes)
NPT
Potholing
63
0
1
2
3
4
5
6
7
8
9
0 1 2 3 4 5 6 7 8 9 10
Traffic (million axles/lane/year)
Tim
e to
Pot
hole
Initi
atio
n (y
ears
)
Granular baseMMP = 100 mm/month
HS = 20 mm
HS = 50 mm
HS = 100 mm
HS = 150 mm
Potholing Initiation
64
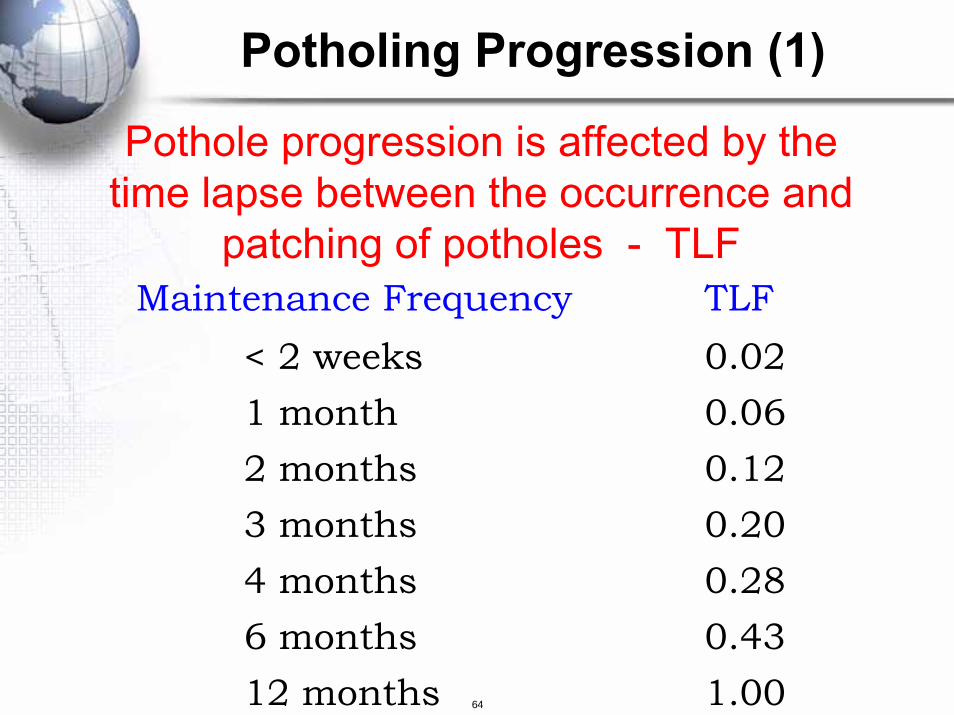
Pothole progression is affected by the time lapse between the occurrence and
patching of potholes - TLFMaintenance Frequency TLF
< 2 weeks 0.021 month 0.062 months 0.123 months 0.204 months 0.286 months 0.4312 months 1.00
Potholing Progression (1)

65
Potholes caused by:
• Cracking
• Ravelling
• Enlargement
Potholing Progression (2)

66
0
200
400
600
800
1000
0 1 2 3 4 5 6 7 8 9 10
Traffic (million axles/lane/year)
Pot
holin
g (n
o/km
/yea
r)
Granular baseACW = 40%MMP = 100 mm/monthTLF = 1
HS = 25 mm HS = 50 mm
HS = 100 mm
Potholing Progression (3)

67
Edge Break (1)
Loss of surface, and possibly base materials from the edge of the pavement
Commonly arises on narrow roads with unsealed shoulders
HDM-4 predicts the volume of material loss
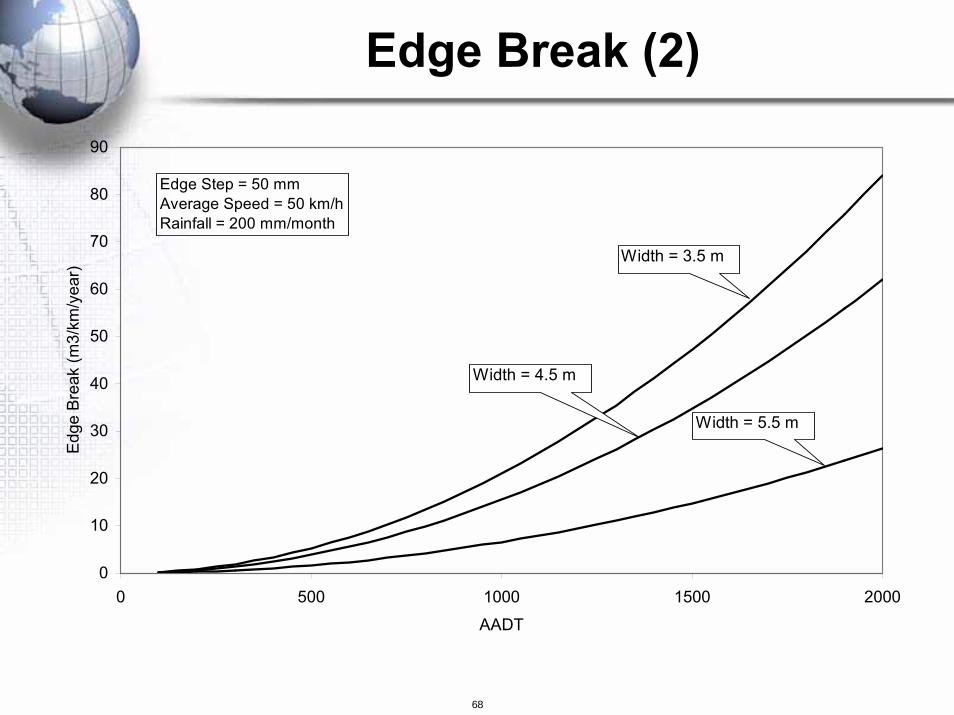
68
Edge Break (2)
0
10
20
30
40
50
60
70
80
90
0 500 1000 1500 2000
AADT
Edg
e B
reak
(m3/
km/y
ear)
Edge Step = 50 mmAverage Speed = 50 km/hRainfall = 200 mm/month
Width = 3.5 m
Width = 4.5 m
Width = 5.5 m

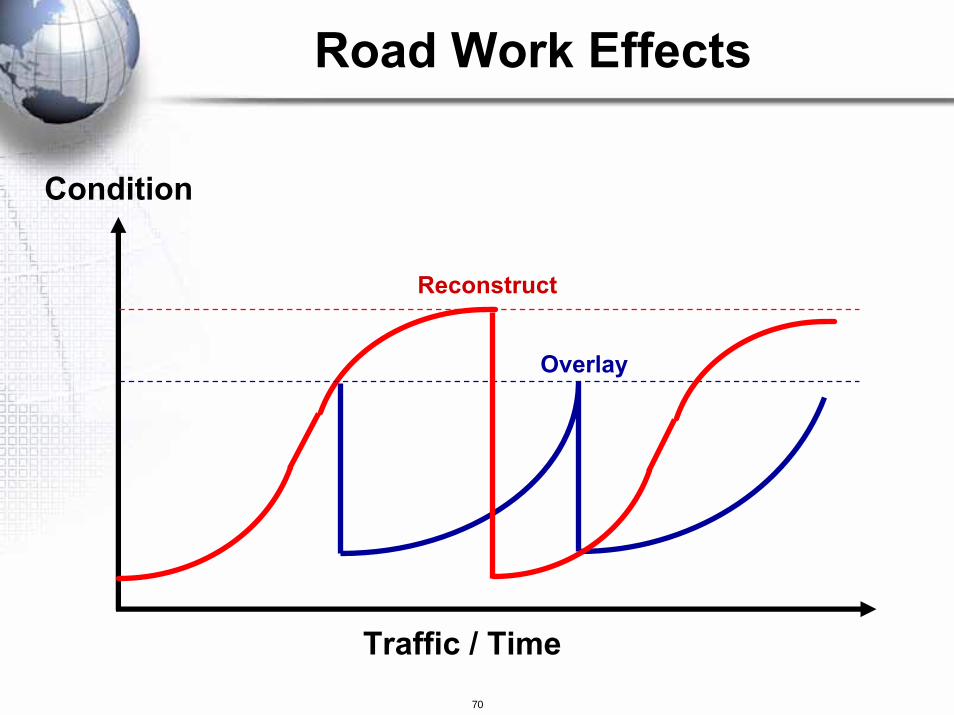
Bituminous Road Work Effects
70
Road Work Effects
Condition
Reconstruct
Overlay
Traffic / Time
71
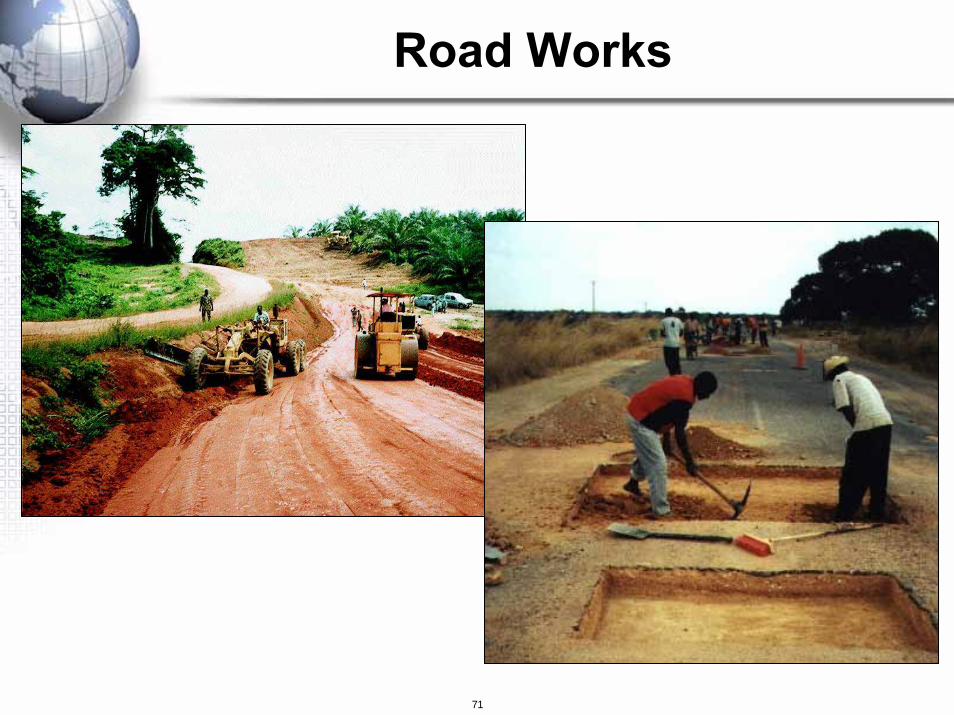
Road Works

72
• Timing of works over the analysis period
• Calculation of the physical quantities or amounts of works to be undertaken
• Estimating the costs of works
• Resetting / changing one or more of the characteristics that define the road
Road Works Modelling

73
• Can group pavement deterioration into:
SurfaceStructural
• Surface deterioration can be halted at almost any point by maintenance
• Structural deterioration rates can be reduced by maintenance, but never halted
Road Work Effects
74
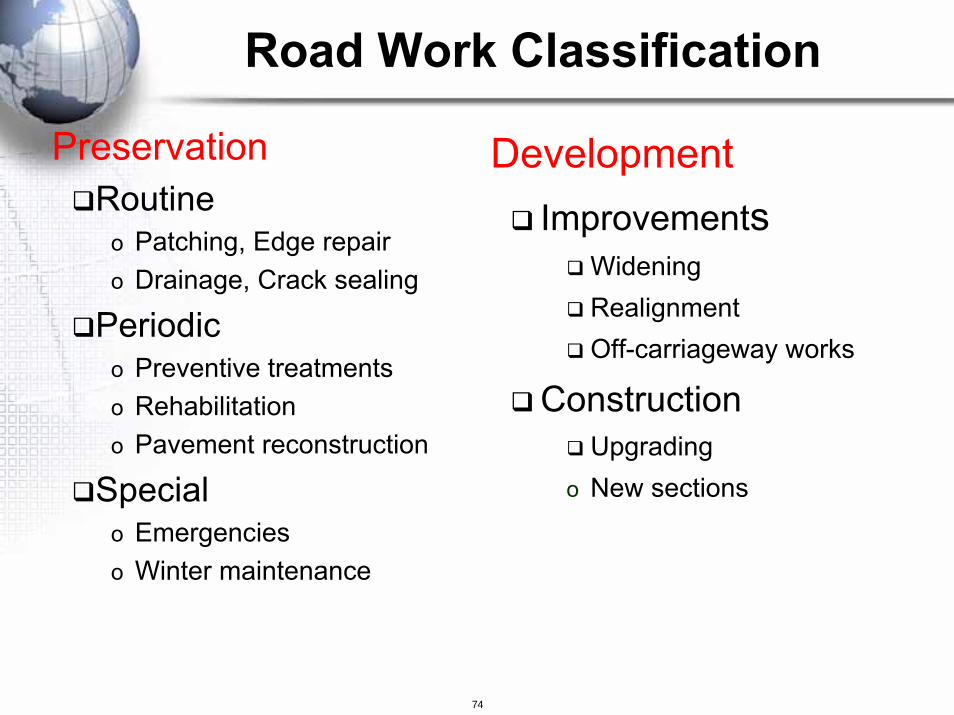
Road Work Classification
PreservationRoutine
o Patching, Edge repairo Drainage, Crack sealing
Periodico Preventive treatmentso Rehabilitationo Pavement reconstruction
Specialo Emergencieso Winter maintenance
DevelopmentImprovements
WideningRealignmentOff-carriageway works
ConstructionUpgrading
o New sections

75
Works Class Works Type Works Activity / OperationRoutineMaintenance
RoutinePavement
patching, edge-repair, crack sealing,spot-regravelling, shoulders repair,etc.
Drainage culvert repairs, clearing side drainsRoutineMiscellaneous
vegetation control, markings, signs
PeriodicMaintenance
PreventiveTreatment
fog seal, rejuvenation
Resurfacing surface dressing, slurry seal, capeseal, regravelling
Rehabilitation overlay, mill and replace, inlayReconstruction partial reconstruction, full pavement
reconstructionSpecial Emergency clearing debris, repairing
washout/subsidence, traffic accidentremoval, etc.
Winter snow removal, salting, gritting, etc
Road Works Activities (1)

76
Works Class Works Type Works Activity /OperationWidening partial widening, lane addition,
Improvement
Realignment horizontal and vertical geometricimprovements, junctionimprovement
Off-carriageway
shoulders addition, shouldersupgrading, NMT lane addition,side drain improvement, etc.
ConstructionUpgrading upgrading by changing the
surface classNew section dualisation of an existing section,
new section (link)
Road Works Activities (2)

77
• ScheduledFixed intervals of time between interventionsInterventions at fixed points of time
• ResponsivePavement conditionPavement strengthSurface ageTraffic volumes/loadingsAccident rates
Maintenance Interventions

78
• Depending on distress maintenance has different effects
Pothole Crack Surface Repair Sealing Treatment
Time or Traffic
Cracking IRIRutting
DistressQuantity
Maintenance Effects
79
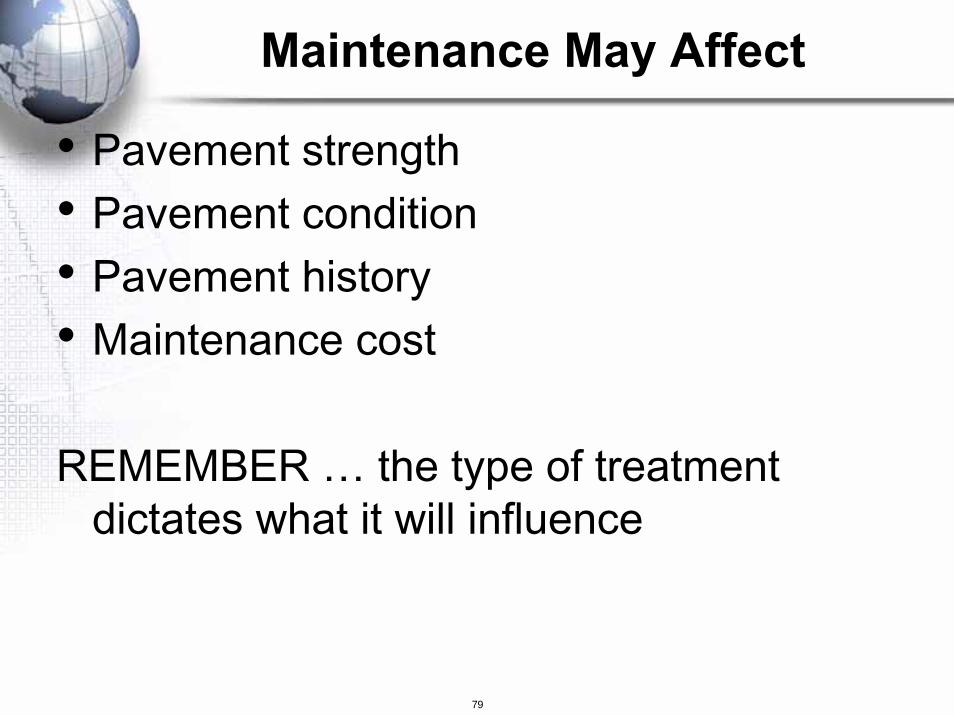
Maintenance May Affect
• Pavement strength• Pavement condition• Pavement history• Maintenance cost
REMEMBER … the type of treatment dictates what it will influence

80
Cb1
Cb4Cb2 = Ca3
Years0 4321
Percenttotalcosts
100
Ca2
Cao
Roadvariable
0 4321 Years
Cbo = Ca1
Scheduled intervention
Responsiveintervention
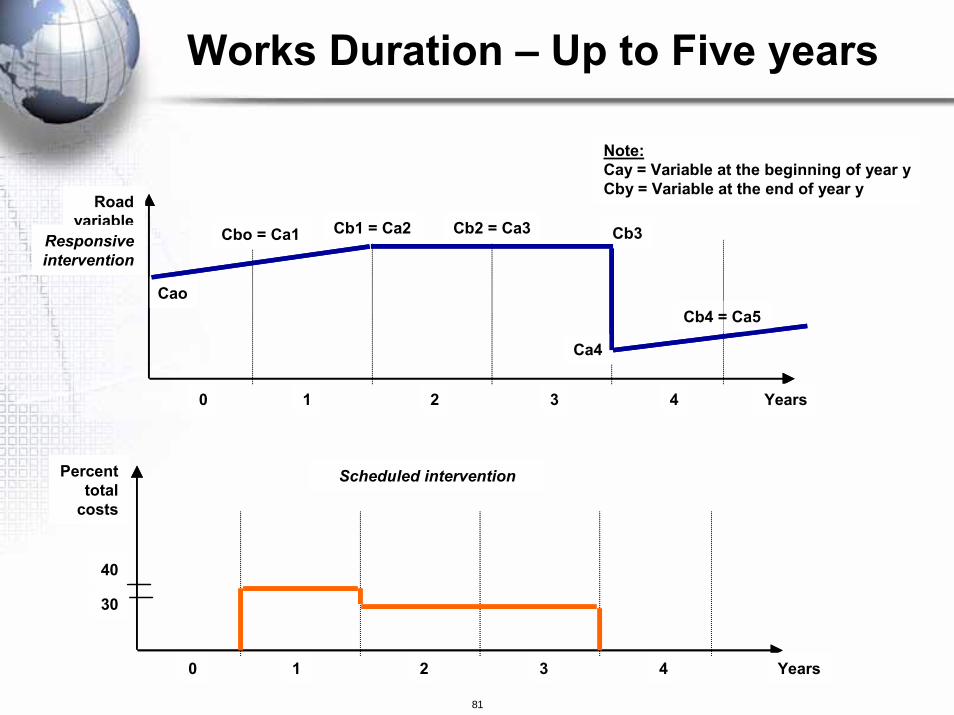
Note:Cay = Variable at the beginning of year yCby = Variable at the end of year y
Cb1
Cb4Cb2 = Ca3
Years0 4321 Years0 4321
Percenttotalcosts
100
Ca2
Cao
Roadvariable
0 4321 Years0 4321 Years
Cbo = Ca1
Scheduled intervention
Responsiveintervention
Note:Cay = Variable at the beginning of year yCby = Variable at the end of year y
Works Duration – One Year
81
Cb4 = Ca5
Cb3
Ca4
Cb1 = Ca2Cbo = Ca1
Cao
Years0 4321
Cb2 = Ca3Road
variable
Percenttotal
costs
0 4321 Years
40
30
Scheduled intervention
Responsiveintervention
Note:Cay = Variable at the beginning of year yCby = Variable at the end of year y
Cb4 = Ca5
Cb3
Ca4
Cb1 = Ca2Cbo = Ca1
Cao
Years0 4321 Years0 4321
Cb2 = Ca3Road
variable
Percenttotal
costs
0 4321 Years0 4321 Years
40
30
Scheduled intervention
Responsiveintervention
Note:Cay = Variable at the beginning of year yCby = Variable at the end of year y
Works Duration – Up to Five years

82
Works Type Works Activity / Operation Hierarchy Unit CostNew section Dualisation of an existing section 1 per km Upgrading Upgrading to a new surface class 2 per km Realignment Geometric realignment 3 per km Widening Lane addition 4 per m2 or per km
Partial widening 5 per m2 or per km Reconstruction Pavement reconstruction 6 per m2 or per kmRehabilitation Mill and replace 7 per m2
Overlay rubberised asphalt 8 per m2Overlay dense-graded asphalt 9 per m2Overlay open-graded asphalt 10 per m2Inlay 11 per m2Thin overlay 12 per m2
Resurfacing Cape seal with shape correction 13 per m2(Resealing) Cape seal 14 per m2
Double surface dressing with shape correction 15 per m2Double surface dressing 16 per m2Single surface dressing with shape correction 17 per m2Single surface dressing 18 per m2Slurry seal 19 per m2
Preventive Fog sealing 20 per m2Treatment Rejuvenation 21 per m2Routine Edge repair* 22 per m2Pavement Patching* 22 per m2
Crack sealing* 22 per m2
Hierarchy of Roads Works
83
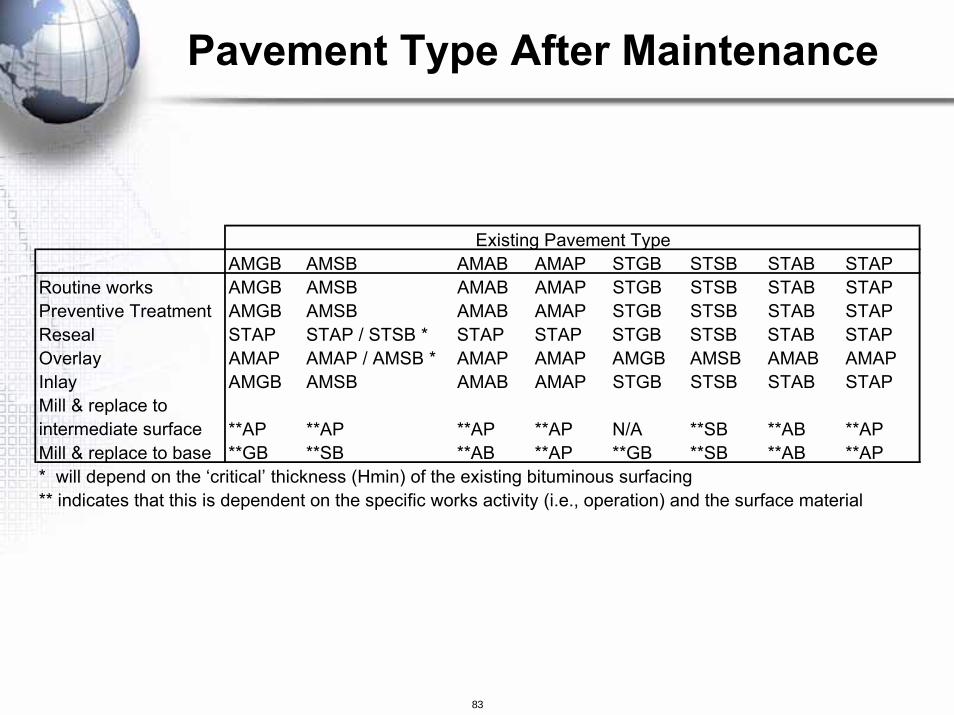
Existing Pavement TypeAMGB AMSB AMAB AMAP STGB STSB STAB STAP
Routine works AMGB AMSB AMAB AMAP STGB STSB STAB STAPPreventive Treatment AMGB AMSB AMAB AMAP STGB STSB STAB STAPReseal STAP STAP / STSB * STAP STAP STGB STSB STAB STAPOverlay AMAP AMAP / AMSB * AMAP AMAP AMGB AMSB AMAB AMAPInlay AMGB AMSB AMAB AMAP STGB STSB STAB STAPMill & replace to intermediate surface **AP **AP **AP **AP N/A **SB **AB **APMill & replace to base **GB **SB **AB **AP **GB **SB **AB **AP* will depend on the ‘critical’ thickness (Hmin) of the existing bituminous surfacing** indicates that this is dependent on the specific works activity (i.e., operation) and the surface material
Pavement Type After Maintenance

84
HDM Series – Volume 4