05 cng buses
DESCRIPTION
cng bus overviewTRANSCRIPT
MSTRS MOVES Review Work group September 25, 2012
Andrew Eilbert, Ari Kahan
Air Quality & Modeling Center Assessment and Standards Division
U.S. EPA Office of Transportation & Air Quality
Proposed Exhaust Emission Rates for
Compressed Natural Gas Transit Buses in MOVES2013
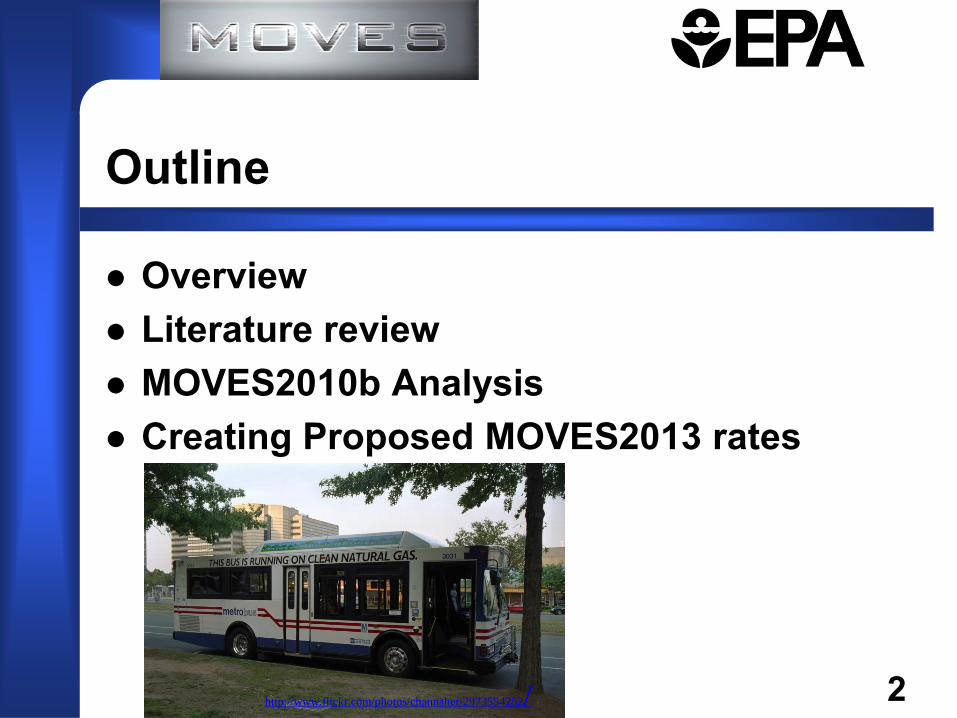
Overview Literature review MOVES2010b Analysis Creating Proposed MOVES2013 rates
Outline
2 http://www.flickr.com/photos/channaher/2973554252/
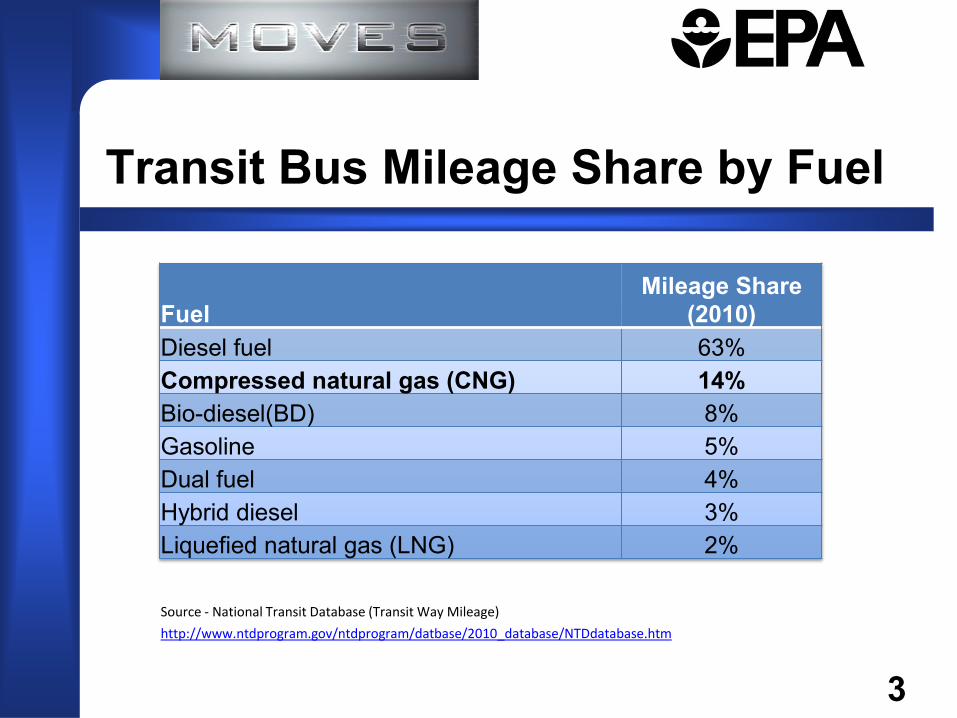
Source - National Transit Database (Transit Way Mileage)
http://www.ntdprogram.gov/ntdprogram/datbase/2010_database/NTDdatabase.htm
Transit Bus Mileage Share by Fuel
3
Fuel Mileage Share
(2010) Diesel fuel 63% Compressed natural gas (CNG) 14% Bio-diesel(BD) 8% Gasoline 5% Dual fuel 4% Hybrid diesel 3% Liquefied natural gas (LNG) 2%
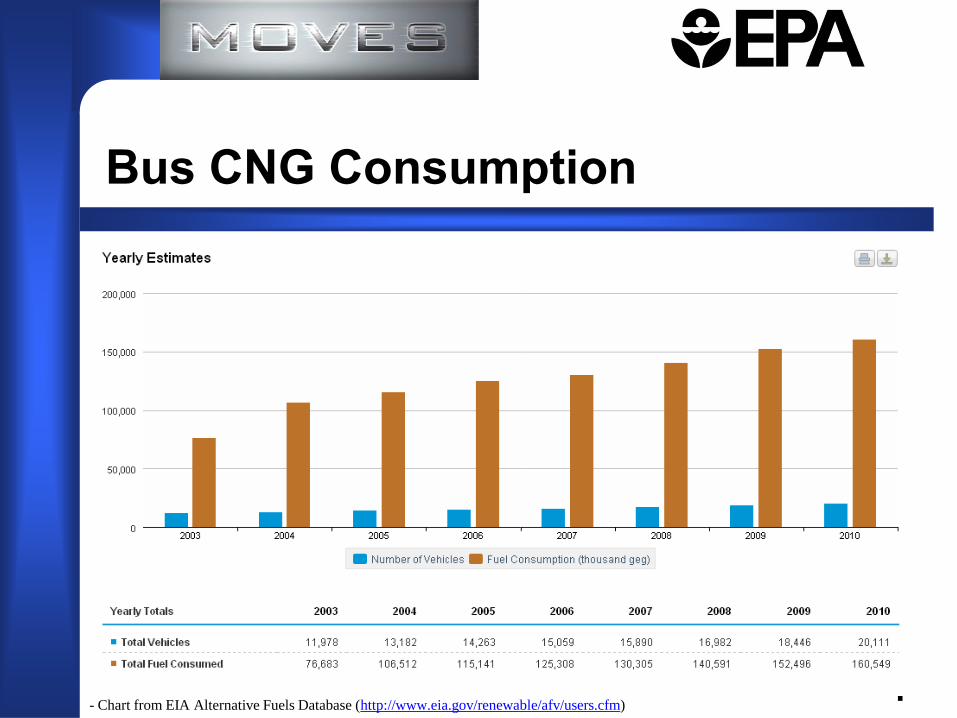
Bus CNG Consumption
4 - Chart from EIA Alternative Fuels Database (http://www.eia.gov/renewable/afv/users.cfm)
Between 2003 and 2010, the number of CNG fueled buses and quantity of CNG consumed has approximately doubled
Buses consume about 75% of the CNG used in transportation
Considered by municipalities for a variety of reasons
– Price of fuel – Potential for central refueling infrastructures
Background
5

Motor gasoline, diesel, and CNG are the only fuels in the default vehicle population in MOVES2010b
– Other fuels (ex. electricity) are available to the user through the alternate vehicle and fuels importer (AVFT)
MOVES2010b CNG bus HC/CO/NOx/PM rates are the
MOVES2010b gasoline medium heavy duty (MHD) rates – Result of timing, priorities, and data limitations in MOVES2010 – Increasing prevalence of CNG buses increases relevance for
MOVES2013 MHD gasoline rates documented in “Development of Emission Rates
for Heavy-Duty Vehicles in the Motor Vehicle Emissions Simulator MOVES2010 (EPA-420-B-12-049)”
MHD is regulatory class 46, 19k - 33k pounds GVWR
CNG Buses in MOVES2010b
6
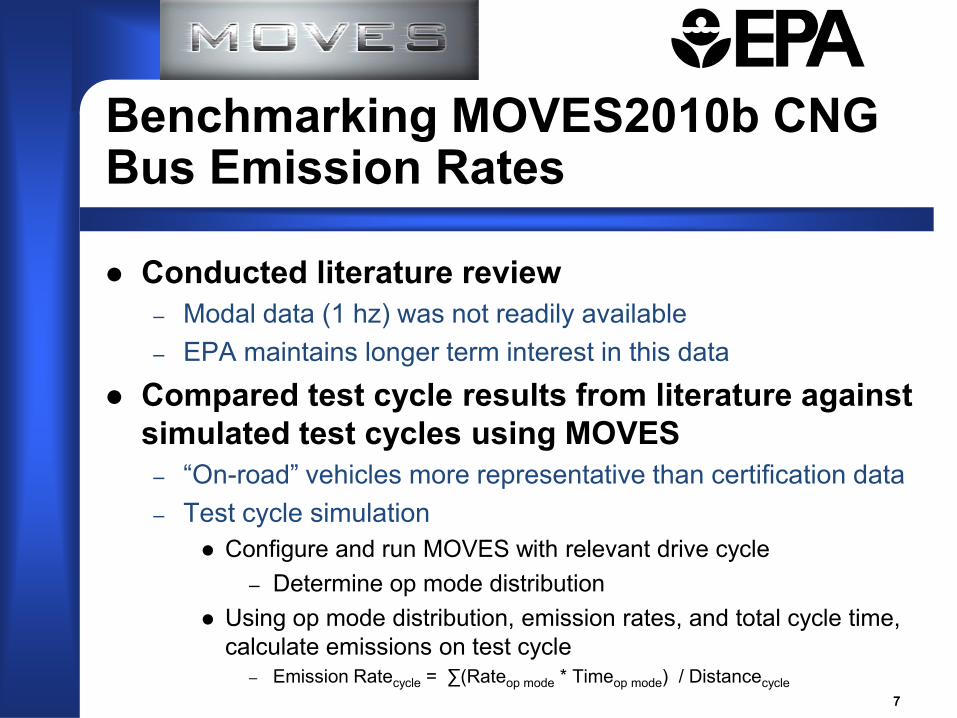
Conducted literature review – Modal data (1 hz) was not readily available – EPA maintains longer term interest in this data
Compared test cycle results from literature against simulated test cycles using MOVES
– “On-road” vehicles more representative than certification data – Test cycle simulation
Configure and run MOVES with relevant drive cycle – Determine op mode distribution
Using op mode distribution, emission rates, and total cycle time, calculate emissions on test cycle
– Emission Ratecycle = ∑(Rateop mode * Timeop mode) / Distancecycle
Benchmarking MOVES2010b CNG Bus Emission Rates
7
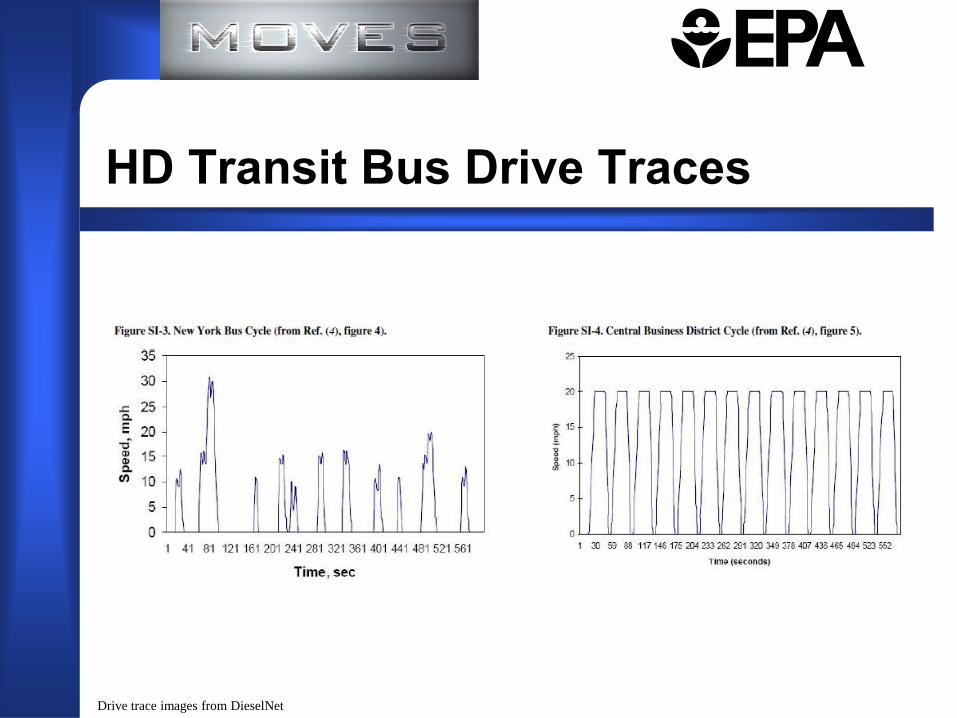
HD Transit Bus Drive Traces
Drive trace images from DieselNet

HD Transit Bus Drive Traces
Drive trace images from DieselNet
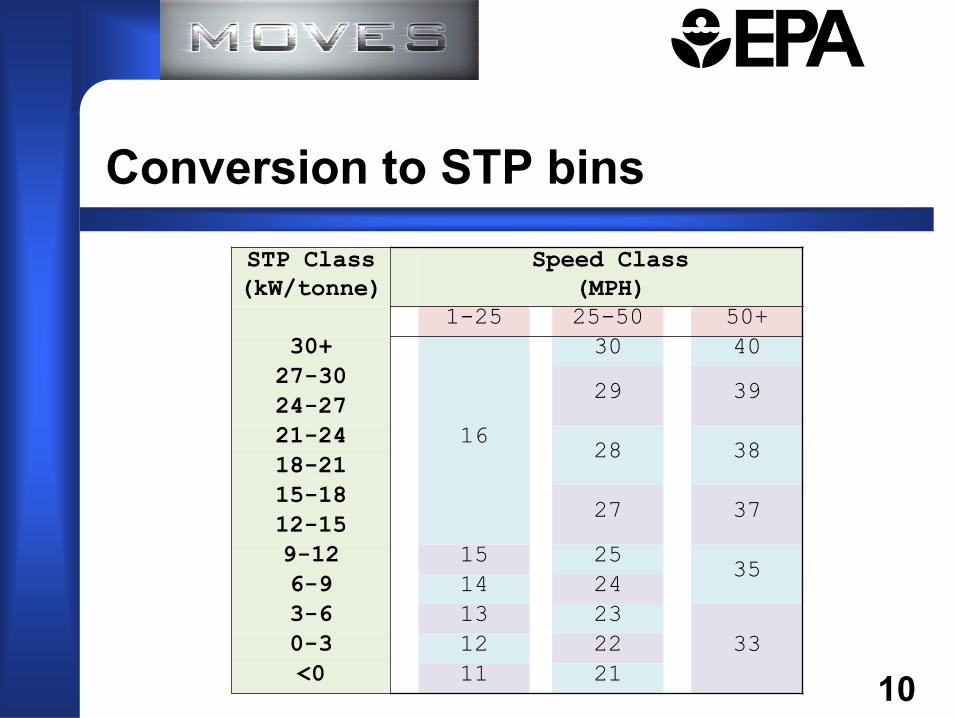
STP Class
(kW/tonne)
Speed Class
(MPH)
1-25 25-50 50+
30+
16
30 40
27-30 29 39
24-27
21-24 28 38
18-21
15-18 27 37
12-15
9-12 15 25 35
6-9 14 24
3-6 13 23
33 0-3 12 22
<0 11 21
Conversion to STP bins
10
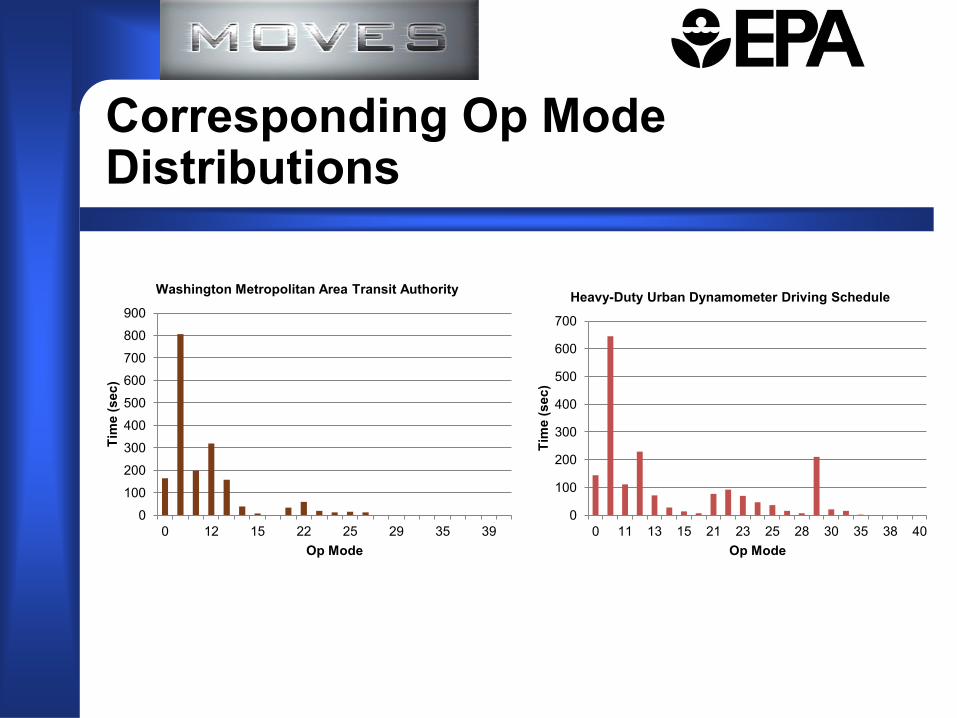
Corresponding Op Mode Distributions
0
100
200
300
400
500
600
700
0 11 13 15 21 23 25 28 30 35 38 40 Ti
me
(sec
) Op Mode
Heavy-Duty Urban Dynamometer Driving Schedule
0
100
200
300
400
500
600
700
800
900
0 12 15 22 25 29 35 39
Tim
e (s
ec)
Op Mode
Washington Metropolitan Area Transit Authority

Op Mode Distributions
0
50
100
150
200
250
300
350
400
450
0 12 15 22 25 29 35 39
Tim
e (s
ec)
Op Mode
New York Bus
0
50
100
150
200
250
300
350
0 12 15 22 25 29 35 39 Ti
me
(sec
) Op Mode
Central Business District
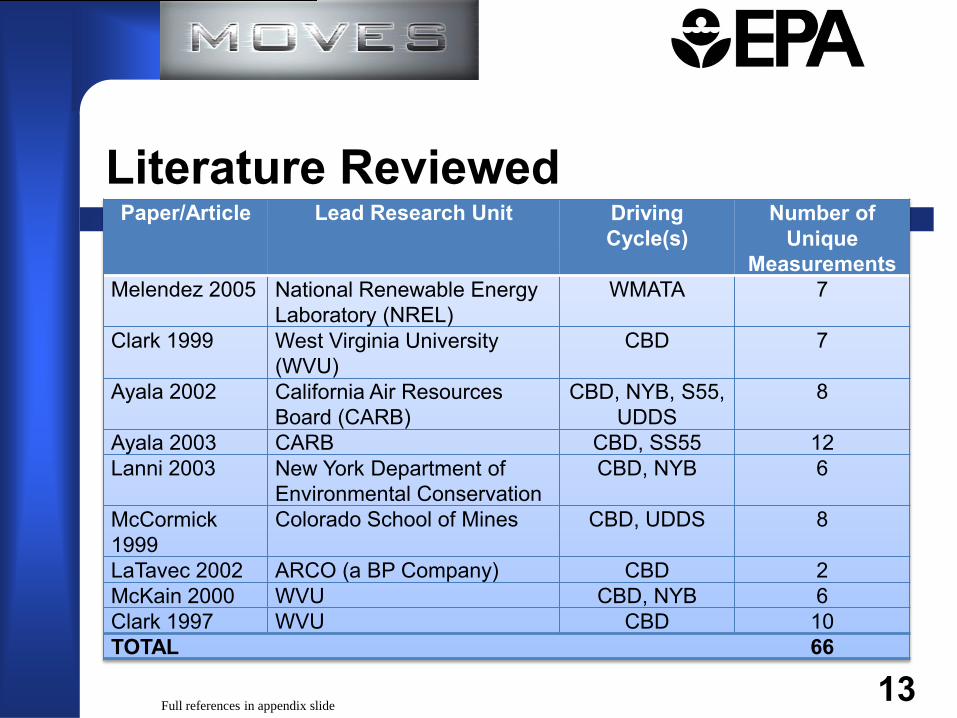
Paper/Article Lead Research Unit Driving Cycle(s)
Number of Unique
Measurements
Melendez 2005 National Renewable Energy Laboratory (NREL)
WMATA 7
Clark 1999 West Virginia University (WVU)
CBD 7
Ayala 2002 California Air Resources Board (CARB)
CBD, NYB, S55, UDDS
8
Ayala 2003 CARB CBD, SS55 12
Lanni 2003 New York Department of Environmental Conservation
CBD, NYB 6
McCormick 1999
Colorado School of Mines CBD, UDDS 8
LaTavec 2002 ARCO (a BP Company) CBD 2
McKain 2000 WVU CBD, NYB 6
Clark 1997 WVU CBD 10
TOTAL 66
Literature Reviewed
13
Full references in appendix slide
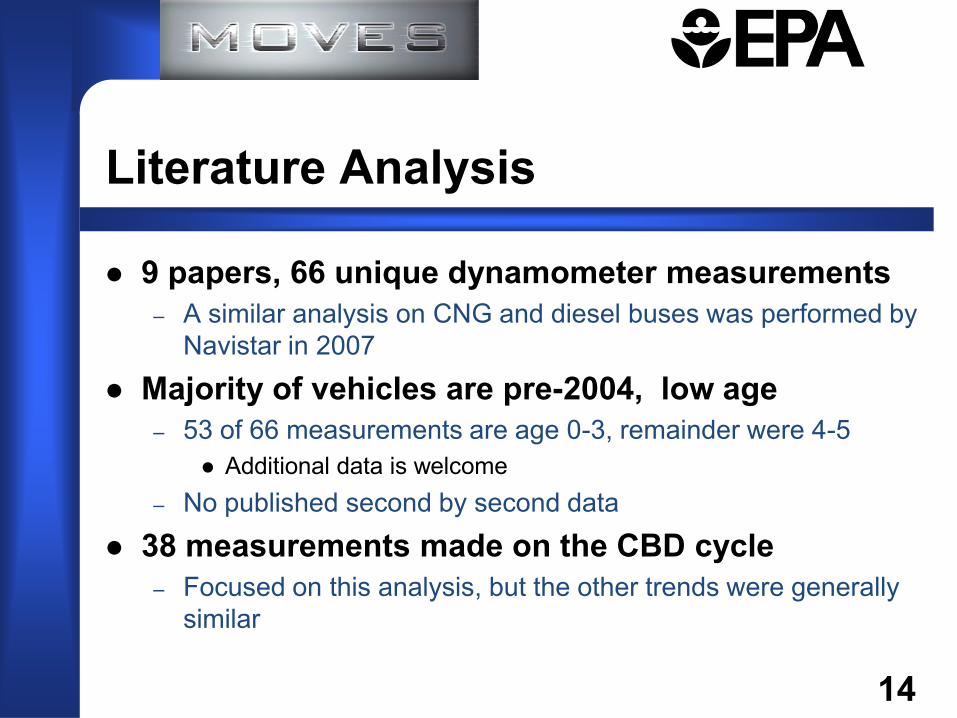
9 papers, 66 unique dynamometer measurements – A similar analysis on CNG and diesel buses was performed by
Navistar in 2007
Majority of vehicles are pre-2004, low age – 53 of 66 measurements are age 0-3, remainder were 4-5
Additional data is welcome – No published second by second data
38 measurements made on the CBD cycle – Focused on this analysis, but the other trends were generally
similar
Literature Analysis
14
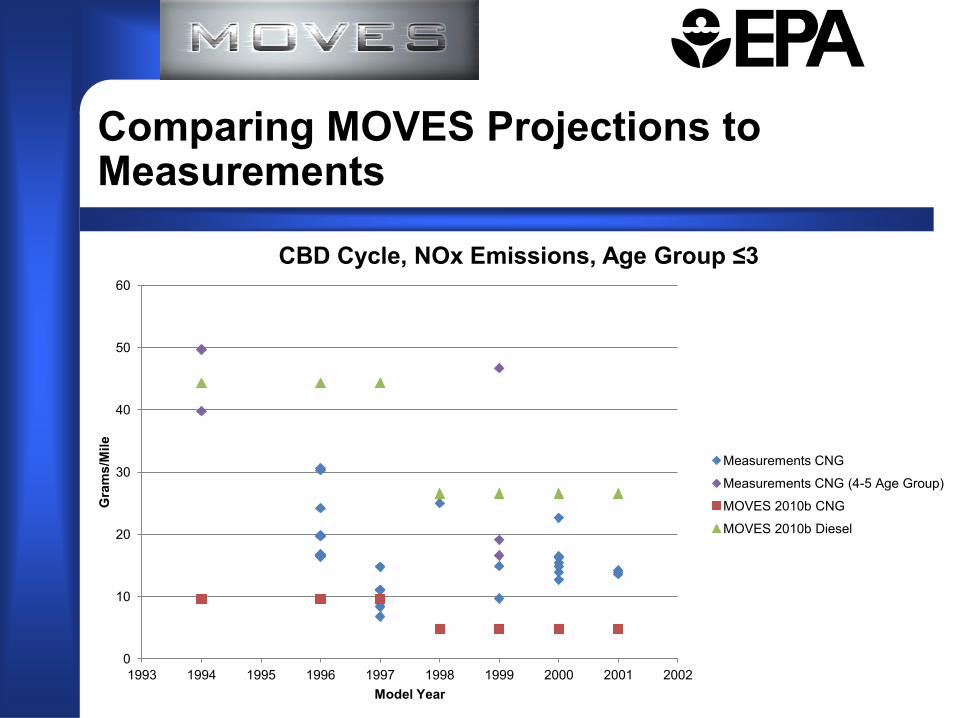
Comparing MOVES Projections to Measurements
0
10
20
30
40
50
60
1993 1994 1995 1996 1997 1998 1999 2000 2001 2002
Gra
ms/
Mile
Model Year
CBD Cycle, NOx Emissions, Age Group ≤3
Measurements CNG
Measurements CNG (4-5 Age Group)
MOVES 2010b CNG
MOVES 2010b Diesel
Comparing MOVES Projections to Measurements
0
10
20
30
40
50
60
70
1993 1994 1995 1996 1997 1998 1999 2000 2001 2002
Gra
ms/
Mile
Model Year
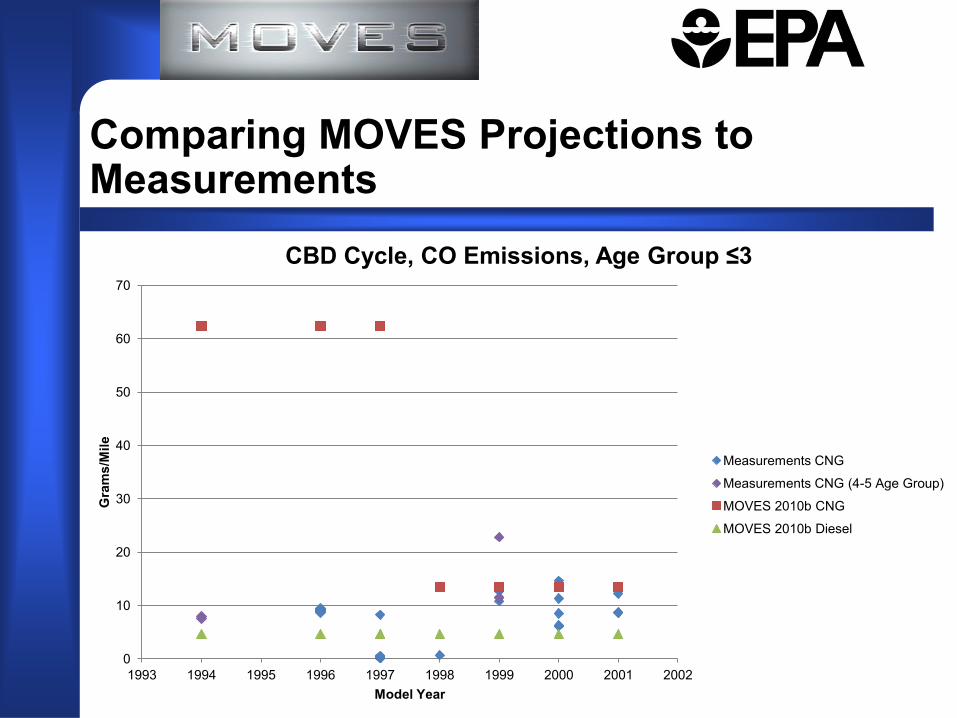
CBD Cycle, CO Emissions, Age Group ≤3
Measurements CNG
Measurements CNG (4-5 Age Group)
MOVES 2010b CNG
MOVES 2010b Diesel
Comparing MOVES Projections to Measurements
0
0.1
0.2
0.3
0.4
0.5
0.6
0.7
0.8
0.9
1
1993 1994 1995 1996 1997 1998 1999 2000 2001 2002
Gra
ms/
Mile
Model Year
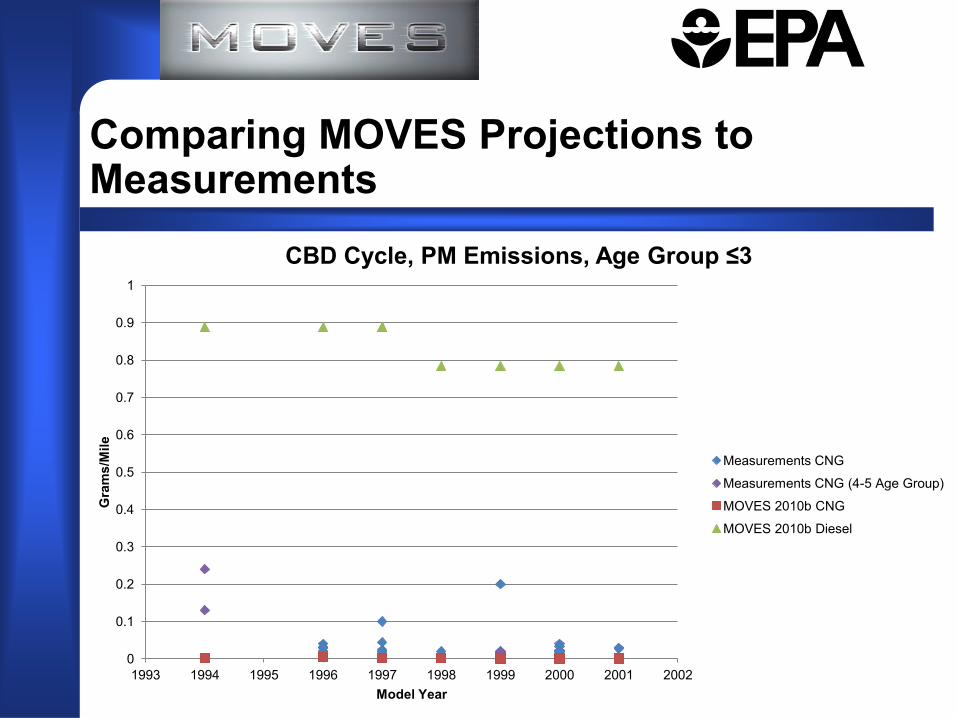
CBD Cycle, PM Emissions, Age Group ≤3
Measurements CNG
Measurements CNG (4-5 Age Group)
MOVES 2010b CNG
MOVES 2010b Diesel
Comparing MOVES Projections to Measurements
0
5
10
15
20
25
1993 1994 1995 1996 1997 1998 1999 2000 2001 2002
Gra
ms/
Mile
Model Year
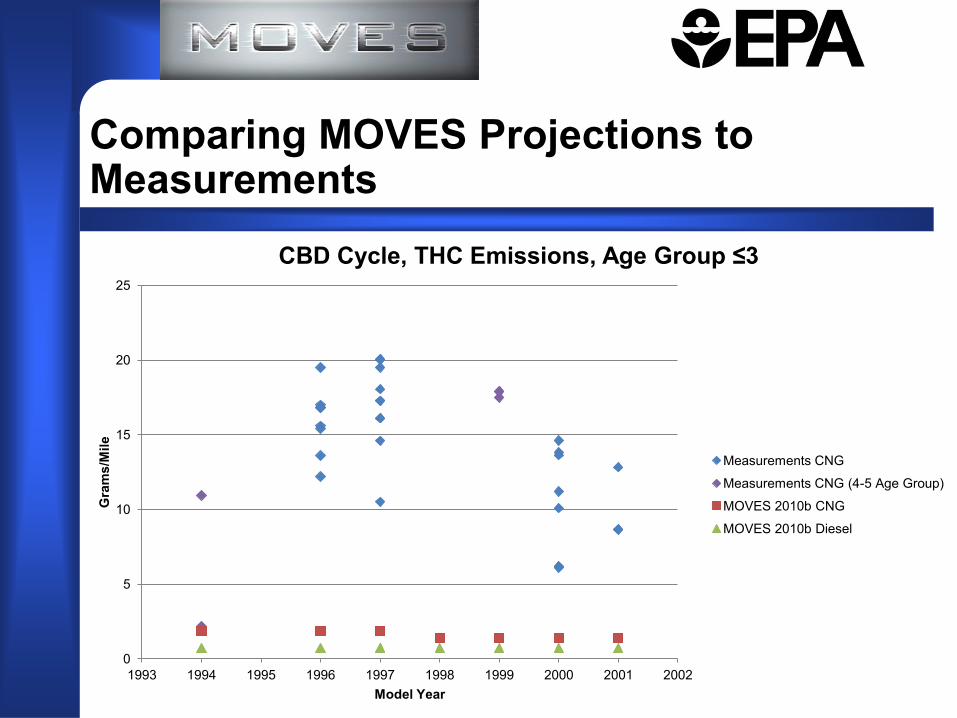
CBD Cycle, THC Emissions, Age Group ≤3
Measurements CNG
Measurements CNG (4-5 Age Group)
MOVES 2010b CNG
MOVES 2010b Diesel
Comparing MOVES Projections to Measurements
0
5
10
15
20
25
1993 1994 1995 1996 1997 1998 1999 2000 2001 2002
Gra
ms/
Mile
Model Year
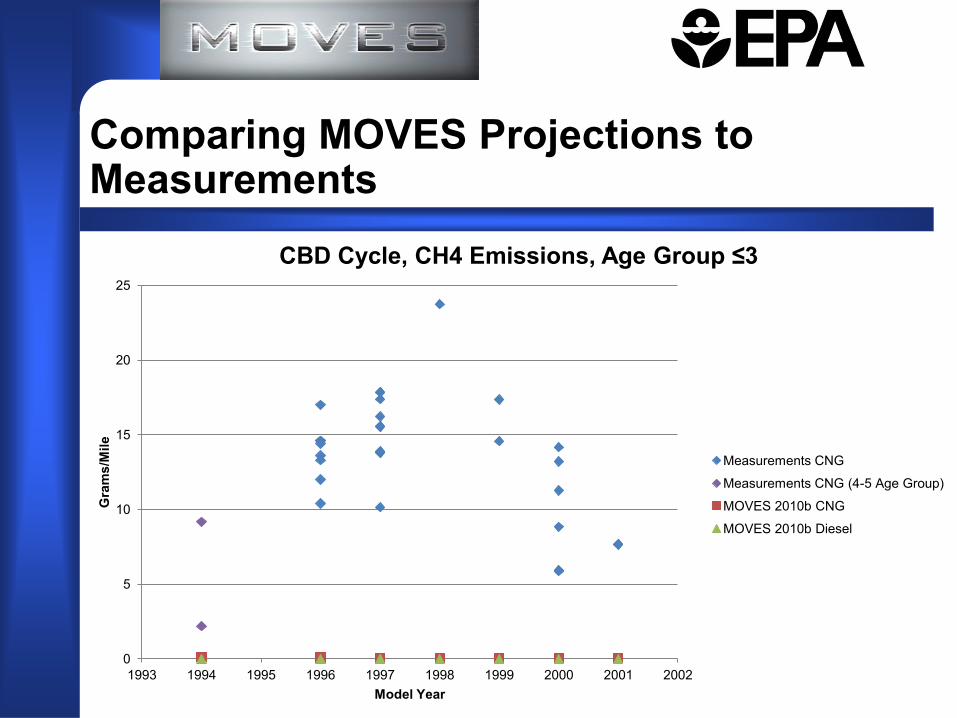
CBD Cycle, CH4 Emissions, Age Group ≤3
Measurements CNG
Measurements CNG (4-5 Age Group)
MOVES 2010b CNG
MOVES 2010b Diesel
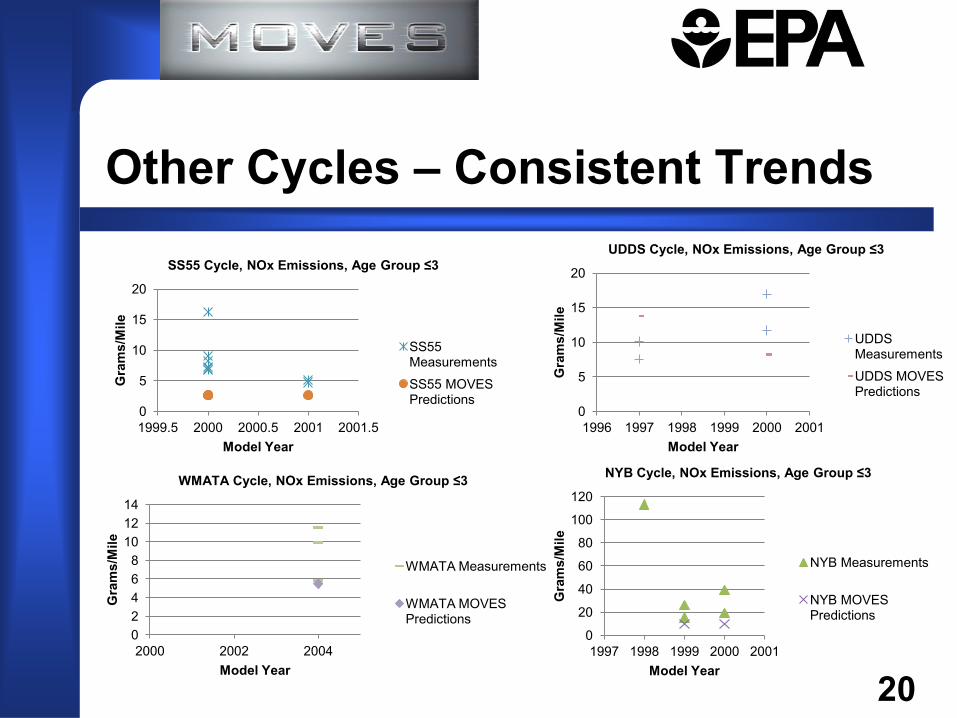
Other Cycles – Consistent Trends
20
0
20
40
60
80
100
120
1997 1998 1999 2000 2001
Gra
ms/
Mile
Model Year
NYB Cycle, NOx Emissions, Age Group ≤3
NYB Measurements
NYB MOVES Predictions
0
5
10
15
20
1996 1997 1998 1999 2000 2001
Gra
ms/
Mile
Model Year
UDDS Cycle, NOx Emissions, Age Group ≤3
UDDS Measurements
UDDS MOVES Predictions
0
5
10
15
20
1999.5 2000 2000.5 2001 2001.5
Gra
ms/
Mile
Model Year
SS55 Cycle, NOx Emissions, Age Group ≤3
SS55 Measurements
SS55 MOVES Predictions
0 2 4 6 8
10 12 14
2000 2002 2004
Gra
ms/
Mile
Model Year
WMATA Cycle, NOx Emissions, Age Group ≤3
WMATA Measurements
WMATA MOVES Predictions
Literature shows much higher THC and CH4 emissions than MOVES2010b CNG rates
– MOVES2010b CNG is based on gasoline emission rates – CH4 is uncombusted fuel from CNG vehicle – Majority of THC increase is CH4
Literature PM rates are higher than MOVES2010b – Much lower than diesel buses without trap
Literature NOx rates are higher than MOVES2010b Literature CO rates are similar Other cycles show similar, but not identical
conclusions
MY 1994-2001 Literature Review
21
No modal data from papers – Potentially available from some authors – Significant additional time and financial investment
Acquisition costs Quality Assurance Analysis
– Potentially a future option Scaled MOVES2010b CNG rates so that simulated drive cycle
emissions are at appropriate level – Simulate drive cycle in MOVES – Match to equivalent data from paper – Develop scaling factor
Assuming same ratio applies to running and start emissions – Assume same age trends, except for CH4
CH4 is assumed to remain same proportion of THC
Developing Modal Rates
22

Categorized CNG buses into 3 model year groups – A: 1994-2001 (Most MYs contained in literature review) – B: 2002-2006 (Additional MYs – WMATA cycle) – C: 2007 and later
For group A & B, emission rates from literature For 2007 and later MYs, scaled group B emission
rates by ratio to sales-weighted certification data – Portions of certification data (ie, projected sales) are CBI.
Proposed MOVES2013 CNG bus rates
23
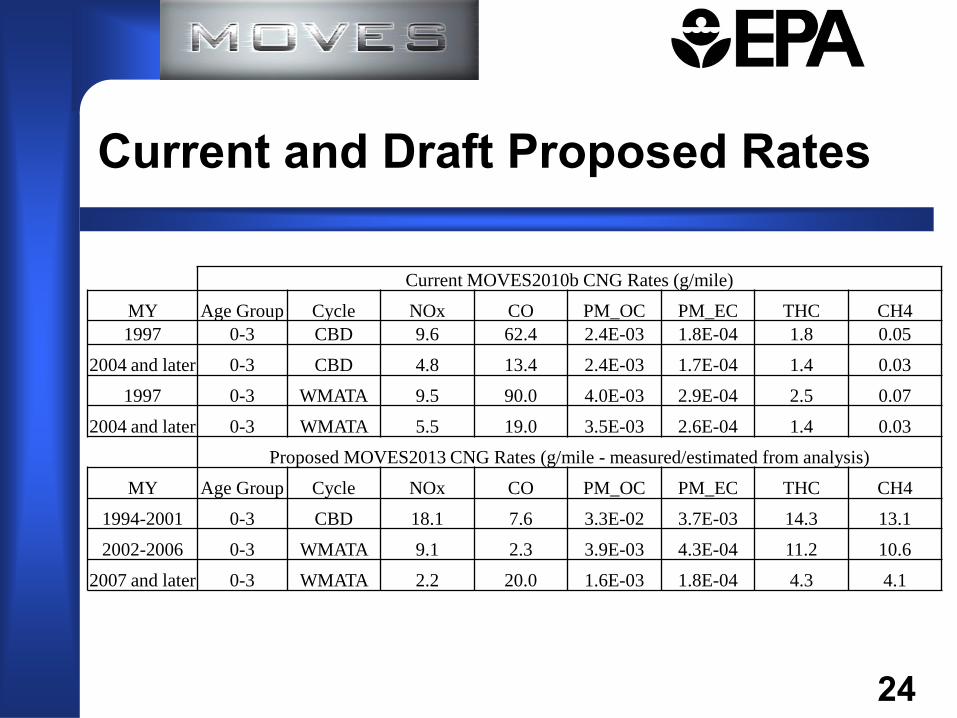
Current and Draft Proposed Rates
24
Current MOVES2010b CNG Rates (g/mile)
MY Age Group Cycle NOx CO PM_OC PM_EC THC CH4
1997 0-3 CBD 9.6 62.4 2.4E-03 1.8E-04 1.8 0.05
2004 and later 0-3 CBD 4.8 13.4 2.4E-03 1.7E-04 1.4 0.03
1997 0-3 WMATA 9.5 90.0 4.0E-03 2.9E-04 2.5 0.07
2004 and later 0-3 WMATA 5.5 19.0 3.5E-03 2.6E-04 1.4 0.03
Proposed MOVES2013 CNG Rates (g/mile - measured/estimated from analysis)
MY Age Group Cycle NOx CO PM_OC PM_EC THC CH4
1994-2001 0-3 CBD 18.1 7.6 3.3E-02 3.7E-03 14.3 13.1
2002-2006 0-3 WMATA 9.1 2.3 3.9E-03 4.3E-04 11.2 10.6
2007 and later 0-3 WMATA 2.2 20.0 1.6E-03 1.8E-04 4.3 4.1
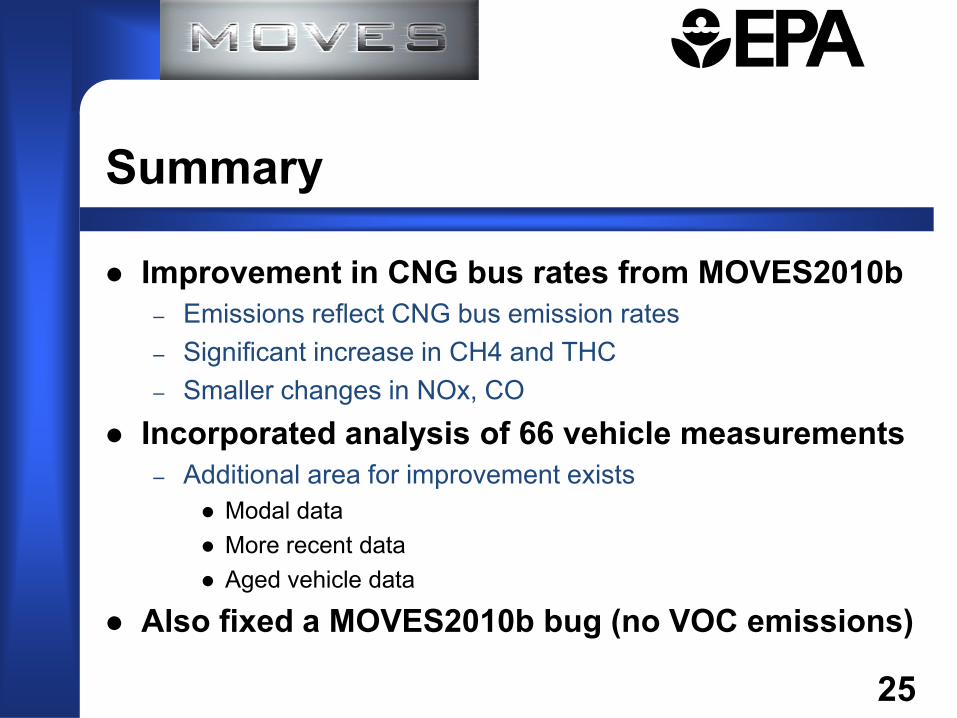
Improvement in CNG bus rates from MOVES2010b – Emissions reflect CNG bus emission rates – Significant increase in CH4 and THC – Smaller changes in NOx, CO
Incorporated analysis of 66 vehicle measurements – Additional area for improvement exists
Modal data More recent data Aged vehicle data
Also fixed a MOVES2010b bug (no VOC emissions)
Summary
25
Appendix: References
26
Clark, N., Gautam, M., Rapp, B., Lyons, D. et al., "Diesel and CNG Transit Bus Emissions Characterization by Two Chassis Dynamometer Laboratories: Results and Issues," Society of Automotive Engineers, SAE Technical Paper 1999-01-1469, 1999, (http://papers.sae.org/1999-01-1469).
Ayala, A., Kado, N., Okamoto, R., Holmén, B. et al., "Diesel and CNG Heavy-duty Transit Bus Emissions over Multiple Driving Schedules: Regulated Pollutants and Project Overview," Society of Automotive Engineers, SAE Technical Paper 2002-01-1722, 2002. (http://papers.sae.org/2002-01-1722).
Ayala, A., Gebel, M., Okamoto, R., Rieger, P. et al., "Oxidation Catalyst Effect on CNG Transit Bus Emissions," Society of Automotive Engineers, SAE Technical Paper 2003-01-1900, 2003. (http://papers.sae.org/2003-01-1900).
Lanni, T., Frank, B., Tang, S., Rosenblatt, D. et al., "Performance and Emissions Evaluation of Compressed Natural Gas and Clean Diesel Buses at New York City's Metropolitan Transit Authority," Society of Automotive Engineers., SAE Technical Paper 2003-01-0300, 2003. (http://papers.sae.org/2003-01-0300).
McCormick, R., Graboski, M., Alleman, T., Herring, A. et al., "In-Use Emissions from Natural Gas Fueled Heavy-Duty Vehicles," Society of Automotive Engineers, SAE Technical Paper 1999-01-1507, 1999. (http://papers.sae.org/1999-01-1507).
LeTavec, C., Uihlein, J., Vertin, K., Chatterjee, S. et al., "Year-Long Evaluation of Trucks and Buses Equipped with Passive Diesel Particulate Filters," Society of Automotive Engineers. SAE Technical Paper 2002-01-0433, 2002. (http://papers.sae.org/2002-01-0433).
McKain, D., Clark, N., Balon, T., Moynihan, P. et al., "Characterization of Emissions from Hybrid-Electric and Conventional Transit Buses," Society of Automotive Engineers, SAE Technical Paper 2000-01-2011, 2000. (http://papers.sae.org/2000-01-2011).
Clark, N., Gautam, M., Lyons, D., Bata, R. et al., "Natural Gas and Diesel Transit Bus Emissions: Review and Recent Data," Society of Automotive Engineers, SAE Technical Paper 973203, 1997. (http://papers.sae.org/973203).