04369341
DESCRIPTION
asdasdaTRANSCRIPT

364 IEEE TRANSACTIONS ON SEMICONDUCTOR MANUFACTURING, VOL. 20, NO. 4, NOVEMBER 2007
An Approach for Factory-Wide Control UtilizingVirtual Metrology
Aftab A. Khan, James R. Moyne, Member, IEEE, and Dawn M. Tilbury
Abstract—In the semiconductor manufacturing industry,market demands and technology trends drive manufacturerstowards increases in wafer size and decreases in device size. Appli-cation of factory-wide advanced process control (APC) techniquesdown to the wafer-to-wafer (W2W) level control capability isbecoming the only choice to cope with the demanding situation.However, one of the main limitations in undertaking W2W controlis the nonavailability of timely metrology data at the wafer level.Recently virtual metrology (VM) techniques have been proposedto provide timely wafer level metrology data; they have the poten-tial to be used in realizing W2W control.
In this paper, the VM approach to W2W control on factory levelis described. VM for an individual process is realized by utilizingthe preprocess metrology and the process data from the underlyingtools that is generally collected in real time for fault detection pur-poses. The VM implementation for factory-wide run-to-run con-trol brings unique opportunities and issues to the forefront suchas dealing with expected lower quality of VM data, coordinationbetween VM modules of cascading processes for better predictionquality, flexibility of the factory-wide controller to accommodatelower quality VM data, dynamic adjustments to the target valuesof individual processes by the factory-wide controller when usingVM data, and dealing with metrology delays at the factory level.Near and long-term solutions are presented to address these issuesin order to allow VM to be used today and become an integral partof the factory-wide APC solution for W2W control.
Index Terms—Advanced process control (APC), factory-widecontrol, partial least squares, run-to-run (R2R) control, semicon-ductor manufacturing, virtual metrology (VM).
I. INTRODUCTION
I N A large-volume multistage manufacturing system, such assemiconductor manufacturing, a product has to go through
a number of processing steps before it can be transformedto a finished product. In such a system, running individualprocesses under optimal conditions may not necessarily resultin an optimal objective for the factory-wide metrics, such asthroughput and yield, cycle time and fabrication cost, andelectrical characteristics of the product [7]. To pursue an op-timal objective for these factory-wide metrics, a factory-widecontrol strategy is required. Some of the factors that influencethe factory-wide objectives are addressed in the product andprocess design phase, such as design of the products, inventorycontrol, scheduling maintenance events, optimized product
Manuscript received April 1, 2007; revised July 12, 2007. This work was sup-ported in part by the National Science Foundation under Grant EEC95-92125.
J. R. Moyne and D. M. Tilbury are with the Mechanical Engineering De-partment, University of Michigan, Ann Arbor, MI 48109-2125 USA (e-mail:[email protected]; [email protected]).
A. A. Khan was with the Mechanical Engineering Department, University ofMichigan, Ann Arbor, MI 48109-2125 USA. He is now with Advanced Engi-neering Research Organization, Wah Cantt. 47040, Pakistan.
Digital Object Identifier 10.1109/TSM.2007.907609
scheduling, and efficient use of human resources. Other fac-tors are addressed in the manufacturing phase. Among these,advanced process control (APC)1 is rapidly emerging as thepredominant tool for continuous process improvement. Today,APC strategies are applied in a process-centric fashion on anR2R basis to increase accuracy, minimize equipment downtime,ensure highly efficient processes, and reduce variability in theprocesses [6], [21], [28]. However, these process-centric goalsof APC may not translate directly in the improvement of fac-tory-wide objectives [7], [20]. Thus, researchers have proposeda factory-wide supervisory control strategy that coordinatesindividual R2R process controllers utilizing the end-of-run or insitu metrology as well as final electrical testing data (ETest) ofthe finished product [26], [20]. A schematic diagram of a typ-ical factory-wide control solution is shown in Fig. 1, [26], [20].Fig. 1 shows a general layout of the manufacturing steps thata wafer might go through in a semiconductor manufacturingfactory. For a typical wafer, the series of processes shown in thefigure are repeated several times in order to produce multipleinterconnect layers on the wafer. A factory-wide controllerdelivers control strategies to maximize an objective functionconsisting of factors such as throughput, yield, cycle time, andfabrication cost. These control strategies along with marketdemands drive the electrical quality characteristics of the fin-ished wafer. The desired electrical quality characteristics arethen translated into individual target values for each processingstep by a supervisory controller. The supervisory controllerrecalculates optimized target values at each processing stepusing the ETest (final metrology) data to achieve the desiredelectrical characteristics of the finished wafer. Depending uponthe importance of a particular processing step, a metrology toolmight be employed to monitor the quality of sampled wafers.This quality measurement (shown as the dashed lines in Fig. 1)can be utilized as feed-forward data for the next process and asfeedback data for the current process [22]. However, the costand time associated with metrology greatly limits the numberof wafers that can be measured at a particular metrology sta-tion (usually one to three wafers per lot; the dashed lines inFig. 1 represent sampled metrology data). Integrated metrology(IM) can provide wafer level metrology data to enable R2Rprocess control [14], [30]; however, issues such as increasedcycle time, lost throughput, and cost of metrology makes itimpractical in many process environments. Furthermore, alltypes of metrology introduce delay into the feedback loop dueto wafer transport, measurement, and quality parameter calcu-lation times. Thus, in most applications the process controller
1Advanced process control includes both run-to-run (R2R) control and faultdetection and classification (FDC) systems [21], [6].
0894-6507/$25.00 © 2007 IEEE

KHAN et al.: APPROACH FOR FACTORY-WIDE CONTROL UTILIZING VIRTUAL METROLOGY 365
Fig. 1. Supervisory L2L control of product going through a number of processing steps.
employed is usually a lot-to-lot (L2L) controller that uses lotlevel metrology data. The control values are either kept thesame for all of the wafers in a lot going through a processingstep [6], [21] or extrapolated for every wafer in the lot using apredictive horizon control strategy [34].
As the semiconductor industry moves towards smaller de-vices and increased fabrication speeds, the need to move processcontrol to the wafer level is more pronounced than ever. WhileIM provides a critical capability in this move, it is not alwayscost effective and can produce critical time delays in feedbackmeasurements as well as reduction in process throughput [23].In the past few years, virtual metrology (VM) has been proposedas a method to augment existing metrology and has the potentialto be used in control schemes for improved process control interms of both accuracy and speed [5], [12], [18]. VM is the pre-diction of metrology variables (either measurable or non-mea-surable) using process and wafer state information. Since VMcan provide metrology data for every wafer, it can be leveragedto provide factory-wide R2R control at every process run. Inthis paper, we propose a factory-wide implementation of VMand R2R control utilizing VM data. Potential issues that mayarise in the development of factory-wide VM and control areidentified. Possible short- and long-term solutions are given toaddress those issues, thus providing a roadmap for the integra-tion of VM into factory-wide control.
The rest of the paper is organized as follows. Section IIcontains a brief overview of VM and the development of VMmodule for an individual process. Section III describes thefactory-wide VM application and its subsequent use in R2Rcontrol at wafer level. A simulation example study is presentedthat illustrates the advantages by using pre- and post-processmetrology in building VM modules. Section IV describespotential issues and challenges that may arise in the implemen-tation of VM-based factory-wide control and provides near andlong-term solutions to those issues. This paper concludes witha summary of the key points and a discussion of future work tohelp drive the VM roadmap.
II. OVERVIEW OF VM
In this paper, VM is defined as the prediction of metrologyvariables (either measurable or nonmeasurable) using informa-tion about the state of the process and/or product [16]. A typical
Fig. 2. Type-1 and type-2 data for VM.
Fig. 3. R2R control using VM for a semiconductor manufacturing process.
fault detection and classification (FDC) system collects equip-ment data (referred to as process variables in this paper) forevery process run. This enormous amount of process data (in-volving hundreds of variables) along with upstream metrologydata can be used for VM purposes (referred to as type-1 andtype-2 data [20] respectively; see Fig. 2). The VM data obtainedfor every process can then be used in a feed-forward and feed-back control scheme to provide R2R control for every wafer.
A. VM Module Development for Individual Process
The formulation of VM and R2R control at the wafer level foran individual process is pictured schematically in Fig. 3 (referto [12] for further details). In Fig. 3, the process has outputs
inputs , and process variables . is the processrun index (which represents processing of a single wafer), isthe lot number (or the event when a wafer is measured at themetrology station), are the recipe (tool) settingsat the start of run are the actual measurement of outputsat the metrology run , are the predicted valuesfor the outputs at the end of run , and are the
366 IEEE TRANSACTIONS ON SEMICONDUCTOR MANUFACTURING, VOL. 20, NO. 4, NOVEMBER 2007
statistical or other characteristic values for process (FD) vari-ables at the end of run . The FD system collects traces ofprocess variables during the process run. At the end of run thetrace signals for each of these process variables can be analyzedin the time and/or frequency domain to identify characteristicvalues that have the most dominant effect on the process out-puts. The vector refers to those characteristic values foundat the end of process run [10]. Most of the FD systems calcu-late summary statistics (mean, standard deviation, etc.), whichare usually used as the characteristic values. The process is thenmodelled by the following equation:
(2.1)
where is the inputs gain matrix, is theprocess variables gain matrix, is a vector of average(constant) drift rates (per run ), and is a multivariate whitenoise sequence with zero mean and variance .
An initial VM module is built from a data set of processvariables, inputs, and outputs, obtained with the help of de-sign of experiments (DOE) [19]. If the upstream metrology isnot available, then it would not be used in building the initialVM module. R2R control at wafer level is made possible byfeeding back the predicted outputs as well as the actualoutputs . The VM module is recursively updated and thecontroller parameters retuned as new metrology data isavailable, as shown by the dashed line in Fig. 3 [12].
To obtain the initial VM module, defineand arrange the DOE data for runs in
two matrices, and. Let and
, where and are the mean values of thecolumns of and , respectively. Then, a linear regressionmodel of the given process can be written as
(2.2)
where is a matrix of regression coefficientsand is an matrix of errors whose ele-
ments are independently and identically distributed with meanzero and variance .
Different regression methods, such as multiple linear regres-sion (MLR), principal component regression (PCR), and partialleast squares (PLS) can be applied to the matrices V and Y toestimate the coefficient matrix in (2.2). For a typical semi-conductor manufacturing process the number of FD variables isgenerally large. Thus, for most processes the FD variables willbe correlated and this fact coupled with measurement noise canlead to imprecise estimation of the matrix using MLR tech-nique [9]. In the PCR approach, the regressor variables in therank deficient V are replaced by a reduced set of principal com-ponents (PC) of V [8], [25]. But the PCs are derived withoutany reference to the output matrix Y. Thus, the derived PCs thatexplain much of the variation in V may not be related to the vari-ation in Y, giving rise to imprecise estimation of . In case ofnoisy and highly correlated data, projection to latent structures
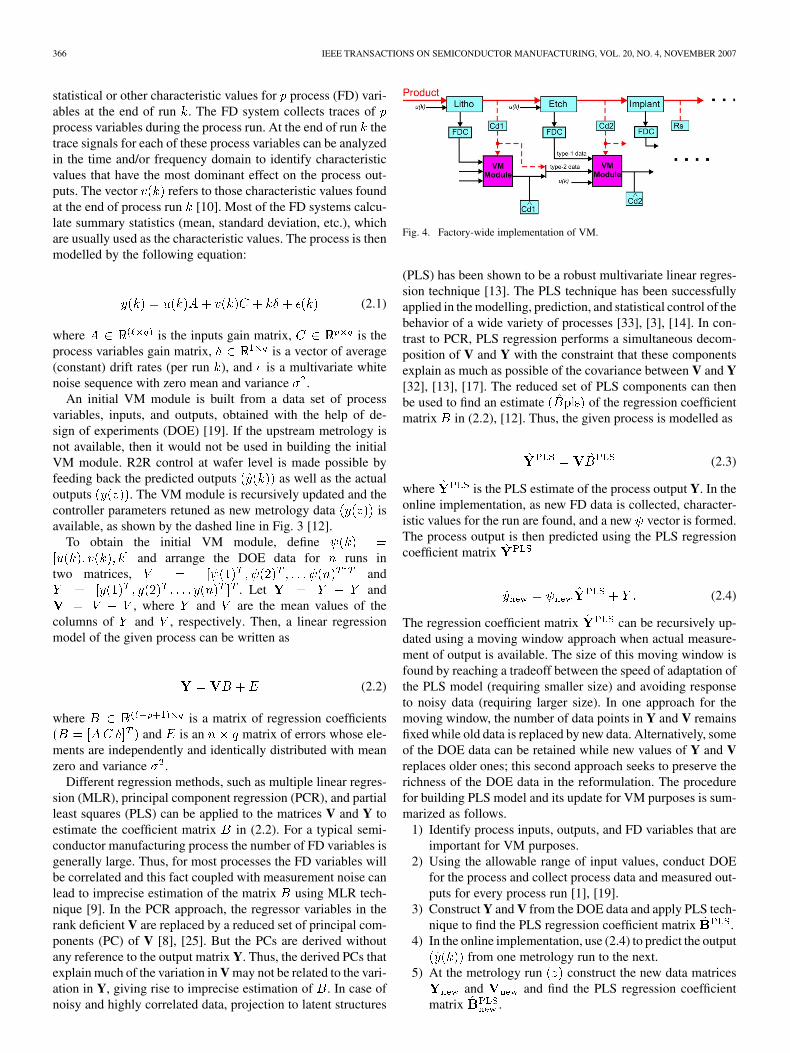
Fig. 4. Factory-wide implementation of VM.
(PLS) has been shown to be a robust multivariate linear regres-sion technique [13]. The PLS technique has been successfullyapplied in the modelling, prediction, and statistical control of thebehavior of a wide variety of processes [33], [3], [14]. In con-trast to PCR, PLS regression performs a simultaneous decom-position of V and Y with the constraint that these componentsexplain as much as possible of the covariance between V and Y[32], [13], [17]. The reduced set of PLS components can thenbe used to find an estimate of the regression coefficientmatrix in (2.2), [12]. Thus, the given process is modelled as
(2.3)
where is the PLS estimate of the process output Y. In theonline implementation, as new FD data is collected, character-istic values for the run are found, and a new vector is formed.The process output is then predicted using the PLS regressioncoefficient matrix
(2.4)
The regression coefficient matrix can be recursively up-dated using a moving window approach when actual measure-ment of output is available. The size of this moving window isfound by reaching a tradeoff between the speed of adaptation ofthe PLS model (requiring smaller size) and avoiding responseto noisy data (requiring larger size). In one approach for themoving window, the number of data points in Y and V remainsfixed while old data is replaced by new data. Alternatively, someof the DOE data can be retained while new values of Y and Vreplaces older ones; this second approach seeks to preserve therichness of the DOE data in the reformulation. The procedurefor building PLS model and its update for VM purposes is sum-marized as follows.
1) Identify process inputs, outputs, and FD variables that areimportant for VM purposes.
2) Using the allowable range of input values, conduct DOEfor the process and collect process data and measured out-puts for every process run [1], [19].
3) Construct Y and V from the DOE data and apply PLS tech-nique to find the PLS regression coefficient matrix .
4) In the online implementation, use (2.4) to predict the outputfrom one metrology run to the next.
5) At the metrology run construct the new data matricesand and find the PLS regression coefficient
matrix .

KHAN et al.: APPROACH FOR FACTORY-WIDE CONTROL UTILIZING VIRTUAL METROLOGY 367
Fig. 5. Factory-wide control utilizing VM at individual processing stations.
III. FACTORY-WIDE IMPLEMENTATION
OF VM AND R2R CONTROL
In the factory-wide implementation, VM modules for indi-vidual processes can be coordinated with one another for betterprediction quality. Since upstream wafer processing affects re-sults of the current process [29], the VM module for a particularprocess step can produce a more accurate prediction of the out-puts by utilizing related preprocess metrology data (predictedvia VM as well as actual) of the upstream processes. In partic-ular, the predicted outputs from the VM module of process-1can be used in the vector for process-2. As shown in Fig. 4,the actual (sampled) metrology of process-1 is used to updatethe PLS model of that process. The same metrology data alongwith the predicted outputs can be fed forward to the VM moduleof process-2, where it can be used in forming the vectorfor prediction on an R2R basis and then grouped together inthe input matrix (V) of process-2 for PLS model update at themetrology run. Thus, the actual metrology data of a process hasa dual purpose: it serves in forming the output matrix (Y) forthe PLS model of the current process and input matrix (V) forthe PLS model of the next process. The vector for process-2at run can now be formed as in (3.1), shown at the bottom ofthe page, where represents the sampling period of metrologyruns (i.e., metrology is done after every process runs) and thesubscripts and represent process-1 and process-2, respec-tively. is a discount factor representing the error in mea-sured outputs for process-1 ( is used in the rest of thepaper) and is the PLS weight factor for process-1 that dis-counts the predicted outputs of process-1 based on their pre-diction quality. This discounting factor can be derived from the
prediction error at the metrologyruns for process-1; , where is a pre-defined maximum allowable prediction error for process-1.
Once the VM results are available for every process run (orevery wafer), the next step is to use them in the APC paradigmto enable R2R control at the wafer level. Fig. 5 shows a generallayout of an R2R control solution using VM outputs. The pre-dicted outputs from individual VM modules can be provided tothe process R2R controllers, which in turn get their target valuesfrom the supervisory controller. The VM results can also be pro-vided to the R2R controller of the next process as a feed-forwardterm. This will provide the incoming wafer quality variation tothe R2R controller of the next process for better control of theprocess [29].
A. Example: VM and R2R Control for TWO ConsecutiveProcesses
A simulation study is performed to illustrate the use of VMin providing the predicted outputs to the R2R controllers andthe coordination between the VM modules of two processesin tandem. Each process is assumed to act on one wafer at atime. The two processes are such that the outputs of the secondprocess depend upon the outcome of the first process. The pro-cesses are modelled as
Process-1:
(3.2)
Process-2:
(3.3)
for between metrology runsfor at the metrology run
(3.1)

368 IEEE TRANSACTIONS ON SEMICONDUCTOR MANUFACTURING, VOL. 20, NO. 4, NOVEMBER 2007
TABLE ITYPICAL INPUT, OUTPUT, AND PROCESS VARIABLES FOR TWO PROCESSES
where is a matrix of parameters that representsthe effects of on and is the wafer index. As shownin Fig. 4, process-1 could be the development process in pho-tolithography carried out for patterning photoresist on the wafer,while process-2 could be a plasma etch process that etches theunderlying oxide layer according to the lithography patterns.Both of the processes have a number of input, output, and FDvariables, as listed in Table I.
Note that in practice some of the FD variables are highly cor-related while others are not, and some variables impact one ormore outputs while others may not affect the outputs at all. Theprocess control simulation is set up to explore the capability ofPLS method to handle these types of input/output (I/O) relation-ships, as described in the following.
For both processes, let the number of input, output, andprocess variables and target values be given as
Tgt , andTgt . Thus,
, and. To simulate the outputs of the
two processes, the following values are used for the differentparameters in their respective models:
(3.4)
and
(3.5)
TABLE IIPROCESS VARIABLE VALUES
and the individual variables in and are generatedas given in Table II. Parameter values for both the processesin this example are selected so that the simulation study closelycorresponds to actual behavior in semiconductor manufacturingprocesses, including drifts in some but not all of the outputs.For simulation purposes, these drifts are assumed to be constant.Some of these correspondence points are listed in Table III.
To control such drifting processes, trend modeling con-trollers such as double exponentially weighted moving average(dEWMA) controllers are commonly employed in the semi-conductor manufacturing processes [4]. For example, in adEWMA control scheme for a square system (both process-1and process-2 models in our example are square), the controlvalue for run is calculated as
Tgt (3.6)
where is an estimate of the process gain matrix foundfrom DOE and is an estimate of in(2.1) at run . These estimates are updated at every run usingtwo multivariate EWMA equations
(3.7)
(3.8)
where is a identity matrix, and and arediagonal matrices [4] having EWMA weights on the main
diagonals.
KHAN et al.: APPROACH FOR FACTORY-WIDE CONTROL UTILIZING VIRTUAL METROLOGY 369
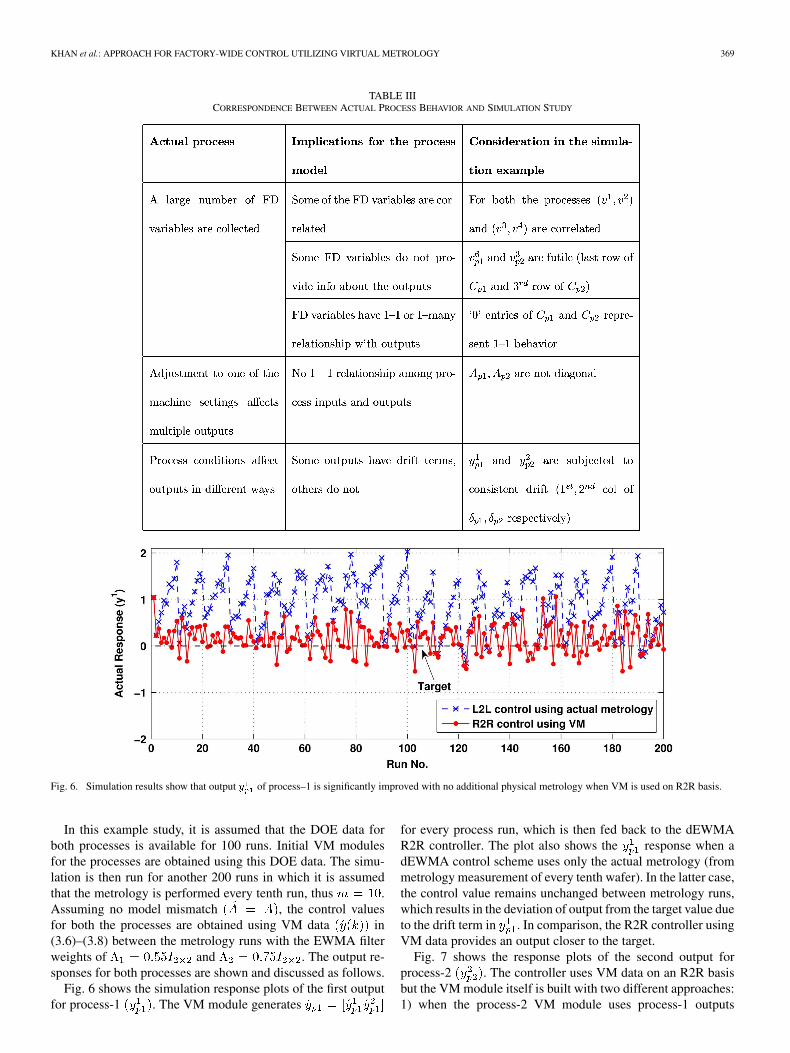
TABLE IIICORRESPONDENCE BETWEEN ACTUAL PROCESS BEHAVIOR AND SIMULATION STUDY
Fig. 6. Simulation results show that output y of process–1 is significantly improved with no additional physical metrology when VM is used on R2R basis.
In this example study, it is assumed that the DOE data forboth processes is available for 100 runs. Initial VM modulesfor the processes are obtained using this DOE data. The simu-lation is then run for another 200 runs in which it is assumedthat the metrology is performed every tenth run, thus .Assuming no model mismatch , the control valuesfor both the processes are obtained using VM data in(3.6)–(3.8) between the metrology runs with the EWMA filterweights of and . The output re-sponses for both processes are shown and discussed as follows.
Fig. 6 shows the simulation response plots of the first outputfor process-1 . The VM module generates
for every process run, which is then fed back to the dEWMAR2R controller. The plot also shows the response when adEWMA control scheme uses only the actual metrology (frommetrology measurement of every tenth wafer). In the latter case,the control value remains unchanged between metrology runs,which results in the deviation of output from the target value dueto the drift term in . In comparison, the R2R controller usingVM data provides an output closer to the target.
Fig. 7 shows the response plots of the second output forprocess-2 . The controller uses VM data on an R2R basisbut the VM module itself is built with two different approaches:1) when the process-2 VM module uses process-1 outputs

370 IEEE TRANSACTIONS ON SEMICONDUCTOR MANUFACTURING, VOL. 20, NO. 4, NOVEMBER 2007
Fig. 7. Simulation results show that when process-1 metrology is used in VM for process-2, output y of process-2 has less variation.
Fig. 8. Simulation results show that output y of process-2 is significantly improved with no additional physical metrology when VM is used on R2R basis.
[with W2W VM control at process-1 according to (3.1)] and2) when it does not. The plot shows that the output responsehas less variation when the VM module uses the preprocessmetrology in its formulation. Thus, the prediction quality ofthe VM module for process-2 has been enhanced with theadditional information of process-1 output (predicted as wellas actual), which results in better control of the process. TheVM data of process-1 can be fed forward to adjust the targetvalues of process-2 if it is not feasible to build a VM modulefor process-2. This situation can arise when the process underconsideration is a lot-based process, e.g., chemical–vapor de-position (CVD) process, instead of taking one wafer at a time.
Fig. 8 compares the response when using: 1) VM dataon R2R basis [that uses process-1 output in the VM module ac-cording to (3.1)], and 2) actual metrology on L2L basis. Fromthe figure, it is clear that the VM-based R2R control performsbetter in controlling the output as compared to the L2L-basedcontrol. In the L2L control case the control values remain un-changed between metrology runs, therefore the process outputdeviates from the target value due to the drift term in the modelfor .
It might seem desirable to improve the L2L controller bymodeling the process drift and adjusting the inputs at every
wafer to compensate for a systematic drift. However, such a con-trol scheme can result in significantly degraded system behaviorwhen the drift is not accurately predicted or the process under-goes a sudden shift in drift due to maintenance events or otherexternal disturbances [4], [10]. While the VM is also using aprediction of the drift, the control inputs are updated after everywafer based on actual measurements of the process variables.Thus, the VM does not present the same danger for divergence.In fact, if the VM indicates that drastic changes have occurred inthe process, steps can be taken to identify and correct any prob-lems at once, instead of continuing to produce wafers until thenext metrology event.
IV. OPPORTUNITIES, ISSUES, AND SOLUTIONS IN REALIZING
FACTORY-WIDE VM AND R2R CONTROL
The methods and concepts developed for VM provide anumber of opportunities that can be leveraged in realizing fac-tory-wide R2R control and achieving factory level objectives.However, these opportunities also bring a number of issuesto the forefront that must be overcome. Some of these issuesrelate to the VM module building while other relate to theiruse in the R2R control solution. Understanding the currentstate-of-the-art as to how VM solutions can be applied as well
KHAN et al.: APPROACH FOR FACTORY-WIDE CONTROL UTILIZING VIRTUAL METROLOGY 371
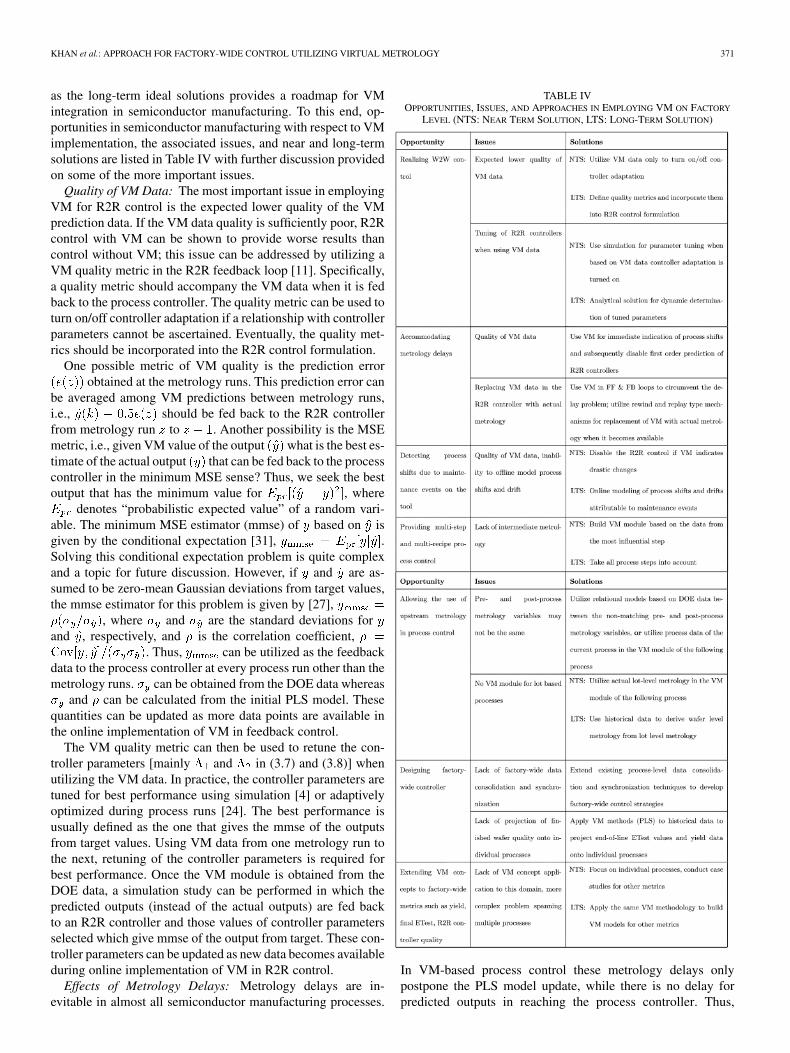
as the long-term ideal solutions provides a roadmap for VMintegration in semiconductor manufacturing. To this end, op-portunities in semiconductor manufacturing with respect to VMimplementation, the associated issues, and near and long-termsolutions are listed in Table IV with further discussion providedon some of the more important issues.
Quality of VM Data: The most important issue in employingVM for R2R control is the expected lower quality of the VMprediction data. If the VM data quality is sufficiently poor, R2Rcontrol with VM can be shown to provide worse results thancontrol without VM; this issue can be addressed by utilizing aVM quality metric in the R2R feedback loop [11]. Specifically,a quality metric should accompany the VM data when it is fedback to the process controller. The quality metric can be used toturn on/off controller adaptation if a relationship with controllerparameters cannot be ascertained. Eventually, the quality met-rics should be incorporated into the R2R control formulation.
One possible metric of VM quality is the prediction errorobtained at the metrology runs. This prediction error can
be averaged among VM predictions between metrology runs,i.e., should be fed back to the R2R controllerfrom metrology run to . Another possibility is the MSEmetric, i.e., given VM value of the output what is the best es-timate of the actual output that can be fed back to the processcontroller in the minimum MSE sense? Thus, we seek the bestoutput that has the minimum value for , where
denotes “probabilistic expected value” of a random vari-able. The minimum MSE estimator (mmse) of based on isgiven by the conditional expectation [31], .Solving this conditional expectation problem is quite complexand a topic for future discussion. However, if and are as-sumed to be zero-mean Gaussian deviations from target values,the mmse estimator for this problem is given by [27],
, where and are the standard deviations forand , respectively, and is the correlation coefficient,
. Thus, can be utilized as the feedbackdata to the process controller at every process run other than themetrology runs. can be obtained from the DOE data whereas
and can be calculated from the initial PLS model. Thesequantities can be updated as more data points are available inthe online implementation of VM in feedback control.
The VM quality metric can then be used to retune the con-troller parameters [mainly and in (3.7) and (3.8)] whenutilizing the VM data. In practice, the controller parameters aretuned for best performance using simulation [4] or adaptivelyoptimized during process runs [24]. The best performance isusually defined as the one that gives the mmse of the outputsfrom target values. Using VM data from one metrology run tothe next, retuning of the controller parameters is required forbest performance. Once the VM module is obtained from theDOE data, a simulation study can be performed in which thepredicted outputs (instead of the actual outputs) are fed backto an R2R controller and those values of controller parametersselected which give mmse of the output from target. These con-troller parameters can be updated as new data becomes availableduring online implementation of VM in R2R control.
Effects of Metrology Delays: Metrology delays are in-evitable in almost all semiconductor manufacturing processes.
TABLE IVOPPORTUNITIES, ISSUES, AND APPROACHES IN EMPLOYING VM ON FACTORY
LEVEL (NTS: NEAR TERM SOLUTION, LTS: LONG-TERM SOLUTION)
In VM-based process control these metrology delays onlypostpone the PLS model update, while there is no delay forpredicted outputs in reaching the process controller. Thus,

372 IEEE TRANSACTIONS ON SEMICONDUCTOR MANUFACTURING, VOL. 20, NO. 4, NOVEMBER 2007
Fig. 9. VM module for multistep process and R2R control.
any discrepancy in control performance is the result of lowerquality of VM data due to metrology delays. The VM data canbe of lower quality if the process undergoes a sudden shift orchange in drift direction, and the PLS model update (to capturethat change) is delayed due to metrology delays. However,the VM module can still provide an indication of the processchange or contextual machine errors (e.g., human errors inentering a wrong value), and this information can be used todisable the R2R controller adaptation to prevent its aggressivebehavior in the face of drastic changes in process conditions.In the normal scenario (no process changes), the delayed actualmetrology should be incorporated into the control formulationwhen it eventually becomes available to take out the effects ofVM data being used earlier in its place. One way of doing thatwould be to recalculate the first-order controller terms from theprocess run associated with delayed metrology event throughthe current process run.
Maintenance Events on Tool: It is well known that differenttypes of scheduled or unscheduled maintenance events on thetool impact process conditions which in turn can introduceoutput shifts or change in drift direction or both [21], [6]. Assuggested above, VM data can be used to detect such changesimmediately, which in turn can be used to disable the processcontroller adaptation. However, for accurate prediction ofthe outputs via VM it is imperative to include the effects ofmaintenance events in the process model. Suppose there are
different types of entities on a processing tool that requiremaintenance from time to time, then the drift term in theprocess model of (2.1) should be replaced by , where
is a vector of drift indices, andis a matrix containing average (constant) drift rates (per run )
.... . .
... (4.1)
In the above matrix, is the drift rate contributed by the thentity towards the th process output. Elements of the vectorare index values for the individual drift types in matrix . Eachof the indices in vector grows incrementally with the processrun index until a particular maintenance event occurs and atthat time the corresponding drift index is reset to zero. With theintroduction of the new drift term, vector for PLS modelingbecomes .
In an ideal environment these drift rates can be foundfrom the DOE data. In reality, however, it is impractical since itwill require an enormous number of experiments to accuratelyestimate the drift rates. A reasonable approach would be to ini-tially assume zero values for all the entries in matrix . Then, inthe online implementation of VM, estimate the individual driftterms as the maintenance events are performed [34] (this ap-proach is a subject of future work).
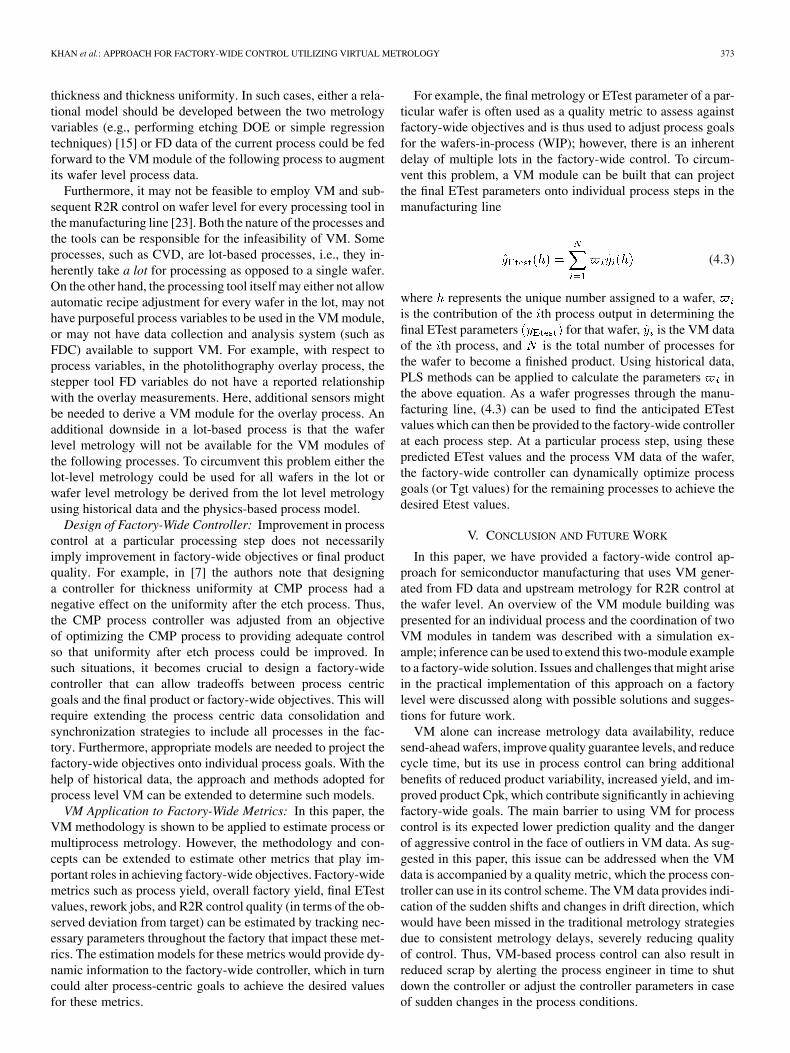
Multirecipe and Multistep Processes: Many processes insemiconductor manufacturing consist of multiple process stepsconducted in a sequence before a physical measurement ismade on the quality attributes (or metrology variables). Forexample, the contact etch process has two similar steps: anoxide etch and a subsequent nitride etch. Both processes areperformed in similar processing tools one after the other, butwafer CD is measured only after the second process. This situ-ation is schematically shown in Fig. 9. In such cases it becomesdifficult to correlate two sets of process variables with one setof metrology variables. A multiprocess multirecipe approachis therefore needed for the formulation of VM problem. In theexample case of contact etch, the second process, nitride etch,determines the final CD. It seems logical to use process datafrom this process only in building the VM module. However,in general, data from all process steps should be used in theVM module and each step components should be weightedaccording to the corresponding level of their influence on thefinal quality variables, i.e.,
(4.2)
where is the weight factor for the th process step. In addition,the R2R controller must be capable of generating two sets ofcontrol values, one for each step of the process. Note that this isa future research topic.
Use of Upstream Metrology in Process Control: In the ex-ample study of Section III, it was demonstrated that the use ofpreprocess metrology in VM module enhances the control per-formance. However, there might be cases when the immediatepre- and post-process metrology variables are not the same. Forexample, quality variable of interest after plasma etch processis the CD and CD uniformity across the wafer, while the fol-lowing process is usually metal implant or chemical–mechan-ical polishing (CMP) process where the output variable is film
KHAN et al.: APPROACH FOR FACTORY-WIDE CONTROL UTILIZING VIRTUAL METROLOGY 373
thickness and thickness uniformity. In such cases, either a rela-tional model should be developed between the two metrologyvariables (e.g., performing etching DOE or simple regressiontechniques) [15] or FD data of the current process could be fedforward to the VM module of the following process to augmentits wafer level process data.
Furthermore, it may not be feasible to employ VM and sub-sequent R2R control on wafer level for every processing tool inthe manufacturing line [23]. Both the nature of the processes andthe tools can be responsible for the infeasibility of VM. Someprocesses, such as CVD, are lot-based processes, i.e., they in-herently take a lot for processing as opposed to a single wafer.On the other hand, the processing tool itself may either not allowautomatic recipe adjustment for every wafer in the lot, may nothave purposeful process variables to be used in the VM module,or may not have data collection and analysis system (such asFDC) available to support VM. For example, with respect toprocess variables, in the photolithography overlay process, thestepper tool FD variables do not have a reported relationshipwith the overlay measurements. Here, additional sensors mightbe needed to derive a VM module for the overlay process. Anadditional downside in a lot-based process is that the waferlevel metrology will not be available for the VM modules ofthe following processes. To circumvent this problem either thelot-level metrology could be used for all wafers in the lot orwafer level metrology be derived from the lot level metrologyusing historical data and the physics-based process model.
Design of Factory-Wide Controller: Improvement in processcontrol at a particular processing step does not necessarilyimply improvement in factory-wide objectives or final productquality. For example, in [7] the authors note that designinga controller for thickness uniformity at CMP process had anegative effect on the uniformity after the etch process. Thus,the CMP process controller was adjusted from an objectiveof optimizing the CMP process to providing adequate controlso that uniformity after etch process could be improved. Insuch situations, it becomes crucial to design a factory-widecontroller that can allow tradeoffs between process centricgoals and the final product or factory-wide objectives. This willrequire extending the process centric data consolidation andsynchronization strategies to include all processes in the fac-tory. Furthermore, appropriate models are needed to project thefactory-wide objectives onto individual process goals. With thehelp of historical data, the approach and methods adopted forprocess level VM can be extended to determine such models.
VM Application to Factory-Wide Metrics: In this paper, theVM methodology is shown to be applied to estimate process ormultiprocess metrology. However, the methodology and con-cepts can be extended to estimate other metrics that play im-portant roles in achieving factory-wide objectives. Factory-widemetrics such as process yield, overall factory yield, final ETestvalues, rework jobs, and R2R control quality (in terms of the ob-served deviation from target) can be estimated by tracking nec-essary parameters throughout the factory that impact these met-rics. The estimation models for these metrics would provide dy-namic information to the factory-wide controller, which in turncould alter process-centric goals to achieve the desired valuesfor these metrics.
For example, the final metrology or ETest parameter of a par-ticular wafer is often used as a quality metric to assess againstfactory-wide objectives and is thus used to adjust process goalsfor the wafers-in-process (WIP); however, there is an inherentdelay of multiple lots in the factory-wide control. To circum-vent this problem, a VM module can be built that can projectthe final ETest parameters onto individual process steps in themanufacturing line
(4.3)
where represents the unique number assigned to a wafer,is the contribution of the th process output in determining thefinal ETest parameters for that wafer, is the VM dataof the th process, and is the total number of processes forthe wafer to become a finished product. Using historical data,PLS methods can be applied to calculate the parameters inthe above equation. As a wafer progresses through the manu-facturing line, (4.3) can be used to find the anticipated ETestvalues which can then be provided to the factory-wide controllerat each process step. At a particular process step, using thesepredicted ETest values and the process VM data of the wafer,the factory-wide controller can dynamically optimize processgoals (or Tgt values) for the remaining processes to achieve thedesired Etest values.
V. CONCLUSION AND FUTURE WORK
In this paper, we have provided a factory-wide control ap-proach for semiconductor manufacturing that uses VM gener-ated from FD data and upstream metrology for R2R control atthe wafer level. An overview of the VM module building waspresented for an individual process and the coordination of twoVM modules in tandem was described with a simulation ex-ample; inference can be used to extend this two-module exampleto a factory-wide solution. Issues and challenges that might arisein the practical implementation of this approach on a factorylevel were discussed along with possible solutions and sugges-tions for future work.
VM alone can increase metrology data availability, reducesend-ahead wafers, improve quality guarantee levels, and reducecycle time, but its use in process control can bring additionalbenefits of reduced product variability, increased yield, and im-proved product Cpk, which contribute significantly in achievingfactory-wide goals. The main barrier to using VM for processcontrol is its expected lower prediction quality and the dangerof aggressive control in the face of outliers in VM data. As sug-gested in this paper, this issue can be addressed when the VMdata is accompanied by a quality metric, which the process con-troller can use in its control scheme. The VM data provides indi-cation of the sudden shifts and changes in drift direction, whichwould have been missed in the traditional metrology strategiesdue to consistent metrology delays, severely reducing qualityof control. Thus, VM-based process control can also result inreduced scrap by alerting the process engineer in time to shutdown the controller or adjust the controller parameters in caseof sudden changes in the process conditions.

374 IEEE TRANSACTIONS ON SEMICONDUCTOR MANUFACTURING, VOL. 20, NO. 4, NOVEMBER 2007
The move to W2W control in semiconductor manufacturingcan be greatly facilitated by making VM an integral part of fu-ture production and planning. Although VM can be shown tobenefit individual processes [2], its application on the factorylevel requires further investigation. In particular, every processin the manufacturing line has to be evaluated for the VM im-plementation considering the extra software resources required,value added to the wafer quality, and the cost of employing IMas an alternative. With the VM roadmap presented in this paperin terms of interim and final VM solutions, the move to VM canbe structured as an evolution rather than revolution, making themove much more viable from both a technology and cost per-spective.
ACKNOWLEDGMENT
The first author would like to acknowledge an internship op-portunity at Intel Corporation. In particular, he would like tothank Dr. M. Braun and Dr. N. Patel for inspiration and guid-ance in the fields of VM and feedback control for semiconductormanufacturing.
REFERENCES
[1] G. P. Box, W. G. Hunter, and J. S. Hunter, Statistics for Experimenters:An Introduction to Design, Data Analysis, and Model Building, 1sted. New York: Wiley, 1978.
[2] R. Bunkofske, “The use of hierarchical data analysis to predict endof line electrical test parameters from in-line FDC data,” in Proc.AEC/APC Symp. XVI, Westminster, CO, USA, Sep. 2004.
[3] S. Bushman, T. F. Edgar, and I. Trachtenberg, “Modeling of plasmaetch systems using ordinary least squares, recurrent neural network,and projection to latent structure models,” J. Electrochem. Soc., vol.144, no. 4, pp. 1379–1389, 1997.
[4] E. D. Castillo and R. Rajagopal, “A multivariate double EWMAprocess adjustment scheme for drifting processes,” IIE Trans., vol. 34,no. 6, pp. 1055–1068, 2002.
[5] P. Chen, S. Wu, J. Lin, F. Ko, H. Lo, J. Wang, C. H. Yu, and M. S.Liang, “Virtual metrology: A solution for wafer to wafer advancedprocess control,” in Proc. IEEE Int. Symp. Semiconductor Manufac-turing (ISSM), Sep. 2005, pp. 155–157.
[6] T. F. Edgar, S. W. Butler, W. J. Campbell, C. Pfeiffer, C. Bode, S. B.Hwang, K. S. Balakrishnan, and J. Hahn, “Automatic control in mi-croelectronics manufacturing: Practices, challenges, and possibilities,”Automatica, vol. 36, no. 11, pp. 1567–1603, 2000.
[7] C. el Chemali, J. Moyne, K. Khan, R. Nadeau, P. Smith, J. Colt, J.Chapple-Sokol, and T. Parikh, “Multizone uniformity control of achemical mechanical polishing process utilizing a pre- and postmea-surement strategy,” J. Vacuum Sci. Technol., Part A, vol. 18, no. 4, pp.1287–1296, 2000.
[8] P. Geladi and B. R. Kowalski, “Partial least squares regression: A tu-torial,” Analytica Chimica Acta, vol. 185, pp. 1–17, 1986.
[9] R. Johnson and D. Wichern, Applied Multivariate Statistical Analysis,5th ed. Englewood Cliffs, NJ: Prentice Hall, 2007.
[10] A. A. Khan, “Predictive inspection based control using diagnostic datafor manufacturing processes,” Ph.D. dissertation, Dept. MechanicalEng., Univ. Michigan, Ann Arbor, 2007.
[11] A. Khan, J. Moyne, and D. Tilbury, “On the quality of virtual metrologydata for use in run-to-run process control,” in Proc. AEC/APC Symp.XIX, Palm Springs, CA, Sep. 2007, To appear.
[12] A. Khan, J. Moyne, and D. Tilbury, “Virtual metrology and feedbackcontrol for semiconductor manufacturing processes using recursivepartial least squares,” J. Process Contr.: Special issue on AdvancedProcess Control for Semiconductor Manufacturing, 2008, Submittedto.
[13] T. Kourti, “Application of latent variable methods to process controland multivariate statistical process control in industry,” Int. J. Adapt.Contr. Signal Process., vol. 19, no. 4, pp. 213–246, 2005.
[14] K. Lensing and B. Stirton, “Integrated metrology and wafer-level con-trol,” Semiconduct. Int., vol. 29, no. 6, pp. 44–54, Jun. 2006.
[15] J.-S. Lin, P.-H. Chen, S. Wu, F. Ko, M.-S. Zhou, M.-S. Liang, J. Zou,T. Mullins, J. Moyne, and K. Edwards, “Model based wafer-to-wafercontrol for Cu CMP,” in Proc. VLSI Multilevel Interconnect Conf., Sept.2003.
[16] T.-H. Lin, M.-H. Hung, R.-C. Lin, and F.-T. Cheng, “A virtualmetrology scheme for predicting CVD thickness in semiconductormanufacturing,” in Proc. IEEE Int. Conf. Robotics Automation, May2006, pp. 1054–1059.
[17] A. Lorber, L. E. Wangent, and B. R. Kowalski, “A theoretical founda-tion for the PLS algorithm,” J. Chemometrics, vol. 1, pp. 19–31, 1987.
[18] J. Mao, “Run-to-run control with fault detection and rejection,” in Proc.AEC/APC Symp. XV, Colorado Springs, CO, Sep. 2003.
[19] D. C. Montgomery, Introduction to Statistical Quality Control. NewYork: Wiley, 1996.
[20] J. Moyne, “Making the move to fab-wide APC,” Solid State Technol.,vol. 47, no. 9, p. 47, Sept. 2004.
[21] J. Moyne, E. del Castillo, and A. M. Hurwitz, Run-to-Run Control inSemiconductor Manufacturing. Boca Raton, FL: CRC, 2001.
[22] J. Moyne, V. Solakhian, A. Yershov, M. Anderson, and D.Mockler-Hebert, “Development and deployment of a multi-com-ponent advanced process control system for an epitaxy tool,” in Proc.Advanced Semiconductor Manufacturing 2002 IEEE/SEMI Conf.Workshop, Apr./May l–2, 2002, pp. 125–130.
[23] N. Patel and M. Anderson, “Considerations in deploying wafer-levelcontrol across the fab. In,” in Proc. AEC/APC Symp. XV, ColoradoSprings, CO, Sep. 2003.
[24] N. S. Patel and S. T. Jenkins, “Adaptive optimization of run-to-runcontrollers: The EWMA example,” IEEE Trans. Semiconduct. Manuf.,vol. 13, no. 1, pp. 97–107, Feb. 2000.
[25] A. Phatak and S. D. Jong, “The geometry of partial least squares,” J.Chemometrics, vol. 11, pp. 311–338, 1997.
[26] S. J. Qin, G. Cherry, R. Good, J. Wang, and C. A. Harrison, “Semi-conductor manufacturing process control and monitoring: A fab-wideframework,” J. Process Contr., vol. 16, no. 3, pp. 179–191, 2006.
[27] S. Ruegsegger, A. Wagner, J. S. Freudenberg, and D. S. Grimard,“Feedforward control for reduced run-to-run variation in microelec-tronics manufacturing,” IEEE Trans. Semiconduct. Manuf., vol. 12,no. 4, pp. 493–502, Nov. 1999.
[28] M. Sarfaty, A. Shanmugasundram, A. Schwarm, J. Z. J. Paik, R. Pan,M. Seamons, H. Li, R. Hung, and S. Parikh, “Advance process controlsolutions for semiconductor manufacturing,” in Proc. IEEE Int. Symp.Semiconductor Manufacturing Conf., Apr. 2002, pp. 101–106.
[29] H. Sasano, W. Liu, D. S. L. Mui, K. Yoo, and J. Yamartino, “Ad-vanced gate process critical dimension control in semiconductor man-ufacturing,” in Proc. IEEE Int. Symp. Semiconductor Manufacturing(ISSM), Sep. 2003, pp. 382–385.
[30] C. Schneider, L. Pfitzner, and H. Ryssel, “Integrated metrology: Anenabler for advanced process control (APC),” in Proc. SPIE—Int. Soc.Opt. Eng., 2001, vol. 4406, pp. 118–130.
[31] H. Stark and J. Woods, Probability, Random Processes, and EstimationTheory for Engineers, 2nd ed. Englewood Cliffs, NJ: Prentice Hall,1994.
[32] X. Wang, U. Kruger, and B. Lennox, “Recursive partial least squaresalgorithms for monitoring complex industrial processes,” Contr. Eng.Practice, vol. 11, no. 6, pp. 613–632, 2003.
[33] L. L. Zheng, T. J. McAvoy, Y. Huang, and G. Chen, “Applicationof multivariate statistical analysis in batch processes,” Industr. Eng.Chemistry Res., vol. 40, no. 7, pp. 1641–1649, 2001.
[34] J. Zou and J. A. Mullins, “Modeling process operation in model basedR2R control,” in Proc. AEC/APC Symp. XVII, Palm Springs, CA, Sep.2005.
Aftab A. Khan received the B.S. degree in me-chanical engineering from NWFP University ofEngineering and Technology, Peshawar, Pakistan, in1994, and the M.S. and Ph.D. degrees in mechanicalengineering from the University of Michigan, AnnArbor, in 2003 and 2007, respectively. He conductedhis Ph.D. thesis research on virtual metrology andcontrol for manufacturing processes.
He is currently working at Advanced EngineeringResearch Organization, Pakistan. His research in-terests include virtual metrology, predictive control,
system modeling, and run-to-run control and their application to semiconductorprocess manufacturing.

KHAN et al.: APPROACH FOR FACTORY-WIDE CONTROL UTILIZING VIRTUAL METROLOGY 375
James R. Moyne (M’90) received the B.S.E.E. andB.S.E. degrees in mathematics, and the M.S.E.E. andPh.D. degrees from the University of Michigan, AnnArbor.
He is an Associate Research Scientist in the De-partment of Mechanical Engineering, University ofMichigan. He is also the Standards and TechnologySpecialist for Applied Material’s Applied Global Ser-vices division. He was President and Cofounder ofMiTeX Solutions, Inc., established in 1995 to pro-vide the first integrated run-to-run control solutions
for semiconductor and display manufacturing (purchased by Brooks Automa-tion in 2000). He has experience in advanced process control, database tech-nology, and sensor bus technology, and is the author of a number of many ref-ereed publications in each of these areas. He also holds the patent on a softwarecontrol framework enabling technology called the Generic Cell Controller, andis coauthor of Run-to-run Control in Semiconductor Manufacturing. He is alsothe author of a number of SEMI standards in the areas of process control sys-tems, sensor bus, and communications, and currently cochairs process controlsystems and sensor bus standards efforts.
Dawn M. Tilbury received the B.S. degree in elec-trical engineering, summa cum laude, from the Uni-versity of Minnesota, Minneapolis, in 1989, and theM.S. and Ph.D. degrees in electrical engineering andcomputer sciences from the University of California,Berkeley, in 1992 and 1994, respectively.
In 1995, she joined the faculty of the Mechan-ical Engineering Department at the University ofMichigan, Ann Arbor, where she is currently holdsthe rank of Professor. Her research interests includedistributed control of mechanical systems with
network communication, logic control of manufacturing systems, performancemanagement and control of computing systems, and uncertainty modelingin cooperative control. She is coauthor of the textbook Feedback Control ofComputing Systems.
Dr. Tilbury won the EDUCOM Medal (jointly with Professor W. Messnerof Carnegie Mellon University) in 1997 for her work on the web-based ControlTutorials for Matlab (published by Addison-Wesley, 1999). She received an NSFCAREER award in 1999, and is the 2001 recipient of the Donald P. EckmanAward of the American Automatic Control Council. She was a member of the2004–2005 class of the Defense Science Study Group (DSSG) and is a currentmember of DARPA’s Information Science and Technology Study Group (ISAT).She belongs to ASME, IEEE, and SWE, and is an elected member of the IEEEControl Systems Society Board of Governors.