02/27/12 update of stock market trends & observations
TRANSCRIPT

8/2/2019 02/27/12 Update of Stock Market Trends & Observations
http://slidepdf.com/reader/full/022712-update-of-stock-market-trends-observations 1/271

8/2/2019 02/27/12 Update of Stock Market Trends & Observations
http://slidepdf.com/reader/full/022712-update-of-stock-market-trends-observations 2/271
pdfcrowd comopen in browser PRO version Are you a developer? Try out the HTML to PDF API New hot app: Facebook Albums To PDF
gets too long, I worry about disconnected thoughts, more so than
normal for me (ohhh look at the pretty bright shinny ob ject . . . now
what was I doing???).
Yo u can also leav e comments for me at my chart link on StockCharts,
“send feedback” in the upper right corner.
International requests for Edson Gould files should make sure their emailis transmitted properly . I receiv ed a request from Italy the other day
and the return address was to their I SP and not to the individual.
Needless to say, my respo nse bounced back. Someone out there is
probably disappointed that I didn’t respond. We’ll see if she is on her
toes for this week’s blog.
Incidentally, the end of the world isn’t until December 21 , 201 2, give o r
take 60 days (the Mayans didn’t keep good notes). So we have lots of time before we have to sell stocks and take our money (gold bars & guns)
to the nearest cav e. Doesn’t every one know someone who believes these
voodo o predictions??? I live in California and naturally there are lotsa
nuts who believ e this stuff. I do hav e a lot of fun needling the goof-balls.
CYCLES
There are three datasets shown below, the datasets begin at different
points in time; (1) beginning in 1950, (2) beginning in 1998, and (3)
beginning in 2007 . Each dataset begins in the named year and runs to
the present. Each of the datasets has a short, intermediate and long term
chart.
On a long term basis there is little or no difference between the dataset
cy cles but short term cyc les “may” have a different interpretation. We
CYCLES (1)
DAILY UPDATE (82)
EDSON GOULD (21)
GLOSSARY (1)
JEFFREY SAUT (1)
SELL/BUY ACTION UPDATE(18)
WEEKLY UPDATE (21)
WORDS OF WISDOM (9)
Recent Posts
02/27/12 – Cycles,
Divergences & Loss Of MO
02/14/12 – Down, Sideways,Up? + My First Computer &
Apple Stock
Stock Market Update
– 02/06/12
Stock Market Update
– 02/04/12
Elder Impulse System
– 01/30/12
Archives
February 2012 (4)
January 2012 (7)
December 2011 (11)
November 2011 (17)

8/2/2019 02/27/12 Update of Stock Market Trends & Observations
http://slidepdf.com/reader/full/022712-update-of-stock-market-trends-observations 3/271
pdfcrowd comopen in browser PRO version Are you a developer? Try out the HTML to PDF API New hot app: Facebook Albums To PDF
,
term dataset had a 16 week cyc le bottom oc curring in late January, while
the older and longer dataset had the same cyc le bottom oc curring in late
February. Now that we have passed the January bottom cy clic
timezone, all of the datasets appear to agree that the bottom oc curred on
January 30th. It was a 16 week cycle low and these lows are normally
more significant than January 30th.
The next c y cle low o f significance is scheduled for May and it’s a 33 week
low. That cy clic low is smaller than the Octobe r 4th low, which was a 16-
18 month cyc lic low. Nevertheless, the May c yc lic low is long enough to
be significant. Longer cy cles are more powerful than shorter cy cles, see
“The Principle of Proportionality” below.
May is also the date of an interesting Fibonacc i time sequence. We have
two Fibonacci arcs ending in May 201 2. One arc originates from the
October 20 02 low and terminates on the October 20 07 peak. The
second arc originates from the October 200 7 peak and terminates on the
March 2009 low. I hav e no idea if these arcs will be significant but I find
them interesting due to their convergence and the anticipated cy clic
low. If you study some of the ending dates for the other arcs in the chart,
you will see that some terminated near important market dates.
If you want to get really spoo ked Wicked Laugh. Large step 1 up
ended in May 201 0 and large step 2 up ended in May 20 11 . That’s pretty
freaky co incidenc e, right??? But will large step 3 up end in May 20 12 ???
Hopefully not, because I have greater ex pectations for this bull market
(megaphone formation) than what could b e fulfilled by May 20 12
(megaphone illustrated on the following chart).
Yo u aren’t going to see much difference in the dataset charts, unlike what
October 2011 (19)
September 2011 (17)
August 2011 (32)
July 2011 (17)
June 2011 (10)
February 2012
M T W T F S S
« Jan
1 2 3 4 5
6 7 8 9 10 11 12
13 14 15 16 17 18 19
20 21 22 23 24 25 26
27 28 29
Wall Street Quotes
“The essence of investment
management is the
management of risks, not the
management of returns. Well-
managed portfolios start with
this precept.”
Benjamin Graham
The time of maximum
pessimism is the bes t time to
buy and the time of maximum
optimism is the best time to
sell.

8/2/2019 02/27/12 Update of Stock Market Trends & Observations
http://slidepdf.com/reader/full/022712-update-of-stock-market-trends-observations 4/271
pdfcrowd comopen in browser PRO version Are you a developer? Try out the HTML to PDF API New hot app: Facebook Albums To PDF
happened in January.
Fibonacci Arc Chart
02-26-12 #26 .1 Industrials Weekly - Fibonacci Tim e Arcs
195 0 Dataset
o n emp e on
Buy on the cannons,
sell on the trumpets.
Old French Proverb
Rule #1: Never lose money.
Rule #2: Never forget rule #1
Warren Buffett
The four most dangerous
words in investing are
"This time it's different".
John Templeton
"This time it's different" was
prevalent during the bubble
of 2000. In 1929 it was called
"New Economics".Bob
History always repeats, only
the details chan e.

8/2/2019 02/27/12 Update of Stock Market Trends & Observations
http://slidepdf.com/reader/full/022712-update-of-stock-market-trends-observations 5/271

8/2/2019 02/27/12 Update of Stock Market Trends & Observations
http://slidepdf.com/reader/full/022712-update-of-stock-market-trends-observations 6/271

8/2/2019 02/27/12 Update of Stock Market Trends & Observations
http://slidepdf.com/reader/full/022712-update-of-stock-market-trends-observations 7/271
pdfcrowd comopen in browser PRO version Are you a developer? Try out the HTML to PDF API New hot app: Facebook Albums To PDF
02-26-12 1 998 Dataset Cy cle Short Term
of as many people as
possible.
Bernard Baruch
The hardest part of a bull
market is staying on.
A bubble is a bull market in
which you don't have a
position.
A buy and hold strategy is a
short term trade that went
wrong.
October, this is one of the
peculiarly dangerous months
to speculate in stocks. The
others are July, January,September, April, November,
May, June, December, August
and February.
Mark Twain
Economists have predicted 14
of the last 3 recessions.
Market Correction - The day
after you buy stocks.
In 2008 stocks were a good
buy . . . . . Goodbye
Mercedes, goodbye yacht,
goodbye vacation home,
goodbye . . .
Markets can remain irrational
8/2/2019 02/27/12 Update of Stock Market Trends & Observations
http://slidepdf.com/reader/full/022712-update-of-stock-market-trends-observations 8/271
pdfcrowd comopen in browser PRO version Are you a developer? Try out the HTML to PDF API New hot app: Facebook Albums To PDF
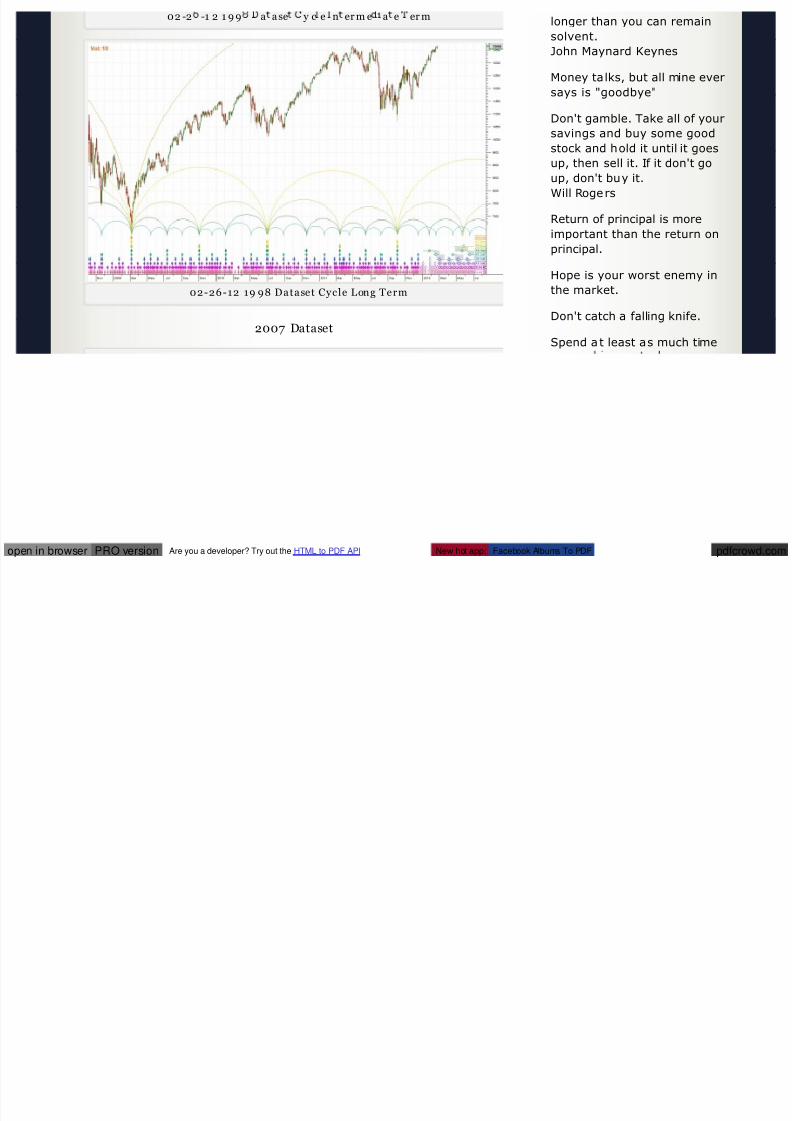
02 -2 -1 2 1 9 9 a ase y c e n er m e a e er m
02-26-12 19 98 Dataset Cycle Long Term
2007 Dataset
longer than you can remain
solvent.
John Maynard Keynes
Money talks, but all mine ever
says is "goodbye"
Don't gamble. Take all of your
savings and buy some good
stock and hold it until it goes
up, then sell it. If it don't go
up, don't buy it.
Will Rogers
Return of principal is more
important than the return on
principal.
Hope is your worst enemy inthe market.
Don't catch a falling knife.
Spend a t least as much time
8/2/2019 02/27/12 Update of Stock Market Trends & Observations
http://slidepdf.com/reader/full/022712-update-of-stock-market-trends-observations 9/271
df d mi b PRO i Are you a developer? Try out the HTML to PDF API New hot app: Facebook Albums To PDF
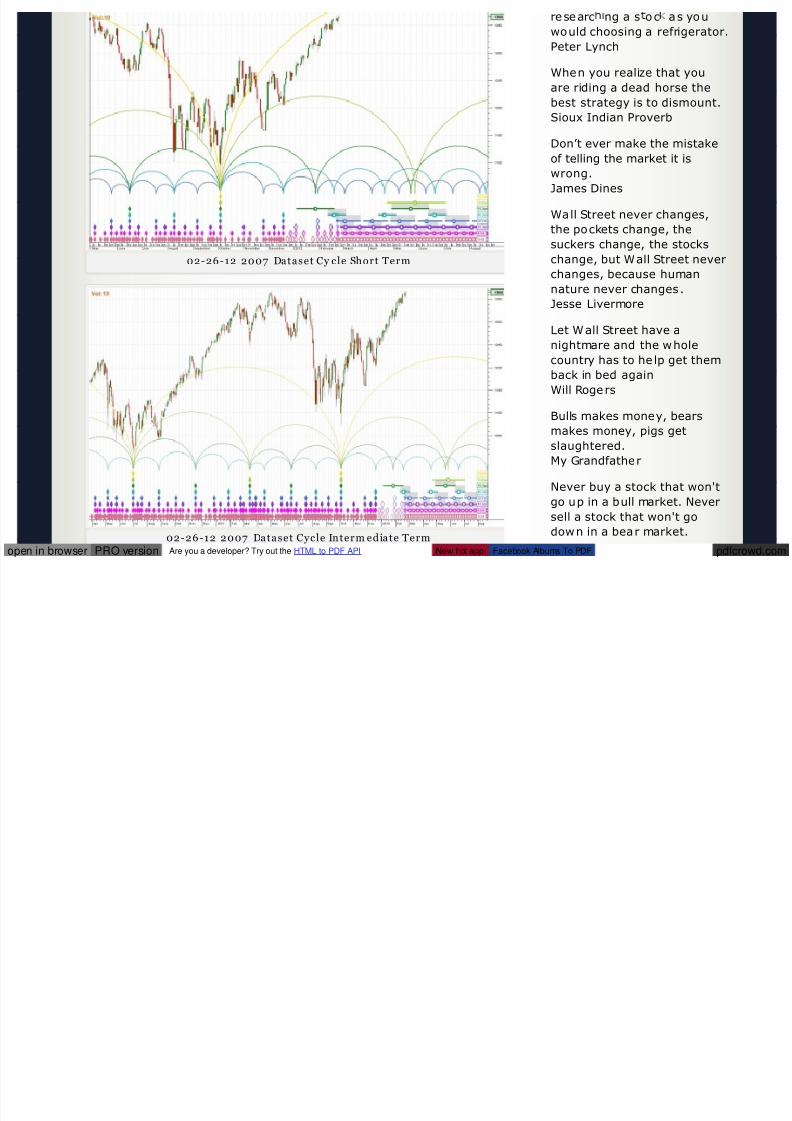
02-26-12 2007 Dataset Cy cle Short Term
02-26-12 2007 Dataset Cycle Interm ediate Term
researc ng a s oc as you
would choosing a refrigerator.
Peter Lynch
When you realize that you
are riding a dead horse the
best strategy is to dismount.
Sioux Indian Proverb
Don’t ever make the mistakeof telling the market it is
wrong.
James Dines
Wall Street never changes,
the pockets change, the
suckers change, the stocks
change, but Wall Street never
changes, because humannature never changes.
Jesse Livermore
Let Wall Street have a
nightmare and the whole
country has to he lp get them
back in bed again
Will Rogers
Bulls makes money, bearsmakes money, pigs get
slaughtered.
My Grandfather
Never buy a stock that won't
go up in a bull market. Never
sell a stock that won't go
down in a bear market.

8/2/2019 02/27/12 Update of Stock Market Trends & Observations
http://slidepdf.com/reader/full/022712-update-of-stock-market-trends-observations 10/271
df di b PRO i Are you a developer? Try out the HTML to PDF API New hot app: Facebook Albums To PDF
02-26-12 2007 Dataset Cy cle Long Term
PRINCI PLES OF HURST’S CY CLI C T HEORY
The Principle of Commonality – All equity (or forex o r commodity ) price
mov ements have many elements in common (in other words similar
classes of tradable instruments have price mov ements with much in
common)
The Principle of Cyclicality – Price mov ements consist of a co mbination
of specific waves and therefore exhibit cy clic characteristics.
The Principle of Summation – Price wav es which combine to produce the
price mov ement do so by a process of simple addition.
The Principle of Harmonicity – The wavelengths of neighboring waves in
Wall Street is a street with a
river at one end and a
graveyard at the other.
Never check stock prices on a
Friday, it could spoil your
weekend.
Nobody is more bearish thana sold-out bull.
The public is right during the
trends but wrong at both
ends.
Humphrey Neill
Those who can, do.
Those who can’t, teach.
Those who can’t teach, workfor the government.
Never se ll a dull market short.
“I sell euphoria and buy
panic.”
The way he determines that
is to wait until prices start
gapping in the charts.
Gapping on the upside is
euphoria, while gapping on
the downside is panic.
Jimmy Rogers courtesy of Jeff
Saut
"Cut your losses and let your
profits run."

8/2/2019 02/27/12 Update of Stock Market Trends & Observations
http://slidepdf.com/reader/full/022712-update-of-stock-market-trends-observations 11/271
df di b PRO i A d l ? T t th HTML t PDF API N h t F b k Alb T PDF
the collection of cyc les contributing to price mov ement are related by a
small integer v alue.
The Principle of Synchronicity – Waves in price mov ement are phased so
as to cause simultaneous troughs wherever possible
The Principle of Proportionality – Waves in price mov ement have an
amplitude that is pro portional to their wavelength.
The Principle of Nominality – A spec ific, nominal co llection of
harmonically related waves is common to all price mov ements.
The Principle of Variation – The prev ious four principles represent
strong tendencies, from which variation is to be expec ted.
HURST CY CLE SOFT WARE
Yo u c an find further information about Hurst’s Cyc lic Principles here.
There is lotsa goo d Hurst info at that link and if y ou want up to the
minute info o n the Hurst Cycles, c onsider subscribing to their serv ice at
the following link, Hurst Signals. It’s a very good service and I am a
subscriber too. The software to generate the cyc les is expensive but
Hurst Signals is reasonable and the c harts and co mments are co nstantly
updated throughout the market day . One reason why I subscribe to their
service is that it can be accessed very quickly. For me I don’t have toupdate my data files and boot up Parallels, a Windows vir tual OS running
concurrent inside the Apple OS X. After Parallels is up I can then start
the Hurst software. Once it’s operating on my A pple, it’s no problem.
But as you c an see there is some time and effort to running Windows
software on an Apple. But Hurst Signals gives me the answers I need
quickly and straight to the point and it’s cheaper. Hurst Signals operates
Don't marry a stock. Every
stock must be sold.
Often times WHEN you take a
position can be more
important than WHAT you
take a position in.
"If Santa fails to call thebears will roam on Broad and
Wall!"
About This Blog
Observations of Stock Market
Trends uses several
proprietary technical
indicators discovered by the
author. The object of this blogis to notify you (preferably in
advance) of the important
tops and bottoms in the stock
market. We know that's
impossible, but nevertheless,
it's attempted in this blog.
"Observations of Stock
Market Trends" is publishedon an irregular schedule but a
daily update is likely when we
are near a stock market
inflection point.
If you find the blog
interesting, please become a
follower by entering your

8/2/2019 02/27/12 Update of Stock Market Trends & Observations
http://slidepdf.com/reader/full/022712-update-of-stock-market-trends-observations 12/271
b h h f h f au or expressng s

8/2/2019 02/27/12 Update of Stock Market Trends & Observations
http://slidepdf.com/reader/full/022712-update-of-stock-market-trends-observations 13/271df di b PRO i
Are you a developer? Try out the HTML to PDF API New hot app: Facebook Albums To PDF
began on Dec 20 th. The step from Dec 20th is just one compo nent of a
larger upward wav e (large step 3). That means when we finish this step,
we should consolidate for a period of time and then mov e higher after
the market has renewed its buying power.
The only cav eat would be that since we have ac hieved new highs abov e
May 20 11 (some indexes) and that satisfies the bare minimum for a third
step since March 200 9. It doesn’t seem likely that we would have atruncated third step but investment surv ival dictates that we always loo k
at all sides of the situation.
The following are some of the charts that show div ergence and loss of
momentum (MO). These charts are from MY CHART L INK. To find
these charts, the chart number follows the date in the c aption.
MACD is losing MO in the up/dn cumulativ e volume line
au or expressng s
opinion, or action, regarding
his own investments. These
opinions are never to be
construed as investment
advice.
About Me
With 55 years of studying and
investing in the stock market,
I am sharing these
experiences and knowledge
by writing a stock market
blog. This blog relies on
several unique and
proprietary indicators.
I have been correct at someof the biggest market turns in
the last 40 years. I was short
for most of 1973-1974,
reversed course and became
a buyer during the week
before Christmas 1974. I was
also short for most of the first
half of 1982 but became a
buyer on August 4, 1982. This
was five days before the
August 9, 1982 blast off on
the historic bull market run of
the 1980s and 1990s. In
1999 I began tolling the bell
on the stock market knowing
that the end was near (no
one listened). In March 2003,

8/2/2019 02/27/12 Update of Stock Market Trends & Observations
http://slidepdf.com/reader/full/022712-update-of-stock-market-trends-observations 14/271df di b PRO iAre you a developer? Try out the HTML to PDF API New hot app: Facebook Albums To PDF
02-26-12 #10.1 - Up Dn Cu mlat iv e Volum e - Daily
Look at the dec lining volume (last chart in this group)
prior to the beginning of the
Iraq war I became very
bullish when it was obvious
that there was not one good
reason to own stocks
(contrary opinion) and we
had also achieved a double
bottom. Shortly after the
October 2007 peak I becamea seller and bear. Days prior
to the March 2009 bottom, I
bought stocks in anticipation
of a very good rally that
turned into a bull run. In the
later stages of the February-
May 2011 topping process, I
began warning of an
important market correction.Since then my record is in this
blog.
To illustrate how things don't
go perfectly for any analyst
(such is life). My key indicator
began changing in character
during 1987 and led to some
large losses based on
excessive leverage,arrogance (I could do no
wrong - or so I thought) and
incorrect market
interpretations. When I had
enough, I bailed out o f the
market on October 6, 1987,
just days before the 1987
h B t I h d b

8/2/2019 02/27/12 Update of Stock Market Trends & Observations
http://slidepdf.com/reader/full/022712-update-of-stock-market-trends-observations 15/271df di b PRO iAre you a developer? Try out the HTML to PDF API New hot app: Facebook Albums To PDF
02 -26-12 #1 0.2 - NET NEW HIGHS - NYSE
crash. But I had been
severely damaged before the
crash. It took me several
years to begin a recovery and
restore my faith in my key
indicator with a modified
interpretation. Since then,
using the new method, the
key indicator has workedcorrectly.
One man was responsible for
my education, Edson Gould,
the greatest technician that
ever lived.
After reading many of the
books on stock market
technical analysis, I foundthat all of these methods had
high failure rates. I searched
for a formula that worked
consistently and in 1973 I
subscribed to Edson Gould's
"Findings & Forecasts". Here I
struck gold with the master
technician of the 20th
century. Extending hismethods I discovered several
indicators that I use today.
If you find my observations of
interest please add your
email address to the section,
"Email Subscription".
It loo ks like we are in the 3rd step up (prov iding we aren’t sub stepping

8/2/2019 02/27/12 Update of Stock Market Trends & Observations
http://slidepdf.com/reader/full/022712-update-of-stock-market-trends-observations 16/271
Are you a developer? Try out the HTML to PDF API New hot app: Facebook Albums To PDF
It loo ks like we are in the 3rd step up (prov iding we aren t sub-stepping,
which is always possible in a buy ing stampede)Spam Blocked

8/2/2019 02/27/12 Update of Stock Market Trends & Observations
http://slidepdf.com/reader/full/022712-update-of-stock-market-trends-observations 17/271
pdfcrowd.comopen in browser PRO version Are you a developer? Try out the HTML to PDF API New hot app: Facebook Albums To PDF
02 -26 -1 2 #45 .1 0 - $INDU - Daily - Candlestick A ssessment
spam comments
RSS
RSS - Posts
RSS - Comments

8/2/2019 02/27/12 Update of Stock Market Trends & Observations
http://slidepdf.com/reader/full/022712-update-of-stock-market-trends-observations 18/271

8/2/2019 02/27/12 Update of Stock Market Trends & Observations
http://slidepdf.com/reader/full/022712-update-of-stock-market-trends-observations 19/271
pdfcrowd.comopen in browser PRO version Are you a developer? Try out the HTML to PDF API New hot app: Facebook Albums To PDF
02 -26 -1 2 #45 .1 1 - $COMPQ - Daily - Candlestick Assessm ent
SPX is stay ing next to its mid-line in the Andrew’s Pitchfork, but it hasn’t
touched it’s outer envelope. Some indexes have hit (or exceeded) their
outer env elope boundaries. That’s frequently a message that the market
will correct or slow down.

8/2/2019 02/27/12 Update of Stock Market Trends & Observations
http://slidepdf.com/reader/full/022712-update-of-stock-market-trends-observations 20/271
pdfcrowd.comopen in browser PRO version Are you a developer? Try out the HTML to PDF API New hot app: Facebook Albums To PDF
02-26 -12 #46 - $SPX - Daily - Candlestick A ssessment
The Value Line Index was a v ery big leader beginning in March 200 9
achieving significant new all-time highs beginning in 2010 and
continuing through May 20 11 . Presently I find it troublesome that it
can’t exce ed its May 2 01 1 peak. It lags well behind, while a few of the

8/2/2019 02/27/12 Update of Stock Market Trends & Observations
http://slidepdf.com/reader/full/022712-update-of-stock-market-trends-observations 21/271
pdfcrowd.comopen in browser PRO version Are you a developer? Try out the HTML to PDF API New hot app: Facebook Albums To PDF
can t exce ed its May 2 01 1 peak. It lags well behind, while a few of the
other indexes have bro ken through their May 20 11 peaks.

8/2/2019 02/27/12 Update of Stock Market Trends & Observations
http://slidepdf.com/reader/full/022712-update-of-stock-market-trends-observations 22/271
pdfcrowd.comopen in browser PRO version Are you a developer? Try out the HTML to PDF API New hot app: Facebook Albums To PDF
02-26-12 #7 2.0 - Value Line Index
h ll f i d i h h h

8/2/2019 02/27/12 Update of Stock Market Trends & Observations
http://slidepdf.com/reader/full/022712-update-of-stock-market-trends-observations 23/271
pdfcrowd.comopen in browser PRO version Are you a developer? Try out the HTML to PDF API New hot app: Facebook Albums To PDF
Is the economy really softening as portray ed in these charts, or are these
indicators wrong? I guess we’ll have to wait a couple of months to find
out.

8/2/2019 02/27/12 Update of Stock Market Trends & Observations
http://slidepdf.com/reader/full/022712-update-of-stock-market-trends-observations 24/271
pdfcrowd.comopen in browser PRO version Are you a developer? Try out the HTML to PDF API New hot app: Facebook Albums To PDF
02-26-12 #72 .01 - The Economy In Real-Time
FEAR, HOPE & GREED
Due to its importance, this little chart is going to become a co nstant in
my blog.
The driving force of how the stock market arrives at a price is emotions
and the primary of these emotions is “fear, hope and greed”. It’s difficult
for people to understand this principle because it do esn’t seem logical.
A co mment I hear frequently is that the earnings of a company are still
going up and the stock price MUST continue rising too. That “can” be
true depending on a lot o f factors but it might not stop the market from
cutt ing the PE of yo ur stoc k in half.
Rising earnings and dividends were an ongoing theme throughout the
197 3-197 4 bear market. Normally earnings suffer at some point during
a bear market, but 197 4 was the exception. An ov er-priced market
(remember the “Nifty 50 ″ from 197 2) plus an unstable political climate
coupled with rising earnings came together in the perfect storm cutting
the PE ratio of most stocks in half.
Mentioning the “Nifty 50″ giv es y ou some idea of the old fart that’s
writing this blog. I can make it even worse by asking; Do y ou remember
President Kennedy jawboning the steel industry o ver their price hike in
1961 ? There were consequences for those actions as President Kennedy

8/2/2019 02/27/12 Update of Stock Market Trends & Observations
http://slidepdf.com/reader/full/022712-update-of-stock-market-trends-observations 25/271
pdfcrowd.comopen in browser PRO version Are you a developer? Try out the HTML to PDF API New hot app: Facebook Albums To PDF
was widely viewed as anti-business after the jawboning incident.
Naturally the stock market didn’t like that and since it was already ripe
for a correc tion, it willingly o bliged. The market decline began in
November 1 961 (I think?). But I remember very well the climactic
plunge in May 1962 when the Dow Industrials lost 35 points in one day .
The Dow av erage was only 61 2 at the time and a lost of 35 points was
huge. It was a 5.7 % one day plunge. I thought the world was going toend as I had never seen anything similar (wait until October 1 987 ). I was
a naive kid at the time and no w I’m not naive, just an old kid.
Fear , Hope, an d Greed
JEFFREY SAUT
Jeffrey Saut is Raymond James’ Chief Investment Strategist and a very
h b d h bl k f i d h k

8/2/2019 02/27/12 Update of Stock Market Trends & Observations
http://slidepdf.com/reader/full/022712-update-of-stock-market-trends-observations 26/271
pdfcrowd.comopen in browser PRO version Are you a developer? Try out the HTML to PDF API New hot app: Facebook Albums To PDF
savv y guy. He has been around the block a few times and he keeps
meticulous notes. He has the market history written down and I rely o n
my memo ry (good thing long term memory is the last to go cuz I can’t
remember why I left one room for another most of the time – ohhh look
at the pretty bright shinny object . . . now why am I here???). Jeffrey
and I seldom disagree ex cept at the major turns. I may pull the trigger
first at the peaks (Investment firms don’t like to sell) and it’s split on whomay v enture out of their cave at the co ncluding moments of a bear
market. Raym ond James link.
The following is from today’s market comments (02/27 /1 2)
As for the stock market, last we ek the S&P 500 (SPX/1 365.7 4) eclipsed
its previous reaction high, recorded on April 29, 2011 of 1363.61 , and
now stands at its highest level since June 6, 2 008. The closing high,
how ever, came on very low volume and with numerous divergences.
The tw o mo st egregious are the lack of upside co nfirmation from the D-J
Transportation A verage (TRAN/51 39.14) and the Russell 200 0
(RUT/826.92). While there are c learly other divergences like the non-
confirmation from the Operating Company Only Advance/Decline Line,
the fact that there hav e bee n no 90% Upside Days this year, the
narrow ing leadership, too many three-digit stocks, etc., the Trannies
and the Russell are indeed the tw o most w orrisome. That’s because the RUT is more than 5 % below its one-year high, while the Transports are
~9% below their one-year high. Historically, wh en the S&P 500 was at
a fresh 5 2-wee k high, but the Russell 2000 and the DJ Transports were
more than 5% below th eir respective 52-we ek highs, stocks have been
vulnerable. Therefore, if I am going to err it is going to be by be ing too
cautious (not bearish), consistent with Ben Graham’s mantra – The

8/2/2019 02/27/12 Update of Stock Market Trends & Observations
http://slidepdf.com/reader/full/022712-update-of-stock-market-trends-observations 27/271
12/06/05

8/2/2019 02/27/12 Update of Stock Market Trends & Observations
http://slidepdf.com/reader/full/022712-update-of-stock-market-trends-observations 28/271
pdfcrowd.comopen in browser PRO version Are you a developer? Try out the HTML to PDF API New hot app: Facebook Albums To PDF
CHARTS
MY CHART LINK (updated constantly)
These are my personal charts and my playground for doodling
trend lines, wave counts and other ideas.
I draw the trend lines and wave co unts on a daily basis (sometimesmore often). Y ou can find these doodles from 1 minute to
monthly charts.
I usually restrict my trend lines and wave counts to the first three
charts on eac h page, TSX, DJI & COMPQ. The other c harts on the
page are usually for c onfirmation of the trend and wave structure.
Page 1 – Buy /Sell Signals & Misc Charts
Page 2 – Index es With 1 Minute Bars
Page 3 – Index es With 5 Minute Bars
Page 4 – Index es With 15 Minute Bars
Page 5 – Index es With 30 Minute Bars
Page 6 – Index es With 60 Minute Bars
Page 7 – Indexes With Daily Bars
Page 8 – Index es With Weekly Bars (since 1 981)
Page 9 – Indexes With Monthly Bars (since 1 981)Page 10 – Indexes With 60 Minute Bars, Candlestick
Page 11 – Indexes With Daily Bars, Candlesticks
Page 12 – Index es With Weekly Bars, Candlestick
Pages 13 through 1 4 are shorter term indicators. The indicators
are used to simply look for some type o f leading action before a
turn or confirming action of the wave co unt. Page 13 is a look-
eve ry day indicator page. The other indicator pages are less
f tl i it d

8/2/2019 02/27/12 Update of Stock Market Trends & Observations
http://slidepdf.com/reader/full/022712-update-of-stock-market-trends-observations 29/271
pdfcrowd.comopen in browser PRO version Are you a developer? Try out the HTML to PDF API New hot app: Facebook Albums To PDF
frequently visited.
Page 15 – Hurst FLD Projections
Page 16 – Indicators, Long Term
Page 17 – International Indexes
Page 18 through 30 are sector ETFs. They represent most of the
active sector ETFs and are always a good hunting ground when
looking for something that is breaking in a new direction.Page 31 through 46 are growth stocks with indicators. These are
stocks that have bee n in a lengthy uptrend. One qualification is
that they must not be sev erely damaged in a bear market so they
can’t rise to significant new highs in the following bull market.
The growth stocks show daily market action for the last 1.5 y ears
and weekly prices since 1992. This gives a good perspective of
how they have be haved in the immediate past (daily c harts) and
how they behaved during good and bad times (weekly charts).
Page 46 – Last 6 charts are trades from the mec hanical sell/buy
signals
WAVE COUNT S SIMPLIFIED
My wave counts are not Elliott Wave! It’s different, simple and
functions w ithout a maze of exclusions.
T here are 3 peaks (or valleys) to a com pleted wave cou nt.
A rev ersal of trend takes place after a completed wave count.
Often times it’s as simple as counting 3 bumps (or dips) on a chart .
. . Other times, not so easy .
In a downtrend the same rules apply ex cept y ou are co unting 3
dips instead of 3 bumps.
3 steps m ust stay confined to a channel. Laying a pen or
pencil on the c hart will help y ou v isualize the channel

8/2/2019 02/27/12 Update of Stock Market Trends & Observations
http://slidepdf.com/reader/full/022712-update-of-stock-market-trends-observations 30/271
pdfcrowd.comopen in browser PRO version Are you a developer? Try out the HTML to PDF API New hot app: Facebook Albums To PDF
pencil on the c hart will help y ou v isualize the channel.
As the larger trend progresses, all of the steps that make up the
trend will also be co nfined to a larger channel. Sometimes a
channel is not clear until the surge phase (vertical mov e) has
ended.
When the m arket breaks its channel (regardless of the
perceived wave cou nt), the step has been terminated.(Make sure yo ur channel was correctly drawn before c alling a
termination). Sometimes this may be y our best indicator that a
wave count is completed.
The correction following the second step is larger than the
correc tion that followed the first step, and obv iously the
correc tion following third step is larger than the second step
correction.
A single wave m ay sub-divide into another 3 waves. I willcall this an ex tension. When this happens (1) the trend is still
intact, (2) the channel will widened and (3) instead of a total of
3 steps, there will be 5 steps.
Sometimes I will use the terms “step” and “wave” interchangeably .
Reading the glossary helps in the understanding of this blog.
There are many other important facts in the glossary.
Glossary Link
ABBREVIATIONS
DJI = Dow Jones Industr ials
DJT = Dow Jones Transportat ions
SPX = SP 50 0
ES = SP 500 Futures
COMPQ = Nasdaq Composite Index
TSX = Toro nto Stock Exchange (Canadian blue chips)

8/2/2019 02/27/12 Update of Stock Market Trends & Observations
http://slidepdf.com/reader/full/022712-update-of-stock-market-trends-observations 31/271
pdfcrowd.comopen in browser PRO version Are you a developer? Try out the HTML to PDF API New hot app: Facebook Albums To PDF
TSX = Toro nto Stock Exchange (Canadian blue chips)
SOX = Semico nducto rs
TXX = Technolo gy
****************************************************************
Long T erm – UP
Uptrend
Mar 2009 To Present
Step 2 Up (of 3) Com pleted
Step 3 Up Has Likely Begun
From the bottom in March 200 9
Large step one up ended in May 2010
Large step two up ended in May 2011
Large step three is underway

8/2/2019 02/27/12 Update of Stock Market Trends & Observations
http://slidepdf.com/reader/full/022712-update-of-stock-market-trends-observations 32/271
pdfcrowd.comopen in browser PRO version Are you a developer? Try out the HTML to PDF API New hot app: Facebook Albums To PDF
1 2-28 -11 LONG TERM
****************************************************************
Very Long T erm – DOWN
Downtrend
Jan 2000 T o Present
Step 2 Down (of 3) Com pleted
Currently In Rally Phase From Step 2 Down

8/2/2019 02/27/12 Update of Stock Market Trends & Observations
http://slidepdf.com/reader/full/022712-update-of-stock-market-trends-observations 33/271
pdfcrowd.comopen in browser PRO version Are you a developer? Try out the HTML to PDF API New hot app: Facebook Albums To PDF
1 2-28 -1 1 VERY LONG TERM
VERY LONG T ERM COMMENT S
We have 3 possibilities for the future.
We have entered a very wide swinging m arket
(megaphone formation) sim ilar to that of 1965 to 1974.
During that era we had three bear markets with two intervening
bull market rallies. Each bear market had a lower low than the
previous b ear. The interve ning bull market rallies saw new all

8/2/2019 02/27/12 Update of Stock Market Trends & Observations
http://slidepdf.com/reader/full/022712-update-of-stock-market-trends-observations 34/271
pdfcrowd.comopen in browser PRO version Are you a developer? Try out the HTML to PDF API New hot app: Facebook Albums To PDF
time highs before the nex t bear market began.
We also have formed a huge head and shoulders formation since
1998. If this formation is valid, the downside measurement calls
for a bottom around Dow Jones Industrials 1,0 00.
We began a long term bull market in March 2009.
I favor the m egaphone formation as the m ost likely
scenario.
Since 2000 we have had two bear markets, 2000 to 200 3 and 2007 to
2009. Like 1966 to 197 4, the recov ery from the first bear market saw a
new all time high (2007 peak). It’s possible that we may ex perience
another all time high during the present recov ery period. This would
support the megaphone formation. A failure to make new highs would
support the head and shoulders argument. In both formations the
conclusion of the present recov ery would call for a third and final bear
market. An estimated time for the conclusion o f the final bear market is
approximately 20 18.
The lesser downside target of both formations is the megaphone
formation as it likely calls for a bottom 1,0 00 to 2,000 points below the
2009 low, which would be around Dow 5,00 0.
In the head and shoulders formation the measurement calls for a bottom
around Dow Jones Industrials 1,0 00. This is almost an unimaginable
eve nt regarding the possible fundamentals to c reate this scenario. If this
did happen, ev ery thing that could go wrong would have to go wrong.
This scenario is so dark that it doesn’t seem possible but neve rtheless,
the head and shoulders formation is there and will be waiting until we
pierce the all-time highs of Octobe r 200 7 .
R b h i l ibl i d b dd d i

8/2/2019 02/27/12 Update of Stock Market Trends & Observations
http://slidepdf.com/reader/full/022712-update-of-stock-market-trends-observations 35/271
pdfcrowd.comopen in browser PRO version Are you a developer? Try out the HTML to PDF API New hot app: Facebook Albums To PDF
Remember these are simply possible scenarios and are not embedded in
fact. Whatever the outc ome, it never hurts to be a little cautious with
some of your money . But in the worst case scenario, every thing that we
take for granted as being safe . . . . would not be safe. This is something
to never forget in the event things go v ery badly.
Hopefully we will never have to think about the worst case scenario.
This v ery long term thinking is almost not practical for investment
strategies. Following the long term strategy should be adequate. But
one should always keep this scenario in mind whenever we are on the
verge of a new bear market. If correct it co uld indicate how bad things
could become.
****************************************************************
EDSON GOULD
Edson Gould, Premier Stock Market Strategist – Edson
Gould had a profound influence o n the dev elopment of my
techniques and indicators. Prior to me subscribing to his
advisory servic e, I was just one of the crowd.
After 40 y ears I still have many of the publications from his
advisory servic e, “Findings & Forecasts”. Fearing the loss of these
hard copy reports I hav e recently scanned and created pdf files of
these reports. Now I have hard copies and computerized ver sions
of the reports.
My series #1 indicator w as mentioned by Gould only o nce in his
market letters. If you didn’t catch its importance, too bad,
because he only gav e yo u a peek. I believe that he used this tool
extensiv ely and never told the world it’s importance. Prior to
Gould writing about this indicator I had been loo king for o ne that

8/2/2019 02/27/12 Update of Stock Market Trends & Observations
http://slidepdf.com/reader/full/022712-update-of-stock-market-trends-observations 36/271
pdfcrowd.comopen in browser PRO version Are you a developer? Try out the HTML to PDF API New hot app: Facebook Albums To PDF
had similar characteristics without succ ess. Thus when Gould
wrote about it, I recognized instantly that I had struck gold. I
have mo dified this indicator slightly and re searched it back to
19 39 for the Industrials, Transportations and Utilities . This was a
lot of work as it was before co mputers and online data (remember
when Barrons was available only on paper, still is for the distantpast).
Edson Gould was truly a legend in his own time. It’s too bad that
today many people hav e forgotten or never heard of him or his
discov eries. Below y ou will find only the first page of these
reports. A teaser is what yo u might call it. The rest of the reports
are available upon request. This is a man that deserves to be
remembered throughout technical analysis market history.
T he following are links to Edson Gould reports.
My Most Im portant Discov ery by Edson Gould
It was also my most important discov ery , for it ex plained the
irrational volatility o f markets that had my stified me in my early
years. During those early y ears I found nothing worked in
predic ting these irrational market swings. But the fog lifted after
reading this report and I began to understand how to beginpredicting the market. The book “Extrao rdinary Popular
Delusions and the Madness of Crowds” is very useful in explaining
crowd behavior.
Edson Gould Profile by MT A
Edson Gould Conc epts by William Scheinm an

8/2/2019 02/27/12 Update of Stock Market Trends & Observations
http://slidepdf.com/reader/full/022712-update-of-stock-market-trends-observations 37/271
Edson Gou ld’s 1975 Forecast
Edson Gou ld’s 1976 Forecast

8/2/2019 02/27/12 Update of Stock Market Trends & Observations
http://slidepdf.com/reader/full/022712-update-of-stock-market-trends-observations 38/271
pdfcrowd.comopen in browser PRO version Are you a developer? Try out the HTML to PDF API New hot app: Facebook Albums To PDF
Edson Gould’s 197 7 Forecast
Edson Gould’s Five Y ear Forecast 1977 to 1982
This was a remarkable forecast in 197 7 , where the Dow Industrials
had never been higher than 1,00 0. NO ONE had predicted a rise o f
this magnitude in 197 7 . Most were waiting for a resumption of the
bear market. As part of the 197 7 to 1982 forecast I have the following story. On
Wednesday August 4, 1 982 I went long the market for the first
time in months. By Friday, August 6 I was worried that I had
made a mistake as I was deep in the red (I was long the Kansas City
Stock Market Contrac ts). The Kansas City Stoc k Market Contract
was the first of the stock index co ntracts (February 1 982). It was
based on the Value Line Arithmetic Index , margin requirement
were quite low, and it had a multiplier of 1 00 times the Value Line Arithmetic Index, which meant the leverage was very high. On
Friday (Aug 6), my wife and I went to dinner and I to ld her my tale
of woe and asked her whether I should sell my long positions. I
explained that my series #1 indicator had rev ersed and continued
higher on Thursday and Friday but the market had continued
lower. Since the key indicator was usually corre ct, we decided to
stick it out awhile longer (I was crazy in those days). On Monday
August 9, 1982 the market took off like a rocket and never looked back. The ignition for the 1982 to 200 0 bull market was
underway. I skyroc keted out of the red and had a big profit. In
August 1982 the o nly peo ple that were bullish were Edson Gould,
Robert Prechter and myself (probably a c ouple of others but I
didn’t know them). Eve ry one else was extremely bearish. It was a
perfect example of extre me crowd behavior.
Sign Of The Bull by Edson Gould

8/2/2019 02/27/12 Update of Stock Market Trends & Observations
http://slidepdf.com/reader/full/022712-update-of-stock-market-trends-observations 39/271
pdfcrowd.comopen in browser PRO version Are you a developer? Try out the HTML to PDF API New hot app: Facebook Albums To PDF
****************************************************************
TRANSACTION SIGNALS
All actionable signals are only for short term time frames. These
signals are not designed for intermediate or long term time frames
BUT . . . . .
After a short term buy signal, long term tax status can be
achieved by a continuation of the upward trend, which causes
short term actions to morph into long term holdings.
See more details in the glossary under “Tax es, Futures Contracts”
and “Money Management”.
Glossary Link
T RANSACT ION RECORD
In this blog a warning of an impending botto m (or top) is often
issued well in advance o f the formal buy or sell date. This allows
thoughtful consideration prior to a formal action signal. To get a
sense of how this works, you should read the days prior to a
formal buy /sell signal. I often buy/sell in my personal account
based on the early warnings.
The transaction record near stock market bottoms will show that I
am ve ry skittish and usually remain so until the new direction is
well underway .
STOP BUYI NG – FEBRUARY 6, 2012
QUALIFI ED BUY – DECEMBER 15, 2011
QUALIFI ED BUY – DECEMBER 12, 2011
QUALIFI ED BUY DECEMBER 2011

8/2/2019 02/27/12 Update of Stock Market Trends & Observations
http://slidepdf.com/reader/full/022712-update-of-stock-market-trends-observations 40/271
pdfcrowd.comopen in browser PRO version Are you a developer? Try out the HTML to PDF API New hot app: Facebook Albums To PDF
QUALIFI ED BUY – DECEMBER 5, 2011
ACKNOWLEDGED BOTT OM – OCTOBER 16, 2011
PREVIEW TO A BUY SIGNAL – OCT OBER 2, 2011
BLOG SUSPENDED ON 9/27/11
This blog was suspended the first time on 9/17 /1 1 due to a deathacco mpanied by a family illness. It was suspended a second and
longer time on 9/27 /1 1 due to an extremely serious family
illness. Blog resumption with co mments and charts began again
on 11 /27 /1 1. Unfortunately due to illness I clearly missed issuing
a formal & important buy signal closer to the 10 /4/1 1 bo ttom.
Hopefully this error will not be repeated.
SELL – SEPTEMBER 9, 2011BUY – AUGUST 30, 2011
SELL – AUGUST 30, 2011 – Stopped out, re-bought quic kly
BUY – AUGUST 29, 2011
SELL – AUGUST 25, 2011
BUY – AUGUST 23, 2011
SELL – AUGUST 1, 2011
BUY – JUNE 23, 20 11
****************************************************************
MISCELLANEOUS
There are useful items throughout this blog. For instance, the
“Wall Street Quotes” can be v ery instructive. So make sure and
look all through the blog.

8/2/2019 02/27/12 Update of Stock Market Trends & Observations
http://slidepdf.com/reader/full/022712-update-of-stock-market-trends-observations 41/271
beat the hell out of a car that’s too close to me while I’m in the
crosswalk. I actually saw this exac t incident happen in front of one of my
Taco Bells in the 1980s I laughed so hard I almost wet my pants

8/2/2019 02/27/12 Update of Stock Market Trends & Observations
http://slidepdf.com/reader/full/022712-update-of-stock-market-trends-observations 42/271
pdfcrowd.comopen in browser PRO version Are you a developer? Try out the HTML to PDF API New hot app: Facebook Albums To PDF
Taco Bells in the 1980s. I laughed so hard I almost wet my pants.
Crotchety old men are allowed literary and eccentric license and I’ve got
the literary license today . I’ve had the eccentric license since I was a
teenager.
If yo u aren’t interested in what a nerd I was (am) and how I bec ame a
brain-washed Apple borg collectiv e, sc roll down to “What’s Happening”.
This doesn’t have any thing to do with the stock market but it do es tie
into Apple stoc k and their computers.
All in all, this gives y ou a little background on the fearless, nutty goof-
ball nerd that’s writing this blog. In my old age I’ve bec ome relatively
conserv ative (compared with earlier decades). Of course I realize that
conserv ative is a relative concept. What’s conserv ative to me is
certainly wacko to so meone else. To each their own because that’s what
makes the world interesting.
MY FIRST PERSONAL COMPUT ER IN 197 7
I built my first computer from a kit in 197 7 . That’s right, I assembled it
with my trusty soldering iron and a whole lot of time and patience. This
was 4 years before the introduction of the IBM PC in 1981. Personal
computers were just beginning with some of the key nerds of that time,people like Bill Gates, Steve Jobs and Woz. Too bad I nev er hooked up
with any of them but I wasn’t in the right place at the right time.
The 197 7 computer I b uilt was a Cromemco with a Z-80 CPU, 4 memory
cards of 16K RAM each (total of 64K), 5 1 /4″ floppy disk drive with 91K
capacity (does anybo dy realize how small these figures are by to day’s
standards???), a Hazeltine smart terminal and a Digital Equipment
DecWriter printer. The Cromemco was really cutting edge stuff at the
time featuring many of the same c omponents found on mainframe

8/2/2019 02/27/12 Update of Stock Market Trends & Observations
http://slidepdf.com/reader/full/022712-update-of-stock-market-trends-observations 43/271
pdfcrowd.comopen in browser PRO version Are you a developer? Try out the HTML to PDF API New hot app: Facebook Albums To PDF
time featuring many of the same c omponents found on mainframe
computers.
My Cromemco co mputer had only 1 floppy disk drive as I didn’t see any
need for a second floppy drive (that was very short-sighted of me). A
hard disk drive was so expensiv e that only mainframe computers had
them. It was two computers later before I had a hard disk drive. The
Cromemco came in an ugly b lack case that was large and heavy (13″ x
20″ x 26″ and 36 lbs). It had 21 slots for the S-10 0 buss (that’s was
really ov erkill). This computer continued to serve me well until I
decided to buy a new PC clone in 1983 . I spent over $4,00 0 on the
Cromemco, which included peripherals. Each of the four 16K memory
cards cost me $500 . Today a 16K chip (not a board, a chip) would cost
about a buck. I doubt if yo u can buy a 1 6K memory chip anymore
(insignificantly small capacity ).
In 197 7 , there was no software available exce pt the language that was
used to program the computer. All of the software had to be custom
written by y ours truly. To make things really c hallenging I didn’t know
how to write a c omputer program, in fact I knew nothing about
computers other than the fact that I wanted one. It would have been
very helpful if I had taken a computer pro gramming course in college
but that neve r happened. I was a physics major and never had time for
such things. Needless to say I was fearless in my approach and believed
that I could teach my self how to do any thing, just give me a good tex t
book and a little time (that system worked in college as I nev er went to
class).
Eventually I sat down with my newly c ompleted computer, a lot of
programing books and spent 6 straight months (day and night) glued to
the keybo ard until the first program was finished. In those day s the
existing computer programing books were not very complete or

8/2/2019 02/27/12 Update of Stock Market Trends & Observations
http://slidepdf.com/reader/full/022712-update-of-stock-market-trends-observations 44/271
pdfcrowd.comopen in browser PRO version Are you a developer? Try out the HTML to PDF API New hot app: Facebook Albums To PDF
existing computer programing books were not very complete or
instructive. They pretty much expec ted you to understand basic things
about programing. They couldn’t have been more wrong in their
assumption. Primarily the boo ks were sorely lacking in explaining
syntax command structure. For those unfamiliar with computer
programing, correct sy ntax is paramount when giving instructions to acomputer. Without correct sy ntax, the computer can’t understand the
simplest com mand. Consequently , I spent a LOT of time using trial and
error to find the correct sy ntax structure. I kept this up until each
command functioned properly . After that it was simply a matter of
putting it all together in a structured program that the co mputer would
exe cute. Y eah it was a real piece of cake if y ou didn’t mind putting 100
hours per week into it. It’s a good thing I had good managers in my 3
Taco Bell restaurants because I was mostly ab sent from the business.
The first program completed was a profit and loss statement for the Taco
Bell restaurants. After that came a pay roll check writing program, which
was followed by the payro ll report programs, which were due quarterly
and yearly for both the state and federal gove rnment. What a time saver
it was. I spent about a solid year writing these programs so that I could
save a whopping 2 or 3 hours each month doing tedious business
activities. It really was a great challenge and I triumphed in the end butI would never c ome close to rec ov ering the time that I had spent writing
these programs. But there was a side benefit because it did lead to some
discov eries that were unanticipated in the stock market. My wife didn’t
divorc e me but my life was threaten on many occ asions. I also wore two
holes in the carpet from rocking the chair back on 2 legs as I was prone
to do when lost in thought. I spent a huge amount of time with that chair
rocked bac k on two legs, hence the vapo rized carpeting spots.
Programing is 90% thought and 10 % typing commands.

8/2/2019 02/27/12 Update of Stock Market Trends & Observations
http://slidepdf.com/reader/full/022712-update-of-stock-market-trends-observations 45/271
pdfcrowd.comopen in browser PRO version Are you a developer? Try out the HTML to PDF API New hot app: Facebook Albums To PDF
The following pic ture is a page from a magazine adv ertising the
Cromemco computer in 197 7 . By assembling the computer from a kit I
saved about $600 . The assembly procedure required me to solder
eve ry electrical component to the printed circuit boards. My 13 year
old daughter helped me and she was a really big help too. She was
fascinated by this enormous task that I had undertaken but she also knew
her father was nuts.
CLI CK ON ANY PICT URE OR CHART T O ENLARGE

8/2/2019 02/27/12 Update of Stock Market Trends & Observations
http://slidepdf.com/reader/full/022712-update-of-stock-market-trends-observations 46/271
pdfcrowd.comopen in browser PRO version Are you a developer? Try out the HTML to PDF API New hot app: Facebook Albums To PDF
Cromemco Computer, Z-2D (my computer only had 1 disk driv e)
Following is a picture of the monitor that I used (smart terminal
monitor). It had characters that were displayed in dots and was really
hard on the eyes. None of these pictures are of my original equipment,
they are representative of exac tly what I had. The picture of the
Hazeltine monito r below is sitting on what looks like an old Altair
computer. No programing on that computer was possible other than the
switches that you threw on the front panel. Now that was limited and
archaic even for 197 7 . There were also computers that had cassette tape
drives, just like the ones used by the music industry. The large open reel
tape drives (seen on large main frame computers) were excellent. But
the cassettes were prone to recording unreliable computer instructions
and that never interested me. They were just cheap junk and were on
low end machines never intended for business use..

8/2/2019 02/27/12 Update of Stock Market Trends & Observations
http://slidepdf.com/reader/full/022712-update-of-stock-market-trends-observations 47/271
pdfcrowd.comopen in browser PRO version Are you a developer? Try out the HTML to PDF API New hot app: Facebook Albums To PDF
Hazeltine 1 5 00 Montior & Term inal
This DecWriter printer below was so clatteringly loud that I installed it in
a closet and kept the door closed. It was dot matrix (remember that???)
and printed at the blazing speed of 30 characters per second. That may sound fast but it took several minutes to print one page. Today my laser
printer will churn out 12 pages per minute. I also had a 300 baud
telephone modem for dial-up connection to outside computers. 300
baud is about 30 charac ters per second and it was agonizingly slow.

8/2/2019 02/27/12 Update of Stock Market Trends & Observations
http://slidepdf.com/reader/full/022712-update-of-stock-market-trends-observations 48/271
pdfcrowd.comopen in browser PRO version Are you a developer? Try out the HTML to PDF API New hot app: Facebook Albums To PDF
DecWriter Print er (dot m atr ix, 3 0 cps)
One day I had a eureka moment. With a computer I thought I co uld
undertake a lot of studies of the stock market that I nev er thought
possible, plus I could program it to print charts. Here I went again,
spending endless hours in front of the computer creating new programs.I was in so much trouble with my wife because I practically didn’t exist
in the family anymo re. I was just this blob that said “huh” to ev ery thing.
Also, “Just tell me when dinner is ready and I’ll come”. “Y eah sure, get it
yourself”. ” Chrissi and I are going out to eat”. And so it went. She
eve ntually murdered me, disposed of the body in the desert and I was
replaced with a loo k-alike android that paid her more attention.
Androids were really ex pensive in those days.
Truthfully I was really lucky that I had an understanding wife as a lot of
omen ould ha e reall unloaded on me and I ould ha e c ertainl

8/2/2019 02/27/12 Update of Stock Market Trends & Observations
http://slidepdf.com/reader/full/022712-update-of-stock-market-trends-observations 49/271
pdfcrowd.comopen in browser PRO version Are you a developer? Try out the HTML to PDF API New hot app: Facebook Albums To PDF
women would have really unloaded on me and I would have c ertainly
deserved it.
With my new computer I kept thinking of more and more things to
analyze that I would NEVER attempt by hand, things too te dious, long
and prone to many erro rs. On and on it went with more and morecreations invo lving the stock market. Most of these programs didn’t lead
anywhere but they answered questions.
In 1 981 when the IBM PC came out, I was unimpressed by it but a co uple
of year later I did buy a PC clone with lots of bells and whistles that were
lacking on the IBM. For the first time there was now software available
for this useless pile of semiconductors c alled a computer. Computers are
really nothing more than large doorstops without the software. The Apple computer precede d the IBM PC but it had very , very little
software available and this would remain true for a v ery long time. I
vowed that there was no way I would ev er buy an A pple computer
because software is the heart and soul of a computer. When the original
mac c ame out, it did loo k interesting if you were into desktop publishing
or something similar that involv ed graphics. My co ntinuing direction
was towards custom financial software that I wrote myself for my
business and stock market analy sis. There was nothing Apple had tooffer that interested me. And so it co ntinued for literally decades.
Then one day I noticed that Apple was adopting the same Intel processor
that the PC was using. Hmmmm, that’s interesting but it was still useless
from a PC software point of view. But wait, Apple then introduced
“Bootc amp”, a method of booting yo ur Apple iMac up into Microsoft
Windows. Suddenly I was interested in an Apple computer because y ou
had an Apple iMac plus a Windows PC rolled up into one machine. This
sounded pretty good, I could use my Windows software on an Apple plus

8/2/2019 02/27/12 Update of Stock Market Trends & Observations
http://slidepdf.com/reader/full/022712-update-of-stock-market-trends-observations 50/271
pdfcrowd.comopen in browser PRO version Are you a developer? Try out the HTML to PDF API New hot app: Facebook Albums To PDF
Apple had made great strides in introducing their own software and often
it was easier to operate than its Windows counterpart.
Not long after Bootcamps introduction (2008) I went to my local Apple
store and fell in love with an iMac. I bought it and proceeded to use it for
my Windows applications and also A pple applications. Things were sogood that after a year I had almost completely abandoned my Windows
software. Better still, the iMac o perating system was so stable that I
never saw the blue screen of death or its related Apple co unterpart (does
it exist???). No rebooting because things froze up or whatev er else that
might go wrong with PCs. I now started talking to friends about my
Apple computer and how they had to buy one too. I was the proud
owner of an iMac and had become a full fledged member of the Apple
club. These were unbelievable words coming from my month, an
avo wed hater of Apple computers. A y ear later I bought a MacBook
(laptop) and was now a two computer o wner of Apple products. My
Apple brainwashing was almost co mplete and ev idently I was turning
into a mindless Apple borg collectiv e member.
The Amazon Kindle came out and I had to have one, lov ed it but it didn’t
do some things that I would like to see do ne by a small device like this.
Boom, A pple announces the iPad and it does ev ery thing the Kindle does
and LOTS more. I quickly sold my Kindle on eBay before the iPad was
introduced and prices dropped b ecause the world was going to wake up
one day and realize that the Kindle wasn’t up to the job and ex pendable.
I bought my iPad on the second day they were av ailable (Monday after
Easter 2010 ). I was now a 3 computer owner of Apple products. It’s
official, I was now an A pple zombie, “me want more A pples”.
And here we are at present day , awaiting the arrival of the iPad 3. I will
be buy ing an iPad 3 because I want the new features so widely rumo red

8/2/2019 02/27/12 Update of Stock Market Trends & Observations
http://slidepdf.com/reader/full/022712-update-of-stock-market-trends-observations 51/271
pdfcrowd.comopen in browser PRO version Are you a developer? Try out the HTML to PDF API New hot app: Facebook Albums To PDF
be buy ing an iPad 3 because I want the new features so widely rumo red.
I theorize that there are a LOT of other people that are thinking exactly
like my self. They have an iPad 1 and want to trade up because the new
features will be too adv anced to pass up. Try to find an unhappy iPad
owner. They “almost” don’t exist.
Now I don’t participate in first day ac tivities with all the Apple dev otees
who can be a little bit crazy with their borg-type dev otion. But I think
it’s highly likely that the iPad 3 demand will ex haust the av ailable supply
on the first day . Second day buy ers and beyo nd will be left with nothing
but an order to be filled at a later date. On black Friday (Friday after
Thanksgiving) the iPhone 4S was sold out throughout the country . There
is obviously precedent for huge demand overwhelming supply. With this
in mind, I must bec ome part of the day one problems but I won’t be partof the opening craziness. I’ll be there about 2 hours after the open when
the opening crazy rush is mostly finished (I hope its finished). It seems
likely that there should be iPads available throughout most of day one.
Hopefully that better not be wishful thinking or I’ll be standing in line
waiting for nothing (yuk).
MUSING ABOUT APPLE
With all of this in mind, it seems extre mely likely that Apple will have
another blowout quarter of earnings propelled by the iPhone 4S and the
new iPad 3. Apple’s guidance for the first quarter of 2012 was well
abov e analy st’s ex pectations and that neve r happens. Apple ALWAY S
predicts very conserv ative numbers that are easy for them to hit. So
first and second quarters are v ery likely going to be sensational.
Earnings for 201 2 should be nothing short of spectacular. Apple TV (the
actual televisions made by A pple) are rumored to also be coming in
201 2. These will be top of the line televisions that yo u will speak
d (Si i) d th ill d thi t ith t

8/2/2019 02/27/12 Update of Stock Market Trends & Observations
http://slidepdf.com/reader/full/022712-update-of-stock-market-trends-observations 52/271
pdfcrowd.comopen in browser PRO version Are you a developer? Try out the HTML to PDF API New hot app: Facebook Albums To PDF
commands (Siri) and they will do ev ery thing you want with no remotes
cluttering your tables. The downside of these TVs will be price but as
usual every thing Apple makes is first rate and not the c heapest when
compared to others. Apple has no peers when yo u compare features,
only c ompetitors that try to catc h up and mimic last year’s Apple
product and never quite catc hing up to Apple.
The stock price of Apple has had a very nice run since its consolidation
around the $350-$360 lev el during the 4th quarter of 201 1. The recent
run up of about 15 0 points (over $5 00 presently ) from $350 has been
prompted by much better earnings than anticipated during the 4th
quarter. This was caused by the blowout sales figures for the iPhone 4S
plus the recent and long awaited announcement that the iPad 3 will be
unveiled during the first week in March.
Apple now has 100 billion dollars in cash. That’s a lot of money . I think
Apple’s new price ov er $50 0 per share makes Apple the most valuable
company in the world eclipsing Exx on. I think it’s very likely that Apple
will begin paying a dividend this year. Apple co uld pay a 4% dividend
and still increase their cash reserv es. A more likely figure for a
beginning dividend is something on the order of 2% per year. Steve Jobs
was dead set against pay ing a dividend but Cook is amendable to pay ing a
dividend. One of the problems that Apple has is that many institutions
have hit their limit on the amount o f stock they can hold in a single
company (Apple). This fact by itself limits severely the buying power
available for Apple. If Apple begins paying a dividend a lot of
institutions that won’t buy Apple due to no dividend pay out will look
favorably towards buying the stock. That’s new buying power plus a lot
of individual investors will look favorably at Apple that passed before
due to no dividend. Apple has all this money and uses a very small
amount of it for acquisitions It’s very strange What did Steve Jobs

8/2/2019 02/27/12 Update of Stock Market Trends & Observations
http://slidepdf.com/reader/full/022712-update-of-stock-market-trends-observations 53/271
pdfcrowd.comopen in browser PRO version Are you a developer? Try out the HTML to PDF API New hot app: Facebook Albums To PDF
amount of it for acquisitions. It s very strange. What did Steve Jobs
have in mind by ac cumulating all this money ???? It’s a mystery to me.
Maybe he just wanted to see how much money he co uld accumulate
before he passed.
A few recent comments about Apple’s money:
“A pple is not exactly hurting for cash; Cupertino reve aled last month
that it’s sitting on approximately $97.6 billion. But rather than burning
those funds on acquisitions, half-baked technology, or iPads for all,
Apple chief Tim Cook insisted Tuesday that the c ompany is very
practical about its money.
“We spend o ur money like it’s our last penny,” Cook said at Tuesday’sGoldman Sachs Technology and Internet Conference. “We’re judicious,
we ’re deliberate.”
Apple shareholders “don’t want us to act like we’re rich,” Cook
continued. “That may sound bizarre, but it’s the truth.”
That being said, Apple isn’t just lounging in piles of gold coins Scrooge
McDuck-style. Cook said Apple has spent b illions on its supply c hain,
acquisitions, intellectual property ( sorry, Samsung ), infrastructure, and
retail stores.
“But yes, we still have a lot [of money],” Cook concede d.
So w hat is Apple going to do with all this cash? “It is being discussed
more now and in greater detail,” he said. “I’d be the first to admit, we
have mo re cash than we need to run the business on a daily basis. And
so w e’re actively discussing it. I only ask for a bit of patience so w e can
do this in a very deliberate way and m ake the best decision for the
shareholders ”

8/2/2019 02/27/12 Update of Stock Market Trends & Observations
http://slidepdf.com/reader/full/022712-update-of-stock-market-trends-observations 54/271
pdfcrowd.comopen in browser PRO version Are you a developer? Try out the HTML to PDF API New hot app: Facebook Albums To PDF
shareholders.
“Cook said the late Steve Jobs “drilled in all of us [that] we should stay
extremely focused on a few things rather than try to do so many that
we did nothing well.” But it’s clear that Apple has th e desire the means
to branch out at least a little in the years to come .”
One of the remarkable features of Apple stock is that it’s currently selling
at 1 4 times trailing earnings and probably selling around 9 times forward
earnings. This is EXTREMELY low valuation for a stock that is growing at
double digit rates every quarter for years. As I said, the buying power is
limited in this stock and that “may” be o ne of the reason why it is v alued
so low. There is probably a lingering feeling that with Steve Jobs gone,
Apple will turn into tomorro w’s wasteland. The fact is that Stev e leftmany, many y ears of projects in the pipeline. Also the entire mindset
has changed at A pple (thanks to Steve), they now think differently than
any o ther company . They aren’t followers like Microsoft and others like
Samsung who is busy stealing Apple’s patents. Apple is now the leader of
the pack and they think like winners. Another reason for a low v aluation
is the nagging fear that another recession/depression is coming. Most
people view Apple as a technology c ompany, which they are, but they
are more correc tly thought of as a end product consumer oriented
stock. As the co nsumer pulls back in their buy ing habits, the thought is
that Apple has to suffer also. The problem with that thinking is it hasn’t
been true in the past. For instance when the economy went into a
slowdown in mid-2011 , Apple rolled right along at high speed. Apple’s
uniqueness keeps their sales going when others are suffering. If the day
comes when Apple loses their edge, the PE ratio that they c arry presently will beco me reasonable but until that happens they will
continue to surprise all of the naysay ers.

8/2/2019 02/27/12 Update of Stock Market Trends & Observations
http://slidepdf.com/reader/full/022712-update-of-stock-market-trends-observations 55/271
pdfcrowd.comopen in browser PRO version Are you a developer? Try out the HTML to PDF API New hot app: Facebook Albums To PDF
Have y ou wanted to buy Apple but y ou kept waiting for a meaningful
correc tion??? Y up, yo u and millions of other people are in that
category . If you look at the charts for Apple in MY CHART LINK ,
page 31, y ou’ll find that Apple has a history of declining down to the peak
of a prior high. It has done this repeatedly. For instance, 2007 to 2009, Apple declined from slightly ov er $200 to approx imately $80. The $80
level was the peak made in 2006 followed by a small correc tion. This
correc tion was followed by Apple’s almost uninterrupted run to the
$200 level. If we had a large recessionary c orrection in the market at
this time, I would ex pect in a worst case sc enario that Apple would
correct from the $500 lev el to $200 (2007 peak price). More than
likely it would stop at one of the other peaks like the $360 level made
during 2011 . So watch those peaks for future support levels should
Apple come under attack.
But I don’t really ex pect much in the way of a correc tion as long as the
economy holds up. The economies strength is surprising a lot of people
as many are still predicting a recession in 2012. But a lateral correction
may b e the worst that we will get until something very unexpec ted takes
place (black swan event).
In the growth stock section of my charts (Apple, page 31), I hav e just
added moving aver age lines, purple and gold. These are called the
“Guppy Multiple Mov ing Averages”. Y ou can read these chart lines
using the tactics o utlined below. These lines form an easily seen v isual
oscillator. Extreme points in the mov ing averages produce the same
extremes in the oscillators that appear on each chart. This makes it easy
to quickly follow ov erbought and overso ld points of reference.
The “Guppy Multiple Moving Average” has the following features (see
below chart for an e xample o f Guppy Lines):

8/2/2019 02/27/12 Update of Stock Market Trends & Observations
http://slidepdf.com/reader/full/022712-update-of-stock-market-trends-observations 56/271
pdfcrowd.comopen in browser PRO version Are you a developer? Try out the HTML to PDF API New hot app: Facebook Albums To PDF
p ppy
TACTICS
Join established trends at points of price weakness
Join established trends breaking to new highs
Trade breakouts using rally dips and rebounds
Trade downtrend rallies as rallies rather than trend breaks
Recognize trend breaks as they dev elop
RULES
Degree and nature of separation in the long term group define
trend strength and weakness
Degree and nature of separation in the short term group define thenature of trading activity .
Degree and nature of separation between the two gro ups of
mov ing averages define the character o f the trend.
Compression shows agreement on price and value.
Compression of both groups at the same time indicate major re-
evaluation of stock and po tential for a trend change
Trade in the direction of the long term group o f averages
The relationships between the groups prov ide the necessary
information about the nature and character o f the trend.
Do not use as a mov ing average cro ssover to ol
ADVANTAGES
Enables effectiv e analysis o f the trend env ironment
Improv es selection of the appropriate trading tacticsBetter understanding of trend strength
Effectiv e ev aluation of unusual price mov ements, such as dips and
spikes

8/2/2019 02/27/12 Update of Stock Market Trends & Observations
http://slidepdf.com/reader/full/022712-update-of-stock-market-trends-observations 57/271
pdfcrowd.comopen in browser PRO version Are you a developer? Try out the HTML to PDF API New hot app: Facebook Albums To PDF
spikes
Effectiv e understanding of trading activity and behav ior
DISADVANTAGES
Not effectiv ely applied to trend less stocksCannot be applied to all trending stocks
Do not use as a mov ing average crossov er signal
Apple stock chart from page 31 (daily view for the last 18 months).

8/2/2019 02/27/12 Update of Stock Market Trends & Observations
http://slidepdf.com/reader/full/022712-update-of-stock-market-trends-observations 58/271
pdfcrowd.comopen in browser PRO version Are you a developer? Try out the HTML to PDF API New hot app: Facebook Albums To PDF
W d I h d l i t d d t f d b t A l O I t
8/2/2019 02/27/12 Update of Stock Market Trends & Observations
http://slidepdf.com/reader/full/022712-update-of-stock-market-trends-observations 59/271
pdfcrowd.comopen in browser PRO version Are you a developer? Try out the HTML to PDF API New hot app: Facebook Albums To PDF
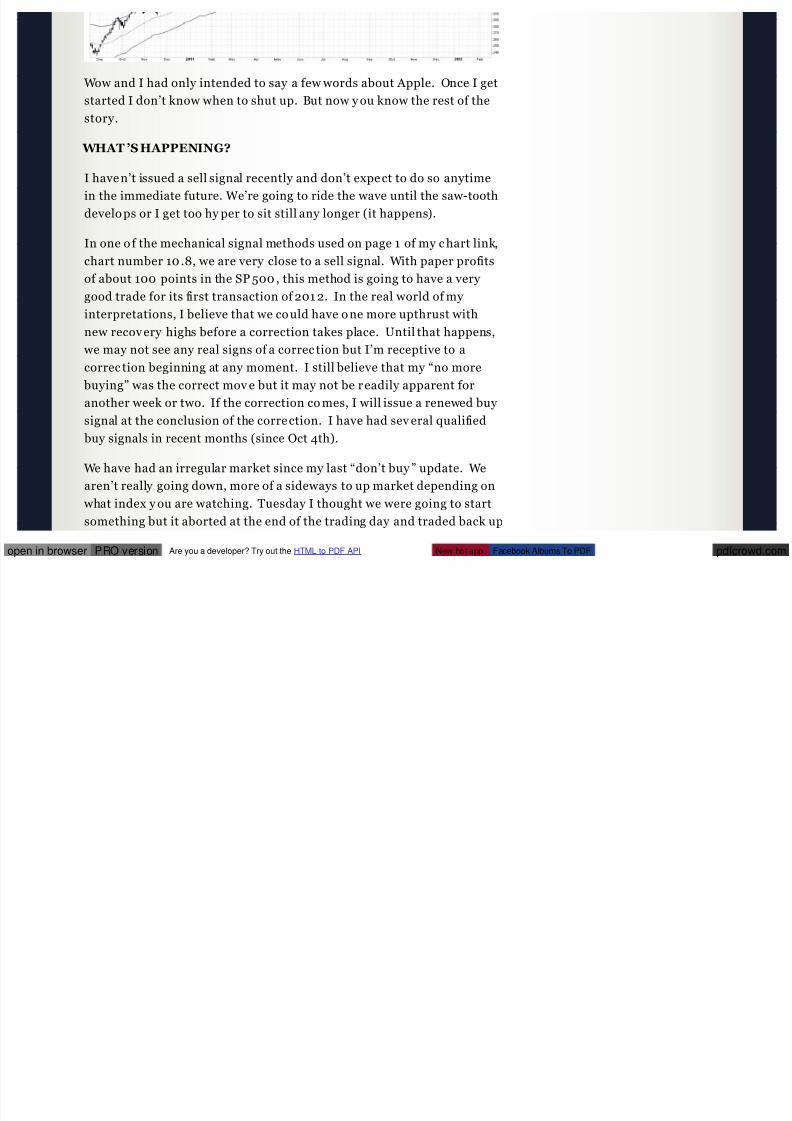
Wow and I had only intended to say a few words about Apple. Once I get
started I don’t know when to shut up. But now y ou know the rest of the
story.
WHAT ’S HAPPENING?
I have n’t issued a sell signal recently and don’t expe ct to do so anytime
in the immediate future. We’re going to ride the wave until the saw-tooth
develo ps or I get too hy per to sit still any longer (it happens).
In one o f the mechanical signal methods used on page 1 of my c hart link,
chart number 10 .8, we are very close to a sell signal. With paper profits
of about 100 points in the SP 500 , this method is going to have a very
good trade for its first transaction of 201 2. In the real world of my interpretations, I believe that we co uld have o ne more upthrust with
new recov ery highs before a correction takes place. Until that happens,
we may not see any real signs of a correc tion but I’m receptive to a
correc tion beginning at any moment. I still believe that my “no more
buying” was the correct mov e but it may not be r eadily apparent for
another week or two. If the correction co mes, I will issue a renewed buy
signal at the conclusion of the corre ction. I have had sev eral qualified
buy signals in recent months (since Oct 4th).
We have had an irregular market since my last “don’t buy ” update. We
aren’t really going down, more of a sideways to up market depending on
what index y ou are watching. Tuesday I thought we were going to start
something but it aborted at the end of the trading day and traded back up
to close little changed for the day. I had gone short early Tuesday morning and closed it out after the small 3 step do wn showed a little too
much life on the upside for me. Made a little money but its a risky trade
and I v ery definitely don’t reco mmend that sane people trade against the

8/2/2019 02/27/12 Update of Stock Market Trends & Observations
http://slidepdf.com/reader/full/022712-update-of-stock-market-trends-observations 60/271
pdfcrowd.comopen in browser PRO version Are you a developer? Try out the HTML to PDF API New hot app: Facebook Albums To PDF
larger trend. It’s one of those axioms, do n’t trade against the larger
trend. It’s very sound advice but I’m a little crazy (not as bad as I used
to be) and hence the risky short position taken early in the day. It could
have v ery easily gone against me and I would have lost money.
John Murphy has turned a bit cautious as he commented on Tuesday :
“It see ms reasonable to expect that an ev entual upside breakout by the
stock market will start to pull commodity prices higher. [Historically,
stock prices have usually turned up before commo dities]. In the
meantime, howe ver, relative w eakness in commo dity prices may be
hinting that the stock rally is overdone.”
“I’ve written a couple of recent messages explaining the importance of
Canada in the global intermarket picture. That’s why I remain focused
in the inability of Canadian stocks to clear their November high and
200-day mov ing average as show n in Chart 4. Its sho rt-term trend also
appears to be weakening a bit. The 1 4-day RSI line is in danger of
slipping below th e 50 level, w hile the daily MACD lines have turned
negative. Any we akness in Canadian stocks would make U.S. stocks
more vulnerable to short-term profit-taking. That’s bec ause the twoneighboring markets are usually c losely c orrelated. The inability o f the
CDW to breakout to the upside may also be helping to keep a lid on
commo dity prices.”
I hav e been establishing a new position in a stock (a stock???). I do own a
few but I normally b uy/ sell SP 500 futures contracts and roll them over
as they ex pire for any longer term holding periods. The stock that I have been slowly buy ing is Linn Energy (LINE). It’s considered a long term
holding and I’m tranching in as a conserv ative entry point. The current
price has a dividend pay out of 7 .7 %. I had already mentioned LINE in

8/2/2019 02/27/12 Update of Stock Market Trends & Observations
http://slidepdf.com/reader/full/022712-update-of-stock-market-trends-observations 61/271
pdfcrowd.comopen in browser PRO version Are you a developer? Try out the HTML to PDF API New hot app: Facebook Albums To PDF
my last comments and won’t bother to say any more.
Meanwhile I had said that I wo uld get back on b oard when the Nasdaq
Composite resumed its relative strength. It has resumed its strong
relative strength position but I I lied because I hav en’t give n an all clearfor buy ing. The COMPQ has resumed an irregular higher move but once
again it has showed a to pping formation ov er the last four day s, which
was destroy ed on Wednesday. It did this before when I warned of not
buying and that also proved to be a false alarm in the Composite Index.
I’m going to be conservative and not put the buy flag out yet. Any one
who is nutty enough to listen to me in the past should have bought a long
time ago and should only hav e been adding to these positions with new
money as it became available. Right now the bank is where the new money belongs.
It’s possible that we may get one more push into new recov ery ground
before a co rrection begins. The chart below shows that we have
completed 2 steps up (red 2 at top right) since December 19th. When the
3rd step up is completed, we can correc t. Overall, we are only in a larger
2nd step up (black 2 of 2) since the October 4th bottom. 1st step up (blue
1) ended in late October. Since then we have been in a larger step up(blue 2 not seen on this chart). If the count is correc t, we have muc h
further to go before the final top. That top will end the bull market,
which began in March 20 09.
Did yo ur ey es glaze over with that last paragraph??? Don’t worry,
eve ryb ody always says, “huh” . . . what did yo u just say???? I think the
conce pt is simple but ex plaining it in words is difficult and co mpletely BSto understand. It’s one of those, a picture is worth a thousand words.
The minutes from the most recent FED meeting have just been released
t d d th t k k t i d d lli ff M b th

8/2/2019 02/27/12 Update of Stock Market Trends & Observations
http://slidepdf.com/reader/full/022712-update-of-stock-market-trends-observations 62/271
pdfcrowd.comopen in browser PRO version Are you a developer? Try out the HTML to PDF API New hot app: Facebook Albums To PDF
today and the stock market was unimpressed and selling off. Maybe the
correc tion has begun. I have seen so many false starts in recent days
that we have to wait and see. This market has been impressive o n the
upside with high persistence and c ontinuing momentum.
20 1 1 -02 -1 4 INDU DAILY
The Nasdaq Composite index burst through the upper red circ le today
(Wednesday). These topping formations seem to be built so they c an be
destroy ed quickly. We are continuing to enjoy the ride but all new
buying is deferred for the moment.

8/2/2019 02/27/12 Update of Stock Market Trends & Observations
http://slidepdf.com/reader/full/022712-update-of-stock-market-trends-observations 63/271
pdfcrowd.comopen in browser PRO version Are you a developer? Try out the HTML to PDF API New hot app: Facebook Albums To PDF
20 1 1 -02 -1 4 COMPQ 5 MINUTE
The semiconductor index is showing poor relative strength and is often
an early indicator of market turns. It clearly shows two steps down but
in an eager bull market, we often only hav e two steps do wn with a
truncated third step. That may b e possibly indicated here and a higher
high than 5 day s ago will prove that case.

8/2/2019 02/27/12 Update of Stock Market Trends & Observations
http://slidepdf.com/reader/full/022712-update-of-stock-market-trends-observations 64/271
pdfcrowd.comopen in browser PRO version Are you a developer? Try out the HTML to PDF API New hot app: Facebook Albums To PDF
201 1 -02-14 SOX 5 MINUTE
The technology index stocks are showing good strength with a new
recov ery high today. That is certainly not an indication of any
correc tive ty pe action. This index has been in a solid uptrend since the
December 20 th bottom.
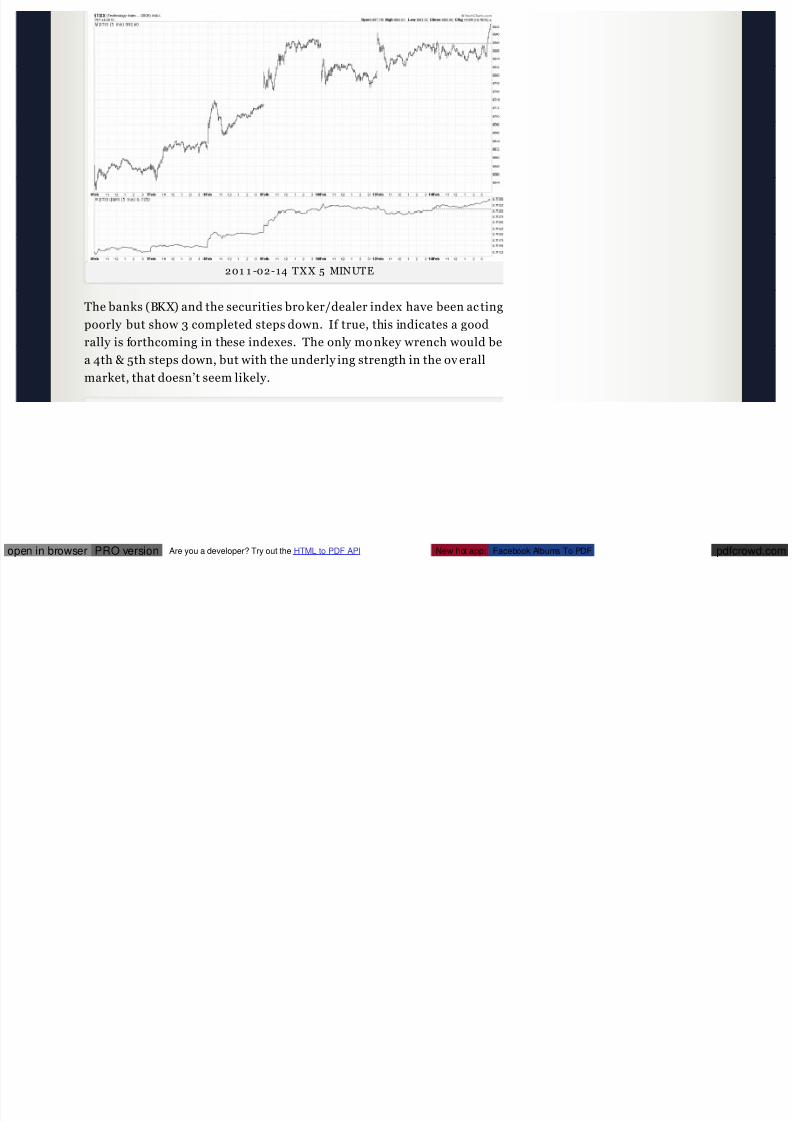
8/2/2019 02/27/12 Update of Stock Market Trends & Observations
http://slidepdf.com/reader/full/022712-update-of-stock-market-trends-observations 65/271
pdfcrowd.comopen in browser PRO version Are you a developer? Try out the HTML to PDF API New hot app: Facebook Albums To PDF
201 1 -02-14 TXX 5 MINUTE
The banks (BKX) and the securities bro ker/dealer index have been ac ting
poorly but show 3 completed steps down. If true, this indicates a good
rally is forthcoming in these indexes. The only mo nkey wrench would be
a 4th & 5th steps down, but with the underly ing strength in the ov erall
market, that doesn’t seem likely.

8/2/2019 02/27/12 Update of Stock Market Trends & Observations
http://slidepdf.com/reader/full/022712-update-of-stock-market-trends-observations 66/271
pdfcrowd.comopen in browser PRO version Are you a developer? Try out the HTML to PDF API New hot app: Facebook Albums To PDF
2 01 1 -02-1 4 BKX AND XBD 5 MINUTE
The Russell 2000 index (RUT) has been declining for sev eral days, but
today formed a higher low and all that is needed is for a higher high than
Monday’s close. If today’s late rally carries over into tomorrow, we
could easily best the Monday close.

8/2/2019 02/27/12 Update of Stock Market Trends & Observations
http://slidepdf.com/reader/full/022712-update-of-stock-market-trends-observations 67/271
pdfcrowd.comopen in browser PRO version Are you a developer? Try out the HTML to PDF API New hot app: Facebook Albums To PDF
20 1 1 -02 -1 4 RUT 5 MINUTE
The SP 500 (SPX) has been go ing nowhere for the last week, but if y ou
look closely at this chart you will see a reverse head and shouldersformation (bullish formatio n). The left shoulder is last Thursday , the
head is Friday and the right shoulder is today. A break of the neckline
(the highs acro ss the top of this chart) would v alidate this formation and
call for a mov e upward of 17 points above the nec kline at approximately
135 4. A target would be about 137 1, which is precisely at the level of the
May 2011 high.

8/2/2019 02/27/12 Update of Stock Market Trends & Observations
http://slidepdf.com/reader/full/022712-update-of-stock-market-trends-observations 68/271
pdfcrowd.comopen in browser PRO version Are you a developer? Try out the HTML to PDF API New hot app: Facebook Albums To PDF
201 1-02-14 SPX 5 MINUTE
The DJ Transports have been in a downtre nd for more than a week. The
late rally to day did v ery little to change that outlook.
201 1-02-14 TRAN 5 MINUTE
A longer v iew of the Canadian blue chip index (TSX) has formed a doub le
top and declined since the seco nd peak. I would count this as
somewhere in the second step down, where the first step down was

8/2/2019 02/27/12 Update of Stock Market Trends & Observations
http://slidepdf.com/reader/full/022712-update-of-stock-market-trends-observations 69/271
pdfcrowd.comopen in browser PRO version Are you a developer? Try out the HTML to PDF API New hot app: Facebook Albums To PDF
somewhere in the second step down, where the first step down was
between the double tops. Second step down began immediately after the
seco nd peak. I like watching the TSX as it has less “noise” than some of
the American indexes. Institutions of all sorts have a temporary
distorting effect on the Americ an indexes. Consequently the distortionscan make count ing steps more difficult in some of the index es. This is the
reason why I hav e 10 indexes on each page with the same chart period.
The hope is that one of these indexe s will have a c lear picture of what’s
happening. Frequently that’s true but when its not, my life beco mes
more difficult.
201 1 -02-14 TSX 15 MINUTE

8/2/2019 02/27/12 Update of Stock Market Trends & Observations
http://slidepdf.com/reader/full/022712-update-of-stock-market-trends-observations 70/271

8/2/2019 02/27/12 Update of Stock Market Trends & Observations
http://slidepdf.com/reader/full/022712-update-of-stock-market-trends-observations 71/271

8/2/2019 02/27/12 Update of Stock Market Trends & Observations
http://slidepdf.com/reader/full/022712-update-of-stock-market-trends-observations 72/271
pdfcrowd.comopen in browser PRO version Are you a developer? Try out the HTML to PDF API New hot app: Facebook Albums To PDF
201 1-02-14 TXX 3 0 MINUTE
The next c hart which is for the same time period as the TXX chart abov e
is the banks (BKX) and sec urites broker/ dealers (XBD) and it shows a
rather clear 3 steps up since the December 1 9th bottom. A perfect
example of why I have 1 0 indexes on each page for the same chart
period (30 minutes).

8/2/2019 02/27/12 Update of Stock Market Trends & Observations
http://slidepdf.com/reader/full/022712-update-of-stock-market-trends-observations 73/271
pdfcrowd.comopen in browser PRO version Are you a developer? Try out the HTML to PDF API New hot app: Facebook Albums To PDF
2 01 1 -02-1 4 BKX & XBD 3 0 MINUTE
A lot of people have become more bullish in recent weeks and that oftenprecedes a temporary reversal, but this indicator is notoriously wrong in
the later stages of a bull market. The period leading up to the 20 00 b ull
market peak was an excellent ex ample of rampant bullish behavior but
no correc tion until the market had expended the buy ing power

8/2/2019 02/27/12 Update of Stock Market Trends & Observations
http://slidepdf.com/reader/full/022712-update-of-stock-market-trends-observations 74/271
pdfcrowd.comopen in browser PRO version Are you a developer? Try out the HTML to PDF API New hot app: Facebook Albums To PDF
p y g p
available. When there is no one left to buy b ecause ev ery one has spent
their money, y ou are only left with sellers.
I remain in an “ov erall” uptrend theme as per previous updates. Thatmeans zig-zag not straight lines.
Told you this was a windy comment. I can really bore the crap out of
you if I start talking about the stoc k market. But I hav e learned to
restrain myself because nobody loves this stuff like I do . Talk about it for
a couple of minutes and then stop. If they want to continue the
conv ersation, they’ll tell me. But you guys are a captive audience
(maniacal laugh here). Only in 1999 did ev ery one want to talk about thestock market and I was telling them to sell, not what they wanted to
hear. Also nobody wants to buy when there is blood in the streets and
nobody wants to sell when eve ry thing is so good that making money in
the stock market is a sure thing. I always like to say “Don’t confuse
genius with a bull market”. Nobody understood that in 1999 and they
thought they had learned more in a short time than I had since 1 957
(they were thinking this guy is really dumb!). I have made peac e with
this attitude and alway s expect it. I don’t even say later, “I told y ou so”.Usually the person will say it for me.
Never forget that the driv ing force in the stock market is emotions and
those primary thoughts are “fear, hope and greed” as displayed in the
following chart.

8/2/2019 02/27/12 Update of Stock Market Trends & Observations
http://slidepdf.com/reader/full/022712-update-of-stock-market-trends-observations 75/271
pdfcrowd.comopen in browser PRO version Are you a developer? Try out the HTML to PDF API New hot app: Facebook Albums To PDF
Fear , Hope, an d Greed
CHARTS
MY CHART LINK (updated constantly)
These are my personal charts and my playground for doodling
trend lines, wave counts and other ideas.
I draw the trend lines and wave co unts on a daily basis (sometimes
more often). Y ou can find these doodles from 1 minute to
monthly charts.
I usually restrict my trend lines and wave counts to the first three
charts on eac h page, TSX, DJI & COMPQ. The other c harts on the
page are usually for c onfirmation of the trend and wave structure.
Page 1 – Buy /Sell Signals & Misc Charts
Page 2 – Index es With 1 Minute Bars
Page 3 – Index es With 5 Minute Bars
Page 4 – Index es With 15 Minute Bars
Page 5 – Index es With 30 Minute Bars

8/2/2019 02/27/12 Update of Stock Market Trends & Observations
http://slidepdf.com/reader/full/022712-update-of-stock-market-trends-observations 76/271
pdfcrowd.comopen in browser PRO version Are you a developer? Try out the HTML to PDF API New hot app: Facebook Albums To PDF
Page 5 – Index es With 30 Minute Bars
Page 6 – Index es With 60 Minute Bars
Page 7 – Indexes With Daily Bars
Page 8 – Index es With Weekly Bars (since 1 981)
Page 9 – Indexes With Monthly Bars (since 1 981)
Page 10 – Indexes With 60 Minute Bars, Candlestick
Page 11 – Indexes With Daily Bars, Candlesticks
Page 12 – Index es With Weekly Bars, Candlestick
Pages 13 through 1 4 are shorter term indicators. The indicators
are used to simply look for some type o f leading action before a
turn or confirming action of the wave co unt. Page 13 is a look-
eve ry day indicator page. The other indicator pages are less
frequently visited.
Page 15 – Hurst FLD Projections
Page 16 – Indicators, Long Term
Page 17 – International Indexes
Page 18 through 30 are sector ETFs. They represent most of the
active sector ETFs and are always a good hunting ground when
looking for something that is breaking in a new direction.Page 31 through 46 are growth stocks with indicators. These are
stocks that have bee n in a lengthy uptrend. One qualification is
that they must not be sev erely damaged in a bear market so they
can’t rise to significant new highs in the following bull market.
The growth stocks show daily market action for the last 1.5 y ears
and weekly prices since 1992. This gives a good perspective of how they have be haved in the immediate past (daily c harts) and
how they behaved during good and bad times (weekly charts).
Page 46 – Last 6 charts are trades from the mec hanical sell/buy
signals

8/2/2019 02/27/12 Update of Stock Market Trends & Observations
http://slidepdf.com/reader/full/022712-update-of-stock-market-trends-observations 77/271
pdfcrowd.comopen in browser PRO version Are you a developer? Try out the HTML to PDF API New hot app: Facebook Albums To PDF
signals
WAVE COUNT S SIMPLIFIED
My wave counts are not Elliott Wave! It’s different, simple and functions w ithout a maze of exclusions.
T here are 3 peaks (or valleys) to a com pleted wave cou nt.
A rev ersal of trend takes place after a completed wave count.
Often times it’s as simple as counting 3 bumps (or dips) on a chart .
. . Other times, not so easy .
In a downtrend the same rules apply ex cept y ou are co unting 3
dips instead of 3 bumps.3 steps m ust stay confined to a channel. Laying a pen or
pencil on the c hart will help y ou v isualize the channel.
As the larger trend progresses, all of the steps that make up the
trend will also be co nfined to a larger channel. Sometimes a
channel is not clear until the surge phase (vertical mov e) has
ended.
When the m arket breaks its channel (regardless of the
perceived wave cou nt), the step has been terminated.(Make sure yo ur channel was correctly drawn before c alling a
termination). Sometimes this may be y our best indicator that a
wave count is completed.
The correction following the second step is larger than the
correc tion that followed the first step, and obv iously the
correc tion following third step is larger than the second stepcorrection.
A single wave m ay sub-divide into another 3 waves. I will
call this an ex tension. When this happens (1) the trend is still
intact, (2) the channel will widened and (3) instead of a total of
3 t th ill b 5 t

8/2/2019 02/27/12 Update of Stock Market Trends & Observations
http://slidepdf.com/reader/full/022712-update-of-stock-market-trends-observations 78/271
pdfcrowd.comopen in browser PRO version Are you a developer? Try out the HTML to PDF API New hot app: Facebook Albums To PDF
3 steps, there will be 5 steps.
Sometimes I will use the terms “step” and “wave” interchangeably .
Reading the glossary helps in the understanding of this blog.
There are many other important facts in the glossary.
Glossary Link
ABBREVIATIONS
DJI = Dow Jones Industr ials
DJT = Dow Jones Transportat ions
SPX = SP 50 0
ES = SP 500 Futures
COMPQ = Nasdaq Composite Index
TSX = Toro nto Stock Exchange (Canadian blue chips)
SOX = Semico nducto rs
TXX = Technolo gy
****************************************************************
Long T erm – UPUptrend
Mar 2009 To Present
Step 2 Up (of 3) Com pleted
Step 3 Up Has Likely Begun
From the bottom in March 200 9
Large step one up ended in May 2010Large step two up ended in May 2011
Large step three is underway

8/2/2019 02/27/12 Update of Stock Market Trends & Observations
http://slidepdf.com/reader/full/022712-update-of-stock-market-trends-observations 79/271
pdfcrowd.comopen in browser PRO version Are you a developer? Try out the HTML to PDF API New hot app: Facebook Albums To PDF

8/2/2019 02/27/12 Update of Stock Market Trends & Observations
http://slidepdf.com/reader/full/022712-update-of-stock-market-trends-observations 80/271
pdfcrowd.comopen in browser PRO version Are you a developer? Try out the HTML to PDF API New hot app: Facebook Albums To PDF
1 2-28 -11 LONG TERM
****************************************************************
Very Long T erm – DOWN
Downtrend
Jan 2000 T o Present
Step 2 Down (of 3) Com pleted
Currently In Rally Phase From Step 2 Down
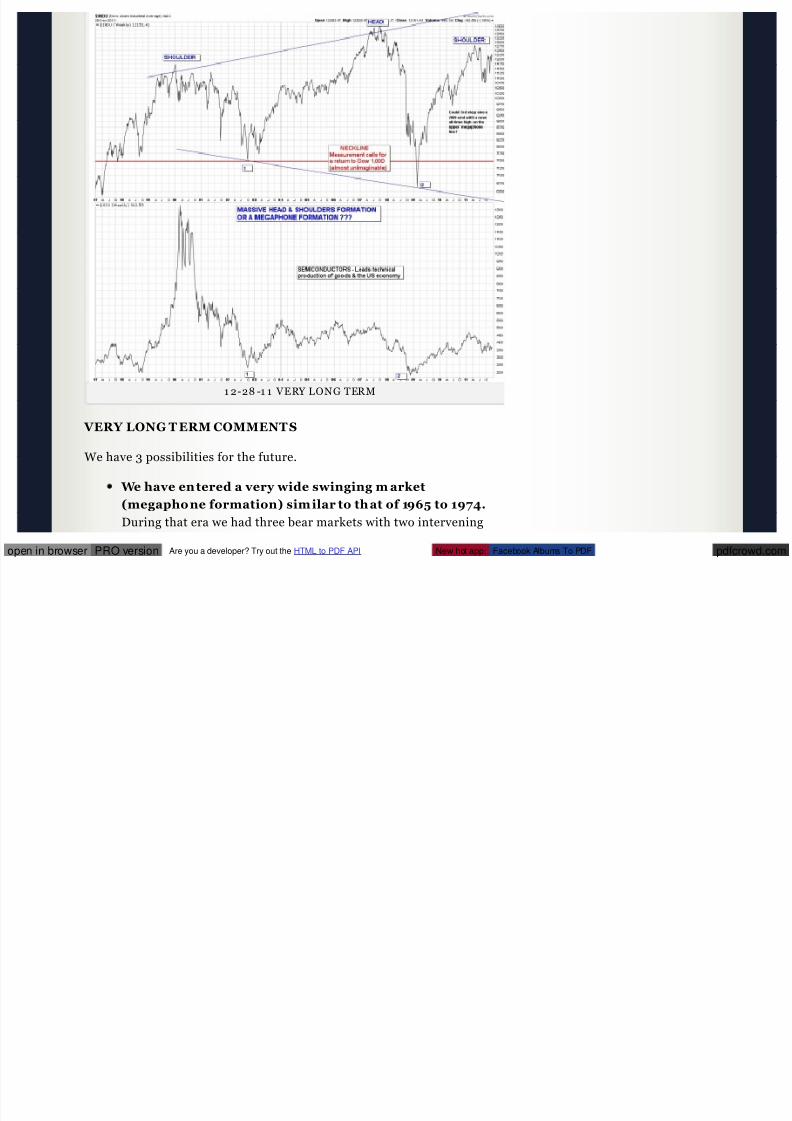
8/2/2019 02/27/12 Update of Stock Market Trends & Observations
http://slidepdf.com/reader/full/022712-update-of-stock-market-trends-observations 81/271
pdfcrowd.comopen in browser PRO version Are you a developer? Try out the HTML to PDF API New hot app: Facebook Albums To PDF
1 2-28 -1 1 VERY LONG TERM
VERY LONG T ERM COMMENT S
We have 3 possibilities for the future.
We have entered a very wide swinging m arket
(megaphone formation) sim ilar to that of 1965 to 1974.
During that era we had three bear markets with two intervening
bull market rallies. Each bear market had a lower low than the
previous b ear. The interve ning bull market rallies saw new all
time highs before the nex t bear market began.
We also have formed a huge head and shoulders formation since
1998. If this formation is valid, the downside measurement calls
for a bottom around Dow Jones Industrials 1,0 00.

8/2/2019 02/27/12 Update of Stock Market Trends & Observations
http://slidepdf.com/reader/full/022712-update-of-stock-market-trends-observations 82/271
pdfcrowd.comopen in browser PRO version Are you a developer? Try out the HTML to PDF API New hot app: Facebook Albums To PDF
for a bottom around Dow Jones Industrials 1,0 00.
We began a long term bull market in March 2009.
I favor the m egaphone formation as the m ost likely
scenario.
Since 2000 we have had two bear markets, 2000 to 200 3 and 2007 to
2009. Like 1966 to 197 4, the recov ery from the first bear market saw a
new all time high (2007 peak). It’s possible that we may ex perience
another all time high during the present recov ery period. This would
support the megaphone formation. A failure to make new highs would
support the head and shoulders argument. In both formations the
conclusion of the present recov ery would call for a third and final bear
market. An estimated time for the conclusion o f the final bear market is
approximately 20 18.
The lesser downside target of both formations is the megaphone
formation as it likely calls for a bottom 1,0 00 to 2,000 points below the
2009 low, which would be around Dow 5,00 0.
In the head and shoulders formation the measurement calls for a bottomaround Dow Jones Industrials 1,0 00. This is almost an unimaginable
eve nt regarding the possible fundamentals to c reate this scenario. If this
did happen, ev ery thing that could go wrong would have to go wrong.
This scenario is so dark that it doesn’t seem possible but neve rtheless,
the head and shoulders formation is there and will be waiting until we

8/2/2019 02/27/12 Update of Stock Market Trends & Observations
http://slidepdf.com/reader/full/022712-update-of-stock-market-trends-observations 83/271
19 39 for the Industrials, Transportations and Utilities . This was a
lot of work as it was before co mputers and online data (remember
when Barrons was available only on paper, still is for the distant
past).
Edson Gould was truly a legend in his own time. It’s too bad that
today many people hav e forgotten or never heard of him or his

8/2/2019 02/27/12 Update of Stock Market Trends & Observations
http://slidepdf.com/reader/full/022712-update-of-stock-market-trends-observations 84/271
pdfcrowd.comopen in browser PRO version Are you a developer? Try out the HTML to PDF API New hot app: Facebook Albums To PDF
y y p p g
discov eries. Below y ou will find only the first page of these
reports. A teaser is what yo u might call it. The rest of the reports
are available upon request. This is a man that deserves to beremembered throughout technical analysis market history.
T he following are links to Edson Gould reports.
My Most Im portant Discov ery by Edson Gould
It was also my most important discov ery , for it ex plained the
irrational volatility o f markets that had my stified me in my early
years. During those early y ears I found nothing worked in
predic ting these irrational market swings. But the fog lifted after
reading this report and I began to understand how to begin
predicting the market. The book “Extrao rdinary Popular
Delusions and the Madness of Crowds” is very useful in explaining
crowd behavior.
Edson Gould Profile by MT A
Edson Gould Conc epts by William Scheinm an
Decade Cycle by Edson Gould
Decade Cyc le Update by Ned Davis
Swing Principle by Edson Gould
A measuring indicator
Utilities by Edson Gould
A forecasting indicator
Dividends by Edson Gould
Bonds by Edson Gould
Speed Lines by Edson Gould
Sentimeter by Edson Gould

8/2/2019 02/27/12 Update of Stock Market Trends & Observations
http://slidepdf.com/reader/full/022712-update-of-stock-market-trends-observations 85/271
pdfcrowd.comopen in browser PRO version Are you a developer? Try out the HTML to PDF API New hot app: Facebook Albums To PDF
With companies failing to pay dividends c ommensurate with their
earnings, this indicator has failed. As the market deteriorate in
the coming years, I would expec t dividends to return to theirformer levels and this indicator will once again become useful.
Prior to the late 1990s, it had 100 y ears of success.
Bottoms by Edson Gould
This was written and directed at the upco ming bottom in 197 4 but
it applies to all major bottoms.
T hree Steps by Edson Gould
Where do y ou think my three steps principle came from? Straight
from this report although I modified the concept through the years.
Edson Gou ld’s 1974 Forecast
Gould’s 197 4 forecast kept me bearish and short throughout 197 4
until the week before Christmas 197 4, during which I began
making long term purchases. After that it was ride the bull phases
that transpired from 197 5 to 1982. 1982 to 2000 was the greatest
bull market of all time.Edson Gou ld’s 1975 Forecast
Edson Gou ld’s 1976 Forecast
Edson Gould’s 197 7 Forecast
Edson Gould’s Five Y ear Forecast 1977 to 1982
This was a remarkable forecast in 197 7 , where the Dow Industrials
had never been higher than 1,00 0. NO ONE had predicted a rise o f
this magnitude in 197 7 . Most were waiting for a resumption of the
bear market.
As part of the 197 7 to 1982 forecast I have the following story. On
Wednesday August 4, 1 982 I went long the market for the first
time in months. By Friday, August 6 I was worried that I had

8/2/2019 02/27/12 Update of Stock Market Trends & Observations
http://slidepdf.com/reader/full/022712-update-of-stock-market-trends-observations 86/271
pdfcrowd.comopen in browser PRO version Are you a developer? Try out the HTML to PDF API New hot app: Facebook Albums To PDF
made a mistake as I was deep in the red (I was long the Kansas City
Stock Market Contrac ts). The Kansas City Stoc k Market Contract
was the first of the stock index co ntracts (February 1 982). It was based on the Value Line Arithmetic Index , margin requirement
were quite low, and it had a multiplier of 1 00 times the Value Line
Arithmetic Index, which meant the leverage was very high. On
Friday (Aug 6), my wife and I went to dinner and I to ld her my tale
of woe and asked her whether I should sell my long positions. I
explained that my series #1 indicator had rev ersed and continued
higher on Thursday and Friday but the market had continued
lower. Since the key indicator was usually corre ct, we decided tostick it out awhile longer (I was crazy in those days). On Monday
August 9, 1982 the market took off like a rocket and never looked
back. The ignition for the 1982 to 200 0 bull market was
underway. I skyroc keted out of the red and had a big profit. In
August 1982 the o nly peo ple that were bullish were Edson Gould,
Robert Prechter and myself (probably a c ouple of others but I
didn’t know them). Eve ry one else was extremely bearish. It was a
perfect example of extre me crowd behavior.
Sign Of The Bull by Edson Gould
****************************************************************
TRANSACTION SIGNALS
All actionable signals are only for short term time frames. These
signals are not designed for intermediate or long term time frames
BUT . . . . .
After a short term buy signal, long term tax status can be
achieved by a continuation of the upward trend which causes

8/2/2019 02/27/12 Update of Stock Market Trends & Observations
http://slidepdf.com/reader/full/022712-update-of-stock-market-trends-observations 87/271
pdfcrowd.comopen in browser PRO version Are you a developer? Try out the HTML to PDF API New hot app: Facebook Albums To PDF
achieved by a continuation of the upward trend, which causes
short term actions to morph into long term holdings.
See more details in the glossary under “Tax es, Futures Contracts”and “Money Management”.
Glossary Link
T RANSACT ION RECORD
In this blog a warning of an impending botto m (or top) is often
issued well in advance o f the formal buy or sell date. This allows
thoughtful consideration prior to a formal action signal. To get asense of how this works, you should read the days prior to a
formal buy /sell signal. I often buy/sell in my personal account
based on the early warnings.
The transaction record near stock market bottoms will show that I
am ve ry skittish and usually remain so until the new direction is
well underway .
STOP BUYI NG – FEBRUARY 6, 2012QUALIFI ED BUY – DECEMBER 15, 2011
QUALIFI ED BUY – DECEMBER 12, 2011
QUALIFI ED BUY – DECEMBER 5, 2011
ACKNOWLEDGED BOTT OM – OCTOBER 16, 2011
PREVIEW TO A BUY SIGNAL – OCT OBER 2, 2011
BLOG SUSPENDED ON 9/27/11
This blog was suspended the first time on 9/17 /1 1 due to a death
acco mpanied by a family illness. It was suspended a second and
longer time on 9/27 /1 1 due to an extremely serious family
illness Blog resumption with co mments and charts began again

8/2/2019 02/27/12 Update of Stock Market Trends & Observations
http://slidepdf.com/reader/full/022712-update-of-stock-market-trends-observations 88/271
pdfcrowd.comopen in browser PRO version Are you a developer? Try out the HTML to PDF API New hot app: Facebook Albums To PDF
Share this:
illness. Blog resumption with co mments and charts began again
on 11 /27 /1 1. Unfortunately due to illness I clearly missed issuing
a formal & important buy signal closer to the 10 /4/1 1 bo ttom.
Hopefully this error will not be repeated.
SELL – SEPTEMBER 9, 2011
BUY – AUGUST 30, 2011
SELL – AUGUST 30, 2011 – Stopped out, re-bought quic kly
BUY – AUGUST 29, 2011
SELL – AUGUST 25, 2011
BUY – AUGUST 23, 2011
SELL – AUGUST 1, 2011
BUY – JUNE 23, 20 11
****************************************************************
MISCELLANEOUS
There are useful items throughout this blog. For instance, the
“Wall Street Quotes” can be v ery instructive. So make sure and
look all through the blog.
Twitter 2 Facebo ok Li nked In 1 Reddit
Digg Email Print
Comments: Be the first to comm ent
Stock Market Update – 02/06/12Pos ted February 7, 201 2 by Bob
C t i DAILY UPDATE SELL/BUY AC TION U PDATE

8/2/2019 02/27/12 Update of Stock Market Trends & Observations
http://slidepdf.com/reader/full/022712-update-of-stock-market-trends-observations 89/271
pdfcrowd.comopen in browser PRO version Are you a developer? Try out the HTML to PDF API New hot app: Facebook Albums To PDF
Categories: DAILY UPDATE , SELL/BUY AC TION U PDATE
CLI CK HERE IF READING PDF
****************************************************************
WHAT ’S HAPPENING?
In my last update I said: “It w ill be interesting to see what type o f
resistance the prior highs of May 2011 will provide. Very little
resistance could prompt a continuing run. Stiff resistance w ould likely
indicate the end of 2nd step since the late Nove mber bottom.”
This week I hav e noticed that the Nasdaq Composite has slowed it growth
relative to the b lue chips (SPX). This is probably warning of a correction
of some type. In fact, most of the indexes hav e topped exc ept for the
blue chips. Maybe the February bottom will take place (????).
First see the c ontinuing strength in the blue c hips.

8/2/2019 02/27/12 Update of Stock Market Trends & Observations
http://slidepdf.com/reader/full/022712-update-of-stock-market-trends-observations 90/271
pdfcrowd.comopen in browser PRO version Are you a developer? Try out the HTML to PDF API New hot app: Facebook Albums To PDF
20 1 1 -02 -06 SPX 5 MINUTE
201 1 -02-06 IND 5 MINUTE
While the Nasdaq Composite and a few of its friends are lagging behind.

8/2/2019 02/27/12 Update of Stock Market Trends & Observations
http://slidepdf.com/reader/full/022712-update-of-stock-market-trends-observations 91/271
pdfcrowd.comopen in browser PRO version Are you a developer? Try out the HTML to PDF API New hot app: Facebook Albums To PDF
20 1 1 -02-06 COMP 5 MINUTE
The banks have slowed their growth.

8/2/2019 02/27/12 Update of Stock Market Trends & Observations
http://slidepdf.com/reader/full/022712-update-of-stock-market-trends-observations 92/271
pdfcrowd.comopen in browser PRO version Are you a developer? Try out the HTML to PDF API New hot app: Facebook Albums To PDF
20 1 1 -02 -06 BKX 5 MINUTE
The semiconductors often turn before the rest o f the market.

8/2/2019 02/27/12 Update of Stock Market Trends & Observations
http://slidepdf.com/reader/full/022712-update-of-stock-market-trends-observations 93/271
pdfcrowd.comopen in browser PRO version Are you a developer? Try out the HTML to PDF API New hot app: Facebook Albums To PDF
20 1 1 -02 -06 SOX 5 MINUTE
The same is true o f the Canadian blue chips (TSX)

8/2/2019 02/27/12 Update of Stock Market Trends & Observations
http://slidepdf.com/reader/full/022712-update-of-stock-market-trends-observations 94/271
pdfcrowd.comopen in browser PRO version Are you a developer? Try out the HTML to PDF API New hot app: Facebook Albums To PDF
2011-02-06 TSX 5 MINUTE
Naturally this could be a natural rotation among groups but for now, it issimply a warning of a “possible” correc tion. Meantime, I’m not buying
nuthin’ for the moment. When the Nasdaq and the other index es
mentioned here begin to show more relative strength, I’ll join up with
them. Naturally things could change quickly as the charts shown are a
very small snap shot in time and it doesn’t take much to change this
picture. Be aware for now.
Bottom line, this is a don’t buy update unt il relative strengthimproves in th e smaller cap stocks.
I remain in an “overall” uptrend theme as per prev ious updates.
CHARTS
MY CHART LINK (updated constantly)
These are my personal charts and my playground for doodling
trend lines, wave counts and other ideas.
I draw the trend lines and wave co unts on a daily basis (sometimes
more often). Y ou can find these doodles from 1 minute to
monthly charts.

8/2/2019 02/27/12 Update of Stock Market Trends & Observations
http://slidepdf.com/reader/full/022712-update-of-stock-market-trends-observations 95/271
pdfcrowd.comopen in browser PRO version Are you a developer? Try out the HTML to PDF API New hot app: Facebook Albums To PDF
I usually restrict my trend lines and wave counts to the first three
charts on eac h page, TSX, DJI & COMPQ. The other c harts on the
page are usually for c onfirmation of the trend and wave structure.
Page 1 – Buy /Sell Signals & Misc Charts
Page 2 – Index es With 1 Minute Bars
Page 3 – Index es With 5 Minute Bars
Page 4 – Index es With 15 Minute Bars
Page 5 – Index es With 30 Minute Bars
Page 6 – Index es With 60 Minute BarsPage 7 – Indexes With Daily Bars
Page 8 – Index es With Weekly Bars (since 1 981)
Page 9 – Indexes With Monthly Bars (since 1 981)
Page 10 – Indexes With 60 Minute Bars, Candlestick
Page 11 – Indexes With Daily Bars, Candlesticks
Page 12 – Index es With Weekly Bars, Candlestick
Pages 13 through 1 4 are shorter term indicators. The indicatorsare used to simply look for some type o f leading action before a
turn or confirming action of the wave co unt. Page 13 is a look-
eve ry day indicator page. The other indicator pages are less
frequently visited.
Page 15 – Hurst FLD Projections
Page 16 – Indicators, Long Term
Page 17 – International Indexes
Page 18 through 30 are sector ETFs. They represent most of the
active sector ETFs and are always a good hunting ground when
looking for something that is breaking in a new direction.
Page 31 through 46 are growth stocks with indicators. These are
stocks that have bee n in a lengthy uptrend. One qualification is

8/2/2019 02/27/12 Update of Stock Market Trends & Observations
http://slidepdf.com/reader/full/022712-update-of-stock-market-trends-observations 96/271
pdfcrowd.comopen in browser PRO version Are you a developer? Try out the HTML to PDF API New hot app: Facebook Albums To PDF
g y p q
that they must not be sev erely damaged in a bear market so they
can’t rise to significant new highs in the following bull market.
The growth stocks show daily market action for the last 1.5 y ears
and weekly prices since 1992. This gives a good perspective of
how they have be haved in the immediate past (daily c harts) and
how they behaved during good and bad times (weekly charts).
Page 46 – Last 6 charts are trades from the mec hanical sell/buy
signals
WAVE COUNT S SIMPLIFIED
My wave counts are not Elliott Wave! It’s different, simple and
functions w ithout a maze of exclusions.
T here are 3 peaks (or valleys) to a com pleted wave cou nt.
A rev ersal of trend takes place after a completed wave count.
Often times it’s as simple as counting 3 bumps (or dips) on a chart .
. . Other times, not so easy .In a downtrend the same rules apply ex cept y ou are co unting 3
dips instead of 3 bumps.
3 steps m ust stay confined to a channel. Laying a pen or
pencil on the c hart will help y ou v isualize the channel.
As the larger trend progresses, all of the steps that make up the
trend will also be co nfined to a larger channel. Sometimes a
channel is not clear until the surge phase (vertical mov e) has
ended.
When the m arket breaks its channel (regardless of the
perceived wave cou nt), the step has been terminated.
(Make sure yo ur channel was correctly drawn before c alling a
termination). Sometimes this may be y our best indicator that a

8/2/2019 02/27/12 Update of Stock Market Trends & Observations
http://slidepdf.com/reader/full/022712-update-of-stock-market-trends-observations 97/271
pdfcrowd.comopen in browser PRO version Are you a developer? Try out the HTML to PDF API New hot app: Facebook Albums To PDF
wave count is completed.
The correction following the second step is larger than the
correc tion that followed the first step, and obv iously the
correc tion following third step is larger than the second step
correction.
A single wave m ay sub-divide into another 3 waves. I will
call this an ex tension. When this happens (1) the trend is still
intact, (2) the channel will widened and (3) instead of a total of
3 steps, there will be 5 steps.
Sometimes I will use the terms “step” and “wave” interchangeably .
Reading the glossary helps in the understanding of this blog.
There are many other important facts in the glossary.
Glossary Link
ABBREVIATIONS
DJI = Dow Jones Industr ials
DJT = Dow Jones Transportat ionsSPX = SP 50 0
ES = SP 500 Futures
COMPQ = Nasdaq Composite Index
TSX = Toro nto Stock Exchange (Canadian blue chips)
SOX = Semico nducto rs
TXX = Technolo gy
****************************************************************
Long T erm – UP
Uptrend
Mar 2009 To Present
Step 2 Up (of 3) Com pleted

8/2/2019 02/27/12 Update of Stock Market Trends & Observations
http://slidepdf.com/reader/full/022712-update-of-stock-market-trends-observations 98/271
pdfcrowd.comopen in browser PRO version Are you a developer? Try out the HTML to PDF API New hot app: Facebook Albums To PDF
Step 2 Up (of 3) Com pleted
Step 3 Up Has Likely Begun
From the bottom in March 200 9
Large step one up ended in May 2010
Large step two up ended in May 2011
Large step three is underway

8/2/2019 02/27/12 Update of Stock Market Trends & Observations
http://slidepdf.com/reader/full/022712-update-of-stock-market-trends-observations 99/271
pdfcrowd.comopen in browser PRO version Are you a developer? Try out the HTML to PDF API New hot app: Facebook Albums To PDF
1 2-28 -11 LONG TERM
****************************************************************
Very Long T erm – DOWN
Downtrend
Jan 2000 T o Present
Step 2 Down (of 3) Com pleted
Currently In Rally Phase From Step 2 Down

8/2/2019 02/27/12 Update of Stock Market Trends & Observations
http://slidepdf.com/reader/full/022712-update-of-stock-market-trends-observations 100/271
pdfcrowd.comopen in browser PRO version Are you a developer? Try out the HTML to PDF API New hot app: Facebook Albums To PDF
1 2-28 -1 1 VERY LONG TERM
VERY LONG T ERM COMMENT S
We have 3 possibilities for the future.
We have entered a very wide swinging m arket
(megaphone formation) sim ilar to that of 1965 to 1974.
During that era we had three bear markets with two intervening
bull market rallies. Each bear market had a lower low than the
previous b ear. The interve ning bull market rallies saw new all
time highs before the nex t bear market began.
We also have formed a huge head and shoulders formation since
1998. If this formation is valid, the downside measurement calls
for a bottom around Dow Jones Industrials 1,0 00.
We began a long term bull market in March 2009.

8/2/2019 02/27/12 Update of Stock Market Trends & Observations
http://slidepdf.com/reader/full/022712-update-of-stock-market-trends-observations 101/271
pdfcrowd.comopen in browser PRO version Are you a developer? Try out the HTML to PDF API New hot app: Facebook Albums To PDF
I favor the m egaphone formation as the m ost likely
scenario.
Since 2000 we have had two bear markets, 2000 to 200 3 and 2007 to
2009. Like 1966 to 197 4, the recov ery from the first bear market saw a
new all time high (2007 peak). It’s possible that we may ex perience
another all time high during the present recov ery period. This would
support the megaphone formation. A failure to make new highs would
support the head and shoulders argument. In both formations the
conclusion of the present recov ery would call for a third and final bearmarket. An estimated time for the conclusion o f the final bear market is
approximately 20 18.
The lesser downside target of both formations is the megaphone
formation as it likely calls for a bottom 1,0 00 to 2,000 points below the
2009 low, which would be around Dow 5,00 0.
In the head and shoulders formation the measurement calls for a bottom
around Dow Jones Industrials 1,0 00. This is almost an unimaginable
eve nt regarding the possible fundamentals to c reate this scenario. If this
did happen, ev ery thing that could go wrong would have to go wrong.
This scenario is so dark that it doesn’t seem possible but neve rtheless,
the head and shoulders formation is there and will be waiting until we
pierce the all-time highs of Octobe r 200 7 .
Remember these are simply possible scenarios and are not embedded in
fact. Whatever the outc ome, it never hurts to be a little cautious with
some of your money . But in the worst case scenario, every thing that we
take for granted as being safe . . . . would not be safe. This is something
to never forget in the event things go v ery badly.

8/2/2019 02/27/12 Update of Stock Market Trends & Observations
http://slidepdf.com/reader/full/022712-update-of-stock-market-trends-observations 102/271
pdfcrowd.comopen in browser PRO version Are you a developer? Try out the HTML to PDF API New hot app: Facebook Albums To PDF
Hopefully we will never have to think about the worst case scenario.
****************************************************************
EDSON GOULD
Edson Gould, Premier Stock Market Strategist – Edson
Gould had a profound influence o n the dev elopment of my
techniques and indicators. Prior to me subscribing to his
advisory servic e, I was just one of the crowd.
After 40 y ears I still have many of the publications from hisadvisory servic e, “Findings & Forecasts”. Fearing the loss of these
hard copy reports I hav e recently scanned and created pdf files of
these reports. Now I have hard copies and computerized ver sions
of the reports.
My series #1 indicator w as mentioned by Gould only o nce in his
market letters. If you didn’t catch its importance, too bad,
because he only gav e yo u a peek. I believe that he used this tool
extensiv ely and never told the world it’s importance. Prior to
Gould writing about this indicator I had been loo king for o ne that
had similar characteristics without succ ess. Thus when Gould
wrote about it, I recognized instantly that I had struck gold. I
have mo dified this indicator slightly and re searched it back to
19 39 for the Industrials, Transportations and Utilities . This was a
lot of work as it was before co mputers and online data (remember
when Barrons was available only on paper, still is for the distant
past).
Edson Gould was truly a legend in his own time. It’s too bad that
today many people hav e forgotten or never heard of him or his
discov eries. Below y ou will find only the first page of these
t A t i h t i ht ll it Th t f th t

8/2/2019 02/27/12 Update of Stock Market Trends & Observations
http://slidepdf.com/reader/full/022712-update-of-stock-market-trends-observations 103/271
pdfcrowd.comopen in browser PRO version Are you a developer? Try out the HTML to PDF API New hot app: Facebook Albums To PDF
reports. A teaser is what yo u might call it. The rest of the reports
are available upon request. This is a man that deserves to be
remembered throughout technical analysis market history.
T he following are links to Edson Gould reports.
My Most Im portant Discov ery by Edson Gould
It was also my most important discov ery , for it ex plained the
irrational volatility o f markets that had my stified me in my early
years. During those early y ears I found nothing worked in
predic ting these irrational market swings. But the fog lifted afterreading this report and I began to understand how to begin
predicting the market. The book “Extrao rdinary Popular
Delusions and the Madness of Crowds” is very useful in explaining
crowd behavior.
Edson Gould Profile by MT A
Edson Gould Conc epts by William Scheinm an
Decade Cycle by Edson Gould
Decade Cyc le Update by Ned Davis
Swing Principle by Edson Gould
A measuring indicator
Utilities by Edson Gould
A forecasting indicator
Dividends by Edson Gould
Bonds by Edson Gould
Speed Lines by Edson Gould
Sentimeter by Edson Gould
With companies failing to pay dividends c ommensurate with their
earnings this indicator has failed As the market deteriorate in

8/2/2019 02/27/12 Update of Stock Market Trends & Observations
http://slidepdf.com/reader/full/022712-update-of-stock-market-trends-observations 104/271
pdfcrowd.comopen in browser PRO version Are you a developer? Try out the HTML to PDF API New hot app: Facebook Albums To PDF
earnings, this indicator has failed. As the market deteriorate in
the coming years, I would expec t dividends to return to their
former levels and this indicator will once again become useful.
Prior to the late 1990s, it had 100 y ears of success.
Bottoms by Edson Gould
This was written and directed at the upco ming bottom in 197 4 but
it applies to all major bottoms.
T hree Steps by Edson Gould
Where do y ou think my three steps principle came from? Straight
from this report although I modified the concept through the
years.
Edson Gou ld’s 1974 Forecast
Gould’s 197 4 forecast kept me bearish and short throughout 197 4
until the week before Christmas 197 4, during which I began
making long term purchases. After that it was ride the bull phases
that transpired from 197 5 to 1982. 1982 to 2000 was the greatest
bull market of all time.
Edson Gou ld’s 1975 Forecast
Edson Gou ld’s 1976 Forecast
Edson Gould’s 197 7 Forecast
Edson Gould’s Five Y ear Forecast 1977 to 1982
This was a remarkable forecast in 197 7 , where the Dow Industrials
had never been higher than 1,00 0. NO ONE had predicted a rise o f
this magnitude in 197 7 . Most were waiting for a resumption of the
bear market.
As part of the 197 7 to 1982 forecast I have the following story. On
Wednesday August 4, 1 982 I went long the market for the first
time in months. By Friday, August 6 I was worried that I had
made a mistake as I was deep in the red (I was long the Kansas City
Stock Market Contrac ts) The Kansas City Stoc k Market Contract
8/2/2019 02/27/12 Update of Stock Market Trends & Observations
http://slidepdf.com/reader/full/022712-update-of-stock-market-trends-observations 105/271
pdfcrowd.comopen in browser PRO version Are you a developer? Try out the HTML to PDF API New hot app: Facebook Albums To PDF
Stock Market Contrac ts). The Kansas City Stoc k Market Contract
was the first of the stock index co ntracts (February 1 982). It was
based on the Value Line Arithmetic Index , margin requirement
were quite low, and it had a multiplier of 1 00 times the Value Line
Arithmetic Index, which meant the leverage was very high. On
Friday (Aug 6), my wife and I went to dinner and I to ld her my tale
of woe and asked her whether I should sell my long positions. I
explained that my series #1 indicator had rev ersed and continued
higher on Thursday and Friday but the market had continued
lower. Since the key indicator was usually corre ct, we decided to
stick it out awhile longer (I was crazy in those days). On Monday
August 9, 1982 the market took off like a rocket and never looked
back. The ignition for the 1982 to 200 0 bull market was
underway. I skyroc keted out of the red and had a big profit. In
August 1982 the o nly peo ple that were bullish were Edson Gould,
Robert Prechter and myself (probably a c ouple of others but I
didn’t know them). Eve ry one else was extremely bearish. It was a
perfect example of extre me crowd behavior.
Sign Of The Bull by Edson Gould
****************************************************************
TRANSACTION SIGNALS
All actionable signals are only for short term time frames. Thesesignals are not designed for intermediate or long term time frames
BUT . . . . .
After a short term buy signal, long term tax status can be
achieved by a continuation of the upward trend, which causes
short term actions to morph into long term holdings.
8/2/2019 02/27/12 Update of Stock Market Trends & Observations
http://slidepdf.com/reader/full/022712-update-of-stock-market-trends-observations 106/271
pdfcrowd.comopen in browser PRO version Are you a developer? Try out the HTML to PDF API New hot app: Facebook Albums To PDF
See more details in the glossary under “Tax es, Futures Contracts”
and “Money Management”.
Glossary Link
T RANSACT ION RECORD
In this blog a warning of an impending botto m (or top) is often
issued well in advance o f the formal buy or sell date. This allows
thoughtful consideration prior to a formal action signal. To get asense of how this works, you should read the days prior to a
formal buy /sell signal. I often buy/sell in my personal account
based on the early warnings.
The transaction record near stock market bottoms will show that I
am ve ry skittish and usually remain so until the new direction is
well underway .
Qualified buy signal given from December 5th toDecem ber 20th, 2011
Buy signal in October 2011 was never issued due t o a
SERIOUS family illness
SELL – SEPTEMBER 9, 2011
BUY – AUGUST 30, 2011
SELL – AUGUST 30, 2011 – Stopped out, re-bought quic kly
BUY – AUGUST 29, 2011SELL – AUGUST 25, 2011
BUY – AUGUST 23, 2011
SELL – AUGUST 1, 2011
BUY – JUNE 23, 20 11
****************************************************************
8/2/2019 02/27/12 Update of Stock Market Trends & Observations
http://slidepdf.com/reader/full/022712-update-of-stock-market-trends-observations 107/271
pdfcrowd.comopen in browser PRO version Are you a developer? Try out the HTML to PDF API New hot app: Facebook Albums To PDF
Share this:
MISCELLANEOUS
There are useful items throughout this blog. For instance, the
“Wall Street Quotes” can be v ery instructive. So make sure and
look all through the blog.
Comments: Be the first to comm ent
Stock Market Update – 02/04/12Pos ted February 5, 201 2 by Bob
Categories: DAILY UPDATE
Twitter 2 Facebo ok Li nked In 1 Reddit
Digg Email Print
CLI CK HERE IF READING PDF
****************************************************************
CYCLES

8/2/2019 02/27/12 Update of Stock Market Trends & Observations
http://slidepdf.com/reader/full/022712-update-of-stock-market-trends-observations 108/271
pdfcrowd.comopen in browser PRO version Are you a developer? Try out the HTML to PDF API New hot app: Facebook Albums To PDF
Previously I said: “It’s alway s possible that we could see nothing more
than 1-3 day c orrections with a resumption of the rally. That’s really great market action if it continues.” And that’s exactly what’s been
happening. The next po ssibility for a cy cle bottom is late February o r
early March per the 1950 dataset.
The best possible outco me for the late January cy cle bottom is that it is
invisible because the larger 18 month cyc le is exerting strong upward
influence and ov erriding the shorter term cy cles. Hopefully this is true
but we won’t know for sure until later.
The 1950 dataset shows:.
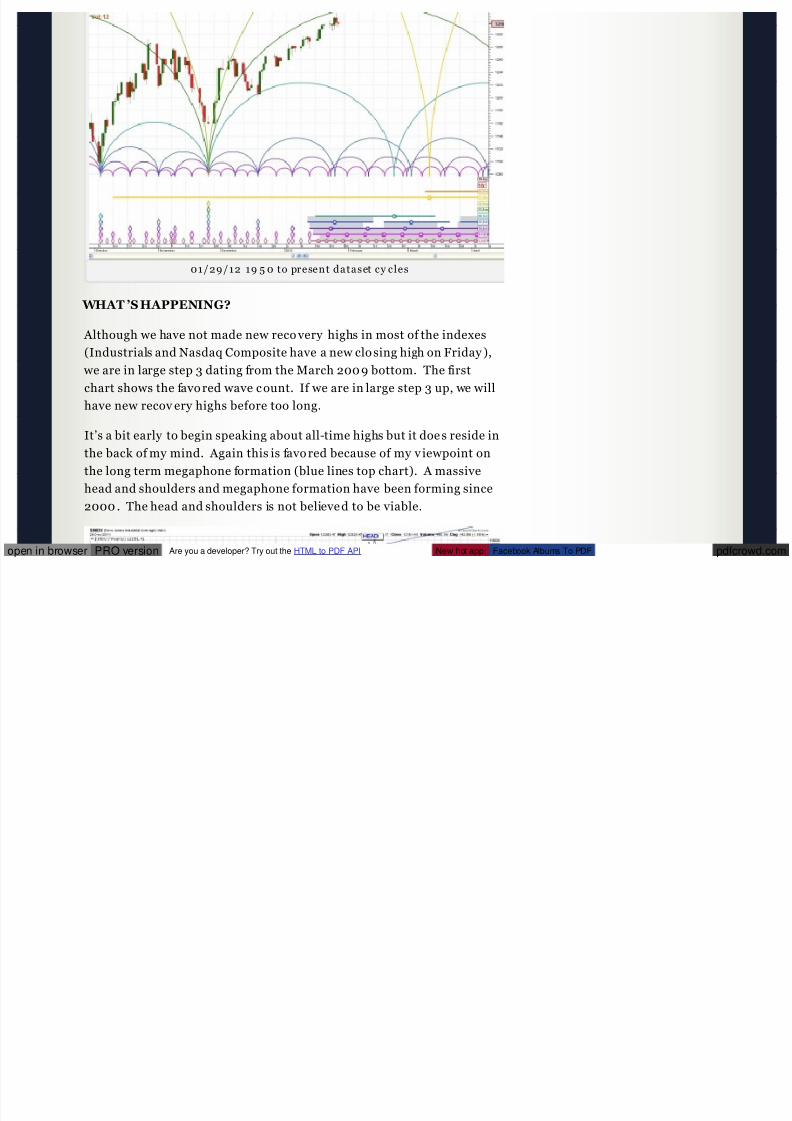
8/2/2019 02/27/12 Update of Stock Market Trends & Observations
http://slidepdf.com/reader/full/022712-update-of-stock-market-trends-observations 109/271
pdfcrowd.comopen in browser PRO version Are you a developer? Try out the HTML to PDF API New hot app: Facebook Albums To PDF
01/29/12 19 5 0 to present dataset cy cles
WHAT ’S HAPPENING?
Although we have not made new reco very highs in most of the indexes
(Industrials and Nasdaq Composite have a new clo sing high on Friday ),
we are in large step 3 dating from the March 200 9 bottom. The first
chart shows the favo red wave c ount. If we are in large step 3 up, we will
have new recov ery highs before too long.
It’s a bit early to begin speaking about all-time highs but it doe s reside in
the back of my mind. Again this is favo red because of my v iewpoint onthe long term megaphone formation (blue lines top chart). A massive
head and shoulders and megaphone formation have been forming since
2000 . The head and shoulders is not believe d to be viable.

8/2/2019 02/27/12 Update of Stock Market Trends & Observations
http://slidepdf.com/reader/full/022712-update-of-stock-market-trends-observations 110/271
pdfcrowd.comopen in browser PRO version Are you a developer? Try out the HTML to PDF API New hot app: Facebook Albums To PDF
The last large megaphone formation was 1965 to 1 97 4. I believe we are
doing the same as 1965-197 4 only the timeline is doubled. The
expec tation is that we will finish the megaphone in 201 8.
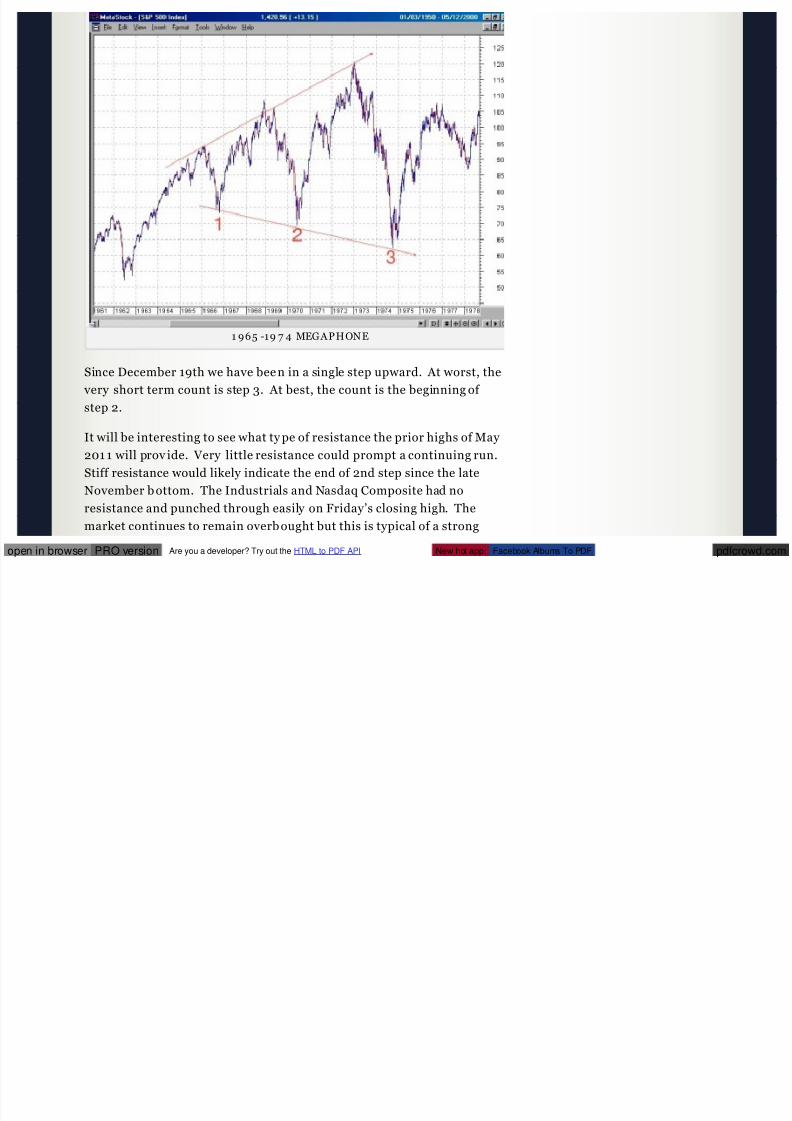
8/2/2019 02/27/12 Update of Stock Market Trends & Observations
http://slidepdf.com/reader/full/022712-update-of-stock-market-trends-observations 111/271
pdfcrowd.comopen in browser PRO version Are you a developer? Try out the HTML to PDF API New hot app: Facebook Albums To PDF
1 965 -19 7 4 MEGAPHONE
Since December 19th we have bee n in a single step upward. At worst, the
very short term count is step 3. At best, the count is the beginning of
step 2.
It will be interesting to see what ty pe of resistance the prior highs of May
201 1 will prov ide. Very little resistance could prompt a continuing run.
Stiff resistance would likely indicate the end of 2nd step since the late
November b ottom. The Industrials and Nasdaq Composite had no
resistance and punched through easily on Friday’s closing high. The
market continues to remain overb ought but this is typical of a strong
bull run, ov erbought with a refusal to correc t.
I remain in an “overall” uptrend theme as per prev ious updates.

8/2/2019 02/27/12 Update of Stock Market Trends & Observations
http://slidepdf.com/reader/full/022712-update-of-stock-market-trends-observations 112/271
pdfcrowd.comopen in browser PRO version Are you a developer? Try out the HTML to PDF API New hot app: Facebook Albums To PDF
2 01 2-02 -04 IND DAILY LONG TERM
Weekly candlestick charts since 20 08 with Fibonacci speed lines.

8/2/2019 02/27/12 Update of Stock Market Trends & Observations
http://slidepdf.com/reader/full/022712-update-of-stock-market-trends-observations 113/271
pdfcrowd.comopen in browser PRO version Are you a developer? Try out the HTML to PDF API New hot app: Facebook Albums To PDF
201 2-02-04 T SX WEEKLY

8/2/2019 02/27/12 Update of Stock Market Trends & Observations
http://slidepdf.com/reader/full/022712-update-of-stock-market-trends-observations 114/271
pdfcrowd.comopen in browser PRO version Are you a developer? Try out the HTML to PDF API New hot app: Facebook Albums To PDF
2 01 2 -02-04 IND WEEKLY

8/2/2019 02/27/12 Update of Stock Market Trends & Observations
http://slidepdf.com/reader/full/022712-update-of-stock-market-trends-observations 115/271
pdfcrowd.comopen in browser PRO version Are you a developer? Try out the HTML to PDF API New hot app: Facebook Albums To PDF
2 01 2 -02-04 COMP & VLE WEEKLY

8/2/2019 02/27/12 Update of Stock Market Trends & Observations
http://slidepdf.com/reader/full/022712-update-of-stock-market-trends-observations 116/271
pdfcrowd.comopen in browser PRO version Are you a developer? Try out the HTML to PDF API New hot app: Facebook Albums To PDF

8/2/2019 02/27/12 Update of Stock Market Trends & Observations
http://slidepdf.com/reader/full/022712-update-of-stock-market-trends-observations 117/271
pdfcrowd.comopen in browser PRO version Are you a developer? Try out the HTML to PDF API New hot app: Facebook Albums To PDF
201 2-02-04 SPX WEEKLY
Daily c andlestick charts since May 20 09

8/2/2019 02/27/12 Update of Stock Market Trends & Observations
http://slidepdf.com/reader/full/022712-update-of-stock-market-trends-observations 118/271
pdfcrowd.comopen in browser PRO version Are you a developer? Try out the HTML to PDF API New hot app: Facebook Albums To PDF
2 01 2-02 -04 IND DAILY
The Nasdaq composite on Friday also ex ceeded its May 201 1 high.There was no resistance, it gapped right through the old highs. It’s
almost always good market action to see the Nasdaq leading the
advance. When this index begins lagging we’ll know that a corre ction is
near.
The Value Line Index mo ve d through its 2007 all-time highs in April
201 0. Currently the index is drawing in on the May 20 11 highs.

8/2/2019 02/27/12 Update of Stock Market Trends & Observations
http://slidepdf.com/reader/full/022712-update-of-stock-market-trends-observations 119/271
pdfcrowd.comopen in browser PRO version Are you a developer? Try out the HTML to PDF API New hot app: Facebook Albums To PDF

8/2/2019 02/27/12 Update of Stock Market Trends & Observations
http://slidepdf.com/reader/full/022712-update-of-stock-market-trends-observations 120/271
pdfcrowd.comopen in browser PRO version Are you a developer? Try out the HTML to PDF API New hot app: Facebook Albums To PDF
2 01 2 -02-04 C OMP & VLE DAILY

8/2/2019 02/27/12 Update of Stock Market Trends & Observations
http://slidepdf.com/reader/full/022712-update-of-stock-market-trends-observations 121/271
pdfcrowd.comopen in browser PRO version Are you a developer? Try out the HTML to PDF API New hot app: Facebook Albums To PDF
20 1 2-02-04 SPX DAILY
Price limiting bands on daily charts since 200 9

8/2/2019 02/27/12 Update of Stock Market Trends & Observations
http://slidepdf.com/reader/full/022712-update-of-stock-market-trends-observations 122/271
pdfcrowd.comopen in browser PRO version Are you a developer? Try out the HTML to PDF API New hot app: Facebook Albums To PDF

8/2/2019 02/27/12 Update of Stock Market Trends & Observations
http://slidepdf.com/reader/full/022712-update-of-stock-market-trends-observations 123/271
pdfcrowd.comopen in browser PRO version Are you a developer? Try out the HTML to PDF API New hot app: Facebook Albums To PDF

8/2/2019 02/27/12 Update of Stock Market Trends & Observations
http://slidepdf.com/reader/full/022712-update-of-stock-market-trends-observations 124/271
pdfcrowd.comopen in browser PRO version Are you a developer? Try out the HTML to PDF API New hot app: Facebook Albums To PDF
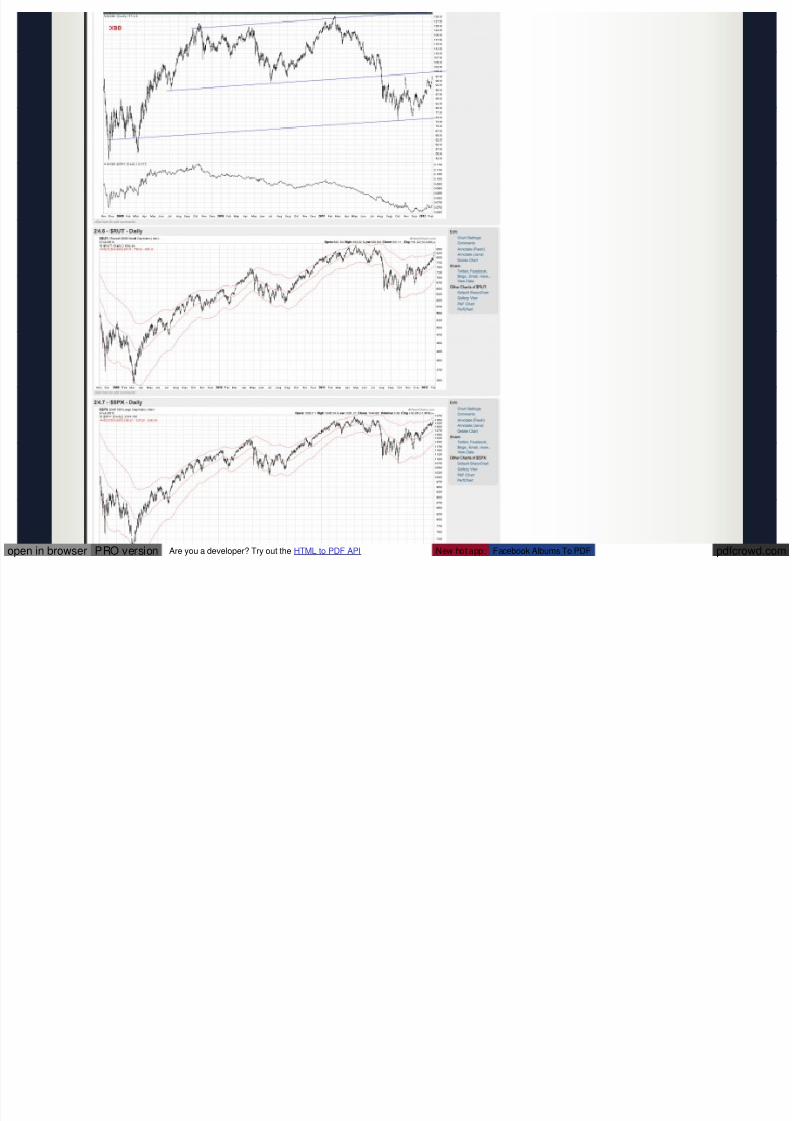
8/2/2019 02/27/12 Update of Stock Market Trends & Observations
http://slidepdf.com/reader/full/022712-update-of-stock-market-trends-observations 125/271
pdfcrowd.comopen in browser PRO version Are you a developer? Try out the HTML to PDF API New hot app: Facebook Albums To PDF
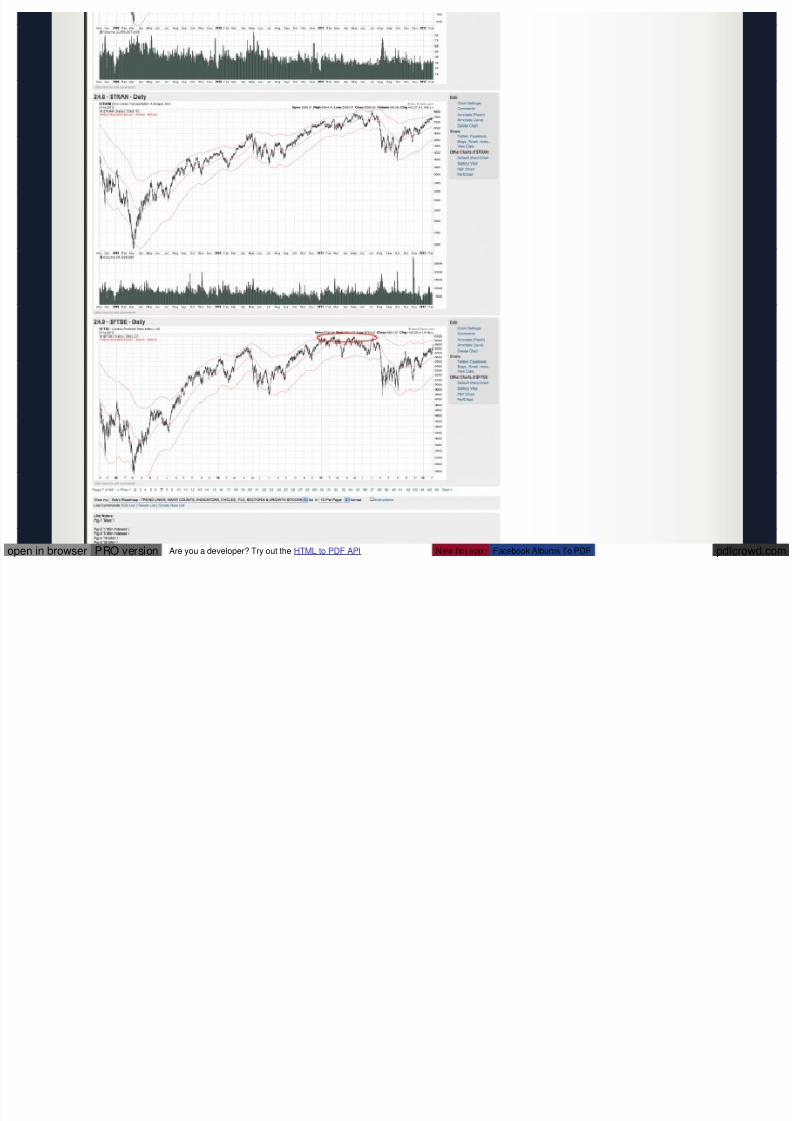
8/2/2019 02/27/12 Update of Stock Market Trends & Observations
http://slidepdf.com/reader/full/022712-update-of-stock-market-trends-observations 126/271
pdfcrowd.comopen in browser PRO version Are you a developer? Try out the HTML to PDF API New hot app: Facebook Albums To PDF

8/2/2019 02/27/12 Update of Stock Market Trends & Observations
http://slidepdf.com/reader/full/022712-update-of-stock-market-trends-observations 127/271
pdfcrowd.comopen in browser PRO version Are you a developer? Try out the HTML to PDF API New hot app: Facebook Albums To PDF
201 2-02-04 INDEXES DAI LY – LIMITING BANDS
60 minute charts since June 201 1
20 1 2-02-04 TSX 60 MINUTE

8/2/2019 02/27/12 Update of Stock Market Trends & Observations
http://slidepdf.com/reader/full/022712-update-of-stock-market-trends-observations 128/271
pdfcrowd.comopen in browser PRO version Are you a developer? Try out the HTML to PDF API New hot app: Facebook Albums To PDF
2012-02-04 IND 60 MINUTE
201 2-02-04 COMP 60 MINUTE
Internal Indicators
The next c hart is the new highs and it is expanding as the market moves
up. Obv iously this is good market action.

8/2/2019 02/27/12 Update of Stock Market Trends & Observations
http://slidepdf.com/reader/full/022712-update-of-stock-market-trends-observations 129/271
pdfcrowd.comopen in browser PRO version Are you a developer? Try out the HTML to PDF API New hot app: Facebook Albums To PDF
201 2-02-04 NET NEW HIGHS
The advance decline line (cumulative) is at an all-time high

8/2/2019 02/27/12 Update of Stock Market Trends & Observations
http://slidepdf.com/reader/full/022712-update-of-stock-market-trends-observations 130/271
pdfcrowd.comopen in browser PRO version Are you a developer? Try out the HTML to PDF API New hot app: Facebook Albums To PDF
20 1 2 -02-04 ADVA NCE DECLINE CUMULATIVE
The cumulative net v olume line is not at a new high but it is showing a
strong uptrend.

8/2/2019 02/27/12 Update of Stock Market Trends & Observations
http://slidepdf.com/reader/full/022712-update-of-stock-market-trends-observations 131/271
pdfcrowd.comopen in browser PRO version Are you a developer? Try out the HTML to PDF API New hot app: Facebook Albums To PDF

8/2/2019 02/27/12 Update of Stock Market Trends & Observations
http://slidepdf.com/reader/full/022712-update-of-stock-market-trends-observations 132/271
pdfcrowd.comopen in browser PRO version Are you a developer? Try out the HTML to PDF API New hot app: Facebook Albums To PDF
2 01 2 -02-04 NET VOLUME CUMMULATIVE
The Dow Theory co ntinues to have co nfirming recov ery highs. The
Industrials exceeded the May 20 11 closing high without a confirmation
from the Transportations. We’ll keep an ey e on a c onfirmation by the
Transports.

8/2/2019 02/27/12 Update of Stock Market Trends & Observations
http://slidepdf.com/reader/full/022712-update-of-stock-market-trends-observations 133/271
pdfcrowd.comopen in browser PRO version Are you a developer? Try out the HTML to PDF API New hot app: Facebook Albums To PDF
201 2-02-04 DOW THEORY
This is my super secret buy /sell indicator (Series #1) in red. The chart
show the Industrials and series #1 since May 20 10 . The decline from
May to October 20 11 was not reflected in the series #1 indicator. I
would interpret this as investors co ntinuing to ex ert a co ntinuous
buying influence o n the market.
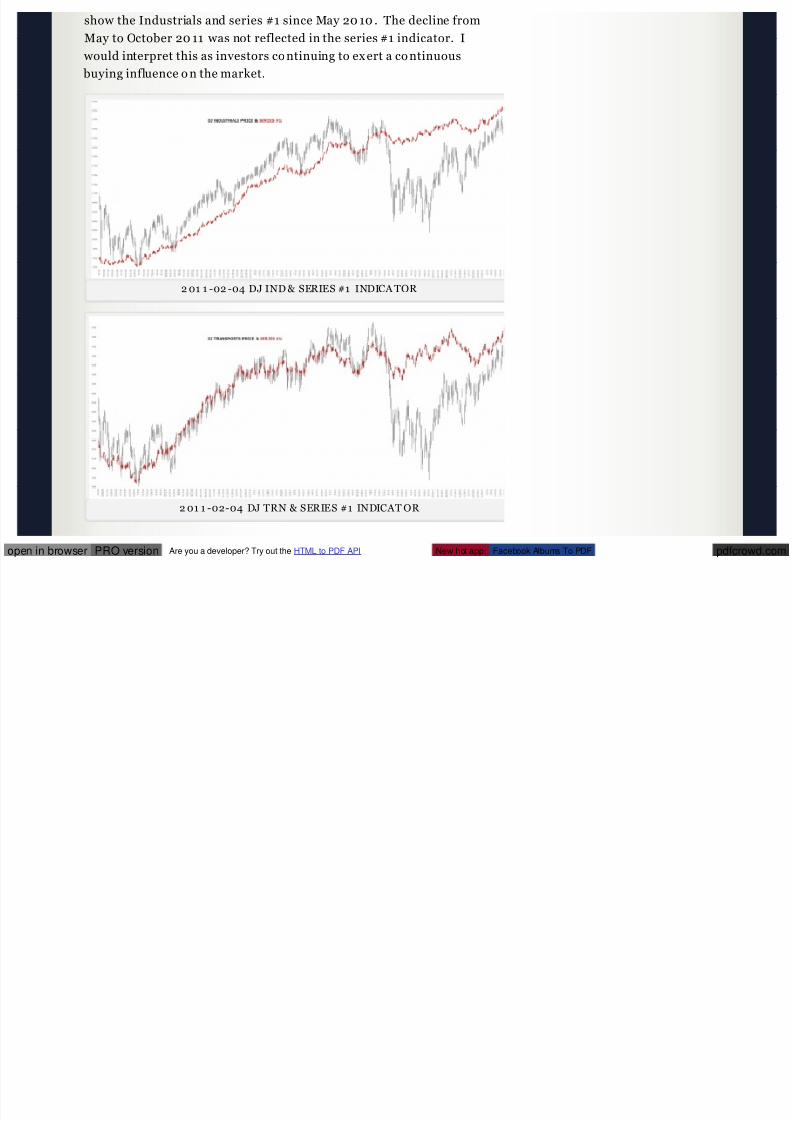
8/2/2019 02/27/12 Update of Stock Market Trends & Observations
http://slidepdf.com/reader/full/022712-update-of-stock-market-trends-observations 134/271
pdfcrowd.comopen in browser PRO version Are you a developer? Try out the HTML to PDF API New hot app: Facebook Albums To PDF
2 01 1 -02 -04 DJ IND & SERIES #1 INDICA TOR
2 01 1 -02-04 DJ TRN & SERIES #1 INDICAT OR
The following chart is the Tranportations av erage and the series #1
indicator since January 20 07 . There was ample warning in this
indicator that the market was in trouble prior to the peak in Octobe r
2007 . The Transports made a subsequent high after Oct 200 7 but the
series #1 indicator was far below its high early in 2007 .

8/2/2019 02/27/12 Update of Stock Market Trends & Observations
http://slidepdf.com/reader/full/022712-update-of-stock-market-trends-observations 135/271
pdfcrowd.comopen in browser PRO version Are you a developer? Try out the HTML to PDF API New hot app: Facebook Albums To PDF
2 01 1 -02-04 TRN & SERIES #1 INDICAT OR
All of the abov e charts (exc ept the series #1 charts) are available on my
chart link below.
CHARTS
MY CHART LINK (updated constantly)
These are my personal charts and my playground for doodling
trend lines, wave counts and other ideas.
I draw the trend lines and wave co unts on a daily basis (sometimes
more often). Y ou can find these doodles from 1 minute to
monthly charts.
I usually restrict my trend lines and wave counts to the first three
charts on eac h page, TSX, DJI & COMPQ. The other c harts on the
page are usually for c onfirmation of the trend and wave structure.
Page 1 – Buy /Sell Signals & Misc Charts
Page 2 – Index es With 1 Minute Bars
Page 3 – Index es With 5 Minute Bars
Page 4 – Index es With 15 Minute Bars
Page 5 Index es With 30 Minute Bars

8/2/2019 02/27/12 Update of Stock Market Trends & Observations
http://slidepdf.com/reader/full/022712-update-of-stock-market-trends-observations 136/271
pdfcrowd.comopen in browser PRO version Are you a developer? Try out the HTML to PDF API New hot app: Facebook Albums To PDF
Page 5 – Index es With 30 Minute BarsPage 6 – Index es With 60 Minute Bars
Page 7 – Indexes With Daily Bars
Page 8 – Index es With Weekly Bars (since 1 981)
Page 9 – Indexes With Monthly Bars (since 1 981)
Page 10 – Indexes With 60 Minute Bars, Candlestick
Page 11 – Indexes With Daily Bars, Candlesticks
Page 12 – Index es With Weekly Bars, Candlestick
Pages 13 through 1 4 are shorter term indicators. The indicators
are used to simply look for some type o f leading action before a
turn or confirming action of the wave co unt. Page 13 is a look-
eve ry day indicator page. The other indicator pages are less
frequently visited.
Page 15 – Hurst FLD Projections
Page 16 – Indicators, Long Term
Page 17 – International Indexes
Page 18 through 30 are sector ETFs. They represent most of the
active sector ETFs and are always a good hunting ground when
looking for something that is breaking in a new direction.
Page 31 through 46 are growth stocks with indicators. These are
stocks that have bee n in a lengthy uptrend. One qualification is
that they must not be sev erely damaged in a bear market so they
can’t rise to significant new highs in the following bull market.
The growth stocks show daily market action for the last 1.5 y ears
and weekly prices since 1992. This gives a good perspective of
how they have be haved in the immediate past (daily c harts) and
how they behaved during good and bad times (weekly charts).
Page 46 – Last 6 charts are trades from the mec hanical sell/buy
signals

8/2/2019 02/27/12 Update of Stock Market Trends & Observations
http://slidepdf.com/reader/full/022712-update-of-stock-market-trends-observations 137/271
pdfcrowd.comopen in browser PRO version Are you a developer? Try out the HTML to PDF API New hot app: Facebook Albums To PDF
WAVE COUNT S SIMPLIFIED
My wave counts are not Elliott Wave! It’s different, simple and
functions w ithout a maze of exclusions.
T here are 3 peaks (or valleys) to a com pleted wave cou nt.
A rev ersal of trend takes place after a completed wave count.
Often times it’s as simple as counting 3 bumps (or dips) on a chart .. . Other times, not so easy .
In a downtrend the same rules apply ex cept y ou are co unting 3
dips instead of 3 bumps.
3 steps m ust stay confined to a channel. Laying a pen or
pencil on the c hart will help y ou v isualize the channel.
As the larger trend progresses, all of the steps that make up the
trend will also be co nfined to a larger channel. Sometimes a
channel is not clear until the surge phase (vertical mov e) hasended.
When the m arket breaks its channel (regardless of the
perceived wave cou nt), the step has been terminated.
(Make sure yo ur channel was correctly drawn before c alling a
termination). Sometimes this may be y our best indicator that a
wave count is completed.
The correction following the second step is larger than the
correc tion that followed the first step, and obv iously the
correc tion following third step is larger than the second step
correction.
A single wave m ay sub-divide into another 3 waves. I will
call this an ex tension. When this happens (1) the trend is still
intact, (2) the channel will widened and (3) instead of a total of
3 steps there will be 5 steps

8/2/2019 02/27/12 Update of Stock Market Trends & Observations
http://slidepdf.com/reader/full/022712-update-of-stock-market-trends-observations 138/271
pdfcrowd.comopen in browser PRO version Are you a developer? Try out the HTML to PDF API New hot app: Facebook Albums To PDF
3 steps, there will be 5 steps.Sometimes I will use the terms “step” and “wave” interchangeably .
Reading the glossary helps in the understanding of this blog.
There are many other important facts in the glossary.
Glossary Link
ABBREVIATIONS
DJI = Dow Jones Industr ialsDJT = Dow Jones Transportat ions
SPX = SP 50 0
ES = SP 500 Futures
COMPQ = Nasdaq Composite Index
TSX = Toro nto Stock Exchange (Canadian blue chips)
SOX = Semico nducto rs
TXX = Technolo gy
****************************************************************
Long T erm – UP
Uptrend
Mar 2009 To Present
Step 2 Up (of 3) Com pleted
Step 3 Up Has Likely Begun
From the bottom in March 200 9
Large step one up ended in May 2010
Large step two up ended in May 2011
Large step three is underway

8/2/2019 02/27/12 Update of Stock Market Trends & Observations
http://slidepdf.com/reader/full/022712-update-of-stock-market-trends-observations 139/271
pdfcrowd.comopen in browser PRO version Are you a developer? Try out the HTML to PDF API New hot app: Facebook Albums To PDF

8/2/2019 02/27/12 Update of Stock Market Trends & Observations
http://slidepdf.com/reader/full/022712-update-of-stock-market-trends-observations 140/271

8/2/2019 02/27/12 Update of Stock Market Trends & Observations
http://slidepdf.com/reader/full/022712-update-of-stock-market-trends-observations 141/271
bull market rallies. Each bear market had a lower low than the
previous b ear. The interve ning bull market rallies saw new all
time highs before the nex t bear market began.
We also have formed a huge head and shoulders formation since
1998. If this formation is valid, the downside measurement calls
for a bottom around Dow Jones Industrials 1,0 00.
We began a long term bull market in March 2009.
I favor the m egaphone formation as the m ost likely
scenario.

8/2/2019 02/27/12 Update of Stock Market Trends & Observations
http://slidepdf.com/reader/full/022712-update-of-stock-market-trends-observations 142/271
pdfcrowd.comopen in browser PRO version Are you a developer? Try out the HTML to PDF API New hot app: Facebook Albums To PDF
Since 2000 we have had two bear markets, 2000 to 200 3 and 2007 to
2009. Like 1966 to 197 4, the recov ery from the first bear market saw a
new all time high (2007 peak). It’s possible that we may ex perience
another all time high during the present recov ery period. This would
support the megaphone formation. A failure to make new highs would
support the head and shoulders argument. In both formations the
conclusion of the present recov ery would call for a third and final bear
market. An estimated time for the conclusion o f the final bear market is
approximately 20 18.
The lesser downside target of both formations is the megaphone
formation as it likely calls for a bottom 1,0 00 to 2,000 points below the
2009 low, which would be around Dow 5,00 0.
In the head and shoulders formation the measurement calls for a bottom
around Dow Jones Industrials 1,0 00. This is almost an unimaginableeve nt regarding the possible fundamentals to c reate this scenario. If this
did happen, ev ery thing that could go wrong would have to go wrong.
This scenario is so dark that it doesn’t seem possible but neve rtheless,
the head and shoulders formation is there and will be waiting until we
pierce the all-time highs of Octobe r 200 7 .
Remember these are simply possible scenarios and are not embedded infact. Whatever the outc ome, it never hurts to be a little cautious with
some of your money . But in the worst case scenario, every thing that we
take for granted as being safe . . . . would not be safe. This is something
to never forget in the event things go v ery badly.
Hopefully we will never have to think about the worst case scenario.
****************************************************************

8/2/2019 02/27/12 Update of Stock Market Trends & Observations
http://slidepdf.com/reader/full/022712-update-of-stock-market-trends-observations 143/271
pdfcrowd.comopen in browser PRO version Are you a developer? Try out the HTML to PDF API New hot app: Facebook Albums To PDF
EDSON GOULD
Edson Gould, Premier Stock Market Strategist – Edson
Gould had a profound influence o n the dev elopment of my
techniques and indicators. Prior to me subscribing to his
advisory servic e, I was just one of the crowd.
After 40 y ears I still have many of the publications from his
advisory servic e, “Findings & Forecasts”. Fearing the loss of these
hard copy reports I hav e recently scanned and created pdf files of
these reports. Now I have hard copies and computerized ver sions
of the reports.
My series #1 indicator w as mentioned by Gould only o nce in his
market letters. If you didn’t catch its importance, too bad,
because he only gav e yo u a peek. I believe that he used this tool
extensiv ely and never told the world it’s importance. Prior to
Gould writing about this indicator I had been loo king for o ne that
had similar characteristics without succ ess. Thus when Gould
wrote about it, I recognized instantly that I had struck gold. I
have mo dified this indicator slightly and re searched it back to
19 39 for the Industrials, Transportations and Utilities . This was a
lot of work as it was before co mputers and online data (remember
when Barrons was available only on paper, still is for the distant
past).
Edson Gould was truly a legend in his own time. It’s too bad that
today many people hav e forgotten or never heard of him or his
discov eries. Below y ou will find only the first page of these
reports. A teaser is what yo u might call it. The rest of the reports
are available upon request. This is a man that deserves to be
remembered throughout technical analysis market history.
8/2/2019 02/27/12 Update of Stock Market Trends & Observations
http://slidepdf.com/reader/full/022712-update-of-stock-market-trends-observations 144/271
pdfcrowd.comopen in browser PRO version Are you a developer? Try out the HTML to PDF API New hot app: Facebook Albums To PDF
T he following are links to Edson Gould reports.
My Most Im portant Discov ery by Edson Gould
It was also my most important discov ery , for it ex plained the
irrational volatility o f markets that had my stified me in my early
years. During those early y ears I found nothing worked in
predic ting these irrational market swings. But the fog lifted after
reading this report and I began to understand how to begin
predicting the market. The book “Extrao rdinary Popular
Delusions and the Madness of Crowds” is very useful in explaining
crowd behavior.
Edson Gould Profile by MT A
Edson Gould Conc epts by William Scheinm an
Decade Cycle by Edson GouldDecade Cyc le Update by Ned Davis
Swing Principle by Edson Gould
A measuring indicator
Utilities by Edson Gould
A forecasting indicator
Dividends by Edson Gould
Bonds by Edson Gould
Speed Lines by Edson Gould
Sentimeter by Edson Gould
With companies failing to pay dividends c ommensurate with their
earnings, this indicator has failed. As the market deteriorate in
the coming years, I would expec t dividends to return to their
former levels and this indicator will once again become useful.
Prior to the late 1990s, it had 100 y ears of success.
8/2/2019 02/27/12 Update of Stock Market Trends & Observations
http://slidepdf.com/reader/full/022712-update-of-stock-market-trends-observations 145/271
pdfcrowd.comopen in browser PRO version Are you a developer? Try out the HTML to PDF API New hot app: Facebook Albums To PDF
Prior to the late 1990s, it had 100 y ears of success.
Bottoms by Edson Gould
This was written and directed at the upco ming bottom in 197 4 but
it applies to all major bottoms.
T hree Steps by Edson Gould
Where do y ou think my three steps principle came from? Straight
from this report although I modified the concept through the
years.
Edson Gou ld’s 1974 Forecast
Gould’s 197 4 forecast kept me bearish and short throughout 197 4
until the week before Christmas 197 4, during which I began
making long term purchases. After that it was ride the bull phases
that transpired from 197 5 to 1982. 1982 to 2000 was the greatest
bull market of all time.
Edson Gou ld’s 1975 ForecastEdson Gou ld’s 1976 Forecast
Edson Gould’s 197 7 Forecast
Edson Gould’s Five Y ear Forecast 1977 to 1982
This was a remarkable forecast in 197 7 , where the Dow Industrials
had never been higher than 1,00 0. NO ONE had predicted a rise o f
this magnitude in 197 7 . Most were waiting for a resumption of the
bear market.
As part of the 197 7 to 1982 forecast I have the following story. On
Wednesday August 4, 1 982 I went long the market for the first
time in months. By Friday, August 6 I was worried that I had
made a mistake as I was deep in the red (I was long the Kansas City
Stock Market Contrac ts). The Kansas City Stoc k Market Contract
was the first of the stock index co ntracts (February 1 982). It was
based on the Value Line Arithmetic Index , margin requirement
were quite low, and it had a multiplier of 1 00 times the Value Line

8/2/2019 02/27/12 Update of Stock Market Trends & Observations
http://slidepdf.com/reader/full/022712-update-of-stock-market-trends-observations 146/271
pdfcrowd.comopen in browser PRO version Are you a developer? Try out the HTML to PDF API New hot app: Facebook Albums To PDF
q , p
Arithmetic Index, which meant the leverage was very high. On
Friday (Aug 6), my wife and I went to dinner and I to ld her my tale
of woe and asked her whether I should sell my long positions. I
explained that my series #1 indicator had rev ersed and continued
higher on Thursday and Friday but the market had continued
lower. Since the key indicator was usually corre ct, we decided to
stick it out awhile longer (I was crazy in those days). On Monday August 9, 1982 the market took off like a rocket and never looked
back. The ignition for the 1982 to 200 0 bull market was
underway. I skyroc keted out of the red and had a big profit. In
August 1982 the o nly peo ple that were bullish were Edson Gould,
Robert Prechter and myself (probably a c ouple of others but I
didn’t know them). Eve ry one else was extremely bearish. It was a
perfect example of extre me crowd behavior.
Sign Of The Bull by Edson Gould
****************************************************************
TRANSACTION SIGNALS
All actionable signals are only for short term time frames. These
signals are not designed for intermediate or long term time framesBUT . . . . .
After a short term buy signal, long term tax status can be
achieved by a continuation of the upward trend, which causes
short term actions to morph into long term holdings.
See more details in the glossary under “Tax es, Futures Contracts”
and “Money Management”.

8/2/2019 02/27/12 Update of Stock Market Trends & Observations
http://slidepdf.com/reader/full/022712-update-of-stock-market-trends-observations 147/271
pdfcrowd.comopen in browser PRO version Are you a developer? Try out the HTML to PDF API New hot app: Facebook Albums To PDF
Glossary Link
T RANSACT ION RECORD
In this blog a warning of an impending botto m (or top) is often
issued well in advance o f the formal buy or sell date. This allows
thoughtful consideration prior to a formal action signal. To get a
sense of how this works, you should read the days prior to aformal buy /sell signal. I often buy/sell in my personal account
based on the early warnings.
The transaction record near stock market bottoms will show that I
am ve ry skittish and usually remain so until the new direction is
well underway .
Qualified buy signal given from December 5th to
Decem ber 20th, 2011Buy signal in October 2011 was never issued due t o a
SERIOUS family illness
SELL – SEPTEMBER 9, 2011
BUY – AUGUST 30, 2011
SELL – AUGUST 30, 2011 – Stopped out, re-bought quic kly
BUY – AUGUST 29, 2011
SELL – AUGUST 25, 2011
BUY – AUGUST 23, 2011
SELL – AUGUST 1, 2011
BUY – JUNE 23, 20 11
****************************************************************
MISCELLANEOUS
There are useful items throughout this blog. For instance, the

8/2/2019 02/27/12 Update of Stock Market Trends & Observations
http://slidepdf.com/reader/full/022712-update-of-stock-market-trends-observations 148/271
pdfcrowd.comopen in browser PRO version Are you a developer? Try out the HTML to PDF API New hot app: Facebook Albums To PDF
Share this:
“Wall Street Quotes” can be v ery instructive. So make sure and
look all through the blog.
Comments: Be the first to comm ent
Elder Impulse System – 01/30/12Pos ted January 30, 201 2 by Bob
Categories: WORDS O F WISDOM
Twitter 2 Facebo ok Li nked In 1 Reddit
Digg Email Print
CLI CK HERE IF READING PDF
****************************************************************
ELDER IMPULSE SYST EM
On MY CHART LINK I hav e begun using the Elder Impulse System o n
the D.J. Industrials on pages 2-9. This is an interesting momentum based
sy stem. The following ex cerpt was taken from “COME INTO MY
TRADING ROOM A C l t G id t T di ” b D A l d Eld

8/2/2019 02/27/12 Update of Stock Market Trends & Observations
http://slidepdf.com/reader/full/022712-update-of-stock-market-trends-observations 149/271
pdfcrowd.comopen in browser PRO version Are you a developer? Try out the HTML to PDF API New hot app: Facebook Albums To PDF
TRADING ROOM, A Complete Guide to Trading” by Dr. A lex ander Elder.
Yo u can find this book at Amazon.com and it has great tidbits o f info.
Begin Quote :
Entries
I designed this system to identify the inflection points where a trend
speeds up or slows down. The Impulse Sy stem works in any timeframe,
including intraday. It pro vides buy and sell signals, but leave s it up to
you to select good markets, tweak parameters, and supply the discipline.
Choose an activ e market whose price s swing in a broad channel. What
happens if yo u make a C trade and grab only 10 % of a channel width? This
result is not too bad if the channel is 20 points wide, but a C trade is an
exe rcise in futility if the channel is only 5 po ints wide. Chase fat rabbits,
don’t waste your time o n skinny o nes.
The Impulse System c ombines two simple but powerful indicators. One
measures market inertia, the other its momentum. When both point in
the same direction, they identify an impulse worth following. We get an
entry signal when both indicators get in gear, but as soon as they stop
confirming one another, we take that as an exit signal.
The Impulse Sy stem uses an exponential mov ing average to find
uptrends and do wntrends. When the EMA rises, it shows that iner tia
favor s the bulls. When EMA falls, inertia works for the bears. The sec-
ond component is MACD-Histogram, an oscillator whose slope reflects
changes o f power among bulls or bears. When MACD-Histogram rises, it
shows that bulls are becoming stronger. When it falls, it shows that bears
are growing stronger.

8/2/2019 02/27/12 Update of Stock Market Trends & Observations
http://slidepdf.com/reader/full/022712-update-of-stock-market-trends-observations 150/271
pdfcrowd.comopen in browser PRO version Are you a developer? Try out the HTML to PDF API New hot app: Facebook Albums To PDF
The Impulse System flags those bars where bo th the inertia and the
momentum point in the same direc tion. When both the EMA and MACD-
Histogram rise, they show that bulls are ro aring and the uptrend is
accelerating. When both indicators fall together, they show that bears
are crushing the market. Those indicators may stay in gear with each
other for o nly a few bars, but that’s when the market trav els fast—the
impulse is on!
Before yo u rush to apply the Impulse System to y our favorite mar- ket,
remember how Triple Screen analyzes markets in more than one
timeframe. Select y our favo rite timeframe and c all it intermediate.
Multiply it by five to define your long-term timeframe. If yo ur favorite
chart is daily, analyze the weekly chart to make a strategic decision to be
a bull or a bear. Use a 26-week EMA, the s lope o f weekly MACD-
Histogram, or both, o n the weekly c hart.Once y ou’ve defined the long-term trend, return to y our daily chart and
look for trades only in the direction of the weekly. The Impulse System
uses a 13-day EMA and a 1 2-26-9 MACD-Histogram. The EMA, tracking
market inertia, is a little shorter than our usual 22 bars, mak- ing the
system more sensitive.
When the weekly trend is up, turn to the daily charts and wait for boththe 13-day EMA and MACD-Histogram to turn up. When both inertia and
momentum rise, you have a stro ng buy signal, telling yo u to get long and
stay long until the buy signal disappears.
When the weekly trend is do wn, turn to the daily charts and wait for both
the 13 -day EMA and MACD-Histogram to turn down. They give y ou a
signal to go short, but b e ready to co ver when that signal disappears.
Some technical programs allow yo u to mark price bars with different

8/2/2019 02/27/12 Update of Stock Market Trends & Observations
http://slidepdf.com/reader/full/022712-update-of-stock-market-trends-observations 151/271
pdfcrowd.comopen in browser PRO version Are you a developer? Try out the HTML to PDF API New hot app: Facebook Albums To PDF
co lors. Make them green when bo th the EMA and MACD-Histogram rise ,
and red when bo th indicators fall. Don’t mark the bars where the
indicators point in the opposite directions. This lets you easily see
signals at a glance.
Exits
When a cowboy at a rodeo hops on the back of a wild bronco, how long
does he ride it? Twenty seconds, 35 may be, 50 if he is good and lucky .
Wild momentum trades don’t last long either. Try to hop off while you’re
still in the money .
The time to buy into a momentum trade is when all yo ur ducks are in a
row, that is, when the weekly tre nd is up and the daily EMA and MACD-
Histogram are rising. Hop o ff as soon as a single indicator turns down.
Usually, daily MACD-Histogram turns first as the upside mo mentum
starts weakening. When the buy signal disappears, sell without waiting
for a sell signal.
Reverse the procedure in downtrends. A momentum trade on the short
side starts when the weekly trend turns down and the daily EMA and
MACD-Histogram also fall, showing that the downward momen- tum is
accelerating. Cov er shorts as soon as one of those indicators stops giv ing
a sell signal. The most dy namic part of the decline is over, and y our
momentum trade has fulfilled its goal.
The Impulse System encourages y ou to enter c autiously but ex it fast.
This is the pro fessional approach to trading, the to tal opposite o f the
amateurs’ style. Beginners jump into trades without thinking too much
and take forever to get out, hoping and waiting for the market to turn
their way .
Yo u must be very disciplined to trade this system because it is hard to

8/2/2019 02/27/12 Update of Stock Market Trends & Observations
http://slidepdf.com/reader/full/022712-update-of-stock-market-trends-observations 152/271
pdfcrowd.comopen in browser PRO version Are you a developer? Try out the HTML to PDF API New hot app: Facebook Albums To PDF
Yo u must be very disciplined to trade this system because it is hard to
place an order when the market is already flying, but even harder to quit
while yo u’re ahead without waiting for a reversal. Y ou are not allowed to
kick yourself if the trend continues after y ou get o ut. Do not touch this
system if y ou hav e the slightest problem with discipline.
End Quote:
CHARTS
MY CHART LINK (updated constantly)
These are my personal charts and my playground for doodling
trend lines, wave counts and other ideas.
I draw the trend lines and wave co unts on a daily basis (sometimes
more often). Y ou can find these doodles from 1 minute to
monthly charts.
I usually restrict my trend lines and wave counts to the first three
charts on eac h page, TSX, DJI & COMPQ. The other c harts on the
page are usually for c onfirmation of the trend and wave structure.
Page 1 – Buy /Sell Signals & Misc Charts
Page 2 – Index es With 1 Minute BarsPage 3 – Index es With 5 Minute Bars
Page 4 – Index es With 15 Minute Bars
Page 5 – Index es With 30 Minute Bars
Page 6 – Index es With 60 Minute Bars
Page 7 – Indexes With Daily Bars
Page 8 – Index es With Weekly Bars (since 1 981)
Page 9 – Indexes With Monthly Bars (since 1 981)
Page 10 – Indexes With 60 Minute Bars, Candlestick
Page 11 – Indexes With Daily Bars Candlesticks

8/2/2019 02/27/12 Update of Stock Market Trends & Observations
http://slidepdf.com/reader/full/022712-update-of-stock-market-trends-observations 153/271
pdfcrowd.comopen in browser PRO version Are you a developer? Try out the HTML to PDF API New hot app: Facebook Albums To PDF
Page 11 Indexes With Daily Bars, Candlesticks
Page 12 – Index es With Weekly Bars, Candlestick
Pages 13 through 1 4 are shorter term indicators. The indicators
are used to simply look for some type o f leading action before a
turn or confirming action of the wave co unt. Page 13 is a look-
eve ry day indicator page. The other indicator pages are less
frequently visited.Page 15 – Hurst FLD Projections
Page 16 – Indicators, Long Term
Page 17 – International Indexes
Page 18 through 30 are sector ETFs. They represent most of the
active sector ETFs and are always a good hunting ground when
looking for something that is breaking in a new direction.
Page 31 through 46 are growth stocks with indicators. These are
stocks that have bee n in a lengthy uptrend. One qualification is
that they must not be sev erely damaged in a bear market so they
can’t rise to significant new highs in the following bull market.
The growth stocks show daily market action for the last 1.5 y ears
and weekly prices since 1992. This gives a good perspective of
how they have be haved in the immediate past (daily c harts) and
how they behaved during good and bad times (weekly charts).
Page 46 – Last 6 charts are trades from the mec hanical sell/buy
signals
WAVE COUNT S SIMPLIFIED
My wave counts are not Elliott Wave! It’s different, simple and
functions w ithout a maze of exclusions.
T here are 3 peaks (or valleys) to a com pleted wave cou nt.

8/2/2019 02/27/12 Update of Stock Market Trends & Observations
http://slidepdf.com/reader/full/022712-update-of-stock-market-trends-observations 154/271
pdfcrowd.comopen in browser PRO version Are you a developer? Try out the HTML to PDF API New hot app: Facebook Albums To PDF
T here are 3 peaks (or valleys) to a com pleted wave cou nt.
A rev ersal of trend takes place after a completed wave count.
Often times it’s as simple as counting 3 bumps (or dips) on a chart .
. . Other times, not so easy .
In a downtrend the same rules apply ex cept y ou are co unting 3
dips instead of 3 bumps.
3 steps m ust stay confined to a channel. Laying a pen or
pencil on the c hart will help y ou v isualize the channel.
As the larger trend progresses, all of the steps that make up the
trend will also be co nfined to a larger channel. Sometimes a
channel is not clear until the surge phase (vertical mov e) has
ended.
When the m arket breaks its channel (regardless of the
perceived wave cou nt), the step has been terminated.
(Make sure yo ur channel was correctly drawn before c alling a
termination). Sometimes this may be y our best indicator that a
wave count is completed.
The correction following the second step is larger than the
correc tion that followed the first step, and obv iously the
correc tion following third step is larger than the second step
correction.
A single wave m ay sub-divide into another 3 waves. I will
call this an ex tension. When this happens (1) the trend is still
intact, (2) the channel will widened and (3) instead of a total of
3 steps, there will be 5 steps.
Sometimes I will use the terms “step” and “wave” interchangeably .
Reading the glossary helps in the understanding of this blog.
There are many other important facts in the glossary.
Glossary Link

8/2/2019 02/27/12 Update of Stock Market Trends & Observations
http://slidepdf.com/reader/full/022712-update-of-stock-market-trends-observations 155/271
pdfcrowd.comopen in browser PRO version Are you a developer? Try out the HTML to PDF API New hot app: Facebook Albums To PDF
ABBREVIATIONS
DJI = Dow Jones Industr ials
DJT = Dow Jones Transportat ions
SPX = SP 50 0
ES = SP 500 Futures
COMPQ = Nasdaq Composite Index
TSX = Toro nto Stock Exchange (Canadian blue chips)
SOX = Semico nducto rs
TXX = Technolo gy
****************************************************************
Long T erm – UP
Uptrend
Mar 2009 To Present
Step 2 Up (of 3) Com pleted
Step 3 Up Has Possibly Begu n
From the bottom in March 200 9
Large step one up ended in May 2010
Large step two up ended in May 2011.
Significant break abov e the May 20 11 highs should signal that Step
3 up is o fficial
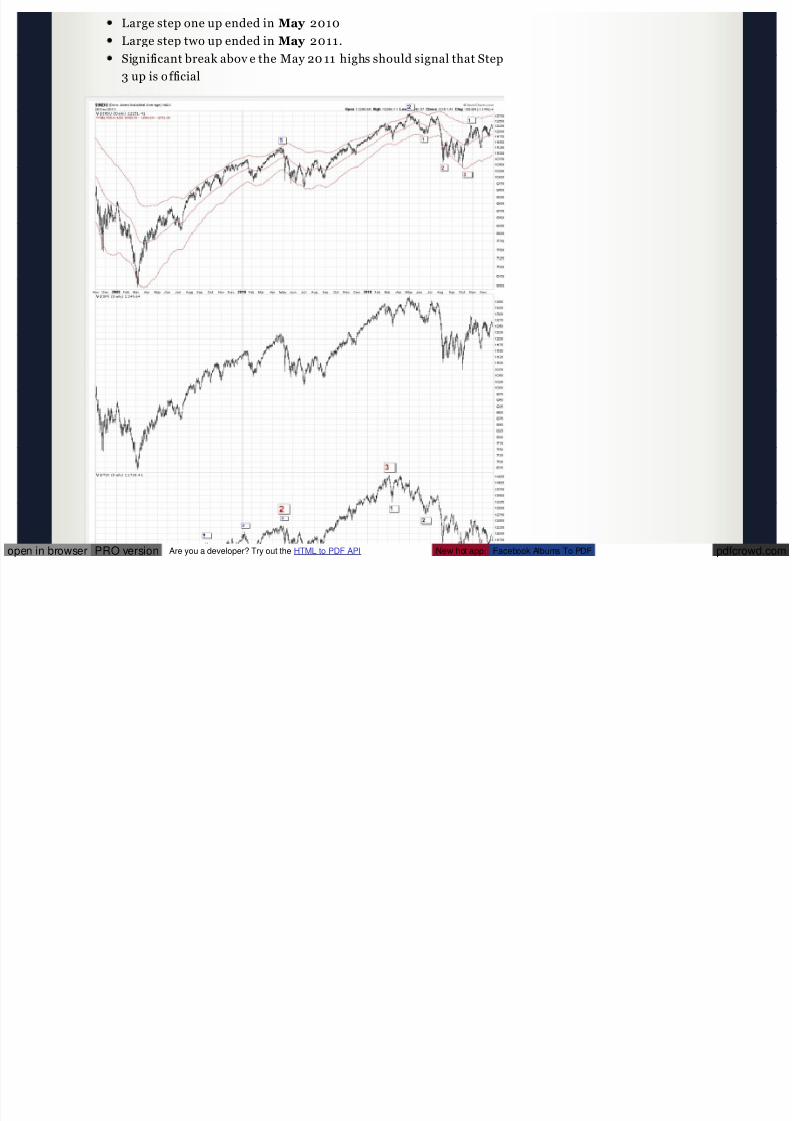
8/2/2019 02/27/12 Update of Stock Market Trends & Observations
http://slidepdf.com/reader/full/022712-update-of-stock-market-trends-observations 156/271
pdfcrowd.comopen in browser PRO version Are you a developer? Try out the HTML to PDF API New hot app: Facebook Albums To PDF
1 2-28 -11 LONG TERM
****************************************************************
Very Long T erm – DOWN
Downtrend

8/2/2019 02/27/12 Update of Stock Market Trends & Observations
http://slidepdf.com/reader/full/022712-update-of-stock-market-trends-observations 157/271
pdfcrowd.comopen in browser PRO version Are you a developer? Try out the HTML to PDF API New hot app: Facebook Albums To PDF
Downtrend
Jan 2000 T o Present
Step 2 Down (of 3) Com pleted
Currently In Rally Phase From Step 2 Down

8/2/2019 02/27/12 Update of Stock Market Trends & Observations
http://slidepdf.com/reader/full/022712-update-of-stock-market-trends-observations 158/271
pdfcrowd.comopen in browser PRO version Are you a developer? Try out the HTML to PDF API New hot app: Facebook Albums To PDF
1 2-28 -1 1 VERY LONG TERM
VERY LONG T ERM COMMENT S
We have 3 possibilities for the future.
We have entered a very wide swinging m arket
(megaphone formation) sim ilar to that of 1966 to 1974.
During that era we had three bear markets with two intervening
bull market rallies. Each bear market had a lower low than the
previous b ear. The interve ning bull market rallies saw new all
time highs before the nex t bear market began. We also have formed a huge head and shoulders formation since
1998. If this formation is valid, the downside measurement calls
for a bottom around Dow Jones Industrials 1,0 00.
We began a long term bull market in March 20 09. Each
subsequent min-bear market will result in higher lows than the
prior major low.
I favor the m egaphone formation as the m ost likely scenario.

8/2/2019 02/27/12 Update of Stock Market Trends & Observations
http://slidepdf.com/reader/full/022712-update-of-stock-market-trends-observations 159/271
pdfcrowd.comopen in browser PRO version Are you a developer? Try out the HTML to PDF API New hot app: Facebook Albums To PDF
Since 2000 we have had two bear markets, 2000 to 200 3 and 2007 to
2009. Like 1966 to 197 4, the recov ery from the first bear market saw a
new all time high (2007 peak). It’s possible that we may ex perience
another all time high during the present recov ery period. This would
support the megaphone formation. A failure to make new highs would
support the head and shoulders argument. In both formations theconclusion of the present recov ery would call for a third and final bear
market. An estimated time for the conclusion o f the final bear market is
approximately 20 18.
The lesser downside target of both formations is the megaphone
formation as it likely calls for a bottom 1,0 00 to 2,000 points below the
2009 low, which would be around Dow 5,00 0.
In the head and shoulders formation the measurement calls for a bottom
around Dow Jones Industrials 1,0 00. This is almost an unimaginable
eve nt regarding the possible fundamentals to c reate this scenario. If this
did happen, ev ery thing that could go wrong would have to go wrong.
The reasons range from the absurd to the absurdly absurd. This scenario
is so dark that it doesn’t seem possible but nev ertheless, the head and
shoulders formation is there and will be waiting until we pierce the all-time highs of October 2 007 .
Remember these are simply possible scenarios and are not embedded in
fact. Whatever the outc ome, it never hurts to be a little cautious with
some of your money . But in the worst case scenario, every thing that we
take for granted as being safe . . . . would not be safe. This is something
to never forget in the event things go v ery badly.
Hopefully we will never have to think about worst case sc enarios other
than to have a go od laugh at them presently

8/2/2019 02/27/12 Update of Stock Market Trends & Observations
http://slidepdf.com/reader/full/022712-update-of-stock-market-trends-observations 160/271
pdfcrowd.comopen in browser PRO version Are you a developer? Try out the HTML to PDF API New hot app: Facebook Albums To PDF
than to have a go od laugh at them presently.
****************************************************************
EDSON GOULD
Edson Gould, Premier Stock Market Strategist – Edson
Gould had a profound influence o n the dev elopment of my techniques and indicators. Prior to me subscribing to his
advisory servic e, I was just one of the crowd.
After 40 y ears I still have many of the publications from his
advisory servic e, “Findings & Forecasts”. Fearing the loss of these
hard copy reports I hav e recently scanned and created pdf files of
these reports. Now I have hard copies and computerized ver sions
of the reports.
I hav e used a technique of his that I found in an obscure referencein one of his reports. It was only mentioned once and never
again. I believe that he used this tool extensiv ely and never told
the world it’s importance. Prior to my finding this tool, I had been
try ing unsuccessfully to find a different way to c hart the market.
When I read about his technique I knew instantly that this was
exac tly what I had been seeking. I have charted this method back to 1 939 and found it to be v ery useful. There is no mention of it in
the reports that I posted below as I have deleted any reference to
it. It’s a super secret indicator and I’d have to kill you if I told y ou
about it.
Edson Gould was truly a legend in his own time. It’s too bad that
today most people have forgotten or nev er heard of him or his
discov eries. Below y ou will find only the first page of these
reports. A teaser is what yo u might call it. The rest of the reports
are available upon request. This is a man that deserves to be

8/2/2019 02/27/12 Update of Stock Market Trends & Observations
http://slidepdf.com/reader/full/022712-update-of-stock-market-trends-observations 161/271
pdfcrowd.comopen in browser PRO version Are you a developer? Try out the HTML to PDF API New hot app: Facebook Albums To PDF
remembered throughout technical analysis market history.
T he following are links to Edson Gould reports.
My Most Im portant Discov ery by Edson Gould
It was also my most important discov ery , for it ex plained the
irrational volatility o f markets that had my stified me in my early years. During those early y ears I found nothing worked in
predic ting these irrational market swings. But the fog lifted after
reading this report and I began to understand how to begin
predicting the market.
Edson Gould Profile by MT A
Edson Gould Conc epts by William Scheinm an
Decade Cycle by Edson Gould
Decade Cyc le Update by Ned Davis
Swing Principle by Edson Gould
A measuring indicator
Utilities by Edson Gould
A forecasting indicatorDividends by Edson Gould
Bonds by Edson Gould
Speed Lines by Edson Gould
Sentimeter by Edson Gould
With companies failing to pay dividends c ommensurate with their
earnings, this indicato r has failed. As the market climate
continues to deteriorate in the coming years, I would expec t
dividends to return to their former lev els and this indicator will
once again become useful. Prior to the late 1990s, it had 100

8/2/2019 02/27/12 Update of Stock Market Trends & Observations
http://slidepdf.com/reader/full/022712-update-of-stock-market-trends-observations 162/271
pdfcrowd.comopen in browser PRO version Are you a developer? Try out the HTML to PDF API New hot app: Facebook Albums To PDF
years of success.
Bottoms by Edson Gould
This was written and directed at the upco ming bottom in 197 4 but
it applies to all major bottoms.
T hree Steps by Edson Gould
Where do y ou think my three steps principle came from? Straight
from this report although I modified the concept through the
years.
Edson Gou ld’s 1974 Forecast
Gould’s 197 4 forecast kept me bearish and short throughout 197 4
until the week before Christmas 197 4, during which I began
making long term purchases. After that it was ride the bull phases
that transpired from 197 5 to 1982. 1982 to 2000 was the greatest
bull market of all time.
Edson Gou ld’s 1975 Forecast
Edson Gou ld’s 1976 Forecast
Edson Gould’s 197 7 Forecast
Edson Gould’s Five Y ear Forecast 1977 to 1982
This was a remarkable forecast in 197 7 , where the Dow Industrials
had nev er been higher than 1,0 00 . NO ONE predic ted a rise o f thismagnitude in 197 7 . Most were waiting for a resumption of the
bear market.
As part of the 197 7 to 1 982 forecast: On Wednesday A ugust 4,
19 82 I went long the market for the first time in months. By
Friday, August 6 I was worried that I had made a mistake as I was
deep in the red (I was long the Kansas City Stock Market
Contracts). The Kansas City Stoc k Market Contract was the first of
the stock index co ntracts (February 1 982). It was based on the
Value Line Arithmetic Index , margin requirement were quite low,

8/2/2019 02/27/12 Update of Stock Market Trends & Observations
http://slidepdf.com/reader/full/022712-update-of-stock-market-trends-observations 163/271
pdfcrowd.comopen in browser PRO version Are you a developer? Try out the HTML to PDF API New hot app: Facebook Albums To PDF
and it had a multiplier of 1 00 times the Value Line Arithmetic
Index , which meant the leverage was very high. On Friday (A ug
6), my wife and I went to dinner and I told her my tale of woe and
whether I should sell my long positions. I ex plained that my key
indicator had reversed and c ontinued higher on Thursday and
Friday but the market had continued lower. Since the key
indicator was usually correc t, we decided to stick it out for a few
days more (I was crazy in those days). My key indicator w as
mentioned by Gould only onc e in his market letters. If y ou didn’t
catch its importance, too bad, because he only gave y ou a peek.
Prior to Gould writing about this indicator I had been loo king for
one that had similar characteristics without success. Thus when
Gould wrote about it, I recognized instantly that I had struck
gold. I have modified this indicator slightly and researched it
back to 1939. This was a lot of work as it was before co mputers
and online data (remember when Barrons was available only on
paper, still is for the distant past). Meanwhile on Monday A ugust
9, 1982 the market took off like a rocket and never lo oked back. I
skyroc keted out of the red and had a big profit. In August 1982
the only people that were bullish were Edson Gould, Robert
Prechter and myself (probably a c ouple of others but I didn’t know them). Ever yo ne else was extremely bearish. It was a perfect
example of crowd behavior.
Sign Of The Bull by Edson Gould
****************************************************************
TRANSACTION SIGNALS
All actionable signals are only for short term time frames. These
signals are not designed for intermediate or long term time frames

8/2/2019 02/27/12 Update of Stock Market Trends & Observations
http://slidepdf.com/reader/full/022712-update-of-stock-market-trends-observations 164/271
pdfcrowd.comopen in browser PRO version Are you a developer? Try out the HTML to PDF API New hot app: Facebook Albums To PDF
signals are not designed for intermediate or long term time frames
BUT . . . . .
After a short term buy signal, long term tax status can be
achieved by a continuation of the upward trend, which causes
short term actions to morph into long term holdings.
See more details in the glossary under “Tax es, Futures Contracts”
and “Money Management”.
Glossary Link
T RANSACT ION RECORD
In this blog a warning of an impending botto m (or top) is often
issued well in advance o f the formal buy or sell date. This allowsthoughtful consideration prior to a formal action signal. To get a
sense of how this works, you should read a few days prior to a
formal buy /sell signal. I often buy/sell in my personal account
based on the early warnings.
The transaction record near stock market bottoms will show that I
am ve ry skittish and usually remain so until the new direction is
well underway .
Qualified buy signal given from December 5th to
Decem ber 20th, 2011
Buy signal in October 2011 was never issued due t o a
SERIOUS family illness
SELL – SEPTEMBER 9, 2011
BUY – AUGUST 30, 2011
SELL – AUGUST 30, 2011 – Stopped out, re-bought quic kly BUY – AUGUST 29, 2011
SELL AUGUST 2 2011

8/2/2019 02/27/12 Update of Stock Market Trends & Observations
http://slidepdf.com/reader/full/022712-update-of-stock-market-trends-observations 165/271
pdfcrowd.comopen in browser PRO version Are you a developer? Try out the HTML to PDF API New hot app: Facebook Albums To PDF
Share this:
SELL – AUGUST 25, 2011
BUY – AUGUST 23, 2011
SELL – AUGUST 1, 2011
BUY – JUNE 23, 20 11
****************************************************************
MISCELLANEOUS
There are useful items throughout this blog. For instance, the
“Wall Street Quotes” can be v ery instructive. So make sure and
look all through the blog.
Comments: Be the first to comm ent
Twitter 2 Facebo ok Li nked In 1 Reddit
Digg Email Print
Stock Market Update – 01/29/12Pos ted January 29, 201 2 by Bob
Categories: DAILY UPDATE
8/2/2019 02/27/12 Update of Stock Market Trends & Observations
http://slidepdf.com/reader/full/022712-update-of-stock-market-trends-observations 166/271
pdfcrowd.comopen in browser PRO version Are you a developer? Try out the HTML to PDF API New hot app: Facebook Albums To PDF
CLI CK HERE IF READING PDF
****************************************************************
WHOOPS
My last update had nothing new included, just the normal every day stuff that is always included. I was preparing for today ’s post and tagged the
wrong button. Sorry about that.
Every time I put a new file (pdf) in my blog an update goes o ut
automatically. That’s not intentional just the way wordpress does
things. So I apologize in advance if I upload 5 files in one day and 5
updates go out.
CYCLES
I haven’t posted the charts for the cy cles since 1/1 8 and today I’ll show
you what’s happening.
Two of the three charts show that we should be bottoming presently.
That’s still possible with a quick deep c orrection and next week should
tell us if that’s going to happen. Whether the correc tion is invisible (very
good sign) or it will occ ur in February remains to be seen.
If the correc tion is practically inv isible, it will indicate that a larger cy cle
has dominance (good sign). The 1950 dataset shows a February bottom
but that factors 60 y ears of data and doesn’t put emphasis on recent
cy cles like the dataset 1998 and 2007 .
The next cy cle of real significance is indicated for March (1950 dataset)or May (1998 and 2007 dataset). The 195 0 dataset shows an 18 month
cy cle bottom in March while the 1998 and 2007 dataset show that the

8/2/2019 02/27/12 Update of Stock Market Trends & Observations
http://slidepdf.com/reader/full/022712-update-of-stock-market-trends-observations 167/271
pdfcrowd.comopen in browser PRO version Are you a developer? Try out the HTML to PDF API New hot app: Facebook Albums To PDF
cy cle bottom in March, while the 1998 and 2007 dataset show that the
18 month cy cle bottomed last Octobe r. If we have a significant
correc tion into February that takes us into the area of the October lows,
it will likely indicate that the 195 0 dataset is correct. That isn’t my
favorite outlook but I don’t get to choose what the market does (nuts).
The market is very ov erbought and a correction of some type should
take place to replenish the market’s firepower. It’s always possible that
we could see nothing more than 1-3 day correc tions with a resumption of
the rally. That’s really great market action if it continues.
The following charts are the datasets 1950 , 1998 and 2007 , in that
order.

8/2/2019 02/27/12 Update of Stock Market Trends & Observations
http://slidepdf.com/reader/full/022712-update-of-stock-market-trends-observations 168/271
pdfcrowd.comopen in browser PRO version Are you a developer? Try out the HTML to PDF API New hot app: Facebook Albums To PDF
01/29/12 19 5 0 to present dataset cy cles
01/29/12 19 98 to present dataset cy cle

8/2/2019 02/27/12 Update of Stock Market Trends & Observations
http://slidepdf.com/reader/full/022712-update-of-stock-market-trends-observations 169/271
pdfcrowd.comopen in browser PRO version Are you a developer? Try out the HTML to PDF API New hot app: Facebook Albums To PDF
01/29/12 2007 to present dataset cy cle
MISC
Jeffrey Saut mentioned Linn Energy (LINE) on his Thursday update. I
hadn’t looked at it before but it pay s a 7 .5% dividend, has an excellent
growth record and is co nstantly making acquisitions. Jeffrey said this is
the stock he rec ommends to friends and family to put away for a few
years. Of course if oil prices don’t rise, LINE wouldn’t do well. Presently
the oil price chart shows that oil is in an inverse head and shoulders
formation (see my charts page 13, #7 1.6). This hasn’t been confirmed by a neckline breakout but the projected rise is to approximately $1 13 per
barrel. This isn’t a reco mmendation because I don’t do that, just take a
look. My normal field of play is the stock index futures where I’m very
careful to NOT become ov er-leveraged (been there, do ne that).
CONFIDENCE INDEX
The following is the confidence index (junk bonds divided by treasury
bonds). Although the index is rising, the curious and bothersome part
about this chart is the index has not risen abov e it’s October high.
Another problem is that various market indexes are approaching their
May 201 1 highs and the confidence index is far away from it’s 201 1 high.
When the market expec ts a reco very , junk bonds will rise much faster
than treasury b onds. That is barely happening at the present. The lower
part of this chart is the Value Line Arithmetic Index . Did yo u realize that
this index hit an all-time in March 201 0 and kept right on rolling. It’s
t ll ti hi h M

8/2/2019 02/27/12 Update of Stock Market Trends & Observations
http://slidepdf.com/reader/full/022712-update-of-stock-market-trends-observations 170/271
pdfcrowd.comopen in browser PRO version Are you a developer? Try out the HTML to PDF API New hot app: Facebook Albums To PDF
present all-time high was May 201 1.

8/2/2019 02/27/12 Update of Stock Market Trends & Observations
http://slidepdf.com/reader/full/022712-update-of-stock-market-trends-observations 171/271
pdfcrowd.comopen in browser PRO version Are you a developer? Try out the HTML to PDF API New hot app: Facebook Albums To PDF
01 /29 /1 2 Confidence Index
ECONOMY
The following chart give s indication for the ec onomy in real-time. The
last chart is the Baltic Dry I ndex, which is the cost o f ocean shipping. When the economy is rolling in high gear, this index will be at high levels
and the reverse is also true. Presently , this index is very near the lows
made in December 200 8. Y ou can draw your own conclusions on that
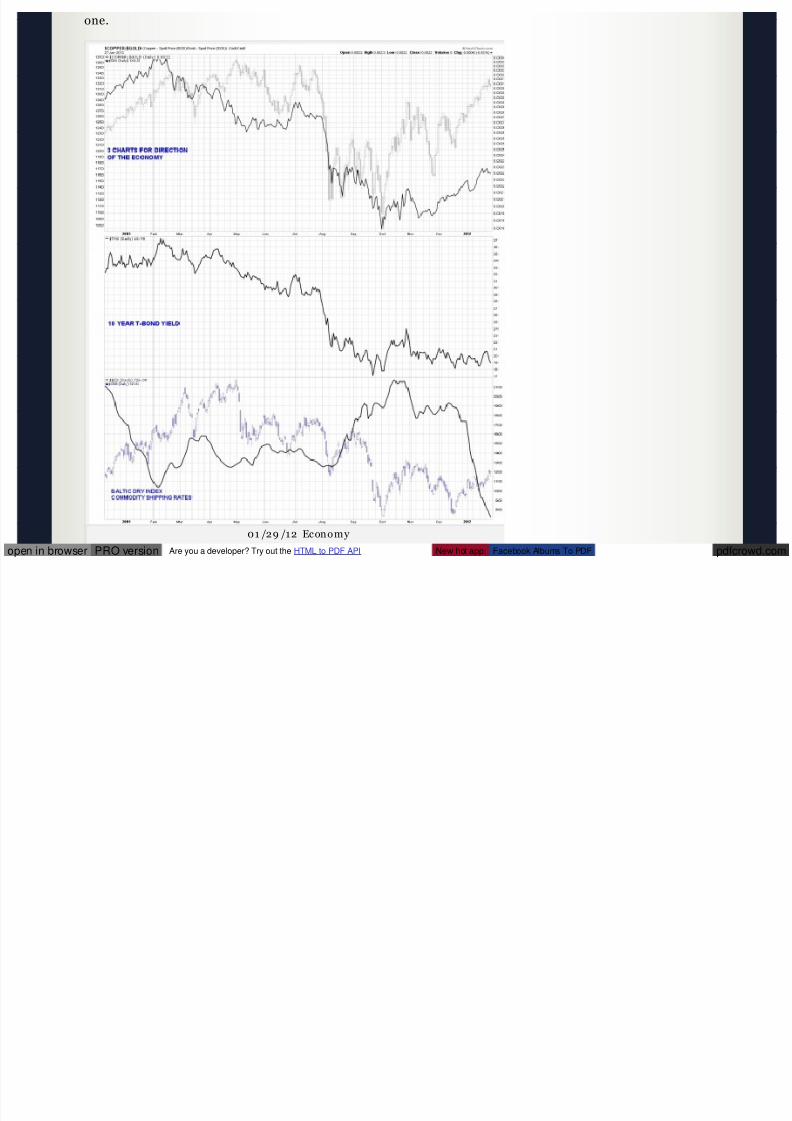
8/2/2019 02/27/12 Update of Stock Market Trends & Observations
http://slidepdf.com/reader/full/022712-update-of-stock-market-trends-observations 172/271

8/2/2019 02/27/12 Update of Stock Market Trends & Observations
http://slidepdf.com/reader/full/022712-update-of-stock-market-trends-observations 173/271
always climbs the “wall of worry ”.
CHARTS
MY CHART LINK (updated constantly)
These are my personal charts and my playground for doodling
trend lines, wave counts and other ideas.
I draw the trend lines and wave co unts on a daily basis (sometimes
more often). Y ou can find these doodles from 1 minute to
monthly charts.
I usually restrict my trend lines and wave counts to the first threecharts on eac h page, TSX, DJI & COMPQ. The other c harts on the
page are usually for c onfirmation of the trend and wave structure.

8/2/2019 02/27/12 Update of Stock Market Trends & Observations
http://slidepdf.com/reader/full/022712-update-of-stock-market-trends-observations 174/271
pdfcrowd.comopen in browser PRO version Are you a developer? Try out the HTML to PDF API New hot app: Facebook Albums To PDF
Page 1 – Buy /Sell Signals & Misc Charts
Page 2 – Index es With 1 Minute Bars
Page 3 – Index es With 5 Minute Bars
Page 4 – Index es With 15 Minute Bars
Page 5 – Index es With 30 Minute Bars
Page 6 – Index es With 60 Minute Bars
Page 7 – Indexes With Daily Bars
Page 8 – Index es With Weekly Bars (since 1 981)
Page 9 – Indexes With Monthly Bars (since 1 981)
Page 10 – Indexes With 60 Minute Bars, Candlestick
Page 11 – Indexes With Daily Bars, Candlesticks
Page 12 – Index es With Weekly Bars, Candlestick
Pages 13 through 1 4 are shorter term indicators. The indicators
are used to simply look for some type o f leading action before a
turn or confirming action of the wave co unt. Page 13 is a look-
eve ry day indicator page. The other indicator pages are less
frequently visited.
Page 15 – Hurst FLD ProjectionsPage 16 – Indicators, Long Term
Page 17 – International Indexes
Page 18 through 30 are sector ETFs. They represent most of the
active sector ETFs and are always a good hunting ground when
looking for something that is breaking in a new direction.
Page 31 through 46 are growth stocks with indicators. These are
stocks that have bee n in a lengthy uptrend. One qualification is
that they must not be sev erely damaged in a bear market so they
can’t rise to significant new highs in the following bull market.
The growth stocks show daily market action for the last 1.5 y ears

8/2/2019 02/27/12 Update of Stock Market Trends & Observations
http://slidepdf.com/reader/full/022712-update-of-stock-market-trends-observations 175/271
pdfcrowd.comopen in browser PRO version Are you a developer? Try out the HTML to PDF API New hot app: Facebook Albums To PDF
and weekly prices since 1992. This gives a good perspective of
how they have be haved in the immediate past (daily c harts) and
how they behaved during good and bad times (weekly charts).
Page 46 – Last 6 charts are trades from the mec hanical sell/buy
signals
WAVE COUNT S SIMPLIFIED
My wave counts are not Elliott Wave! It’s different, simple and
functions w ithout a maze of exclusions.
T here are 3 peaks (or valleys) to a com pleted wave cou nt.
A rev ersal of trend takes place after a completed wave count.
Often times it’s as simple as counting 3 bumps (or dips) on a chart .
. . Other times, not so easy .
In a downtrend the same rules apply ex cept y ou are co unting 3
dips instead of 3 bumps.

8/2/2019 02/27/12 Update of Stock Market Trends & Observations
http://slidepdf.com/reader/full/022712-update-of-stock-market-trends-observations 176/271
COMPQ = Nasdaq Composite Index
TSX = Toro nto Stock Exchange (Canadian blue chips)
SOX = Semico nducto rsTXX = Technolo gy
****************************************************************
Long T erm – UP
Uptrend
Mar 2009 To Present
Step 2 Up (of 3) Com pleted
Step 3 Up Has Possibly Begu n
From the bottom in March 200 9

8/2/2019 02/27/12 Update of Stock Market Trends & Observations
http://slidepdf.com/reader/full/022712-update-of-stock-market-trends-observations 177/271
pdfcrowd.comopen in browser PRO version Are you a developer? Try out the HTML to PDF API New hot app: Facebook Albums To PDF
Large step one up ended in May 2010
Large step two up ended in May 2011.
Significant break abov e the May 20 11 highs should signal that Step
3 up is o fficial

8/2/2019 02/27/12 Update of Stock Market Trends & Observations
http://slidepdf.com/reader/full/022712-update-of-stock-market-trends-observations 178/271
pdfcrowd.comopen in browser PRO version Are you a developer? Try out the HTML to PDF API New hot app: Facebook Albums To PDF
1 2-28 -11 LONG TERM
****************************************************************
Very Long T erm – DOWN
Downtrend
Jan 2000 T o Present
Step 2 Down (of 3) Com pleted
Currently In Rally Phase From Step 2 Down

8/2/2019 02/27/12 Update of Stock Market Trends & Observations
http://slidepdf.com/reader/full/022712-update-of-stock-market-trends-observations 179/271
pdfcrowd.comopen in browser PRO version Are you a developer? Try out the HTML to PDF API New hot app: Facebook Albums To PDF
1 2-28 -1 1 VERY LONG TERM
VERY LONG T ERM COMMENT S
We have 3 possibilities for the future.
We have entered a very wide swinging m arket
(megaphone formation) sim ilar to that of 1966 to 1974.
During that era we had three bear markets with two intervening

8/2/2019 02/27/12 Update of Stock Market Trends & Observations
http://slidepdf.com/reader/full/022712-update-of-stock-market-trends-observations 180/271
The reasons range from the absurd to the absurdly absurd. This scenario
is so dark that it doesn’t seem possible but nev ertheless, the head and
shoulders formation is there and will be waiting until we pierce the all-time highs of October 2 007 .
Remember these are simply possible scenarios and are not embedded in
fact. Whatever the outc ome, it never hurts to be a little cautious with
some of your money . But in the worst case scenario, every thing that we
take for granted as being safe . . . . would not be safe. This is something
to never forget in the event things go v ery badly.
Hopefully we will never have to think about worst case sc enarios other
than to have a go od laugh at them presently.
****************************************************************

8/2/2019 02/27/12 Update of Stock Market Trends & Observations
http://slidepdf.com/reader/full/022712-update-of-stock-market-trends-observations 181/271
pdfcrowd.comopen in browser PRO version Are you a developer? Try out the HTML to PDF API New hot app: Facebook Albums To PDF
EDSON GOULD
Edson Gould, Premier Stock Market Strategist – Edson
Gould had a profound influence o n the dev elopment of my
techniques and indicators. Prior to me subscribing to his
advisory servic e, I was just one of the crowd.
After 40 y ears I still have many of the publications from his
advisory servic e, “Findings & Forecasts”. Fearing the loss of these
hard copy reports I hav e recently scanned and created pdf files of
these reports. Now I have hard copies and computerized ver sions
of the reports.
I hav e used a technique of his that I found in an obscure referencein one of his reports. It was only mentioned once and never
again. I believe that he used this tool extensiv ely and never told
the world it’s importance. Prior to my finding this tool, I had been
try ing unsuccessfully to find a different way to c hart the market.
When I read about his technique I knew instantly that this was
exac tly what I had been seeking. I have charted this method back
to 1 939 and found it to be v ery useful. There is no mention of it in
the reports that I posted below as I have deleted any reference to
it. It’s a super secret indicator and I’d have to kill you if I told y ou
about it.
Edson Gould was truly a legend in his own time. It’s too bad that
today most people have forgotten or nev er heard of him or his
discov eries. Below y ou will find only the first page of these
reports. A teaser is what yo u might call it. The rest of the reportsare available upon request. This is a man that deserves to be
remembered throughout technical analysis market history.

8/2/2019 02/27/12 Update of Stock Market Trends & Observations
http://slidepdf.com/reader/full/022712-update-of-stock-market-trends-observations 182/271
pdfcrowd.comopen in browser PRO version Are you a developer? Try out the HTML to PDF API New hot app: Facebook Albums To PDF
T he following are links to Edson Gould reports.
My Most Im portant Discov ery by Edson Gould
It was also my most important discov ery , for it ex plained the
irrational volatility o f markets that had my stified me in my early
years. During those early y ears I found nothing worked in
predic ting these irrational market swings. But the fog lifted after
reading this report and I began to understand how to begin
predicting the market.
Edson Gould Profile by MT A
Edson Gould Conc epts by William Scheinm an
Decade Cycle by Edson GouldDecade Cyc le Update by Ned Davis
Swing Principle by Edson Gould

8/2/2019 02/27/12 Update of Stock Market Trends & Observations
http://slidepdf.com/reader/full/022712-update-of-stock-market-trends-observations 183/271
Edson Gould’s Five Y ear Forecast 1977 to 1982
This was a remarkable forecast in 197 7 , where the Dow Industrials
had nev er been higher than 1,0 00 . NO ONE predic ted a rise o f this
magnitude in 197 7 . Most were waiting for a resumption of the
bear market.
As part of the 197 7 to 1 982 forecast: On Wednesday A ugust 4,
19 82 I went long the market for the first time in months. By
Friday, August 6 I was worried that I had made a mistake as I was
deep in the red (I was long the Kansas City Stock Market
Contracts). The Kansas City Stoc k Market Contract was the first of
the stock index co ntracts (February 1 982). It was based on the Value Line Arithmetic Index , margin requirement were quite low,
and it had a multiplier of 1 00 times the Value Line Arithmetic
Index , which meant the leverage was very high. On Friday (A ug

8/2/2019 02/27/12 Update of Stock Market Trends & Observations
http://slidepdf.com/reader/full/022712-update-of-stock-market-trends-observations 184/271
pdfcrowd.comopen in browser PRO version Are you a developer? Try out the HTML to PDF API New hot app: Facebook Albums To PDF
, g y g y ( g
6), my wife and I went to dinner and I told her my tale of woe and
whether I should sell my long positions. I ex plained that my key
indicator had reversed and c ontinued higher on Thursday and
Friday but the market had continued lower. Since the key
indicator was usually correc t, we decided to stick it out for a few days more (I was crazy in those days). My key indicator w as
mentioned by Gould only onc e in his market letters. If y ou didn’t
catch its importance, too bad, because he only gave y ou a peek.
Prior to Gould writing about this indicator I had been loo king for
one that had similar characteristics without success. Thus when
Gould wrote about it, I recognized instantly that I had struck
gold. I have modified this indicator slightly and researched it
back to 1939. This was a lot of work as it was before co mputers
and online data (remember when Barrons was available only on
paper, still is for the distant past). Meanwhile on Monday A ugust
9, 1982 the market took off like a rocket and never lo oked back. I
skyroc keted out of the red and had a big profit. In August 1982
the only people that were bullish were Edson Gould, Robert
Prechter and myself (probably a c ouple of others but I didn’t know
them). Ever yo ne else was extremely bearish. It was a perfect
example of crowd behavior.
Sign Of The Bull by Edson Gould
****************************************************************
TRANSACTION SIGNALS
All actionable signals are only for short term time frames. These
signals are not designed for intermediate or long term time frames
BUT . . . . .

8/2/2019 02/27/12 Update of Stock Market Trends & Observations
http://slidepdf.com/reader/full/022712-update-of-stock-market-trends-observations 185/271
pdfcrowd.comopen in browser PRO version Are you a developer? Try out the HTML to PDF API New hot app: Facebook Albums To PDF
After a short term buy signal, long term tax status can be
achieved by a continuation of the upward trend, which causes
short term actions to morph into long term holdings.
See more details in the glossary under “Tax es, Futures Contracts”
and “Money Management”.
Glossary Link
T RANSACT ION RECORD
In this blog a warning of an impending botto m (or top) is often
issued well in advance o f the formal buy or sell date. This allows
thoughtful consideration prior to a formal action signal. To get a
sense of how this works, you should read a few days prior to a
formal buy /sell signal. I often buy/sell in my personal account
based on the early warnings.
The transaction record near stock market bottoms will show that I
am ve ry skittish and usually remain so until the new direction is
well underway .
Qualified buy signal given from December 5th to
Decem ber 20th, 2011
Buy signal in October 2011 was never issued due t o a
SERIOUS family illness
SELL – SEPTEMBER 9, 2011
BUY – AUGUST 30, 2011
SELL – AUGUST 30, 2011 – Stopped out, re-bought quic kly BUY – AUGUST 29, 2011
SELL – AUGUST 25, 2011
BUY – AUGUST 23, 2011

8/2/2019 02/27/12 Update of Stock Market Trends & Observations
http://slidepdf.com/reader/full/022712-update-of-stock-market-trends-observations 186/271
pdfcrowd.comopen in browser PRO version Are you a developer? Try out the HTML to PDF API New hot app: Facebook Albums To PDF
Share this:
SELL – AUGUST 1, 2011
BUY – JUNE 23, 20 11
****************************************************************
MISCELLANEOUS
There are useful items throughout this blog. For instance, the
“Wall Street Quotes” can be v ery instructive. So make sure and
look all through the blog.
Comments: Be the first to comm ent
Twitter 2 Facebo ok Li nked In 1 Reddit
Digg Email Print
Stock Market Update – 01/26/12
Pos ted January 28, 201 2 by Bob
Categories: DAILY UPDATE
****************************************************************

8/2/2019 02/27/12 Update of Stock Market Trends & Observations
http://slidepdf.com/reader/full/022712-update-of-stock-market-trends-observations 187/271
pdfcrowd.comopen in browser PRO version Are you a developer? Try out the HTML to PDF API New hot app: Facebook Albums To PDF
CHARTS
MY CHART LINK (updated constantly)
These are my personal charts and my playground for doodling
trend lines, wave counts and other ideas.
I draw the trend lines and wave co unts on a daily basis (sometimes
more often). Y ou can find these doodles from 1 minute to
monthly charts.
I usually restrict my trend lines and wave counts to the first three
charts on eac h page, TSX, DJI & COMPQ. The other c harts on the
page are usually for c onfirmation of the trend and wave structure.
Page 1 – Buy /Sell Signals & Misc Charts
Page 2 – Index es With 1 Minute Bars
Page 3 – Index es With 5 Minute Bars
Page 4 – Index es With 15 Minute Bars
Page 5 – Index es With 30 Minute Bars
Page 6 – Index es With 60 Minute Bars
Page 7 – Indexes With Daily Bars
Page 8 – Index es With Weekly Bars (since 1 981)
Page 9 – Indexes With Monthly Bars (since 1 981)
Page 10 – Indexes With 60 Minute Bars, Candlestick
Page 11 – Indexes With Daily Bars, Candlesticks
Page 12 – Index es With Weekly Bars, Candlestick
Pages 13 through 1 4 are shorter term indicators. The indicators
are used to simply look for some type o f leading action before a
turn or confirming action of the wave co unt. Page 13 is a look-
eve ry day indicator page. The other indicator pages are less
f tl i it d

8/2/2019 02/27/12 Update of Stock Market Trends & Observations
http://slidepdf.com/reader/full/022712-update-of-stock-market-trends-observations 188/271
pdfcrowd.comopen in browser PRO version Are you a developer? Try out the HTML to PDF API New hot app: Facebook Albums To PDF
frequently visited.
Page 15 – Hurst FLD Projections
Page 16 – Indicators, Long Term
Page 17 – International Indexes
Page 18 through 30 are sector ETFs. They represent most of theactive sector ETFs and are always a good hunting ground when
looking for something that is breaking in a new direction.
Page 31 through 46 are growth stocks with indicators. These are
stocks that have bee n in a lengthy uptrend. One qualification is
that they must not be sev erely damaged in a bear market so they
can’t rise to significant new highs in the following bull market.
The growth stocks show daily market action for the last 1.5 y ears
and weekly prices since 1992. This gives a good perspective of how they have be haved in the immediate past (daily c harts) and
how they behaved during good and bad times (weekly charts).
Page 46 – Last 6 charts are trades from the mec hanical sell/buy
signals
WAVE COUNT S SIMPLIFIED
My wave counts are not Elliott Wave! It’s different, simple and
functions w ithout a maze of exclusions.
T here are 3 peaks (or valleys) to a com pleted wave cou nt.
A rev ersal of trend takes place after a completed wave count.
Often times it’s as simple as counting 3 bumps (or dips) on a chart .
. . Other times, not so easy .In a downtrend the same rules apply ex cept y ou are co unting 3
dips instead of 3 bumps.
3 steps m ust stay confined to a channel. Laying a pen or

8/2/2019 02/27/12 Update of Stock Market Trends & Observations
http://slidepdf.com/reader/full/022712-update-of-stock-market-trends-observations 189/271
pdfcrowd.comopen in browser PRO version Are you a developer? Try out the HTML to PDF API New hot app: Facebook Albums To PDF
pencil on the c hart will help y ou v isualize the channel.
As the larger trend progresses, all of the steps that make up the
trend will also be co nfined to a larger channel. Sometimes a
channel is not clear until the surge phase (vertical mov e) has
ended. When the m arket breaks its channel (regardless of the
perceived wave cou nt), the step has been terminated.
(Make sure yo ur channel was correctly drawn before c alling a
termination). Sometimes this may be y our best indicator that a
wave count is completed.
The correction following the second step is larger than the
correc tion that followed the first step, and obv iously the
correc tion following third step is larger than the second step
correction.
A single wave m ay sub-divide into another 3 waves. I will
call this an ex tension. When this happens (1) the trend is still
intact, (2) the channel will widened and (3) instead of a total of
3 steps, there will be 5 steps.
Sometimes I will use the terms “step” and “wave” interchangeably .
Reading the glossary helps in the understanding of this blog.
There are many other important facts in the glossary.
Glossary Link
ABBREVIATIONS
DJI = Dow Jones Industr ials
DJT = Dow Jones Transportat ionsSPX = SP 50 0
ES = SP 500 Futures
COMPQ = Nasdaq Composite Index

8/2/2019 02/27/12 Update of Stock Market Trends & Observations
http://slidepdf.com/reader/full/022712-update-of-stock-market-trends-observations 190/271
pdfcrowd.comopen in browser PRO version Are you a developer? Try out the HTML to PDF API New hot app: Facebook Albums To PDF
TSX = Toro nto Stock Exchange (Canadian blue chips)
SOX = Semico nducto rs
TXX = Technolo gy
****************************************************************
Long T erm – UP
Uptrend
Mar 2009 To Present
Step 2 Up (of 3) Com pleted
Step 3 Up Has Possibly Begu n
From the bottom in March 200 9
Large step one up ended in May 2010
Large step two up ended in May 2011.
Significant break abov e the May 20 11 highs should signal that Step
3 up is o fficial

8/2/2019 02/27/12 Update of Stock Market Trends & Observations
http://slidepdf.com/reader/full/022712-update-of-stock-market-trends-observations 191/271
pdfcrowd.comopen in browser PRO version Are you a developer? Try out the HTML to PDF API New hot app: Facebook Albums To PDF
1 2-28 -11 LONG TERM
****************************************************************
Very Long T erm – DOWN
Downtrend
Jan 2000 T o Present
Step 2 Down (of 3) Com pleted
Currently In Rally Phase From Step 2 Down

8/2/2019 02/27/12 Update of Stock Market Trends & Observations
http://slidepdf.com/reader/full/022712-update-of-stock-market-trends-observations 192/271
pdfcrowd.comopen in browser PRO version Are you a developer? Try out the HTML to PDF API New hot app: Facebook Albums To PDF

8/2/2019 02/27/12 Update of Stock Market Trends & Observations
http://slidepdf.com/reader/full/022712-update-of-stock-market-trends-observations 193/271
bull market rallies. Each bear market had a lower low than the
previous b ear. The interve ning bull market rallies saw new all
time highs before the nex t bear market began.
We also have formed a huge head and shoulders formation since
1998. If this formation is valid, the downside measurement calls
for a bottom around Dow Jones Industrials 1,0 00.
We began a long term bull market in March 20 09. Each
subsequent min-bear market will result in higher lows than the
prior major low.
I favor the m egaphone formation as the m ost likely
scenario.
Since 2000 we have had two bear markets, 2000 to 200 3 and 2007 to
2009. Like 1966 to 197 4, the recov ery from the first bear market saw a
ll i hi h ( k) ’ ibl h i

8/2/2019 02/27/12 Update of Stock Market Trends & Observations
http://slidepdf.com/reader/full/022712-update-of-stock-market-trends-observations 194/271
pdfcrowd.comopen in browser PRO version Are you a developer? Try out the HTML to PDF API New hot app: Facebook Albums To PDF
new all time high (2007 peak). It’s possible that we may ex perience
another all time high during the present recov ery period. This would
support the megaphone formation. A failure to make new highs would
support the head and shoulders argument. In both formations the
conclusion of the present recov ery would call for a third and final bear
market. An estimated time for the conclusion o f the final bear market is
approximately 20 18.
The lesser downside target of both formations is the megaphone
formation as it likely calls for a bottom 1,0 00 to 2,000 points below the
2009 low, which would be around Dow 5,00 0.
In the head and shoulders formation the measurement calls for a bottomaround Dow Jones Industrials 1,0 00. This is almost an unimaginable
eve nt regarding the possible fundamentals to c reate this scenario. If this
did happen, ev ery thing that could go wrong would have to go wrong.
The reasons range from the absurd to the absurdly absurd. This scenario
is so dark that it doesn’t seem possible but nev ertheless, the head and
shoulders formation is there and will be waiting until we pierce the all-
time highs of October 2 007 .
Remember these are simply possible scenarios and are not embedded in
fact. Whatever the outc ome, it never hurts to be a little cautious with
some of your money . But in the worst case scenario, every thing that we
take for granted as being safe . . . . would not be safe. This is something
to never forget in the event things go v ery badly.
Hopefully we will never have to think about worst case sc enarios otherthan to have a go od laugh at them presently.
****************************************************************

8/2/2019 02/27/12 Update of Stock Market Trends & Observations
http://slidepdf.com/reader/full/022712-update-of-stock-market-trends-observations 195/271
pdfcrowd.comopen in browser PRO version Are you a developer? Try out the HTML to PDF API New hot app: Facebook Albums To PDF
EDSON GOULD
Edson Gould, Premier Stock Market Strategist – Edson
Gould had a profound influence o n the dev elopment of my
techniques and indicators. Prior to me subscribing to his
advisory servic e, I was just one of the crowd.
After 40 y ears I still have many of the publications from his
advisory servic e, “Findings & Forecasts”. Fearing the loss of these
hard copy reports I hav e recently scanned and created pdf files of
these reports. Now I have hard copies and computerized ver sions
of the reports.
I hav e used a technique of his that I found in an obscure reference
in one of his reports. It was only mentioned once and never
again. I believe that he used this tool extensiv ely and never told
the world it’s importance. Prior to my finding this tool, I had been
try ing unsuccessfully to find a different way to c hart the market.
When I read about his technique I knew instantly that this was
exac tly what I had been seeking. I have charted this method back
to 1 939 and found it to be v ery useful. There is no mention of it in
the reports that I posted below as I have deleted any reference to
it. It’s a super secret indicator and I’d have to kill you if I told y ou
about it.
Edson Gould was truly a legend in his own time. It’s too bad that
today most people have forgotten or nev er heard of him or his
discov eries. Below y ou will find only the first page of these
reports. A teaser is what yo u might call it. The rest of the reports
are available upon request. This is a man that deserves to be
remembered throughout technical analysis market history.
T he following are links to Edson Gould reports.

8/2/2019 02/27/12 Update of Stock Market Trends & Observations
http://slidepdf.com/reader/full/022712-update-of-stock-market-trends-observations 196/271
pdfcrowd.comopen in browser PRO version Are you a developer? Try out the HTML to PDF API New hot app: Facebook Albums To PDF
My Most Im portant Discov ery by Edson Gould
It was also my most important discov ery , for it ex plained the
irrational volatility o f markets that had my stified me in my early
years. During those early y ears I found nothing worked in
predic ting these irrational market swings. But the fog lifted after
reading this report and I began to understand how to begin
predicting the market.
Edson Gould Profile by MT A
Edson Gould Conc epts by William Scheinm an
Decade Cycle by Edson GouldDecade Cyc le Update by Ned Davis
Swing Principle by Edson Gould
A measuring indicator
Utilities by Edson Gould
A forecasting indicator
Dividends by Edson Gould
Bonds by Edson Gould
Speed Lines by Edson Gould
Sentimeter by Edson Gould
With companies failing to pay dividends c ommensurate with their
earnings, this indicato r has failed. As the market climate
continues to deteriorate in the coming years, I would expec t
dividends to return to their former lev els and this indicator will
once again become useful. Prior to the late 1990s, it had 100
years of success.
Bottoms by Edson Gould
This was written and directed at the upco ming bottom in 197 4 but

8/2/2019 02/27/12 Update of Stock Market Trends & Observations
http://slidepdf.com/reader/full/022712-update-of-stock-market-trends-observations 197/271
pdfcrowd.comopen in browser PRO version Are you a developer? Try out the HTML to PDF API New hot app: Facebook Albums To PDF
p g 97 4
it applies to all major bottoms.
T hree Steps by Edson Gould
Where do y ou think my three steps principle came from? Straight
from this report although I modified the concept through the years.
Edson Gou ld’s 1974 Forecast
Gould’s 197 4 forecast kept me bearish and short throughout 197 4
until the week before Christmas 197 4, during which I began
making long term purchases. After that it was ride the bull phases
that transpired from 197 5 to 1982. 1982 to 2000 was the greatest
bull market of all time.Edson Gou ld’s 1975 Forecast
Edson Gou ld’s 1976 Forecast
Edson Gould’s 197 7 Forecast
Edson Gould’s Five Y ear Forecast 1977 to 1982
This was a remarkable forecast in 197 7 , where the Dow Industrials
had nev er been higher than 1,0 00 . NO ONE predic ted a rise o f this
magnitude in 197 7 . Most were waiting for a resumption of the
bear market.
As part of the 197 7 to 1 982 forecast: On Wednesday A ugust 4,
19 82 I went long the market for the first time in months. By
Friday, August 6 I was worried that I had made a mistake as I was
deep in the red (I was long the Kansas City Stock Market
Contracts). The Kansas City Stoc k Market Contract was the first of
the stock index co ntracts (February 1 982). It was based on the
Value Line Arithmetic Index , margin requirement were quite low,
and it had a multiplier of 1 00 times the Value Line Arithmetic
Index , which meant the leverage was very high. On Friday (A ug
6), my wife and I went to dinner and I told her my tale of woe and

8/2/2019 02/27/12 Update of Stock Market Trends & Observations
http://slidepdf.com/reader/full/022712-update-of-stock-market-trends-observations 198/271
pdfcrowd.comopen in browser PRO version Are you a developer? Try out the HTML to PDF API New hot app: Facebook Albums To PDF
whether I should sell my long positions. I ex plained that my key
indicator had reversed and c ontinued higher on Thursday and
Friday but the market had continued lower. Since the key
indicator was usually correc t, we decided to stick it out for a few days more (I was crazy in those days). My key indicator w as
mentioned by Gould only onc e in his market letters. If y ou didn’t
catch its importance, too bad, because he only gave y ou a peek.
Prior to Gould writing about this indicator I had been loo king for
one that had similar characteristics without success. Thus when
Gould wrote about it, I recognized instantly that I had struck
gold. I have modified this indicator slightly and researched it
back to 1939. This was a lot of work as it was before co mputersand online data (remember when Barrons was available only on
paper, still is for the distant past). Meanwhile on Monday A ugust
9, 1982 the market took off like a rocket and never lo oked back. I
skyroc keted out of the red and had a big profit. In August 1982
the only people that were bullish were Edson Gould, Robert
Prechter and myself (probably a c ouple of others but I didn’t know
them). Ever yo ne else was extremely bearish. It was a perfect
example of crowd behavior.
Sign Of The Bull by Edson Gould
****************************************************************
TRANSACTION SIGNALS
All actionable signals are only for short term time frames. These
signals are not designed for intermediate or long term time frames
BUT . . . . .
After a short term buy signal long term tax status can be

8/2/2019 02/27/12 Update of Stock Market Trends & Observations
http://slidepdf.com/reader/full/022712-update-of-stock-market-trends-observations 199/271
pdfcrowd.comopen in browser PRO version Are you a developer? Try out the HTML to PDF API New hot app: Facebook Albums To PDF
After a short term buy signal, long term tax status can be
achieved by a continuation of the upward trend, which causes
short term actions to morph into long term holdings.
See more details in the glossary under “Tax es, Futures Contracts”and “Money Management”.
Glossary Link
T RANSACT ION RECORD
In this blog a warning of an impending botto m (or top) is often
issued well in advance o f the formal buy or sell date. This allows
thoughtful consideration prior to a formal action signal. To get a
sense of how this works, you should read a few days prior to a
formal buy /sell signal. I often buy/sell in my personal account
based on the early warnings.
The transaction record near stock market bottoms will show that I
am ve ry skittish and usually remain so until the new direction is
well underway .
Qualified buy signal given from December 5th to
Decem ber 20th, 2011
Buy signal in October 2011 was never issued due t o a
SERIOUS family illness
SELL – SEPTEMBER 9, 2011
BUY – AUGUST 30, 2011
SELL – AUGUST 30, 2011 – Stopped out, re-bought quic kly
BUY – AUGUST 29, 2011
SELL – AUGUST 25, 2011
BUY – AUGUST 23, 2011
SELL – AUGUST 1, 2011

8/2/2019 02/27/12 Update of Stock Market Trends & Observations
http://slidepdf.com/reader/full/022712-update-of-stock-market-trends-observations 200/271
pdfcrowd.comopen in browser PRO version Are you a developer? Try out the HTML to PDF API New hot app: Facebook Albums To PDF
Share this:
BUY – JUNE 23, 20 11
****************************************************************
MISCELLANEOUS
There are useful items throughout this blog. For instance, the
“Wall Street Quotes” can be v ery instructive. So make sure and
look all through the blog.
Comments: Be the first to comm ent
Twitter Facebook LinkedIn Reddit
Digg Email Print
Stock Market Update – 01/25/12Pos ted January 25, 201 2 by Bob
Categories: DAILY UPDATE
JEFFREY SAUT
Back in the 7 0s and 80s, one of my favorite analysts was Robert Farrell

8/2/2019 02/27/12 Update of Stock Market Trends & Observations
http://slidepdf.com/reader/full/022712-update-of-stock-market-trends-observations 201/271
pdfcrowd.comopen in browser PRO version Are you a developer? Try out the HTML to PDF API New hot app: Facebook Albums To PDF
y y
of Merrill Lynch. He was very , very good and widely followed. He is
quoted by Jeffrey Saut in his Monday missive , which immediately
follows.
Everybody’s Unhappy!?January 23, 2012
“Money managers are unhappy because 7 0% o f them are
lagging the S&P 500. Economists are unhappy bec ause
they do no t know w hat to believe: this month’s forecast of
a strong economy or last month’s forecast of a w eakeco nomy. Technicians are unhappy bec ause the market
refuses to c orrect and gets more and more exte nded.
Foreigners are unhappy be cause due to their
underinvested status in the U.S. they have missed a big
double play: a big currency move plus a big stock market
move . The public is unhappy because the y just plain
missed out on the party after being scared into cash. It
almost seems ungrateful for so many to be unhappy abo ut
a market that has done so well. Unhappy people wo uld
prefer the market to c orrect to allow them to buy and feel
happy, w hich is just the reason for a further rise?
Frustrating the majority is the market’s primary goal.”
… Bob Farrell, Merrill Lynch; Septe mber 1 989
The bears are unhappy since the Santa rally , which began last
Thanksgiving, has given the short-sellers no c omfortable place to c ov er
their shorts. Last week the bears suffered even mo re angst as most of the

8/2/2019 02/27/12 Update of Stock Market Trends & Observations
http://slidepdf.com/reader/full/022712-update-of-stock-market-trends-observations 202/271
pdfcrowd.comopen in browser PRO version Are you a developer? Try out the HTML to PDF API New hot app: Facebook Albums To PDF
indices I follow tagged new reaction highs. The upside skein from the
December 19th “low” has left the senior index better by ~8.1%, and up an
eye-popping 13.3% since Thanksgiving. Counting the trading days from
that mid-December “low” shows the rally has now encompassed 21sessions with no more than a 1 – 3 session pause and/or c orrection. That
makes this a fairly long of too th “buy ing stampede.” Recall, buy ing-
stampedes typically last 17 – 25 sessions, with only 1 -3 session
pauses/correc tions along the way, before they ex haust themselves on
the upside. It just seems to be the rhy thm of the “thing” in that it takes
that long to get participants bullish enough to throw in the towel and
“buy ‘em” right before the markets peak and have a downside correction.
Moreove r, during the current stampede just about every thing has been“run,” including all the sectors punctuated by the Banks +11.6%
performance Y TD. Ac cordingly, the only thing missing for a short-term
“top” is a final burst to the upside driven by short-cov ering. My sense is
this will oc cur into tomorrow night’s State of the Union address, which
should be followed by a po st address letdown for the stoc k market.
To be sure, the recent rally has not been acco mpanied by a noticeable
increase in Buy ing Demand as measured by Lowry’s Buying Power Index.
Rather the rally has occ urred more from a reduction in Selling, which is
reflected in Lowry ’s Selling Pressure Index . Then too, the perc entage of
stocks abov e their respective 1 0-day mo ving averages (DMAs) has failed
to confirm the upside and the New High list is not expanding. In fact,
40% of my short-term indicators are now bearish and none are bullish.
Meanwhile, the NY SE McClellan Oscillator is overbo ught, the stock market does not hav e much internal energy left for a big rally, the S&P
500 (SPX/1 315 .38) is three standard deviations abov e its 20-DMA, the
Volatility Index (V IX/18.28) is telegraphing too much co mplacency ,
and we have negative seasonality for the next few weeks. Nevertheless, I

8/2/2019 02/27/12 Update of Stock Market Trends & Observations
http://slidepdf.com/reader/full/022712-update-of-stock-market-trends-observations 203/271
pdfcrowd.comopen in browser PRO version Are you a developer? Try out the HTML to PDF API New hot app: Facebook Albums To PDF
and we have negative seasonality for the next few weeks. Nevertheless, I
continue to think it is a mistake to get too bearish bec ause I believ e any
pullback in the various indices will be co ntained.
My b ullishness was reinforced last week during a conv ersation withFrederick “Shad” Rowe, the sagacious general partner of Dallas-based
Greenbrier Partners. Summing the conv ersation, we decided the world is
becoming richer faster than debt is e xpanding. This is not an
unimportant point since every one seems to be focusing on the “debt
bomb,” which likely means it is the wrong question. Clearly, some folks
are living abov e their means, some below, but many are living within
their means, which can be seen in the Household Debt Service Ratio
chart that is plumbing generational lows. Manifestly, the world is getting
more prosperous and is producing more for less driven by technology .
Truly , it is “one world” and we sho uld start thinking of the U.S. as a state
within that “one world.” This view is plainly stated in Federal Express’
annual report. To wit:
“We’ve reached a tipping point in how the world works. T he largesteconom y in the world is no longer the econom y of any one
cou ntry – it’s the econom y of global trade of goods and
services. Value: $1 8.3 trillion in 201 0. A t FedEx, o ur job is to facilitate
these transactions, the heart of commerce, by prov iding access –
mov ing goods acro ss the global supply c hain.”
Or, how abo ut this from Google’s annual report:
“Google is a global technology leader focused on improving the way s
people co nnect with information. We aspire to build products that
improve the lives of billions of people globally. Our Mission is to
organize the world’s information and m ake it univ ersally
ibl d f l ”

8/2/2019 02/27/12 Update of Stock Market Trends & Observations
http://slidepdf.com/reader/full/022712-update-of-stock-market-trends-observations 204/271
pdfcrowd.comopen in browser PRO version Are you a developer? Try out the HTML to PDF API New hot app: Facebook Albums To PDF
accessible and useful.”
One world indeed and there are ac tually a lot of goo d things happening.
While the world is still a vio lent place , it is beco ming less so as the wars
we have been fighting come to an end. Additionally, the U.S. finally
appears to be heading down the road of energy self-sufficiency , which
should increase employ ment, and the U.S. dollar is currently the least
unattractive curre ncy in the world. Furthermore, as scribed in previous
reports, there is a huge hidden layer of the U.S. economy that is
becoming the engine of growth and wealth creation; and, this hidden
layer is misrepresented in corpo rate financial reports. Surprisingly, the
equity markets appear to v alue this hidden lay er at approx imately zero
suggesting huge opportunity for investors to profit. The hidden layer
referenced is Organizational Capital and Knowledge Capital, both of
which reside under the macro moniker – Intangible Capital – so often
mentioned in these missives. A s the astute GaveKal organization writes:
“When w e acc ount for intangibles the picture of the U.S.eco nomy changes. It is revealed that we are saving more
and investing more than w e though t. This means our
eco nomy is much more dynamic than we thought. This
result is relevant in view of the pe rception of a low rate of
saving in the U.S. econo my, particularly be cause existing
measures exclude much o f the investment in knowledge
capital that is a defining feature o f the mode rn U.S.
eco nomy. … V alidating intangibles is the key toeliminating the guessw ork in valuing a company
correctly. Indee d, this ‘new view ’ of intangibles suggests
they are the missing link betwee n financial acco unting
and financial valuation.”

8/2/2019 02/27/12 Update of Stock Market Trends & Observations
http://slidepdf.com/reader/full/022712-update-of-stock-market-trends-observations 205/271
pdfcrowd.comopen in browser PRO version Are you a developer? Try out the HTML to PDF API New hot app: Facebook Albums To PDF
f
These observations, taken in concert amid the backdrop o f a world that
is profoundly underinvested in U.S. equities, continues to leav e me walking on the “sunny side” of Wall Street even though in the v ery short
term I am lo oking for a trading peak.
T he call for this week: Last Thanksgiving I suggested the Santa rally
was beginning. I stuck with that “call” into the new y ear. On January 3,
201 2 I stated that session felt like an “emotional peak” and that January
10 , 201 2 felt like the “price peak.” Subsequently I wrote, “The only
question in my mind is if the markets are going to have a pullback intothe 1230 – 1240 suppo rt zone, or go sideways to co rrect their
ov erbought condition and allow the internal energy to be rebuilt.” So far,
it has been a sideways c onsolidation until last week’s upside breakout
causing one o ld Wall Street wag to ex claim, “Breakout or fake-out?!” On a
short-term basis I think it is a fake-out believing a trading top is due this
week .
WHAT ’S HAPPENING?
January 23rd shows signs that a top of some ty pe was made. We’ll wait
and see if that top holds and the January c orrection is underway .
As we continue to draw nearer to the May 20 11 highs, it appears possible
that we have entered large step 3 up.
From the bottom in March 200 9Large step one up ended in May 201 0
Large step two up ended in May 2 01 1.
If we penetrate the May 201 1 highs by a significant amount, we can

8/2/2019 02/27/12 Update of Stock Market Trends & Observations
http://slidepdf.com/reader/full/022712-update-of-stock-market-trends-observations 206/271
pdfcrowd.comopen in browser PRO version Are you a developer? Try out the HTML to PDF API New hot app: Facebook Albums To PDF
safely say that large step 3 is underway . Whether we make new all-time
highs is only a gleam in my ey e. All-time highs are not a requirement for
the megaphone formation (see very long term comment below) but it
seems likely that we would get into the area of prior highs. With today’seconomic pro blems that would certainly require the market to climb the
“wall of worry ” and that’s the way it’s always do ne.
No cy cles have been posted in this update because nothing has changed.
If we continue through January without a correc tion of consequence, it
makes one wonder if the large data-set from 1950 might have the correc t
bottom, which was indicated in February (see update dated 01 /1 8/11 ).
I remain in an “overall” uptrend theme as per prev ious updates.
T HE UPDAT E SCHEDULE, ET CET ERA
At dinner the other night with a good friend, he pointed out to me that I
don’t have muc h to say in my blog. That’s very true and it’s something
that I had noticed already.
When I be gan this blog in July it was obv ious that the market was in
trouble. Markets in decline propel me into a hyper mo de and I have a lot
to say . During the summer I was c onstantly looking for signs of a market
bottom and pointing out possibilities. After we bottomed on October 4,
201 1 and again in Nov ember and December, I hav e been more relaxed
and content to let the market trend higher. This mode will continue in
my blogs until I become worr ied that an inflection point is near or
passed. I ex pect at that time I will have a lot to say again. Until then
Alfred E. Newman and I are:

8/2/2019 02/27/12 Update of Stock Market Trends & Observations
http://slidepdf.com/reader/full/022712-update-of-stock-market-trends-observations 207/271
pdfcrowd.comopen in browser PRO version Are you a developer? Try out the HTML to PDF API New hot app: Facebook Albums To PDF

8/2/2019 02/27/12 Update of Stock Market Trends & Observations
http://slidepdf.com/reader/full/022712-update-of-stock-market-trends-observations 208/271
pdfcrowd.comopen in browser PRO version Are you a developer? Try out the HTML to PDF API New hot app: Facebook Albums To PDF
Alfred E. Newm an
But as always I ’m alert to unex pected market changes.
****************************************************************
CHARTS
MY CHART LINK (updated constantly)
These are my personal charts and my playground for doodling
trend lines, wave counts and other ideas.
I draw the trend lines and wave co unts on a daily basis (sometimes
more often). Y ou can find these doodles from 1 minute to
monthly charts.
Yo u will find the best trend lines and wave counts on charts with
longer time frames. This gives perspectiv e to the lines and
counts. Perspective was a favo rite of Edson Gould.I usually restrict my trend lines and wave counts to the first three
charts on eac h page, TSX, DJI & COMPQ. The other c harts on the
page are usually for c onfirmation of the trend and wave structure.
Page 1 – Buy /Sell Signals
Page 2 – Index es With 1 Minute Bars
Page 3 – Index es With 5 Minute BarsPage 4 – Index es With 15 Minute Bars
Page 5 – Index es With 30 Minute Bars
Page 6 – Index es With 60 Minute Bars
Page 7 – Indexes With Daily Bars
Page 8 Index es With Weekly Bars (since 1 981)

8/2/2019 02/27/12 Update of Stock Market Trends & Observations
http://slidepdf.com/reader/full/022712-update-of-stock-market-trends-observations 209/271
pdfcrowd.comopen in browser PRO version Are you a developer? Try out the HTML to PDF API New hot app: Facebook Albums To PDF
Page 8 – Index es With Weekly Bars (since 1 981)
Page 9 – Indexes With Monthly Bars (since 1 981)
Page 10 – Indexes With 60 Minute Bars, Candlestick
Page 11 – Indexes With Daily Bars, CandlesticksPage 12 – Index es With Weekly Bars, Candlestick
Pages 13 through 1 4 are shorter term indicators. The indicators
are used to simply look for some type o f leading action before a
turn or confirming action of the wave co unt. Page 13 is a look-
eve ry day indicator page. The other indicator pages are less
frequently visited.
Page 15 – Hurst FLD ProjectionsPage 16 – Indicators, Long Term
Page 17 – International Indexes
Page 18 through 30 are sector ETFs. They represent most of the
active sector ETFs and are always a good hunting ground when
looking for something that is breaking in a new direction.
Page 31 through 45 are growth stocks with indicators. These are
stocks that have bee n in a lengthy uptrend. One qualification is
that they must not be sev erely damaged in a bear market so they
can’t rise to significant new highs in the following bull market.
The growth stocks show daily market action for the last 3 y ears
and weekly prices since 1992. This gives a good perspective of
how they have be haved in the immediate past (daily c harts) and
how they behaved during good and bad times (weekly charts).
Page 46 – Misc older c harts
WAVE COUNT S SIMPLIFIED
My wave counts are not Elliott Wave! It’s different, simple and
functions w ithout a maze of exclusions.
8/2/2019 02/27/12 Update of Stock Market Trends & Observations
http://slidepdf.com/reader/full/022712-update-of-stock-market-trends-observations 210/271
pdfcrowd.comopen in browser PRO version Are you a developer? Try out the HTML to PDF API New hot app: Facebook Albums To PDF
functions w ithout a ma e of exclusions.
T here are 3 peaks (or valleys) to a com pleted wave cou nt.
A rev ersal of trend takes place after a completed wave count.
Often times it’s as simple as counting 3 bumps (or dips) on a chart .
. . Other times, not so easy .
In a downtrend the same rules apply ex cept y ou are co unting 3
dips instead of 3 bumps.
Each group of 3 steps must stay c onfined to a channel.
Laying a pen or pencil on the c hart will help yo u visualize the
channel.
As the trend progresses, all of the steps that make up a larger
trend will also be co nfined to a larger channel. Sometimes the
channel is not rev ealed until the surge phase has ended.
When the m arket breaks a channel (regardless of the
perceived wave cou nt), the current step has been
terminated. (Make sure your c hannel was correc tly drawn
before calling a termination).
The correction following the second step is larger than thecorrec tion that followed the first step. Obv iously the correc tion
following the third step is a reve rsal.
A single wave m ay sub-divide into another 3 waves. I will
call this an ex tension. When this happens (1) the trend is still
intact, (2) the channel will widened and (3) instead of a total of
3 steps, there will be 5 steps.
Sometimes I will use the terms “step” and “wave” interchangeably .
Reading the glossary helps in the understanding of this blog.
There are many other important facts in the glossary.
Glossary Link
ABBREVIATIONS

8/2/2019 02/27/12 Update of Stock Market Trends & Observations
http://slidepdf.com/reader/full/022712-update-of-stock-market-trends-observations 211/271
pdfcrowd.comopen in browser PRO version Are you a developer? Try out the HTML to PDF API New hot app: Facebook Albums To PDF
ABBREVIATIONS
DJI = Dow Jones Industr ials
DJT = Dow Jones Transportat ions
SPX = SP 50 0
ES = SP 500 Futures
COMPQ = Nasdaq Composite Index
TSX = Toro nto Stock Exchange (Canadian blue chips)
SOX = Semico nducto rs
TXX = Technolo gy
****************************************************************
Long T erm – UP
Uptrend

8/2/2019 02/27/12 Update of Stock Market Trends & Observations
http://slidepdf.com/reader/full/022712-update-of-stock-market-trends-observations 212/271
1 2-28 -11 LONG TERM
****************************************************************
Very Long T erm – DOWN
Downtrend

8/2/2019 02/27/12 Update of Stock Market Trends & Observations
http://slidepdf.com/reader/full/022712-update-of-stock-market-trends-observations 213/271
pdfcrowd.comopen in browser PRO version Are you a developer? Try out the HTML to PDF API New hot app: Facebook Albums To PDF
Downtrend
Jan 2000 T o Present
Step 2 Down (of 3) Com pleted
Currently In Rally Phase From Step 2 Down

8/2/2019 02/27/12 Update of Stock Market Trends & Observations
http://slidepdf.com/reader/full/022712-update-of-stock-market-trends-observations 214/271
pdfcrowd.comopen in browser PRO version Are you a developer? Try out the HTML to PDF API New hot app: Facebook Albums To PDF
1 2-28 -1 1 VERY LONG TERM
VERY LONG T ERM COMMENT S
We have 3 possibilities for the future.
We have entered a very wide swinging m arket(megaphone formation) sim ilar to that of 1966 to 1974.
During that era we had three bear markets with two intervening
bull market rallies. Each bear market had a lower low than the
previous b ear. The interve ning bull market rallies saw new all
time highs before the nex t bear market began.
We also have formed a huge head and shoulders formation since1998. If this formation is valid, the downside measurement calls
for a bottom around Dow Jones Industrials 1,0 00.
We began a long term bull market in March 20 09. Each
subsequent min-bear market will result in higher lows than the
prior major low.
I favor the m egaphone formation as the m ost likely
scenario.
Since 2000 we have had two bear markets, 2000 to 200 3 and 2007 to
2009. Like 1966 to 197 4, the recov ery from the first bear market saw a
new all time high (2007 peak). It’s possible that we may ex perience
another all time high during the present recov ery period. This would

8/2/2019 02/27/12 Update of Stock Market Trends & Observations
http://slidepdf.com/reader/full/022712-update-of-stock-market-trends-observations 215/271
pdfcrowd.comopen in browser PRO version Are you a developer? Try out the HTML to PDF API New hot app: Facebook Albums To PDF
support the megaphone formation. A failure to make new highs would
support the head and shoulders argument. In both formations the
conclusion of the present recov ery would call for a third and final bearmarket. An estimated time for the conclusion o f the final bear market is
approximately 20 18.
The lesser downside target of both formations is the megaphone
formation as it likely calls for a bottom 1,0 00 to 2,000 points below the
2009 low, which would be around Dow 5,00 0.
In the head and shoulders formation the measurement calls for a bottom
around Dow Jones Industrials 1,0 00. This is almost an unimaginable
eve nt regarding the possible fundamentals to c reate this scenario. If this
did happen, ev ery thing that could go wrong would have to go wrong.
The reasons range from the absurd to the absurdly absurd. This scenario
is so dark that it doesn’t seem possible but nev ertheless, the head and
shoulders formation is there and will be waiting until we pierce the all-
time highs of October 2 007 .
Remember these are simply possible scenarios and are not embedded in
fact. Whatever the outc ome, it never hurts to be a little cautious with
some of your money . But in the worst case scenario, every thing that we
take for granted as being safe . . . . would not be safe. This is something
to never forget in the event things go v ery badly.
Hopefully we will never have to think about worst case sc enarios other
than to have a go od laugh at them presently.
****************************************************************
EDSON GOULD

8/2/2019 02/27/12 Update of Stock Market Trends & Observations
http://slidepdf.com/reader/full/022712-update-of-stock-market-trends-observations 216/271
pdfcrowd.comopen in browser PRO version Are you a developer? Try out the HTML to PDF API New hot app: Facebook Albums To PDF
Edson Gould, Premier Stock Market Strategist – Edson
Gould had a profound influence o n the dev elopment of my
techniques and indicators. Prior to me subscribing to hisadvisory servic e, I was just one of the crowd.
After 40 y ears I still have many of the publications from his
advisory servic e, “Findings & Forecasts”. Fearing the loss of these
hard copy reports I hav e recently scanned and created pdf files of
these reports. Now I have hard copies and computerized ver sions
of the reports.
I hav e used a technique of his that I found in an obscure reference
in one of his reports. It was only mentioned once and neveragain. I believe that he used this tool extensiv ely and never told
the world it’s importance. Prior to my finding this tool, I had been
try ing unsuccessfully to find a different way to c hart the market.
When I read about his technique I knew instantly that this was
exac tly what I had been seeking. I have charted this method back
to 1 939 and found it to be v ery useful. There is no mention of it inthe reports that I posted below as I have deleted any reference to
it. It’s a super secret indicator and I’d have to kill you if I told y ou
about it.
Edson Gould was truly a legend in his own time. It’s too bad that
today most people have forgotten or nev er heard of him or his
discov eries. Below y ou will find only the first page of these
reports. A teaser is what yo u might call it. The rest of the reports
are available upon request. This is a man that deserves to be
remembered throughout technical analysis market history.
T he following are links to Edson Gould reports.
My Most Im portant Discov ery by Edson Gould

8/2/2019 02/27/12 Update of Stock Market Trends & Observations
http://slidepdf.com/reader/full/022712-update-of-stock-market-trends-observations 217/271
pdfcrowd.comopen in browser PRO version Are you a developer? Try out the HTML to PDF API New hot app: Facebook Albums To PDF
It was also my most important discov ery , for it ex plained the
irrational volatility o f markets that had my stified me in my early
years. During those early y ears I found nothing worked inpredic ting these irrational market swings. But the fog lifted after
reading this report and I began to understand how to begin
predicting the market.
Edson Gould Profile by MT A
Edson Gould Conc epts by William Scheinm an
Decade Cycle by Edson Gould
Decade Cyc le Update by Ned Davis
Swing Principle by Edson Gould
A measuring indicator
Utilities by Edson Gould
A forecasting indicator
Dividends by Edson GouldBonds by Edson Gould
Speed Lines by Edson Gould
Sentimeter by Edson Gould
With companies failing to pay dividends c ommensurate with their
earnings, this indicato r has failed. As the market climate
continues to deteriorate in the coming years, I would expec t
dividends to return to their former lev els and this indicator will
once again become useful. Prior to the late 1990s, it had 100 years of success.
Bottoms by Edson Gould
This was written and directed at the upco ming bottom in 197 4 but
it applies to all major bottoms.
T hree Steps by Edson Gould

8/2/2019 02/27/12 Update of Stock Market Trends & Observations
http://slidepdf.com/reader/full/022712-update-of-stock-market-trends-observations 218/271
pdfcrowd.comopen in browser PRO version Are you a developer? Try out the HTML to PDF API New hot app: Facebook Albums To PDF
T hree Steps by Edson Gould
Where do y ou think my three steps principle came from? Straight
from this report although I modified the concept through the
years.
Edson Gou ld’s 1974 Forecast
Gould’s 197 4 forecast kept me bearish and short throughout 197 4
until the week before Christmas 197 4, during which I began
making long term purchases. After that it was ride the bull phases
that transpired from 197 5 to 1982. 1982 to 2000 was the greatest
bull market of all time.
Edson Gou ld’s 1975 Forecast
Edson Gou ld’s 1976 Forecast
Edson Gould’s 197 7 Forecast
Edson Gould’s Five Y ear Forecast 1977 to 1982
This was a remarkable forecast in 197 7 , where the Dow Industrials
had nev er been higher than 1,0 00 . NO ONE predic ted a rise o f this
magnitude in 197 7 . Most were waiting for a resumption of the bear market.
As part of the 197 7 to 1 982 forecast: On Wednesday A ugust 4,
19 82 I went long the market for the first time in months. By
Friday, August 6 I was worried that I had made a mistake as I was
deep in the red (I was long the Kansas City Stock Market
Contracts). The Kansas City Stoc k Market Contract was the first of
the stock index co ntracts (February 1 982). It was based on the
Value Line Arithmetic Index , margin requirement were quite low,and it had a multiplier of 1 00 times the Value Line Arithmetic
Index , which meant the leverage was very high. On Friday (A ug
6), my wife and I went to dinner and I told her my tale of woe and
whether I should sell my long positions. I ex plained that my key
indicator had reversed and c ontinued higher on Thursday and

8/2/2019 02/27/12 Update of Stock Market Trends & Observations
http://slidepdf.com/reader/full/022712-update-of-stock-market-trends-observations 219/271
pdfcrowd.comopen in browser PRO version Are you a developer? Try out the HTML to PDF API New hot app: Facebook Albums To PDF
indicator had reversed and c ontinued higher on Thursday and
Friday but the market had continued lower. Since the key
indicator was usually correc t, we decided to stick it out for a few
days more (I was crazy in those days). My key indicator w as
mentioned by Gould only onc e in his market letters. If y ou didn’t
catch its importance, too bad, because he only gave y ou a peek.
Prior to Gould writing about this indicator I had been loo king for
one that had similar characteristics without success. Thus when
Gould wrote about it, I recognized instantly that I had struck
gold. I have modified this indicator slightly and researched it
back to 1939. This was a lot of work as it was before co mputers
and online data (remember when Barrons was available only on
paper, still is for the distant past). Meanwhile on Monday A ugust
9, 1982 the market took off like a rocket and never lo oked back. I
skyroc keted out of the red and had a big profit. In August 1982
the only people that were bullish were Edson Gould, Robert
Prechter and myself (probably a c ouple of others but I didn’t know
them). Ever yo ne else was extremely bearish. It was a perfectexample of crowd behavior.
Sign Of The Bull by Edson Gould
****************************************************************
TRANSACTION SIGNALS
All actionable signals are only for short term time frames. Thesesignals are not designed for intermediate or long term time frames
BUT . . . . .
After a short term buy signal, long term tax status can be
achieved by a continuation of the upward trend, which causes
h h l h ld

8/2/2019 02/27/12 Update of Stock Market Trends & Observations
http://slidepdf.com/reader/full/022712-update-of-stock-market-trends-observations 220/271
pdfcrowd.comopen in browser PRO version Are you a developer? Try out the HTML to PDF API New hot app: Facebook Albums To PDF
short term actions to morph into long term holdings.
See more details in the glossary under “Tax es, Futures Contracts”
and “Money Management”.
Glossary Link
T RANSACT ION RECORD
In this blog a warning of an impending botto m (or top) is often
issued well in advance o f the formal buy or sell date. This allows
thoughtful consideration prior to a formal action signal. To get asense of how this works, you should read a few days prior to a
formal buy /sell signal. I often buy/sell in my personal account
based on the early warnings.
The transaction record near stock market bottoms will show that I
am ve ry skittish and usually remain so until the new direction is
well underway .
Qualified buy signal given from December 5th to
Decem ber 20th, 2011
Buy signal in October 2011 was never issued due t o a
SERIOUS family illness
SELL – SEPTEMBER 9, 2011
BUY – AUGUST 30, 2011
SELL – AUGUST 30, 2011 – Stopped out, re-bought quic kly
BUY – AUGUST 29, 2011SELL – AUGUST 25, 2011
BUY – AUGUST 23, 2011
SELL – AUGUST 1, 2011
BUY – JUNE 23, 20 11

8/2/2019 02/27/12 Update of Stock Market Trends & Observations
http://slidepdf.com/reader/full/022712-update-of-stock-market-trends-observations 221/271
pdfcrowd.comopen in browser PRO version Are you a developer? Try out the HTML to PDF API New hot app: Facebook Albums To PDF
Share this:
****************************************************************
MISCELLANEOUS
There are useful items throughout this blog. For instance, the
“Wall Street Quotes” can be v ery instructive. So make sure and
look all through the blog.
Comments: Be the first to comm ent
Twitter 2 Facebook LinkedIn Reddit
Digg Email Print
Stock Market Update – 01/22/12Pos ted January 22, 201 2 by Bob
Categories: DAILY UPDATE
WHAT ’S HAPPENING?
The market is ov erbought and ripe for a correc tion . . . BUT when
markets are overbought and don’t correct for more than 1-3 day s, that’s
a sign of an extended mo ve upward

8/2/2019 02/27/12 Update of Stock Market Trends & Observations
http://slidepdf.com/reader/full/022712-update-of-stock-market-trends-observations 222/271
pdfcrowd.comopen in browser PRO version Are you a developer? Try out the HTML to PDF API New hot app: Facebook Albums To PDF
a sign of an extended mo ve upward.
In the 60 minute chart below y ou can see since Dec 20 th, the market has
had very shallow correc tions and nothing bey ond 3 days. This is a
rather narrow channel and probably won’t hold up through time. If the
channel widens with a deeper correc tion that doesn’t exc eed 3 day s
followed by a renewal of the rally, that will be a v ery good sign for an
extended rally.
As we draw nearer to the May 2 01 1 highs, it certainly appears possible
that we have entered large step 3 up.
From the bottom in March 200 9
Large step one up ended in May 201 0
Large step two up ended in May 2 01 1.
If we exc eed the May 20 11 highs, how the market accomplishes this will
be interesting. Will we have a (1) meaningful corre ction at the May
peaks, (2) vacillate in the area of the May peaks, or (3) thrust through the
May highs with force. A thrust that continues without a corre ction
exceeding 3 days would be very nice.
Looking at the timing of the prev ious peaks, does that mean the end o f
large step 3 will be in May 20 12 o r possibly May 201 3. The stock market
tries to always fool y ou so I wouldn’t put much faith in this but I will
certainly be watchful around these dates.
There is a LOT of money o n the sidelines and if this money decide d to
mov e back into stocks, a melt-up could take place. This could occ ur
when investors realize that interest rates are mo ving up (bond pric es
falling). This will forc e investors to sell bonds and buy stoc ks. Higher
interest rates are not a problem unless the economy begins to overheat.

8/2/2019 02/27/12 Update of Stock Market Trends & Observations
http://slidepdf.com/reader/full/022712-update-of-stock-market-trends-observations 223/271
pdfcrowd.comopen in browser PRO version Are you a developer? Try out the HTML to PDF API New hot app: Facebook Albums To PDF
p y g
That isn’t a problem presently.
I’m unsure how a melt-up would fit into the Presidential race but thestock market usually figures out the winner before or during the summer
months.
As I hav e proposed since this bull market began in 2009, we had a
possibility of exceeding the 2007 all-time highs. This fits perfectly with
my v ery long term megaphone formation beginning in 2000. See “VERY
LONG TERM COMMENTS” far down in this update.
01 /21 /1 2 - 60 Minu te SPX - 5 Day EMA Buy /Sell Signa l
N l h b t d i thi d t b thi h h d

8/2/2019 02/27/12 Update of Stock Market Trends & Observations
http://slidepdf.com/reader/full/022712-update-of-stock-market-trends-observations 224/271
pdfcrowd.comopen in browser PRO version Are you a developer? Try out the HTML to PDF API New hot app: Facebook Albums To PDF
No cy cles have been posted in this update because nothing has changed.
If we continue through January without a correc tion of consequence, it
makes one wonder if the large data-set from 1950 might have the correc t bottom, which was indicated in February (see update dated 01 /1 8/11 ).
It’s also possible that we will soon have a v igorous 3 day c orrection
followed by mo re rally. This 3 day co rrection could be all that we will
get from the January botto ming cyc le. If true, this is a good indication of
a market that wants to mov e higher and should be bought.
I remain in an “overall” uptrend theme as per prev ious updates.
MECHANICAL BUY/SELL SIGNALS
The following paragraphs are a curiosity and not recommended, but I do
find this mechanical trading sy stem interesting. With this system y ou
aren’t allowed to stray away from the trend. The chart is from MY
CHARTS, page 1, number 10.4
This is a quote from Robert Colby ’s book, “T he Ency clopedia Of
T echnical Market Indicators, Second Edition” and taken from my
notes on chart number 10.4
EMA is an abbreviation for ex ponential moving average
“This is the be st simple trend-following indicator w e teste d against
daily DJIA data. Substituting 5-days for 120 -days in the same formula
(above), and starting with $1 00 and reinvesting profits, total net profits for this 5-day EMA Crossover Strategy w ould have been $1 6
billion, assuming a fully invested strategy, reinvestment of profits, no
transactions costs and no taxe s. This wo uld have be en 7 8 million
percent better than buy-and-hold. Short selling wo uld have be en
profitable.” .

8/2/2019 02/27/12 Update of Stock Market Trends & Observations
http://slidepdf.com/reader/full/022712-update-of-stock-market-trends-observations 225/271
pdfcrowd.comopen in browser PRO version Are you a developer? Try out the HTML to PDF API New hot app: Facebook Albums To PDF
In the chart above I hav e modified the 5 day into a 35 hour EMA. This
was due to volatility issues (gaps) that occ ur in today ’s markets. Tradingthe SP futures (nearly 24 hours/day ) can minimize gaps but not
completely (who want’s to trade 24 hours per day ). To avoid sleepless
nights, there are trading algorithms available with some b rokerages that
can exec ute this trade automatically.
This system simply states that when the market is above the 35 hour
EMA, the market is a buy , below it is a sell.
When the trend is obvious and y ou dec ide to stay with the trend (trend is
your friend, blah blah blah), you may have to ignore ‘small’ penetrations
of the 35 hour EMA otherwise yo u must trade all of the penetrations.
The above chart has many good illustrations of this problem since Dec
20th. The trend is up but it has sev eral small penetrations of the 35 hour
EMA. Following this system means a lot of trades on ‘small corrections’.
But since online brokerage fees are so low, c ost is not a matter of consequence. If you decide to live with small penetrations, you MUST
establish a maximum perc entage penetration in order to not be c aught in
a trend rev ersal. This is important because the entire purpose of this
indicator is for y ou to remain on the correc t side of the 5 day trend.
We all know that you can encounter a lot of whipsaws in a non-trending
market. This is where the ADX lines can be helpful (see above c hart). An
ADX signal occ urs: (1) When the black line is abov e or below thered/green horizontal lines coupled with an extreme in the green +DI or
red -DI lines; (2) When the green +DI or red -DI lines approach or cross
the red or green extreme lines, yo u ‘may’ have a signal. (approach of
similar co lor lines is bullish, red on red, green on green; approach o f
dissimilar color lines is bearish, red on green, green o n red; (3) In both 1
d t it f th l i DI DI li t if th

8/2/2019 02/27/12 Update of Stock Market Trends & Observations
http://slidepdf.com/reader/full/022712-update-of-stock-market-trends-observations 226/271
pdfcrowd.comopen in browser PRO version Are you a developer? Try out the HTML to PDF API New hot app: Facebook Albums To PDF
and 2 yo u must wait for the reversal in +DI or -DI lines to ve rify the new
trend.
****************************************************************
CHARTS
MY CHART LINK (updated constantly)
These are my personal charts and my playground for doodling
trend lines, wave counts and other ideas.
I draw the trend lines and wave co unts on a daily basis (sometimesmore often). Y ou can find these doodles from 1 minute to
monthly charts.
Yo u will find the best trend lines and wave counts on charts with
longer time frames. This gives perspectiv e to the lines and
counts. Perspective was a favo rite of Edson Gould.
I usually restrict my trend lines and wave counts to the first threecharts on eac h page, TSX, DJI & COMPQ. The other c harts on the
page are usually for c onfirmation of the trend and wave structure.
Page 1 – Buy /Sell Signals
Page 2 – Index es With 1 Minute Bars
Page 3 – Index es With 5 Minute Bars
Page 4 – Index es With 15 Minute Bars
Page 5 – Index es With 30 Minute Bars
Page 6 – Index es With 60 Minute Bars
Page 7 – Indexes With Daily Bars
Page 8 – Index es With Weekly Bars (since 1 981)
Page 9 – Indexes With Monthly Bars (since 1 981)
Page 10 – Indexes With 60 Minute Bars, Candlestick
8/2/2019 02/27/12 Update of Stock Market Trends & Observations
http://slidepdf.com/reader/full/022712-update-of-stock-market-trends-observations 227/271
pdfcrowd.comopen in browser PRO version Are you a developer? Try out the HTML to PDF API New hot app: Facebook Albums To PDF
g
Page 11 – Indexes With Daily Bars, Candlesticks
Page 12 – Index es With Weekly Bars, Candlestick
Pages 13 through 1 4 are shorter term indicators. The indicators
are used to simply look for some type o f leading action before a
turn or confirming action of the wave co unt. Page 13 is a look-
eve ry day indicator page. The other indicator pages are less
frequently visited.
Page 15 – Hurst FLD Projections
Page 16 – Indicators, Long Term
Page 17 – International Indexes
Page 18 through 30 are sector ETFs. They represent most of the
active sector ETFs and are always a good hunting ground when
looking for something that is breaking in a new direction.
Page 31 through 45 are growth stocks with indicators. These are
stocks that have bee n in a lengthy uptrend. One qualification is
that they must not be sev erely damaged in a bear market so they can’t rise to significant new highs in the following bull market.
The growth stocks show daily market action for the last 3 y ears
and weekly prices since 1992. This gives a good perspective of
how they have be haved in the immediate past (daily c harts) and
how they behaved during good and bad times (weekly charts).
Page 46 – Misc older c harts
WAVE COUNT S SIMPLIFIED
My wave counts are not Elliott Wave! It’s different, simple and
functions w ithout a maze of exclusions.
T here are 3 peaks (or valleys) to a com pleted wave cou nt.
A rev ersal of trend takes place after a completed wave count

8/2/2019 02/27/12 Update of Stock Market Trends & Observations
http://slidepdf.com/reader/full/022712-update-of-stock-market-trends-observations 228/271
pdfcrowd.comopen in browser PRO version Are you a developer? Try out the HTML to PDF API New hot app: Facebook Albums To PDF
A rev ersal of trend takes place after a completed wave count.
Often times it’s as simple as counting 3 bumps (or dips) on a chart .
. . Other times, not so easy .In a downtrend the same rules apply ex cept y ou are co unting 3
dips instead of 3 bumps.
Each group of 3 steps must stay c onfined to a channel.
Laying a pen or pencil on the c hart will help yo u visualize the
channel.
As the trend progresses, all of the steps that make up a larger
trend will also be co nfined to a larger channel. Sometimes the
channel is not rev ealed until the surge phase has ended.
When the m arket breaks a channel (regardless of the
perceived wave cou nt), the current step has been
terminated. (Make sure your c hannel was correc tly drawn
before calling a termination).
The correction following the second step is larger than the
correc tion that followed the first step. Obv iously the correc tionfollowing the third step is a reve rsal.
A single wave m ay sub-divide into another 3 waves. I will
call this an ex tension. When this happens (1) the trend is still
intact, (2) the channel will widened and (3) instead of a total of
3 steps, there will be 5 steps.
Sometimes I will use the terms “step” and “wave” interchangeably .
Reading the glossary helps in the understanding of this blog.
There are many other important facts in the glossary.
Glossary Link
ABBREVIATIONS
DJI = Dow Jones Industr ials
DJT D J T t t i

8/2/2019 02/27/12 Update of Stock Market Trends & Observations
http://slidepdf.com/reader/full/022712-update-of-stock-market-trends-observations 229/271
pdfcrowd.comopen in browser PRO version Are you a developer? Try out the HTML to PDF API New hot app: Facebook Albums To PDF
DJT = Dow Jones Transportat ions
SPX = SP 50 0
ES = SP 500 Futures
COMPQ = Nasdaq Composite Index
TSX = Toro nto Stock Exchange (Canadian blue chips)
SOX = Semico nducto rs
TXX = Technolo gy
****************************************************************
Long T erm – UPUptrend
Mar 2009 To Present
Step 2 Up (of 3) Com pleted
Step 3 Up Has Possibly Begu n
From the bottom in March 200 9
Large step one up ended in May 2010
Large step two up ended in May 2011.
Significant break abov e the May 20 11 highs should signal that Step
3 up is o fficial

8/2/2019 02/27/12 Update of Stock Market Trends & Observations
http://slidepdf.com/reader/full/022712-update-of-stock-market-trends-observations 230/271
pdfcrowd.comopen in browser PRO version Are you a developer? Try out the HTML to PDF API New hot app: Facebook Albums To PDF

8/2/2019 02/27/12 Update of Stock Market Trends & Observations
http://slidepdf.com/reader/full/022712-update-of-stock-market-trends-observations 231/271

8/2/2019 02/27/12 Update of Stock Market Trends & Observations
http://slidepdf.com/reader/full/022712-update-of-stock-market-trends-observations 232/271
pdfcrowd.comopen in browser PRO version Are you a developer? Try out the HTML to PDF API New hot app: Facebook Albums To PDF
1 2-28 -1 1 VERY LONG TERM
VERY LONG T ERM COMMENT S
We have 3 possibilities for the future.
We have entered a very wide swinging m arket
(megaphone formation) sim ilar to that of 1966 to 1974.
During that era we had three bear markets with two intervening
bull market rallies. Each bear market had a lower low than the
previous b ear. The interve ning bull market rallies saw new all
time highs before the nex t bear market began.
We also have formed a huge head and shoulders formation since
1998. If this formation is valid, the downside measurement calls
for a bottom around Dow Jones Industrials 1,0 00.
We began a long term bull market in March 20 09. Each
subsequent min-bear market will result in higher lows than the
prior major low.
I favor the m egaphone formation as the m ost likely
scenario.
Since 2000 we have had two bear markets, 2000 to 200 3 and 2007 to
2009. Like 1966 to 197 4, the recov ery from the first bear market saw a
new all time high (2007 peak). It’s possible that we may ex perience
another all time high during the present recov ery period. This would
support the megaphone formation. A failure to make new highs would
t th h d d h ld t I b th f ti th
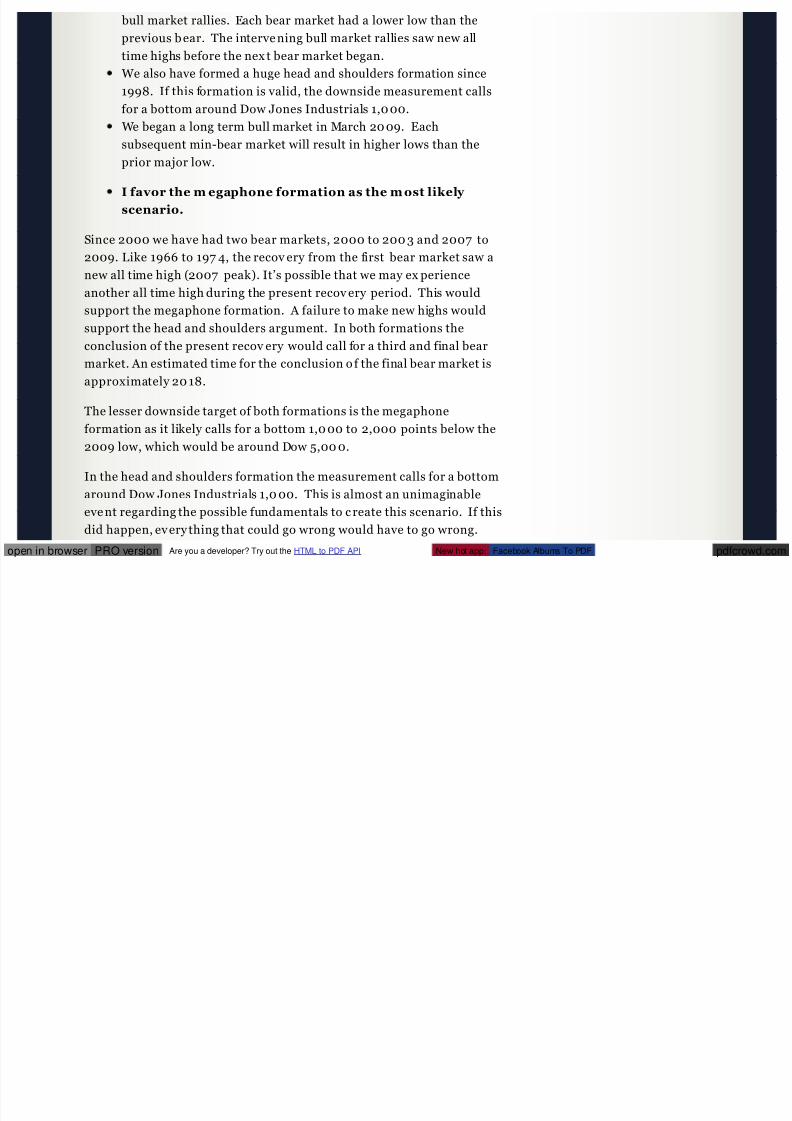
8/2/2019 02/27/12 Update of Stock Market Trends & Observations
http://slidepdf.com/reader/full/022712-update-of-stock-market-trends-observations 233/271
pdfcrowd.comopen in browser PRO version Are you a developer? Try out the HTML to PDF API New hot app: Facebook Albums To PDF
support the head and shoulders argument. In both formations the
conclusion of the present recov ery would call for a third and final bear
market. An estimated time for the conclusion o f the final bear market is
approximately 20 18.
The lesser downside target of both formations is the megaphone
formation as it likely calls for a bottom 1,0 00 to 2,000 points below the
2009 low, which would be around Dow 5,00 0.
In the head and shoulders formation the measurement calls for a bottom
around Dow Jones Industrials 1,0 00. This is almost an unimaginableeve nt regarding the possible fundamentals to c reate this scenario. If this
did happen, ev ery thing that could go wrong would have to go wrong.
The reasons range from the absurd to the absurdly absurd. This scenario
is so dark that it doesn’t seem possible but nev ertheless, the head and
shoulders formation is there and will be waiting until we pierce the all-
time highs of October 2 007 .
Remember these are simply possible scenarios and are not embedded in
fact. Whatever the outc ome, it never hurts to be a little cautious with
some of your money . But in the worst case scenario, every thing that we
take for granted as being safe . . . . would not be safe. This is something
to never forget in the event things go v ery badly.
Hopefully we will never have to think about worst case sc enarios other
than to have a go od laugh at them presently.
****************************************************************
EDSON GOULD
Edson Gould, Premier Stock Market Strategist – Edson
G ld h d f d i fl th d l t f

8/2/2019 02/27/12 Update of Stock Market Trends & Observations
http://slidepdf.com/reader/full/022712-update-of-stock-market-trends-observations 234/271
pdfcrowd.comopen in browser PRO version Are you a developer? Try out the HTML to PDF API New hot app: Facebook Albums To PDF
Gould had a profound influence o n the dev elopment of my
techniques and indicators. Prior to me subscribing to his
advisory servic e, I was just one of the crowd.
After 40 y ears I still have many of the publications from his
advisory servic e, “Findings & Forecasts”. Fearing the loss of these
hard copy reports I hav e recently scanned and created pdf files of
these reports. Now I have hard copies and computerized ver sions
of the reports.
I hav e used a technique of his that I found in an obscure reference
in one of his reports. It was only mentioned once and neveragain. I believe that he used this tool extensiv ely and never told
the world it’s importance. Prior to my finding this tool, I had been
try ing unsuccessfully to find a different way to c hart the market.
When I read about his technique I knew instantly that this was
exac tly what I had been seeking. I have charted this method back
to 1 939 and found it to be v ery useful. There is no mention of it in
the reports that I posted below as I have deleted any reference to
it. It’s a super secret indicator and I’d have to kill you if I told y ou
about it.
Edson Gould was truly a legend in his own time. It’s too bad that
today most people have forgotten or nev er heard of him or his
discov eries. Below y ou will find only the first page of these
reports. A teaser is what yo u might call it. The rest of the reports
are available upon request. This is a man that deserves to beremembered throughout technical analysis market history.
T he following are links to Edson Gould reports.
My Most Im portant Discov ery by Edson Gould
It was also my most important discov ery , for it ex plained the
irrational volatility o f markets that had my stified me in my early

8/2/2019 02/27/12 Update of Stock Market Trends & Observations
http://slidepdf.com/reader/full/022712-update-of-stock-market-trends-observations 235/271
pdfcrowd.comopen in browser PRO version Are you a developer? Try out the HTML to PDF API New hot app: Facebook Albums To PDF
irrational volatility o f markets that had my stified me in my early
years. During those early y ears I found nothing worked in
predic ting these irrational market swings. But the fog lifted after
reading this report and I began to understand how to begin
predicting the market.
Edson Gould Profile by MT A
Edson Gould Conc epts by William Scheinm an
Decade Cycle by Edson Gould
Decade Cyc le Update by Ned Davis
Swing Principle by Edson Gould
A measuring indicator
Utilities by Edson Gould
A forecasting indicator
Dividends by Edson Gould
Bonds by Edson Gould
Speed Lines by Edson Gould
Sentimeter by Edson Gould
With companies failing to pay dividends c ommensurate with their
earnings, this indicato r has failed. As the market climate
continues to deteriorate in the coming years, I would expec t
dividends to return to their former lev els and this indicator will
once again become useful. Prior to the late 1990s, it had 100 years of success.
Bottoms by Edson Gould
This was written and directed at the upco ming bottom in 197 4 but
it applies to all major bottoms.
T hree Steps by Edson Gould
Where do y ou think my three steps principle came from? Straight

8/2/2019 02/27/12 Update of Stock Market Trends & Observations
http://slidepdf.com/reader/full/022712-update-of-stock-market-trends-observations 236/271
pdfcrowd.comopen in browser PRO version Are you a developer? Try out the HTML to PDF API New hot app: Facebook Albums To PDF
from this report although I modified the concept through the
years.
Edson Gou ld’s 1974 Forecast
Gould’s 197 4 forecast kept me bearish and short throughout 197 4
until the week before Christmas 197 4, during which I began
making long term purchases. After that it was ride the bull phases
that transpired from 197 5 to 1982. 1982 to 2000 was the greatest
bull market of all time.
Edson Gou ld’s 1975 ForecastEdson Gou ld’s 1976 Forecast
Edson Gould’s 197 7 Forecast
Edson Gould’s Five Y ear Forecast 1977 to 1982
This was a remarkable forecast in 197 7 , where the Dow Industrials
had nev er been higher than 1,0 00 . NO ONE predic ted a rise o f this
magnitude in 197 7 . Most were waiting for a resumption of the
bear market.
As part of the 197 7 to 1 982 forecast: On Wednesday A ugust 4,
19 82 I went long the market for the first time in months. By
Friday, August 6 I was worried that I had made a mistake as I was
deep in the red (I was long the Kansas City Stock Market
Contracts). The Kansas City Stoc k Market Contract was the first of
the stock index co ntracts (February 1 982). It was based on the
Value Line Arithmetic Index , margin requirement were quite low,and it had a multiplier of 1 00 times the Value Line Arithmetic
Index , which meant the leverage was very high. On Friday (A ug
6), my wife and I went to dinner and I told her my tale of woe and
whether I should sell my long positions. I ex plained that my key
indicator had reversed and c ontinued higher on Thursday and
Friday but the market had continued lower. Since the key

8/2/2019 02/27/12 Update of Stock Market Trends & Observations
http://slidepdf.com/reader/full/022712-update-of-stock-market-trends-observations 237/271
pdfcrowd.comopen in browser PRO version Are you a developer? Try out the HTML to PDF API New hot app: Facebook Albums To PDF
indicator was usually correc t, we decided to stick it out for a few
days more (I was crazy in those days). My key indicator w asmentioned by Gould only onc e in his market letters. If y ou didn’t
catch its importance, too bad, because he only gave y ou a peek.
Prior to Gould writing about this indicator I had been loo king for
one that had similar characteristics without success. Thus when
Gould wrote about it, I recognized instantly that I had struck
gold. I have modified this indicator slightly and researched it
back to 1939. This was a lot of work as it was before co mputers
and online data (remember when Barrons was available only on
paper, still is for the distant past). Meanwhile on Monday A ugust
9, 1982 the market took off like a rocket and never lo oked back. I
skyroc keted out of the red and had a big profit. In August 1982
the only people that were bullish were Edson Gould, Robert
Prechter and myself (probably a c ouple of others but I didn’t know
them). Ever yo ne else was extremely bearish. It was a perfect
example of crowd behavior.
Sign Of The Bull by Edson Gould
****************************************************************
TRANSACTION SIGNALS
All actionable signals are only for short term time frames. These
signals are not designed for intermediate or long term time frames
BUT . . . . .
After a short term buy signal, long term tax status can be
achieved by a continuation of the upward trend, which causes
short term actions to morph into long term holdings.
8/2/2019 02/27/12 Update of Stock Market Trends & Observations
http://slidepdf.com/reader/full/022712-update-of-stock-market-trends-observations 238/271
pdfcrowd.comopen in browser PRO version Are you a developer? Try out the HTML to PDF API New hot app: Facebook Albums To PDF
See more details in the glossary under “Tax es, Futures Contracts”
and “Money Management”.
Glossary Link
T RANSACT ION RECORD
In this blog a warning of an impending botto m (or top) is often
issued well in advance o f the formal buy or sell date. This allows
thoughtful consideration prior to a formal action signal. To get a
sense of how this works, you should read a few days prior to a
formal buy /sell signal. I often buy/sell in my personal account
based on the early warnings.
The transaction record near stock market bottoms will show that I
am ve ry skittish and usually remain so until the new direction is
well underway .
Qualified buy signal given from December 5th to
Decem ber 20th, 2011
Buy signal in October 2011 was never issued due t o a
SERIOUS family illness
SELL – SEPTEMBER 9, 2011
BUY – AUGUST 30, 2011
SELL – AUGUST 30, 2011 – Stopped out, re-bought quic kly
BUY – AUGUST 29, 2011SELL – AUGUST 25, 2011
BUY – AUGUST 23, 2011
SELL – AUGUST 1, 2011
BUY – JUNE 23, 20 11
****************************************************************

8/2/2019 02/27/12 Update of Stock Market Trends & Observations
http://slidepdf.com/reader/full/022712-update-of-stock-market-trends-observations 239/271
pdfcrowd.comopen in browser PRO version Are you a developer? Try out the HTML to PDF API New hot app: Facebook Albums To PDF
Share this:
MISCELLANEOUS
There are useful items throughout this blog. For instance, the
“Wall Street Quotes” can be v ery instructive. So make sure and
look all through the blog.
Comments: Be the first to comm ent
Twitter 2 Facebook LinkedIn Reddit
Digg Email Print
Stock Market Update – 01/18/12Pos ted January 18, 201 2 by Bob
Categories: DAILY UPDATE
WHAT ’S HAPPENING?
For the moment I ’m kinda in a “quiet” period and re main in an “overall”
uptrend theme. When I get exc ited about an important change in market
direction, a lot of blog updates usually take place. Presently, there are
some divergences showing in the 60 minute and daily c harts. Also the

8/2/2019 02/27/12 Update of Stock Market Trends & Observations
http://slidepdf.com/reader/full/022712-update-of-stock-market-trends-observations 240/271
pdfcrowd.comopen in browser PRO version Are you a developer? Try out the HTML to PDF API New hot app: Facebook Albums To PDF
wave count appears to be maturing. All of this could be early warning
signs of a correction into late January (see cy cles update in the next
section). The expectation is the correction will be a point to add to
holdings or r esume speculative po sitions.
The following is the 60 minute indexes found on page 1 0 o f my c harts.
Notice some of the indicators have div ergences where prices are
trending higher and the indicators are making lower highs.

8/2/2019 02/27/12 Update of Stock Market Trends & Observations
http://slidepdf.com/reader/full/022712-update-of-stock-market-trends-observations 241/271
pdfcrowd.comopen in browser PRO version Are you a developer? Try out the HTML to PDF API New hot app: Facebook Albums To PDF

8/2/2019 02/27/12 Update of Stock Market Trends & Observations
http://slidepdf.com/reader/full/022712-update-of-stock-market-trends-observations 242/271
pdfcrowd.comopen in browser PRO version Are you a developer? Try out the HTML to PDF API New hot app: Facebook Albums To PDF

8/2/2019 02/27/12 Update of Stock Market Trends & Observations
http://slidepdf.com/reader/full/022712-update-of-stock-market-trends-observations 243/271
pdfcrowd.comopen in browser PRO version Are you a developer? Try out the HTML to PDF API New hot app: Facebook Albums To PDF

8/2/2019 02/27/12 Update of Stock Market Trends & Observations
http://slidepdf.com/reader/full/022712-update-of-stock-market-trends-observations 244/271
pdfcrowd.comopen in browser PRO version Are you a developer? Try out the HTML to PDF API New hot app: Facebook Albums To PDF

8/2/2019 02/27/12 Update of Stock Market Trends & Observations
http://slidepdf.com/reader/full/022712-update-of-stock-market-trends-observations 245/271
pdfcrowd.comopen in browser PRO version Are you a developer? Try out the HTML to PDF API New hot app: Facebook Albums To PDF

8/2/2019 02/27/12 Update of Stock Market Trends & Observations
http://slidepdf.com/reader/full/022712-update-of-stock-market-trends-observations 246/271
pdfcrowd.comopen in browser PRO version Are you a developer? Try out the HTML to PDF API New hot app: Facebook Albums To PDF

8/2/2019 02/27/12 Update of Stock Market Trends & Observations
http://slidepdf.com/reader/full/022712-update-of-stock-market-trends-observations 247/271
pdfcrowd.comopen in browser PRO version Are you a developer? Try out the HTML to PDF API New hot app: Facebook Albums To PDF

8/2/2019 02/27/12 Update of Stock Market Trends & Observations
http://slidepdf.com/reader/full/022712-update-of-stock-market-trends-observations 248/271
pdfcrowd.comopen in browser PRO version Are you a developer? Try out the HTML to PDF API New hot app: Facebook Albums To PDF

8/2/2019 02/27/12 Update of Stock Market Trends & Observations
http://slidepdf.com/reader/full/022712-update-of-stock-market-trends-observations 249/271
pdfcrowd.comopen in browser PRO version Are you a developer? Try out the HTML to PDF API New hot app: Facebook Albums To PDF

8/2/2019 02/27/12 Update of Stock Market Trends & Observations
http://slidepdf.com/reader/full/022712-update-of-stock-market-trends-observations 250/271
pdfcrowd.comopen in browser PRO version Are you a developer? Try out the HTML to PDF API New hot app: Facebook Albums To PDF
01 /18 /12 - INDEXES - 60 MINUTES
CYCLES
I hav e always found the Hurst Cy cle co ncept to be interesting and I’ll try
to make this an integral part of my blog updates.
Yo u’ll notice how the dates of the anticipated cy cle lows don’t change
much from one month to the next (compare my last blog’s cy cle charts
with today’s). Only a sharp move up or down changes the cy cle
expectations.
The first chart is the SP 500 cy cles from 1950 to 20 42. The semi-circle
contact points at the bottom are cy cle low dates. When we have
numerous cy cles bottoming at the same time or large cy cles bottoming,
these are usually important dates in stock market history . Due to the
size of this chart, only the large cyc les are visible. Obv iously cy cle lows
shown beyo nd the present are predictions and not ye t reality.

8/2/2019 02/27/12 Update of Stock Market Trends & Observations
http://slidepdf.com/reader/full/022712-update-of-stock-market-trends-observations 251/271
pdfcrowd.comopen in browser PRO version Are you a developer? Try out the HTML to PDF API New hot app: Facebook Albums To PDF
Some cyc le lows don’t produce bottoms. In a strongly upward trendingmarket, a cyc le low can be a sideways pattern followed by a breakout to
the upside. Looking at the chart below you can see how several large
cy cle are approaching a crest and beginning a move to their cy cle low.
This is not a strongly upward trending market as portray ed by this
chart. At be st it shows the last stage of a bull market, which coincides
with a large 3rd step in the wav e co unt.
Click On Charts T o Enlarge
0 1 /1 8 /1 2 - 1 9 5 0 D at a - 1 9 5 0 To 20 4 2
Acco rding to Hurst’s Principle o f Proportionality – Waves in price
moveme nt have an amplitude that is proportional to their wav elength.
This simply means that longer cy cles produce bigger mov es up or down.
Smaller cy cles produc e smaller fluctuations.
The next chart is a close up of the abov e chart and it shows a confluence

8/2/2019 02/27/12 Update of Stock Market Trends & Observations
http://slidepdf.com/reader/full/022712-update-of-stock-market-trends-observations 252/271
pdfcrowd.comopen in browser PRO version Are you a developer? Try out the HTML to PDF API New hot app: Facebook Albums To PDF
of cyc le lows occ urring from May to September 2013. This appears to beanticipating the most important cyc le bottom since March 2009.
Further out the cyc le low occurring in early 201 8 is much larger and
there are also several other cy cles lows anticipated about the same time.
This calls into play the Principle o f Synch ronicity – Waves in price
moveme nt are phased so as to cause simultaneous troughs. This means
all of these cy cles will bottom at the same time. This will likely be a time
for a very im portant m arket low . 201 8 could mark the end of a longperiod of bad markets that began with the bursting of the 2000 internet
bubble.

8/2/2019 02/27/12 Update of Stock Market Trends & Observations
http://slidepdf.com/reader/full/022712-update-of-stock-market-trends-observations 253/271

8/2/2019 02/27/12 Update of Stock Market Trends & Observations
http://slidepdf.com/reader/full/022712-update-of-stock-market-trends-observations 254/271
01/18/12 - 2007 Data - Cycles - April 201 1 To March 2 01 3
This next cy cle chart is based on data since 2007 and shows the
important cyc le lows over the last 5 y ears. Notice how it differs slightly
from the chart based on the 1950 data-set. It’s simply squeezing the
cy cles to fit into the time frame selected. I think long data-sets are
suitable for long cy cles and smaller data-sets are more acc urate for
smaller cy cles. We’ll see how that works out in the near future.
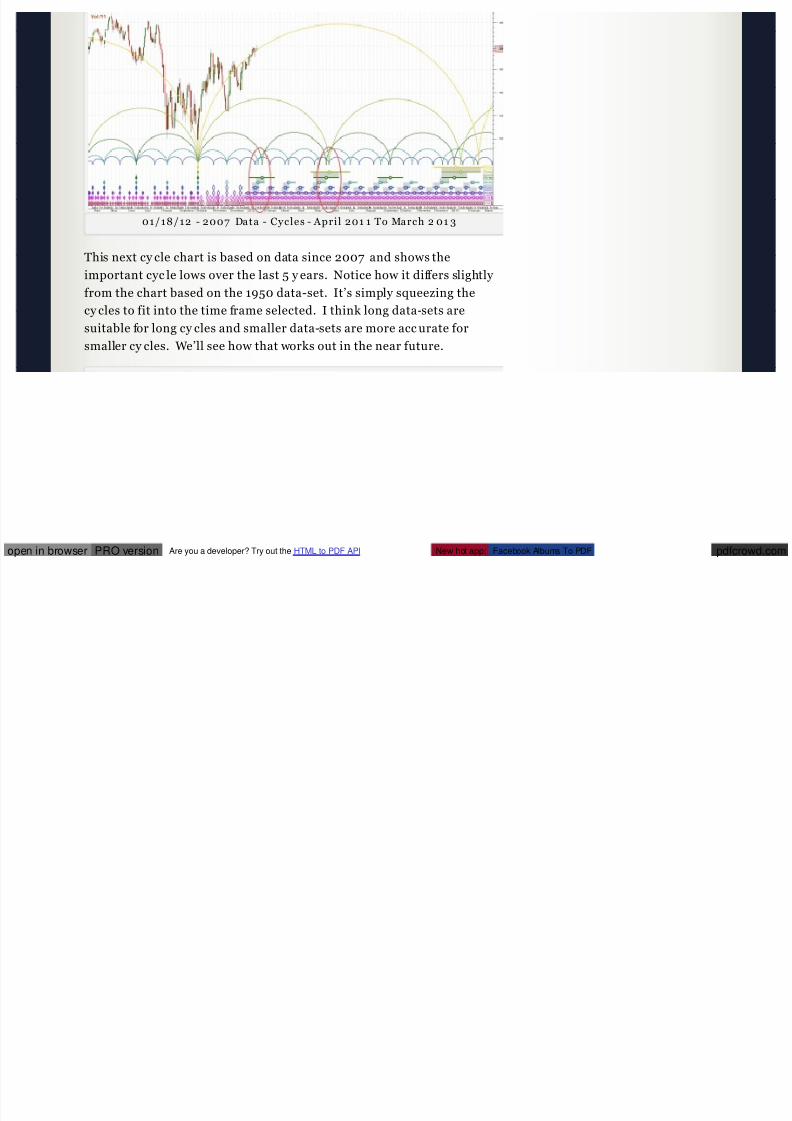
8/2/2019 02/27/12 Update of Stock Market Trends & Observations
http://slidepdf.com/reader/full/022712-update-of-stock-market-trends-observations 255/271
pdfcrowd.comopen in browser PRO version Are you a developer? Try out the HTML to PDF API New hot app: Facebook Albums To PDF
01 /1 8/1 2 - 2007 Data - 2007 To Present
I find these cyc le charts to be o f significant interest as it can give y ou an
idea of when to expect bottoms to occur. Wave counting gives you an
idea of where y ou are in the rally or decline. Altogether, these cy cle
lows coupled with wave co unts can be of great help for narrowing down
valid buy points.

8/2/2019 02/27/12 Update of Stock Market Trends & Observations
http://slidepdf.com/reader/full/022712-update-of-stock-market-trends-observations 256/271
pdfcrowd.comopen in browser PRO version Are you a developer? Try out the HTML to PDF API New hot app: Facebook Albums To PDF
If yo u find these cy cle c harts interesting, the service “Hurst Signals”prov ides cy cle charts and trading advice based on the work of J.M.
Hurst, “More info at HURST SIGNALS” It’s an exc ellent service .
PRINCI PLES OF HURST’S CY CLI C T HEORY
The Principle of Commonality – All equity (or forex o r commodity ) price
mov ements have many elements in common (in other words similar
classes of tradable instruments have price mov ements with much in
common)
The Principle of Cyclicality – Price mov ements consist of a co mbination
of specific waves and therefore exhibit cy clic characteristics.
The Principle of Summation – Price wav es which combine to produce the
price mov ement do so by a process of simple addition.
The Principle of Harmonicity – The wavelengths of neighboring waves in
the collection of cyc les contributing to price mov ement are related by a
small integer v alue.
The Principle of Synchronicity – Waves in price mov ement are phased so
as to cause simultaneous troughs wherever possible
The Principle of Proportionality – Waves in price mov ement have an
amplitude that is pro portional to their wavelength.
The Principle of Nominality – A spec ific, nominal co llection of
harmonically related waves is common to all price mov ements.
The Principle of Variation – The prev ious four principles represent
strong tendencies, from which variation is to be expec ted.
Further information about Hurst’s Cyclic Principles can be found here

8/2/2019 02/27/12 Update of Stock Market Trends & Observations
http://slidepdf.com/reader/full/022712-update-of-stock-market-trends-observations 257/271
pdfcrowd.comopen in browser PRO version Are you a developer? Try out the HTML to PDF API New hot app: Facebook Albums To PDF
Further information about Hurst s Cyclic Principles can be found here.
Lotsa good Hurst info here.
****************************************************************
CHARTS
MY CHART LINK (updated constantly)
These are my personal charts and my playground for doodling
trend lines, wave counts and other ideas.
I draw the trend lines and wave co unts on a daily basis (sometimes
more often). Y ou can find these doodles from 1 minute to
monthly charts.
Yo u will find the best trend lines and wave counts on charts with
longer time frames. This gives perspectiv e to the lines and
counts. Perspective was a favo rite of Edson Gould.
I usually restrict my trend lines and wave counts to the first three
charts on eac h page, TSX, DJI & COMPQ. The other c harts on the
page are usually for c onfirmation of the trend and wave structure.
Page 1 – Buy /Sell Signals
Page 2 – Index es With 1 Minute Bars
Page 3 – Index es With 5 Minute BarsPage 4 – Index es With 15 Minute Bars
Page 5 – Index es With 30 Minute Bars
Page 6 – Index es With 60 Minute Bars
Page 7 – Indexes With Daily Bars
Page 8 – Index es With Weekly Bars (since 1 981)
Page 9 – Indexes With Monthly Bars (since 1 981)
Page 10 – Indexes With 60 Minute Bars, Candlestick

8/2/2019 02/27/12 Update of Stock Market Trends & Observations
http://slidepdf.com/reader/full/022712-update-of-stock-market-trends-observations 258/271
pdfcrowd.comopen in browser PRO version Are you a developer? Try out the HTML to PDF API New hot app: Facebook Albums To PDF
Page 11 – Indexes With Daily Bars, CandlesticksPage 12 – Index es With Weekly Bars, Candlestick
Pages 13 through 1 4 are shorter term indicators. The indicators
are used to simply look for some type o f leading action before a
turn or confirming action of the wave co unt. Page 13 is a look-
eve ry day indicator page. The other indicator pages are less
frequently visited.
Page 15 – Hurst FLD ProjectionsPage 16 – Indicators, Long Term
Page 17 – International Indexes
Page 18 through 30 are sector ETFs. They represent most of the
active sector ETFs and are always a good hunting ground when
looking for something that is breaking in a new direction.
Page 31 through 45 are growth stocks with indicators. These are
stocks that have bee n in a lengthy uptrend. One qualification is
that they must not be sev erely damaged in a bear market so they
can’t rise to significant new highs in the following bull market.
The growth stocks show daily market action for the last 3 y ears
and weekly prices since 1992. This gives a good perspective of
how they have be haved in the immediate past (daily c harts) and
how they behaved during good and bad times (weekly charts).
Page 46 – Misc older c harts
WAVE COUNT S SIMPLIFIED
My wave counts are not Elliott Wave! It’s different, simple and
functions w ithout a maze of exclusions.
T here are 3 peaks (or valleys) to a com pleted wave cou nt.
A rev ersal of trend takes place after a completed wave count.

8/2/2019 02/27/12 Update of Stock Market Trends & Observations
http://slidepdf.com/reader/full/022712-update-of-stock-market-trends-observations 259/271
pdfcrowd.comopen in browser PRO version Are you a developer? Try out the HTML to PDF API New hot app: Facebook Albums To PDF
Often times it’s as simple as counting 3 bumps (or dips) on a chart .
. . Other times, not so easy .
In a downtrend the same rules apply ex cept y ou are co unting 3
dips instead of 3 bumps.
Each group of 3 steps must stay c onfined to a channel.
Laying a pen or pencil on the c hart will help yo u visualize the
channel.
As the trend progresses, all of the steps that make up a larger
trend will also be co nfined to a larger channel. Sometimes the
channel is not rev ealed until the surge phase has ended.
When the m arket breaks a channel (regardless of the
perceived wave cou nt), the current step has been
terminated. (Make sure your c hannel was correc tly drawn
before calling a termination).
The correction following the second step is larger than thecorrec tion that followed the first step. Obv iously the correc tion
following the third step is a reve rsal.
A single wave m ay sub-divide into another 3 waves. I will
call this an ex tension. When this happens (1) the trend is still
intact, (2) the channel will widened and (3) instead of a total of
3 steps, there will be 5 steps.
Sometimes I will use the terms “step” and “wave” interchangeably .
Reading the glossary helps in the understanding of this blog.
There are many other important facts in the glossary.
Glossary Link
ABBREVIATIONS
DJI = Dow Jones Industr ials
DJT = Dow Jones Transportat ions
8/2/2019 02/27/12 Update of Stock Market Trends & Observations
http://slidepdf.com/reader/full/022712-update-of-stock-market-trends-observations 260/271
pdfcrowd.comopen in browser PRO version Are you a developer? Try out the HTML to PDF API New hot app: Facebook Albums To PDF
p
SPX = SP 50 0
ES = SP 500 Futures
COMPQ = Nasdaq Composite Index
TSX = Toro nto Stock Exchange (Canadian blue chips)
SOX = Semico nducto rs
TXX = Technolo gy
****************************************************************
Long T erm – UP
Uptrend
Mar 2009 To Present
Step 2 Up (of 3) Com pleted
Has Step 3 Up Begun ???
From the bottom in March 200 9
Large step one up ended in May 2010
Large step two up ended in May 2011.
Significant break abov e the May 20 11 highs should signal that Step
3 up is o fficial

8/2/2019 02/27/12 Update of Stock Market Trends & Observations
http://slidepdf.com/reader/full/022712-update-of-stock-market-trends-observations 261/271
pdfcrowd.comopen in browser PRO version Are you a developer? Try out the HTML to PDF API New hot app: Facebook Albums To PDF
1 2-28 -11 LONG TERM
****************************************************************
Very Long T erm – DOWN
Downtrend
Jan 2000 T o Present
Step 2 Down (of 3) Com pleted

8/2/2019 02/27/12 Update of Stock Market Trends & Observations
http://slidepdf.com/reader/full/022712-update-of-stock-market-trends-observations 262/271
pdfcrowd.comopen in browser PRO version Are you a developer? Try out the HTML to PDF API New hot app: Facebook Albums To PDF
Currently In Rally Phase From Step 2 Down

8/2/2019 02/27/12 Update of Stock Market Trends & Observations
http://slidepdf.com/reader/full/022712-update-of-stock-market-trends-observations 263/271
pdfcrowd.comopen in browser PRO version Are you a developer? Try out the HTML to PDF API New hot app: Facebook Albums To PDF
1 2-28 -1 1 VERY LONG TERM
VERY LONG T ERM COMMENT S
We have 3 possibilities for the future.
We have entered a very wide swinging m arket
(megaphone formation) sim ilar to that of 1966 to 1974.During that era we had three bear markets with two intervening
bull market rallies. Each bear market had a lower low than the
previous b ear. The interve ning bull market rallies saw new all
time highs before the nex t bear market began.
We also have formed a huge head and shoulders formation since
1998. If this formation is valid, the downside measurement callsfor a bottom around Dow Jones Industrials 1,0 00.
We began a long term bull market in March 20 09. Each
subsequent min-bear market will result in higher lows than the
prior major low.
I favor the m egaphone formation as the m ost likely
scenario.
Since 2000 we have had two bear markets, 2000 to 200 3 and 2007 to
2009. Like 1966 to 197 4, the recov ery from the first bear market saw a
new all time high (2007 peak). It’s possible that we may ex perience
another all time high during the present recov ery period. This would
support the megaphone formation. A failure to make new highs would
support the head and shoulders argument. In both formations the
conclusion of the present recov ery would call for a third and final bear
k t A ti t d ti f th l i f th fi l b k t i

8/2/2019 02/27/12 Update of Stock Market Trends & Observations
http://slidepdf.com/reader/full/022712-update-of-stock-market-trends-observations 264/271
pdfcrowd.comopen in browser PRO version Are you a developer? Try out the HTML to PDF API New hot app: Facebook Albums To PDF
market. An estimated time for the conclusion o f the final bear market isapproximately 20 18.
The lesser downside target of both formations is the megaphone
formation as it likely calls for a bottom 1,0 00 to 2,000 points below the
2009 low, which would be around Dow 5,00 0.
In the head and shoulders formation the measurement calls for a bottom
around Dow Jones Industrials 1,0 00. This is almost an unimaginable
eve nt regarding the possible fundamentals to c reate this scenario. If this
did happen, ev ery thing that could go wrong would have to go wrong.
The reasons range from the absurd to the absurdly absurd. This scenario
is so dark that it doesn’t seem possible but nev ertheless, the head and
shoulders formation is there and will be waiting until we pierce the all-
time highs of October 2 007 .
Remember these are simply possible scenarios and are not embedded in
fact. Whatever the outc ome, it never hurts to be a little cautious with
some of your money . But in the worst case scenario, every thing that we
take for granted as being safe . . . . would not be safe. This is something
to never forget in the event things go v ery badly.
Hopefully we will never have to think about worst case sc enarios other
than to have a go od laugh at them presently.
****************************************************************
EDSON GOULD
Edson Gould, Premier Stock Market Strategist – Edson
Gould had a profound influence o n the dev elopment of my
techniques and indicators. Prior to me subscribing to his
d i i I j t f th d

8/2/2019 02/27/12 Update of Stock Market Trends & Observations
http://slidepdf.com/reader/full/022712-update-of-stock-market-trends-observations 265/271
pdfcrowd.comopen in browser PRO version Are you a developer? Try out the HTML to PDF API New hot app: Facebook Albums To PDF
advisory servic e, I was just one of the crowd. After 40 y ears I still have many of the publications from his
advisory servic e, “Findings & Forecasts”. Fearing the loss of these
hard copy reports I hav e recently scanned and created pdf files of
these reports. Now I have hard copies and computerized ver sions
of the reports.
I hav e used a technique of his that I found in an obscure reference
in one of his reports. It was only mentioned once and never
again. I believe that he used this tool extensiv ely and never toldthe world it’s importance. Prior to my finding this tool, I had been
try ing unsuccessfully to find a different way to c hart the market.
When I read about his technique I knew instantly that this was
exac tly what I had been seeking. I have charted this method back
to 1 939 and found it to be v ery useful. There is no mention of it in
the reports that I posted below as I have deleted any reference toit. It’s a super secret indicator and I’d have to kill you if I told y ou
about it.
Edson Gould was truly a legend in his own time. It’s too bad that
today most people have forgotten or nev er heard of him or his
discov eries. Below y ou will find only the first page of these
reports. A teaser is what yo u might call it. The rest of the reports
are available upon request. This is a man that deserves to be
remembered throughout technical analysis market history.
T he following are links to Edson Gould reports.
My Most Im portant Discov ery by Edson Gould
It was also my most important discov ery , for it ex plained the
irrational volatility o f markets that had my stified me in my early
years. During those early y ears I found nothing worked in
predic ting these irrational market swings But the fog lifted after

8/2/2019 02/27/12 Update of Stock Market Trends & Observations
http://slidepdf.com/reader/full/022712-update-of-stock-market-trends-observations 266/271
pdfcrowd.comopen in browser PRO version Are you a developer? Try out the HTML to PDF API New hot app: Facebook Albums To PDF
predic ting these irrational market swings. But the fog lifted afterreading this report and I began to understand how to begin
predicting the market.
Edson Gould Profile by MT A
Edson Gould Conc epts by William Scheinm an
Decade Cycle by Edson Gould
Decade Cyc le Update by Ned Davis
Swing Principle by Edson Gould
A measuring indicator
Utilities by Edson Gould
A forecasting indicator
Dividends by Edson Gould
Bonds by Edson GouldSpeed Lines by Edson Gould
Sentimeter by Edson Gould
With companies failing to pay dividends c ommensurate with their
earnings, this indicato r has failed. As the market climate
continues to deteriorate in the coming years, I would expec t
dividends to return to their former lev els and this indicator will
once again become useful. Prior to the late 1990s, it had 100
years of success.
Bottoms by Edson Gould
This was written and directed at the upco ming bottom in 197 4 but
it applies to all major bottoms.
T hree Steps by Edson Gould
Where do y ou think my three steps principle came from? Straight
from this report although I modified the concept through the
years.

8/2/2019 02/27/12 Update of Stock Market Trends & Observations
http://slidepdf.com/reader/full/022712-update-of-stock-market-trends-observations 267/271
pdfcrowd.comopen in browser PRO version Are you a developer? Try out the HTML to PDF API New hot app: Facebook Albums To PDF
Edson Gou ld’s 1974 Forecast
Gould’s 197 4 forecast kept me bearish and short throughout 197 4
until the week before Christmas 197 4, during which I began
making long term purchases. After that it was ride the bull phases
that transpired from 197 5 to 1982. 1982 to 2000 was the greatest
bull market of all time.
Edson Gou ld’s 1975 Forecast
Edson Gou ld’s 1976 Forecast
Edson Gould’s 197 7 Forecast

8/2/2019 02/27/12 Update of Stock Market Trends & Observations
http://slidepdf.com/reader/full/022712-update-of-stock-market-trends-observations 268/271
skyroc keted out of the red and had a big profit. In August 1982
the only people that were bullish were Edson Gould, Robert
Prechter and myself (probably a c ouple of others but I didn’t know
them). Ever yo ne else was extremely bearish. It was a perfect
example of crowd behavior.
Sign Of The Bull by Edson Gould
****************************************************************
TRANSACTION SIGNALS
All actionable signals are only for short term time frames. These
signals are not designed for intermediate or long term time framesBUT . . . . .
After a short term buy signal, long term tax status can be
achieved by a continuation of the upward trend, which causes
short term actions to morph into long term holdings.
See more details in the glossary under “Tax es, Futures Contracts”
and “Money Management”.

8/2/2019 02/27/12 Update of Stock Market Trends & Observations
http://slidepdf.com/reader/full/022712-update-of-stock-market-trends-observations 269/271
pdfcrowd.comopen in browser PRO version Are you a developer? Try out the HTML to PDF API New hot app: Facebook Albums To PDF
Glossary Link
T RANSACT ION RECORD
In this blog a warning of an impending botto m (or top) is often
issued well in advance o f the formal buy or sell date. This allows
thoughtful consideration prior to a formal action signal. To get a
sense of how this works, you should read a few days prior to aformal buy /sell signal. I often buy/sell in my personal account
based on the early warnings.
The transaction record near stock market bottoms will show that I
am ve ry skittish and usually remain so until the new direction is
well underway .
Qualified buy signal given from December 5th toDecem ber 20th, 2011
Buy signal in October 2011 was never issued due t o a
SERIOUS family illness
SELL – SEPTEMBER 9, 2011
BUY – AUGUST 30, 2011
SELL – AUGUST 30, 2011 – Stopped out, re-bought quic kly
BUY – AUGUST 29, 2011
SELL – AUGUST 25, 2011BUY – AUGUST 23, 2011
SELL – AUGUST 1, 2011
BUY – JUNE 23, 20 11
****************************************************************
MISCELANEOUS
There are useful items throughout this blog. For instance, the

8/2/2019 02/27/12 Update of Stock Market Trends & Observations
http://slidepdf.com/reader/full/022712-update-of-stock-market-trends-observations 270/271
pdfcrowd.comopen in browser PRO version Are you a developer? Try out the HTML to PDF API New hot app: Facebook Albums To PDF
Share this:
There are useful items throughout this blog. For instance, the
“Wall Street Quotes” can be v ery instructive. So make sure and
look all through the blog.
Comments: Be the first to comm ent
Twitter 3 Facebook LinkedIn Reddit
Digg Email Print
« Olde r Entries
Blog at WordPress.com. The me : Sapphire by Michae l Martine.

8/2/2019 02/27/12 Update of Stock Market Trends & Observations
http://slidepdf.com/reader/full/022712-update-of-stock-market-trends-observations 271/271
pdfcrowd.comopen in browser PRO version Are you a developer? Try out the HTML to PDF API New hot app: Facebook Albums To PDF