01622499
TRANSCRIPT

264 IEEE TRANSACTIONS ON VEHICULAR TECHNOLOGY, VOL. VT-27, NO. 4, NOVEMBER 1978
[4] E. V. Jull, “Finite-Range gain of sectoral and pyramidal horns,” Electron. Lerr., vol. 6, pp. 680-681, Oct. 15,1970.
1 Harold E. Taggart (”58-SM’78) received the B.S. degree in chemistry from the Uni- versity of Denver in 1950.
He joined the National Bureau of Standards as an electronic engineer in 1956 and is cur- rently a Project Leader in the Electromagnetic Fields Division. His principal fields of com- petence include antennas, field strength standards, electromagnetic interference, tele- communications, plus other electromagnetic areas. He is currently developing techniques for
measuring electromagnetic interference emanating from electronic devices and is also developing techniques for susceptibility testing of electronic devices. He managed a communications project from 1971 to 1977 which involved many types of radio equipment used in public- safety communications. Prior to that he was responsible for developing and maintaining antenna standards below one GHz and calibrating antenna and field strength standards submitted to NBS. Prior to joining the National Bureau of Standards, he was an electronic instructor for the U.S. Air Force. He is also a veteran of the U.S. Navy.
Mr. Taggart has published a number of papers related to his field of work and is active in the EMC standards community. He is presently Chairman of the IEEE EMC Standards Committee, and also Chairman of the SAE AE4 subcommittee on EM1 antenna factors. He is past Chairman of the Denver IEEE Joint Instrumentation and EMC Chapter, and past member of the IEEE EMC ADCOM.
I
John F. W e t (M’62-SM’78) was born in Hastings,NE,on June 12,1932. He received the B.A. degree in physics from Hastings College in 1958.
He joined the staff of the National Bureau of Standards, Boulder, C O , in 1958, and worked for eight years in the Low Frequency Standards GTOUP. ffe then transferred to the Microwave Power Research Group where he was responsible for the calibration of the national bolometric power standards. He
remained with this group from 1965 to 1968 at which time he trans- ferred to the Pulse and Time Domain Group where he was involved in the computer interfacing of fast rise time pulse instrumentation. In 1971 he joined the newly formed Law Enforcement Communication Program. During this period he has worked with land mobile FM equip- ment with emphasis on mobile, base, repeaters, and hand-held radio measurement procedures. His work in this program includes the prepa- ration of voluntary standards, technical reports, and guidelines for use in law enforcement communications.
Mr. Shafer is presently Chairman of the Denver/Boulder Chapter of the IEEE Vehicular Technology Society. He has served as Awards Chairman of the Denver section. He was an organizer for the Vehicular Technology Society in the Denver section. He was Papers and Program Coordinator for the 1978 Vehicular Technology Conference in Denver. He is past President of the Colorado/Wyoming Chapter of APCO (Associated Public Safety Communications Officers). In 1975, he was honored by being made a Fellow in Radio Club of America. He is a Life Member in ARRL and holds a fust-class radio telephone license.
A SpreadSpectrum Technique for Highapacity Mobile Communications
Abstract-A sprepd-spectnun technique for Quulu highclppcity mobile communications is d e s c n i and some results from an analytic study are summarized. The technique uses a very large set of frequency- hopped signals which are designed for minimal mutual interference. No synduonizntion of the mobile units is required, and eacb w r is perma- nenliy assigned his own signal, which serves as an identifying si@ and as a carrier for the biphasemodukted digital message. The spectnl effiaency of the spredapectnun system is analyzed and compared with the efficienaes of developmentd FM/ch.nnd reuse schemes currently under construction in the US. and Japan. I t is conduded that even with relatively simple speech digitization schemes, the efficiency of the spreadgpectrum scheme may exceed those of the nnrrow-band schemes by a factor of almost five. More ambitious bit-ratereducing speech digitization methods could improve still furthm on these 6gures. Additional benefits of the spreadapectnun scheme indude immunity from fading and interference, more consistent speed^ quality, simpler system contrd algorithms, and more flexible blocking pmperiies under overload conditions.
Manuscript received September 30, 1977; revised July 14, 1978. This work was supported in part by the National Science Foundation under Grants no. ENG 75-15649 and ENG 76-80536. A portion of t h i s paper was presented at the 1977 Vehicular Technology Conference, Orlando, FL.
The authors are with the School of Electrical Engineering, Purdue University, West Lafayette, IN 47907. Telephone: G. R. Cooper (317) 494-8607; R. W. Nettleton (317) 4944222.
S I. INTRODUCTION
EVERE CONGESTION of the mobile communication spec- trum. in some geographic areas dramatically illustrates the
need to seek a communication technique that offers the poten- tial for utilizing the spectrum more efficiently. The system proposed here employs wide-band time-frequency coded signals to accomplish this objective.
Although spread-spectrum communication systems have been widely studied and used for specialized applications [l J , they are not usually considered to be efficient from the stand- point of spectrum utilization in multi-user applications. This conclusion results from comparing such systems, which are almost always interference limited, with frequency-division systems that are assumed to be noise limited. Such a compar- ison is not meaningful, however, in the case of a mobile com- munication system covering a large geographic area in which the density of users is also 1arge.In such a case, the frequency-division systems are also interference limited, and the comparison tips in favor of the spread-spectrum system because of its more uniform spectrum occupancy and its greater immunity to interference.
It is well known that in a cellular mobile communications
0018-9545/78/1100-0264$00.75 0 1978 IEEE

COOPER AND NETTLETON: SPREAD-SPECTRUM TECHNIQUE 26 5
system, increasing the density of users can be achieved by decreasing the size of the cells. The cellular systems proposed thus far use relatively few very large cells (e.g., 12 km radius) so that channel reuse occurs perhaps only once or twice in a service area and even then in cells beyond the radio horizon. The user densities achievable with such large cells are not greatly above the levels used currently with central-base-station systems. There is a substantial body of evidence that acceptable FM service at high density with small cells might be achievable only with either very poor voice quality [2], or by the use of spatial-diversity FM receivers [3] .
This paper attempts to look beyond the short-term solutions of FM and to address the problem of truly high-density small- cell systems with consistently acceptable speech quality. The analysis presented here indicates that a spread-spectrum system can achieve greater user densities than FM. Furthermore, the operational complexities associated with switching channels frequently as the vehicle moves from cell to cell in an FM system are eliminated in the spread spectrum system because every user uses the entire band. These complexities are replaced, of course, by other operational problems (such as power control to combat the near-far problem) but these appear to be less severe and do not significantly increase the cost and complexity of the individual mobile units.
11. PROPOSED MOBILE COMMUNICATION SYSTEM The mobile communication system considered here is a
cellular system with a fmed base station centrally located in each cell. The base station antenna may be omnidirectional in the horizontal plane, thus illuminating the entire cell; or it may have sectoral beam patterns, illuminating three rhomboidal subcells or six triangular ones with 120” or 60’ beam patterns, respectively. All base-station radios are connected to a central processor so that calls originating in any cell may terminate in any other cell. The available frequency spectrum is divided such that half is used for mobile-to-base station transmission and the other half for base station-to-mobile unit transmission. All mobile transmitters are assumed to have automatic power control that maintains the average received signal level at the base station constant regardless of the location of the mobile unit within the cell.
Each mobile unit is also assigned a unique set of time- frequency coded waveforms that are used for both transmission and reception. These waveforms have large time-bandwidth products such that interfering signals can be well suppressed, and which provide a very large set of signals so that a large number of potential users can each be assigned a unique set of waveforms. Message modulation is accomplished by digitizing the speech and encoding the resulting binary sequences into the set of waveforms available to each user. The encoding into binary form may be conventional PCM, differential PCM, delta modulation, or any other digital encoding procedure which provides acceptable results.
The system to be described requires no waveform synchro- nization whatever. Hence, considerable versatility is permitted; each user category might choose to encode its speech (or other data) in a different way and at a different bit rate. More exotic speech communication methods might then be employed
(such as vocoder speech) as and when userdensity demands and the application permits. Further improvements in efficiency may result from transmitting no energy during speech pauses, thus reducing inter-user interference.
The presence of multipath results in a loss of phase coher- ence in the received signal. Thus time correlation or matched fdter detection of the signal is not possible. This difficulty is circumvented by employing a differentially coherent procedure in which the phases of each received waveform are compared with those of the preceding waveform. This is possible because the coherence time of the channel is greater than the duration of one waveform.
Power control in the mobile transmitters is used to compen- sate for changes in signal level (at the base station) due to path loss variations and slow fading. No attempt is made to have the power control follow the rapid fading due to multipath. The control signal is derived from a unique waveform, identifying each base station, under the assumption that reciprocity holds in the mean (i.e., once the rapid-fading variations have been averaged out). This requires that the mobile unit know which base station is monitoring its operation, and algorithms for accomplishing t h i s have been investigated. However, this is an operational detail that is not discussed further since this paper attempts only to present the overall concept of the proposed system.
111. PRINCIPAL FEATURES OF A SPREAD-SPECTRUM SYSTEM
Advantageous Features The use of signals all occupying the same frequency band at
the same time results in a number of operational characteristics that can be very advantageous in a mobile communication system. In addition to the increased user density that is possible in a small-cell system, these advantages may be summarized as follows.
1) The use of a large number of frequencies in each wave- form results in a form of frequency diversity that significantly reduces the degradation in performance that normally arises from rapid fading. This aspect is discussed further in a subse- quent section.
2) Any user can access the system at any time without waiting for a free channel. Thus there are no blocked calls in the usual sense, although of course traffic will be ultimately limited by the available plant and its associated software.
3) There is no hard limit on the number of active users that can be handled simultaneously by the system. When the number of active users exceeds the design value, the result is a degradation of performance for all users rather than denial of access. This is usually referred to as “graceful degradation.’’
4) Since each potential user of the system is assigned a unique signal set, message privacy is achieved as a fringe benefit. This, of course, refers to privacy with respect to the casual listener and does not preclude message interception by a pro- perly equipped third party.
5) Because each user retains his unique signal set perma- nently, there is no channel switching or address changes as the user moves from cell to cell. Hence, the particularly objection-

266 IEEE TRANSACTIONS ON VEHICULAR TECHNOLOGY, VOL. VT-27, NO. 4, NOVEMBER 1978
able characteristic of FM systems known as “forced termina- tion,” which occurs when a mobile crosses a boundary into a cell in which no channel is available, will not occur in this system.
6 ) Since all users occupy the same band, all user hardware is identical except for the filters associated with the unique signal set. (A recent feasibility study [4] has shown that these re- ceivers can be fabricated using existing CCD technology).
7) Priority messages (e.g., public safety vehicles) can be accommodated in the system, even in the presence of system overload, without assigning dedicated channels or denying other users access to the system. This can be done either by increasing the power level, on an emergency basis, or by in- creasing the time-bandwidth product of the. priority signal.
8) Under circumstances in which the full capacity of the system is not required, a spread-spectrum system may coexist in the same frequency band as conventional narrow-band systems without excessive mutual interference. This suggests the possibility that a spread-spectrum system could be phased into operation in a given geographical area without immediately obsoleting existing equipment operating in the same band. It is even possible that spread-spectrum and narrowband schemes could coexist permanently, using the same band twice.
Disadvantageous Features The desirable characteristics noted above cannot be achieved
without cost. Some of the disadvantages of the spread-spectrum approach are summarized below.
1) Effective power control is required in order to prevent users near the base station from overpowering more distant users. Preliminary studies indicate that a satisfactory power control system is realizable, however.
2) Message encoding and decoding is inherently more com- plex if full advantage of the available frequency diversity is to be achieved.
3) A vehicle-location technique, having modest accuracy, is required in order to adequately monitor the vehicle as it moves from cell to cell. However, some such facility is required of all the smallcell schemes that have been proposed; also, it is anticipated that location and power control circuitry will be essentially common in the receiver.
4) Fully coherent detection (Le., true matched-fiter detec- tion) is not possible in a rapid fading environment.
5) The spread-spectrum approach does not appear to be particularly attractive for largecell systems from the stand- point of cost-effectiveness. However, the operational advantages noted above would still apply in the largecell case.
IV. CHARACTERISTICS OF THE URBAN 900- MHz CHANNEL
The urban 900-MHz mobile radio channel has been studied in great detail in the literature [3, Ch. 1 and 21 . We summarize the pertinent details below.
1) Highly frequency-selective fading, with Rayleigh statis- tics, occurs over distances of about one-half wavelength. Thus, a vehicle moving through the field will encounter perhaps hundreds of such fades in one second. The coherence bandwidth of the channel is defined as the closest spacing between two
frequencies with correlation of 0.5 or less and is inversely pro- portional to the ms time spread of the channel impulse response [SI. Typical coherence bandwidth range from 100 kHz to 1 MHz. Thus, a narrowband transmission, such as FM, is subjected to “flat fading” i.e., there is no spectral distortion of the signal. A spread-spectrum transmission, however, en- counters different fades in different portions of its spectrum. It is possible to utilize this fact in the form of explicitfiequency diversity to combat the effects of Rayleigh fading [ S I .
2)hppZer spectra due to vehicle motion cause random frequency-modulation noise in FM receivers. At normal vehic- ular speeds, the Doppler spectrum has a bandwidth of less than 300 Hz. The coherence time of the channel is defined as a time/frequency dual to the definition of coherence bandwidth, and is inversely proportional to Doppler bandwidth (and hence vehicle speed) [5] . The minimum coherence time at vehicular speeds at 900 MHz is around 3 ms.
3 ) S W o w fading due to buildings and terrain features imposes a non-frequency-selective, slowly changing median upon the Rayleigh field statistics. This fading has a lognormal characteristic with standard deviations on the order of 6-8 dB.
4) Attenuation with distance ranges from an inverse cubic law to an inverse fourth-power law [3] . To a limited extent, the law can be “engineered” by suitable choice of antenna design, location, and height. However, terrain is still the gov- erning feature. Rapid attenuation with distance is essential to frequency reuse schemes, because the greatest efficiency is achieved if channels can be reused at the minimum distance. However, in a spread-spectrum system, about half the inter- user interference comes from within the cell, and power control compensates for all path losses, whatever the attenuation law. Hence, the spread-spectrum system performance is far less susceptible to changes in attenuation law (or to changes in shadow-fading standard deviation).
V. PRINCIPLE OF OPERATION
In t h i s section, we consider an “idealized” system of the general type proposed, but stripped of such details as the modulation technique and timedependent variations of parameters. Once the general concept is explained, we describe the system in greater detail in a later section.
Suppose that messages are composed of sequences of sym- bols taken from a set of n symbols. For example, the n symbols may be all possible combinations of binary digits in a block containing logzn digits. It is convenient to represent each of these symbols as a vector that is nonzero in only one element. For example, the ith symbol may be represented as xi = [0 ‘.- 0 1 0 ... 01 , where the 1 occurs in the ith element of the vector. The entire set of n symbols form an n-ary set
The objective of any spread-spectrum system is to provide a modulation method such that any given message symbol pro- duces a unique transmitted signal that occupies the entire avail- able bandwidth in some sense. One method of accomplishing t h i s is to assign a unique set of n frequencies to each member of the n-ary message set. In a mathematical sense, this may be accomplished by forming a signal vector yi = bil --,yin] that
{XI, = {XI x2 9 * * e , xn 1.

COOPER AND NETTLETON: SPREAD-SPECTRUM TECHNIQUE 267
is uniquely related to the message vector xi by
yi =Xi05
where 0 is an n X n orthogonal matrix in which all elements have the same magnitude in order that all transmitted signals have the same energy. An example of such a matrix might be the normalized Hadamard matrix defined by the recursion relation
01 = [ I 1
e,=’ [‘ ‘1 4 1 -1
G~ fi [ o k - 1 ek-1 s k - 1
However, if F’ is a random (fading) matrix, the received 9i will not be exactly the transmitted x i . But now, each element of ii is a linear combination of all the elements of ii, so that each element of -3, contains energy from all the elements of$i and is nonzero. This is the embodiment of a diversity scheme, since the elements of ii have more favorable statistical proper- ties than those of ii. The concept is depicted in Fig. 1, in which Rayleigh fading is assumed, noise is ignored (u = 0), and x2 was assumed to be transmitted. The statistics of all thejzi are exponential; the statistic i z 2 is chi-square of order 2n with mean one and standard deviation n-l l2 ; i.e., if x = iz2,
The statistics of all the other i z j 7 j # 2 are given by convolving two chi-square densities of order n but with arguments of opposite sign; the result is of the form [ 2 2 ]
(This matrix is used here for purposes of illustration only and 6 does not represent the form actually used in the proposed system.) It is clear that for each xi the vector y i is simply the ith row of 0, so that each element of y i has the
P(Z> = K, (nz), z 2 0
same magnitude. Now, suppose that the elements of y i are each transmitted
through a separate “subchannel” and received by a receiver. This, in effect, is what happens in the proposed system if the frequencies assigned to every transmitted signal are separated, on the average, by more than the coherence bandwidth of the channel. If the subchannels are independent, then the noise added to each element, and the fading to which each element diversity were employed. is subjected, will also be independent from channel to channel;
and p(-z) = p(z), where z = i2j, q = n - 1 / 2 , and K,(*) is the modified Bessel function of the second kind and order q. These are “bell-shaped” functions of mean zero and standard deviation n-l 1 2 . (They are not unlike the Gaussian density, but have heavier “tails.”)
The resultant diversity permits far more reliable decisions to be made on which message was transmitted than if no
i.e., the received vector will have the form
yi = y F + U,
where F’ is a diagonal fading mafrix, each element of which is a statistically independent multiplier, and u is a vector of statis- tically independent noise elements. If the fading is of the Rayleigh type, the message energy in each received element will be exponentially distributed. That is
= 0, y <o. In the receiver, the vector ji is once more subjected to
multiplication by the orthogonal vector 0; .$i =jjiOT,
VI. SIGNAL SET DESIGN
Since transmissions from the mobile units to the base stations are to be nonsynchronous, it is desirable to use signal sets that have uniformly small cross-correlation functions for any relative time shift. Although there are many ways in which such sets could be designed, the one-coincidence property of a class of time-frequency coded signals seems ideal for t h i s purpose [ 6 ] , [ 7 ] . Such signals have been demonstrated to have an average cross correlation that is very near to the theo- retical uniform lower bound [8] . This is important because in a matched-filter-type receiver, the demodulator output wave- forms are directly related to the correlation functions of the signal set.
The signal design procedure is in two stages. First, a basic signal set containing comparatively few signals is constructed. Second, this set is subdivided in the time-delay domain to gen- -
where 6‘ is the transpose of 6. the identity matrix) we would have
erate the large number of signals required for this application. For purposes of discussion, let each signal from the basic
discrete time intervals of duration tl , called “chips.” The In a noiseless nonfading (i‘e.7 if = and ‘3 si@ set be a sinusoidal constantenvelope signal divided into
i i = XiQ’Q = x i , assumed rectangular envelope shape of each time chip is for convenience in visualization and is not crucial to the perform-
since the orthogonal matrix squared is the identity matrix. ance of the signal set. Each signal is assigned a different constant Hence, we would be able to recover the original message frequency for each time chip, and over a waveform interval of unambiguously. duration = mtl , no frequency assignment is repeated.

268 IEEE TRANSACTIONS ON VEHICULAR TECHNOLOGY, VOL. VT-27, NO. 4, NOVEMBER 1978
I
- I ; - [ i+ RECEIVED VECTOR ORTHOGONAL M T R l X ’
- 1
r -
0
1
0
0
RESULTANT Y E C T C R
$ E & ) E Q
Fig. 1. Method of obtaining frequency diversity by rotation of sjgnal-space coordinates.
The frequency assignments are of the form
f i k =fo +aik f l , i = 1,2 , -,m, k = 1,2 , - e , m ,
where f i k is the frequency assigned to the ith time chip of the kth waveform of the set, uik is the ith integer from the kth code of the code set to be described, f l is the minimum fre- quency shift, and fo is the nominal carrier frequency. Hence, there are m distinct signal waveforms, each with m time chips, and each with a bandwidth of approximately mfl . (The ulk are permuted from the set of integers ( 1 , 2, 3, e-, m}). Fig. 2 shows a representative signal in the time-frequency plane.
The code sequences S k = {al&, a 2 k , ask, -, a,&}, k = 1 , 2, e - , m, are all permutations of the integer set { 1 , 2 , 3 , e-, m}. Since there are m! such permutations, it is not immediately obvious how one goes about selecting the m “best” permuta- tions from the m! possibilities, or indeed why there should only be m such codes. The somewhat complex theory needed to understand the construction of the codes is beyond the scope of this paper. Interested readers are referred to Cooper and Yates [8]. By contrast, however, the method of actually generating such codes is simple and algorithmic, as shown below.
1 ) Select a prime number p . (The selection criteria will become obvious in a later section). Then m = p - 1 .
2) From the smallest primitive root b of p , generate the permutation vector ll;
= ( 1 9 (b), (b2X .**, (bm-l)),
where the operation (bi) denotes the modulop-reduced, jth power of b; i.e., ( x ) = x - [ x / p ] p where b] denotes the largest integer +.
3) Select an arbitrary starting permutation S1. 4) Operate on S1 with ll (m - 1) times to form the m code
‘0’2’,
b + f l 0 t, a,---- Fig . 2. Typical Signal from basic signal set in time-frequency plane.
sequences. The operation Sj = flps’-l means
a , l l l = a l ’ .
The mth permutation operation regenerates the original starting vector S1 and the sequence of codes is periodic thereafter. Hence, there are m distinct sequences.
We illustrate the procedure with a simple example. Let p = 7. Then b = 3, and 117 = { 1,3 ,2 ,6 ,4 ,5} . Select, say, the starting vector
S3 ={4,1 ,5 ,2 ,6 ,3)
S4 = {6,5 ,4 ,3 ,2 ,1)
Ss = {2,4 ,6 ,1 ,3 ,5)
S6 = {3 ,6 ,2 ,5 ,1 ,4 )
and finally back to
S1 = { 1,2 ,3 ,4 ,5 ,6) *-, and so on.
The basic set of m signals created by the above procedure possesses the one-coincidence property when considered aperiodically. That is, when one waveform is shifted in time by any integral multiple of tl with respect to any other wave- form in the set, there will be, at most, one time chip in which both waveforms have the Same frequency. This property tends to minimize the linear cross-Correlation function between any pair of signals. Thus, if the productfltl is an integer,allsignals in the set are mutually orthogonal when their starting times are the same. When signals are repeated periodically, as in the present system, there may be, at most, two coincidences in any interval mtl , and the cyck cross-correlation function also tends to be minimized.
Since the bandwidth of the basic signal set is approximately mfl (m >> l), and the duration is m t l , the time-bandwidth of the signals is m2fl tl for only m signals. This is not a sufficiently large number of signals for the proposed system. The number can be increased by dividing the basic signal set into subsets each having only n time chips. Thus, there will be [m/n] sub- sets, where [m/n] implies the largest integer less than or equal to m/n , and each of these subsets will also possess the one- coincidence property on an aperiodic basis. The time-bandwidth- product of the entire set of nm[m/n] = m2 signals is now
When n is a power of 2, each shortened signal from the subdivided set can be biphase coded to create n mutually orthogonal signals. Hence, the unique waveform assigned to each user acts as a frequencyhopped “carrier” which is differ- entially biphase-modulated to convey the message. The “dif- ferential” aspect is discussed subsequently.
It is worth noting at this point that the spectrum of a signal from the divided set is no longer continuous over the available band, but contains discrete segments distributed quasi-randomly through the band. The spacing between spectral segments has an average value of roughly B/n, where B is the available (one- way) bandwidth.
In order to utilize the signal sets efficiently and to improve the energy efficiency of the system, it is desirable to utilize K-ary signaling, with K < n. That is, each user is assigned K biphase-modulated versions of its waveform, where K is a power of 2 and encodes blocks of length log2 K message bits into this signal set. The number of such signal sets and, hence, the number of potential users of the system is now
d l t l .
M = (nm[ m/n] )/K. (1)
Most efficient use of the available signal sets is achieved by
letting n = K , but this is not an essential requirement. An example of signal set construction is given below.
Example: For convenience, we let n = K = 32. Then, each waveform represents logz 32 = 5 message bits. Let the bit rate R b = 20 000 bits/s (e.g., adaptive delta modulation.) Then, the waveforms are generated at the rate R, = 20,OOOiS = 4000 waveforms/s, and there are 32 X 4,000 = 128,000 time chips per second. The reciprocal of the last number gives the param- eter I , = 7.8 ps approximately.
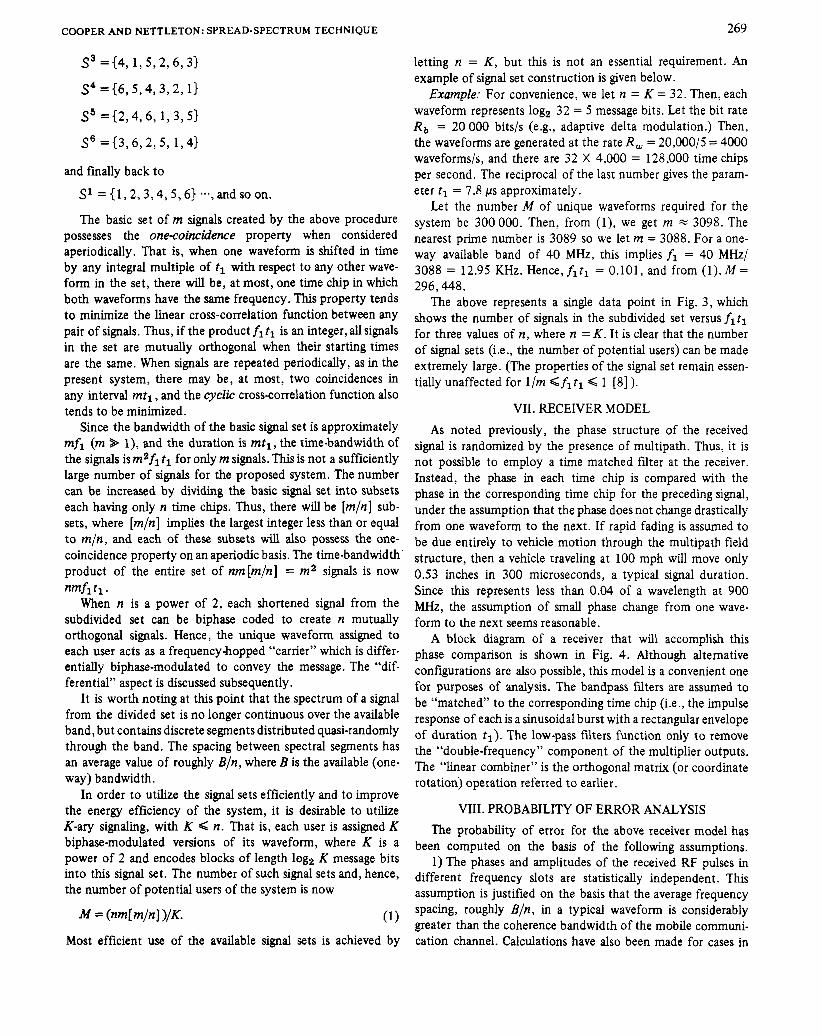
Let the number M of unique waveforms required for the system be 300 000. Then, from (l) , we get m = 3098. The nearest prime number is 3089 so we let m = 3088. For a one- way available band of 40 MHz, this implies f1 = 40 MHz/ 3088 = 12.95 KHz. Hence,fltl = 0.101, and from ( l ) , M = 296,448.
The above represents a single data point in Fig. 3, which shows the number of signals in the subdivided set versus fit1 for three values of n, where n = K . It is clear that the number of signal sets (i.e., the number of potential users) can be made extremely large. (The properties of the signal set remain essen- tially unaffected for l/m <fitl < 1 [8] ).
VII. RECEIVER MODEL As noted previously, the phase structure of the received
signal is randomized by the presence of multipath. Thus, it is not possible to employ a time matched filter at the receiver. Instead, the phase in each time chip is compared with the phase in the Corresponding time chip for the preceding signal, under the assumption that the phase does not change drastically from one waveform to the next. If rapid fading is assumed to be due entirely to vehcle motion through the multipath field structure, then a vehicle traveling at 100 mph will move only 0.53 inches in 300 microseconds, a typical signal duration. Since this represents less than 0.04 of a wavelength at 900 MHz, the assumption of s m d phase change from one wave- form to the next seems reasonable.
A block diagram of a receiver that will accomplish this phase comparison is shown in Fig. 4. Although alternative configurations are also possible, t h s model is a convenient one for purposes of analysis. The bandpass filters are assumed to be “matched” to the corresponding time chip (i.e., the impulse response of each is a sinusoidal burst with a rectangular envelope of duration tl). The low-pass filters function only to remove the “double-frequency’’ component of the multiplier outputs. The “linear combiner” is the orthogonal matrix (or coordinate rotation) operation referred to earlier.
VIII. PROBABILITY OF ERROR ANALYSIS The probability of error for the above receiver model has
been computed on the basis of the following assumptions. 1) The phases and amplitudes of the received RF pulses in
different frequency slots are statistically independent. This assumption is justified on the basis that the average frequency spacing, roughly B/n, in a typical waveform is considerably greater than the coherence bandwidth of the mobile communi- cation channel. Calculations have also been made for cases in

270 IEEE TRANSACTIONS ON VEHICULAR TECHNOLOGY, VOL. VT-27, NO. 4, NOVEMBER 1918
IO’, I
0’ - M
IO6 -
lo5-
IO‘ -
IO’-. I
.01 1 fl4
Fig . 3. Number of available signals in divided signal set.
I
FROM I.F. TAPPED DELAY LINE AWUFIER I I 1
- - BANDPASS FILTERS - - $7 - - - - DELAYS - - - - $? - -PRODUCT DETECTORS - -
LPF LPF - - LOWPASS FILTERS - - LPF
L
LlNEbR COMBINER AN0 BINARY SIGNAL
MAXMUM-LIKELIHOOD DECISION CIRCUIT OUT ~. -
Fig . 4. Receiver analytical model.
which there is correlation and in which there is a nonfading specular component to the signal [9]. There is a minimal amount of additional degradation when reasonable amounts of correlation are considered, while the presence of a specular component (the most likely departure from the independent assumption) results in improved performance. Only the independent-phase case is considered here.
2) The number of interfering signals is assumed to be suffi- ciently large that the interference can be modeled as white noise with a spectral density equal to the total interference power divided by the signal bandwidth. This assumption is based on a central-limit-theorem type argument which takes into account the statistics of timechip coincidences in both the time and frequency domains; the fact that interfering channels will be fading independently of the wanted channels; and the orthogonal-matrix receiver operation, which takes all “coincidences” from each received frequency slot and averages them over all the elements of the received message vector.
3) The sampling instants are determined by a threshold circuit and are assumed to be correct. This is a reasonable assumption whenever the probability of error is small, say less than 1W2. (Threshold errors are usually between one and two
orders of magnitude less frequent than messagedecision errors at these levels.)
Given that message x1 was transmitted, and a fxed fading matrix F, the conditional probability of correctly deciding which message was transmitted is given by [lo] as
where p(u) is the marginal probability density function of the noise after the linearcombiner operation, SNR is the receiver input signal-to-noise ratio measured over the receiver equivalent noise bandwidth (m/tl), j 1 = xlF, hi is the ith row of the Hadamard matrix, and
*(a) &/- p(u) du. -OD
The marginal probability of error is then obtained by inte- grating the above overall possible values of 3; i.e., if 3 =

COOPER AND NETTLETON: SPREAD-SPECTRUM TECHNIQUE
'"1
27 1
COHERENT: V I T E R B I ' S W P E R
DIFFERENTIALLY CWERENT. FA01 YG
COHERENT: V I T E R B I ' S W P E R \ BOUHD ([IO], p.247) \
COHERENT. ION-FADING OIFFEREWTIALLV
' \ \ \ \ 10-4
4 6 8 IO 12
rb/Ho, dB
Fig . 5 . Bit error rate for no slot-to-slot correlation, Rayleigh fading Channel.
Clearly, this n-fold multiple integral cannot be evaluated analytically. It has been evaluated by computer for various values of n using a MonteCarlo algorithm, and typical results are displayed in Fig. 5 . The abscissa quantity F,, is the average received signal energy for each message bit and the, quantity No is the one-sided spectral density of receiver noise-plus- interference.
It is of interest to compare these results with the perform- ance of the same receiver model operating in a nonfading environment and with the performance of a coherent receiver operating in a nonfading environment, the latter situation representing an upper bound on the ultimate performance that could be achieved with the specified signal set [lo]. These comparisons are displayed in Fig. 6 for the case of n = 32.
Several conclusions are apparent from these results.
I
10-4 b I I I 1
0 2 1 6 8 10 12
rb/U,. dB
Fig. 6 . Bit error rates for fading and nonfading channels compared.
frequency diversity to achieve acceptably s m a l l probabilities of error.
2) The degradation in performance of the assumed receiver model due to rapid fading is less than 3 dB under most cir- cumstances. This should be compared with the 10-20 dB degradation that is encountered in conventional FM systems
3) The degradation in performance of the assumed receiver model compared to true coherent detection in the nonfading case is less than one dB. A similar comparison for the rapid fading case is not meaningful because coherent detection cannot be used in this case.
[31.
E. SPREAD-SPECTRUM INTERFERENCE ANALYSIS
In the spread-spectrum system, energy from all users occupies the same spectral space at the same time. Hence, interfering sources cover the entire area and there are no "guard-bands" of cells. The assumptions used in this section are listed below.
1) Interference spectral density is uniform (white) and proportional to U/BA. This assumption derives from the
1) Values o f n 2 32 are necessary in order to obtain enough central-limit-theorem argument referred to earlier.
272 IEEE TRANSACTIONS ON VEHICULAR TECHNOLOGY, VOL. VT-27, NO. 4, NOVEMBER 1978
2) The number of users per cell is large. This permits the use of integrals to approximate a discrete summation.
3 ) Power control is employed which limits the power received by each base station from mobiles in its cell to P watts. Each base station receives the same power.
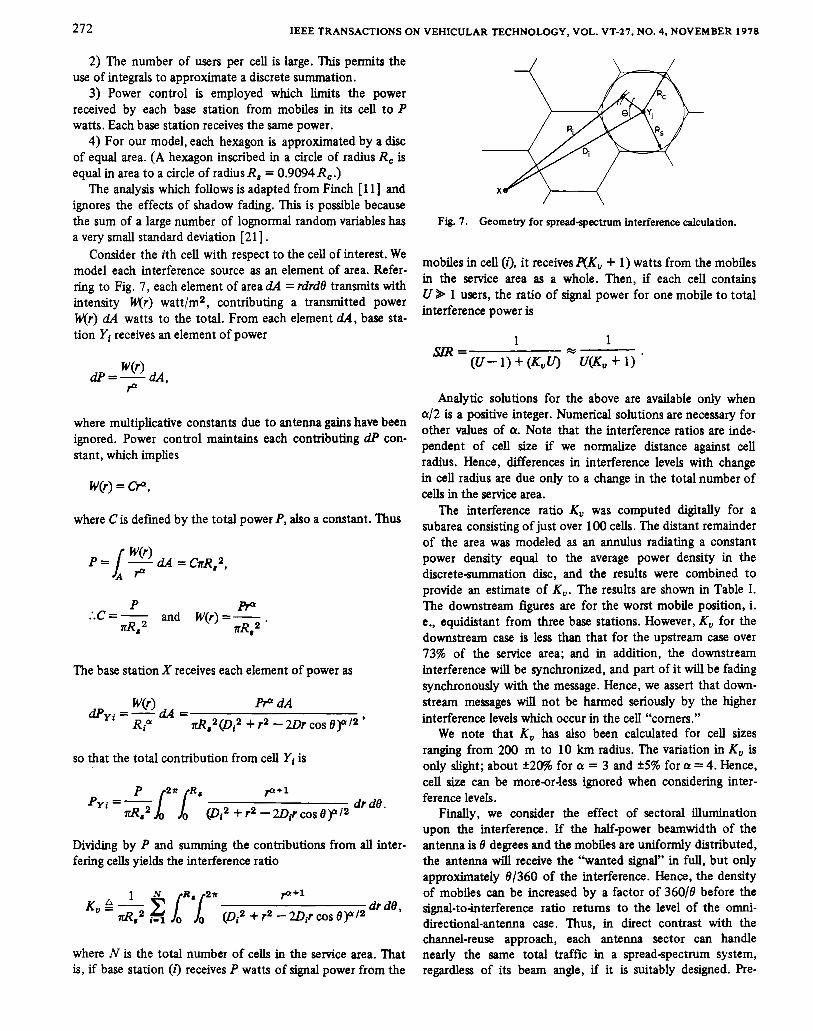
4) For our model, each hexagon is approximated by a disc of equal area. (A hexagon inscribed in a circle of radius R, is equal in area to a circle of radius R, = 0.9094 R,.)
The analysis which follows is adapted from Finch [ 111 and ignores the effects of shadow fading. This is possible because the sum of a large number of lognormal random variables has a very small standard deviation [21].
Consider the ith cell with respect to the cell of interest. We model each interference source as an element of area. Refer- ring to Fig. 7, each element of area d4 = rdrde transmits with intensity W(r) wattlm2, contributing a transmitted power W(r) dA watts to the total. From each element d4, base sta- tion Yi receives an element of power
P ‘
where multiplicative constants due to antenna gains have been ignored. Power control maintains each contributing dP con- stant, which implies
W(r) = C F ,
where Cis defrned by the total power P, also a constant. Thus
P RQ :.c = - and W(r) =- rR,2 TR,~ ’
The base station X receives each element of power as
so that the total contribution from cell Yi is
Dividing by P and summing the contributions from all inter- fering cells yields the interference ratio
where N is the total number of cells in the service area. That is, if base station ( i ) receives P watts of signal power from the
Fig. 7. Geometry for spreadspectrum interference calculation.
mobiles in cell (21, it receives f l K , + 1) watts from the mobiles in the service area as a whole. Then, if each cell contains U B= 1 users, the ratio of signal power for one mobile to total interference power is
Analytic solutions for the above are available only when a/2 is a positive integer. Numerical solutions are necessary for other values of a. Note that the interference ratios are inde- pendent of cell size if we normalize distance against cell radius. Hence, differences in interference levels with change in cell radius are due only to a change in the total number of cells in the service area.
The interference ratio K , was computed digitally for a subarea consisting of just over 100 cells. The distant remainder of the area was modeled as an annulus radiating a constant power density equal to the average power density in the discrete-summation disc, and the results were combined to provide an estimate of K,. The results are shown in Table I. The downstream figures are for the worst mobile position, i. e., equidistant from three base stations. However, K , for the downstream case is less than that for the upstream case over 73% of the service area; and in addition, the downstream interference will be synchronized, and part of it will be fading synchronously with the message. Hence, we assert that down- stream messages will not be hanned seriously by the higher interference levels which occur in the cell “comers.”
We note that K , has also been calculated for cell sizes ranging from 200 m to 10 km radius. The variation in K , is only slight; about 220% for a = 3 and *5% for a = 4. Hence, cell size can be more-or-less ignored when considering inter- ference levels.
Finally, we consider the effect of sectoral illumination upon the interference. If the half-power beamwidth of the antenna is e degrees and the mobiles are uniformly distributed, the antenna will receive the “wanted signal” in full, but only approximately 8/360 of the interference. Hence, the density of mobiles cau be increased by a factor of 360/e before the signal-to-interference ratio returns to the level of the omni- directional-antenna case. Thus, in direct contrast with the channel-reuse approach, each antenna sector can handle nearly the same total traffic in a spread-spectrum system, regardless of its beam angle, if it is suitably designed. Pre-

COOPER AND NETTLETON: SPREAD-SPECTRUM TECHNIQUE 273
TABLE I TABLE II RATIO OF OUTSIDE INTERFERENCE TO INSIDE CHANNEL REUSE SYSTEM PARAMETERS FOR COMMERCIAL
INTERFERENCE K, DEVELOPMENT SYSTEMS
a UPSTREAP (WORST - CASE) WWSTREAH
3 4
.~ 1 .2 3.3 Frequency Spacing 30 kHz
FH No. o f Channels 800 x 2 800 x 2 PH
500 x 2 Sectoral Illumination 3600 & 120° 360°. 120° G 60’ 360“
*For the central 1 km radius cell o f a 50 km radius ser- Corresponding no. o f tells 12 6 7 12, 7 6 4 1 2 t o 16 vtce area. Parameter a is the path-loss exponent; i.e., Blocking Probability 0.02 0.02 0.03 n = 3 m a n s an inverse-cubic path loss with distance.
0.74 2.0 tbdulation 30 kHz 25 kHz
FH
-
sumably, this means that at least the 120” and 60” designs example, that objective (i.e., quantitative) measures of speech would yield substantial density increases. quality, such as mean-square error, are very poor predictors of
user satisfaction [ 171. In the mobile-radio environment, X. MEASURES OF SYSTEM EFFICIENCY speech quality is subject both to very rapid and to longer term
Before embarking upon an analysis of system efficiency, we briefly discuss here the measures to be used. These meas- ures have been discussed in the literature [ 121 .
The fundamental unit of system efficiency is the number of calls per megahertz for each hexagonal cell, i.e., U/B per cell. This measure has the units of Erlangs per M H z , and is deter- mined with the parameter of blocking probability held at a fmed level (typically 2 or 3 percent). This is most important, since in a frequency-division scheme wch as FM, the blocking probability approaches unity as the traffic per MHz approaches the number of channels per MHz for a given cell. Typically, traffic per MHz will be between 60% and 80% of the upper limit when blocking probability is around 2% [3, Ch. 71. The exact figure depends on the system design, in particular, on the algorithm for assigning channels to cells [ 131 .
Another useful measure is U/BA, the unit of which is Erlangs/(MHz h2), or traffic per MHz per square kilometer. Here we take into account the fact that U/B vanes only slightly with cell size, so that smaller cells will have higher traffic densities as measured by this unit.
U/BA is difficult to apply in service areas where traffic is a nonuniform function of location, hence, in the sequel we will use U/B for a cell centrally located in the busiest zone of the service area. Blocking probability will be 2%.
XI. FMlCHANNEL REUSE SCHEMES At the time of writing, 900-MHz cellular mobile communi-
cations systems are under development by Bell Laboratories (Chicago and Newark) [14], Motorola (Baltimore and Wash- ington, DC) [ IS], and Nippon Telegraph and Telephone (Tokyo) [16]. The US. systems use 30-ldIz channel spacing and frequency modulation and are mutually compatible. The Japanese system uses 25-kHz channel spacing and phase modulation. All are based on hexagonal cells, but there are differences in sectoral illumination patterns. Voice com- panding is used to combat the effects of rapid fading on speech quality. Table I1 summarizes the principle character- istics of the systems.
Very little has been said in the literature about speech quality in these systems, other than imprecise generalizations like “acceptable” or “of toll quality.” The problem here is not one of concealment, but of the huge number of variables involved. It is well known from digitized-speech research, for
variations, so that objective measurements are both difficult to make and probably meaningless in t e r n of user satisfaction. The corporations developing these schemes have each used different techniques for measuring subjective user satisfaction, and have applied various criteria for speech quality to their systems. The Bell method [14], for example, is to use a scale with five increments, where “1” means “speech not under- standable” and “5” means “speech perfectly understandable.” The criterion used is that 90% of the listeners rate 90% of the calls at “3” or better, where “3” means “speech understand- able with a slight effort, occasional repetitions needed.” NTT simply rate their calls at “80% articulation,” where articula- tion means intelligibility using a standard articulation test
Thus it is exceedingly difficult to compare the highly variable speech quality obtained with these frequency reuse schemes with the relatively consistent quality of digitized speech obtained from the spread-spectrum scheme. It seems reasonable to suppose that a lower average quality of speech would be acceptable if that quality did not vary sigdicantly, but this is only conjecture, and we will not rely on it here.
[161*
X I . FM AND SPREAD SPECTRUM COMPARED Having outlined the difficulty of the task, we now draw
some comparisons, cautioning the reader that the results presented are based on the best available “guesstimates” of the relative subjective acceptabilities of the two systems. To the authors’ knowledge, no experiments have been conducted in this context.
U/B for FM In a channel reuse scheme in which the basic repetitive
group of cells contains v hexagonal cells, in which channels are spaced Af apart, and for which the required blocking probability yields a trunking efficiency of q, U/B per cell is given by
-=- ‘ ErlangwHz. B A f - v
The required blocking probabilities for the developing systems are 0.02 (USA) and 0.03 (Japan), yielding trunking efficiencies in the range 0.6 to 0.8. We have used the latter figure to calculate the values of U/B given in Table 111.

274 IEEE TRANSACTIONS ON VEHICULAR TECHNOLOGY, VOL. VT-27, NO. 4, NOVEMBER 1978
TABLE III U/B COMPARED FOR FM AND SPREAD SPECTRUM
.- . - . -- . - e 360° SO0 I eo0 I200 60’ #if 25 kHz 30 kHz No. o f Cells U/B. FH 2.7 2.2 -- 3.8 6.7
U/B. SS 5.3 5.3 10.6 15.8 31.7 Improvement 2.0 2.4 -- 4.2 4.7
-_ 12 12 7 4
30 kHz 30 kHz -_
Ratio
An Equivalent Sprecrdspectnun System In order to specify an “equivalent” scheme for spread
spectrum, we consider the baseband output signal-to-noise ratio of the FM schemes to have a median value of approxi- mately 20 dB, which is an “average” value from various claims made in the literature, and takes into account the effects of shadow fading and syllabic voice companding. The output SNR is lognormal due to shadow fading with standard deviation around 6 to 8 dB (corresponding quite closely to the input CNR variations).
A digitized voice system of equivalent subjective accept- ability would have a bit rate, we surmise, on the order of 25 kbits/s to 35 kbitsls, depending on the choice of encoding method [18]. (For example, a simple 5-bit PCM system would have a bit mte of 30 kbits/s.)
A MonteCarlo simulation of PCM encoded speech, per- formed by the authors, yielded an average baseband S N R of around 24 dB when Eb/No was 8 dB. The standard deviation of the baseband SNR was less than 4.5 dB at this value. We will use these specifications in our comparison.
U/B for Spread Spectrum Assuming that interference power greatly exceeds thermal
noise. power, that interference is white and Gaussian, and that each of the n bandpass receiver fdters has an equivalent noise bandwidth of l/tl, the input SIR to the receiver is given by [91 as
S Bt1 1 I n (1 +K,)U -= - , U B I ,
where s is the average power of the wanted signal, I is the total interference power, B is the total available bandwidth, and Uis the number of simultaneous users per cell. Then
U 1 - = B ( n / t M / N l +Kd *
But
log2 n t , =- nR
and
E b log2 n I No n2 ’ - =- . -
where R is the message bit rate, as can be easily shown. Hence,
and
Now if 6” sectoral illumination is used at the base station antennas, and if no energy is transmitted during speech pauses (which occur at least half the time in a two-way conversation), we have
where K, is the ratio of speech time to total time in an average conversation.
Substituting the values R = 30 kbits/s, Eb/N0 = 8 dB = 6.3, K, = 1 (typically), ahd K, = 0.5, we get
U 360 -=- ~e
5.28 Erlang/MHz.
The resultant values for U/B per cell are given in Table 111. It can be seen that for this set of parameters, spread-spectrum has uniformly higher capacities than FM, with improvement ratios varying from 2 to nearly 5 ,
Reduction of Bit Rate It is worth observing here that if the message bit rate can
be reduced, there will always be an inversely proportional increase in system traffic efficiency. Indeed, intelligible speech transmission has been reported with bit rates as low as 4.8 kbits/s [19] and even lower; with systems such as these, improvement ratios over FM could reach as high as 30 or beyond. Of course, the resultant system would emphatically be no longer of “telephone quality;” but in truth, neither are the developing FM systems. (One might also ponder what the subjective quality of 2.5 kHz-spaced SSEAM systems might be! [20] .) If, as is evident, the public is to be educated to expect lower quality speech (or at least “less natural” or “more processed” speech), then bit-rate reduction of digitized speech seems to be a productive avenue to follow.
XIII. CONCLUSIONS A plan for a spread-spectrum land-mobile communications
system has been outlined in principle, and some results from an analytical study of one possible implementation of the technique have been summarized. ’Ihe technique uses an orthogonal digital signal set differentially biphase-modulated onto one of a set of frequencyhopped carriers. The receiver acts as a form of matched fiter and no synchronization is

required. Each user is assigned own unique frequency- [ 121 D. N. Hatfield, “Measures of spectral efficiency in land mobile hopping sequence, which is designed for minimal mutual radio,” LEEE Tram. Electrol~gn. Compnt., vol. EMC-19:3,
pp. 2 6 6 2 6 8 Aug. 1977. interference with the other sequences in the set. The channel [131 L. “A h u l a t i o n study of Some dynamic assignment is suitable for reliable high-speed transmission of digital algorithms in a high cnpacity mobile telecommunications system,” information, including digitized speech. IEEE Tr4m Veh. Technol., vol. VT-22, p. 210, Nov. 1973. See
It has been concluded that several benefits can be had also Anderson’s Ph.D. dissertation, ‘Telephone traffic in a high capacity mobile telephone system,” Ohio State Univ., Columbus,
from such a system when compared to the more conventional 1972.
include higher and more consistent message quality, immunity Technical Repon, submitted to the FCC in Dec. 1971. See also p. 21 of Telephony, [ 151.
to byleigh fading, lower sensitivity to environmental param- [151 M. Stem and V. Graziano “A new portable and mobile radio- eters, greater benefits from sectoral illumination, more flexible telephone system goes to Washington (and Baltimore),” Tele-
phony, p. 26, July 18,1977.
forced termination when handing over from cell to cell, and system-Overall view,” Rev. EZectricrrl Communication Lubom- more efficient use of the available spectrum. tories, VOL 25:ll-12, pp. 1147-1156, Nov.-Dec. 1977.
[ 171 J. Yau and R. Donaldson, “Subjective effects of channel trans- mission errors on PCM and DPCM voice communication system,” IEEE Tmns. Commun., voL COM-20:3, pp. 281-290, June
The are we’ aware Of *e sigruficance Of the [18] N. S. Jayant, “Digital coding of speech waveforms, PCM, DPCM, 1972.
technological polemic which is the subject of this paper. and DM quantizen,”inRoc IEEE, vol. 6 2 5 , pp. 611-632, May During the past year they have had discussions on the subject 1974. with many of their colleagues. me authors’ [19] R. E. Crochiere and M. R. Sambur, “A variableband coding
knowledge of the problems of mobile radio, particularly scheme for speech encoding at 4.8 kb/s,” Bell Syst. Tech. J., vol. 5 6 5 , pp. 771-779, May-June 1977.
those associated with systems currently under development, 1201 B. B. Lusignan, “Evaluation of modulation and voice processing owes much to the assistance and advice of the Mobile Radio techniques for land mobile radio,” LEEE Veh. TechnoL News- Divisions of Bell Laboratories and the Motorola Corporation, [21] 1. NU^, “Some propetties of power Sums of truncated normal
letter, vol. 25:2, pp. 16-18, May 1978.
which are gratefully acknowledged. random variables,” Bell Syst. Tech. J., VOL 46, pp. 2091-2110, The authors owe special votes of thanks to Dr. Harrison [221 K. s. mer, Multidimariod Gd Distibutions. New
Rowe of Bell Laboratories and Dr. John Costas of General York: Wiley, 1964, p. 61. Electric for extended discussions on our proposals.
narrow-bmd systems currently under development. These [I4] Laboratories, H@ ~ ~ c i ~ Mobile Telephone syaem
busy-hour traffic-handling behavior, no Channel Switching Or [ 161 S. It0 and y. ma^&, ‘‘800 M H z band h d mobfie telephone
ACKNOWLEDGMENT
Nov. 1967.
REFERENCES
R. C. Dixon, Spread Spectrum Systems. New York: Wiley, 1976. J. H. Park, Jr., and C. Chayavadhanangkur, “Effect of fading on FM reception with cwhannel interference,” IEEE Tr4ns. Aemsp. Electron. Syst., vol. AES-13.2, pp. 127-132, Mar. 1977. W. C. Jakes, Jr., (Ed.), Microwwe Mobile Communications. New York: Wiley, 1974. D. P. Grybos and G. R. Cooper, “A receiver feasibility study for the spreadspectrum high capacity mobile radio system,” Conf. Rec. Vehicular Technology Society, Mar. 22-24, 1978, Denver,
R. S. Kennedy, Fading Dispersive Communication Chcmnelr. New Yo&: Wiley, 1969, Ch. 2 4 . G. R. Cooper, “A method of timefrequency coding for multiple access systems,” Roc. Third Hawaii In?. Cone System Sciences, Jan. 1970. G. A. Schlueter, “Effects of interference for time-frequency coded communication systems,” Ph.D. dissertation, Purdue Uni., West Lafayette, IN, Aug. 1973. R. D. Yates and G . R. Cooper, “Design of large signal sets with good aperiodic correlation properties,” Tech. Report, TR-EE 66-13, Purdue Univ., West Lafayette, IN, Sept 1966. G. R. Cooper and R. W. Nettleton, “Efficient spectrum utiliza- tion with wideband signals,” Tech. Report, TR-EE 77-12, Purdue Univ., West Lafayette, IN, Dec. 1976. A. J. Viterbi, Principles of Coherent Communication. New York: McGraw-Hill, 1966, p. 221. R. G. Finch, “Spectrum utilization in land mobile radio seMce,” Ph.D. dissertation, Purdue Univ., West Lafayette, IN, Dec. 1974.
CO, pp. 98-104.
George R Cooper was born in Connersville, IN, and received his under- graduate and graduate training at Purdue University. Since nceiving the Ph.D. degree in 1949, he has been on the staff of Purdue University where he is currently Professor of Electrical Engineering and Chairman of the Electrical Engineering Graduate Committee.
His teaching and research have been in the areas of radar, statistical communication theory, estimation theory, and systems analysis. He has had extensive consulting experience in the areas of active and passive radar systems, adaptive control systems, signal design, multipleaccess communication systems, seismic data analysis, interference prediction, electromagnetic compatibility, and array processing.
Dr. Cooper is a member of Tau Beta Pi, Eta Kappa Nu, Sigma Xi, Sigma Pi Sigma, and ASEE. He is a past member of the Board of Governors of the IEEE Communications Society, and a member of the Communication Theory Committee and the Education Committee of that Society, a past member of the Administrative Committee of the Information Theory Group, and past Chairman of the Chicago Area Chapter of the Information Theory Group.
R. W. Nettieton was born in London, England, and came to the United States in 1972. After graduating Magna cum Laude from the Uni- versity of Dayton in 1974, he began graduate studies at Purdue University. He received the M S . degree in electrical engineering from Purdue in 1976, and is currently a doctoral candidate.
Mr. Nettleton is a member of Eta Kappa Nu.