01 marico bangladesh ltd
TRANSCRIPT

26500159
Des
igne
dby
Alo
kN
anda
and
Com
pany
, Prin
ted
byD
hote
Of fs
etTe
chno
kraf
tsP
vt. L
td.

1
INDEXMARICO BANGLADESH LIMITEDCompany Information ..........................................................3Chairman’s Letter to Shareholders ......................................4Management Discussion and Analysis ................................5Corporate Governance Report .......................................... 11Corporate Governance Compliance Report ......................12Directors’ Report ................................................................24Directors’ Report Annexure-1 & 2 .....................................28Auditors’ Report .................................................................29Balance Sheet ...................................................................30Profi t and Loss Account .....................................................31Cash Flows Statement ......................................................32Statement of Changes In Shareholders’ Equity .................33Notes To the Financial Statements ....................................34
MBL INDUSTRIES LIMITEDCompany Information ........................................................52Directors’ Report ................................................................53Auditors’ Report .................................................................54Balance Sheet ...................................................................55Profi t and Loss Account .....................................................56Cash Flow Statement ........................................................57Statement of Changes In Shareholders’ Equity .................58Notes to the Financial StatementsFor the year ended September 30, 2012...........................59
KAYA LIMITEDCompany Information ........................................................64Directors’ Report ................................................................65Auditors’ Report .................................................................69Annexure to Auditor’s Report ............................................70Balance Sheet ...................................................................72Profi t and Loss Account .....................................................73Cash Flow Statement ........................................................74Notes to Financial Statement ............................................75
DERMA - Rx INTERNATIONAL AESTHETICS PTE LTD.Company Information ........................................................96Directors’ Report ................................................................97Statement By Directors’ .....................................................98Independent Auditor’s Report ............................................99Statement of Comprehensive Income .............................100Balance Sheet .................................................................101Statement of Changes In Equity ......................................102Statement of Cash Flows ................................................103Notes to the Financial Statements...................................104
THE DRx CLINIC PTE LTD.Company Information ......................................................120Directors’ Report ..............................................................121Statement by Directors ....................................................122Independent Auditors’ Report ..........................................123Balance Sheet ................................................................124Statement of Comprehensive Income .............................125Statement of Changes In Equity ......................................126Statement of Cash Flows ................................................127Notes to the Financial Statements ..................................128
THE DRx MEDISPA PTE LTD.Company Information ......................................................140Report of the Directors ....................................................141Statement by Directors ....................................................142Auditors’ Report ...............................................................143Balance Sheet ................................................................144Statement of comprehensive Income ..............................145Statement of Changes In Equity .....................................146Cash Flow Statement ......................................................147Notes to the Financial Statements...................................148
DRx INVESTMENTS PTE LTDCompany Information ......................................................160Report of the Directors ....................................................161Statement of Directors ....................................................162Independent Auditors’ Report ..........................................163Statement of Comprehensive Income .............................164Balance Sheet ................................................................165Statement of Changes In Equity .....................................166Cash Flow Statement ......................................................167Notes to the Financial Statements...................................168
DRx AESTHETICS SDN. BHDCompany Information ......................................................174Directors’ Report ..............................................................175Statement by Directors ....................................................177Statutory Declaration .......................................................178Independent Auditors’ Report .........................................179Income Statement ...........................................................181Balance Sheet .................................................................182Statement of Changes In Equity ......................................183Cash Flow Statement ......................................................184Notes to the Financial Statements ..................................185Income Statement ...........................................................192Schedule of Expenses .....................................................193
MARICO MIDDLE EAST FZECompany Information ......................................................194Auditors’ Report ...............................................................195Balance Sheet .................................................................196Statement of Comprehensive Income .............................197Cash Flow Statement ......................................................198Notes to the Financial Statements...................................199
KAYA MIDDLE EAST FZECompany Information ......................................................213Independent Auditors’ Report ..........................................214Balance Sheet .................................................................215Statement Comprehensive Income .................................216Statement of Changes In Equity ......................................217Statement of Cash Flow ..................................................218Notes to the Financial Statements ..................................219
MEL CONSUMER CARE SAECompany Information ......................................................232Independent Auditors’ Report ..........................................233Balance Sheet .................................................................234Income Statement ...........................................................235

2
M A R I C O B A N G L A D E S H L I M I T E D
2
Statement of Changes In Equity ......................................236Cash Flow Statement .....................................................237Notes to the Unconsolidated fi nancial Statement ............238
EGYPTIAN AMERICAN INVESTMENT AND INDUSTRIAL DEVELOPMENT COMPANY SAECompany Information ......................................................245Independent Auditors’ Report ..........................................246Balance sheet ..................................................................247Income Statement ...........................................................248Statement of Changes in Equity ......................................249Cash Flows Statement ....................................................250Notes to the fi nancial statements ....................................251
MARICO EGYPT FOR INDUSTRIES (SAE)Company Information ......................................................261Independent Auditors’ Report .........................................262Balance Sheet .................................................................263Income Statement ...........................................................264Statement of Changes In Shareholders’ Equity ...............265Cash Flow Statement ......................................................266Notes to the Financial Statements...................................267
MARICO SOUTH AFRICA CONSUMER CARE (PTY) LIMITEDCompany Information ......................................................278Directors’ Responsibility Statement .................................279Independent Auditors’ Report .........................................280Report of the Directors ’ ...................................................281Balance sheet .................................................................282Income Statement ...........................................................283Statement of changes in equity ......................................284Statement of cash fl ows .................................................285Notes to the Financial Statements...................................286
MARICO SOUTH AFRICA (PTY) LIMITEDCompany Information ...................................................... 311Statement of Directors ’ Responsibility ............................312Independent Auditor’s Report ..........................................313Directors’ Report ..............................................................314Statement of Financial Position .......................................315Income Statement ...........................................................316Statement of Changes In Equity ......................................317Statement of Cash Flow ..................................................318Notes to The Annual Financial Statements .....................319
MARICO MALAYSIA SDN. BHDCompany Information ......................................................337Directors’ Report ..............................................................338Statement by Directors ....................................................340Independent Auditors’ Report .........................................341Balance Sheet ................................................................342Income Statement ..........................................................343Statement of Changes In Equity ......................................344Cash Flow Statement ......................................................345Notes to the Financial Statements ..................................346Income Statement ...........................................................353Schedule of Expenses .....................................................354
INTERNATIONAL CONSUMER PRODUCTS CORPORATIONCompany Information ......................................................355Report of the Board of Directors ......................................356Independent Auditors’ Report ..........................................357Balance Sheet .................................................................358Income Statement ...........................................................360Cash Flow Statement ......................................................361Notes to the Financial Statements...................................362
BEAUTÉ COSMÉTIQUE SOCIETÉ PAR ACTIONSCompany Information ......................................................379Report of the Board of Directors ......................................380Independent Auditors’ Report ..........................................381Balance Sheet .................................................................382Income Statement ...........................................................384Cash Flow Statement ......................................................385Notes to the Financial Statements...................................386
THUAN PHAT FOODSTUFF JOINT STOCK COMPANYCompany Information ......................................................398Report of The Board of Directors .....................................399Independent Auditors’ Report ..........................................400Balance Sheet .................................................................401Income Statement ...........................................................403Cash Flow Statement ......................................................404Notes to the Financial Statements...................................405
MARICO CONSUMER CARE LIMITEDCompany Information ......................................................416Directors Report ..............................................................417Independent Auditors’ Report ..........................................420Balance Sheet .................................................................422Profi t & Loss ...................................................................423Cash Flow Statement ......................................................424Notes to the Financial Statements...................................425
HALITE PERSONAL CARE INDIA PVT LTDCompany Information ......................................................435Report To Principal Auditors ............................................436Balance Sheet .................................................................438Statement of Profi t & Loss ..............................................439Notes to the Financial Statements...................................440
MARICO KAYA ENTERPRISES LIMITEDCompany Information ......................................................450Independent Auditor’s Report ..........................................451Balance Sheet .................................................................453Profi t & Loss ...................................................................454Notes to the Financial Statements...................................455
MARICO INNOVATION FOUNDATIONCompany Information ......................................................459Directors Report ..............................................................460Independent Auditor’s Report ..........................................462Balance Sheet .................................................................464Income and Expenditure Statement ...............................465Notes to the Financial Statements...................................466

3
M A R I C O B A N G L A D E S H L I M I T E D
3
Board Of DirectorsSaugata Gupta (Additional Director w.e.f. April 23, 2013)Milind Sarwate (Director)B. Sridhar (Additional Director w.e.f. April 23, 2013)Rohit Jaiswal (Ceased to be MD w.e.f. April 23, 2013)Aditya Shome (Managing Director w.e.f. April 23, 2013)Ghulam Mostafa (Independent Director)Rupali Chowdhury (Independent Director)
Management TeamAdiyta Shome (Managing Director)Ipsit Chakrabarti (Director-Sales)K.S. Balaji (Director-Operations)Ashikur Rahman (Director-Marketing)Iqbal Chowdhury (Director-Finance & Corporate Affairs)Sidhartha Das (Director-Human Resources)
Company Secretary Sorwar Alam
Registered & Corporate Offi ce House-1, Road-1, Sector-1,Uttara, Dhaka-1230. Telephone: (+0088) 8931202 Facsimile: (+0088) 8932322, Web: www.maricobd.com
Company Reg Number C-38527(485)/99
Place Of Incorporation Dhaka
Date Of Incorporation September 6, 1999
Our Factories Factory 1: Mouchak, Kaliakoir, Gazipur Factory 2: Sirirchala, Mahona, Bobanipur, Gazipur
Our Depots Dhaka Depot: Tongi, Gazipur Chittagong Depot: Hathazari Road Comilla Depot: Ashrafpur Jessore Depot: Loan Offi ce Para Bogra Depot: Bakshibazar Road, Maltinagar
Auditors A. Qasem & Co. Chartered Accountants Gulshan Pink City, Suites-01-03, Level-7, Plot-15, Road-103, Gushan-2, Dhaka
Legal Advisor Corporate Counsel Suite-802, Rahat Tower (7th Floor), 14, Biponon C/A, West Banglamotor, Dhaka-1000
Principal Bankers Citibank N.A. HSBC Standard Chartered Bank BRAC Bank
Share Listing The Dhaka Stock Exchange Ltd. The Chittagong Stock Exchange Ltd.
Investor Relations
For enquiries, please contact with Investor Relations Department at
Tell : (+0088) 8931202 Ext-100, 102 Fax : (+0088) 8932322 Email : [email protected]
Stock Data Stock Code: MARICO ISIN: BD0481MRICO6 Sector : Pharmaceuticals & Chemicals
Websites www.maricobd.com www.marico.com

4
M A R I C O B A N G L A D E S H L I M I T E D
4
CHAIRMAN’S LETTER TO SHAREHOLDERS Dear Shareholders,
It is my privilege to present to you the annual report of the company for the fi nancial year ended 31st March 2013.
We have completed another challenging year for Marico Bangladesh Limited with the country witnessing high degree of political turmoil during the latter part of the year. Notwithstanding the challenges for the year, the company showed steady performance at the overall business level. For the fi nancial year ended 31st March 2013 (FY 13), the company registered a Top-line growth of 1.4% over the previous fi nancial year (FY12) and a PAT growth @62%. Consequently, Earnings per Share (EPS) increased from Tk. 17 to Tk. 27.53 in FY13.
Your company’s fl agship brand “Parachute” continued to maintain its clear leadership position by further improving upon its market share in the branded coconut oil segment which is highest ever in Marico Bangladesh history. This further reinforces our belief in our existing market strategy and campaigning of promoting “Parachute” purity and quality. In the Value Added Hair Oil (VAHO) segment, the bullish run continued all though FY13 registering a handsome growth of 52% over the previous fi nancial year. Consistent performances during the last few years have now made us a formidable player in this category. With a slew of initiatives and planned innovations in the near future, we are confi dent of our continued aggressive performances in the coming year(s). At the same time in the powdered “Hair dye” segment, Hair Code coupled with the introduction of its new “faster acting” variant during the last quarter of FY13, continues to dominate this segment with a commanding value market share of 26%.
The new copra crushing plant at “Shirirchala” which commenced in Q3FY13 is fully stabilized and we now service all our requirements through this factory thereby ensuring 100% in-house supply assurance for our crushing operations.
Over the last three years as part of our “long-term” business strategy, we have been making concerted efforts to broad base and de-risk its operations from dependence on a single vertical. Therefore, new segments i.e. hair oil, hair dye etc. have been focused for adding value to our overall business portfolio. This has started yielding dividends and for the fi nancial year ended 31st March 2013, contribution from other segments was signifi cant. The journey is expected to further enhance in the coming years with the inclusion of newer product categories and brands.
During the year, your company received accolade from the Institute of Cost and Management Accountants of Bangladesh (ICMAB) for being the 2nd best Multinational Company in Bangladesh.
The country is currently witnessing a certain degree of political turmoil and uncertainties which could continue in the next Financial Year. This may have a bearing on the overall trade sentiments and consumer spending thereby impacting the short term performance of FMCG sector. Your company is however cautiously optimistic after seeing signs of recovery in the Q4FY13. We also believe that the building blocks are in place to capture the long term potential consumer sector in Bangladesh.
I would like to take this opportunity to thank each and every one of our stakeholders for their trust and encouragement.
Warm regards,
Sd/-
Saugata Gupta
Chairman

5
M A R I C O B A N G L A D E S H L I M I T E D
5
MANAGEMENT DISCUSSION AND ANALYSISManagement discussion and analysis is an integral part of understanding of fi nancial results of the company. This has been prepared following the requirements of Section 184 of The Companies Act, 1994, BSEC Notifi cation, Listing Regulations of Dhaka Stock Exchange (DSE) and Chittagong Stock Exchange (CSE). The reporting period of management discussion and analysis is for 12 months from April’12 to March’ 13. It covers general economic conditions of the country, overview of business operations, internal control system, fi nancial results and other developments happened during the reporting period.
We have stated some information relevant to discussion and analysis describing projections, estimates, expectations or outlook may be forward looking. Various factors i.e. changes in government regulations, tax regimes, economic developments of the country, exchange rate and interest rate movements, impact of competing products and their pricing, product demand and supply constraints can be reasons for deviation of actual results from stated information materially.
FMCG Industry-Structure & Development
Fast Moving Consumer Goods (FMCG) include a wide range of frequently purchased consumer products such as toiletries, soap, cosmetics, tooth cleaning products, shaving products and detergents, oils, food & beverage, personal care products, dairy products etc.
Bangladesh is home to the eighth largest population in the world. The country’s GDP has been growing at a rate of over 6%. FMCG sector is one of the largest sectors in the economy of Bangladesh. The growth of FMCG Industry is expected to be correlated with population and economy. The industry is currently growing and is expected to maintain a high growth rate. The industry is characterized by continuous moderation in volume growths, rising advertisement spends to retain market share and competitive landscape intensifying.
The FMCG market can be divided into two segments – urban and rural. The urban segment is characterized by high penetration levels and high spending propensity of the urban resident. The rural economy is largely agrarian – directly or indirectly dependent on agriculture as a means of livelihood – with relatively lower levels of penetration and a large unorganized sector.
The FMCG Industry caters to the needs of the consumers located across the country - both in the key cities and in the rural hinterland through a well developed and effi cient supply chain model comprising C&F Agents, distributors, wholesalers and retailers. With access to the rural economy gradually improving with investments in physical infrastructure, it provides FMCG companies the potential to continue to grow their franchise of consumers.
With exposure provided through overseas travel and to a large extent through overseas media, consumers aspire to reach a level of consumption similar to consumers in the developed economies even as they are cautious about extravagance and over indulgence. This provides the FMCG companies with opportunities for growing the market.
Low capital requirements, simple manufacturing processes and sub-contracting of manufacturing activities are characteristics of the Industry. As a result, several small local brands tend to compete with well established multinational companies. FMCG companies have to continuously innovate and also advertise in order to build the equity of their brands and create mass pull. Brand building, product innovation and product differentiation are critical to the growth of FMCG companies.
Opportunities & Threats
The main opportunities & threats of FMCG industry of Bangladesh can be outlined as followings;
• Demographic profi le
The country has a population more than 150 million. This provides the FMCG companies with a large consumer base. Currently, more than 60* companies are operating in FMCG business. The median age continues to be in mid to late twenties. The youth of today is conscious of the importance of being well groomed and looking good. With increasing focus on education and empowerment of women, their lifestyle and propensity to consume is undergoing a change; they are becoming more fashion conscious and open to experimenting with new products.
• Urban economy
Rapid urbanization has resulted in large markets getting concentrated in urban centers. Increasing disposable incomes and exposure to media have shaped aspirations of the urban consumer while consumerism has led to satisfaction of wants. Availability of credit and changed mindset towards consumption has further fuelled the demand for consumables.

6
M A R I C O B A N G L A D E S H L I M I T E D
6
MANAGEMENT DISCUSSION AND ANALYSISThe high growth trajectory in the urban economy of the past few years has shown some slowdown on account of the global economic crisis, particularly for discretionary spending. However, the impact has been muted for items of daily consumption.
• Rise of the rural economy
The economic scenario in the country has undergone a change in the recent past. Nearly two-thirds of the Bangladesh population resides in sub-urban and rural villages and mainly practices agriculture besides trading activities. Facilities and government subsidies in inputs of agriculture, diversifi cation from basic farming to fi sheries, poultry, live stocks, dairy and organized branded marketing of several of these items continues to boost the rural economy. Rural Bangladesh now forms a sizeable share of the demand for FMCG products, consumer durables and consumer discretionary products. Increased spending power of the rural people coupled with relatively lower degree of penetration of branded FMCG products in these markets, have provided the Industry players with an opportunity to drive growth. Established brands are tapping in to the rural economy to encourage up-trading by the consumer from unbranded products to branded ones with assured quality and purity.
• Lifestyle and awareness
The present day consumer is savvy, has higher aspirations and is brand & lifestyle conscious. She does not mind spending on quality products and seeks value for money spent. FMCG companies have recognized the opportunity available by introducing “Value for Money” as well as “Premium” product variants aimed at catering to varying needs of different consumers. Products aimed at delivering healthy lifestyle solutions have been introduced to woo health conscious consumers.
• Branded solutions sector
The increase in the propensity to consume and the increasing consciousness for adopting healthy lifestyle offerings have led to the development of branded solutions including leveraging of existing brand identities and creating extensions around them. The quality conscious consumer is willing to pay premium for effective solutions, improved services and a superior experience. The focus is to provide consumers with a holistic solution for their needs in the form of a consolidated offering of various products and services.
• Impact of National Economy over Marico Business
GDP growth for the last 5 years reveals that the economy of Bangladesh has been growing at steady rate of about 6 percent. Foreign exchange remittance by migrant workers and NRBs has increased rapidly and touched almost US$ 14 billion in the recent past. This has had a positive impact on the demand side on mass consumption especially in the rural areas, which are major recipients of overseas remittances. Moreover, growing disposable incomes and increased media exposure are ushering in a revolution in consumer behavior, presenting exciting growth opportunities for companies. Despite the global economic recession, the growth in demand in the rural market especially in FMCG space is unabated.
Risks & Concerns
• Input Costs
Commodity prices are often linked to international indices and volatility in these benchmarks causes fl uctuations in the product prices. The past 2-3 years have witnessed wide fl uctuations in the price of commodities. Copra- a basic raw material of producing coconut oil was unstable. Volatility was consequently experienced in other commodities such as crude derivatives like liquid paraffi n and high density polyethylene (HDPE) as well as edible oils. Input costs comprise nearly 60% of the production costs in the FMCG sector. Infl ationary tendencies in the economy directly impact the input costs and could create a strain on the operating margins of the FMCG companies. Brands with greater equity may fi nd it easier to adjust prices in line with fl uctuating commodity prices and input costs.
• Exchange Rate
Exchange rate risk relates to the core business of MNCs, since it mostly imports materials from abroad in foreign currency. Volatility of exchange rates impacts business of the FMCG companies and profi ts.

7
M A R I C O B A N G L A D E S H L I M I T E D
7
MANAGEMENT DISCUSSION AND ANALYSIS
• Competition
The FMCG environment in Bangladesh is dominated by a few large MNCs. Growing entrepreneurship among local operators is seeing newer entrants thereby making the market competitive. Therefore, focus on branding, product differentiation, distribution and innovation is of higher importance, to build a loyal consumer franchise.
• Product innovation and new product launches
Success rate for new product launches in the FMCG sector is low. Superior consumer understanding and differentiated propositions are major priorities that the sector needs to focus on in order to minimize the risk and cost involved in such initiatives. Marico group has adopted the prototyping approach to new product introductions that helps maintain a healthy pipeline and at the same time limits the downside risks.
• Discretionary spending / Down trading
In situations of economic duress, items which are in the nature of discretionary spending are the fi rst to be curtailed. This is relevant for the lifestyle solutions offered by companies. In an extended recession, down trading from branded products to non-branded ones could also occur and affect the fi nancial performance of the company.
• Internal Control Systems and their Adequacy
Marico has a well established and comprehensive internal control structure across the value chain to ensure that all assets are safeguarded and protected against loss from unauthorized use or disposition that transactions are authorised, recorded and reported correctly and that operations are conducted in an effi cient and cost effective manner. The key constituents of the internal control system are:
• Establishment and review of business plans
• Identifi cation of key risks and opportunities
• Policies on operational and strategic risk management
• Clear and well defi ned organization structure and limits of fi nancial authority
• Continuous identifi cation of areas requiring strengthening of internal controls
• Operating procedures to ensure the effective business process
• Systems of monitoring compliance with statutory regulations
• Well-defi ned principles and procedures for evaluation of new business proposals/capital expenditures
• A robust management information systems
• A robust internal audit and review systems
Marico has an Internal Audit function and Mr. K.S. Balaji is working as Head of Internal Audit. He coordinates and supervises all internal control systems. We have two internal auditors- M/s Hossain Farhad & Co., a local Chartered Accountant Firm who conducts audit throughout the year and M/s Ernst & Young, a Global Chartered Accountant Firm practicing in India, who is the internal auditors of the parent company.
Internal Audit is undertaken on a continuous basis covering areas across the value chain like manufacturing operations, sales and distribution, marketing, fi nance etc. Reports of the internal auditor are regularly reviewed by the management and corrective actions are initiated to strengthen the controls and enhance the effectiveness of the existing systems.
The SAP suite of ERP (SAP R/3, SCM and APO) provides a real time check on various transactions emanating from various business processes of the company. Marico-Net, the web-enabled architecture that links to Marico to its biggest business associates, namely its distributors, also helps the company exercise similar controls over its sales system.
Distribution
Distribution facilities and timely reach of products to consumers is one of the key strengths of a FMCG company. Marico has a full-fl edged distribution channel. Currently, the company has a good distribution network coverage comprising its own fi ve depots and distribution partners across the country, in order to keep suffi cient level of products available all around the country. These

8
M A R I C O B A N G L A D E S H L I M I T E D
8
MANAGEMENT DISCUSSION AND ANALYSISfi ve depots are located at Tongi, Chittagong, Comilla, Jessore and Bogra enabling a strong presence across the country, both in rural and urban areas. Marico’s own sales professionals support and scrutinize the entire distribution channel. At present, there are a good number of distribution partners all over the country. Marico’s own sales employees like RSM (Regional Sales Manager), ASM (Area Sales Manager) and TSM (Territory Sales Manager) physically monitor and rigorously control the distributors’ functions from time to time.
Capacity Building
Continuous investments had been made in last couple of years in building capacity for smoothening company’s operation. At present, Marico Bangladesh Limited owns two factories and also operates with a number of contract manufacturers-FG & packing materials. Both factories have capacity for storage of oil approx. 6000 KL. The existing capacity is capable for meeting its production facilities for current products as well as future products.
Quality Assurance
Quality & good manufacturing practices along with following legal parameters dictating quality aspects, as laid out by regulatory bodies, Marico practices MMEM (Marico Manufacturing Excellence Model), an in house Quality Assurance model developed on the lines of ISO 900. This allows consistent quality of products. Q-CERT aids in minimizing break downs while supporting maximum possible output. Further, such initiatives have helped Marico in preventing accidents and curtailing overhead costs. The company has strong focus on the quality control of its products. All products are in accordance to BSTI’s given parameters. Marico ensures quality of product thorough inspection and surveillance. Standard Operating Procedures (SOP) for every step of the production process are followed. Marico Bangladesh Limited is also a ISO 14001 & 18001 certifi ed. Marico places great emphasis on managing quality control and careful steps are taken to ensure that the standard of the products provided to its customers are consistent, reliable and meets their needs. Marico practices good Housekeeping & Good Manufacturing Practices (GMP) at both its factory premises. Housekeeping helps to maintain a healthy environment. Housekeeping means keeping the right object in the right place and removing unwanted objects from the work place. This is pivotal in maintaining quality of fi nished goods and in order to keep a clean environment for labors to work.
Technology in Marico
The entire sales commercial, factory commercial, fi nance operation runs through SAP based integrated ERP system. Use of this package makes it possible to track and manage, in real-time, sales, production, fi nance & accounting and human resources in an enterprise. In most of the cities, the sales representatives known as Distributor Based Sales Men (DBSMs) carry Personal Digital Assistant (PDA), which makes the sales process much more effi cient. PDA is installed with software that makes the sales process easier for both retailers and DBSMs. The PDA has been customized so that the medium of interface is in Bengali. Such a PDA assists DBSMs in recalling all the brands, SKUs and aids in seeing whether suffi cient stock is available or not.
Human Resources and Development
Marico is a professionally managed organization that has built for itself a stimulating work culture that empowers people, promotes team building and encourages new ideas. This year the concept of Talent Value Proposition (TVP) was created to defi ne how Marico fulfi lls the purpose of our members, our current and prospective talent. Marico’s TVP aims to continuously challenge, enrich and fulfi ll the aspirations of the Mariconians so that they can maximize their true potential to – Make a Difference.
Your company continues with the process of hiring the best talent from the premier institutes of Bangladesh as Management Trainees with an intention to groom them for future Business Leadership roles in the company. In line with the above mentioned TVP, we aim at providing challenge and early responsibility at work. All Human Resource related actions have a strong business focus and is in line with the business plan. Human Resource partners the other line functions and supports them by providing the necessary impetus to take your company to the next level. The organization creates an environment of positivity that leads to enhanced effectiveness and effi ciency.
Marico through its various processes believes in building upon the strength of the person while simultaneously providing inputs to its members to facilitate them to improve upon their development areas. The organization believes in investing in people to develop and expand their capabilities. Marico’s strategies are based, inter alia, on processes of continuous learning and improvements. PDP (Personal Development Plan) focus upon how each individual’s strength can be best leveraged so as to help each one to deliver to his / her full potential. External Training Programs and cross functional exposures provides the extra edge.

9
M A R I C O B A N G L A D E S H L I M I T E D
9
MANAGEMENT DISCUSSION AND ANALYSISMarico has formulated a contemporary set of values and it is important that all members in the organization are not only aware but also consciously practice and “walk the talk” on all its values. To build this consciousness and commitment, value workshops are held for teams to bring clarity and to identify their focus areas and plan actions accordingly.
Key Brands’ Performance
Parachute Coconut oil
The name of “Parachute” stands as the epitome of “Purity” and “Quality” in Bangladesh. Made from the fi nest coconuts in automated machines, Parachute Coconut Oil is the leading brand in the Branded coconut oil market of the country. With its newest avatar in the True Blue bottle, the brand is available in more than 7 lac retail outlets catering to the need of all people across the nation. For such an astounding journey “Parachute” was recognized as the No.1 Brand of Bangladesh across FMCG categories for 2012 in a study jointly conducted by AC Nielson & Bangladesh Brand Forum.
Parachute Advansed Enriched Hair Oil
Parachute Advansed Enriched Hair oil comes with the goodness of Coconut oil and other herbal ingredients like Amla, Hibiscus, Mehedi and lemon. The oil serves consumers who believe that their hair requires more than just the care of coconut oil. The various herbal ingredients present in this oil address particular hair related issues.
The widely popular “Bondhu Teen Din” campaign communicated the qualities of the brand and also presented the importance of oiling hair for at least 3 days a week for 3 times more hair growth.
Parachute Beliphool Lite
Parachute Beliphool Lite is the largest brand in the Marico Bangladesh Limited VAHO (Value-Added Hair Oil) portfolio. It is a coconut oil enhanced with the fragrance of beliphool which provides a non-sticky usage experience. The goodness of coconut nourishes the hair while the non-sticky nature of the oil leaves hair light and bouncy, and adding the fragrance of beliphool. Parachute Beliphool Lite caters to young modern consumers who want something extra from their hair oil. The brand operates in the perfumed oil sub-segment and is one of the fastest growing brands in Marico Bangladesh Limited’s product basket. It is available in packs of 100 ml, 150 ml & 300 ml.
Parachute Advansed Cooling Hair Oil
Parachute ventured into the cooling oil segment in April 2011 with Parachute Advansed Cooling Hair Oil (PACHO). It is coconut based oil enriched with 21 ayurvedic herbs that provides cooling effect, hair nourishment along with additional benefi ts such as relief from headaches, ensures sound sleep and long lasting stress relief. It caters to those consumers who seek a cooling effi cacy from their hair oil. The brand is available in two formats- rigid bottles of 50 ml, 100 ml, 200 ml and mini sachets. Since its inauguration, PACHO has successfully served the cooling oil needs of the consumers of Bangladesh.
Nihar Naturals
Marico Bangladesh Limited introduced an exciting range of hair oils to the Bangladesh market with the launch of Nihar Naturals range in 2012. The Nihar Naturals range offers the modern woman three specialized hair oils, and all three variants derive its ingredients from the best gifts of nature. Nihar Amla hair oil is a nourishing blend of amla oil & almond oil, making hair long, healthy and beautiful. Nihar Almond oil is rich in vitamin E, giving the benefi ts of fi ve almonds in each application whereas Nihar Enriched hair oil combines the goodness of coconut oil with methi and the fragrance of jasmine extracts. Each variant comes in packs of 100 ml and 200 ml and is available in outlets nationwide.
Hair Code Hair Dye
Hair Code Herbal Hair Dye was launched in Bangladesh in 2008. Available in 6g sachet packs, Hair Code is the pioneer as a herbal hair dye in Bangladesh is enriched with Joba, Amlaki and Mehendi. It covers grey hair naturally, giving you a smarter, younger and more confi dent look.
The brand continues to be the No.-1 in the category through insightful advertising and salon activation programs.

10
M A R I C O B A N G L A D E S H L I M I T E D
10
MANAGEMENT DISCUSSION AND ANALYSISNew Launched Products
HairCode Active
Marico Bangladesh Limited added a new range of faster acting hair color-HairCode Active enhancing the existing dye portfolio of HairCode herbal powder dye at a launch ceremony in Dhaka in January 2013.
For the fi rst time ever a range of 3 color variants, Natural Black, Natural Brown and Mehendi Red has been launched to address the needs of consumers for a faster solution to grey coverage coupled with the assurance of herbal goodness. HairCode Active promises complete grey coverage in just 15 minutes of application. It has identifi ed the evolving consumer needs in the category for not just a problem solution but for convenience and styling along with the assurance of damage protection. The new range of hair color will address these evolving needs of the Bangladeshi consumers and further strengthen the brand’s footprint in the herbal dye category.
Livon Silky Potion
Almost every woman these days suffers from dry, frizzy, dull and tangled hair due to the harsh chemicals in ordinary soap, shampoo, or even external factors like pollution and weather. To offer a solution to many active and busy women who are suffering from this problem on a regular basis, Marico Bangladesh Limited launched “Livon Silky Potion”, a detangling hair fl uid.
Livon Silky Potion’s new Cutisoft formula smoothens and softens the hair cuticles by forming a coat on the hair strand. It seals the moisture with a layer of protection and instantly transforms dry, frizzy and brittle hair into tangle free, soft, and silky hair with which you are sure to fall in love once again. This unique post wash serum is also enriched with Vitamin E to nourish your hair. Currently Livon Silky Potion is available in two SKUs (20ml and 50ml) in the market.
Cost Structure of the Company
Particulars FY13 FY 12Cost of Goods Sold 64% 76%Sales & Distribution expenses 12% 9%Other expenses 8% 6%Operating Margins 15% 9%PBT 19% 11%PAT 14% 9%
Notes:
1. The above percentages are to turnover for the respective years.
2. The average market prices of copra, the largest component of input costs, was down during FY13 as compared to FY12. This along with other effi ciency led initiatives led to a reduction in the cost of goods sold even though there was an infl ationary trend in other input costs.
3. A part of the gross margin expansion due to reduction in cost of goods sold has been re-invested back into the business in the form of Advertisement & Sales Promotion as is evident from the overall increase of 300 bps for year. The Company continues to make investments behind existing products and new products such as Parachute Beliphool, Nihar, Parachute Cooling and Hair Dye products.
4. The other expenses include certain items which are variable in nature (almost 2/3rd of other expenses) and accordingly they have increased in conjunction with the volume growth and infl ation. The fi xed part of other expenses has increased on account of normal infl ation and certain expenses such as rent due to planned higher inventory positions.
Outlook
The country is currently witnessing certain degree of political turmoil and uncertainties which could continue in the coming Quarters of the next Financial Year. This may have a bearing on the overall trade sentiments and consumer spending thereby impacting the short term performance of the sector. The Company is however cautiously optimistic given the performance in FY13. We also believe that the building blocks are in place to capture the long term potential consumer sector in Bangladesh.
Sd/-
Aditya ShomeManaging Director

11
M A R I C O B A N G L A D E S H L I M I T E D
11
CORPORATE GOVERNANCE REPORTMarico believes that Corporate Governance is not an end in itself but is a catalyst in the process towards maximization of shareholder value. Therefore, shareholder value as an objective is woven into all aspects of Corporate Governance – the underlying philosophy, development of roles, creation of structures and continuous compliance with standard practices.
This report on Corporate Governance is divided into the following parts
• Compliance with SEC Corporate Governance Guideline Notifi cation
• Board of Directors
• Audit Committee
• Remuneration Policy of the Company for Members of the Board
• General Body Meetings
• Means of Communication
• General Shareholder Information
Compliance with SEC Corporate Governance Guideline Notifi cation
Marico Bangladesh Limited follows amended Bangladesh Securities & Exchange Commission Corporate Governance guideline issued on August 7, 2012 vides notifi cation no-SEC/CMRRCD/2006-158/134/Admin/44:
Board of Directors:
• Marico Bangladesh Limited’s Board of Directors consists of 7 (seven) members including the Managing Director. The Managing Director sits as a member of the Board of Directors.
• Among the members of Board of Directors, two are non-shareholding non-executive independent directors. These two independent directors were fi rst appointed on December 31, 2009 and their appointments were approved at 10th AGM held on January 17, 2010. They were re-appointed for second term at the 12th AGM held on July 19, 2012.
• Among the independent directors represent to Board of Directors, Mr. Ghulam Mostafa is the Chairman and Managing Director of Kollol Group of Companies and Mrs. Rupali Chowdhury is the Managing Director of Berger Paints Bangladesh Limited.
• The Chairman of Board of Directors and Managing Director of the company are different persons.
• The Directors’ report has been enclosed with the annual report.
Chief Financial Offi cer, Head of Internal Audit and Company Secretary:
• The Board of Directors has designated Mr. Iqbal Chowdhury as Chief Financial Offi cer on April 23, 2013. Moreover, Mr. K.S. Balaji and Mr. Sorwar Alam are continuing as Head of Internal Audit and Company Secretary respectively of the company.
Audit Committee:
• The Board of Directors has constituted an Audit Committee as a sub-committee of the Board.
• There are 3 (three) members to the committee (excluding the Company Secretary).
• The committee assists the Board of Directors in ensuring that the fi nancial statements refl ect true and fair view of the state of affairs of the company and in ensuring a good monitoring system within the business.
• One of independent director, Mrs. Rupali Chowdhury is the chairman of the committee. The members of the committee appointed and reports to Board of Directors.
• All members of the committee have sound fi nancial knowledge and background.
External/Statutory Auditors:
• M/s. A. Qasem & Co. is acting as statutory auditors. They are not involved with any other services of the company.

12
M A R I C O B A N G L A D E S H L I M I T E D
12
CORPORATE GOVERNANCE COMPLIANCE REPORTReporting and Compliance of Corporate Governance:
• The company obtained a certifi cate from practicing chartered secretary, M/s. Al-Muqtadir Associates. The copy of the report has been annexed with the annual report.
• Status of Compliance with Bangladesh Securities and Exchange Commission’s Notifi cation SEC/CMRRCD/2006-158/134/Admin/44 dated 7th August, 2012 The checklist are attached hereunder:-
ConditionNo.
Title Compliance Status (Put √ in the appropriate column)
Remarks (if any)
Complied Not Complied
1 Board of Directors:
1.1 Board’s Size: Board members should not be less than 5 (fi ve) and more than 20 (twenty)
√
1.2 Independent Directors:1.2 (i) At least 1/5th √
1.2 (ii) a) Does not hold any or holds less than 1% shares √
1.2 (ii) b) Is not connected with the company’s any sponsor, director or shareholder who holds 1% or more shares.
√
1.2 (ii) c) Does not have any other relationship, whether pecuniary or otherwise with the company or its subsidiary/associated companies.
√
1.2 (ii) d) Not a member, director or offi cer of any stock exchange √
1.2 (ii) e) Not a member, director or offi cer of any member of stock exchange or an intermediary of the capital market.
√
1.2 (ii) f) Who is not and was not a partner or an executive during the preceding 3 years of any statutory audit fi rm.
√
1.2 (ii) g) Is not an independent director in more than 3 listed companies √
1.2 (ii) h) Has not been convicted by a court of competent jurisdiction as a defaulter in payment of any loan to a bank or a Non-Bank Financial Institution.
√
1.2 (ii) i) Has not been convicted for criminal offence involving moral turpitude.
√
1.2 (iii) Nominated by the board of directors and approved by the shareholders in the AGM
√
1.2 (iv) The post does not remain vacant for more than 90 days. √
1.2 (v) The board shall lay down a code of conduct of all board members and annual compliance of the code to be recorded.
√
1.2 (vi) The tenure of offi ce of an independent director shall be for a period of 3 years, which may be extended for 1 term only.
√
1.3 Qualifi cation of Independent Director (ID):1.3 (i) Independent Director shall be a knowledgeable individual with
integrity who is able to ensure compliance with fi nancial, regulatory and corporate laws and can make meaningful contribution to business.
√
1.3 (ii) The person should be a Business Leader/Corporate Leader/ iversity Teacher with Economics or Business Studies or Law background/ Professionals like Chartered Accountants, Cost & Management Accountants, Chartered Secretaries. The independent director must have at least 12 years of corporate management/professional experiences.
√
1.3 (iii) In special cases the above qualifi cations may be relaxed subject to prior approval of the Commission.
√

13
M A R I C O B A N G L A D E S H L I M I T E D
13
CORPORATE GOVERNANCE COMPLIANCE REPORT
1.4 Chairman of the Board and Chief Executive Offi cer: The positions of the Chairman of the Board and the Chief Executive Offi cer of the companies shall be fi lled by different individuals. The Chairman of the company shall be elected from among the directors of the company. The Board of Directors shall clearly defi ne respective roles and responsibilities of the Chairman and the Chief Executive Offi cer.
√
1.5 The Directors’ Report to Shareholders:1.5 (i) Industry outlook and possible future developments in the
industry√
1.5 (ii) Segment-wise or product-wise performance. √1.5 (iii) Risks and concerns. √1.5 (iv) A discussion on Cost of Goods Sold, Gross Profi t Margin and
Net Profi t Margin.√
1.5 (v) Discussion on continuity of any Extra-Ordinary gain or loss. √1.5 (vi) Basis for related party transactions √1.5 (vii) Utilization of proceeds from public issues, rights issues and/or
through any others instruments.√
1.5 (viii) An explanation if the fi nancial results deteriorate after the company goes for Initial Public Offering (IPO), Repeat Public Offering (RPO), Rights Offer, Direct Listing, etc.
√
1.5 (ix) If significant variance occurs between Quarterly Financial performance and Annual Financial Statements the management shall explain about the variance on their Annual Report.
√
1.5 (x) Remuneration to directors including independent directors. √1.5 (xi) The fi nancial statements prepared by the management of the
issuer company present fairly its state of affairs, the result of its operations, cash fl ows and changes in equity.
√
1.5 (xii) Proper books of account of the issuer company have been maintained
√
1.5 (xiii) Appropriate accounting policies have been consistently applied in preparation of the fi nancial statements and that the accounting estimates are based on reasonable and prudent judgment.
√
1.5 (xiv) International Accounting Standards (IAS)/Bangladesh Accounting Standards (BAS)/International Financial Reporting Standards (IFRS)/Bangladesh Financial Reporting Standards (BFRS), as applicable in Bangladesh, have been followed in preparation of the fi nancial statements and any departure there-from has been adequately disclosed.
√
1.5 (xv) The system of internal control is sound in design and has been effectively implemented and monitored.
√
1.5 (xvi) There are no signifi cant doubts upon the issuer company’s ability to continue as a going concern. If the issuer company is not considered to be a going concern, the fact along with reasons thereof should be disclosed.
√
1.5 (xvii) Signifi cant deviations from the last year’s operating results of the issuer company shall be highlighted and the reasons thereof should be explained.
√
1.5 (xviii) Key operating and fi nancial data of at least preceding 5 (fi ve) years shall be summarized.
√
1.5 (xix) If the issuer company has not declared dividend (cash or stock) for the year, the reasons thereof shall be given.
√

14
M A R I C O B A N G L A D E S H L I M I T E D
14
CORPORATE GOVERNANCE COMPLIANCE REPORT
1.5 (xx) The number of Board meetings held during the year and attendance by each director shall be disclosed.
√
1.5 (xxi) The pattern of shareholding shall be reported to disclose the aggregate number of shares (along with name wise details where stated below) held by:
√
1.5 (xxi) a) Parent/Subsidiary/Associated Companies and other related parties (name wise details)
√
1.5 (xxi) b) Directors, Chief Executive Offi cer, Company Secretary, Chief Financial Offi cer, Head of Internal Audit and their spouses and minor children (name wise details);
√
1.5 (xxi) c) Executives; √
1.5 (xxi) d) Shareholders holding ten percent (10%) or more voting interest in the company (name wise details)
√
1.5 (xxii) In case of the appointment/re-appointment of a director the company shall disclose the following information to the shareholders:-
√
1.5 (xxii) a) a brief resume of the director √
1.5 (xxii) b) nature of his/her expertise in specifi c functional areas √
1.5 (xxii) c) names of companies in which the person also holds the directorship and the membership of committees of the board
√
2 Chief Financial Offi cer (CFO), Head of Internal Audit and Company Secretary (CS):
2.1 Appointment: The company shall appoint a Chief Financial Offi cer (CFO), a Head of Internal Audit (Internal Control and Compliance) and a Company Secretary (CS). The Board of Directors should clearly defi ne respective roles, responsibilities and duties of the CFO, the Head of Internal Audit and the CS.
√
2.2 Requirement to attend the Board Meetings: The CFO and the Company Secretary shall attend the meetings of the Board of Directors, provided that the CFO and/or the Company Secretary shall not attend such part of a meeting of the Board of Directors which involves consideration of an agenda item relating to their personal matters.
√
3 Audit Committee:3 (i) The company shall have an Audit Committee as a sub-committee
of the Board of Directors√
3 (ii) The Audit Committee shall assist the Board of Directors in ensuring that the fi nancial statements refl ect true and fair view of the state of affairs of the company and in ensuring a good monitoring system within the business.
√
3 (iii) The Audit Committee shall be responsible to the Board of Directors. The duties of the Audit Committee shall be clearly set forth in writing
√
3.1 Constitution of the Audit Committee: √
3.1 (i) The Audit Committee shall be composed of at least 3 (three) members
√
3.1 (ii) The Board of Directors shall appoint members of the Audit Committee who shall be directors of the company and shall include at least 1 (one) independent director.
√
3.1 (iii) All members of the audit committee should be “fi nancially literate” and at least 1 (one) member shall have accounting or related fi nancial management experience
√

15
M A R I C O B A N G L A D E S H L I M I T E D
15
CORPORATE GOVERNANCE COMPLIANCE REPORT
3.1 (iv) When the term of service of the Committee members expires or there is any circumstance causing any Committee member to be unable to hold offi ce until expiration of the term of service, thus making the number of the Committee members to be lower than the prescribed number of 3 (three) persons, the Board of Directors shall appoint the new Committee member(s) to fi ll up the vacancy (ies) immediately or not later than 1 (one) month from the date of vacancy (ies) in the Committee to ensure continuity of the performance of work of the Audit Committee.
√
3.1 (v) The company secretary shall act as the secretary of the Committee
√
3.1 (vi) The quorum of the Audit Committee meeting shall not constitute without at least 1 (one) independent director.
√
3.2 Chairman of the Audit Committee:3.2 (i) The Board of Directors shall select 1 (one) member of the Audit
Committee to be Chairman of the Audit Committee, who shall be an independent director.
√
3.2 (ii) Chairman of the audit committee shall remain present in the Annual General Meeting (AGM)
√
3.3 Role of Audit Committee:3.3 (i) Oversee the fi nancial reporting process. √
3.3 (ii) Monitor choice of accounting policies and principles √
3.3 (iii) Monitor Internal Control Risk management process √
3.3 (iv) Oversee hiring and performance of external auditors √
3.3 (v) Review along with the management, the annual financial statements before submission to the board for approval
√
3.3 (vi) Review along with the management, the quarterly and half yearly fi nancial statements before submission to the board for approval
√
3.3 (vii) Review the adequacy of internal audit function √
3.3 (viii) Review statement of significant related party transactions submitted by the management
√
3.3 (ix) Review Management Letters/Letter of Internal Control weakness issued by statutory auditors
√
3.3 (x) When money is raised through Initial Public Offering (IPO)/Repeat Public Offering (RPO)/Rights Issue the company shall disclose to the Audit Committee about the uses/applications of funds by major category (capital expenditure, sales and marketing expenses, working capital, etc), on a quarterly basis, as a part of their quarterly declaration of fi nancial results. Further, on an annual basis, the company shall prepare a statement of funds utilized for the purposes other than those stated in the offer document/ prospectus
√
3.4 Reporting of the Audit Committee:3.4.1 Reporting to the Board of Directors: √
3.4.1 (i) The Audit Committee shall report on its activities to the Board of Directors
√
3.4.1 (ii) The Audit Committee shall immediately report to the Board of Directors on the following fi ndings, if any:
√
3.4.1 (ii) a) report on confl icts of interests; √
3.4.1 (ii) b) suspected or presumed fraud or irregularity or material defect in the internal control system;
√
16
M A R I C O B A N G L A D E S H L I M I T E D
16
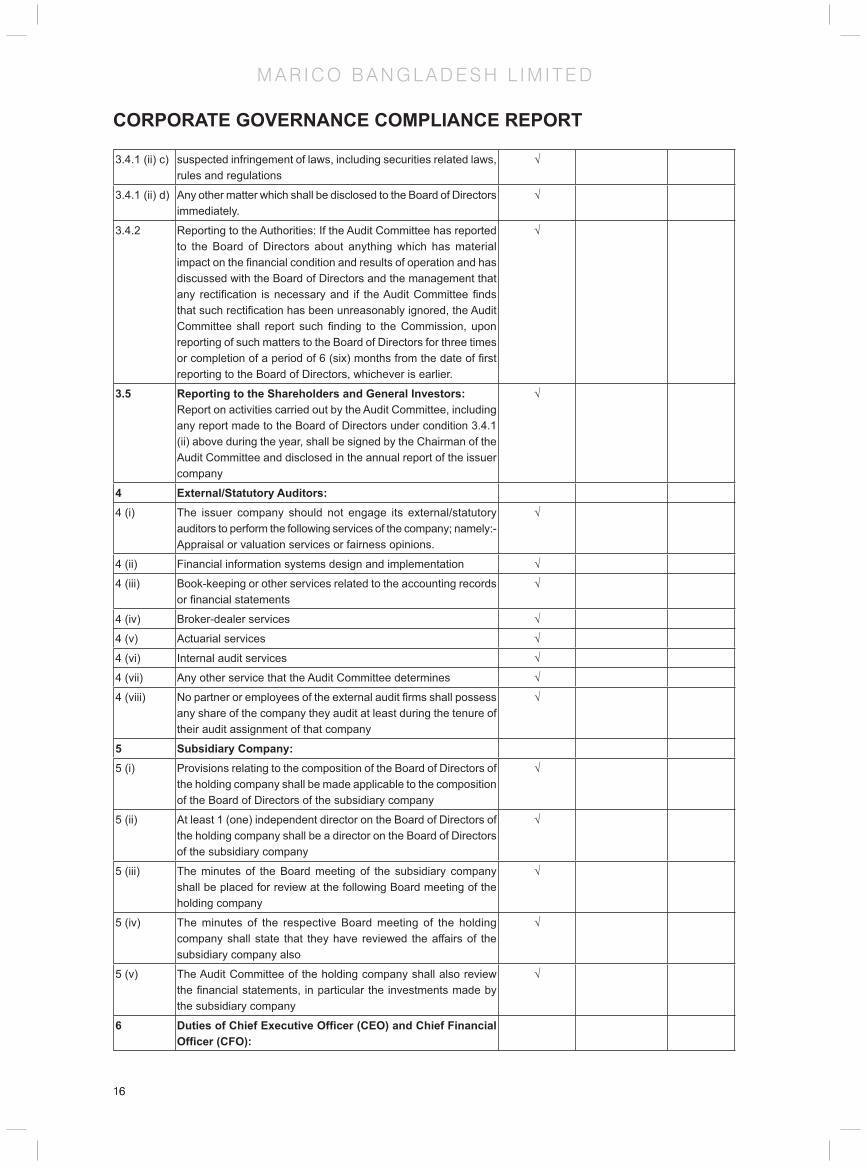
CORPORATE GOVERNANCE COMPLIANCE REPORT
3.4.1 (ii) c) suspected infringement of laws, including securities related laws, rules and regulations
√
3.4.1 (ii) d) Any other matter which shall be disclosed to the Board of Directors immediately.
√
3.4.2 Reporting to the Authorities: If the Audit Committee has reported to the Board of Directors about anything which has material impact on the fi nancial condition and results of operation and has discussed with the Board of Directors and the management that any rectifi cation is necessary and if the Audit Committee fi nds that such rectifi cation has been unreasonably ignored, the Audit Committee shall report such fi nding to the Commission, upon reporting of such matters to the Board of Directors for three times or completion of a period of 6 (six) months from the date of fi rst reporting to the Board of Directors, whichever is earlier.
√
3.5 Reporting to the Shareholders and General Investors: Report on activities carried out by the Audit Committee, including any report made to the Board of Directors under condition 3.4.1 (ii) above during the year, shall be signed by the Chairman of the Audit Committee and disclosed in the annual report of the issuer company
√
4 External/Statutory Auditors:4 (i) The issuer company should not engage its external/statutory
auditors to perform the following services of the company; namely:- Appraisal or valuation services or fairness opinions.
√
4 (ii) Financial information systems design and implementation √
4 (iii) Book-keeping or other services related to the accounting records or fi nancial statements
√
4 (iv) Broker-dealer services √
4 (v) Actuarial services √
4 (vi) Internal audit services √
4 (vii) Any other service that the Audit Committee determines √
4 (viii) No partner or employees of the external audit fi rms shall possess any share of the company they audit at least during the tenure of their audit assignment of that company
√
5 Subsidiary Company:5 (i) Provisions relating to the composition of the Board of Directors of
the holding company shall be made applicable to the composition of the Board of Directors of the subsidiary company
√
5 (ii) At least 1 (one) independent director on the Board of Directors of the holding company shall be a director on the Board of Directors of the subsidiary company
√
5 (iii) The minutes of the Board meeting of the subsidiary company shall be placed for review at the following Board meeting of the holding company
√
5 (iv) The minutes of the respective Board meeting of the holding company shall state that they have reviewed the affairs of the subsidiary company also
√
5 (v) The Audit Committee of the holding company shall also review the fi nancial statements, in particular the investments made by the subsidiary company
√
6 Duties of Chief Executive Offi cer (CEO) and Chief Financial Offi cer (CFO):

17
M A R I C O B A N G L A D E S H L I M I T E D
17
CORPORATE GOVERNANCE COMPLIANCE REPORT
6 (i) The CEO and CFO shall certify to the Board that:- They have reviewed fi nancial statements for the year and that to the best of their knowledge and belief:
√
6 (i) a) these statements do not contain any materially untrue statement or omit any material fact or contain statements that might be misleading.
√
6 (i) b) these statements together present a true and fair view of the company’s affairs and are in compliance with existing accounting standards and applicable laws.
√
6 (ii) There are, to the best of knowledge and belief, no transactions entered into by the company during the year which are fraudulent, illegal or violation of the company’s code of conduct.
√
7 Reporting and Compliance of Corporate Governance:7 (i) The company shall obtain a certificate from a Professional
Accountant/Secretary (Chartered Accountant/Cost & Management Accountant/Chartered Secretary) regarding compliance of conditions of Corporate Governance Guidelines of the Commission and shall send the same to the shareholders along with the Annual Report on a yearly basis.
√
7 (ii) The directors of the company shall state, in accordance with the Annexure attached, in the directors’ report whether the company has complied with these conditions.
√
Board of Directors
(i) Composition and categories of Directors :-
Name Category
Mr. Saugata Gupta Additional Director (w.e.f. April 23, 2013)
Mr. Milind Sarwate Director
Mr. B. Sridhar Additional Director (w.e.f. April 23, 2013)
Mr. Rohit Jaiswal Director (Managing Director till April 23, 2013; continues as Director)
Mr. Aditya Shome Managing Director (w.e.f. April 23, 2013)
Mrs. Rupali Chowdhury Independent Director
Mr. Ghulam Mostafa Independent Director
(ii) Attendance of each Director at the Board meetings and the last Annual General Meeting:
Four meetings of the Board of Directors were held during the period April 1, 2012 to March 31, 2013.
The attendance record of all directors is as under:-
Names of Directors No. of Board Meetings Attendance at Last AGM
Held Attended
Mr. Harsh C. Mariwala 4 1 No
Mr. Milind Sarwate 4 1 Yes
Mr. Vijay Subramaniam 4 4 Yes
Mr. Debashish Neogi 4 0 No
Mr. Rohit Jaiswal 4 4 Yes
Mr. Aditya Shome 3 3 Yes
Mrs. Rupali Chowdhury 4 4 Yes
Mr. Ghulam Mostafa 4 3 Yes

18
M A R I C O B A N G L A D E S H L I M I T E D
18
CORPORATE GOVERNANCE COMPLIANCE REPORT(iii) Audit committee
Constitution:
The Audit Committee was constituted by the Board of Directors at its meeting held on November 26, 2009. The Audit Committee was last re-constituted by the Board of Directors on April 23, 2013.
The Audit Committee now comprises the following Members:
Mrs. Rupali Chowdhury Chairman
Mr. B. Sridhar Member
Mr. Aditya Shome Member
Mr. Sorwar Alam Secretary to the committee
The Audit Committee reports to the Board of Directors. It usually notifi es Board of Directors along with oversight of the Company’s fi nancial reporting process and the disclosure of its fi nancial information to ensure that the fi nancial statement is correct, suffi cient and credible and review internal audit reports fi ndings.
The Committee had 3 meeting during the reporting period April 1, 2012 to March 31, 2013.
Names of Directors No. of Board Meetings
Held Attended
Mrs. Rupali Chowdhury 3 3
Mr. Vijay Subramaniam 3 2
Mr. Rohit Jaiswal 3 3
Remuneration Policy of the Company for Members of the Board
> Remuneration Policy for Executive Director
The Marico Board presently consists of only one executive director namely Mr. Aditya Shome, Managing Director. Therefore, the remuneration policy for executive directors presently covers only the Managing Director.
The remuneration of the Managing Director is governed by the agreement of his appointment. The remuneration to the MD comprises of two broad terms – Fixed Remuneration and Variable remuneration in the form of performance incentive. The performance incentive is based on internally developed detailed performance related matrix which is verifi ed by the HR department.
> Remuneration Policy for Non-Executive Director
Non-Executive Directors and Independent Directors only get sitting fees for Board of Directors’ meetings and fees to attend Committee Meetings.
General Body Meetings
Annual General Meetings
Year Venue Date Time2009-10 Mouchak, Kaliakoir, Gazipur Company’s Factory Premises January 19, 2010 11:00 AM
2010-11 Army Golf Club, Airport Road, Dhaka June 6, 2011 10:30 AM
2011-12 Army Golf Club, Airport Road, Dhaka July 19, 2012 10:30 AM
There was no Special Resolution passed at last General Meetings
Means of Communication
Price sensitive information, quarterly, half-yearly and annual results for Marico Bangladesh Limited are published in two daily newspaper one English and another in Bengali newspaper. The company circulates analyst notes to investors and stock exchanges quarterly. All offi cial fi nancial results and price sensitive information are communicated by the Company through its corporate website - www.maricobd.com. The Management Discussion and Analysis Report form part of the Annual Report.

19
M A R I C O B A N G L A D E S H L I M I T E D
19
CORPORATE GOVERNANCE COMPLIANCE REPORT General Shareholders Information
Details of AGM
AGM–Date, time and Venue : 10.30 A.M. Monday, August 19, 2013 Radisson Blu Water Garden Hotel Dhaka, Airport Road Dhaka Cantonment, Dhaka 1206, Bangladesh.
Financial Year : April 01, 2012 - March 31, 2013
Record Date : Tuesday, July 02, 2013
Dividend Paid & Recommended : Interim Cash Dividend @100% on Face Value Tk. 10 each Final Cash Dividend @50% on Face Value Tk. 10 each
Dividend Payment Date : Paid within 30 days from decision of board meeting October 22, 2012 and proposed payment within 30 days of approval at AGM
Listing on Stock Exchanges : Dhaka Stock Exchange Limited (DSE),Chittagong Stock Exchange Limited (CSE) Listing fees upto December 31, 2013 has been paid.
Stock /Scrip Code : DSE – MARICO CSE – MARICO
ISIN number : BD0481MRICO6
Category : Chemical & Others
Investors’ enquiry : +88(02)8931202, Ext-100, 102 [email protected] www.maricobd.com
Stock Price Information and Stock Performance
Quarterly Stock Price
Our common stock is traded on the Dhaka Stock Exchange and Chittagong Stock Exchange under the symbol MARICO. On July 2, 2013, there were 2,566 registered holders of our common stock on record. The high and low common stock prices per share in Taka were as follows:
Quarter Ended June 30 September 31 December 31 March 31 Fiscal YearApril 01, 2012 – March 31, 2013
High Tk. 424.00 Tk. 395.00 Tk. 439.80 Tk. 443.10 Tk. 443.10
Low Tk. 355.00 Tk. 356.00 Tk. 370.00 Tk. 350.50 Tk. 350.50
Securities Transactions Insider Trading Policy
The Company has a formal Insider Trading Policy and Disclosure of Dealings in Securities Policy on dealings in the securities of the Company, which sets out the implications of insider trading and guidance on such dealings. The policy has been distributed to the directors and offi cers. In compliance with SEC (Prohibition of Insider Trading) Rules, 1995 & relevant notifi cations on best practices on dealing in securities, the Company issues circulars to its Directors and offi cers informing that the Company and its offi cers must not deal in listed securities of the Company two month before the release of the full-year results and before

20
M A R I C O B A N G L A D E S H L I M I T E D
20
CORPORATE GOVERNANCE COMPLIANCE REPORTclosing day of quarterly fi nancial statements to the day of board meeting to be held and before the release of quarterly results, and if they are in possession of unpublished price-sensitive information.
Pattern of Shareholdings on Record Date-July 02, 2013
Particulars No of Shares PercentageParent Company:Marico Limited 28,349,993 90.00%
Other Related Parties:Board of Directors:Saugata Gupta 1
Milind Sarwate 1
B. Sridhar 1
Rohit Jaiswal 1
Aditya Shome, Managing Director 1
Ghulam Mostafa, Independent Director –
Rupali Chowdhury, Independent Director –
Iqbal Chowdhury, CFO and Spouse and Minor Children: 6,200
Balaji K.S. Head of Internal Audit and Spouse and Minor Children: 1
Sorwar Alam, Company Secretary and Spouse and Minor Children: 1,500
Executives (Top 5 Salaried Person Other than MD, CFO, HIA, CS):Ashiqur Rahman –
Ipsit Chakrabarti –
Subir De –
Md. Nazim Uddin –
Saiful Alam –
Percentage of Shareholding-Marico Bangladesh Limited
Category No of Shares PercentageMarico Limited 28,350,000 90.00%
Institutional SHs 2,608,750 8.30%
Individual SHs 541,250 1.7%
Total 31,500,000 100%
90%
8.30%
1.70%
Marico Limited IndiaInstitutional SHsIndividual SHs

21
M A R I C O B A N G L A D E S H L I M I T E D
21
ANNEXURE TO THE CORPORATE GOVERNANCE REPORTCorporate Governance Compliance Certifi cate
Certifi cate of Compliance to the Shareholders of Marico Bangladesh Limited(As required under the BSEC Guidelines)
We have examined compliance to the BSEC guidelines on Corporate Governance by Marico Bangladesh Limited for the year ended 31st March 2013. These guidelines relate to the Notifi cation no. SEC/CMRRCD/2006-158/134/Admin/44 dated 7th August 2012 of Bangladesh Securities and Exchange Commission (BSEC) on Corporate Governance.
Such compliance to the codes of Corporate Governance is the responsibility of the Company. Our examination was limited to the procedures and implementation thereof as adopted by the Management in ensuring compliance to the conditions of Corporate Governance. This is a scrutiny and verifi cation only and not an expression of opinion or audit on the fi nancial statements of the Company.
In our opinion and to the best of our information and according to the explanations provided to us, we certify that, subject to the remarks and observations as reported in the attached compliance statement, the Company has complied with the conditions of Corporate Governance as stipulated in the above mentioned guidelines issued by BSEC.
We also state that such compliance is neither an assurance as to the future viability of the Company nor a certifi cation on the effi ciency or effectiveness with which the Management has conducted the affairs of the Company
AI-Muqutadir AssociatesChartered Secretaries & Consultants
Dhaka, 21st April 2013

22
M A R I C O B A N G L A D E S H L I M I T E D
22
SAUGATA GUPTAChairman
Saugata Gupta, CEO, Marico Limited leads the Company’s operations in India and the International markets. Saugata joined Marico Limited in January 2004 as head of Marketing.
In the year 2007, he was elevated to become the CEO of the Company’s India business. Prior to joining Marico, Saugata was Chief of Marketing and Group Sales at ICICI Prudential and was part of the start up team that was instrumental in establishing ICICI Prudential as the largest private sector Insurance fi rm in the country. Saugata started his career with Cadbury’s where he spent 9 years in various roles in Sales and Marketing. His last role was Marketing Manager - Chocolates.
Saugata has 20 years of experience primarily in FMCG sector. He has an engineering degree from IIT Kharagpur and a Management degree from IIM Bangalore.
MILIND SARWATEDirector
Milind Sarwate, is Marico’s Group CFO and a member of its Group Executive Committee. Milind’s current role at Marico covers Corporate Finance, Legal & Secretarial, M&A, Investor Relations, Internal Audit.
He has about 30 years of experience in Finance, HR, Strategic Planning, Corporate Development and Product Supply, across three organizations- Marico, Godrej and Hoechst (now, Sanofi Aventis).
Milind is a Chartered Accountant, Cost Accountant and Company Secretary (1983-84).
B. SRIDHARDirector
B. Sridhar is the EVP & Business Head - International Markets at Marico Limited.
Sridhar brings with him 18 years of experience and currently heads Marico’s International Units of Marico Bangladesh Limited, EM SEANS, Marico Middle East & Rest of Africa.
He has led Sales, Business Finance and Supply Chain for Marico’s India business in the past where he was responsible for developing and deploying the strategic road map for the above mentioned functions.
Sridhar holds a B-Tech in Electronics from IT BHU and is a MBA from XLRI Jamshedpur.
ROHIT JAISWALDirector
Rohit Jaiswal is currently the Regional Head- Marico Middle East & North Africa. He was the Managing Director of Marico Bangladesh Limited till April 23, 2013.
Rohit is a commerce graduate (a University topper & Gold Medal list) and holds his management degree from Indian Institute of Management – Bangalore. He has over 13 years of experience in Customer Management & Marketing. Rohit brings with him years of rich experience in the consumer goods industry with specialization in Trade Marketing & Customer Management.
ADITYA SHOMEManaging Director
Aditya Shome is appointed as Managing Director of Marico Bangladesh Limited from April 23, 2013. Prior to that, he was the CFO and Executive Director of Marico Bangladesh Limited.
Prior to joining Bangladesh, Aditya was the Head of Finance (MENA) & Country Guardian (Egypt Operations) in Marico Limited & has held management positions in diverse manufacturing companies; petrochemicals, FMCG and engineering products. He qualifi ed Cost and Works Management Accountancy from ICWA in India.
BOARD OF DIRECTORS

23
M A R I C O B A N G L A D E S H L I M I T E D
23
BOARD OF DIRECTORSGHULAM MOSTAFAIndependent Director
Mr. Ghulam Mostafa is the Independent Director since 31st December, 2009.
Mr. Mostafa is the Managing Director of Kallol Group of Companies. His group of companies is in the business of manufacturing, marketing and distribution of FMCG & Food products. He was awarded CIP status three times and highest VAT payer in business category twice by the NBR.
RUPALI CHOWDHURYIndependent Director
Mrs. Rupali Chowdhury is the Independent Director since 31st December, 2009. Mrs. Chowdhury is also the Managing Director of Berger Paints Bangladesh Limited and Chairman & Managing Director of Jenson & Nicholson (Bangladesh) Limited. She did her MBA from IBA and Bachelor in Chemistry from Chittagong University. She is involved with different trade bodies including FICCI wherein she is a Member of the Executive Committee. She brings with her a years of rich experience of managing various functions at Berger Paints.

24
M A R I C O B A N G L A D E S H L I M I T E D
24
DIRECTORS’ REPORTTo the Members
Your Board of Directors (‘Board’) are pleased to present the Fourth Annual Report of your Company, Marico Bangladesh Limited, for the year ended March 31, 2013 (‘the year under review’, ‘the year’ or ‘FY13’) after being listed on the stock exchanges.
In line with the requirements of the compliance with section 184 of the Companies Act, 1994, Stock Exchanges regulations and Bangladesh Securities & Exchange Commission Order No.SEC/CMRRCD/2006-158/134/Admin/44 dated August 7, 2012, your Company has been presenting directors’ report. This discussion therefore covers the fi nancial results and other developments during the period April 2012 – March 2013 in respect of Marico Bangladesh Limited’s business in Bangladesh.
Prime Business Activities of your company
The prime business activities of the company continued to be manufacturing and marketing of Fast Moving Consumer Goods (‘FMCG’). The company is the manufacturer and marketer of well-known brands like Parachute, Parachute Advansed, Parachute Beliphool, Parachute Advansed Cooling Hair Oil, Haircode, Nihar, Saffola, Livon etc.
Launching of New Products
Your company has launched a few new products like Haircode Active in 3 different variants & Livon Silky Potion. These new products are promising and potential for future growth.
Divestment of Soap Brands
The company divested its soap brands ‘Aromatic’ and ‘Camelia’. Certain Fixed Assets concerning to the soap business as well as trademarks were sold to TLRA Holdings Limited (TLRA) on March 25, 2013. The Company in its focused pursuit of sustainable profi table growth recognised that the soap business had limited fi tment in its portfolio. Hence, the transactions were a logical subset of its business strategy aimed at sustainable growth and brand rationalisation.
Related Party Transaction
Related parties transactions of the company for the fi nancial year (FY13) were with Marico Limited, the parent company and Marico Middle East FZE, a subsidiary of the parent company. Details for transactions have been enclosed to notes 27 of the fi nancial statements.
Directors’ Responsibilities for Financial Statements
The Statement of the Director’s Responsibilities and Management’s Report on Internal Control over Financial Reporting for fi nancial statements are given in Annexure -1 and 2.
Corporate and Financial Reporting Framework
In accordance with Bangladesh Securities and Exchange Commission’s Notifi cation No-SEC/CMRRCD/2006-158/134/Admin/44 dated August 7, 2012, the Directors are pleased to confi rm the following:
a) The fi nancial statements together with the notes thereof have been drawn up in conformity with the Companies Act, 1994 and Bangladesh Securities and Exchange Rules, 1987. These statements present fairly the Company’s state of affairs, the results of its operations, cash fl ow and changes in equity.
b) Proper books of account of the Company have been maintained.
c) Appropriate accounting policies have been consistently applied in preparation of the fi nancial statements and the accounting estimates are based on reasonable and prudent judgment.
d) International Accounting Standards, as applicable in Bangladesh, have been followed in preparation of the fi nancial statements.
e) The systems of internal controls are sound and have been effectively implemented and monitored.
f) There are no signifi cant doubts about the Company’s ability to continue as a going concern.
g) The signifi cant deviations from last year in operating results of the Company have been highlighted in the report and reasons thereof have been explained.

25
M A R I C O B A N G L A D E S H L I M I T E D
25
DIRECTORS’ REPORTh) The key operating and fi nancial data for the last fi ve years are annexed.
Management Discussion and Analysis
An Annexure to this Report contains a detailed Management Discussion and Analysis, which, inter alia, covers the following:
• FMCG -Industry Structure and Development
• Opportunities and Threats
• Risks and Concerns
• Internal Control Systems and their Adequacy
• Distribution
• Capacity Building
• Quality Assurance
• Technology in Marico
• Human Resources and Development
• Key Brands’ Performance
• New Launched Products
• Cost Structure of the Company
• Outlook
In addition, a review of operations of your Company has been given in this report.
Directors of the Company
Restructuring in Board of Directors
I. Mr. Harsh C. Mariwala, Mr. Vijay Subramaniam and Mr. Debashish Neogi, Directors of the Company have resigned from the Board of the Company w.e.f April 23, 2013 and the Board has approved their resignation.
II. Mr. Saugata Gupta, Mr. B. Sridhar have been appointed as Additional Director of the company w.e.f. April 23, 2013. They will hold offi ce as Additional Directors till the ensuing Annual General Meeting of the Company. Mr. Saugata Gupta has been appointed as the Chairman of the Board of Directors of the Company on the said date.
III. Mr. Rohit Jaiswal, Managing Director of the company has moved out of Bangladesh to take charge of Marico Middle East & North Africa as Regional Head and has resigned from Marico Bangladesh Limited Board as Managing Director. The Board has approved his resignation with effect from close of working hours on April 23, 2013. He will however; continue to be a Director on the Board of the Company.
Appointment of New Managing Director
Mr. Aditya Shome, erstwhile Executive Director & CFO of Marico Bangladesh Limited has been appointed as Managing Director of the Company for fi ve years, with effect from April 23, 2013 subject to approval in the 13th Annual General Meeting of the company.
Directors’ Retirement and Re-election
Mr. Saugata Gupta and Mr. B. Sridhar (nominated to the Board of Marico Bangladesh Limited by Marico Limited (holding/parent company) were appointed as Additional Directors on April 23, 2013.
The Board of Directors has recommended for re-appointment of Mr. Saugata Gupta and Mr. B. Sridhar at ensuing annual general meeting.
In addition, Mr. Milind Sarwate, Director of the company, will retire by rotation as per relevant provision of the Companies Act, 1994 and relevant clause of Articles of Association of the company and being eligible, offers himself for re-appointment.

26
M A R I C O B A N G L A D E S H L I M I T E D
26
Corporate Governance
Marico Bangladesh Limited adheres to good Corporate Governance principles, as described in Corporate Governance Report.
The Company has also complied with all the requirements of Corporate Governance as required by the Bangladesh Securities and Exchange Commission. Accordingly, Corporate Governance Compliance Certifi cate is shown in the annexure of the Corporate Governance Report.
Results of Operations
Financial Year Ended March 31, 2013 (FY13)
Tk in Cr, except per share amounts 2013 2012Turnover 612 604
Net earnings 87 54
Net earnings per share 27.53 17
Dividends per share 15 10
Operating cash fl ow 62.47 -16.87
Return on assets 18.50% 12.15%
Return on equity 30.12% 21.15%
Contribution by National Exchequer
During the reporting period, your company paid Tk. 150 Crore (appx.) to the National Exchequer in the form of Corporate Income Tax, Customs Duties, Supplementary Duties, VAT and others.
Distribution to Equity Shareholders
Dividend Trend:
The Company has declared the following dividends from the time of its listing on the stock exchanges;
In FY 2008-09, 25% cash dividend
In FY 2009-11 (18 months period), a total of 45% (20% & 25%) cash dividend
In FY 2011-12, 100% interim cash dividend which was considered as fi nal dividend
Declaration of Interim Cash Dividend for H1FY13:
The Board declared 100% interim cash dividend on an equity per share Tk. 10 i.e. total dividend Tk. 31.50 crore on October 22, 2012 which has been paid to shareholders subsequently.
Final Dividend for FY13:
The Board of Directors has recommended as fi nal cash dividend @50% on an equity share Tk. 10. In aggregate, the Board has declared cash dividend @150% including interim dividend for the fi nancial year.
Reserves
The total reserves of the company stood Tk. 284 Crore, details of which is shown in the Statement of Financial Position as share premium and retained earnings to the fi nancial statements.
Events Subsequent to the Statement of Financial Position
For the year ended March 31, 2013, the Board of Directors recommended fi nal cash dividend @ 50% per share at 75th board meeting held on April 23, 2013.
Apart that, there are no other events identifi ed after the statement of fi nancial position date which might be material.
Shareholder Information & Substantial Shareholders
The distribution of shareholding and market value of shares is given in the Corporate Governance Report.
DIRECTORS’ REPORT

27
M A R I C O B A N G L A D E S H L I M I T E D
27
Appointment of Auditors
The auditors, M/s. A. Qasem & Co., Chartered Accountants, will retire at the conclusion of the ensuing Annual General Meeting and being eligible under Section 210 of the Companies Act, 1994 read with Bangladesh Securities and Exchange Commission Order No. SEC /CFD-71/2001/Admin/02/05 dated January 03, 2002, offer themselves for reappointment with proposed Audit Fees of Tk. 4,00,000/-.
Acknowledgement
The members of the Board of Directors would like to take this opportunity to express their heartfelt thanks to all stakeholders such as employees, customers, consumers, Banks and fi nancial institutions, Regulatory bodies, Auditors, BSEC, DSE, CSE, CDBL, Business Associates and fi nally the shareholders for their immense support and contribution towards the success of the Company.
On Behalf of Board of Directors
Sd/-
Aditya ShomeManaging Director
April 23, 2013
DIRECTORS’ REPORT

28
M A R I C O B A N G L A D E S H L I M I T E D
28
Directors’ Responsibilities for Financial Statements (Annexure-1)
The directors of the company are responsible for the integrity and accuracy of the fi nancial statements. The board believes that the fi nancial statements for the year ended on March 31, 2013 have been prepared in conformity with Bangladesh Accounting Standard (BAS), BFRS/IFRS, Companies Act, 1994, BSEC guidelines, Stock Exchanges Listing Regulations appropriate in the circumstances. In preparing the fi nancial statements, management with the consultation of the board make informed judgments and estimates wherever necessary, to refl ect the expected effects of events and transactions that have not been completed. The Company’s disclosure controls and procedures ensure that material information required to be disclosed is recorded, processed, summarized and communicated to management and reported within the required time periods. In meeting its responsibility for the reliability of the fi nancial statements, management relies on a system of internal accounting control. This system is designed to provide reasonable assurance that assets are safeguarded and transactions are executed in accordance with the management’s authorization and recorded properly to permit the preparation of fi nancial statements in accordance with BAS/BFRS/IFRS. The design of this system recognizes that errors or irregularities may occur and that estimates and judgments are required to assess the relative cost and expected benefi ts of the controls. Directors believe that the Company’s internal accounting controls provide reasonable assurance that errors or irregularities that could be material to the fi nancial statements are prevented or would be detected within a timely period. The Audit Committee of the Board of Directors, which is composed including of independent directors, is responsible for overseeing the Company’s fi nancial reporting process. The Audit Committee meets with management and sees the report of the Company’s internal auditors periodically to review the work of each and to monitor the discharge by each of its responsibilities. The independent auditors are engaged to express an opinion on the Company’s fi nancial statements and on the Company’s internal control over fi nancial reporting. Their opinions are based on procedures that they believe to be suffi cient to provide reasonable assurance that the fi nancial statements contain no material errors and that the Company’s internal controls are effective.
On Behalf of Board of Directors
Sd/-
Aditya ShomeManaging Director
April 23, 2013
ANNEXURE TO THE DIRECTORS’ REPORT
MANAGEMENT’S REPORT ON INTERNAL CONTROL OVER FINANCIAL REPORTING (ANNEXURE-2)
The Company’s management is responsible for establishing and maintaining adequate internal control over fi nancial reporting for the Company. With the participation of the Chief Financial Offi cer and Head of Internal Audit, management conducted an evaluation of the effectiveness of internal control over fi nancial reporting based on the framework and the criteria established in Internal Control – Integrated Framework, issued by the Audit Committee. Based on this evaluation, management has concluded that internal control over fi nancial reporting was effective as of March 31, 2013. The Company’s auditor, M/s. A. Qasem & Co., Chartered Accountants, statutory auditors enlisted with The Institute of Chartered Accountants of Bangladesh (ICAB), has issued an audit report on the fi nancial statements.
Sd/-
K.S. BalajiHead of Internal Audit

29
M A R I C O B A N G L A D E S H L I M I T E D
29
To the Shareholders of Marico Bangladesh Limited
We have audited the accompanying Financial Statements of Marico Bangladesh Limited which comprise the Statement of Financial Position as at 31 March 2013 and the Statement of Comprehensive Income, Statement of Changes in Equity and Statement of Cash Flows for the year then ended, and a summary of signifi cant accounting policies and other explanatory notes.
Management’s Responsibility for the Financial Statements
Management is responsible for the preparation and fair presentation of these fi nancial statements in accordance with Bangladesh Financial Reporting Standards (BFRS), and for such internal control as management determines is necessary to enable the preparation of fi nancial statements that are free from material misstatement, whether due to fraud or error.
Auditors’ Responsibility
Our responsibility is to express an opinion on these fi nancial statements based on our audit. We conducted our audit in accordance with Bangladesh Standards on Auditing (BSA). Those standards require that we comply with ethical requirements and plan and perform the audit to obtain reasonable assurance about whether the fi nancial statements are free from material misstatement.
An audit involves performing procedures to obtain audit evidence about the amounts and disclosures in the fi nancial statements. The procedures selected depend on the auditors’ judgment, including the assessment of the risks of material misstatement of the fi nancial statements, whether due to fraud or error. In making those risk assessments, the auditors consider internal control relevant to the entity’s preparation and fair presentation of the fi nancial statements in order to design audit procedures that are appropriate in the circumstances, but not for the purpose of expressing an opinion on the effectiveness of the entity’s internal control. An audit also includes evaluating the appropriateness of accounting policies used and the reasonableness of accounting estimates made by management, as well as evaluating the overall presentation of the fi nancial statements.
We believe that the audit evidence we have obtained is suffi cient and appropriate to provide a basis for our audit opinion.
Opinion
In our opinion, the fi nancial statements present fairly, in all material respects, the fi nancial position of Marico Bangladesh Limited as at 31 March 2013 and its fi nancial performance and its cash fl ows for the year then ended in accordance with Bangladesh Financial Reporting Standards (BFRS), and comply with applicable sections of the Companies Act 1994, the Securities and Exchange Rules 1987 and other applicable laws and regulations.
We also report that:
(a) We have obtained all the information and explanations which to the best of our knowledge and belief were necessary for the purpose of our audit and made due verifi cation thereof.
(b) In our opinion, proper books of account as required by law have been kept by the Company so far as it appeared from our examination of those books.
(c) The statement of fi nancial position, and statement of comprehensive income dealt with by the report are in agreement with the books of account and returns.
(d) The expenditure incurred was for the purposes of the Company’s business.
_______________
A. Qasem & Co.
Dhaka, 23 April 2013 Chartered Accountants
AUDITORS’ REPORT

30
M A R I C O B A N G L A D E S H L I M I T E D
30
BALANCE SHEETNote 31 March
2013 31 March
201231 March
2013 31 March
2012 Taka Taka Rs. Crore Rs. Crore
AssetsProperty, plant and equipment 4 836,558,863 325,642,856 58.14 20.22
Capital work in progress 28,157,695 16,275,280 1.96 1.01
Intangible assets 4 – 62,500 – 0.01
Deferred tax assets 5 39,235,721 88,282,527 2.72 5.48
Non-current assets 903,952,279 430,263,163 62.82 26.72
Inventories 6 1,021,556,368 1,777,938,918 71.01 110.41
Accrued interest 55,018,956 30,632,604 3.82 1.90
Advance income tax 7 920,345,408 717,730,520 63.96 44.57
Advances, deposits and prepayments 8 216,454,120 464,859,208 15.04 28.87
Fixed deposits 9 2,014,917,416 610,000,000 140.04 37.88
Cash and cash equivalents 10 50,833,931 171,207,069 3.53 10.63
Current assets 4,279,126,199 3,772,368,319 297.40 234.26 Total assets 5,183,078,478 4,202,631,482 360.22 260.98
Equity and LiabilitiesEquity Share capital 11 315,000,000 315,000,000 21.89 19.56
Share premium 252,000,000 252,000,000 17.51 15.65
Retained earnings 2,588,543,247 2,036,194,216 179.90 126.45
Total equity 3,155,543,247 2,603,194,216 219.30 161.66
Liabilities
Provision for gratuity 12 15,956,603 12,388,093 1.12 0.76
Provision for leave encashment 13 9,404,119 6,419,607 0.65 0.40
Non-current liabilities 25,360,722 18,807,700 1.77 1.16
Short term fi nance 14 38,534,964 100,000,000 2.68 6.21
Liability for expenses 15 433,481,827 269,768,968 30.13 16.75
Provision for income tax 16 1,080,417,993 826,822,981 75.09 51.35
Trade creditors 17 120,138,849 174,605,728 8.35 10.84
Payable to holding company 18 256,466,179 177,772,739 17.82 11.04
Other liabilities 19 73,134,697 31,659,150 5.08 1.97
Current liabilities 2,002,174,509 1,580,629,566 139.15 98.16 Total liabilities 2,027,535,231 1,599,437,266 140.92 99.32
Total equity and liabilities 5,183,078,478 4,202,631,482 360.22 260.98 ___________________________________________________________________________________________________The annexed notes 1 to 33 form an integral part of these fi nancial statements.
_______________ ________________ _______________ Company Secretary Director Managing Director
As per our annexed report of same date. _________________ A. Qasem & Co. Dhaka, 23 April 2013 Chartered Accountants
Note: The exchange rate use to convert Taka to Rs.<0.695>/(Previous year Taka to Rs.<0.621>)

31
M A R I C O B A N G L A D E S H L I M I T E D
31
___________________________________________________________________________________________________The annexed notes 1 to 33 form an integral part of these fi nancial statements.
_______________ ________________ _______________ Company Secretary Director Managing Director
As per our annexed report of same date.
_________________ A. Qasem & Co. Dhaka, 23 April 2013 Chartered Accountants
STATEMENT OF COMPREHENSIVE INCOME FOR THE YEAR ENDED 31 MARCH 2013
Note 31 March 2013
31 March 2012
31 March 2013
31 March 2012
Taka Taka Rs. Crore Rs. Crore
Revenue 20 6,119,893,866 6,036,260,121 425.33 374.85
Cost of sales 21 (3,912,943,094) (4,560,022,466) (271.95) (283.18)
Gross profi t 2,206,950,772 1,476,237,655 153.38 91.67
Marketing, selling and distribution expenses 22 (754,789,774) (568,513,132) (52.46) (35.30)
General and administration expenses 23 (504,086,748) (360,187,456) (35.03) (22.37)
Profi t from operation 948,074,250 547,537,067 65.89 33.95
Other income 24 221,916,599 154,598,079 15.42 9.60
Profi t before income tax 1,169,990,849 702,135,146 81.31 43.55
Income tax expense 25 (302,641,818) (166,515,359) (21.03) (10.34)
Profi t for the year 867,349,031 535,619,787 60.28 33.21
Other comprehensive income – – – –
Total comprehensive income for the year 867,349,031 535,619,787 60.28 33.21
Earnings per share
Basic earnings per share (par value of Tk 10) 26 27.53 17.00 – –
Note: The exchange rate use to convert Taka to Rs.<0.695>/(Previous year Taka to Rs.<0.621>)

32
M A R I C O B A N G L A D E S H L I M I T E D
32
CASH FLOWS STATEME NT
31 March 2013
31 March 2012
31 March 2013
31 March 2012
Taka Taka Rs. Crore Rs. Crore
Cash fl ows from operating activities
Collection from customers 6,151,925,664 6,036,260,121 427.56 374.85
Payment to suppliers and operating expenses (4,120,154,024) (6,314,604,097) (286.35) (392.14)
Net fi nance income/(cost) 1,478,127 (74,300,055) 0.10 (4.61)
Interest received 137,276,311 223,630,323 9.54 13.89
Income tax paid (202,614,889) (402,438,367) (14.08) (24.99)
Net cash fl ows from/(used in) operating activities 1,967,911,189 (531,452,075) 137.17 (33.00)
Cash fl ows from investing activities
Acquisition of fi xed assets (365,771,155) (204,071,590) (25.42) (12.67)
Disposal of fi xed assets 58,869,281 – 4.09 –
Dividend income – 3,754,141 – 0.23
Encashment of investment in quoted shares – 29,619,846 – 1.84
(Investment in)/Encashment of fi xed deposits (1,404,917,416) 1,660,000,000 (97.64) 103.09
Net cash (used in)/ fl ows from investing activities (1,711,819,291) 1,489,302,397 (119.17) 92.49
Cash fl ows from fi nancing activities
Dividend paid (315,000,000) (378,000,000) (21.89) (23.47)
Short term fi nance (61,465,036) (675,256,101) (4.27) (41.93)
Net cash used in fi nancing activities (376,465,036) (1,053,256,101) (26.16) (65.40)
Net decrease in cash and cash equivalents (120,373,138) (95,405,779) (8.16) (5.91)
Opening cash and cash equivalents 171,207,069 266,612,848 11.90 16.56
Closing cash and cash equivalents (Note 10) 50,833,931 171,207,069 3.74 10.65
Note: The exchange rate use to convert Taka to Rs.<0.695>/(Previous year Taka to Rs.<0.621>)

33
M A R I C O B A N G L A D E S H L I M I T E D
33
STATEMENT OF CHANGES IN SHAREHOLDERS’ EQUITY
Sha
re
capi
tal
Sha
re
prem
ium
Fai
r val
ue
rese
rve
Ret
aine
d ea
rnin
gs T
otal
eq
uity
Sha
re
capi
tal
Sha
re
prem
ium
Fai
r va
lue
rese
rve
Ret
aine
d ea
rnin
gs T
otal
eq
uity
Tak
a T
aka
Tak
a T
aka
Tak
a R
s.C
rore
R
s.C
rore
R
s.C
rore
R
s.C
rore
R
s.C
rore
B
alan
ce a
t 1 A
pril
2011
31
5,00
0,00
0 2
52,0
00,0
00
17,
022,
900
1,8
78,5
74,4
29
2,4
62,5
97,3
29
19.
56
15.
65
1.0
6 1
16.6
6 1
52.9
3
Net
pro
fit f
or t
he y
ear
ende
d 31
Mar
ch
2012
– –
– 5
35,6
19,7
87
535
,619
,787
–
–
–
33.
26
33.
26
Fina
l div
iden
d fo
r 201
0-20
11 –
–
– (6
3,00
0,00
0) (6
3,00
0,00
0) –
–
–
(3.9
1) (3
.91)
Inte
rim d
ivid
end
for 2
011-
2012
–
– –
(315
,000
,000
) (3
15,0
00,0
00)
– –
– (1
9.56
) (1
9.56
)
Rea
lisat
ion
of c
hang
e in
the
fai
r va
lue
of
avai
labl
e fo
r sal
e fi n
anci
al a
sset
s–
(17,
022,
900)
2,03
6,19
4,21
6 (1
7,02
2,90
0) –
–
(1.0
6)
- (1
.06)
Bal
ance
at 3
1 M
arch
201
2 3
15,0
00,0
00
252,
000,
000
– -
2,6
03,1
94,2
16
19.
56
15.
65
– 1
26.4
5 16
1.66
Bal
ance
at 1
Apr
il 20
12 3
15,0
00,0
00
252,
000,
000
– 2,
036,
194,
216
2,6
03,1
94,2
16
21.
89
17.
51
– 1
41.5
2 1
80.9
2
Net
pro
fit f
or t
he y
ear
ende
d 31
Mar
ch
2013
–
– 8
67,3
49,0
31
867
,349
,031
–
– 6
0.27
6
0.28
Inte
rim d
ivid
end
for 2
012-
2013
–
–
– (3
15,0
00,0
00)
(315
,000
,000
)–
–
–
(2
1.89
) (2
1.89
)
Bal
ance
at 3
1 M
arch
201
3 3
15,0
00,0
00
252
,000
,000
–
2
,588
,543
,247
3
,155
,543
,247
2
1.89
1
7.51
–
1
79.9
0 2
19.3
1
Not
e: T
he e
xcha
nge
rate
use
to c
onve
rt Ta
ka to
Rs.
<0.6
95>/
(Pre
viou
s ye
ar T
aka
to R
s.<0
.621
>)

34
M A R I C O B A N G L A D E S H L I M I T E D
34
NOTES TO THE FINANCIAL STATEMENTSfor the year ended 31 March 2013
1. Reporting entity
Marico Bangladesh Limited (MBL) was incorporated on 6 September 1999 in Bangladesh under the Companies Act 1994 as a private company limited by shares. Subsequently, the Company converted to "Public Company" limited by shares vide special resolution passed in the extra ordinary general meeting held on 21 September 2008. The Company is a subsidiary of Marico Limited, India and also a listed entity enlisted with Dhaka Stock Exchange Limited (DSE) and Chittagong Stock Exchange Limited (CSE).
1.1 Registered offi ce
The address of the Company's registered offi ce is House # 01, Road # 01, Sector # 01, 4th fl oor, Uttara, Dhaka-1230.
1.2 Nature of Business Activities
The Company is engaged in manufacturing and marketing of branded Fast Moving Consumer Goods under the brand name of Parachute, Beliphool, Nihar, Saffola, Hair Code Active etc in Bangladesh. The Company sells its products with its depot from Dhaka, Chittagong, Bogra, Jessore and Comilla. The Company started its commercial operations from 30 January 2000.
2 Basis of preparation
2.1 Statement of compliance
The fi nancial statements have been prepared in accordance with Bangladesh Financial Reporting Standards (BFRSs).
The fi nancial statements were authorized for issue by the Board of Directors in the 75th Board meeting held on 23 April 2013.
2.2 Basis of measurement
The fi nancial statements have been prepared under the historical cost convention.
2.3 Functional and presentation currency
These fi nancial statements are presented in Bangladesh Taka (BDT), which is the Company's functional currency. All fi nancial information presented in BDT/Taka has been rounded off to the nearest integer.
2.4 Reporting period
The fi nancial statements of the Company covered one year from 1 April 2012 to 31 March 2013.
2.5 Use of estimates and judgments
The preparation of the fi nancial statements requires management to make judgments, estimates and assumptions that affect the application of accounting policies and the reported amount of assets, liabilities, income and expenses. Actual results may differ from these estimates.
Estimates and underlying assumptions are reviewed on an ongoing basis. Revisions to accounting estimates are recognized in the period in which the estimates are revised and in any future periods affected.
2.6 Going concern
The Company has adequate resources to continue in operation for foreseeable future and hence, the fi nancial statements have been prepared on going concern basis. As per management assessment there are no material uncertainties related to events or conditions which may cast signifi cant doubt upon the Company's ability to continue as a going concern.
3 Signifi cant accounting policies
The accounting policies set out below have been applied consistently (otherwise as stated) to all periods presented in these fi nancial statements.

35
M A R I C O B A N G L A D E S H L I M I T E D
35
NOTES TO THE FINANCIAL STATEMENTSfor the year ended 31 March 2013
3.1 Foreign currency
Transactions in foreign currencies are translated to the functional currency (BDT) at exchange rates at the dates of transactions. Monetary assets and liabilities denominated in foreign currencies at reporting date are re-translated into Bangladesh Taka at the exchange rates ruling at the statement of fi nancial position date. Non-monetary assets and liabilities denominated in foreign currencies, stated at historical cost, are translated into Bangladesh Taka at the exchange rate ruling at the date of transaction. Foreign exchange differences arising on translation are recognized in profi t or loss.
3.2 Property, plant and equipment
i) Recognition and measurement
Items of property, plant and equipment are measured at cost less accumulated depreciation and accumulated impairment losses. Cost includes expenditures that are directly attributable to the acquisition of the assets.
Parts of an item of property, plant and equipment having different useful lives, are accounted for as separate items (major components) of property, plant and equipment.
The gain or loss on disposal of an item of property, plant and equipment is determined by comparing the proceeds from disposal with the property amount of the property, plant and equipment and is recognized with other income/general and administrative expenses in profi t or loss.
ii) Subsequent cost
The cost of replacing component of an item of property, plant and equipment is recognized in the carrying amount of the item if it is probable that the future economic benefi ts embodied within the component will fl ow to the company and its cost can be measured reliably. The costs of the day to day servicing of property, plant and equipment are recognized in profi t or loss as incurred.
iii) Depreciation
Depreciation is based on the cost of an asset less its residual value. Signifi cant components of individual assets are assessed and if a component has a useful life that is different from the remainder of that asset, that component is depreciated separately.
Depreciation is recognized in profi t or loss on straight line method over the estimated useful lives of each component of an item of property, plant and equipment. Land is not depreciated. Considering the estimated useful lives of the assets the following rates have been applied in current and comparative years:
Assets Depreciation ratePlant and machinery 10-33%Factory equipment 10-33%Moulds 20-50%Factory building 10-20%Laboratory equipment 20-33%Offi ce equipment 20-50%Vehicles 20-33%Computers 20-33%Furniture 20-33%Fixtures 20-33%
Air conditioner, refrigerator 20-33%
Depreciation methods, useful lives and residual value are reviewed annually and adjusted if appropriate.
Depreciation is charged from the month of acquisition of property, plant and equipment but no depreciation is charged in the month of disposal.

36
M A R I C O B A N G L A D E S H L I M I T E D
36
NOTES TO THE FINANCIAL STATEMENTSfor the year ended 31 March 2013
3.3 Intangible assets
Intangible assets have fi nite useful lives and are stated at cost less accumulated amortization using straight line method. Intangible assets are recognized in accordance with BAS-38. Intangible assets include cost of acquisition of the intellectual property, copyright and other costs incidental to such capital expenditure.
Amortisation
Amortisation is recognized in the income statement on straight line basis over the estimated useful lives of intangible assets from the date they are available for use.
3.4 Impairment
3.4.1 Non-derivative fi nancial assets
A fi nancial asset not classifi ed as at fair value through profi t or loss is assessed at each reporting date to determine whether there is objective evidence that it is impaired. A fi nancial asset is impaired if objective evidence indicates that a loss event has occurred after initial recognition of the asset, and that the loss event had a negative effect on the estimated future cash fl ows of that asset that can be estimated reliably.
Loans and receivables and held-to-maturity investment securities
The Company considers evidence of impairment for loans and receivables and held-to-maturity investment securities at both a specifi c asset and collective levels. All individually signifi cant receivables and held-to-maturity investment securities are assessed for specifi c impairment . Those found not to be specifi cally impaired are then collectively assessed for any impairment that has been incurred but not yet identifi ed. Assets that are not individually signifi cant are collectively assessed for impairment by grouping together assets with similar risk characteristics.
Available-for-sale fi nancial assets
Impairment losses on available-for-sale fi nancial assets are recognised by reclassifying the losses accumulated in the fair value reserve in equity, to profi t or loss. The cumulative loss that is reclassifi ed from equity to profi t or loss is the difference between the acquisition cost, net of any principal repayment and amortisation, and the current fair value, less any impairment loss recognised previously in profi t or loss. Changes in impairment provisions attributable to application of the effective interest method are refl ected as a component of interest income. If, in a subsequent period, the fair value of an impaired available-for-sale debt security increases and the increase can be related objectively to an event occurring after the impairment loss was recognised in profi t or loss, then the impairment loss is reversed, with the amount of the reversal recognised in profi t or loss. However, any subsequent recovery in the fair value of an impaired available-for-sale equity security is recognised in comprehensive income.
3.4.2 Non-fi nancial assets
The carrying amounts of the Company's non-fi nancial assets, other than biological assets, investment property, inventories and deferred tax assets, are reviewed at each reporting date to determine whether there is any indication of impairment. If any such indication exists, then the asset's recoverable amount is estimated. For goodwill, and intangible assets that have indefi nite useful lives or that are not yet available for use, the recoverable amount is estimated each year at the same time. An impairment loss is recognised if the carrying amount of an asset or its related cash generated unit (CGU) exceeds its estimated recoverable amount.
The recoverable amount of an asset or CGU is the greater of its value in use and its fair value less cost to sell. In assessing value in use, the estimated future cash fl ows are discounted to their present value using a pre tax discount rate that refl ects current market assessments of the time value of money and the risks specifi c to the assets or CGU. For the purpose of impairment testing, assets that can not be tested individually are grouped together into the smallest group of assets that generates cash infl ows from continuing use that are largely independent of the cash infl ows of other assets or CGU.
Impairment losses are recognised in profi t or loss. Impairment losses recognised in respect of CGUs are allocated fi rst to reduce the carrying amount of any goodwill allocated to the CGU (group of CGUs), and then to reduce the carrying amounts of the other assets in the CGU (group of CGUs) on a pro rata basis.

37
M A R I C O B A N G L A D E S H L I M I T E D
37
NOTES TO THE FINANCIAL STATEMENTSfor the year ended 31 March 2013
An impairment loss in respect of goodwill is not reversed. For other assets, an impairment loss is reversed only to the extent that the asset's carrying amount does not exceed the carrying amount that would have been determined, net of depreciation or amortisation, if no impairment loss had been recognised.
3.5 Finance income and fi nance costs
Finance income comprises interest income on funds invested (including available-for-sale fi nancial assets), dividend income, gains on the disposal of available-for-sale fi nancial assets. Interest income is recognised as it accrues in profi t or loss, using the effective interest method. Dividend income is recognised in profi t or loss on the date that the Company's right to receive payment is established, which in the case of quoted securities is normally the ex-dividend date.
Finance costs comprise interest expense on borrowings, foreign exchange gain or loss, unwinding of the discount on provisions and contingent consideration, losses on disposal of available-for-sale fi nancial assets, dividends on preference shares classifi ed as liabilities, fair value losses on fi nancial assets at fair value through profi t or loss, impairment losses recognised on fi nancial assets (other than trade receivables).
Borrowing costs that are not directly attributable to the acquisition, construction or production of a qualifying asset are recognised in profi t or loss using the effective interest method.
3.6 Income tax
Income tax expense comprises current and deferred tax. Current tax and deferred tax is recognised in profi t or loss except to the extent that it relates to a business combination, or items recognised directly in equity or in comprehensive income.
Current tax is the expected tax payable or receivable on the taxable income or loss for the year, using tax rates enacted or substantively enacted at the reporting date, and any adjustment to tax payable in respect of previous years. Current tax payable also includes any tax liability arising from the declaration of dividends.
Deferred tax is recognised in respect of temporary differences between the carrying amounts of assets and liabilities for fi nancial reporting purposes and the amounts used for taxation purposes. Deferred tax is measured at the tax rates that are expected to be applied to temporary differences when they reverse, using tax rates enacted or substantively enacted by the reporting date.
Deferred tax assets and liabilities are offset if there is a legally enforceable right to offset current tax liabilities and assets, and they relate to taxes levied by the same tax authority on the same taxable entity, or on different tax entities, but they intend to settle current tax liabilities and assets on a net basis or their tax assets and liabilities will be realised simultaneously.
A deferred tax asset is recognised for unused tax losses, tax credits and deductible temporary differences, to the extent that it is probable that future taxable profi ts will be available against which they can be utilised. Deferred tax assets are reviewed at each reporting date and are reduced to the extent that it is no longer probable that the related tax benefi t will be realised.
3.7 Revenue
Revenue from sale of goods is measured at fair value of the consideration received or receivable, net off return and allowance, trade discount, volume rebates exclusive of VAT. Revenue is recognized when the risk and reward of the ownership is transferred to the buyer, recovery of the consideration is probable, the associated cost and possible return of goods can be estimated reliably, and there is no continuing management involvement with the goods sold. Transfer of risk and rewards occurs for the sale of goods when the product is delivered along with dispatch documents and invoiced to customers.
3.8 Inventories
Inventories are measured at the lower of cost and net realisable value. The cost of inventories is based on weighted average cost method, and includes expenditure incurred in acquiring the inventories, production or conversion costs, and

38
M A R I C O B A N G L A D E S H L I M I T E D
38
NOTES TO THE FINANCIAL STATEMENTSfor the year ended 31 March 2013
other costs incurred in bringing them to their existing location and condition. In the case of manufactured inventories and work in progress, cost includes an appropriate share of production overheads based on normal operating capacity.
Net realisable value is the estimated selling price in the ordinary course of business, less the estimated costs of completion and selling expenses.
3.9 Provisions
A provision is recognized in the statement of fi nancial position when the Company has a legal or constructive obligation as a result of past event and it is probable that an outfl ow of resources embodying economic benefi ts will be required to settle the obligation and a reliable estimate thereof can be made.
3.10 Employee benefi ts
(i) Defi ned benefi t plans
A defi ned benefi t plan is a post-employment benefi t plan other than a defi ned contribution plan. The Company's net obligation in respect of defi ned benefi t pension plan is calculated separately for each plan by estimating the amount of future benefi t that employees have earned in return for their service in current and prior periods; that benefi t is discounted to determine its present value. Any unrecognised past service costs and the fair value of any plan assets are deducted.
The calculation is performed annually by a qualifi ed actuary using the projected unit credit method. When the calculation results in a benefi t to the Company, the recognised asset is limited to the total of any unrecognised past service costs and the present value of economic benefi ts available in the form of any future refunds from the plan or reductions in future contributions to the plan. When the benefi ts of the plan are improved, the portion of the increased benefi t related to past service by employees is recognised in profi t and loss on a straight line basis over the average period until the benefi ts become vested. To the extent that the benefi ts vest immediately, the expense is recognised immediately in profi t and loss.
The Company recognises all expenses and all actuarial gains and losses arising from defi ned plan in profi t and loss.
(ii) Short term employee benefi ts
Short term employee benefi t obligations are measured based on undiscounted basis and are expensed as the related service is rendered. A liability is recognised for the amount expected to be paid under short-term cash bonus or profi t sharing plans if the Company has a present legal or constructive obligation to pay this amount as a result of past service provided by the employee, and the obligation can be estimated reliably.
3.11 Contingencies
Contingencies arising from claims, litigations, assessments, fi nes, penalties, etc. are recorded when it is probable that a liability has been incurred and the amount can be reasonably estimated.
3.12 Earnings per share
The Company presents basic and diluted earnings per share data for its ordinary shares. Basic earnings per share is calculated by dividing the profi t or loss attributable to ordinary shareholders of the Company by the weighted average number of ordinary shares outstanding during the year, adjusted for own shares held. Diluted earnings per share is determined by adjusting the profi t or loss attributable to ordinary shareholders and the weighted average number of ordinary shares outstanding, adjusted for own shares held, for the effects of all dilutive potential ordinary shares, which comprise convertible notes and share options granted to employees.
3.13 Events after the reporting period
Events after statement of fi nancial position date that provide additional information about the company's positions at the statement of fi nancial position date are refl ected in the fi nancial statements. Events after the statement of fi nancial position

39
M A R I C O B A N G L A D E S H L I M I T E D
39
NOTES TO THE FINANCIAL STATEMENTSfor the year ended 31 March 2013
date that are non-adjusting events are disclosed in the notes when material.
3.14 Financial instruments
Non-derivative fi nancial instruments comprise investments in shares and Fixed Deposit Receipts (FDR), cash and cash equivalents, trade creditors, share capital, and interest-bearing borrowings.
Investment in shares
Investment in share are non-derivative fi nancial assets that are designated as available for sale. Initially they are recognised at cost and subsequent to initial recognition, they are measured at fair value and changes therein, other than impairment losses and foreign currency differences on available-for-sale are recognised in comprehensive income and presented in the fair value reserve in equity. When an investment is derecognised, the gain or loss accumulated in equity is reclassifi ed to profi t or loss.
Investment in Fixed Deposit Receipts (FDR)
The company has the positive intent and ability to hold FDR to maturity, and as such fi nancial assets are classifi ed as held to maturity. Held-to-maturity fi nancial assets are recognised initially at fair value plus any directly attributable transaction costs. Subsequent to initial recognition, held-to-maturity fi nancial assets are measured at amortised cost using the effective interest method, less any impairment losses.
Cash and cash equivalents
Cash and cash equivalents comprise cash and bank balances. Bank overdrafts that are repayable on demand form an integral part of the Company's cash management are included as a component of cash and cash equivalents for the purpose only of the statement of cash fl ows.
Share capital
Ordinary shares are classifi ed as equity. Incremental costs directly attributable to the issue of ordinary share are recognised as a deduction from equity, net of any tax effects.
Trade creditors
Trade creditors are recognised at fair value.
Interest-bearing borrowings
Interest-bearing borrowings are recognised initially at fair value less attributable transaction costs. Subsequent to initial recognition, interest-bearing borrowings are stated at amortised cost using the effective interest method, less any impairment losses.
Advances from customers
Advances from customers are recognised initially at fair value. Subsequent to initial recognition, they are measured at amortised cost using the effective interest method.
3.15 Financial risk management
The company management has overall responsibility for the establishment and oversight of the Company's risk management framework. The company's management policies are established to identify and analyse the risks faced by the Company to set appropriate risk limits and controls and to monitor risks and adherence to limit. Risk management policies, procedures and systems are reviewed regularly to refl ect changes in market conditions and the company's activities. The Company has exposure for measuring and managing risks from its use of fi nancial instruments which are as follows:
i) Credit risk
Credit risk is the risk of fi nancial loss if a customer or counterpart to a fi nancial instrument fails to meet its contractual obligations which arise principally from the Company's receivables from customers.

40
M A R I C O B A N G L A D E S H L I M I T E D
40
NOTES TO THE FINANCIAL STATEMENTSfor the year ended 31 March 2013
ii) Liquidity risk
Liquidity risk is the risk that the Company will encounter diffi culty in meeting the obligations associated with its fi nancial liabilities that are settled by delivering cash or another fi nancial asset. The Company’s approach to managing liquidity is to ensure, as far as possible, that it will always have suffi cient liquidity to meet its liabilities when due, under both normal and stressed conditions, without incurring unacceptable losses or risking damage to the Company’s reputation.
iii) Market risk
Market risk is the risk that changes in market prices such as foreign exchange rates, interest rates and equity prices will affect the Company's income or the value of its holdings of fi nancial instruments. The objective of market risk management is to manage and control market risk exposures within acceptable parameters, while optimising the return.
Market risk includes the followings:
Currency risk:
Transaction risk
Transaction risk arises from risk of adverse exchange rate movements occurring in the course of normal international transaction.
Translation risk
Translation risk is the risk that the Company will make exchange losses when the accounting results are translated into the home currency.
Economic risk
Economic risk refers to the effect of exchange rate movements on the international competitiveness of the Company.
Interest rate risk:
Interest rate risk arises from movement in interest rates. The Company needs to manage interest rate risk so as to be able to repay debts as they fall due and to minimise the risks surrounding interest payments and receipts.

41
M A R I C O B A N G L A D E S H L I M I T E D
41
NOTES TO THE FINANCIAL STATEMENTSfor the year ended 31 March 2013
4. Property, plant and equipment
Cost Accumulated depreciation Carrying value
Particulars As at 1 April 2012
Addition during
the year
Disposal / Adjustment
during the year
As at 31 March 2013
As at 1 April 2012
Charged for
the year
Adjustment for the year
As at 31 March 2013
As at 31 March 2013
Taka Taka Taka Taka Taka Taka Taka Taka Taka
Plant and machinery 170,146,774 353,317,504 (81,225,902) 442,238,376 121,730,396 51,191,863 (81,159,228) 91,763,031 350,475,345
Freehold land 174,712,066 – – 174,712,066 – – – – 174,712,066
Vehicles 30,836,326 10,411,552 – 41,247,878 10,859,094 7,804,084 – 18,663,178 22,584,700
Factory equipments 3,653,071 – (91,400) 3,561,671 1,988,038 820,397 (64,602) 2,743,833 817,838
Moulds 19,885,048 17,367,488 – 37,252,536 9,559,124 6,598,608 – 16,157,732 21,094,804
Factory building 2,909,990 116,169,799 – 119,079,789 604,507 10,217,825 – 10,822,332 108,257,457
Offi ce building 62,193,176 105,280,413 – 167,473,589 19,922,162 7,660,946 – 27,583,108 139,890,481
Laboratory equipments 1,297,985 3,240,334 – 4,538,319 400,124 585,648 – 985,772 3,552,547
Offi ce equipments 11,884,363 3,088,395 – 14,972,758 5,218,895 5,976,466 – 11,195,361 3,777,397
Computers 5,829,160 1,613,835 – 7,442,995 3,974,948 1,440,221 – 5,415,169 2,027,826
Furniture and fi xtures 27,120,084 4,336,900 – 31,456,984 14,038,507 11,021,589 – 25,060,096 6,396,887
A.C., refrigerator, water coolers
6,853,375 2,898,153 (320,000) 9,431,528 3,382,767 3,397,247 (320,000) 6,460,014 2,971,514
As at 31 March 2013 517,321,418 617,724,374 (81,637,302) 1,053,408,489 191,678,562 106,714,895 (81,543,831) 216,849,626 836,558,863
As at 31 March 2012 514,222,996 187,683,338 (184,584,916) 517,321,418 285,210,417 91,118,687 (184,650,542) 191,678,562 325,642,856
Intangible Assets
As at 31 March 2013 23,075,125 – (23,075,125) – 23,012,625 62,500 (23,075,125) – –
As at 31 March 2012 23,075,125 – – 23,075,125 16,423,391 6,589,234 – 23,012,625 62,500
4. Property, plant and equipment
Cost Accumulated depreciation Carrying value
Particulars As at 1 April 2012
Addition during
the year
Disposal / Adjustment
during the year
As at 31 March 2013
As at 1 April 2012
Charged for
the year
Adjustment for the year
As at 31 March 2013
As at 31 March 2013
Rs. Crore Rs. Crore Rs. Crore Rs. Crore Rs. Crore Rs. Crore Rs. Crore Rs. Crore Rs. Crore
Plant and machinery 10.57 24.56 (5.65) 29.48 8.46 3.56 5.64 6.38 24.36
Freehold land 10.85 – – 10.85 – – – – 12.14
Vehicles 1.91 0.72 – 2.63 0.75 0.54 (0.01) 1.30 1.57
Factory equipments 0.23 – (0.01) 0.22 0.14 0.06 0.01 0.19 0.06
Moulds 1.23 1.21 – 2.44 0.66 0.46 – 1.12 1.47
Factory building 0.18 8.07 – 8.25 0.04 0.71 – 0.75 7.52
Offi ce building 3.86 7.32 – 11.18 1.38 0.53 (0.01) 1.92 9.72
Laboratory equipments 0.08 0.23 – 0.31 0.03 0.04 – 0.07 0.25
Offi ce equipments 0.74 0.21 – 0.95 0.36 0.42 – 0.78 0.26
Computers 0.36 0.11 – 0.47 0.28 0.10 – 0.38 0.14
Furniture and fi xtures 1.68 0.30 – 1.98 0.98 0.77 0.01 1.74 0.44
A.C., refrigerator, water coolers
0.43 0.20 (0.02) 0.61 0.24 0.24 0.03 0.45 0.21
As at 31 March 2013 32.12 42.93 (5.68) 69.37 13.32 7.43 5.67 15.08 58.14
As at 31 March 2012 31.93 11.66 (11.46) 32.13 17.71 5.66 (11.47) 11.90 20.22
Intangible Assets
As at 31 March 2013 1.60 – (1.60) – 1.60 – (1.60) 1.43 –
As at 31 March 2012 1.43 – – 1.43 1.02 0.41 – 58.14 –

42
M A R I C O B A N G L A D E S H L I M I T E D
42
NOTES TO THE FINANCIAL STATEMENTSfor the year ended 31 March 2013
4.1 Depreciation allocated to:
For the year ended 31
March 2013
For the year ended 31
March 2012
For the year ended 31
March 2013
For the year ended 31
March 2012 Taka Taka Rs.Crore Rs.Crore
Cost of sales (Note 21.1) 71,405,559 68,230,695 4.96 4.24
General and administration expenses (Note 23) 35,309,336 22,887,992 2.45 1.42
106,714,895 91,118,687 7.41 5.66
5 Deferred tax asset/(liability) is arrived as follows:
Carrying value as at
31 March
31 March 2013 31 March 2012
Carrying value as at
31 March
31 March 2013 31 March 2012
Taka Taka Rs.Crore Rs.Crore
Tax base as at 3
1 March
Temporary Difference Taxable/
(deductible)
Tax base as at
31 March
Temporary Difference Taxable/
(deductible)
Deferred tax asset/(liability)
Year 2013
Non-current assets 661,503,419 537,232,561 124,270,858 45.97 37.34 8.64
Deferred revenue expense – 27,621,519 (27,621,519) – 1.92 (1.92)
Provision for gratuity (15,956,603) – (15,956,603) (1.11) – (1.11)
Provision for leave encashment (9,404,119) – (9,404,119) (0.65) – (0.65)
Royalty payable (229,816,785) – (229,816,785) (15.97) – (15.97)
Net deductible temporary difference (158,528,168) (11.01)
Income tax rate * 24.75% 0.25
Deferred tax asset (A) (39,235,721) (2.72)
Year 2012
Non-current assets 148,671,988 317,703,037 (169,031,049) 9.23 19.73 (10.50)
Provision for gratuity (12,388,093) – (12,388,093) (0.77) – (0.77)
Provision for leave encashment (6,399,181) – (6,399,181) (0.4) – (0.40)
Royalty payable (168,878,754) – (168,878,754) (10.49) – (10.49)
Net deductible temporary difference (356,697,077) (22.16)
Income tax rate * 24.75% 0.25
Deferred tax asset (B) (88,282,527) (5.49)
Deferred tax expense (A-B) (49,046,806) (2.82)
* The Company has declared 100% interim dividend and thus its tax rate is 24.75% for the relevant assessment year.
6 Inventories
31 March 2013 31 March 2012 31 March 2013 31 March 2012 Taka Taka Rs. Crore Rs. Crore
Raw materials 553,048,338 1,241,885,840 38.44 77.12
Packing materials 53,502,198 108,864,923 3.72 6.76
Finished goods 283,400,693 224,018,376 19.70 13.91
Raw materials in transit 131,605,139 203,169,779 9.15 12.62
1,021,556,368 1,777,938,918 71.01 110.41

43
M A R I C O B A N G L A D E S H L I M I T E D
43
NOTES TO THE FINANCIAL STATEMENTSfor the year ended 31 March 2013
7 Advance income tax
31 March 2013 31 March 2012 31 March 2013 31 March 2012 Taka Taka Rs. Crore Rs. Crore
Opening balance 717,730,520 315,292,151 49.88 19.58
Addition during the year 202,614,888 402,438,369 14.08 24.99
920,345,408 717,730,520 63.96 44.57
8 Advances, deposits and prepayments
31 March 2013 31 March 2012 31 March 2013 31 March 2012 Taka Taka Rs. Crore Rs. Crore
Advances:Loan to employees 10,887,727 10,518,964 0.76 0.65
Advance for services 40,085,251 30,777,745 2.79 1.91
Capital goods 69,218,493 333,054,126 4.81 20.68
120,191,471 374,350,835 8.36 23.24 Deposits: VAT current account 43,246,741 80,122,256 3.01 4.98
Supplementary duty 42,288,306 1,241,917 2.94 0.08
Security deposits 4,726,144 9,144,200 0.33 0.57
90,261,191 90,508,373 6.28 5.63
Prepayments:Prepaid insurance 6,001,458 – 0.40 –
216,454,120 464,859,208 15.04 28.87
9 Fixed deposits
Bank Asia Limited – 50,000,000 – 3.11
BRAC Bank Limited 175,804,456 – 12.22 –
Dhaka Bank Limited 50,000,000 – 3.48 –
Commercial Bank of Ceylon PLC 300,000,000 50,000,000 20.85 3.11
Delta Brac Housing Finance Corporation Limited
– 50,000,000 – 3.11
IDLC Finance Limited 350,000,000 170,000,000 24.33 10.56
The Hongkong and Shanghai Banking Corporation Limited
272,354,688 150,000,000 18.93 9.32
IFIC Bank Limited 10,765,029 – 0.75 –
Prime Bank Limited 50,000,000 60,000,000 3.48 3.73
State Bank of India 240,000,000 40,000,000 16.68 2.48
Standard Chartered Bank 515,993,243 40,000,000 35.84 2.46
Southeast Bank Limited 50,000,000 – 3.48 –
2,014,917,416 610,000,000 140.04 37.88
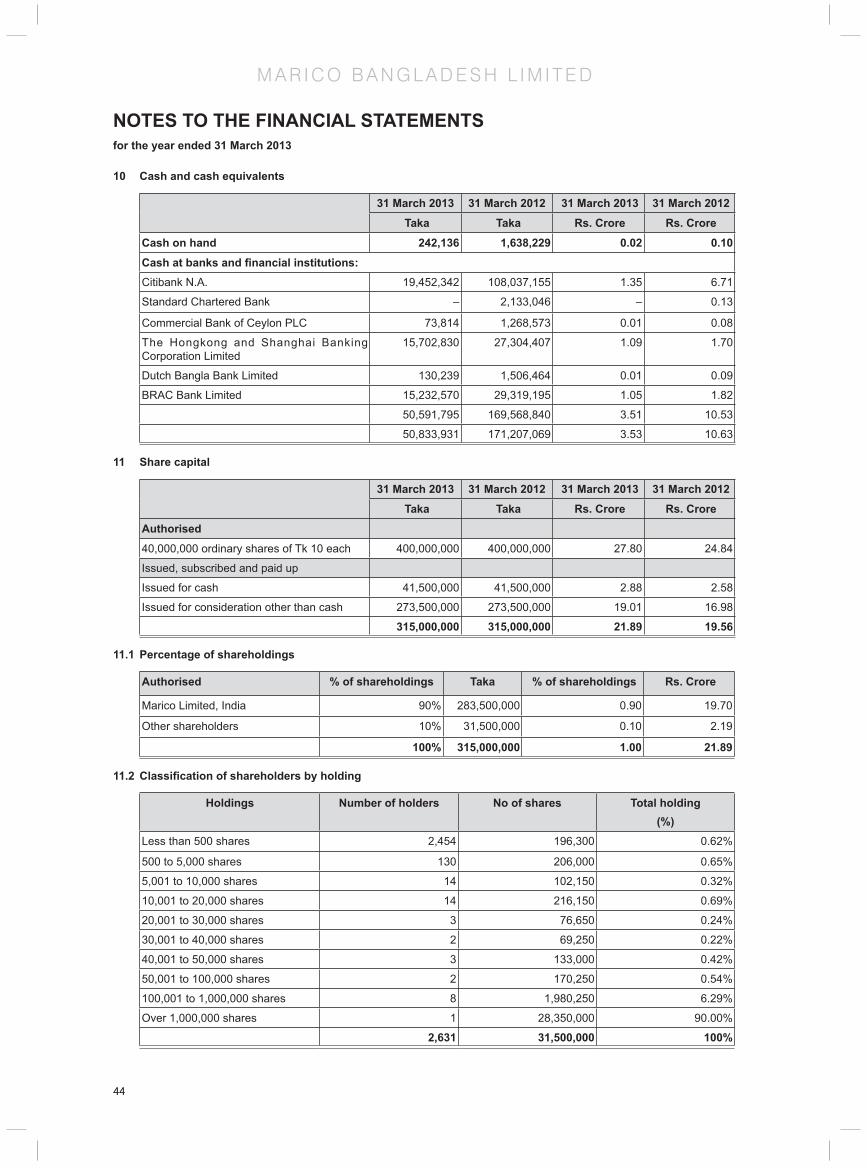
44
M A R I C O B A N G L A D E S H L I M I T E D
44
NOTES TO THE FINANCIAL STATEMENTSfor the year ended 31 March 2013
10 Cash and cash equivalents
31 March 2013 31 March 2012 31 March 2013 31 March 2012
Taka Taka Rs. Crore Rs. Crore
Cash on hand 242,136 1,638,229 0.02 0.10
Cash at banks and fi nancial institutions:Citibank N.A. 19,452,342 108,037,155 1.35 6.71
Standard Chartered Bank – 2,133,046 – 0.13
Commercial Bank of Ceylon PLC 73,814 1,268,573 0.01 0.08
The Hongkong and Shanghai Banking Corporation Limited
15,702,830 27,304,407 1.09 1.70
Dutch Bangla Bank Limited 130,239 1,506,464 0.01 0.09
BRAC Bank Limited 15,232,570 29,319,195 1.05 1.82
50,591,795 169,568,840 3.51 10.53
50,833,931 171,207,069 3.53 10.63
11 Share capital
31 March 2013 31 March 2012 31 March 2013 31 March 2012
Taka Taka Rs. Crore Rs. Crore
Authorised
40,000,000 ordinary shares of Tk 10 each 400,000,000 400,000,000 27.80 24.84
Issued, subscribed and paid up
Issued for cash 41,500,000 41,500,000 2.88 2.58
Issued for consideration other than cash 273,500,000 273,500,000 19.01 16.98
315,000,000 315,000,000 21.89 19.56
11.1 Percentage of shareholdings
Authorised % of shareholdings Taka % of shareholdings Rs. Crore
Marico Limited, India 90% 283,500,000 0.90 19.70
Other shareholders 10% 31,500,000 0.10 2.19
100% 315,000,000 1.00 21.89
11.2 Classifi cation of shareholders by holding
Holdings Number of holders No of shares Total holding(%)
Less than 500 shares 2,454 196,300 0.62%
500 to 5,000 shares 130 206,000 0.65%
5,001 to 10,000 shares 14 102,150 0.32%
10,001 to 20,000 shares 14 216,150 0.69%
20,001 to 30,000 shares 3 76,650 0.24%
30,001 to 40,000 shares 2 69,250 0.22%
40,001 to 50,000 shares 3 133,000 0.42%
50,001 to 100,000 shares 2 170,250 0.54%
100,001 to 1,000,000 shares 8 1,980,250 6.29%
Over 1,000,000 shares 1 28,350,000 90.00%
2,631 31,500,000 100%

45
M A R I C O B A N G L A D E S H L I M I T E D
45
NOTES TO THE FINANCIAL STATEMENTSfor the year ended 31 March 2013
12 Provision for gratuity
31 March 2013 31 March 2012 31 March 2013 31 March 2012 Taka Taka Rs. Crore Rs. Crore
Opening balance 12,388,093 8,896,857 0.86 0.55
Add: Provision made during the year 5,564,289 4,682,411 0.39 0.29
Less: Paid during the year 17,952,382 13,579,268 1.25 0.84
(1,995,779) (1,191,175) (0.13) (0.08)
15,956,603 12,388,093 1.12 0.76
13 Provision for leave encashment
Opening balance 6,419,607 8,892,093 0.45 0.55
Add:Provision made/(reversed) during the year 4,529,939 (755,898) 0.31 (0.05)
Less: Paid during the year 10,949,546 8,136,195 0.76 0.50
(1,545,427) (1,716,588) (0.11) (0.10)
9,404,119 6,419,607 0.65 0.40
14 Short term fi nance
Short term loan:
Citibank N.A – 100,000,000 – 6.21
Standard Chartered Bank (Note 14.1) 38,534,964 – 2.68 –
38,534,964 100,000,000 2.68 6.21
14.1 Standard Chartered Bank
a) Limit
Total aggregate limit of short term loan and bank overdraft is Tk 208 million. Short term loan is taken whenever required.
b) Nature of security (Short term loan and bank overdraft)
Demand promissory note and letter of continuity for Tk 208 million.
c) Rate of interest
Rate of interest has been varied from 13.5% to 14.5% depending on the money market and inter relationship.
15 Liability for expenses
31 March 2013 31 March 2012 31 March 2013 31 March 2012 Taka Taka Rs. Crore Rs. Crore
Business promotion expenses 218,037,453 80,388,416 15.15 4.99
Advertisement expenses 121,467,319 87,107,626 8.44 5.41
Audit fees 400,000 313,500 0.03 0.02
Creditors for supplies 10,802,128 36,581,015 0.75 2.27
Import duty and related charges 19,750,813 41,072,557 1.37 2.55
Other expenses 63,024,114 24,305,854 4.39 1.51
433,481,827 269,768,968 30.13 16.75

46
M A R I C O B A N G L A D E S H L I M I T E D
46
NOTES TO THE FINANCIAL STATEMENTSfor the year ended 31 March 2013
16 Provision for income tax
31 March 2013 31 March 2012 31 March 2013 31 March 2012 Taka Taka Rs. Crore Rs. Crore
Opening balance 826,822,981 614,689,532 57.46 38.17
Add: Provision during the year 282,689,572 212,133,449 19.65 13.18
1,109,512,553 826,822,981 77.11 51.35
Less: Prior year adjustment
Assessment year 2009-2010 (49,593,836) – (3.45) –
Assessment year 2010-2011 54,670,501 – 3.80 –
Assessment year 2011-2012 (34,171,225) – (2.37) –
1,080,417,993 826,822,981 75.09 51.35
17 Trade creditors
Marico Limited, India 106,605,619 131,873,368 7.41 8.19
Other creditors 13,533,230 42,732,360 0.94 2.65
120,138,849 174,605,728 8.35 10.84
18 Payable to holding company
Royalty and bank guarantee commission 233,038,526 177,772,739 16.20 11.04 General and technical assistance fees 23,427,653 – 1.62 –
256,466,179 177,772,739 17.82 11.04
19 Other liabilities
Advance from customers 48,822,695 16,790,898 3.39 1.04 Tax and VAT deducted from vendors' bills 24,312,002 14,868,252 1.69 0.93
73,134,697 31,659,150 5.08 1.97
20 Revenue
ProductsParachute coconut oil 5,347,987,702 5,438,197,387 371.69 337.71
Value added hair oil (VAHO) 632,310,719 417,388,497 43.95 25.92
Haircode hair dye 100,176,003 91,909,694 6.96 5.71
Saffola - Edible oil 10,166,874 32,990,515 0.71 2.05Kaya 14,192,137 35,247,121 0.99 2.19Others 15,060,431 20,526,907 1.05 1.27
6,119,893,866 6,036,260,121 425.33 374.85
21 Cost of sales
Opening stock of fi nished goods 224,018,376 247,581,606 15.57 15.37
Cost of goods manufactured (Note 21.1) 3,972,325,411 4,536,459,236 276.08 281.71
4,196,343,787 4,784,040,842 291.65 297.08 Closing stock of fi nished goods (283,400,693) (224,018,376) (19.7) (13.91)
3,912,943,094 4,560,022,466 271.95 283.18

47
M A R I C O B A N G L A D E S H L I M I T E D
47
NOTES TO THE FINANCIAL STATEMENTSfor the year ended 31 March 2013
21.1 Cost of goods manufactured
31 March 2013 31 March 2012 31 March 2013 31 March 2012 Taka Taka Rs. Crore Rs. Crore
Materials consumed:Opening stock of raw and packing materials 1,553,920,542 933,217,127 108 57.95Purchases during the year 2,975,351,454 5,020,115,221 206.79 311.75Closing stock of raw and packing materials (738,155,674) (1,553,920,542) (51.30) (96.50)
3,791,116,322 4,399,411,806 263.48 273.20 Factory overhead:Salary and allowances 23,970,333 17,791,032 1.67 1.1
Cost of outsourced resources 26,278,865 18,127,865 1.83 1.13
Power expenses 33,553,640 4,198,283 2.33 0.26Warehouse rent 2,059,949 8,336,005 0.14 0.52Loading charges 2,229,199 1,714,544 0.15 0.11Repairs and maintenance of plant and machinery 6,428,384 2,388,651 0.45 0.15Repairs and maintenance of factory building 1,549,255 1,832,669 0.11 0.11Depreciation 71,405,559 68,230,695 4.96 4.24Freight inward 10,780,480 10,530,517 0.75 0.65LC charges 2,953,425 3,897,169 0.21 0.24
181,209,089 137,047,430 12.59 8.51 3,972,325,411 4,536,459,236 276.08 281.71
22 Marketing, selling and distribution expenses
Business promotion expenses 234,023,754 115,494,989 16.26 7.17
Advertisement 413,242,315 321,331,716 28.72 19.95
Market research expenses 15,825,943 30,058,962 1.1 1.87
Distribution expenses 37,732,136 53,534,430 2.62 3.32
Freight- outward 53,965,626 48,093,035 3.75 2.99
754,789,774 568,513,132 52.46 35.30
23 General and administration expenses
31 March 2013 31 March 2012 31 March 2013 31 March 2012 Taka Taka Rs. Crore Rs. Crore
Salaries and allowances 199,382,577 114,736,339 13.86 7.13
Gratuity 5,564,289 4,682,411 0.39 0.29
Rent 11,785,791 12,269,215 0.82 0.76
Professional charges 42,136,205 28,811,092 2.93 1.79
Security charges 1,790,518 1,852,327 0.12 0.12
Legal charges 3,252,936 257,748 0.23 0.02
Postage, stamp and license fees 4,723,402 582,661 0.33 0.04
Director's remuneration 31,571,424 10,398,168 2.19 0.65
Director's fees 516,765 420,000 0.04 0.03
Repair and maintenance 19,832,224 14,771,518 1.38 0.92
Communication expenses 8,451,007 9,533,566 0.59 0.59
Subscription to trade association 102,900 90,000 0.01 0.01
Entertainment 6,376,945 5,682,621 0.44 0.35
Printing and stationery 1,762,596 2,262,036 0.12 0.14

48
M A R I C O B A N G L A D E S H L I M I T E D
48
NOTES TO THE FINANCIAL STATEMENTSfor the year ended 31 March 2013
Vehicle running expenses 16,352,919 14,133,475 1.14 0.88
Travelling and conveyance - Local 15,932,903 15,690,222 1.11 0.97
Travelling and conveyance - Foreign 8,527,160 9,140,340 0.59 0.57
Audit fees 400,000 313,500 0.03 0.02
Recruitment expenses 699,430 803,888 0.05 0.05
Insurance premium 3,930,088 4,552,759 0.27 0.28
Books and periodicals 200,649 119,504 0.01 0.01
Bank charges 2,427,765 8,858,391 0.17 0.55
Staff welfare expenses 11,566,204 9,791,425 0.8 0.61
AGM expenses 1,924,342 2,446,161 0.13 0.15
Conference and training expenses 12,035,679 2,475,378 0.84 0.15
Electricity and gas charges 2,062,408 1,210,741 0.14 0.08
Amortization 62,500 6,589,234 – 0.41
Royalty 55,265,786 54,684,744 3.84 3.4
Depreciation 35,309,336 22,887,992 2.45 1.42
Listing fees 140,000 140,000 0.01 0.01
504,086,748 360,187,456 35.03 22.37
24 Other income
31 March 2013 31 March 2012 31 March 2013 31 March 2012 Taka Taka Rs. Crore Rs. Crore
Interest on fi xed deposit 160,905,031 202,869,404 11.18 12.6
Dividend income – 3,754,141 – 0.23
Interest on call deposit 757,632 206,508 0.05 0.01
Net fi nance income/(costs) (Note 24.1) 1,478,127 (69,243,728) 0.1 (4.3)
Gain on sale of assets (Note 24.2) 58,775,809 17,011,754 4.08 1.06
221,916,599 154,598,079 15.42 9.60
24.1 Net fi nance costs/(income)
Interest on term loan 1,052,483 13,995,309 0.07 0.87
Interest on overdraft 1,201,730 3,474,614 0.08 0.22
Foreign exchange (gain) / loss (3,732,340) 51,773,805 (0.26) 3.22
(1,478,127) 69,243,728 (0.10) 4.30
24.2 Gain on sale of assets
Gain on sale of Gain on sale of Book value Sale value Assets Book value Sale value Assets
Taka Taka Taka Rs. Crore Rs. Crore Rs. Crore Plant and machinery 66,674 50,800,000 50,733,326 0.01 3.53 3.53
Factory equipments 26,798 69,281 42,483 0.01 – –
Intangible assets – 8,000,000 8,000,000 – 0.56 0.56
93,472 58,869,281 58,775,809 0.02 4.09 4.08

49
M A R I C O B A N G L A D E S H L I M I T E D
49
NOTES TO THE FINANCIAL STATEMENTSfor the year ended 31 March 2013
25 Income tax expense
31 March 2013 31 March 2012 31 March 2013 31 March 2012 Taka Taka Rs. Crore Rs. Crore
Current tax expense 253,595,012 212,133,449 17.62 13.17
Deferred tax expense / (income) 49,046,806 (45,618,090) 3.41 (2.83)
302,641,818 166,515,359 21.03 10.34
25.1 Reconciliation of effective tax
Profi t before income tax as per statement of comprehensive income
1,169,990,849 702,135,146 81.31 43.60
Income tax using the domestic corporate tax rate (@ 24.75%)
Factors affecting the tax charge for current year 289,572,735 173,778,449 20.13 10.79
Non deductible expenses – –
Deductible expenses 65,054,159 55,591,435 4.52 3.45
Tax savings from reduced tax rates from dividend
(71,937,322) (13,691,027) (5.00) (0.85)
Tax savings from reduced tax rates from capital gain – (178,322) – (0.01)
Previous year adjustment – (3,367,086) – (0.21)
Deferred tax expense / (income) (29,094,560) – (2.02) –
Total income tax expenses 49,046,806 (45,618,090) 3.41 (2.83) 302,641,818 166,515,359 21.04 11.34
26 Earnings per share
26.1 Basic Earnings Per Share
31 March 2013 31 March 2012 31 March 2013 31 March 2012 Taka Taka Rs. Crore Rs. Crore
The computation of EPS is given below:
Earnings attributable to ordinary share holders
867,349,031 535,619,787 60.28 33.26
(Net profi t after tax)
Weighted average number of ordinary shares outstanding during the year
31,500,000 31,500,000 31,500,000 31,500,000
Earnings per share (EPS) in Taka and Rs. 27.53 17.00 19.14 10.56
26.2 Diluted earnings per share
Since there is no dilutive factors, diluted earnings per share is not required to be calculated.
27 Related party transactions During the year the Company carried out a number of transactions with related parties in the normal course of business and on an arm’s length basis. The name of related parties, nature of transactions, their total value and closing balance have been set out in accordance with the provisions of BAS 24: Related party disclosure

50
M A R I C O B A N G L A D E S H L I M I T E D
50
NOTES TO THE FINANCIAL STATEMENTSfor the year ended 31 March 2013
Name of the related party
Relationship Nature of transactions
TransactionAmount
Balance as at
31 March 2013
Balance as at
31 March 2012
TransactionAmount
Balance as at
31 March 2013
Balance as at
31 March 2012
Marico Limited, India Parent company
Purchase of raw material
1,249,465,010 106,605,619 132,222,668 86.84 7.41 8.21
Purchase of moulds
1,542,832 – – 0.11 – –
Royal ty and bank guarantee commission
55,265,786 233,038,526 177,772,739 3.84 16.20 11.04
Dividend 255,150,000 – – 17.73 – –
General and t e c h n i c a l assistance fee
23,427,653 23,427,653 – 1.63 1.63 –
Marico Middle East FZE
Subsidiary of parent company
Purchase of raw material
423,905,507 5,607,131 43,721,058 29.46 0.39 2.72
28 Capacity
Major product Unit of measure Budgeted capacityduring the year
PCNO KL 24,000
Copra Ton 28,000
29 Contingent Liabilities
29.1 L/C amount for import of raw materials which were not received till the reporting date.
At 31 March 2013
US dollar
At 31 March 2012
US dollar
At 31 March 2013
Rs.Crore
At 31 March 2012
Rs.CroreOutstanding L/C 1,547,747 4,114,990 8.4 20.94
29.2 There are contingent liabilities in respect of certain tax claims made against the Company. However, these are being vigorously defended by the Company and the directors do not consider it is appropriate to make provision in respect of any of these claims.
30 Financial risk management
30.1 Credit risk
Credit risk is risk of fi nancial loss if a customer or counterpart to a fi nancial instrument fails to meet its contractual obligations which arises principally from the Company’s receivables from customers.
The company makes sales on advance basis i.e. it receives advance from customers prior to sale so there is no credit risk due to uncollectibility from the customers. However, the company maintains most of the fi nancial assets with short-term deposits and cash and cash equivalents.
The following are the fi nancial assets of the Company as at 31 March 2013:
Exposure of fi nancial assets31 March 2013 31 March 2013
Taka Rs. Crore Accrued interest 55,018,956 3.82
Fixed deposits 2,014,917,416 140.04
Cash and cash equivalents 50,833,931 3.53
Total fi nancial assets 2,120,770,303 147.39

51
M A R I C O B A N G L A D E S H L I M I T E D
51
NOTES TO THE FINANCIAL STATEMENTSfor the year ended 31 March 2013
30.2 Liquidity risk
Liquidity risk is the risk that the Company may encounter diffi culty in meeting the obligations associated with its fi nancial liabilities that are settled by delivering cash or another fi nancial assets.
The Company’s approach to managing liquidity is to ensure, as far as possible, that it will always have suffi cient liquidity to meet its liabilities when due, under both normal and stressed conditions, without incurring unacceptable losses or risking damage to the Company’s reputation.
The following are the contractual maturities of fi nancial liabilities of the Company as at 31 March 2013:
Exposure of liquidity risk
Carrying amount
Cash fl ows Upto 1 year
Above 1 year
to 5 years
Carrying amount
Cashfl ows
Upto 1 year
Above 1 year
to 5 years
Taka Taka Taka Taka Taka RS. Crore RS. Crore RS. Crore
Short term fi nance 38,534,964 38,534,964 38,534,964 – 2.68 2.68 2.68 –
Liability for expenses 433,481,827 433,481,827 433,481,827 – 30.13 30.13 30.13 –
Trade creditors 120,138,849 120,138,849 120,138,849 – 8.35 8.35 8.35 –
Payable to holding company 256,466,179 256,466,179 78,693,439 177,772,739 17.82 17.82 5.47 12.36
Other liabilities 73,134,697 73,134,697 73,134,697 – 5.08 5.08 5.08 –
Total fi nancial liabilities 921,756,516 921,756,516 743,983,776 177,772,739 64.06 64.06 51.71 12.36
Surplus of financial assets over fi nancial liabilities
1,199,013,787 – – – 95.31 – – –
30.3 Market risk
Market risk is the risk that include changes in market price, such as foreign exchange rate, interest rates and equity prices that may affect the Company’s income or the value of its holdings of fi nancial instruments. The objective of market risk management is to manage and control market risk exposures within acceptable parameters, while optimizing the return.The company’s exposure to foreign currency risk at 31 March are as follows:
US Dollar Rs.CroreImport of goods and services 1,441,823 7.83
Bank balance 90,071 0.49
1,531,894 8.32
31 Value of import calculated on CIF Basis
31 March 2013 31 March 2013Taka Rs. Crore
Raw materials 2,175,192,279 151.18
Capital goods 127,227,526 8.84 2,302,419,805 160.02
32 General
32.1 The number of employees engaged for the whole period or part thereof who received a total salary of Tk 36,000 p.a. and above was 127 (previous year: 124).
32.2 Comparative fi gures have been rearranged wherever considered necessary to conform current year’s presentation.
33 Events after the reporting period
For the year ended 31 March 2013 the Board of Directors recommended fi nal cash dividend @ 50% per share at 75th boar d meeting held on 23 April 2013.
There are no other events identifi ed after the statement of fi nancial position date which might be material.

52
M B L INDUSTRIES L I M I T E D
52
Board of Directors Milind Sarwate
Aditya Shome
Rohit Jaiswal
Pawan Agrawal
Registered Offi ce House-1, Road-1, Sector-1,
Uttara, Dhaka – 1230, Bangladesh
Auditors Rahman Rahman Huq
Chartered Accountants
Internal Auditors Farhad Hussain & Co.
Bankers Standard Chartered Bank
Citibank N.A.
Legal Advisors Corporate Counsel
Suite-802, Rahat Tower (7th Floor),
14, Biponon C/A,
West Banglamotor, Dhaka-1000

5353
M B L INDUSTRIES L I M I T E D
DIRECTORS’ REPORTTo,
The Members
The Board of Directors is pleased to present the Annual Report together with audited accounts of your Company for the year ended September 30, 2012.
FINANCIAL RESULTS
(Taka Crore) (Rs. Crore)
Particulars 2012 2011 2012 2011Sales and Other Income 0.00 0.00 0.00 0.00
Profi t before tax 0.18 0.22 (0.13) (0.14)Tax (0.00) (0.00) (0.00) (0.00)
Profi t after Tax (0.42) 0.22 (0.13) 0.14Add : Surplus brought forward 2.72 2.50 1.99 1.61
Surplus carried forward 2.30 2.72 1.86 1.76
(Note: The exchange rate used to convert Taka to Rs. is Rs. 0.73 /Taka)
SALES TURNOVER & PROFITABILITY
During the year ended September 30, 2012 (FY11), there was on trading transaction except other income on which it earned a profi t/income before tax of Taka 0.18 Crore and a profi t after tax of Taka (0.42) Crore.
DIVIDEND
No dividend is being proposed for this year.
DIRECTORS
The Board of Directors was re-constituted on April 23, 2013
AUDITORS
M/s. Rahman Rahman Huq, Chartered Accountants, retire and a new auditors will be appointed of the Company.
HUMAN RESOURCES
The Board wishes to place on record its appreciation of the co-operation and support received from all members of the organization.
ACKNOWLEDGEMENT
The Board acknowledges the continued support and assistance received from the Government of Bangladesh, Bankers, Vendors, Distributors and other business associates and looks forward to continued support of all these partners in progress.
For and on behalf of Board of Directors
Aditya Shome Rohit JaiswalDirector Director
Place: DhakaDate: April 23, 2013

54
M B L INDUSTRIES L I M I T E D
54
AUDITORS’ REPORTReport on the Financial Statements
We have audited the accompanying fi nancial statements of MBL Industries Limited (“the Company”) which comprise the balance sheet as at 30 September 2012, and the profi t and loss account, statement of changes in equity and cash fl ow statement for the year then ended, and a summary of signifi cant accounting policies and other explanatory information.
Management’s Responsibility for the Financial Statements
Management is responsible for the preparation of fi nancial statements that give a true and fair view in accordance with Bangladesh Financial Reporting Standards, and for such internal control as management determines is necessary to enable the preparation of fi nancial statements that are free from material misstatement, whether due to fraud or error.
Auditor's Responsibility
Our responsibility is to express an opinion on these fi nancial statements based on our audit. We conducted our audit in accordance with Bangladesh Standards on Auditing. Those standards require that we comply with ethical requirements and plan and perform the audit to obtain reasonable assurance about whether the fi nancial statements are free from material misstatement.
An audit involves performing procedures to obtain audit evidence about the amounts and disclosures in the fi nancial statements. The procedures selected depend on our judgment, including the assessment of the risks of material misstatement of the fi nancial statements, whether due to fraud or error. In making those risk assessments, we consider internal control relevant to the entity’s preparation of fi nancial statements that give a true and fair view in order to design audit procedures that are appropriate in the circumstances, but not for the purpose of expressing an opinion on the effectiveness of the entity’s internal control. An audit also includes evaluating the appropriateness of accounting policies used and the reasonableness of accounting estimates made by management, as well as evaluating the overall presentation of the fi nancial statements.
We believe that the audit evidence we have obtained is suffi cient and appropriate to provide a basis for our audit opinion.
Opinion
In our opinion, the fi nancial statements give a true and fair view of the fi nancial position of the Company as at 30 September 2012, and of its fi nancial performance and its cash fl ows for the year then ended in accordance with Bangladesh Financial Reporting Standards.
Report on Other Legal and Regulatory Requirements
In accordance with Companies Act 1994, we also report the following:
a) we have obtained all the information and explanation which to the best of our knowledge and belief were necessary for the purpose of our audit and made due verifi cation thereof;
b) in our opinion, proper books of account as required by law have been kept by the Company so far as it appeared from our examination of those books; and
c) the balance sheet and profi t and loss account dealt with by the report are in agreement with the books of account.
Dhaka, 30 October 2012

5555
M B L INDUSTRIES L I M I T E D
BALANCE SHEET
As at September 30,
Note 2012 2011 2012 2011
Taka Taka Rs. Crore Rs. Crore
Source of funds
Shareholders' funds:
Share capital 4 1,000,000 1,000,000 0.06 0.07
Retained earnings 22,956,699 27,159,648 1.49 1.77
Total 23,956,699 28,159,648 1.55 1.84
Application of funds
Current assets:
Advance income tax 5 40,734,974 40,009,557 2.64 2.60
Accrued interest 6 1,174,949 1,142,260 0.08 0.07
Cash and cash equivalents 7 30,331,519 30,545,235 1.96 1.99
72,241,442 71,697,052 4.68 4.66
Current liabilities and provisions:
Liability for expenses 8 703,324 583,074 0.05 0.04 Provision for tax 9 42,225,607 37,799,831 2.73 2.45
Payable to holding company 10 3,609,981 3,609,981 0.23 0.23
Other liabilities 11 1,745,831 1,544,518 0.11 0.10
48,284,743 43,537,404 3.12 2.88
Net current assets 23,956,699 28,159,648 1.56 1.84
Total 23,956,699 28,159,648 1.56 1.84
___________________________________________________________________________________________________The annexed notes 1 to 18 form an integral part of these fi nancial statements.
Debashish Neogi Vijay Subramaniam Director Director
As per our report of same date.
Rahman Rahman Huq Auditor
Dhaka, 30 October 2012
Note: The exchange rate use to convert Taka to Rs.<0.695>/(Previous year Taka to Rs.<0.621>)

56
M B L INDUSTRIES L I M I T E D
56
PROFIT AND LOSS ACCOUNT
Note 31 March 2012
31 March 2011
31 March 2012
31 March 2011
Taka Taka Rs. Crore Rs. Crore
Turnover
Cost of sales
Gross profi t
General and administrative expenses 12 1,569,982 684,148 0.10 0.04
Results from operating activities (1,569,982) (684,148) (0.10) (0.04)
Finance income 13 3,383,312 2,844,997 0.22 0.19
Profi t before tax 1,813,330 2,160,849 0.12 0.15
Tax expenses:
Current tax expenses 14 6,016,279 – 0.39 –
(Loss)/profi t for the year (4,202,949) 2,160,849 (0.27) 0.15
Note: The exchange rate use to convert Taka to Rs.<0.695>/(Previous year Taka to Rs.<0.621>)
___________________________________________________________________________________________________The annexed notes 1 to 18 form an integral part of these fi nancial statements.
Debashish Neogi Vijay Subramaniam Director Director
As per our report of same date.
Rahman Rahman Huq Auditor
Dhaka, 30 October 2012

5757
M B L INDUSTRIES L I M I T E D
CASH FLOWS STATEME NT
As at September 30,
2012 2011 2012 2011 Taka Taka Rs. Crore Rs. Crore
Cash fl ows from operating activities
(Loss)/profi t for the year (4,202,949) 2,160,849 (0.27) 0.14
Adjustment for income tax expense 6,016,279 – 0.39 –
1,813,330 2,160,849 0.12 0.14
Changes in:
Liabilities for expenses 120,250 (40,250) 0.01 –
Other liabilities 201,314 60,600 0.01 –
Accrued interest (32,689) (408,219) 0.01 (0.03)
Cash generated from operation 2,102,205 1,772,980 0.14 0.11
Tax paid (2,315,921) (243,678) (0.15) (0.02)
Net cash (used in)/generated from operating activities
(213,716) 1,529,302 (0.01) 0.09
Cash fl ows from investing activities – – – –
Net cash from investing activities – – – –
Cash fl ows from fi nancing activities – – – –
Net cash from fi nancing activities – – – –
Net (decrease)/increase in cash and cash equivalents
(213,716) 1,529,302 (0.01) 0.1
Cash and cash equivalents at 1 October 30,545,235 29,015,933 1.98 1.89
Cash and cash equivalents 30 September 30,331,519 30,545,235 1.97 1.99
Note: The exchange rate use to convert Taka to Rs.<0.695>/(Previous year Taka to Rs.<0.621>)

58
M B L INDUSTRIES L I M I T E D
58
STATEMENT OF CHANGES IN SHAREHOLDERS’ EQUITY
Share capital
Retained earnings
Total Share capital
Retained earnings
Total
Taka Taka Taka Rs.Crore Rs.Crore Rs.Crore Balance at 1 October 2010 1,000,000 24,998,799 25,998,799 0.07 1.62 1.69
Profi t for the year – 2,160,849 2,160,849 – 0.14 0.14
Balance at 30 September 2011 1,000,000 27,159,648 28,159,648 0.07 1.76 1.83 Balance at 1 October 2011 1,000,000 27,159,648 28,159,648 0.06 1.74 1.8
Loss for the year – (4,202,949) (4,202,949) – (0.27) (0.27)
Balance at 30 September 2012 1,000,000 22,956,699 23,956,699 0.06 1.47 1.53
Note: The exchange rate use to convert Taka to Rs.<0.695>/(Previous year Taka to Rs.<0.621>)

5959
M B L INDUSTRIES L I M I T E D
NOTES TO THE FINANCIAL STATEMENTSfor the year ended 30 September 2012
1. Reporting entity
1.1 Company profi le
MBL Industries Limited ("the company") is a private limited company incorporated on 2 August 2003 in Bangladesh under the Companies Act 1994. The company is a wholly owned subsidiary of Marico Middle East FZE (MME) which is a 100% subsidiary of Marico Limited, India.
1.2 Registered offi ce
The address of the registered offi ce of the company is at House no. 1, Road no. 1, Sector no. 1, Uttara Model Town, Dhaka-1230.
1.3 Nature of business
The principal activities of the company are import trading and local trading, marketing and selling of coconut oil and hair code.
The main operation of the entity was discontinued since 2009. No sales has taken place for the year.
2. Basis of preparation
2.1 Statement of compliance
These fi nancial statements have been prepared in accordance with Bangladesh Financial Reporting Standards, and the Companies Act 1994.
2.2 Date of authorisation
The Board of Directors has authorised these fi nancial statements on 31 October 2012.
2.3 Basis of measurement
The fi nancial statements have been prepared on historical cost convention.
2.4 Functional and presentational currency
The fi nancial statements are presented in Bangladeshi Taka (Taka), which is the company's functional currency. The fi gures of fi nancial statements have been rounded off to the nearest taka.
2.5 Reporting period
The fi nancial statements of the company covered one year from 1 October 2011 to 30 September 2012 and is followed consistently.
2.6 Use of estimates and judgments
The preparation of the fi nancial statements in conformity with Bangladesh Financial Reporting Standards, requires management to make judgment, estimates and assumptions that affect the application of accounting policies and the reported amounts of assets, liabilities, income and expenses. Actual results may differ from these estimates.
Estimates and underlying assumptions are reviewed on an ongoing basis. Revisions to accounting estimates are recognised in the period in which the estimate is revised and in any future periods affected.
2.7 Going concern
The fi nancial statements have been prepared on a going concern basis, which means the company will be able to continue in operational existence for the foreseeable future by meeting its liabilities as they fall due for payment.
3. Signifi cant accounting policies
The accounting policies set out below have been applied consistently (otherwise as stated) to all periods presented in these fi nancial statements.

60
M B L INDUSTRIES L I M I T E D
60
NOTES TO THE FINANCIAL STATEMENTSfor the year ended 30 September 2012
3.1 Revenue recognition
Revenue is recognised when the signifi cant risks and rewards of ownership have been transferred to the distributors. Revenue is measured at fair value of the consideration received or receivable, net of allowance, trade discounts and Value Added Tax (VAT).
3.2 Cash and cash equivalents
Cash and cash equivalents comprise cash in hand, cash at bank and fi xed deposits.
The net cash fl ow from operating activities is determined by adjusting profi t/(loss) for the year under indirect method as per BAS 7 Statement of Cash Flows.
3.3 Provisions
A provision is recognised in the balance sheet when the company has a legal or constructive obligation as a result of past event and it is probable that an outfl ow of resources embodying economic benefi ts will be require to settle the obligation and a reliable estimate thereof can be made.
3.4 Taxation
Income tax expenses comprises current and deferred tax. Current tax and deferred tax is recognised in profi t or loss except to the extent that its relates to a item recognised directly in equity in which case it is recognised in equity.
3.4.1 Current tax
Current tax is expected tax payable or receivable on the taxable income or loss for the year, using tax rates enacted or substantively enacted at the reporting date, and any adjustment to tax payable in respect of previous years.
3.4.2 Deferred tax
Deferred tax is recognised in respect of temporary differences between the carrying amount of assets and liabilities for fi nancial reporting purpose and the amounts used for taxation purposes. Deferred tax is not recognised for:
a) Temporary differences on the initial recognition of assets or liabilities in a transaction that is not a business combination and that effects neither accounting nor taxable profi t or loss.
b) Temporary differences related to investment in subsidiaries and jointly controlled entities to the extent that it is probable that they will not reverse in the foreseeable future, and
c) Taxable temporary differences arising on the initial recognition of goodwill.
Deferred tax is measured at the tax rates that are expected to be applied to the temporary differences when they reverse, based on the laws that have been enacted or substantively enacted by the reporting date.
Deferred tax assets and liabilities are offset if there is legally enforceable right to offset current tax liabilities and assets, and they relate to income taxes levied by the same tax authority on the same taxable entity, or on different tax entities, but they intend to settle current tax liabilities and assets on a net basis or there tax assets and liabilities will be realised simultaneously.
A deferred tax asset is recognised to the extent that it is probable that future taxable profi ts will be available against which temporary difference can be utilised. Deferred tax assets are reviewed at each reporting date and are reduced to the extent that it is no longer probable that the related tax benefi t will be realised.
3.5 Events after the reporting period
Events after reporting period that provide additional information about the company's position at the balance sheet date or those that indicate the going concern assumption is not appropriate, are refl ected in the fi nancial statements. Events after the reporting period that are non-adjusting events are disclosed in the notes when material.

6161
M B L INDUSTRIES L I M I T E D
NOTES TO THE FINANCIAL STATEMENTSfor the year ended 30 September 2012
4. Share capital
As at September 30,2012 2011 2012 2011 Taka Taka Rs. Crore Rs. Crore
Authorized:1,000,000 Ordinary shares of Tk 10 each 10,000,000 10,000,000 0.65 0.65
Paid up:100,000 Ordinary shares of Tk 10 each fully paid up in cash
1,000,000 1,000,000 0.06 0.07
At 30 September 2012, share holding position of the company was as follows:
Number ofshares
Value of shares
TakaMarico Middle East FZE (MME) 99,996 999,960 0.01
Directors (as joint holders with MME) 4 40 –
100,000 1,000,000 0.01
5. Advance income taxAs at September 30,
2012 2011 2012 2011 Taka Taka Rs. Crore Rs. Crore
Opening balance 40,009,557 39,765,879 2.59 2.59
Add: Advance tax paid
TDS on interest 335,063 243,678 0.02 0.02
Under section 74 for assesment year 2011 - 2012
390,354 – 0.03 –
Closing balance 40,734,974 40,009,557 2.64 2.60
6. Accrued interest
Interest on fi xed deposit 1,174,949 1,142,260 0.08 0.07
1,174,949 1,142,260 0.08 0.07
7. Cash and cash equivalents
Cash in hand
Cash at banks: 773,666 4,827,570 0.05 0.31
Citibank, N.A. (SND Account) 1,367,353 717,665 0.09 0.05
Standard Chartered Bank (Call deposit account)
2,141,019 5,545,235 0.14 0.36
Fixed deposits with: 5,000,000 5,000,000 0.32 0.33
Bank Asia Limited 2,000,000 – 0.13 –
Citibank, N.A. 21,190,500 20,000,000 1.37 1.30
Delta Brac Housing Finance Corporation Ltd. 28,190,500 25,000,000 1.82 1.63
30,331,519 30,545,235 1.96 1.99

62
M B L INDUSTRIES L I M I T E D
62
NOTES TO THE FINANCIAL STATEMENTSfor the year ended 30 September 2012
8. Liability for expenses
As at September 30,
2012 2011 2012 2011
Taka Taka Rs. Crore Rs. Crore
Audit fees 230,000 109,750 0.01 0.01
Creditors for imports 473,324 473,324 0.03 0.03
703,324 583,074 0.05 0.04
9. Provision for tax
Opening balance 37,799,831 37,799,831 2.45 2.46
Provision for the year 4,425,776 – 0.29 –
Closing balance 42,225,607 37,799,831 2.73 2.46
10. Payable to holding company
Bank guarantee commission 3,609,981 3,609,981 0.23 0.24
11. Other liabilities
VAT and SD payable 1,639,164 1,463,918 0.11 0.10
Tax deducted at source 106,667 80,600 0.01 0.01
1,745,831 1,544,518 0.11 0.10
12. General and administrative expenses
Professional charges 784,314 672,750 0.05 0.04
Group audit and review fees 371,000 – 0.02 –
Statutory audit fees 345,000 – 0.02 –
Bank charges 8,120 11,398 – –
Legal fees 61,548 – – –
1,569,982 684,148 0.10 0.04
13. Finance income
Interest on SND account 38,123 45,528 – –
Interest on fi xed deposits 3,345,189 2,799,469 0.22 0.18
3,383,312 2,844,997 0.22 0.19
14. Current tax expenses
Current year tax expense 233,635 – 0.02 –
Prior year tax expense:
For 2005 79,749 – 0.01 –
For 2006 1,510,755 – 0.10 –
For 2009 3,067,454 – 0.20 –
For 2010 880,340 – 0.06 –
For 2011 244,346 – 0.02 –
6,016,279 – 0.39 –

6363
M B L INDUSTRIES L I M I T E D
NOTES TO THE FINANCIAL STATEMENTSfor the year ended 30 September 2012
15. Number of employees
MBL Industries Limited has no employee since July 2009. The employees of Marico Bangladesh Limited provide support for continuing its operations. Preparation and presentation of the fi nancial statements was also done by the employees of Marico Bangladesh Limited.
16. Capital expenditure commitment
There is no such commitment as at 30 September 2012.
17. Events after the reporting period
No material events had occurred after the date of balance sheet to the date of issue of these fi nancial statements, which could affect the values stated in the fi nancial statements or required disclosure in the notes.
18. General
Previous year’s figures have been rearranged wherever considered necessary to conform to current year’s presentation.

64
K A Y A L I M I T E D
Board of Directors Harsh Mariwala, Chairman & Managing Director Ravindra Mariwala Rajen Mariwala Rishabh Mariwala
Company Secretary Deepali Herror (Upto April 10, 2013)
Registered Offi ce Rang Sharda, K. C. Marg Bandra Reclamation, Bandra (W), Mumbai – 400 050
Auditors M/s. Price Waterhouse Chartered Accountants
Internal Auditors M/s. Ernst & Young LLP Chartered Accountants
Bankers Citibank NA HDFC Bank Limited ICICI Bank Limited Standard Chartered Bank
Website www.kayaclinic.com

65
K A Y A L I M I T E D
DIRECTORS’ REPORTTo
The Members
Your Board of Directors (“Board”) is pleased to present the Tenth Annual Report together with audited accounts of your Company for the year ended March 31, 2013.
FINANCIAL RESULTS - AN OVERVIEW
During the year under review, your Company reported total revenue of Rs. 143.66 Crore and incurred an operating loss of Rs.29.75 Crore.
Year ended March 31,
2013 2012Rs. Crore Rs. Crore
Total Revenue 143.66 141.74
Profi t / (Loss) Before Tax and Exceptional Items (19.74) (2.51)
Exceptional Items (10.02) (0.46)
Profi t / (Loss) Before Tax (29.75) (2.97)
Profi t / (Loss) Before Tax from Continuing Operations (29.75) (2.97)
Less : Provision for Tax for Current Period
(Fringe Benefi t Tax +Deferred Tax) (0.0) (0.02)
Profi t / (Loss) after Tax from Continuing Operations (29.75) (2.94)
Profi t / (Loss) Before Tax from Discontinuing Operations (0.00) (0.00)
Less: Provision for Tax for Current Period
(Fringe Benefi t Tax +Deferred Tax) (0.00) (0.00)
Profi t / Loss after Tax from Discontinuing Operations (0.00) (0.00)
Total Profi t / (Loss) after Tax for current period (29.75) (2.94)
Add: Profi t / (Loss) Brought Forward (75.00) (72.06)
Profi t / (Loss) carried forward (104.75) (75.00)
DISTRIBUTION TO SHAREHOLDERS
No dividend is being proposed for the fi nancial year under review.
REVIEW OF OPERATIONS
The business of your company comprises offering skin care solutions to its customers. The service revenue includes packaged services for which the consideration is collected upfront towards services to be availed by the customers over a period of time. These advances are non-refundable and hence are designed to constitute revenue at some point of time in the future. Based on actual utilization of services by customers against each package within its validity period, your company had been recognizing revenue and parking the balance as deferred revenue for which advance payments have been received insofar as packaged services are concerned. Accordingly, during the year under review, additional amounts of Rs. 1.03 Crore collected during the period in respect of which services have been considered to be pending to be rendered as at the period end have been deferred for recognition upon rendering of services in the subsequent periods. Total deferred collection as on 31st March 2013 stands at Rs. 35.07 Crore. The deferred collections are included under the head Current Liabilities. However these advances are non-refundable and hence are designed to constitute revenue at some point of time in the future.
Accounting standard require impairment testing on a clinic by clinic basis. The company has carried this out during the year under review which resulted in an additional impairment of Rs. 10.02 Crores (shown as Exceptional Item in the table above). Your company however remains confi dent about the potential of the Kaya business as a whole. An application of the impairment test to the business as a whole would yield a positive result as other clinics are performing well.
66
K A Y A L I M I T E D
DIRECTORS’ REPORTYour company’s turnover comprises service revenue and product revenue. In FY13, the company clocked a service turnover of Rs. 110.80 Crores as against Rs. 98.98 Crores during FY12. The sale of the skin care products of your Company increased to Rs. 32.53 Crores in FY13 from Rs. 30.65 Crores in FY12.
The management believes that the building blocks are in place for turning in a better operating and fi nancial performance in future.
OTHER CORPORATE DEVELOPMENTS
Restructuring of businesses, corporate entities and organizations belonging to the Marico Group
The Board of Directors of Marico Limited (“Marico”), the holding Company at its meeting held on January 7, 2013, passed a resolution approving restructuring of Marico’s businesses, corporate entities and organization, effective April 1, 2013.
This restructuring is a proactive step to build on Marico’s sustained value creation, taking into account
• the increasing convergence of businesses in Consumer Products in India (Current CPB) and the International Business Group (Current IBG) and
• Kaya’s distinct potential to create value as an independent business.
Kaya business which is currently housed under Marico will be demerged into Marico Kaya Enterprises Limited (“MaKE”), a newly incorporated skin care solutions business company by Marico. MaKE will eventually house the Kaya Business through its subsidiaries in India and overseas.
As a consideration, the shareholders of Marico as on the record date shall be issued 1 share of MaKE with a face value of Rs. 10 each for every 50 shares of Marico with a face value of Rs. 1 each.
Consequently, the shareholding structure of MaKE will mirror the shareholding structure of Marico Limited.
The corporate entity restructuring is subject to shareholder, creditors, lenders and other contractual, statutory and regulatory approvals as may be required.
Conversion of outstanding loan due to Marico Limited (“Marico”), the holding Company into equity capital and subsequent allotment of Equity Shares on Rights basis
The Board of Directors of the Company, at their meeting held on March 1, 2013, approved the conversion of outstanding loan of Rs. 1,088,416,875, as on February 28, 2013 due to Marico into equity capital. The said conversion was carried out by way of issue and allotment of equity shares on Rights basis. Subsequently, the Company allotted 33,48,975 equity shares of face value of Rs. 10 each at a premium of Rs. 315 each to Marico on March 18, 2013. This resulted in an increase of equity share capital by Rs. 3,34,89,750 and securities premium reserve by Rs. 1,05,49,27,125.
Transfer of KME ownership from MME to DIAL
To align the shareholding in Kaya’s skin care business so as to integrate the ownership under the Company; in view of the aforementioned de-merger by Marico in Kaya’s skin care business, the shareholders of Marico Middle East FZE in their meeting held on March 18, 2013 approved disinvestment of 100% stake in Kaya Middle East FZE to Derma Rx International Aesthetics Pte. Ltd (DIAL), wholly owned subsidiary of the Company for a consideration of 55,050,000 UAE Dirhams. The disinvestment was effected through a share purchase agreement between MME and DIAL dated February 7, 2013 subject to approval from Hamriyah Free Zone Authority (HFZA). Post approval it became a wholly owned subsidiary of DIAL.
Personnel Movements
During the year under review, Ms. Deepali Heroor, Company Secretary of the Company resigned from the offi ce of Company Secretary with effect from the close of working hours on April 10, 2013. The Company is in the process of recruiting a suitable candidate possessing the prescribed qualifi cation.
Further, Mr. Ajay Pahwa, the Chief Executive Offi cer of the Company resigned with effect from April 30, 2013 and Mr. Vijay Subramaniam took over as the Chief Executive Offi cer of the Company, effective April 1, 2013. During his association with the Company, Mr. Ajay Pahwa led maiden acquisition of DRx Clinic which strengthened Company’s product and service portfolio

67
K A Y A L I M I T E D
DIRECTORS’ REPORTand he also created a culture of customer centricity with cost consciousness which enabled the business to improve margins. The management wishes to express their deep and sincere appreciation towards the contribution made by Mr. Ajay Pahwa during his association with the company.
PUBLIC DEPOSITS
During the year, your Company did not accept any Public Deposits.
CONSERVATION OF ENERGY
Your Company’s operations are not energy-intensive and as such at present no additional investments and proposals are contemplated for reduction of consumption of energy. However, your Company is conscious of the importance of conserving energy and continuous monitoring is done in each of the clinics to reduce any wastage.
RESEARCH & DEVELOPMENT (R & D)
During the year under review, your Company continued its efforts to launch new products and services. Certain new products launched are Balancing Cleansing Gel, Rebalancing Mist, Calming Moisturiser, Recharging Moisture Concentrate, Brightening Serum, Brightening & Firming Eye Serum, Derma Stemness Benefactor, Derma Stemness Reviving Serum, Refi ning Mist, All Day Brightening Cream, Overnight Brightening Nourisher, Skin Awakening Rinse, Skin Awakening Gel, Overnight Skin Replenisher, Acne Free Purify Spot Corrector etc.
TECHNOLOGY ABSORPTION, ADAPTATION AND INNOVATION
Your Company invests actively in training its in-clinic staff to gain expertise of the equipment imported to impart the various skin care services. Such training creates a learning curve, which helps the staff absorb any new techniques that may get introduced from time to time as and when a new service is introduced.
FOREIGN EXCHANGE EARNING AND OUTGO
Foreign exchange earning and outgo during the period is as mentioned in Schedule No. “31 & 32”.
PARTICULARS OF EMPLOYEES
Your Company had no employee of the category indicated under Section 217 (2A) of the Companies Act, 1956 read with the Companies (Particulars of Employees) Rules, 1975 and the Companies (Particulars of Employees) Rules, 2011 as amended from time to time. Your Company has therefore no particulars to disclose under these rules.
DIRECTORS’ RESPONSIBILITY STATEMENT
Pursuant to Section 217(2AA) of the Companies Act, 1956 (the Act), amended by the Companies (Amendment) Act, 2000, the Directors confi rm that:
1. In preparation of the Annual Accounts of your Company, the Accounting Standards, laid down by the Institute of Chartered Accountants of India from time to time, have been followed and that no material departures have been made from the same;
2. Appropriate accounting policies have been selected and applied consistently, and reasonable and prudent judgment and estimates have been made so as to ensure that the accounts give a true and fair view of the state of affairs of your Company as at March 31, 2013 and the profi ts of your Company for the year ended on that date;
3. Proper and suffi cient care has been taken for maintenance of appropriate accounting records in accordance with the provisions of the Act for safeguarding the assets of your Company and for preventing and detecting fraud and other irregularities;
4. The annual accounts have been prepared on a going concern basis;
Further, your Directors also confi rm that the observations of the Auditors in their report to the Members have been adequately dealt with in the relevant notes to the accounts. Hence no additional explanation is considered necessary.

68
K A Y A L I M I T E D
DIRECTORS’ REPORTDIRECTORS
Director retiring by rotation
Mr. Rajen Mariwala, Director of the Company, is liable to retire at the ensuing Annual General Meeting pursuant to the provisions of Section 256 of the Companies Act, 1956 and being eligible offers himself for re-appointment.
STATUTORY AUDITORS
M/s. Price Waterhouse, Chartered Accountants, retires at the ensuing Annual General Meeting and have confi rmed their eligibility for reappointment.
COST AUDITORS
Your Company appointed M/s. Ashwin Solanki & Associates, Cost Accountants, Mumbai, to conduct the cost audit compliance for the fi nancial year ended March 31, 2013.
INTERNAL AUDITORS
Ernst & Young LLP, Chartered Accountant Firm, has been associated with your Company from the fi nancial year 2012-13 as its internal auditor partnering your Company in the area of risk management and internal control systems.
ACKNOWLEDGEMENT
The Board takes this opportunity to thank all its employees for their dedicated service and fi rm commitment to the goals of the Company. The Board also wishes to place on record its sincere appreciation for the wholehearted support received from bankers and all other business associates and looks forward to continued support of all these partners in progress.
On behalf of the Board of Directors
Place: Mumbai Harsh Mariwala
Date: April 30, 2013 Chairman & Managing Director

69
K A Y A L I M I T E D
INDEPENDENT AUDITORS’ REPORTTo
THE MEMBERS OF KAYA LIMITEDReport on the Financial Statements1. We have audited the accompanying fi nancial statements of Kaya Limited (the “Company”), which comprise the Balance Sheet
as at March 31, 2013, the Statement of Profi t and Loss and Cash Flow Statement for the year then ended, and a summary of signifi cant accounting policies and other explanatory information, which we have signed under reference to this report.
Management’s Responsibility for the Financial Statements2. The Company’s Management is responsible for the preparation of these fi nancial statements that give a true and fair view
of the fi nancial position, fi nancial performance and cash fl ows of the Company in accordance with the Accounting Standards referred to in sub-section (3C) of section 211 of ‘the Companies Act, 1956’ of India (the “Act”). This responsibility includes the design, implementation and maintenance of internal control relevant to the preparation and presentation of the fi nancial statements that give a true and fair view and are free from material misstatement, whether due to fraud or error.
Auditors’ Responsibility3. Our responsibility is to express an opinion on these fi nancial statements based on our audit. We conducted our audit in
accordance with the Standards on Auditing issued by the Institute of Chartered Accountants of India. Those Standards require that we comply with ethical requirements and plan and perform the audit to obtain reasonable assurance about whether the fi nancial statements are free from material misstatement.
4. An audit involves performing procedures to obtain audit evidence, about the amounts and disclosures in the fi nancial statements. The procedures selected depend on the auditors’ judgment, including the assessment of the risks of material misstatement of the fi nancial statements, whether due to fraud or error. In making those risk assessments, the auditors consider internal control relevant to the Company’s preparation and fair presentation of the fi nancial statements in order to design audit procedures that are appropriate in the circumstances. An audit also includes evaluating the appropriateness of accounting policies used and the reasonableness of the accounting estimates made by Management, as well as evaluating the overall presentation of the fi nancial statements.
5. We believe that the audit evidence we have obtained is suffi cient and appropriate to provide a basis for our audit opinion.
Opinion6. In our opinion, and to the best of our information and according to the explanations given to us, the accompanying fi nancial
statements give the information required by the Act in the manner so required and give a true and fair view in conformity with the accounting principles generally accepted in India:
(a) in the case of the Balance Sheet, of the state of affairs of the Company as at March 31, 2013;
(b) in the case of the Statement of Profi t and Loss, of the loss for the year ended on that date; and
(c) in the case of the Cash Flow Statement, of the cash fl ows for the year ended on that date.
Report on Other Legal and Regulatory Requirements7. As required by ‘the Companies (Auditor’s Report) Order, 2003’, as amended by ‘the Companies (Auditor’s Report)
(Amendment) Order, 2004’, issued by the Central Government of India in terms of sub-section (4A) of section 227 of the Act (hereinafter referred to as the “Order”), and on the basis of such checks of the books and records of the Company as we considered appropriate and according to the information and explanations given to us, we give in the Annexure a statement on the matters specifi ed in paragraphs 4 and 5 of the Order.
8. As required by section 227(3) of the Act, we report that:
(a) We have obtained all the information and explanations which, to the best of our knowledge and belief, were necessary for the purpose of our audit;
(b) In our opinion, proper books of account as required by law have been kept by the Company so far as appears from our examination of those books;
(c) The Balance Sheet, Statement of Profi t and Loss, and Cash Flow Statement dealt with by this Report are in agreement with the books of account;
(d) In our opinion, the Balance Sheet, Statement of Profi t and Loss, and Cash Flow Statement dealt with by this report comply with the Accounting Standards referred to in sub-section (3C) of section 211 of the Act;
(e) On the basis of written representations received from the directors as on March 31, 2013, and taken on record by the Board of Directors, none of the directors is disqualifi ed as on March 31, 2013, from being appointed as a director in terms of clause (g) of sub-section (1) of section 274 of the Act.
For Price WaterhouseFirm Registration Number: 301112EChartered Accountants
Uday ShahPartnerMembership Number: 46061
Mumbai April 30, 2013

70
K A Y A L I M I T E D
ANNEXURE TO AUDITOR’S REPORT
i. (a) The Company is maintaining proper records showing full particulars, including quantitative details and situation, of fi xed assets.
(b) The fi xed assets are physically verifi ed by the Management according to a phased programme designed to cover all the items over a period of two years which, in our opinion, is reasonable having regard to the size of the Company and the nature of its assets. Pursuant to the programme, a portion of the fi xed assets has been physically verifi ed by the Management during the year and no material discrepancies have been noticed on such verifi cation.
(c) In our opinion, and according to the information and explanations given to us, a substantial part of fi xed assets has not been disposed off by the Company during the year.
ii. (a) The inventory has been physically verifi ed by the Management during the year. In our opinion, the frequency of verifi cation is reasonable.
(b) In our opinion, the procedures of physical verifi cation of inventory followed by the Management are reasonable and adequate in relation to the size of the Company and the nature of its business.
(c) On the basis of our examination of the inventory records, in our opinion, the Company is maintaining proper records of inventory. The discrepancies noticed on physical verifi cation of inventory as compared to book records were not material.
iii. (a) The Company has not granted any secured/ unsecured loans to companies, fi rms or other parties covered in the register maintained under Section 301 of the Act.
(b) The Company has taken interest free unsecured loans from the Holding Company covered in the register maintained under Section 301 of the Act. The maximum amount involved during the year and the year-end balance of such loans aggregated to Rs. 1,151,580,763 and Rs. 1,132,763,978, respectively.
(c) In our opinion, the rate of interest and other terms and conditions of such loans are not prima facie prejudicial to the interest of the Company.
(d) The said loan has not become due for repayment as at the year end.
iv. In our opinion, and according to the information and explanations given to us, there is an adequate internal control system commensurate with the size of the Company and the nature of its business for the purchase of inventory and fi xed assets and for the sale of goods and services. Further, on the basis of our examination of the books and records of the Company, and according to the information and explanations given to us, we have neither come across, nor have been informed of, any continuing failure to correct major weaknesses in the aforesaid internal control system.
v. (a) According to the information and explanations given to us, we are of the opinion that the particulars of all contracts or arrangements that need to be entered into the register maintained under section 301 of the Companies Act, 1956 have been so entered.
(b) In our opinion, and according to the information and explanations given to us, the transactions being in the nature of interest free loans referred in paragraph 3 above and reimbursement of expenses, the question of commenting on comparison with the prevailing market prices at the relevant time does not arise.
vi. The Company has not accepted any deposits from the public within the meaning of Sections 58A and 58AA of the Act and the rules framed there under.
vii. In our opinion, the Company has an internal audit system commensurate with its size and the nature of its business.
viii. We have broadly reviewed the books of account maintained by the Company in respect of products where, pursuant to the rules made by the Central Government of India, the maintenance of cost records has been prescribed under clause (d) of sub-section (1) of Section 209 of the Act, and are of the opinion that, prima facie, the prescribed accounts and records have been made and maintained. We have not, however, made a detailed examination of the records with a view to determine whether they are accurate or complete.
ix. (a) According to the information and explanations given to us and the records of the Company examined by us, in our opinion, the Company is regular in depositing the undisputed statutory dues, including provident fund, employees’ state insurance, income tax, sales tax, service tax, customs duty and other material statutory dues, as applicable, with the appropriate authorities.
Referred to in paragraph 7 of the Auditors’ Report of even date to the members of Kaya Limited on the fi nancial statements for the year ended March 31, 2013

71
K A Y A L I M I T E D
ANNEXURE TO AUDITOR’S REPORT (b) According to the information and explanations given to us and the records of the Company examined by us, the
particulars of dues of sales tax and service tax as at March 31, 2013 which have not been deposited on account of a dispute are as follows:
Name of the statute Nature of dues Amount
(Rs.)
Period to which the amount relates
Forum where the dispute is pending
Finance Act 1994 Service Tax 3,746,436 December 01, 2004 to March 31, 2008
Joint Commissioner – Service Tax
Local sales tax acts of various states
Sales tax and VAT
5,029,137 2005 – 2006 to 2008 – 2009
The appellate deputy commissioner / commercial tax offi cer
x. The accumulated losses of the Company exceeds fi fty percent of its net worth as at March 31, 2013 and it has incurred cash losses in the fi nancial year ended on that date but has not incurred cash losses in the immediately preceding fi nancial year.
xi. As the Company does not have any borrowings from any fi nancial institution or bank, nor has it issued any debentures as at the balance sheet date, the provisions of Clause 4(xi) of the Order are not applicable to the Company.
xii. The Company has not granted any loans and advances on the basis of security by way of pledge of shares, debentures and other securities. Therefore, the provisions of Clause 4(xii) of the Order are not applicable to the Company.
xiii. As the provisions of any special statute applicable to chit fund/ nidhi/ mutual benefi t fund/ societies are not applicable to the Company, the provisions of Clause 4(xiii) of the Order are not applicable to the Company.
xiv. In our opinion, the Company is not dealing in or trading in shares, securities, debentures and other investments. Accordingly, the provisions of Clause 4(xiv) of the Order are not applicable to the Company.
xv. In our opinion, and according to the information and explanations given to us, the Company has not given any guarantee for loans taken by others from banks or fi nancial institutions during the year. Accordingly, the provisions of Clause 4(xv) of the Order are not applicable to the Company.
xvi. The Company has not raised any term loans. Accordingly, the provisions of Clause 4(xvi) of the Order are not applicable to the Company.
xvii. According to the information and explanations given to us and on an overall examination of the balance sheet of the company, we report that the no funds raised on short-term basis have been used for long-term investment.
xviii. The Company has not made any preferential allotment of shares to parties and companies covered in the register maintained under Section 301 of the Act during the year. Accordingly, the provisions of Clause 4(xviii) of the Order are not applicable to the Company.
xix. The Company has not issued any debentures during the year and does not have any debentures outstanding as at the beginning of the year and at the year end. Accordingly, the provisions of Clause 4(xix) of the Order are not applicable to the Company.
xx. The Company has not raised any money by public issues during the year. Accordingly, the provisions of Clause 4(xx) of the Order are not applicable to the Company.
xxi. During the course of our examination of the books and records of the Company, carried out in accordance with the generally accepted auditing practices in India, and according to the information and explanations given to us, we have neither come across any instance of material fraud on or by the Company, noticed or reported during the year, nor have we been informed of such case by the Management.
For Price WaterhouseFirm Registration Number: 301112EChartered Accountants
Uday ShahPartnerMembership Number: 46061
Mumbai April 30, 2013

72
K A Y A L I M I T E D
BALANCE SHEET
Note As at March 31, 2013
As at March 31, 2012
EQUITY AND LIABILITIESSHAREHOLDERS' FUNDSShare capital 3 17.85 14.50
Reserves and surplus 4 16.54 (59.09)
34.39 (44.59)
NON - CURRENT LIABILITIESLong-term borrowings 5 113.28 102.15
Long-term provisions 6 3.63 3.64
116.91 105.79
CURRENT LIABILITIESTrade payables 7 10.26 10.39
Other current liabilities 8 44.83 40.33
Short-term provisions 9 1.72 1.59
56.81 52.31
Total 208.11 113.51ASSETSNON - CURRENT ASSETSFixed assets
- Tangible assets 10 16.40 43.14
- Intangible assets 10 0.44 0.05
- Capital work-in-progress 0.12 2.16
16.96 45.35
Non-current investments 11 104.35 22.98
Long-term loans and advances 12 14.82 17.38
Other non-current assets 13 0.28 0.27
119.45 40.63
CURRENT ASSETSCurrent Investments 14 41.51 –
Inventories 15 14.39 15.63
Trade receivables 16 0.42 0.25
Cash and bank balances 17 3.38 1.29
Short-term loans and advances 18 11.08 9.40
Other current assets 19 0.92 0.96
71.70 27.53
Total 208.11 113.51
The notes are an integral part of these fi nancial statements.
As per our attached report of even date.
For Price Waterhouse For and on behalf of the Board of DirectorsChartered AccountantsFirm Registration Number: 301112E
Uday ShahPartner Harsh Mariwala Rajen MariwalaMembership No. : 46061 Chairman and Managing Director Director
Mumbai: April 30, 2013 Mumbai: April 30, 2013

73
K A Y A L I M I T E D
The notes are an integral part of these fi nancial statements.
As per our attached report of even date.
For Price Waterhouse For and on behalf of the Board of DirectorsChartered AccountantsFirm Registration Number: 301112E
Uday ShahPartner Harsh Mariwala Rajen MariwalaMembership No. : 46061 Chairman and Managing Director Director
Mumbai: April 30, 2013 Mumbai: April 30, 2013
Note Year ended March 31, 2013
Year ended March 31, 2012
REVENUE :Revenue from operations 22 143.34 129.63
Other income 23 0.32 12.11
TOTAL REVENUE 143.66 141.74
EXPENSES:Cost of material consumed 24 13.23 7.70
Purchases of stock-in-trade 0.44 1.51
Changes in inventories of fi nished goods, work-in-process and stock-in-trade - (Increase) / decrease
25 (2.72) 0.14
Employee benefi ts expenses 26 36.46 30.48
Finance costs 27 2.23 2.02
Depreciation and amortisation expenses 10 10.27 9.57
Other expenses 28 103.49 92.83
TOTAL EXPENSES 163.40 144.25
PROFIT / (LOSS) BEFORE EXCEPTIONAL ITEMS AND TAX
(19.74) (2.51)
Exceptional Items - expenses 29 10.02 0.46
PROFIT / (LOSS) BEFORE TAX (29.76) (2.97)Tax Expenses
- Current tax (Refer note 40(a)) – –
- Deferred tax (Refer note 40(b)) – –
- Fringe benefi t tax - prior year adjustments – (0.02)
PROFIT / (LOSS) FOR THE YEAR (29.76) (2.95)Earnings per equity share: [Nominal Value per share: Rs.10 (Previous year - Rs.10)]
38
Basic (20.34) (2.03)
Diluted (20.34) (2.03)
STATEMENT OF PROFIT AND LOSS

74
K A Y A L I M I T E D
CASH FLOW STATEMENTYear ended March 31
March 31, 2013
March 31, 2013
Rs. Rs.
A CASH FLOW FROM OPERATING ACTIVITIESProfi t / (Loss) before taxation (29.75) (2.97)Adjustments for:Depreciation and amortisation expenses 10.27 9.57Provision for impairment of fi xed assets (Refer note 29) 10.02 0.46Finance costs 2.23 2.02Interest income (0.01) (0.01)Irrecoverable balances written off 0.26 0.42Provision no longer required written back (0.17) –Loss / (profi t) on sale / discarding of assets (net) 2.92 (0.07)Profi t on sale of current investments (0.00) –Dividend Income (0.00) (11.96)Provision for doubtful debts 0.03 –
25.55 0.42Operating profi t / (loss) before working capital changes (4.20) (2.54)Adjustments for:(Increase) / decrease in inventories 1.24 (1.68)(Increase) / decrease in trade receivables (0.20) 0.02(Increase) / decrease in loans and advances and other current and non-current assets 0.67 (0.82)Increase / (decrease) in trade payables and other current and non-current liabilities and provisions 4.66 10.50
6.37 8.02Cash generated from / (used in) operations 2.17 5.48Taxes paid 0.00 2.83NET CASH INFLOW / (OUTFLOW) FROM OPERATING ACTIVITIES 2.17 2.65
B CASH FLOW FROM INVESTING ACTIVITIESPurchase of fi xed assets (8.39) (6.68)Sale of fi xed assets 13.57 0.29Investments in a subsidiary (81.37) –Purchase of Current Investments - in mutual funds (net) (41.51) –Dividend income received 0.00 11.96Interest income received 0.00 0.00NET CASH OUTFLOW FROM INVESTING ACTIVITIES (117.70) 5.57
C CASH FLOW FROM FINANCING ACTIVITIESLoans taken / (repaid) from the Holding Company (net of repayments) 11.13 (5.87)Proceeds from issuance of Share capital on rights basis 108.73 –Finance costs paid (2.23) (2.02)NET CASH INFLOW FROM FINANCING ACTIVITIES 117.63 (7.89)
D NET INCREASE / (DECREASE) IN CASH & CASH EQUIVALENTS 2.09 0.31E Cash and cash equivalents - opening balance (Refer note 17) 1.29 0.98F Cash and cash equivalents - closing balance (Refer note 17) 3.38 1.29
Notes:1. The above cash fl ow statement has been prepared under the ‘Indirect Method’ as set out in the Accounting Standard – 3
on Cash Flow Statements, as specifi ed in the Companies (Accounting Standards) Rules, 2006.2. Previous year fi gures have been regrouped where necessary.
The notes are an integral part of these fi nancial statements.
As per our attached report of even date.
For Price Waterhouse For and on behalf of the Board of DirectorsChartered AccountantsFirm Registration Number: 301112E
Uday ShahPartner Harsh Mariwala Rajen MariwalaMembership No. : 46061 Chairman and Managing Director Director
Mumbai: April 30, 2013 Mumbai: April 30, 2013

75
K A Y A L I M I T E D
1. GENERAL INFORMATION
Kaya Limited (‘Kaya’ or the ‘Company’), headquartered in Mumbai, India a wholly owned subsidiary of Marico Limited, carries on skin care business through Kaya Skin Clinics. The clinics offer skin care solutions using scientifi c dermatological procedures and products.
Further, as per the Scheme of Arrangement between Marico Limited and Marico Kaya Enterprises Limited (‘MaKE’), which is subject to requisite approvals, the Company will become a wholly owned subsidiary of MaKE with appointed date of April 1, 2013.
2. SUMMARY OF SIGNIFICANT ACCOUNTING POLICIES
a) Basis of preparation of fi nancial statements:
The fi nancial statements are prepared in accordance with Indian Generally Accepted Accounting Principles (“GAAP”) under the historical cost convention on an accrual basis and are in conformity with mandatory accounting standards, as specifi ed in the Companies (Accounting Standards) Rules, 2006 and the other relevant provisions of the Companies Act, 1956.
All assets and liabilities have been classifi ed as current or non-current as per the Company’s normal operating cycle and other criteria set out in the Schedule VI to the Companies Act, 1956.
b) Use of Estimates:
The preparation of the fi nancial statements in conformity with GAAP requires management to make estimates and assumptions that affect the reported balances of assets and liabilities and disclosures relating to contingent assets and liabilities as at the date of the fi nancial statements and reported amounts of income and expenses during the year. Examples of such estimates include provision for doubtful debts, future obligations under employee retirement benefi t plans, income taxes, the useful lives and provision for impairment of fi xed assets and intangible assets.
Management believes that the estimates used in the preparation of fi nancial statements are prudent and reasonable. Future results could differ from these estimates.
c) Tangible assets, intangible assets and capital work-in-progress:
Tangible assets and intangible assets are stated at cost of acquisition, less accumulated depreciation / amortisation and impairment loss, if any. Cost includes taxes, duties, freight and other incidental expenses related to acquisition and installation. Pre-operative expenses incidental and related to setting up of new clinics have been included under capital work-in-progress. Such expenditure are capitalised to fi xed asset upon start of operations of the clinic.
Capital work in progress comprises cost of fi xed assets that are not yet ready for their intended use at the year end.
d) Depreciation / amortization:
1) Tangible assets
(i) Depreciation is provided on Straight line basis at higher of the rates based on useful lives of the assets as estimated by the management or those stipulated in Schedule XIV to the Companies Act, 1956. The useful lives of the following assets as estimated by the management are higher from the rates prescribed under Schedule XIV to the Companies Act, 1956:
Computer hardware, related peripherals etc. – 33.33%
Technologically advanced machineries – 14.29% to 50%
Other plant and equipment – 11.11% to 50%
Furniture and fi xtures (Including lease hold improvements) – 11.11%
NOTES TO FINANCIAL STATEMENTS

76
K A Y A L I M I T E D
(ii) The useful life of leasehold improvements are estimated taking into consideration lease period including the renewal option. Leasehold improvements includes provision for site restoration costs which are recognised based on the estimates made by management for probable liability towards restoration of these premises at the end of lease period.
(iii) Assets individually costing Rs. 5,000 or less are depreciated fully in the year of acquisition.
(iv) Depreciation on additions during the year is charged from the month in which the assets are capitalized and for deletions up to the month prior to the month in which the asset is disposed off.
2) Intangible assets
Intangible assets are amortised over their respective individual estimated useful lives on a straight line basis, but not exceeding the period given here under:
Computer softwares – 33.33%
Trade marks / copyrights – 10.00%
e) Impairment:
Assessment is done at each Balance Sheet date as to whether there is any indication that an asset (tangible and intangible) may be impaired. For the purpose of assessing impairment, the smallest identifi able group of assets that generates cash infl ows from continuing use that are largely independent of the cash infl ows from other assets or groups of assets, is considered as a cash generating unit. If any such indication exists, an estimate of the recoverable amount of the asset/cash generating unit is made. Assets whose carrying value exceeds their recoverable amount are written down to the recoverable amount. Recoverable amount is higher of an asset’s or cash generating unit’s net selling price and its value in use. Value in use is the present value of estimated future cash fl ows expected to arise from the continuing use of an asset and from its disposal at the end of its useful life. Assessment is also done at each Balance Sheet date as to whether there is any indication that an impairment loss recognised for an asset in prior accounting periods may no longer exist or may have decreased.
f) Investments:
Long-term investments are valued at cost. Provision for diminution, if any, in the value of investments is made to recognize a decline, other than temporary. Current investments are valued at lower of cost and fair value, computed individually for each investment. In case of investments in mutual funds which are unquoted, net asset value is taken as fair value.
g) Inventories:
1) Raw materials, packing materials, stores, spares and consumables are valued at lower of cost and net realizable value. However, these items are considered to be realizable at cost if the fi nished products in which they will be used are expected to be sold at or above cost.
2) Finished goods, stock-in-trade and work-in-progress are valued at lower of cost and net realizable value.
3) Cost is ascertained on weighted average method and in case of fi nished products and work-in-progress, it includes appropriate production overheads and duties.
h) Research and development:
Capital expenditure on research and development is capitalized and depreciated. Revenue expenditure is chargedoff in the year in which it is incurred.
i) Revenue recognition:
1) Income from services is recognized on rendering of services and are recorded net of discounts and service tax.
2) Income from package sale is recognized based on the utilisation of sessions by the customers.
NOTES TO FINANCIAL STATEMENTS

77
K A Y A L I M I T E D
3) Sale of products is recognized on delivery, which is when risks and rewards of ownership passed to the customers, and are recorded net of trade discounts, sales tax and value added tax.
j) Retirement benefi ts:
1) Long-term employee benefi ts
(i) Defi ned contribution plans
The Company has defi ned contribution plan for post employment benefi ts in the form of provident fund. The Company’s contributions to defi ned contribution plans are charged to the Statement of Profi t and Loss as incurred.
(ii) Defi ned benefi t plans
The Company has defi ned benefi t plans for post employment benefi ts in the form of gratuity and compensated absences. Liability for defi ned benefi t plans is provided on the basis of valuations, as at the Balance Sheet date, carried out by an independent actuary. The actuarial valuation method used for measuring the liability is the projected unit credit method.
2) Actuarial gains and losses due to changes in actuarial assumptions are recognised immediately in the Statement of Profi t and Loss as income or expense.
k) Foreign currency transactions:
1) Transactions in foreign currencies are recognised at the prevailing exchange rates on the transaction dates. Realised gains and losses on settlement of foreign currency transactions are recognised in the Statement of Profi t and Loss.
2) Foreign currency monetary assets and liabilities at the year end are translated at the year end exchange rates, and the resultant exchange difference is recognised in the Statement of Profi t and Loss.
l) Accounting for taxes on income:
1) Provision for current tax is made, based on the tax payable under the Income Tax Act, 1961.
2) Deferred tax on timing differences between taxable income and accounting income is accounted for, using the tax rates and the tax laws enacted or substantively enacted as on the Balance Sheet date. Deferred tax assets on unabsorbed tax losses and unabsorbed tax depreciation are recognized only when there is a virtual certainty of realization and other items are recognized when there is a reasonable certainty of realisation.
m) Assets taken on lease:
1) The assets taken on fi nance lease are capitalized at the inception of the lease at the lower at the fair value of the leased assets and present value of the minimum lease payments. The corresponding amount is recognised as lease liabilities. The principal component in the lease rental is adjusted aganist the lease liability and the interest component is charged to the Statement of profi t and loss.
2) Operating lease payments are recognized as expenditure in the Statement of Profi t and Loss account as per the terms of the lease arrangements. Initial direct cost incurred by the company for operating lease arrangements are amortised over a non cancellable period of lease agreement.
n) Accounting for provision, contingent liabilities and contingent assets:
Provisions are recognised, when there is a present legal or statutory obligation as a result of past events, where it is probable that there will be outfl ow of resources to settle the obligation and when a reliable estimate of the amount of the obligation can be made. Contingent Liabilities are disclosed only when there is a possible obligation arising from past events due to occurrence or non-occurrence of one or more uncertain future events, not wholly within the control of the Company, or where any present obligation cannot be measured in terms of future outfl ow of resources or where a reliable estimate of the obligation cannot be made. Obligations are assessed on an ongoing basis and
NOTES TO FINANCIAL STATEMENTS

78
K A Y A L I M I T E D
only those having a largely probable outfl ow of resources are provided for. Contingent Assets are not recognised in the fi nancial statements.
o) Utilisation of Securities Premium Reserve
Expenses incurred on issue of shares are adjusted against the Securities Premium Reserve.
p) Earnings Per Share
Basic earnings per share is calculated by dividing the net profi t or loss for the year attributable to equity shareholders by the weighted average number of equity shares outstanding during the year. Earnings considered in ascertaining the Company’s earnings per share is the net profi t for the year after deducting preference dividends and any attributable tax thereto for the period. The weighted average number of equity shares outstanding during the period and for all periods presented is adjusted for events, such as bonus shares, other than the conversion of potential equity shares, that have changed the number of equity shares outstanding, without a corresponding change in resources. For the purpose of calculating diluted earnings per share, the net profi t or loss for the period attributable to equity shareholders and the weighted average number of shares outstanding during the period is adjusted for the effects of all dilutive potential equity shares.
NOTES TO FINANCIAL STATEMENTS

79
K A Y A L I M I T E D
(Figures in INR Crores)
As at March 31, 2013 As at March 31, 2012
3. SHARE CAPITAL
(a) Authorised 20.00 20.00
20,000,000 (20,000,000) equity shares of Rs. 10/- each
(b) Issued, subscribed and fully paid-up
17,848,975 (14,500,000) equity shares of Rs. 10/- each fully paid-up
17.85 14.50
Total 17.85 14.50
(c) Reconciliation of number of shares
Number of Shares
Amount Number of Shares
Amount
Balance as at the beginning of the year 14,500,000 145,000,000 14,500,000 145,000,000
Shares issued during the year - Rights issue 3,348,975 33,489,750 – –
Balance as at the end of the year 17,848,975 178,489,750 14,500,000 145,000,000
(d) Rights, preferences and restrictions attached to equity shares -
The Company has one class of equity shares having a par value of Rs. 10 per share. Each shareholder is eligible for one vote per share held. The dividend proposed by the Board of Directors is subject to the approval of the shareholders in the ensuing Annual General Meeting, except in case of interim dividend. In the event of liquidation, the equity shareholders are eligible to receive the remaining assets of the Company after distribution of all preferential amounts, in proportion to their shareholding.
(e) Shares held by the holding company:
Entire share capital is held by Marico Limited, the holding company, including 6 ( 6 ) equity shares held by its nominees.
(f) Details of shares held by shareholders holding more than 5% of the aggregate shares in the Company
No. of Shares held
% of Holding
No. of Shares held
% of Holding
Marico Limited and its nominees 17,848,975 100% 14,500,000 100%
4. RESERVES AND SURPLUS
As at March 31,2013 As at March 31, 2012Securities premium reserve (Refer note 10 (b)):
Balance as at the beginning of the year 15.91 15.91
Add : Receipt on issue of shares during the year (Refer note 3(c)) 105.49 –
Less: Amount adjusted towards share issue expenses 0.11 –
121.29 15.91
Surplus / (Defi cit) in the Statement of Profi t and Loss:
Balance as at the beginning of the year (75.00) (72.06)
Loss for the year (29.75) (2.94)
Balance as at the end of the year (104.75) (75.00)
Total 16.54 (59.09)
NOTES TO FINANCIAL STATEMENTS

80
K A Y A L I M I T E D
5. LONG-TERM BORROWINGS
As at March 31,2013 As at March 31, 2012Unsecured:
Loan from the holding company - Interest free 113.28 102.15
Total 113.28 102.15
The above loan is given by the holding company to provide long-term funding support to the Company. There are no specifi c terms of repayment of the loan.
6. LONG-TERM PROVISIONS
Provision for Employee Benefi ts:
- Provision for gratuity (Refer note 34) 0.43 0.42
0.43 0.42
Other provisions:
- Provision for equalisation of rent expenses (Refer note (a) below) 2.26 2.03
- Provision for site restoration cost (Refer note (b) below) 0.94 1.19
3.20 3.22
Total 3.63 3.64
a) Provision for equalisation of rent expenses represents amounts recorded towards recognition of rent expenses on straight line basis over the lease period.
b) Provision for site restoration cost
Balance as at the beginning of the year 1.43 1.39
Additions 0.15 0.04
Amounts used (0.12) –
Balance as at the end of the year 1.46 1.43
Classifi ed as Non-current: 0.93 1.19
Classifi ed as current: 0.53 0.24
Total 1.46 1.43
The Company uses various leased premises for its clinics. A provision for site restoration cost is recognised for the estimates made for probable liability towards the restoration of these premises at the end of lease period.
7. TRADE PAYABLES
Trade payables 10.26 10.39
Total 10.26 10.39
NOTES TO FINANCIAL STATEMENTS

81
K A Y A L I M I T E D
(a) The disclosure pursuant to the Micro, Small and Medium Enterprises Development Act, 2006 (‘MSMEC Act’) are as follows:
Principal amount due to suppliers registered under the MSMED Act and remaining unpaid as at year end.
– 0.01
Interest due to suppliers registered under the MSMED Act and remaining unpaid as at year end.
– –
Principal amounts paid to suppliers registered under the MSMED Act, beyond the appointed day during the year.
– –
Interest paid other than under Section 16 of MSMED Act to suppliers registered under the MSMED Act, beyond the appointed day during the year.
– –
Interest paid under Section 16 of MSMED Act to suppliers registered under the MSMED Act, beyond the appointed day during the year.
– –
Interest due and payable towards suppliers registered under MAMED Act for payments already made.
– –
Further ineterest remaining due and payable for earlier years. – –
b) Trade payables includes due to subsidiary Rs.4,362,500 (Previous year: Rs.20,667,247)
8. OTHER CURRENT LIABILITIES
Advances from customers 35.08 34.21
Book overdraft – 1.18
Due to the holding company 3.88 0.85
Statutory dues including provident fund and tax deducted at source 1.52 1.57
Creditors for capital goods 0.55 0.02
Employee benefi ts payable 2.35 1.83
Others 1.45 0.67
Total 44.83 40.33
9. SHORT-TERM PROVISIONS
Provision for employee benefi ts: – –
- Provision for gratuity (Refer note 34) 0.23 0.19
Provision for compensated absences (Refer note 34) 0.53 0.54
0.76 0.73
Other provisions: – –
Provision for lease termination cost (Refer note below) 0.05 0.13
Provision for equalisation of rent expenses (Refer note 6(a)) 0.38 0.50
Provision for site restoration cost (Refer note 6(b)) 0.53 0.24
0.96 0.86
Total 1.72 1.59Provision for lease termination costBalance as at the beginning of the year 0.13 0.22
Amounts used 0.08 0.09
Balance as at the end of the year 0.05 0.13
Provision for lease termination cost are towards lock in period rent in respect of certain clinics closed in an earlier year, which are recognized to the extent it is more than probable that outfl ow of resources will be required to settle the transactions.
NOTES TO FINANCIAL STATEMENTS

82
K A Y A L I M I T E D
10.
Fixe
d A
sset
s
GR
OSS
BLO
CK
D E
P R
E C
I A
T I
O N
/ A
M O
R T
I S
A T
I O N
" Im
pairm
ent
loss
as
at
April
1, 2
012
(Ref
er n
ote
c be
low
and
no
te 2
9) "
" Cha
rge
/ (R
ever
sal)
for t
he y
ear
(Ref
er n
ote
29) "
" Im
pairm
ent
loss
as
at
Mar
ch 3
1,
2013
(Ref
er n
ote
29) "
N E
T
B L
O C
K
As a
tAp
ril 1
,20
12
Addi
tions
Ded
uctio
ns /
Adju
stm
ents
As a
t Mar
ch
31, 2
013
Upt
o Ap
ril 1
,
2012
For t
he y
ear
Ded
uctio
ns /
Adju
stm
ents
Upt
o M
arch
31, 2
013
As a
t Mar
ch
31, 2
013
As a
t Mar
ch
31, 2
012
Tang
ible
ass
ets
Build
ings
16.8
7–
16.8
7–
1.24
0.05
1.28
0.00
––
––
15.6
3
Plan
t and
equ
ipm
ent
(Ref
er n
ote
b be
low
)72
.17
4.58
2.32
74.4
348
.94
5.70
1.95
52.6
95.
715.
4911
.21
10.5
317
.52
Offi
ce e
quip
men
t4.
700.
080.
054.
732.
510.
610.
043.
080.
480.
561.
030.
621.
71
Furn
iture
and
fi xt
ures
(Ref
er n
otes
a a
nd b
bel
ow)
19.1
61.
464.
0616
.56
9.35
3.49
3.84
9.00
1.82
3.97
5.78
1.77
7.99
Leas
ehol
d im
prov
emen
ts0.
443.
830.
323.
950.
040.
340.
030.
350.
12–
0.12
3.48
0.29
Tota
l - A
113.
349.
9523
.62
99.6
762
.08
10.1
87.
1465
.12
8.13
10.0
218
.14
16.4
043
.14
Inta
ngib
le a
sset
s
Com
pute
r sof
twar
es1.
990.
480.
002.
461.
870.
090.
001.
960.
07–
0.07
0.43
0.04
Trad
emar
ks /
copy
right
s0.
02–
–0.
020.
000.
00–
0.00
––
–0.
010.
01
Tota
l - B
2.01
0.48
0.00
2.48
1.87
0.09
0.00
1.96
0.07
-0.
070.
440.
05
Tota
l - A
+ B
115.
3510
.43
23.6
210
2.15
63.9
510
.27
7.14
67.0
88.
2010
.02
18.2
116
.84
43.1
8
As a
t Mar
ch 3
1, 2
012
111.
794.
801.
2511
5.34
55.4
39.
571.
0463
.95
7.74
0.46
8.20
43.1
9–
Not
es:
a)
Furn
iture
and
fi xt
ures
als
o in
clud
es le
aseh
old
impr
ovem
ents
, the
am
ount
s fo
r whi
ch is
not
sep
arat
ely
iden
tifi a
ble.
b)
Dur
ing
the
year
end
ed M
arch
31,
200
7, th
e C
ompa
ny h
ad c
arrie
d ou
t fi n
anci
al re
stru
ctur
ing
sche
me
('Sch
eme'
) und
er th
e re
leva
nt p
rovi
sion
s of
the
Com
pani
es A
ct, 1
956.
The
Sch
eme
was
app
rove
d by
the
Sha
reho
lder
s on
Feb
ruar
y 7,
200
7 an
d su
bseq
uent
ly b
y H
on'b
le H
igh
Cou
rt vi
de it
s or
der d
ated
Apr
il 16
, 200
7. In
term
s of
the
Sch
eme,
the
carr
ying
am
ount
of
certa
in it
ems
of p
lant
and
equ
ipm
ents
to th
e ex
tent
of R
s. 7
0,82
5,40
6 an
d fu
rnitu
re a
nd fi
xtur
es to
the
exte
nt o
f Rs.
115
,690
,088
and
rela
ted
defe
rred
tax
liabi
lity
of R
s. 1
,811
,039
and
lo
ss o
f Rs.
240
,000
,000
wer
e ad
just
ed a
gain
st th
e ba
lanc
e in
sec
uriti
es p
rem
ium
rese
rve.
c)
Impa
irmen
t cha
rge
of R
s. 1
00,1
57,9
13 (P
revi
ous
year
Rs.
4,5
66,1
61) i
s re
fl ect
ed a
s "E
xcep
tiona
l Ite
m" i
n th
e S
tate
men
t of P
rofi t
and
Los
s. (R
efer
not
e 29
)
NOTES TO FINANCIAL STATEMENTS

83
K A Y A L I M I T E D
11. NON-CURRENT INVESTMENTS
As at March 31,2013 As at March 31, 2012Long-term
Trade investments (Valued at cost unless otherwise stated)
Investments in equity instruments
Investment in Subsidiary - Unquoted
Derma – Rx International Aesthetics Pte Limited ( wholly owned ) 104.35 22.98
25,554,250 (Previous year 7,000,000) equity shares of 1 SGD each, fully paid *
* These shares have been pledged as a security for loans taken by the said subsidiary.
Total 104.35 22.98Aggregate amount of unquoted investments ( At cost ) 104.35 22.98
12. LONG-TERM LOANS AND ADVANCES
(Unsecured and considered good, unless otherwise stated)
Capital advances – 0.93
Security deposits 10.76 12.50
Balance with Government Authorities (Refer note 20) 0.22 0.22
Prepaid expenses 0.74 0.63
Income tax payments (net of provision for income tax Rs. Nil (Previous year Rs. Nil)*
3.10 3.10
Total 14.82 17.38
* Income tax payments includes Rs. 30,926,510 (Previous year Rs. 30,926,510) towards disputed tax matters pending before appellate authorities. (Refer note 20)
13. OTHER NON-CURRENT ASSETS
(Unsecured and considered good, unless otherwise stated)
Term deposits with banks with maturity period more than 12 months @ 0.14 0.15
Interest accrued on long-term deposits with banks 0.07 0.05
Fringe benefi t tax 0.07 0.07
Total 0.28 0.27
@ Term deposits with bank includes Rs. 71,613 (Previous year Rs.71,613) deposited with sales tax authorities and Rs. 1,333,372 (Previous year Rs. 1,392,419) held as lien by bank against guarantees issued on behalf of the Company.
NOTES TO FINANCIAL STATEMENTS

84
K A Y A L I M I T E D
14. CURRENT INVESTMENTS
(at lower of cost and fair market value)
As at March 31,2013
As at March 31, 2012
Non-trade Short-Term Investments:
Investments in Mutual Funds (Unquoted):Peerless Ultra Short Term Fund Super Institutional Growth 7,731,740 (Nil) Units of Rs. 10 each fully paid
10.00 –
ICICI Prudential Ultra Short Term Regular Plan Growth 8,448,586 (Nil) Units of Rs. 10 each fully paid
10.00 –
Baroda Pioneer Liquid Fund Plan A daily dividend reinvestment 67,024 (Nil) Units of Rs. 1,000 each fully paid
9.00 –
Reliance Liquid Fund-Treasury Plan Growth 24,546 (Nil) Units of Rs. 1.000 each fully paid
7.00 –
JP Morgan India Liquid Fund Super Institutional Growth 2,304,551(Nil) Units of Rs. 10 each fully paid
3.50 –
JP Morgan India Treasury Fund Super Institutional Growth 1,301,084 (Nil) Units of Rs. 10 each fully paid
2.00 –
UTI Money Market Fund Institutional plan Growth 8 (Nil) Units of Rs. 1,000 each fully paid
0.00 –
Religare Liquid Fund Growth 6 (Nil) Units of Rs. 1,000 each fully paid 0.00 –
Kotak Liquid Scheme Plan A Growth 4 (Nil) Units of Rs. 1,000 each fully paid
0.00 –
Peerless Liquid Fund Super Institutional Growth 784 (Nil) Units of Rs. 10 each fully paid
0.00 –
JM High Liquidity Fund Growth Option 315 (Nil) Units of Rs. 10 each fully paid
0.00 –
TOTAL 41.51 –
Aggregate amount of unquoted investments ( At cost ) 41.51 –
15. INVENTORIES (Refer note 2(g) for basis of valuation)
Stores, spares and consumables 5.93 7.77
Raw materials [Includes goods in transit Rs. 4,251,891 (Previous year Rs. Nil)]
1.06 3.59
Packing materials 2.14 1.73
Work-in-process # 0.22 0.39
Finished goods # 4.67 1.83
Stock-in-trade # 0.37 0.32
Total 14.39 15.63
NOTES TO FINANCIAL STATEMENTS

85
K A Y A L I M I T E D
# Skin care products16. TRADE RECEIVABLES
As at March 31,2013
As at March 31, 2012
Unsecured, considered good : – –
Outstanding for a period exceeding 6 months from the date they are due for payment
0.01 0.01
Others 0.42 0.25
0.42 0.25
Unsecured, considered doubtful : – –
Outstanding for a period exceeding 6 months from the date they are due for payment
0.04 0.01
Others – –
0.04 0.01
Less : Provision for doubtful debts 0.04 0.01
Total 0.42 0.25
17. CASH AND BANK BALANCES
Cash and cash equivalents: – –
Cash on hand 0.65 0.86
Bank balances: – –
In current accounts 2.73 0.43
Total 3.38 1.29
18. SHORT-TERM LOANS AND ADVANCES
(Unsecured and considered good, unless otherwise stated) – –
Loans and advances to related parties 0.48 1.08
(Refer Note 36) – –
Other loans and advances – –
Advances to suppliers 1.38 3.44
Balances with Government Authorities 2.06 0.78
Security deposits 5.68 2.90
Prepaid expenses 1.30 1.10
Loans and advances to employees 0.18 0.10
Total 11.08 9.40
19. OTHER CURRENT ASSETS
(Unsecured and considered good, unless otherwise stated) – –
Insurance claims receivable 0.01 0.13
Others: – –
Unsecured, considered good 0.91 0.83
Unsecured, considered doubtful 0.06 0.06
0.97 0.89
Less: Provision for doubtful advances 0.06 0.06
0.91 0.83
Total 0.92 0.96
NOTES TO FINANCIAL STATEMENTS

86
K A Y A L I M I T E D
20. CONTINGENT LIABILITIES
As at March 31,2013
As at March 31, 2012
Claims against the Company not acknowledge as debts
- Income tax matters (Refer note 12) 1.61 6.19
- Sales tax matters 0.72 0.37
- Services tax matters 0.37 0.37
- Claims by the customers 0.38 1.11
Total 3.08 8.04
(a) The Company has been sanctioned cash credit and letter of credit facilities of Rs. 80,000,000 (Rs. 80,000,000) by banks. These facilities are guaranteed by the holding company. Amount outstanding towards these facilities on account of letter of credit is Rs.7,665,261(Previous year Rs. Nil).
21. CAPITAL AND OTHER COMMITMENTS
(a) Capital Commitments
Estimated value of contracts in capital account remaining to be executed (net of capital advances)
0.37 0.31
(b) Other Commitments
Lease termination cost - representing lock-in-period rental under rental agreements 10.53 22.57
22 REVENUE Year endedMarch 31, 2013
Year endedMarch 31, 2012
Revenue from operations:
Sale of products # 32.53 30.65
Sale of services # 110.81 98.98
143.34 129.63
Other operating revenues 0.00 0.00
# Skin care products and services – – Total 143.34 129.63
23. OTHER INCOME
Interest income 0.01 0.01
Dividend income: – –
- On Non current investments (from a subsidiary) – 11.96
- On current investments 0.00 –
Profi t on sale of current investments 0.00 –
Net gain on foreign currency transactions and translation – 0.06
Profi t on sale / discarding of assets (net) – 0.07
Liabilities written back to the extent no longer required 0.17 –
Other non operating income 0.14 0.01
Total 0.32 12.11
24. COST OF MATERIALS CONSUMED (Refer note 33)
Raw materials consumed 7.27 4.63
Packing materials consumed 5.96 3.07
Total 13.23 7.70
NOTES TO FINANCIAL STATEMENTS

87
K A Y A L I M I T E D
25. CHANGES IN INVENTORY OF FINISHED GOODS, WORK IN PROCESS AND STOCK-IN-TRADE
Year endedMarch 31, 2013
Year endedMarch 31, 2012
(Increase) / Decrease in stocks
Stock at the end of the year – –
- Work-in-process 0.22 0.39
- Finished goods 4.67 1.83
- Stock-in-trade 0.37 0.32
Total A 5.26 2.54Less: Stock at the beginning of the year: – –
- Work-in-process 0.39 0.09
- Finished goods 1.83 1.82
- Stock-in-trade 0.32 0.77
Total B 2.54 2.68(Increase) / decrease in stocks (B - A) (2.72) 0.14
26. EMPLOYEE BENEFITS EXPENSES
Salaries, wages and bonus 18.59 19.67
Contribution to provident and other funds 1.06 1.08
Stock appreciation rights expenses 0.04 0.05
Staff welfare expenses 3.50 2.76
Seconded employees cost 13.28 6.92
Total 36.46 30.48
27. FINANCE COSTS
Interest expense 0.01 0.00
Bank charges and commission 2.22 2.02
Total 2.23 2.02
NOTES TO FINANCIAL STATEMENTS

88
K A Y A L I M I T E D
28. OTHER EXPENSES
Year endedMarch 31, 2013
Year endedMarch 31, 2012
"Consumption of consumables and stores and spare parts(Refer note 32)"
21.58 20.41
Contract manufacturing expenses 3.39 1.09
Payments to consultants 13.58 13.90
Electricity expenses 3.85 3.27
Rent (Refer note 37) 23.86 22.11
Repairs and maintenance:
-Plant and machinery 0.40 0.27
-Building 4.71 5.47
-Others 1.57 1.50
6.68 7.24
Insurance 0.33 0.21
Rates and taxes 0.98 0.69
Travelling, conveyance and vehicle expenses 2.42 2.55
Auditors' remuneration
- Statutory audit fees 0.18 0.14
- Tax audit fees 0.02 0.02
- Out of pocket expenses 0.01 0.01
0.21 0.17
Legal and professional charges 2.65 3.49
Printing, stationery and communication expenses 2.89 3.46
Advertisement and sales promotion 15.02 11.12
Freight forwarding and distribution expenses 0.18 0.23
Commission to selling agents – 0.02
Provision for doubtful debts 0.03 –
Irrecoverable balances written off 0.26 0.42
Loss on sale / discarding of assets (net) 2.92 –
Miscellaneous expenses @ 2.66 2.45
Total 103.49 92.83
@ Miscellaneous expences includes Rs.7,170,053 (Previous year Rs. 7367,952) on account of service tax charged by vendor which is not available for input credit
NOTES TO FINANCIAL STATEMENTS

89
K A Y A L I M I T E D
29. EXCEPTIONAL ITEMS
Year endedMarch 31, 2013
Year endedMarch 31, 2012
Impairment loss on fi xed assets 10.02 0.46
Total 10.02 0.46
The Company has, as in the previous year, carried out impairment testing at the clinic level, which the management considers as the relevant cash generating unit. This resulted in an impairment loss of Rs.100,157,913 (Previous year Rs. 4,566,161). The Company has considered a pre tax discount rate of 19% (Previous year 19%) for determining value in use.
30. CIF VALUE OF IMPORTS
Raw materials 2.12 4.60Packing materials 4.56 2.05Consumables 2.63 2.06Capital goods 2.04 3.69Finished goods 0.18 1.27Total 11.53 13.67
31. EXPENDITURE IN FOREIGN CURRENCY
Travelling 0.07 0.10Total 0.07 0.10
32. EARNINGS IN FOREIGN CURRENCY
Revenue from exports on FOB Basis 1.08 0.76Rendering of services 0.15 0.11Dividend from subsidiary – 11.96Others 0.34 0.17Total 1.57 13.00
33. DETAILS OF CONSUMPTION AND PURCHASES
(a) Details of Raw material / Packing material consumed: @
Chemicals 7.27 4.63
Packing materials 5.96 3.06
Total 13.23 7.69
@ Consumption of raw materials and packing material include consumption by third parties under contract with the Company and consumption in respect of samples.
(b) Value of imported and indigenous materials consumed:
RAW MATERIALS March 31, 2013 March 31, 2012Amount % Amount %
Imported 4.28 59% 2.09 45%Indigenous 2.99 41% 2.54 55%
Total 7.27 4.63Stores and spare parts:Imported 2.68 12% 4.17 20%Indigenous 18.90 88% 16.25 80%Total 21.58 20.42
(c) Purchase of stock-in-trade:
Skin care products 0.44 1.51Total 0.44 1.51
NOTES TO FINANCIAL STATEMENTS

90
K A Y A L I M I T E D
34. DISCLOSURE PURSUANT TO ACCOUNTING STANDARD 15 – EMPLOYEE BENEFITS
a) Brief descriptions of the plans:
The Company has various schemes for long-term benefi ts such as provident fund and gratuity. The Company's contribution to provident fund is defi ned contribution plan, since the Company has no further obligation beyond making the contributions. The Company's defi ned benefi t plans include gratuity. The employees of the Company are also entitled to leave entitlement as per the Company's policy. The defi ned benefi t plans are not funded.
b) Defi ned contribution plan (Provident fund):
The Company has recognised following amount as expenses and included in Employees’ remuneration (Refer Note 26)
For the year ended March 31, 2013
(Rs. Crore)
For the year ended March 31, 2012
(Rs. Crore)Contribution to provident fund 0.77 0.80
Contribution to employee state insurance contribution 0.29 0.28
1.06 1.08
c) Defi ned benefi t plans (Gratuity unfunded):
March 31, 2013(Rs. Crore)
March 31, 2012(Rs. Crore)
I. Actuarial assumptions: 0.80Discount rate 7.75% 8.00%Rate of return on plan assets – –Future salary rise 12.00% 12.00%Attrition rate 45.00% 45.00%
II. Change in defi ned benefi t obligations:Liability at the beginning of the year 0.61 0.58Interest cost 0.05 0.05Current service cost 0.06 0.12Benefi ts paid (0.10) (0.06)Actuarial (gain) / loss on obligations 0.04 (0.08)Liability at the end of the year 0.66 0.61
III. Liability recognised in the Balance Sheet:Liability at the end of the year 0.66 0.61Fair value of plan assets at the end of the year – –Difference (0.66) (0.61)Unrecognised past service cost -- –Liability recognised in the Balance Sheet 0.66 0.61
IV. Expenses recognised in the Statement of Profi t and Loss:Current service cost 0.06 0.12Interest cost 0.05 0.05Expected return on plan assets – –Net actuarial (gain) / loss to be recognized 0.04 (0.08)Past service cost (vested and non vested benefi ts) – –Expense recognised in Statement of Profi t and Loss 0.15 0.09
V. Balance Sheet reconciliation:Opening net liability 0.61 0.58Expenses as above 0.15 0.09Benefi ts paid (0.10) (0.06)Closing net liability 0.66 0.61
March 31, 2013
March 31, 2012
March 31, 2011
March 31, 2010
March 31, 2009
VI. Experience adjustments:On plan liability (gain) /Loss
0.04 (0.07) 0.15 0.03 (0.00)
NOTES TO FINANCIAL STATEMENTS

91
K A Y A L I M I T E D
As at March 31, 2013 (Rs. Crore)
As at March 31, 2012 (Rs. Crore)
Closing net liability (as above)
Classifi ed as short-term 0.23 0.19
Classifi ed as long-term 0.43 0.42
The estimates of future salary increases considered in actuarial valuation, takes account of infl ation, seniority, promotion, and other relevant factors such as supply and demand factors in the employment market.
d) Leave Encashment:
The Company permits encashment of privileged leave (except sick leave) accumulated by its employees on retirement, separation and during the course of service. The liability for unexpired leave is determined and provided on the basis of actuarial valuation at the Balance Sheet date. The privileged leave liability is not funded.
Amount recognized in the Balance Sheet and movements in net liability:
Particulars March 31, 2013 March 31, 2012
Opening Balance of Compensated Absences (a) 0.54 0.62
Present value of Compensated Absences(As per actuary valuation) as at the year end (b)
0.53 0.54
Unfunded liability of Compensated Absences recognized in the Statement of Profi t and Loss
For the year (b – a) (0.01) (0.08)
35. SEGMENT REPORTING:
Primary Segment:
In accordance with Accounting Standard 17 – “Segment Reporting”, the Company has determined its business segment as ‘Skin Care’. Since, 100% of the Company’s business is from providing specialized skin care services and other related products, there are no other primary reportable segments. Thus, the segment revenue, segment results, total carrying amount of segment assets, total carrying amount of segment liabilities, total cost incurred to acquire segment assets, total amount of charge for deprecation during the year is refl ected in the Financials Statements as of and for the year April 1, 2012 to March 31, 2013.
36. RELATED PARTY DISCLOSURES
a) Names of the related parties and nature of relationship:
(i) Holding Company Marico Limited
(ii) Subsidiaries / fellow subsidiaries Derma Rx international Aesthetics Pte Limited
The DRx Medispa Pte Limited
The DRx Clinic Pte Limited
DRx Investments Pte Limited
DRx Aesthetics Sdn Bhd
Kaya Middle East FZE
Marico Bangladesh Limited
(iii) Key managerial personnel:
Mr. Harsh Mariwala - Chairman and Managing Director (With effect November 1, 2011)
NOTES TO FINANCIAL STATEMENTS

92
K A Y A L I M I T E D
NOTES TO FINANCIAL STATEMENTS b) Transactions with parties referred in ‘a’ above:
(Amount in Rs. Crore)
ParticularsHolding company Subsidiaries / fellow
subsidiariesTotal
March 31, 2013
March 31, 2012
March 31, 2013
March 31, 2012
March 31, 2013
March 31, 2012
Transactions during the yearSale of goods – – 1.08 0.76 1.08 0.76
Purchases – – 0.45 2.26 0.45 2.26
Sale of fi xed assets 13.15 - 0.34 0.17 13.49 0.17
Rendering of services – – 0.15 0.11 0.15 0.11
Reimbursement of expenses incurred by the Company on behalf of
– 0.31 1.06 0.64 1.06 0.95
Reimbursement of expenses incurred for the Company (Seconded employee cost, rent, electricity and others)
13.93 7.55 – 0.01 13.93 7.57
Rent paid 1.03 – – – 1.03 –
Dividend received – – – 11.96 – 11.96
Loans taken (net) 121.19 – – – 121.19 –
Loans repaid (net) – 11.54 – – – 11.54
Loan Conversion to Equity (Refer Note 3)
108.84 – – – 108.84 –
Investment Made – – 81.37 – 81.37 –
Balances Receivable / (Payable) as at year endInvestment @ – – 104.35 22.98 104.35 22.98
Trade Payables – – (0.44) (2.07) (0.44) (2.07)
Short-term loans and advances – – 0.48 1.08 0.48 1.08
Other current liabilities (3.88) (0.85) – – (3.88) (0.85)
Long-term borrowings* (113.28) (102.15) – – (113.28) (102.15)
Guarantee given by 8.00 8.00 – – 8.00 8.00
@ These shares have been pledged as a security for loans taken by the said subsidiary.
* Interest Free
c) Disclosure in respect of transactions which are more than 10% of the total transactions of the same type with related parties

93
K A Y A L I M I T E D
SR NO. PARTICULAR
Transactions Balances Receivable / (Payable)
March 31, 2013
March 31, 2012
March 31, 2013
March 31, 2012
I Sale of goods
Fellow Subsidiary : Kaya Middle East FZE, Dubai
1.08 0.38 0.06 –
Fellow Subsidiary : Marico Bangladesh limited, MBL
– 0.39 – –
II Purchases
Subsidiary : Derma Rx International Aesthetics Pte Ltd
0.45 2.26 (0.44) (2.07)
III Sale of fi xed assets
Holding Company : Marico Limited 13.15 – – –
Fellow Subsidiary : Kaya Middle East FZE, Dubai
0.34 0.14 – –
IV Rendering of services
Fellow Subsidiary : Kaya Middle East FZE, Dubai
0.15 0.11 – –
V Reimbursement of expenses incurred by the company on behalf of
Holding company : Marico Limited – 0.31 – –
Subsidiary : Derma Rx International Aesthetics Pte Ltd
0.20 – 0.20 0.11
Fellow Subsidiary : Kaya Middle East FZE, Dubai
0.86 0.64 0.22 0.97
VI Reimbursement of expenses incurred for the Company (Seconded employee cost, rent, electricity and others)
Holding company : Marico Limited 13.93 7.55 (3.88) (0.85)
VII Rent paid
Holding company : Marico Limited 1.03 – – –
VIII Dividend received
Subsidiary : Derma Rx International Aesthetics Pte Ltd
– 11.96 – –
IX Loans taken
Holding company : Marico Limited* 121.19 – (113.28) (102.15)
X Loans repaid
Holding company : Marico Limited* – 11.54 (113.28) (102.15)
XI Loan Converted to Equity
Holding Company: Marico Limited 108.84 – – –
XII Investmets made
Subsidary: Derma Rx International Aesthetics Pte. Ltd.
81.37 – 104.35 –
*Interest Free
NOTES TO FINANCIAL STATEMENTS

94
K A Y A L I M I T E D
NOTES TO FINANCIAL STATEMENTS37. OPERATING LEASES:
The Company has entered into several operating lease arrangements for its Offi ce premises and Skin clinics for a period ranging from 3 to 9 years and, is renewable on a periodic basis at the option of the lessor and / or lessee. Under these arrangements, generally refundable interest free deposits have been given.
Disclosure in respect of assets taken on non cancellable operating lease:
Particulars March 31, 2013 (Rs. Crore)
March 31, 2012 (Rs. Crore)
Lease payments recognized in the statement of Profi t and Loss during the year *
23.86 22.11
Future minimum lease rentals payments payable:
- not later than one year 20.18 20.79
- later than one year but not later than fi ve years 46.63 39.02
- later than fi ve years 10.42 2.05
77.23 61.86
*Including Contingent Rent Rs. 1,524,982 (Rs. 655,962)
38. EARNINGS PER SHARE:
Particulars For the year ended March 31, 2013
For the year ended March 31, 2012
Profi t / (Loss) after tax (Rs. Crore) (29.75) (2.94)Equity shares outstanding as at the year end 17,848,975 14,500,000
Weighted average number of equity shares used as denominator for calculating basic and diluted earnings per share
14,628,454 14,500,000
Nominal value per equity share (Rs.) 10 10
Basic and diluted earnings per equity share (Rs.) (20.34) (2.03)
39. PROVISION FOR TAX EXPENSES:
a) There is no provision for income tax in view of assessable loss for the year.
b) There are no deferred tax liabilities as at the year end. Deferred tax assets has not been recognised on c a r r i e d forward depreciation, business loss and other item of deferred tax assets, as there is no virtual cer ta in ty o f i t s realization on account of the losses incurred by the Company.
40. DERIVATIVE TRANSACTIONS:
The Company has not entered into any derivative transactions during the year and there were no derivative transactions outstanding as on March 31, 2013. Net foreign currency exposure not hedged as at the year end were as under:-
ParticularsForeign currency amount Equivalent amount in Rupees
Currency As at March 31, 2013
As at March 31, 2012
As at March 31,2013
As at March 31, 2012
Trade payables EURO 4,250 6,270 295,732 425,633
SGD 99,678 510,865 4,362,309 20,663,972
USD 31,482 111,653 1,708,843 5,680,444
Short-term advances USD 100,138 253,072 5,435,464 12,875,311
AUD – 2,400 – 118,018
EURO 36,000 249 2,505,024 16,921
GBP 9,703 – 800,468 –
AED 46,734 – 690,661 –
SGD 41,863 – 1,832,092 –

95
K A Y A L I M I T E D
41. Research and Development expenses aggregating Rs. 0.66 Crore (Previous year Rs. 0.39 Crore) have been included under the relevant heads in the Statement of Profi t and Loss.
42. Previous year figures have been re-grouped and reclassified wherever necessary to conform to this year’s classifi cation.
Signatures to Note 1 to 42
The notes are an integral part of these fi nancial statements.
As per our attached report of even date.
For Price Waterhouse For and on behalf of the Board of DirectorsChartered AccountantsFirm Registration Number: 301112E
Uday ShahPartner Harsh Mariwala Rajen MariwalaMembership No. : 46061 Chairman and Managing Director Director
Mumbai: April 30, 2013 Mumbai: April 30, 2013
NOTES TO FINANCIAL STATEMENTS

96
DERMA-RX INTERNATIONAL AESTHETICS PTE. LTD
96
Board of Directors Vijay S. Subramaniam
Dharmendra B Jain
Frank Thong Mun Loong
Naveen Duggal
Registered Offi ce 213 Henderson Road, # 01-08 Henderson Industrial Park, Singapore - 159553
Auditors Pricewaterhouse Coopers LLP
Bankers Citi Bank UOB Bank

97
DERMA-RX INTERNATIONAL AESTHETICS PTE. LTD
97
DIRECTORS’ REPORTThe directors present their report to the member together with the audited fi nancial statements for the fi nancial year ended 31 March 2013.
Directors
The directors in offi ce at the date of this report are as follows:
Vijay S. Subramaniam (Appointed on 1 may 2013)
Dharmendra b. Jain (Appointed on 1 may 2013)
Frank Thong Mun Loong (Appointed on 1 may 2013)
Naveen Duggal
Arrangements to enable directors to acquire shares and debentures
Neither at the end of nor at any time during the fi nancial year was the Company a party to any arrangement whose object was to enable the directors of the Company to acquire benefi ts by means of the acquisition of shares in, or debentures of, the Company or any other body corporate.
Directors’ interests in shares or debentures
According to the register of directors’ shareholdings, none of the directors holding offi ce at the end of the fi nancial year had any interest in the shares or debentures of the Company or its related corporations.
Directors’ contractual benefi ts
Since the end of the previous fi nancial year, no director has received or become entitled to receive a benefi t by reason of a contract made by the Company or a related corporation with the director or with a fi rm of which he is a member or with a company in which he has a substantial fi nancial interest, except as disclosed in the accompanying fi nancial statements and in this report, and except that certain directors receive remuneration as a result of their employment with related corporations.
Share options
No options were granted during the fi nancial year to subscribe for unissued shares of the Company.
No shares were issued during the fi nancial year by virtue of the exercise of options to take up unissued shares of the Company.
There were no unissued shares of the Company under option at the end of the fi nancial year.
Independent auditor
The independent auditor, PricewaterhouseCoopers LLP, has expressed its willingness to accept re-appointment.
On behalf of the directors
Frank Thong Mun Loong Naveen DuggalDirector Director

98
DERMA-RX INTERNATIONAL AESTHETICS PTE. LTD
98
In the opinion of the directors,
(a) the fi nancial statements as set out on pages 6 to 31 are drawn up so as to give a true and fair view of the state of affairs of the Company as at 31 March 2013 and of the results of the business, changes in equity and cash fl ows of the Company for the fi nancial year then ended; and
(b) at the date of this statement, there are reasonable grounds to believe that, with the continuing fi nancial support from its
immediate holding corporation, the Company will be able to pay its debts as and when they fall due.
On behalf of the directors
Frank Thong Mun Loong Naveen DuggalDirector Director
STATEMENT BY DIRECTORS’ fi nancial statements for the fi nancial year ended 31 March 2013.

99
DERMA-RX INTERNATIONAL AESTHETICS PTE. LTD
99
INDEPENDENT AUDITOR’S REPORT TO THE SHAREHOLDER Report on the Financial Statements
We have audited the accompanying fi nancial statements of Derma-Rx International Aesthetics Pte Ltd set out on pages 5 to 31, which comprise the balance sheet as at 31 March 2013, the statement of comprehensive income, the statement of changes in equity and the statement of cash fl ows for the year then ended, and a summary of signifi cant accounting policies and other explanatory information.
Management’s Responsibility for the Financial Statements
Management is responsible for the preparation of fi nancial statements that give a true and fair view in accordance with the provisions of the Singapore Companies Act (the “Act”) and Singapore Financial Reporting Standards, and for devising and maintaining a system of internal accounting controls suffi cient to provide a reasonable assurance that assets are safeguarded against loss from unauthorised use or disposition; and transactions are properly authorised and that they are recorded as necessary to permit the preparation of true and fair profi t and loss accounts and balance sheets and to maintain accountability of assets.
Auditor’s Responsibility
Our responsibility is to express an opinion on these fi nancial statements based on our audit. We conducted our audit in accordance with Singapore Standards on Auditing. Those standards require that we comply with ethical requirements and plan and perform the audit to obtain reasonable assurance about whether the fi nancial statements are free from material misstatement.
An audit involves performing procedures to obtain audit evidence about the amounts and disclosures in the fi nancial statements. The procedures selected depend on the auditor’s judgement, including the assessment of the risks of material misstatement of the fi nancial statements, whether due to fraud or error. In making those risk assessments, the auditor considers internal control relevant to the entity’s preparation of fi nancial statements that give a true and fair view in order to design audit procedures that are appropriate in the circumstances, but not for the purpose of expressing an opinion on the effectiveness of the entity’s internal control. An audit also includes evaluating the appropriateness of accounting policies used and the reasonableness of accounting estimates made by management, as well as evaluating the overall presentation of the fi nancial statements.
We believe that the audit evidence we have obtained is suffi cient and appropriate to provide a basis for our audit opinion.
Opinion
In our opinion, the fi nancial statements of the Company are properly drawn up in accordance with the provisions of the Act and Singapore Financial Reporting Standards so as to give a true and fair view of the state of affairs of the Company as at 31 March 2013, and of the results, changes in equity and cash fl ows of the Company for the fi nancial year ended on that date.
Report on Other Legal and Regulatory Requirements
In our opinion, the accounting and other records required by the Act to be kept by the Company have been properly kept in accordance with the provisions of the Act.
PricewaterhouseCoopers LLPPublic Accountants and Certifi ed Public AccountantsSingapore, 27 June 2013.

100
DERMA-RX INTERNATIONAL AESTHETICS PTE. LTD
100
STATEMENT OF COMPREHENSIVE INCOMEfor the fi nancial year ended 31st March 2013
Note 2013 2012 2013 2012
$ $ Rs.Crore Rs.Crore
Revenue 4 5,538,000 5,44 6,000 24.23 20.79
Cost of sales 7 (1,078,000) (1,520,000) (4.72) (5.80)
Gross profi t 4,460,000 3,926,000 19.52 14.99
Other income 5 106,000 3,197,000 0.46 12.20
Other gains/(losses) - net 6 5,000 (1,000) 0.02 –
Expenses
- Distribution and marketing 7 (109,000) (112,000) (0.48) (0.43)
- Administrative 7 (2,437,000) (1,971,000) (10.66) (7.52)
- Finance 9 (582,000) (599,000) (2.55) (2.29)
Profi t before income tax 1,443,000 4,440,000 6.31 16.95
Income tax expense 10 (493,000) (1,016,000) (2.16) (3.88)
Profi t after tax and total comprehensive income 950,000 3,424,000 4.16 13.07
The accompanying notes form an integral part of these fi nancial statements
Note: The exchange rate used to convert SGD to Rs. <43.764> /(Previous year SGD to Rs.<40.829>).

101
DERMA-RX INTERNATIONAL AESTHETICS PTE. LTD
101
BALANCE SHEET AS AT 31 MARCH 2013
Note 2013 2012 2013 2012
$ $ Rs.Crore Rs.Crore
ASSETSCurrent assetsCash and cash equivalents 11 1,828,000 278,000 8.00 1.14
Trade and other receivables 12 1,301,000 1,039,000 5.69 4.24
Other assets 13 35,000 36,000 0.15 0.15
Inventories 14 381,000 447,000 1.67 1.83
3,545,000 1,800,000 15.51 7.35
Non-current assetsIntangible assets 16 14,930,000 14,930,000 65.34 60.96
Goodwill 17 10,067,000 10,067,000 44.06 41.10
Investment in subsidiaries 15 33,415,000 14,861,000 146.24 60.68
Plant and equipment 18 13,000 17,000 0.06 0.07
58,425,000 39,875,000 255.69 162.81
Total assets 61,970,000 41,675,000 271.21 170.15
LIABILITIESCurrent liabilitiesTrade and other payables 19 8,440,000 3,225,000 36.94 13.17
Borrowings 20 9,737,000 6,305,000 42.61 25.74
Current income tax liabilities 10 – 14,000 – 0.06
18,177,000 9,544,000 79.55 38.97
Non-current liabilitiesOther payables 19 – 7,500,000 – 30.62
Borrowings 20 15,300,000 16,150,000 66.96 65.94
Deferred income tax liabilities 21 1,525,000 1,017,000 6.67 4.15
16,825,000 24,667,000 73.63 100.71
Total liabilities 35,002,000 34,211,000 153.18 139.68
NET ASSETS 26,968,000 7,464,000 118.02 30.47
EQUITYShare capital 22 25,554,000 7,000,000 111.83 28.58
Retained profi ts 1,414,000 464,000 6.19 1.89
Total equity 26,968,000 7,464,000 118.02 30.47
The accompanying notes form an integral part of these fi nancial statements
Note: The exchange rate used to convert SGD to Rs. <43.764> /(Previous year SGD to Rs.<40.829>).

102
DERMA-RX INTERNATIONAL AESTHETICS PTE. LTD
102
Note Sharecapital
Retainedprofi ts
Totalequity
Sharecapital
Retainedprofi ts
Totalequity
2013Beginning of fi nancial year 7,000,000 464,000 7,464,000 30.63 2.03 32.66
Increase in share capital 18,554,000 – 18,554,000 81.20 – 81.20
Total comprehensive income - 950,000 950,000 – 4.16 4.16
Dividends paid 23 – – – – – –
End of fi nancial year 25,554,000 1,414,000 26,968,000 111.83 6.19 118.022012Beginning of fi nancial year 7,000,000 40,000 7,040,000 28.58 0.16 28.74
Total comprehensive income – 3,424,000 3,424,000 – 13.98 13.98
Dividends paid 23 – (3,000,000) (3,000,000) – (12.25) (12.25)
End of fi nancial year 7,000,000 464,000 7,464,000 28.58 1.89 30.47
The accompanying notes form an integral part of these fi nancial statements.
STATEMENT OF CHANGES IN EQUITYfor the fi nancial year ended 31st March 2013
Note: The exchange rate used to convert SGD to Rs. <43.764> /(Previous year SGD to Rs.<40.829>).

103
DERMA-RX INTERNATIONAL AESTHETICS PTE. LTD
103
STATEMENT OF CASH FLOWSfor the fi nancial year ended 31st March 2013
Note 2013 2012 2013 2012
$ $ Rs.Crore Rs.Crore
Cash fl ows from operating activitiesProfi t after tax 950,000 3,424,000 4.16 13.98
Adjustments for:
- Income tax expense 493,000 1,016,000 2.16 4.15
- Depreciation 9,000 12,000 0.04 0.05
- Dividend income – (3,000,000) – (12.25)
- Provision for doubtful debt – (96,000) – (0.39)
- Interest expense 582,000 599,000 2.55 2.45
2,034,000 1,955,000 8.90 7.98
Change in working capital:
- Inventories 66,000 10,000 0.29 0.04
- Trade and other receivables (261,000) (532,000) (1.14) (2.17)
- Trade and other payables 715,000 (27,000) 3.13 (0.11)
Cash generated from operations 2,554,000 1,406,000 11.18 5.74
Income tax paid – (164,000) – (0.67)
Net cash provided by operating activitiesCash fl ows from investing activities 2,554,000 1,242,000 11.18 5.07
Additions to plant and equipment (6,000) (21,000) (0.03) (0.09)
Acquisition of a subsidiary (18,554,000) - (81.20) –
Payment of contingent consideration arising from the (3,000,000) (2,500,000) (13.13) (10.21)
acquisition of DRx Group
Dividend received – 3,000,000 – 12.25
Net cash (used in)/provided by investing activitiesCash fl ows from fi nancing activities (21,560,000) 479,000 (94.36) 1.96
Proceeds from borrowings - related corporations 4,172,000 3,996,000 18.26 16.32
Repayments of borrowings - bank (850,000) (4,000,000) (3.72) (16.33)
Interest paid (580,000) (599,000) (2.54) (2.45)
Dividend paid – (3,000,000) – (12.25)
Issuance of share capital 18,554,000 – 81.20 –
Net cash provided by/(used in) fi nancing activities 21,296,000 (3,603,000) 93.20 (14.71)
Net increase/(decrease) in cash and cash equivalents 2,290,000 (1,882,000) 10.02 (7.68)
Cash and cash equivalents at beginning of fi nancial year 11 (462,000) 1,420,000 (2.02) 5.80
Cash and cash equivalents at end of fi nancial year 11 1,828,000 (462,000) 8.00 (1.89)
The accompanying notes form an integral part of these fi nancial statements
Note: The exchange rate used to convert SGD to Rs. <43.764> /(Previous year SGD to Rs.<40.829>).

104
DERMA-RX INTERNATIONAL AESTHETICS PTE. LTD
104
NOTES TO THE FINANCIAL STATEMENTSFor the fi nancial year ended 31 March 2013
These notes form an integral part of and should be read in conjunction with the accompanying fi nancial statements.
1. General information
The Company is incorporated and domiciled in Singapore. The address of its registered offi ce is 213 Henderson Road, #01-08 Henderson Industrial Park, Singapore 159553.
The principal activities of the Company are those of consultancy in skincare, trading in cosmetics and investment holding.
As at 31 March 2013, the Company is in net current liability position. The fi nancial statements have been prepared on a going concern basis due to the fi nancial support from its immediate holding corporation.
2. Signifi cant accounting policies
2.1 Basis of preparation
The fi nancial statements have been prepared in accordance with Singapore Financial Reporting Standards (“FRS”) and under the historical cost convention, except as disclosed in the accounting policies below.
These fi nancial statements are separate fi nancial statements under FRS 27 Consolidated and Separate Financial Statements. As provided under FRS 27 the Company has elected not to prepare consolidated fi nancial statements as it is wholly-owned subsidiary of Marico Limited, which produces consolidated fi nancial statements for public use. The registered offi ce of Marico Limited is located at Rang Sharda Krishmachandra Marg, Bandra Reclamation, Branda (West), Mumbai 400050 India.
The preparation of these fi nancial statements in conformity with FRS requires management to exercise its judgement in the process of applying the Company’s accounting policies. It also requires the use of certain critical accounting estimates and assumptions. The areas involving a higher degree of judgement or complexity, or areas where estimates and assumptions are signifi cant to the fi nancial statements are disclosed in Note 3.
Interpretations and amendments to published standards effective in 2013
On 1 April 2012, the Company adopted the new or amended FRS and Interpretations to FRS (“INT FRS”) that are mandatory for application from that date. Changes to the Company’s accounting policies have been made as required, in accordance with the transitional provisions in the respective FRS and INT FRS.
The adoption of these new or amended FRS and INT FRS did not result in substantial changes to the Company’s accounting policies and had no material effect on the amounts reported for the current or prior fi nancial years.
2.2 Revenue recognition
(a) Sale of goods
Sale of goods comprises the fair value of the consideration received or receivable for the sale of goods in the ordinary course of the Company’s activities.
Sales are recognised when the Company has delivered the products to the customers, the customers have accepted the products and the collectability of the related receivables is reasonably assured. Sales are presented, net of goods and services tax and discounts.
(b) Royalties income
Royalties are recognised on an accrual basis in accordance with the substance of the relevant agreement.
(c) Interest income
Interest income is recognised using the effective interest method.
(d) Dividend income
Dividend income is recognised when the right to receive payment is established.

105
DERMA-RX INTERNATIONAL AESTHETICS PTE. LTD
105
NOTES TO THE FINANCIAL STATEMENTSFor the fi nancial year ended 31 March 2013
2. Signifi cant accounting policies (continued)
2.3 Employee compensation
(a) Defi ned contribution plans
The Company’s contributions to defi ned contribution plans are recognised as employee compensation expense when the contributions are due, unless they can be capitalised as an asset.
(b) Employee leave entitlement
Employee entitlements to annual leave are recognised when they accrue to employees. A provision is made for the estimated liability for annual leave as a result of services rendered by employees up to the balance sheet date.
2.4 Operating lease payments
Payments made under operating leases (net of any incentives received from the lessors) are recognised in profi t or loss on a straight-line basis over the period of the lease.
2.5 Borrowing costs
Borrowing costs are recognised in profi t or loss using the effective interest method.
2.6 Income taxes
Current income tax is recognised at the amount expected to be paid to or recovered from the tax authorities.
Deferred income tax is recognised for all temporary differences except when the deferred income tax arises from the initial recognition of an asset or liability that affects neither accounting nor taxable profi t or loss at the time of the transaction.
Current and deferred income tax is measured using the tax rates and tax laws that have been enacted or substantively enacted by the balance sheet date, and are recognised as income or expenses in profi t or loss, except to the extent that the tax arises from a transaction which is recognised directly in equity.
2.7 Inventories
Inventories are carried at lower of the cost and net realisable value. Cost is determined using the weighted average method. Net realisable value is the estimated selling price in the ordinary course of business less the estimated cost of completion and the estimated costs necessary to make the sale.
2.8 Plant and equipment
All items of plant and equipment are recognised at cost less accumulated depreciation and accumulated impairment losses.
Subsequent expenditure relating to property, plant and equipment that has already been recognised is added to the carrying amount of the asset only when it is probable that future economic benefi ts associated with the item will fl ow to the Company and the cost of the item can be measured reliably.
Depreciation is calculated using the straight-line method to allocate depreciable amounts over their estimated useful lives. The estimated useful lives are as follows:
Useful lives
Computers 3 years
Furniture and fi ttings 3 years
Offi ce equipment 3 years
Renovations 3 years
Machinery 3 years

106
DERMA-RX INTERNATIONAL AESTHETICS PTE. LTD
106
NOTES TO THE FINANCIAL STATEMENTSFor the fi nancial year ended 31 March 2013
The residual values, estimated useful lives and depreciation method of property, plant and equipment are reviewed, and adjusted as appropriate, at each balance sheet date. The effects of any revision are recognised in profi t or loss when the changes arise.
2.9 Intangible assets (a) Goodwill
Goodwill on acquisition represents the excess of (i) the sum of the consideration transferred, the amount of any ■ controlling interest in the acquiree and the acquisition date fair value of any previous equity interest in the acquiree over (ii) the fair value of the identifi able not assets acquired.
(b) Acquired trademark and licences
Trademarks, which have an indefi nite useful life, are initially recognised at cost and are subsequently carried at cost less any impairment loss. At each balance sheet date, the company assesses whether there is any indication of impairment. If such indication exists, the recoverable amount is estimated.
2.10 Investments in subsidiaries
Investments in subsidiaries are carried in the Company’s balance sheet at cost less accumulated impairment losses. On disposal of investments in subsidiaries, the difference between disposal proceeds and the carrying amounts of the investments are recognised in profi t and loss.
2.11 Impairment of non-fi nancial assets
(a) Goodwill
Goodwill recognised separately as an intangible asset is tested for impairment annually and whenever there is indication that the goodwill may be impaired.
For the purpose of impairment testing of goodwill, goodwill is allocated to each of the Group’s cash-generating-units (“CGU”) expected to benefi t from synergies arising from the business combination.
An impairment loss is recognised when the carrying amount of a CGU, including the goodwill, exceeds the recoverable amount of the CGU. The recoverable amount of a CGU is the higher of the CGU’s fair value less cost to sell and value-in-use.
The total impairment loss of a CGU is allocated fi rst to reduce the carrying amount of goodwill allocated to the CGU and then to the other assets of the CGU pro-rata on the basis of the carrying amount of each asset in the CGU.
An impairment loss on goodwill is recognised as an expense and is not reversed in a subsequent period.
(b) Intangible assets
Plant and equipment
Investments in subsidiaries
Intangible assets, plant and equipment and investments in subsidiaries are tested for impairment whenever there is any objective evidence or indication that these assets may be impaired.
For the purpose of impairment testing, the recoverable amount (i.e. the higher of the fair value less cost to sell and the value-in-use) is determined on an individual asset basis unless the asset does not generate cash infl ows that are largely independent of those from other assets. If this is the case, the recoverable amount is determined for the CGU to which the asset belongs.
If the recoverable amount of the asset (or CGU) is estimated to be less than its carrying amount, the carrying amount of the asset (or CGU) is reduced to its recoverable amount.

107
DERMA-RX INTERNATIONAL AESTHETICS PTE. LTD
107
NOTES TO THE FINANCIAL STATEMENTSFor the fi nancial year ended 31 March 2013
The difference between the carrying amount and recoverable amount is recognised as an impairment loss in profi t or loss, unless the asset is carried at revalued amount, in which case, such impairment loss is treated as a revaluation decrease.
An impairment loss for an asset other than goodwill is reversed if, and only if, there has been a change in the estimates used to determine the asset’s recoverable amount since the last impairment loss was recognised. The carrying amount of this asset is increased to its revised recoverable amount, provided that this amount does not exceed the carrying amount that would have been determined (net of any accumulated amortisation or depreciation) had no impairment loss been recognised for the asset in prior years.
A reversal of impairment loss for an asset other than goodwill is recognised in profi t or loss, unless the asset is carried at revalued amount, in which case, such reversal is treated as a revaluation increase. However, to the extent that an impairment loss on the same revalued asset was previously recognised as an expense, a reversal of that impairment is also credited to profi t or loss.
2.12 Loans and receivables
Cash and cash equivalents
Trade and other receivables
Cash and cash equivalents, and trade and other receivables are initially recognised at their fair values plus transaction costs and subsequently carried at amortised cost using the effective interest method, less accumulated impairment losses.
The Company assesses at each balance sheet date whether there is objective evidence that these fi nancial assets are impaired and recognises an allowance for impairment when such evidence exists. Signifi cant fi nancial diffi culties of the debtor, probability that the debtor will enter bankruptcy and default or signifi cant delay in payments are objective evidence that these fi nancial assets are impaired.
The carrying amount of these assets is reduced through the use of an impairment allowance account which is calculated as the difference between the carrying amount and the present value of estimated future cash fl ows, discounted at the original effective interest rate.
These assets are presented as current assets except for those that are expected to be realised later than 12 months after the balance sheet date, which are presented as non-current assets.
2.13 Trade and other payables
Trade and other payables represent liabilities for goods and services provided to the Company prior to the end of fi nancial year. They are classifi ed as current liabilities if payment is due within one year or less (or in the normal operating cycle of the business, if longer). If not, they are presented as non-current liabilities.
Trade and other payables are initially recognised at fair value, and subsequently carried at amortised cost using the effective interest method.
2.14 Borrowings
Borrowings are initially recognised at their fair values (net of transaction costs) and subsequently carried at amortised cost. Any difference between the proceeds (net of transaction costs) and the redemption value is recognised in profi t or loss over the period of the borrowings using the effective interest method.
2.15 Cash and cash equivalents
For the purpose of presentation in the statement of cash fl ows, cash and cash equivalents include cash on hand, deposits with fi nancial institutions which are subject to an insignifi cant risk of change in value and bank overdrafts. Bank overdrafts are presented as current borrowings on the balance sheet.
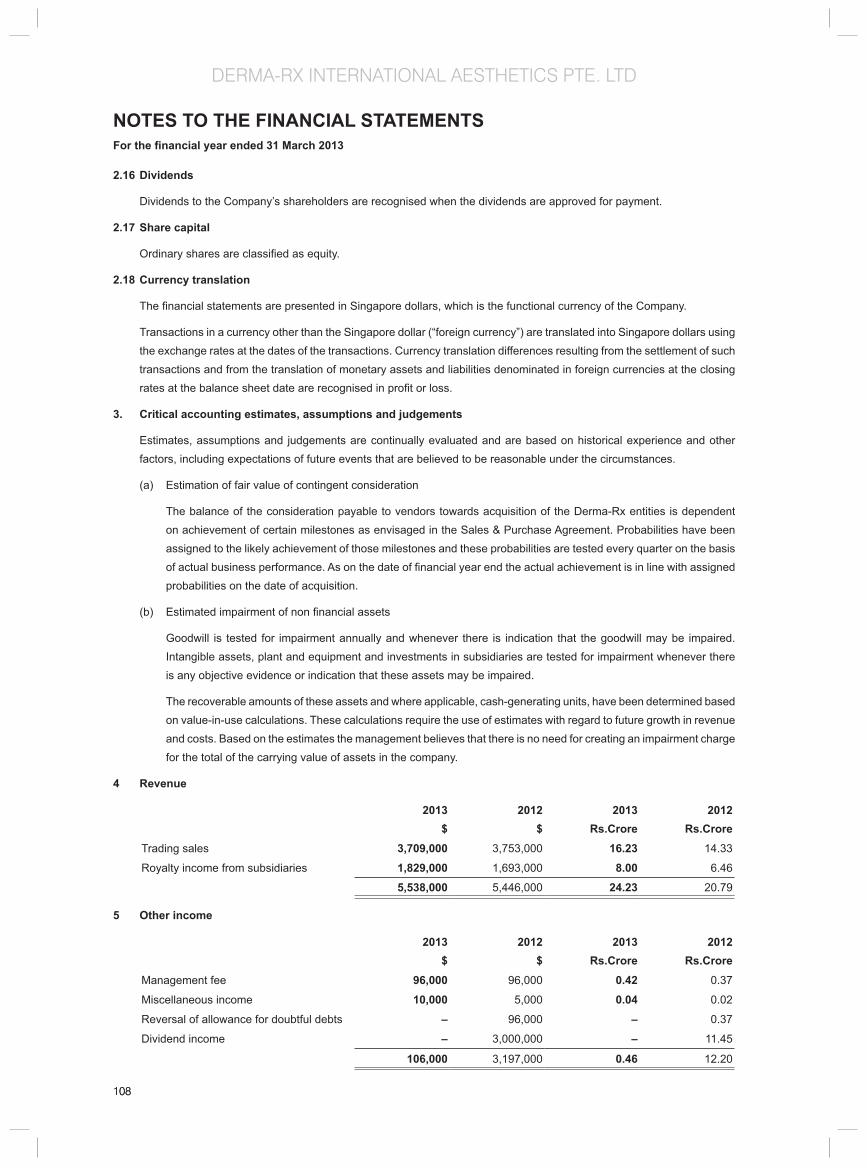
108
DERMA-RX INTERNATIONAL AESTHETICS PTE. LTD
108
NOTES TO THE FINANCIAL STATEMENTSFor the fi nancial year ended 31 March 2013
2.16 Dividends
Dividends to the Company’s shareholders are recognised when the dividends are approved for payment.
2.17 Share capital
Ordinary shares are classifi ed as equity.
2.18 Currency translation
The fi nancial statements are presented in Singapore dollars, which is the functional currency of the Company.
Transactions in a currency other than the Singapore dollar (“foreign currency”) are translated into Singapore dollars using the exchange rates at the dates of the transactions. Currency translation differences resulting from the settlement of such transactions and from the translation of monetary assets and liabilities denominated in foreign currencies at the closing rates at the balance sheet date are recognised in profi t or loss.
3. Critical accounting estimates, assumptions and judgements
Estimates, assumptions and judgements are continually evaluated and are based on historical experience and other factors, including expectations of future events that are believed to be reasonable under the circumstances.
(a) Estimation of fair value of contingent consideration
The balance of the consideration payable to vendors towards acquisition of the Derma-Rx entities is dependent on achievement of certain milestones as envisaged in the Sales & Purchase Agreement. Probabilities have been assigned to the likely achievement of those milestones and these probabilities are tested every quarter on the basis of actual business performance. As on the date of fi nancial year end the actual achievement is in line with assigned probabilities on the date of acquisition.
(b) Estimated impairment of non fi nancial assets
Goodwill is tested for impairment annually and whenever there is indication that the goodwill may be impaired. Intangible assets, plant and equipment and investments in subsidiaries are tested for impairment whenever there is any objective evidence or indication that these assets may be impaired.
The recoverable amounts of these assets and where applicable, cash-generating units, have been determined based on value-in-use calculations. These calculations require the use of estimates with regard to future growth in revenue and costs. Based on the estimates the management believes that there is no need for creating an impairment charge for the total of the carrying value of assets in the company.
4 Revenue
2013$
2012$
2013Rs.Crore
2012Rs.Crore
Trading sales 3,709,000 3,753,000 16.23 14.33
Royalty income from subsidiaries 1,829,000 1,693,000 8.00 6.46
5,538,000 5,446,000 24.23 20.79
5 Other income
2013$
2012$
2013Rs.Crore
2012Rs.Crore
Management fee 96,000 96,000 0.42 0.37
Miscellaneous income 10,000 5,000 0.04 0.02
Reversal of allowance for doubtful debts – 96,000 – 0.37
Dividend income – 3,000,000 – 11.45
106,000 3,197,000 0.46 12.20

109
DERMA-RX INTERNATIONAL AESTHETICS PTE. LTD
109
NOTES TO THE FINANCIAL STATEMENTSFor the fi nancial year ended 31 March 2013
6 Other gains/(losses) - net
2013$
2012$
2013Rs.Crore
2012Rs.Crore
Net currency translation gains/(losses) 5,000 (1,000) 0.02 –
5,000 (1,000) 0.02 –
7 Expenses by nature
2013$
2012$
2013Rs.Crore
2012Rs.Crore
Cost of inventories included in cost of sales 1,078,000 1,520,000 4.72 5.80
Depreciation of property, plant and equipment 9,000 12,000 0.04 0.05
(Note 18)
Employee compensation (Note 8) 1,360,000 1,339,000 5.95 5.11
Advertising and entertainment expense 109,000 112,000 0.48 0.43
Professional fees 78,000 59,000 0.34 0.23
Rental on operating leases 217,000 197,000 0.95 0.75
Transportation expense 14,000 11,000 0.06 0.04
Bank charges 163,000 194,000 0.71 0.74
Other expenses 596,000 159,000 2.61 0.61
Total cost of sales, distribution and marketing costs and administrative expenses 3,624,000 3,603,000 15.86 13.75
8 Employee compensation
2013$
2012$
2013Rs.Crore
2012Rs.Crore
Wages and salaries 1,163,000 1,160,000 5.09 4.43
Employer’s contribution to Central Provident Fund
94,000 83,000 0.41 0.32
Other benefi ts 103,000 96,000 0.45 0.37
1,360,000 1,339,000 5.95 5.11
9 Finance expenses
2013$
2012$
2013Rs.Crore
2012Rs.Crore
Interest expense
- bank borrowings 574,000 598,000 2.51 2.28
- bank overdrafts 8,000 1,000 0.04 –
582,000 599,000 2.55 2.29

110
DERMA-RX INTERNATIONAL AESTHETICS PTE. LTD
110
NOTES TO THE FINANCIAL STATEMENTSFor the fi nancial year ended 31 March 2013
10 Income taxes
(a) Income tax expense
2013$
2012$
2013Rs.Crore
2012Rs.Crore
Tax expense attributable to profi t is made up of:
5.09 4.43
- Current income tax – – – –
- Deferred income tax (Note 21) 508000 508,000 2.22 1.94
508,000 508,000 2.22 1.94
Over provision in preceding financial years
- Current income tax (15,000) – (0.07) –
- Deferred income tax (Note 21) – 508,000 – 1.94
493,000 1,016,000 2.16 3.88
The tax on profi t before tax differs from the theoretical amount that would arise using the Singapore standard rate of income tax as follows:
2013$
2012$
2013Rs.Crore
2012Rs.Crore
Profi t before tax 1,443,000 4,440,000 6.31 16.95
Tax calculated at tax rate of 17% (2012: 17%)
245,000 755,000 1.07 2.88
Effects of:
- statutory stepped income exemption – – – –
- capital allowances transferred under Group Relief
120,000 111,000 0.53 0.42
- expenses not deductible for tax purposes
147,000 152,000 0.64 0.58
- income not subject to tax (4,000) (510,000) (0.02) (1.95)
Tax charge 508,000 508,000 2.22 1.94
(b) Movements in current income tax liabilities -
2013$
2012$
2013Rs.Crore
2012Rs.Crore
Beginning of fi nancial year 14,000 178,000 0.06 0.73
Income tax paid – (164,000) – (0.67)
Over provision in prior fi nancial years (14,000) – (0.06) –
End of fi nancial year – 14,000 – 0.06
11 Cash and cash equivalents
2013$
2012$
2013Rs.Crore
2012Rs.Crore
Cash at bank and on hand 328,000 278,000 1.44 1.14
Short-term bank deposit 1,500,000 – 6.56 –
1,828,000 278,000 8.00 1.14

111
DERMA-RX INTERNATIONAL AESTHETICS PTE. LTD
111
NOTES TO THE FINANCIAL STATEMENTSFor the fi nancial year ended 31 March 2013
For the purpose of presenting the statement of cash fl ows, cash and cash equivalents comprise the following:
2013$
2012$
2013Rs.Crore
2012Rs.Crore
Cash and bank deposits (as above) 1,828,000 278,000 8.00 1.14
Less: Bank overdrafts (Note 20) – (740,000) – (3.02)
Cash and cash equivalents per statement of cash fl ows 1,828,000 (462,000) 8.00 (1.89)
12 Trade and other receivables
2013$
2012$
2013Rs.Crore
2012Rs.Crore
Trade receivables from:
- Non-related parties 80,000 29,000 0.35 0.12
- Immediate holding corporation 100,000 511,000 0.44 2.09
- Subsidiaries 624,000 543,000 2.73 2.22
- Other related party – 2,000 – 0.01
Less: Allowance for impairment of receivables (86,000) (86,000) (0.38) (0.35)
Trade receivables - net 718,000 999,000 3.14 4.08
– –
Deposits 43,000 40,000 0.19 0.16
Other receivables 541,000 – 2.37 –
1,302,000 1,039,000 5.70 4.24
13 Other assets
2013$
2012$
2013Rs.Crore
2012Rs.Crore
Prepayments 5,000 36,000 0.02 0.15Advance payment to creditors 30,000 – 0.13 –
35,000 36,000 0.15 0.15
14 Inventories
2013$
2012$
2013Rs.Crore
2012Rs.Crore
Finished goods 79,000 287,000 0.35 1.17Raw materials 302,000 160,000 1.32 0.65
381,000 447,000 1.67 1.83
15 Investments in subsidiaries
2013$
2012$
2013Rs.Crore
2012Rs.Crore
Equity investments at cost
Beginning of fi nancial year 14,861,000 14,861,000 65.04 60.68
Addition through acquisition of subsidiary 18,554,000 – 81.20 –
End of fi nancial year 33,415,000 14,861,000 146.24 60.68

112
DERMA-RX INTERNATIONAL AESTHETICS PTE. LTD
112
NOTES TO THE FINANCIAL STATEMENTSFor the fi nancial year ended 31 March 2013
Name of subsidiaries Principal activities Country of incorporation and business
Equity holding
2013%
2012%
The DRxMedispa Distribution of health and supplement products, general trading and provision of beauty and spa services
Singapore 100 100
The DRx Clinic Ltd Clinical services and other general western medical services
Singapore 100 100
The DRx Investments Pte. Ltd. Investment holding Singapore 100 100
Kaya Middle East Pte. Ltd. Operate aesthetic skin care clinics which offer various skin care products and services
Middle East 100 –
The subsidiary of DRx Investments Pte. Ltd. is as follows:
Name of subsidiaries Principal activities Country of incorporation and business
Equity holding
2013%
2012%
DRx Aesthetics SdnBhd Managing private medical p rac t i ce and med ica l laboratory service and consultation
Malaysia 100 100
16 Intangible assets
2013$
2012$
2013Rs.Crore
2012Rs.Crore
Trademarks 14,930,000 14,930,000 65.34 60.96

113
DERMA-RX INTERNATIONAL AESTHETICS PTE. LTD
113
NOTES TO THE FINANCIAL STATEMENTSFor the fi nancial year ended 31 March 2013
17 Goodwill2013
$2012
$2013
Rs.Crore2012
Rs.CroreGoodwill arising from amalgamation 10,067,000 10,067,000 44.06 41.10
Goodwill arose as a result of a restructuring exercise undertaken by the company on 1 March 2012 (“effective date”) to streamline its corporate structure and operations by amalgamating the business of DRx Meditech Pte. Ltd. into that of the company with a view to minimise the number of operating entities. As a result, DRx Meditech Pte. Ltd.’s business operations, assets and liabilities had been transferred to the company from the effective date.
2011 2011$ Rs. Crore
AssetsProperty, plant and equipment 9,000 0.03 Inventories 520,000 1.84 Trade receivables 32,000 0.11 Other receivables 150,000 0.53 Amount owing by ultimate holding company – – Amount owing by intermediate holding company 115,000 0.41 Amount owing by immediate holding company 259,000 0.92 Amounts owing by subsidiaries 47,000 0.17 Amount owing by a related party 6,000 0.02 Cash and cash equivalents 514,000 1.82 Total assets 1,652,000 5.84 Less: liabilitiesTrade payables 32,000 0.11 Other payables 83,000 0.29 Amount owing to a subsidiary 370,000 1.31 Current tax liabilities 178,000 0.63 Deferred tax liabilities 1,000 – Total liabilities 664,000 2.35 Net assets transferred 988,000 3.49 Cost of investment in DRx Meditech Pte. Ltd. (11,055,000) (39.09)Goodwill arising from transfer of business operations (10,067,000) (35.59)
Impairment tests for goodwill
Goodwill is allocated to the individual entity which is also the cash-generating unit (“CGU”).
The recoverable amount of a CGU was determined based on value-in-use. Cash fl ow projections in the value-in-use calculations were based on a 10-year period using an estimated growth rate of 1%. The growth rate did not exceed the long-term average growth rate for the industry in which the CGU operates. The discount rate used of 7% was consistent with forecasts included in industry reports and refl ected specifi c risks relating to the CGU. Management determined budgeted gross margin of 78% based on past performance and its expectations of market developments.

114
DERMA-RX INTERNATIONAL AESTHETICS PTE. LTD
114
NOTES TO THE FINANCIAL STATEMENTSFor the fi nancial year ended 31 March 2013
18 Plant and equipment
Computers Furniture and fi ttings
Renovations Offi ce equipment
Machinery Total
$ $ $ $ $ $2013Cost Beginning of fi nancial year 92,000 12,000 3,000 17,000 5,000 129,000 Additions 4,000 1,000 – – 1,000 6,000 Transfers – 3,000 (3,000) – - - End of fi nancial year 96,000 16,000 – 17,000 6,000 135,000 Accumulated depreciationBeginning of fi nancial year 88,000 11,000 3,000 5,000 5,000 112,000 Depreciation charge (Note 7) 3,000 1,000 – 5,000 – 9,000 Transfers – 3,000 (3,000) - – – End of fi nancial year 91,000 15,000 – 10,000 5,000 121,000 Net book valueEnd of fi nancial year 5,000 1,000 – 7,000 1,000 14,000
2012Cost Beginning of fi nancial year 87,000 11,000 3,000 2,000 5,000 108,000 Additions 5,000 1,000 – 15,000 – 21,000 Disposals – – – – – – End of fi nancial year 92,000 12,000 3,000 17,000 5,000 129,000 Accumulated depreciationBeginning of fi nancial year 80,000 11,000 3,000 1,000 5,000 100,000 Depreciation charge (Note 7) 8,000 – – 4,000 – 12,000 Disposals – – – - – – End of fi nancial year 88,000 11,000 3,000 5,000 5,000 112,000 Net book valueEnd of fi nancial year 4,000 1,000 – 12,000 – 17,000
Computers Furniture and fi ttings
Renovations Offi ce equipment
Machinery Total
Rs.Crore Rs.Crore Rs.Crore Rs.Crore Rs.Crore Rs.Crore2013CostBeginning of fi nancial year 0.40 0.05 0.01 0.07 0.02 0.56Additions 0.02 – – – – 0.03Transfers – 0.01 (0.01) – – –End of fi nancial year 0.42 0.07 – 0.07 0.02 0.59Accumulated depreciationBeginning of fi nancial year 0.39 0.05 0.01 0.02 0.02 0.49Depreciation charge (Note 7) 0.01 – – 0.02 – 0.04Transfers - 0.01 (0.01) – – –End of fi nancial year 0.40 0.07 – 0.04 0.02 0.53Net book valueEnd of fi nancial year 0.02 – – 0.03 – 0.062012CostBeginning of fi nancial year 0.36 0.04 0.01 0.01 0.02 0.44Additions 0.02 – – 0.06 – 0.09Disposals – – – – – –End of fi nancial year 0.38 0.05 0.01 0.07 0.02 0.53Accumulated depreciationBeginning of fi nancial year 0.33 0.04 0.01 – 0.02 0.41Depreciation charge (Note 7) 0.03 – – 0.02 – 0.05Disposals – – – – – –End of fi nancial year 0.36 0.04 0.01 0.02 0.02 0.46Net book valueEnd of fi nancial year 0.02 – – 0.05 – 0.07
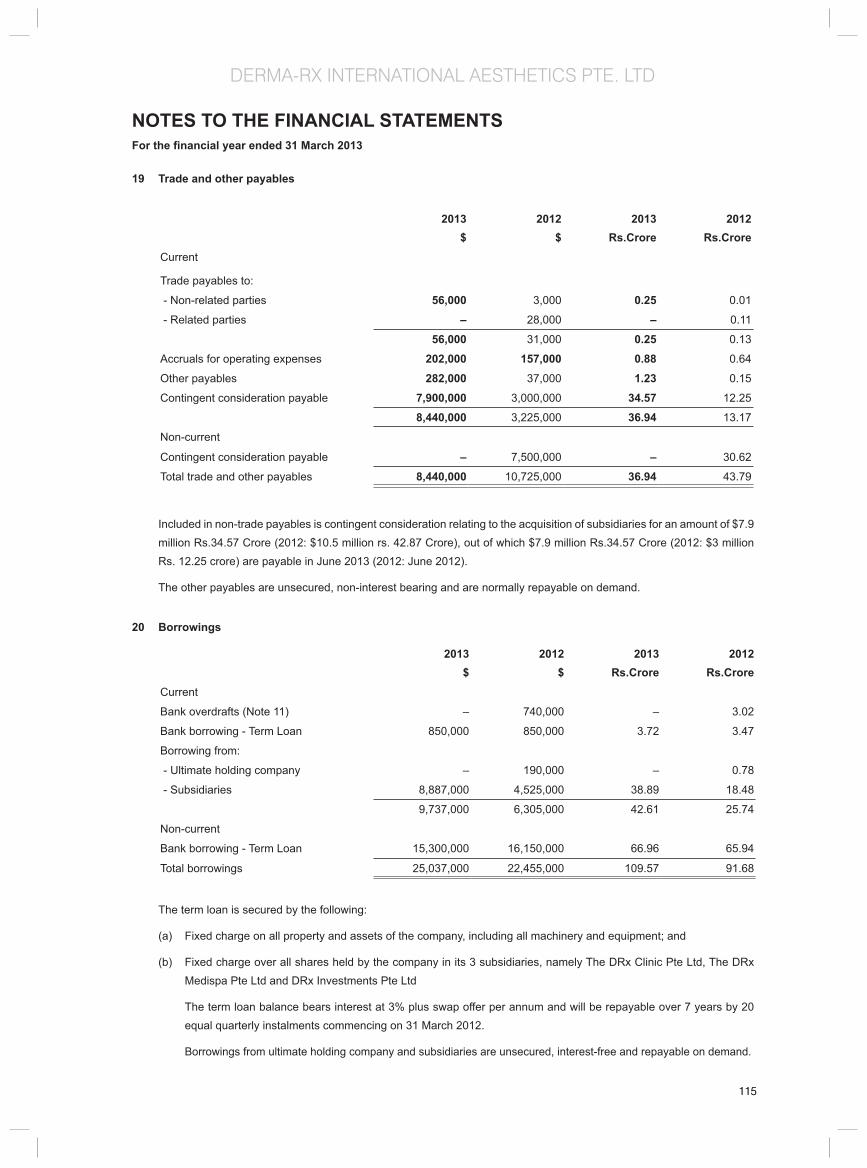
115
DERMA-RX INTERNATIONAL AESTHETICS PTE. LTD
115
NOTES TO THE FINANCIAL STATEMENTSFor the fi nancial year ended 31 March 2013
19 Trade and other payables
2013$
2012$
2013Rs.Crore
2012Rs.Crore
Current
Trade payables to:
- Non-related parties 56,000 3,000 0.25 0.01
- Related parties – 28,000 – 0.11
56,000 31,000 0.25 0.13
Accruals for operating expenses 202,000 157,000 0.88 0.64
Other payables 282,000 37,000 1.23 0.15
Contingent consideration payable 7,900,000 3,000,000 34.57 12.25
8,440,000 3,225,000 36.94 13.17
Non-current
Contingent consideration payable – 7,500,000 – 30.62
Total trade and other payables 8,440,000 10,725,000 36.94 43.79
Included in non-trade payables is contingent consideration relating to the acquisition of subsidiaries for an amount of $7.9
million Rs.34.57 Crore (2012: $10.5 million rs. 42.87 Crore), out of which $7.9 million Rs.34.57 Crore (2012: $3 million Rs. 12.25 crore) are payable in June 2013 (2012: June 2012).
The other payables are unsecured, non-interest bearing and are normally repayable on demand.
20 Borrowings
2013$
2012$
2013Rs.Crore
2012Rs.Crore
Current
Bank overdrafts (Note 11) – 740,000 – 3.02
Bank borrowing - Term Loan 850,000 850,000 3.72 3.47
Borrowing from:
- Ultimate holding company – 190,000 – 0.78
- Subsidiaries 8,887,000 4,525,000 38.89 18.48
9,737,000 6,305,000 42.61 25.74
Non-current
Bank borrowing - Term Loan 15,300,000 16,150,000 66.96 65.94
Total borrowings 25,037,000 22,455,000 109.57 91.68
The term loan is secured by the following:
(a) Fixed charge on all property and assets of the company, including all machinery and equipment; and
(b) Fixed charge over all shares held by the company in its 3 subsidiaries, namely The DRx Clinic Pte Ltd, The DRx Medispa Pte Ltd and DRx Investments Pte Ltd
The term loan balance bears interest at 3% plus swap offer per annum and will be repayable over 7 years by 20 equal quarterly instalments commencing on 31 March 2012.
Borrowings from ultimate holding company and subsidiaries are unsecured, interest-free and repayable on demand.

116
DERMA-RX INTERNATIONAL AESTHETICS PTE. LTD
116
NOTES TO THE FINANCIAL STATEMENTSFor the fi nancial year ended 31 March 2013
21 Deferred income taxes
2013$
2012$
2013Rs.Crore
2012Rs.Crore
Beginning of fi nancial year 1,017,000 1,000 4.45 0.00
Tax charged to:
- profi t or loss (Note 10(a)) 508,000 1,016,000 2.22 4.15
End of fi nancial year 1,525,000 1,017,000 6.67 4.15
Net deferred income tax liabilities to be settled from the balance sheet date as follows:
2013SGD
2012SGD
2013Rs.Crore
2012Rs.Crore
To be settled within one year – – – –
To be settled after one year 1,524,000 1,017,000 6.67 4.15
1,524,000 1,017,000 6.67 4.15
The movement in deferred income tax liabilities during the fi nancial year is as follows:
Deferred income tax liabilities
2013$
2013Rs.Crore
2013 – –Beginning of fi nancial year 1,017,000 4.45
Charged to profi t or loss 508,000 2.22
End of fi nancial year 1,525,000 6.67
2012Beginning of fi nancial year 1,000 –
Charged to profi t or loss 1,016,000 4.15
End of fi nancial year 1,017,000 4.15
22 Share capital
The Company’s share capital comprises fully paid-up 25,554,000 (2012: 7,000,000) ordinary shares with no par value, amounting to a total of $25,554,000 (2012: $7,000,000) (2013 Rs.111.83 Crore 2012 Rs. 28.58 Crore)
23 Dividends
2013$
2012$
2013Rs.Crore
2012Rs.Crore
Ordinary dividends paid and proposed
Final dividend paid in respect for 2013 of S$nil
– 1,500,000 – 6.12
(2012: S$0.21) per share
Interim dividend paid in respect for 2013 of S$nil (2012: S$0.07) per share
– 500,000 – 2.04
Interim dividend paid in respect for 2013 of S$nil (2012: S$0.14) per share
– 1,000,000 – 4.08
– 3,000,000 – 12.24

117
DERMA-RX INTERNATIONAL AESTHETICS PTE. LTD
117
NOTES TO THE FINANCIAL STATEMENTSFor the fi nancial year ended 31 March 2013
24 Commitments
Operating lease commitments - where the Company is a lessee
The Company leases business and residential premises under non-cancellable operating lease agreements. These leases have varying terms, escalation clauses and renewal rights.
The future minimum lease payables under non-cancellable operating leases contracted for at the balance sheet date but not recognised as liabilities, are as follows:
2013$
2012$
2013Rs.Crore
2012Rs.Crore
Not later than one year 222,000 170,000 0.97 0.69
Between one and fi ve years 49,000 27,000 0.21 0.11
Later than fi ve years – – 0.00 0.00
271,000 197,000 1.19 0.80
25. Financial risk management
Financial risk factors
The Company is exposed to fi nancial risks arising from its operations and the use of fi nancial instruments. The key fi nancial risks are market risk (including currency risk and interest rate risk), credit risk and liquidity risk.
(a) Market risk
(i) Currency risk
The Company’s business operations are exposed to insignifi cant currency risk as its fi nancial assets and fi nancial liabilities are mainly denominated in Singapore Dollar.
(ii) Interest rate risk
The Company is exposed to signifi cant interest rate risk on its borrowings.
The Company’s borrowings at variable rates are denominated mainly in SGD. At 31 March 2013, if the SGD interest rates had increased/decreased by 1% (2012: 1%) with all other variables including tax rate being held constant, the profi t after tax for the year would have been lower/higher by $134,000 Rs. 0.59 Crore (2012: $141,000 Rs. 0.58 Crore) as a result of higher/lower interest expense on these borrowings.
(b) Credit risk
The Company adopts the policy of dealing only with customers of appropriate credit history. For other fi nancial assets, the Company adopts the policy of dealing with fi nancial institutions and other counterparties with high credit ratings. During the fi nancial period, the company derived approximately 89% (2012: 89%) of its revenue from its related parties.
The maximum exposure to credit risk for each class of fi nancial assets is the carrying amount of that class of fi nancial instruments presented on the balance sheet. The Company’s major classes of fi nancial assets are bank deposits and trade and other receivables.
(i) Financial assets that are neither past due nor impaired
Bank deposits that are neither past due nor impaired are mainly deposits with banks which have high credit-ratings. Trade and other receivables that are neither past due nor impaired are substantially companies with good collection track records with the Company.
There are no fi nancial assets that are past due and/or impaired.
During the year no allowance for impairment was made.

118
DERMA-RX INTERNATIONAL AESTHETICS PTE. LTD
118
NOTES TO THE FINANCIAL STATEMENTSFor the fi nancial year ended 31 March 2013
(c) Liquidity risk
The table below analyses the Company’s non-derivative fi nancial liabilities into relevant maturity groupings based on the remaining period from the balance sheet date to the contractual maturity date. The amounts disclosed in the table are the contractual undiscounted cash fl ows.
Less than 1 year
Between 1 and 2 years
Between 2 and 5 years
Less than 1 year
Between 1 and 2 years
Between 2 and 5 years
$ $ $ Rs.Crore Rs.Crore Rs.CroreAt 31 March 2013Trade and other payables
8,440,000 – – 36.94 – –
Borrowings 9,737,000 3,516,000 12,304,000 42.61 15.39 53.85
At 31 March 2012Trade and other payables
3,225,000 7,500,000 – 13.17 30.62 –
Borrowings 1,590,000 3,516,000 13,184,000 6.49 14.36 53.83
(d) Capital risk
The Company’s objectives when managing capital are to ensure that the Company is adequately capitalised and to maintain an optimal capital structure by issuing or redeeming additional equity when necessary.
The Company is not subject to any externally imposed capital requirements.
(e) Fair value of fi nancial assets and liabilities .
The carrying amount of cash and cash equivalents, borrowings, receivables and payables approximate their fair values due to their short term nature.
(f) Financial instruments by category
The aggregate carrying amounts of loans and receivables and fi nancial liabilities at amortised cost are as follows:
2013 2012 2013 2012$ $ Rs.Crore Rs.Crore
Loans and receivables 3,159,000 1,317,000 13.83 5.38
Financial liabilities at amortised cost 33,477,000 33,180,000 146.51 135.47
26. Immediate and ultimate holding corporation
The Company’s immediate holding corporation is Kaya Limited, incorporated in India. The ultimate holding corporation is Marico Limited, incorporated in the India.
27 Related party transactions
In addition to the information disclosed elsewhere in the fi nancial statements, the following transactions took place between the Company and related parties at terms agreed between the parties:

119
DERMA-RX INTERNATIONAL AESTHETICS PTE. LTD
119
NOTES TO THE FINANCIAL STATEMENTSFor the fi nancial year ended 31 March 2013
(a) Sales and purchase of goods and services
2013 2012 2013 2012
$ $ Rs.Crore Rs.Crore
(i) With ultimate holding company Commission
160,000 190,000 0.70 0.73
(ii) With immediate holding company 104,000 597,000 0.46 2.28
Sales – 28,000 0.00 0.11
Expenses
(iii) With subsidiaries
Sales 3,007,000 2,544,000 13.16 9.71
Royalty income 1,829,000 1,693,000 8.00 6.46
Management fee income 96,000 96,000 0.42 0.37
(iv) With companies in which key management personal have a substantial fi nancial interest
Rental 180,000 161,000 0.79 0.61
Balances with related parties at the balance sheet date are disclosed in Notes 12, 19 and 20.
(b) Key management personnel compensation
Employees benefi ts expense includes key management personnel compensation as follows:
2013 2012 2013 2012$ $ Rs.Crore Rs.Crore
Directors’ remuneration 278,000 549,000 1.22 2.10
Other key management personnel 299,000 98,000 1.31 0.37
577,000 647,000 2.53 2.47
28. New or revised accounting standards and interpretations
Certain new standards, amendments and interpretations to existing standards have been published and are mandatory for the Company’s accounting periods beginning on or after 1 January 2013 or later periods and which the Company has not early adopted are:
• Annual Improvements 2011(effective for annual periods beginning on or after 1 January 2013). These annual improvements address six issues in the 2009 to 2011 reporting cycle. It includes changes to FRS 101 First time adoption, FRS 1 Presentation of Financial Statements, FRS 16 Property, plant and equipment, FRS 32 Financial Instruments: Presentation and FRS 34 Interim Financial Reporting.
The management anticipates that the adoption of the above FRSs in the future periods will not have a material impact on the fi nancial statements of the Company in the period of their initial adoption.
29. Authorisation of fi nancial statements
These fi nancial statements were authorised for issue in accordance with a resolution of the Board of Directors of Derma-Rx International Aesthetics Pte Ltd on 27 June 2013.

120
T H E D R X C L I N I C P T E . LT D.
Board of Directors Vijay S. Subramaniam Dharmendra B. Jain Frank Thong Mun Loong Naveen Duggal
Registered Offi ce 213, Henderson Road #01-08 Henderson Industrial Park Singapore 159553
Factory (Outlet) 302, Orchard Road, #16-01 Tong Building, Singapore
Auditors Pricewaterhouse Coopers
Bankers UOB Bank

121
T H E D R X C L I N I C P T E . LT D.
The directors present their report to the shareholder together with the audited fi nancial statements for the fi nancial year ended 31 March 2013.
Directors
The directors in offi ce at the date of this report are as follows:
Vijay S. Subramaniam (appointed on 1 May 2013)Dharmendra B. Jain (appointed on 1 May 2013) Frank Thong Mun Loong (appointed on 1 May 2013)Naveen Duggal
Arrangements to enable directors to acquire shares and debentures
Neither at the end of nor at any time during the fi nancial year was the Company a party to any arrangement whose object was to enable the directors of the Company to acquire benefi ts by means of the acquisition of shares in, or debentures of, the Company or any other body corporate.
Directors’ interests in shares or debentures
According to the register of directors’ shareholdings, none of the directors holding offi ce at the end of the fi nancial year had any interest in the shares or debentures of the Company or its related corporations.
Directors’ contractual benefi ts
Since the end of the previous fi nancial year, no director has received or become entitled to receive a benefi t by reason of a contract made by the Company or a related corporation with the director or with a fi rm of which he is a member or with a company in which he has a substantial fi nancial interest, except as disclosed in the accompanying fi nancial statements and in this report, and except that certain directors receive remuneration as a result of their employment with related corporations.
Share options
No options were granted during the fi nancial year to subscribe for unissued shares of the Company.
No shares were issued during the fi nancial year by virtue of the exercise of options to take up unissued shares of the Company.
There were no unissued shares of the Company under option at the end of the fi nancial year.
Independent auditor
The independent auditor, PricewaterhouseCoopers LLP, has expressed its willingness to accept re-appointment.
On behalf of the directors
Naveen DuggalDirector
Frank Thong Mun LoongDirector
Singapore, 14 June 2013
In the opinion of the directors,
DIRECTORS’ REPORT FOR THE FINANCIAL YEAR ENDED 31 MARCH 2013

122
T H E D R X C L I N I C P T E . LT D.
(a) the fi nancial statements as set out on pages 5 to 23 are drawn up so as to give a true and fair view of the state of affairs of the Company as at 31 March 2013 and of the results of the business, changes in equity and cash fl ows of the Company for the fi nancial year then ended; and
(b) at the date of this statement, there are reasonable grounds to believe that the Company will be able to pay its debts as and when they fall due.
On behalf of the directors
Naveen DuggalDirector
Frank Thong Mun LoongDirector
Singapore, 14 June 2013
STATEMENT BY DIRECTORS’ FOR THE FINANCIAL YEAR ENDED 31 MARCH 2013

123
T H E D R X C L I N I C P T E . LT D.
INDEPENDENT AUDITORS’ REPORTTO THE SHAREHOLDER OF THE DRX CLINIC PTE LTD
Report on the Financial Statements
We have audited the accompanying fi nancial statements of The DRx Clinic Pte Ltd (the “Company”) set out on pages 5 to 23, which comprise the balance sheet as at 31 March 2013, the statement of comprehensive income, the statement of changes in equity and the statement of cash fl ows for the year then ended, and a summary of signifi cant accounting policies and other explanatory information.
Management’s Responsibility for the Financial Statements
Management is responsible for the preparation of fi nancial statements that give a true and fair view in accordance with the provisions of the Singapore Companies Act (the “Act”) and Singapore Financial Reporting Standards, and for devising and maintaining a system of internal accounting controls suffi cient to provide a reasonable assurance that assets are safeguarded against loss from unauthorised use or disposition; and transactions are properly authorised and that they are recorded as necessary to permit the preparation of true and fair profi t and loss accounts and balance sheets and to maintain accountability of assets.
Auditor’s Responsibility
Our responsibility is to express an opinion on these fi nancial statements based on our audit. We conducted our audit in accordance with Singapore Standards on Auditing. Those standards require that we comply with ethical requirements and plan and perform the audit to obtain reasonable assurance about whether the fi nancial statements are free from material misstatement.
An audit involves performing procedures to obtain audit evidence about the amounts and disclosures in the fi nancial statements. The procedures selected depend on the auditor’s judgement, including the assessment of the risks of material misstatement of the fi nancial statements, whether due to fraud or error. In making those risk assessments, the auditor considers internal control relevant to the entity’s preparation of fi nancial statements that give a true and fair view in order to design audit procedures that are appropriate in the circumstances, but not for the purpose of expressing an opinion on the effectiveness of the entity’s internal control. An audit also includes evaluating the appropriateness of accounting policies used and the reasonableness of accounting estimates made by management, as well as evaluating the overall presentation of the fi nancial statements.
We believe that the audit evidence we have obtained is suffi cient and appropriate to provide a basis for our audit opinion.
Opinion
In our opinion, the fi nancial statements of the Company are properly drawn up in accordance with the provisions of the Act and Singapore Financial Reporting Standards so as to give a true and fair view of the state of affairs of the Company as at 31 March 2013, and of the results, changes in equity and cash fl ows of the Company for the fi nancial year ended on that date.
Report on Other Legal and Regulatory Requirements
In our opinion, the accounting and other records required by the Act to be kept by the Company have been properly kept in accordance with the provisions of the Act.
PRICE WATERHOUSE COOPERS LLPPUBLIC ACCOUNTANTS AND CERTIFIED PUBLIC ACCOUNTANTS
Singapore, 14th June 2013

124
T H E D R X C L I N I C P T E . LT D.
BALANCE SHEET AS AT 31 MARCH 2013
Note 2013 2012 2013 2012$ $ Rs. Crore Rs. Crore
ASSETSCurrent assetsCash and cash equivalents 8 956,000 366,000 4.18 1.49
Trade and other receivables 9 386,000 263,000 1.69 1.07
Loan to immediate holding corporation 11 3,703,000 2,039,000 16.21 8.33
Inventories 10 660,000 494,000 2.89 2.02
Tax recoverable 7 161,000 13,000 0.70 0.05
5,866,000 3,175,000 25.67 12.96
Non-current assetsPlant and equipment 12 289,000 176,000 1.26 0.72
Total assets 6,155,000 3,351,000 26.94 13.68
LIABILITIESCurrent liabilitiesTrade and other payables 13 818,000 285,000 3.58 1.16
Deferred revenue 894,000 587,000 3.91 2.40
1,712,000 872,000 7.49 3.56
Non-current liabilitiesDeferred income tax liabilities 14 – 44,000 – 0.18
Total liabilities 1,712,000 916,000 7.49 3.74
NET ASSETS 4,443,000 2,435,000 19.44 9.94
EQUITYShare capital 15 100,000 100,000 0.44 0.41
Retained profi ts 4,343,000 2,335,000 19.01 9.53
Total equity 4,443,000 2,435,000 19.44 9.94
The accompanying notes form an integral part of these fi nancial statements.
Note: The exchange rate used to convert SGD to Rs. <43.764> /(Previous year SGD to Rs.<40.829>).

125
T H E D R X C L I N I C P T E . LT D.
STATEMENT OF COMPREHENSIVE INCOMEfor the fi nancial year ended 31st March 2013
Note 2013 2012 2013 2012$ $ Rs. Crore Rs. Crore
Revenue 3 10,155,000 9,788,000 44.44 37.36
Cost of sales 5 (2,784,000) (2,685,000) (12.18) (10.25)
Gross profi t 7,371,000 7,103,000 32.26 27.11
Other income 4 464,000 464,000 2.03 1.77
Expenses –
- Distribution and marketing 5 (2,190,000) (1,815,000) (9.58) (6.93)
- Administrative 5 (3,484,000) (2,964,000) (15.25) (11.31)
Profi t before income tax 2,161,000 2,788,000 9.46 10.64 Income tax (expense)/credit 7 (153,000) 247,000 (0.67) 0.94
Profi t after tax and total comprehensive income 2,008,000 3,035,000 8.79 11.59
The accompanying notes form an integral part of these fi nancial statements.
Note: The exchange rate used to convert SGD to Rs. <43.764> /(Previous year SGD to Rs.<40.829>).

126
T H E D R X C L I N I C P T E . LT D.
STATEMENT OF CHANGES IN EQUITYfor the fi nancial year ended 31st March 2013
Note Share Retained Totalcapital
$profi ts
$equity
$2013Beginning of fi nancial year 100,000 2,335,000 2,435,000 Total comprehensive income – 2,008,000 2,008,000
Dividends paid 16 – – –
End of fi nancial year 100,000 4,343,000 4,443,000 2012Beginning of fi nancial year 100,000 1,550,000 1,650,000 Total comprehensive income – 3,035,000 3,035,000
Dividends paid 16 – (2,250,000) (2,250,000)
End of fi nancial year 100,000 2,335,000 2,435,000
Note Share Retained Totalcapital
Rs. Crore profi ts
Rs. Crore equity
Rs. Crore 2013Beginning of fi nancial year 0.44 10.22 10.66 Total comprehensive income – 8.79 8.79
Dividends paid 16 – – –
End of fi nancial year 0.44 19.01 19.44 2012Beginning of fi nancial year 0.41 6.33 6.74 Total comprehensive income – 12.39 12.39
Dividends paid 16 – (9.19) (9.19)
End of fi nancial year 0.41 9.53 9.94
The accompanying notes form an integral part of these fi nancial statements
Note: The exchange rate used to convert SGD to Rs. <43.764> /(Previous year SGD to Rs.<40.829>).

127
T H E D R X C L I N I C P T E . LT D.
STATEMENT OF CASH FLOWSfor the fi nancial year ended 31st March 2013
Note 2013 2012 2013 2012$ $ Rs. Crore Rs. Crore
Cash fl ows from operating activities Profi t after tax 2,008,000 3,035,000 8.79 12.39
Adjustments for:
- Income tax expense 7 153,000 (247,000) 0.67 (1.01)
- Depreciation 12 193,000 242,000 0.84 0.99
2,354,000 3,030,000 10.30 12.37
Change in working capital: - Inventories (166,000) (152,000) (0.73) (0.62)
- Trade and other receivables (123,000) (19,000) (0.54) (0.08)
- Trade and other payables 533,000 (100,000) 2.33 (0.41)
- Deferred revenue 307,000 (30,000) 1.34 (0.12)
Cash generated from operations 2,905,000 2,729,000 12.71 11.14
Income tax refund received 84,000 – 0.37 –
Income tax paid 7 (429,000) (519,000) (1.88) (2.12)
Net cash provided by operating activities 2,560,000 2,210,000 11.20 9.02 Cash fl ows from investing activitiesAdditions to plant and equipment 12 (318,000) (39,000) (1.39) (0.16)
Proceeds from disposal of plant and equipment 12,000 0.05 –
Loan to immediate holding corporation (1,664,000) (1,373,000) (7.28) (5.61)
Net cash used in investing activities (1,970,000) (1,412,000) (8.62) (5.77)Cash fl ows from fi nancing activities – Repayments of borrowings – (1,000) – –
Dividends paid – (2,250,000) – (9.19)
Net cash used in fi nancing activities – (2,251,000) – (9.19)Net increase/(decrease) in cash and cash equivalents
590,000 (1,453,000) 2.58 (5.93)
Cash and cash equivalents at beginning of fi nancial year
8 366,000 1,819,000 1.60 7.43
Cash and cash equivalents at end of fi nancial year
8 956,000 366,000 4.18 1.49
Note: The exchange rate used to convert SGD to Rs. <43.764> /(Previous year SGD to Rs.<40.829>).

128
T H E D R X C L I N I C P T E . LT D.
NOTES TO THE FINANCIAL STATEMENTS For the year ended 31 March, 2013
These notes form an integral part of and should be read in conjunction with the accompanying fi nancial statements.
1 General Information
The Company is incorporated and domiciled in Singapore. The address of its registered offi ce is 213 Henderson Road, #01-08 Henderson Industrial Park, Singapore 159553
The principal activities of the Company are those of clinical services and other general western medical services.
The Company’s principal place of business is located at 302 Orchard Road, #16-02, Tong Building, Singapore 238862
2 Signifi cant accounting policies
2.1 Basis of preparation
The fi nancial statements have been prepared in accordance with Singapore Financial Reporting Standards (“FRS”) under the historical cost convention, except as disclosed in the accounting policies below.
The preparation of these fi nancial statements in conformity with FRS requires management to exercise its judgement in the process of applying the Company’s accounting policies. It also requires the use of certain accounting estimates and assumptions. There are no areas in the fi nancial statements which involve the application of signifi cant estimates or judgement.
Interpretations and amendments to published standards effective in 2012
On 1 April 2012, the Company adopted the new or amended FRS and Interpretations to FRS (“INT FRS”) that are mandatory for application from that date. Changes to the Company’s accounting policies have been made as required, in accordance with the transitional provisions in the respective FRS and INT FRS.
The adoption of these new or amended FRS and INT FRS did not result in substantial changes to the Company’s accounting policies and had no material effect on the amounts reported for the current or prior fi nancial years.
2.2 Revenue recognition
(a) Sale of goods
Sale of goods comprises the fair value of the consideration received or receivable for the sale of goods in the ordinary course of the Company’s activities.
Sales are recognized when the Company has delivered the products to the customers, the customers have accepted the products and the collectability of the related receivables is reasonably assured. Sales are presented, net of goods and services tax and discounts.
(b) Rendering of services
Service income is recognized when services are rendered and accepted by customers.
Collections from service packages are deferred and recognised as revenue as and when the services due are provided to customers. Unused service packages are included in the balance sheet as deferred income.
(c) Interest income
Interest income is recognized using the effective interest method.
2.3 Employee compensation
(a) Defi ned contribution plans
The Company’s contributions to defi ned contribution plans are recognised as employee compensation expense when the contributions are due, unless they can be capitalized as an asset.

129
T H E D R X C L I N I C P T E . LT D.
(b) Employee leave entitlement
Employee entitlements to annual leave are recognized when they accrue to employees. A provision is made for the estimated liability for annual leave as a result of services rendered by employees up to the balance sheet date.
2.4 Operating leases
(a) When the Company is the lessee:
Payments made under operating leases (net of any incentives received from the lessors) are recognised in profi t or loss on a straight-line basis over the period of the lease.
(b) When the Company is the lessor:
Rental income from operating leases (net of any incentives given to the lessees) are recognised in profi t or loss on a straight-line basis over the period of the lease.
2.5 Income taxes
Current income tax is recognised at the amount expected to be paid to or recovered from the tax authorities.
Deferred income tax is recognised for all temporary differences except when the deferred income tax arises from the initial recognition of an asset or liability that affects neither accounting nor taxable profi t or loss at the time of the transaction.
Current and deferred income tax is measured using the tax rates and tax laws that have been enacted or substantively enacted by the balance sheet date, and are recognised as income or expenses in profi t or loss, except to the extent that the tax arises from a transaction which is recognised directly in equity.
2.6 Inventories
Inventories are carried at the lower of cost and net realisable value. Cost is determined using the weighted average method. Net realisable value is the estimated selling price in the ordinary course of business, less the estimated costs necessary to make the sale.
2.7 Plant and equipment
Plant and equipment are recognised at cost less accumulated depreciation and accumulated impairment losses.
Subsequent expenditure relating to plant and equipment that has already been recognised is added to the carrying amount of the asset only when it is probable that future economic benefi ts associated with the item will fl ow to the Company and the cost of the item can be measured reliably.
Depreciation is calculated using the straight-line method to allocate depreciable amounts over their estimated useful lives. The estimated useful lives are as follows:
Useful lives
Computers 3 years
Furniture and fi ttings 3 years
Offi ce equipment 3 years
Renovations 3 years
Medical equipment 3 years
The residual values, estimated useful lives and depreciation method of property, plant and equipment are reviewed, and adjusted as appropriate, at each balance sheet date. The effects of any revision are recognised in profi t or loss when the changes arise.
NOTES TO THE FINANCIAL STATEMENTS For the year ended 31 March, 2013

130
T H E D R X C L I N I C P T E . LT D.
2.8 Impairment of non-fi nancial assets
Plant and equipment
Plant and equipment are reviewed for impairment whenever there is any indication that these assets may be impaired.
For the purpose of impairment testing, the recoverable amount (i.e. the higher of the fair value less cost to sell and the value-in-use) is determined on an individual asset basis unless the asset does not generate cash infl ows that are largely independent of those from other assets. If this is the case, the recoverable amount is determined for the CGU to which the asset belongs.
If the recoverable amount of the asset (or CGU) is estimated to be less than its carrying amount, the carrying amount of the asset (or CGU) is reduced to its recoverable amount.
The difference between the carrying amount and recoverable amount is recognized as an impairment loss in profi t or loss.
An impairment loss for an asset is reversed if, and only if, there has been a change in the estimates used to determine the asset’s recoverable amount since the last impairment loss was recognised. The carrying amount of this asset is increased to its revised recoverable amount, provided that this amount does not exceed the carrying amount that would have been determined (net of any accumulated amortisation or depreciation) had no impairment loss been recognised for the asset in prior years. A reversal of impairment loss for an asset is recognised in profi t or loss.
2.9 Loans and receivables Cash and cash equivalents Trade and other receivablesLoan to immediate holding corporation
Cash and cash equivalents, trade and other receivables and loan to immediate holding corporation are initially recognised at their fair values plus transaction costs and subsequently carried at amortised cost using the effective interest method, less accumulated impairment losses.
The Company assesses at each balance sheet date whether there is objective evidence that these fi nancial assets are impaired and recognises an allowance for impairment when such evidence exists. Signifi cant fi nancial diffi culties of the debtor, probability that the debtor will enter bankruptcy and default or signifi cant delay in payments are objective evidence that these fi nancial assets are impaired.
The carrying amount of these assets is reduced through the use of an impairment allowance account which is calculated as the difference between the carrying amount and the present value of estimated future cash fl ows, discounted at the original effective interest rate.
These assets are presented as current assets except for those that are expected to be realised later than 12 months after the balance sheet date, which are presented as non-current assets.
2.10 Trade and other payables
Trade and other payables represent unpaid liabilities for goods and services provided to the Company prior to the end of the fi nancial year. They are classifi ed as current liabilities if payment is due within one year or less (or in the normal operating cycle of the business, if longer). If not, they are presented as non current liabilities.
Trade and other payables are initially recognised at fair value, and subsequently carried at amortised cost using the effective interest method.
2.11 Cash and cash equivalents
For the purpose of presentation in the statement of cash fl ows, cash and cash equivalents include cash on hand and deposits with fi nancial institutions which are subject to an insignifi cant risk of change in value.
2.12 Dividends
Dividends to the Company’s shareholders are recognised when the dividends are approved for payment.
NOTES TO THE FINANCIAL STATEMENTS For the year ended 31 March, 2013

131
T H E D R X C L I N I C P T E . LT D.
2.13 Currency translation
The fi nancial statements are presented in Singapore Dollars, which is the functional currency of the Company.
Transactions in a currency other than the Singapore Dollar (“foreign currency”) are translated into Singapore Dollars using the exchange rates at the dates of the transactions. Currency translation differences resulting from the settlement of such transactions and from the translation of monetary assets and liabilities denominated in foreign currencies at the closing rates at the balance sheet date are recognised in profi t or loss.
2.14 Share capital
Ordinary shares are classifi ed as equity.
3 RevenueRevenue Comprises the following items :
2013 2012 2013 2012$ $ Rs. Crore Rs. Crore
Rendering of services 4,944,000 4,524,000 21.63 17.27
Sales of goods 5,211,000 5,264,000 22.80 20.09
10,155,000 9,788,000 44.44 37.36
4 Other Income
2013 2012 2013 2012$ $ Rs. Crore Rs. Crore
Rental income 326,000 326,000 1.43 1.24
Consultation fees 132,000 132,000 0.58 0.50
Miscellaneous income 6,000 3,000 0.03 0.01
Exchange gain – 3,000 – 0.01
464,000 464,000 2.03 1.77
5 Expenses by nature
2013 2012 2013 2012$ $ Rs.crore Rs.crore
Purchases of inventories 2,784,000 2,685,000 12.18 10.25
"Depreciation of property, plant and equipment (Note 12)”
193,000 242,000 0.84 0.92
Employee compensation (Note 6) 2,989,000 2,225,000 13.08 8.49
Advertising expense 2,000 4,000 0.01 0.02
Professional fee 26,000 37,000 0.11 0.04
Rental on operating leases 627,000 627,000 2.74 2.39
Transportation expense 21,000 16,000 0.09 0.06
Royalty 1,466,000 1,350,000 6.42 5.15
Bank charge 196,000 171,000 0.86 0.65
Other expenses 154,000 107,000 0.67 0.51
Total cost of sales, distribution and marketing costs and administrative expenses
8,458,000 7,464,000 37.01 28.49
NOTES TO THE FINANCIAL STATEMENTS For the year ended 31 March, 2013

132
T H E D R X C L I N I C P T E . LT D.
6 Employee Compensation
2013 2012 2013 2012$ $ Rs. Crore Rs. Crore
Wages and salaries 2,754,000 2,038,000 12.05 7.78
Employer’s contribution to Central Provident Fund
181,000 152,000 0.79 0.58
Other benefi ts 54,000 35,000 0.24 0.13
2,989,000 2,225,000 13.08 8.49
7 Income Taxes
(a) Income tax (expense) / Credit
2013 2012 2013 2012$ $ Rs. Crore Rs. Crore
Tax expense attributable to profi t is made up of:
- Current income tax 208,000 84,000 0.91 0.32
208,000 84,000 0.91 0.32
over provision in prior fi nancial years –
- Current income tax (11,000) (331,000) (0.05) (1.26)
- Deferred income tax (Note 14) (44,000) – (0.19) –
153,000 (247,000) 0.67 (0.94)
The tax on profi t before tax differs from the theoretical amount that would arise using the Singapore standard rate of income tax as follows:
2013 2012 2013 2012$ $ Rs. Crore Rs. Crore
Profi t before tax 2,161,000 2,788,000 9.46 11.38
Tax calculated at tax rate of 17% (2012: 17%)
367,000 474,000 1.61 1.94
Effects of:
- Statutory stepped income exemption (26,000) (26,000) (0.11) (0.11)
- Expenses not deductible for tax purposes
4,000 43,000 0.02 0.18
- Utilisation of group losses (120,000) (394,000) (0.53) (1.61)
- Tax incentives (10,000) – (0.04) –
- Income not subject to tax (7,000) (13,000) (0.03) (0.05)
Tax charge 208,000 84,000 0.91 0.34
NOTES TO THE FINANCIAL STATEMENTS For the year ended 31 March, 2013

133
T H E D R X C L I N I C P T E . LT D.
b. Movements in current Income tax liabilities/(tax recoverable)
2013 2012 2013 2012$ $ Rs. Crore Rs. Crore
Beginning of fi nancial year (13,000) 753,000 (0.06) 3.07
Income tax paid (429,000) (519,000) (1.88) (2.12)
Income tax refund received 84,000 – 0.37 –
Tax expense 208,000 84,000 0.91 0.34
Overprovision in prior fi nancial years (11,000) (331,000) (0.05) (1.35)
End of fi nancial year (161,000) (13,000) (0.70) (0.05)
8 Cash and cash equivalents
2013 2012 2013 2012$ $ Rs.crore Rs.crore
Cash at bank and on hand 956,000 366,000 4.18 1.49
For the purpose of presenting the statement of cash fl ows, cash & cash equivalents comprise the following:
2013 2012 2013 2012$ $ Rs. Crore Rs. Crore
Cash and bank deposits (as above) 956,000 366,000 4.18 1.49
Cash and cash equivalents per statement of cash fl ows
956,000 366,000 4.18 1.49
9 Trade and other Receivables
2013 2012 2013 2012$ $ Rs. Crore Rs. Crore
Trade receivables
-Fellow subsidiaries 106,000 – 0.46 –
-Non-related parties 80,000 82,000 0.35 0.33
Trade receivables – net 186,000 82,000 0.81 0.33
Other receivables 200,000 181,000 0.88 0.74
386,000 263,000 1.69 1.07
10 Inventories
2013 2012 2013 2012$ $ Rs. Crore Rs. Crore
Finished goods 660,000 494,000 2.89 2.02
11 Loan to Immediate holding corporation
The loan to the immediate holding corporation is unsecured, Interest free and repayable on demand.
NOTES TO THE FINANCIAL STATEMENTS For the year ended 31 March, 2013

134
T H E D R X C L I N I C P T E . LT D.
12 Plant and equipment
Computers Furniture & fi ttings
Renovations Offi ce equipments
Medical equipments
Total
2013 $ $ $ $ $ $Cost Beginning of fi nancial year 50,000 246,000 710,000 93,000 829,000 1,928,000
Additions 8,000 5,000 – 1,000 304,000 318,000
Disposals (2,000) – – (2,000) (24,000) (28,000)
Transfers – 7,000 – (7,000) – –
End of fi nancial year 56,000 258,000 710,000 85,000 1,109,000 2,218,000
Accumulated depreciation
Beginning of fi nancial year 48,000 245,000 684,000 92,000 683,000 1,752,000
Depreciation charge (Note 5) 2,000 2,000 21,000 1,000 166,000 193,000
Disposals (2,000) – – (2,000) (12,000) (16,000)
Transfers – 7,000 – (7,000) – –
End of fi nancial year 48,000 254,000 705,000 84,000 837,000 1,928,000
Net book value
End of fi nancial year 8,000 4,000 5,000 1,000 272,000 290,000
2012
Cost
Beginning of fi nancial year 48,000 246,000 710,000 93,000 832,000 1,929,000
Additions 2,000 – – – 37,000 39,000
Disposals – – – – (40,000) (40,000)
End of fi nancial year 50,000 246,000 710,000 93,000 829,000 1,928,000
Accumulated depreciation
Beginning of fi nancial year 47,000 241,000 638,000 89,000 535,000 1,550,000
Depreciation charge (Note 5) 1,000 4,000 46,000 3,000 188,000 242,000
Disposals – – – – (40,000) (40,000)
End of fi nancial year 48,000 245,000 684,000 92,000 683,000 1,752,000
Net book value
End of fi nancial year 2,000 1,000 26,000 1,000 146,000 176,000
NOTES TO THE FINANCIAL STATEMENTS For the year ended 31 March, 2013

135
T H E D R X C L I N I C P T E . LT D.
12 Property, plant and equipment(Contd.)
Computers Furniture & fi ttings
Renovations Offi ce equipments
Medical equipments
Total
2013 Rs. Crore Rs. Crore Rs. Crore Rs. Crore Rs. Crore Rs. Crore
Cost
Beginning of fi nancial year 0.22 1.08 3.11 0.41 3.63 8.44
Additions 0.04 0.02 – – 1.33 1.39
Disposals (0.01) – – (0.01) (0.11) (0.12)
Transfers – 0.03 – (0.03) – –
End of fi nancial year 0.25 1.13 3.11 0.37 4.85 9.71
Accumulated depreciation
Beginning of fi nancial year 0.21 1.07 2.99 0.40 2.99 7.67
Depreciation charge (Note 5) 0.01 0.01 0.09 – 0.73 0.84
Disposals (0.01) – – (0.01) (0.05) (0.07)
Transfers – 0.03 – (0.03) – –
End of fi nancial year 0.21 1.11 3.09 0.37 3.66 8.44
Net book value
End of fi nancial year 0.04 0.02 0.02 – 1.19 1.27
2012
Cost
Beginning of fi nancial year 0.20 1.00 2.90 0.38 3.40 7.88
Additions 0.01 – – – 0.15 0.16
Disposals – – – – (0.16) (0.16)
End of fi nancial year 0.20 1.00 2.90 0.38 3.38 7.87
Accumulated depreciation
Beginning of fi nancial year 0.19 0.98 2.60 0.36 2.18 6.33
Depreciation charge (Note 5) – 0.02 0.19 0.01 0.77 0.99
Disposals – – – – (0.16) (0.16)
End of fi nancial year 0.20 1.00 2.79 0.38 2.79 7.15
Net book value
End of fi nancial year 0.01 – 0.11 – 0.60 0.72
13 Trade and other payables
2013 2012 2013 2012$ $ Rs. Crore Rs. Crore
Trade payables to:
- Non-related parties 421,000 – 1.84 –
Accruals for operating expenses 397,000 285,000 1.74 1.16
818,000 285,000 3.58 1.16
NOTES TO THE FINANCIAL STATEMENTS For the year ended 31 March, 2013

136
T H E D R X C L I N I C P T E . LT D.
14 Deferred income taxes
2013 2012 2013 2012$ $ Rs. Crore Rs. Crore
Beginning of fi nancial year 44,000 44,000 0.19 0.18
Tax credited to:
- Profi t or loss (Note 7(a)) (44,000) – 0.19 0.18
End of fi nancial year – 44,000 – 0.18
15 Share Capital
The Company’s share capital comrises fully paid-up 100,000 (2012: 100,000) ordinary shares with no par value, amounting to a total of $100,000 (2012: $100,000)
16 Dividends
2013 2012 2013 2012$ $ Rs. Crore Rs. Crore
Ordinary dividends paid or proposed
First interim dividend paid in respect of current fi nancial year of S$nil (2012: S$12.50) per share
– 1,250,000 – 5.10
Second interim dividend paid in respect of current fi nancial year of S$nil (2012 S$5) per share
– 500,000 – 2.04
Third interim dividend paid in respect of current fi nancial year of S$nil (2012: S$5) per share
– 500,000 – 2.04
– 2,250,000 – 9.19
17 Commitments
(a) Operating lease commitments - where the Company is a lessee
The Company leases business premises under non-cancellable operating lease agreements. The leases have varying terms, escalation clauses and renewal rights.
The future minimum lease payables under non-cancellable operating leases contracted for at the balance sheet date but not recognised as liabilities, are as follows:
2013 2012 2013 2012$ $ Rs. Crore Rs. Crore
Not later than one year 631,000 627,000 2.76 2.56
Between one and fi ve years 389,000 1,046,000 1.70 4.27
1,020,000 1,673,000 4.46 6.83
(b) Operating lease commitments - where the Company is a lessor
The Company sublets business premises to associated companies under non cancellable operating lease agreements. The leases have varying terms, escalation clauses and renewal rights.
The future minimum lease payables under non-cancellable operating leases contracted for at the balance sheet date but not recognised as assets, are as follows:
NOTES TO THE FINANCIAL STATEMENTS For the year ended 31 March, 2013

137
T H E D R X C L I N I C P T E . LT D.
2013 2012 2013 2012$ $ Rs. Crore Rs. Crore
Not later than one year 314,000 326,000 1.37 1.33
Between one and fi ve years 189,000 543,000 0.83 2.22
503,000 869,000 2.20 3.55
18 Financial risk management
Financial risk factors
The Company is exposed to fi nancial risks arising from its operations and the use of fi nancial instruments. The key fi nancial risks are credit risk, foreign exchange risk, interest rate risk and liquidity risk. Management reviews and agrees on policies for managing each of these risks and they are summarized below:
(a) Credit risk
Credit risk is the potential risk of fi nancial loss resulting from the failure of customers or other counterparties to settle their fi nancial and contractual obligations to the company as and when they fall due.
The Company’s exposure to credit risk arises primarily from trade and other receivables (including amounts owing by related parties). For other fi nancial assets (including cash and cash equivalents),the company minimises credit risk by dealing with high credit rating counterparties.
Management regularly monitors credit risk exposure to counterparties.
Management believes that concentration of credit risk is limited due to ongoing credit evaluations on all counterparties and, where necessary, maintaining an allowance for doubtful receivables which will adequately provide for potential credit risks.
Financial assets that are neither past due nor impaired
Trade and other receivables that are neither past due nor impaired are creditworthy debtors with a good payment record with the Company. Cash and cash equivalents that are neither past due nor impaired are mainly deposits placed with reputable fi nancial institutions with high credit-ratings.
There are no fi nancial assets that are past due or impaired as at the balance sheet date.
(b) Market risk
(i) Currency risk
The company does not have signifi cant foreign currency transactions,thus the net exposure is not expected to be signifi cant.
(ii) Interest rate risk
Interest rate risk is the risk that the fair value or future cash fl ows of the company’s fi nancial instruments will fl uctuate because of changes in market interest rates.
The company does not have any interest-bearing fi nancial liabilities. Its only exposure to changes in interest rates relates to interest-earning bank deposits. The company monitors movements in interest rates to ensure deposits are placed with fi nancial institutions offering optimal rates of return.
(c) Liquidity risk
Liquidity risk is the risk that the company will encounter diffi culty in meeting fi nancial obligations due to shortage of funds.
NOTES TO THE FINANCIAL STATEMENTS For the year ended 31 March, 2013

138
T H E D R X C L I N I C P T E . LT D.
The company monitors its liquidity risk by maintaining a level of cash and cash equivalents deemed adequate to fi nance the company’s operations and to mitigate the effects of fl uctuations in cash fl ows.
All fi nancial liabilities of the company are repayable on demand or mature within one year.
(d) Capital risk
The Company’s objectives when managing capital are to ensure that the Company is adequately capitalised and to maintain an optimal capital structure by issuing or redeeming additional equity when necessary.
Management monitors its capital based on total equity.
The Company is not subject to any externally imposed capital requirements.
There were no changes to the Company’s approach to capital management during the year.
(e) Fair value of fi nancial assets and liabilities
The carrying amounts of cash and cash equivalents, receivables and payables approximate their fair values due to their short term nature.
(f) Financial instruments by category
The aggregate carrying amounts of loans and receivables and fi nancial liabilities at amortised cost are as follows:
2013 2012 2013 2012$ $ Rs. Crore Rs. Crore
Loans & Receivables 5,045,000 2,668,000 22.08 10.89
Financials liabilities at amortised cost 818,000 285,000 3.58 1.16
19 Immediate and ultimate holding corporation
The Company’s immediate holding corporation is Derma-Rx International Aesthetics Pte Ltd, incorporated in Singapore. The ultimate and intermediate holding corporation are Marico Limited and Kaya Limited respectively, both incorporated in India.
20 Related Party Transactions
In addition to the information disclosed elsewhere in the fi nancial statements, the following transactions took place between the Company and related parties at terms agreed between the parties:
(a) Sales and purchase of goods and services
2013 2012 2013 2012$ $ Rs. Crore Rs. Crore
(i) With immediate holding company
Purchases 2,131,000 1,992,000 9.33 7.60
Royalty fees 1,466,000 1,350,000 6.42 5.15
(ii) With fellow subsidiaries
Sales 381,000 870,000 1.67 3.32
Rental 326,000 326,000 1.43 1.24
Consultation fee income 132,000 132,000 0.58 0.50
Miscellaneous – 2,000 – 0.01
Purchases – 35,000 – 0.13
Sale of plant and equipment 12,000 – 0.05 –
Balances with related parties at the balance sheet date are unsecured and receivable/payable on demand and are disclosed in Notes 9 and 11 respectively.
NOTES TO THE FINANCIAL STATEMENTS For the year ended 31 March, 2013

139
T H E D R X C L I N I C P T E . LT D.
(b) Key management personnel compensation
Employee benefi ts expense includes key management personnel compensation as follows:
2013 2012 2013 2012$ $ Rs. Crore Rs. Crore
Short-term employee benefi ts
- Directors’ remuneration 639,000 616,000 2.80 2.35
- Other key management personnel 34,000 34,000 0.15 0.13
673,000 650,000 2.95 2.48
21 New or revised accounting standards and interpretations
Certain new accounting standards, amendments and interpretations to existing standards have been published and are mandatory for the Company’s accounting periods beginning on or after 1 January 2013 or later periods and which the Company has not early adopted.
• Annual Improvements 2011 (effective for annual periods beginning on or after 1 January 2013). These annual improvements address six issues in the 2009 to 2011 reporting cycle. It includes changes to FRS 101 First time adoption, FRS 1 Presentation of Financial Statements, FRS 16 Property, plant and equipment, FRS 32 Financial Statements: Presentation and FRS 34 Interim Financial Reporting.
The management anticipates that the adoption of the above FRSs in the future periods will not have a material impact on the fi nancial statements of the Company in the period of their initial adoption.
22 Authorisation of fi nancial statements
These fi nancial statements were authorised for issue in accordance with a resolution of the Board of Directors of The DRx Clinic Pte Ltd on 14th June 2013.
NOTES TO THE FINANCIAL STATEMENTS For the year ended 31 March, 2013

140
T H E D R X M E D I S PA P T E . LT D.
Board of Directors Vijay S. Subramaniam
Dharmeendra B Jain
Frank Thong Mun Loong
Naveen Duggal
Registered Offi ce 213, Henderson Road
#01-08 Henderson Industrial Park
Singapore 159553
Factory (Outlet) 302, Orchard Road
#16-01 Tong Building
Singapore
Auditors Pricewaterhouse Coopers
Bankers UOB Bank

141
T H E D R X M E D I S PA P T E . LT D.
The directors present their report to the shareholder together with the audited fi nancial statements for the fi nancial year ended 31 March 2013.
Directors
The directors in offi ce at the date of this report are as follows:
Vijay S. Subramaniam appointed on 1 May 2013Dharmendra B. Jain appointed on 1 May 2013 Frank Thong Mun Loong appointed on 1 May 2013Naveen Duggal appointed on 1 May 2013
Arrangements to enable directors to acquire shares and debentures
Neither at the end of nor at any time during the fi nancial year was the Company a party to any arrangement whose object was to enable the directors of the Company to acquire benefi ts by means of the acquisition of shares in, or debentures of, the Company or any other body corporate.
Directors’ interests in shares or debentures
According to the register of directors’ shareholdings, none of the directors holding offi ce at the end of the fi nancial year had any interest in the shares or debentures of the Company or its related corporations.
Directors’ contractual benefi ts
Since the end of the previous fi nancial year, no director has received or become entitled to receive a benefi t by reason of a contract made by the Company or a related corporation with the director or with a fi rm of which he is a member or with a company in which he has a substantial fi nancial interest, except as disclosed in the accompanying fi nancial statements and in this report, and except that certain directors receive remuneration as a result of their employment with related corporations.
Share options
No options were granted during the fi nancial year to subscribe for unissued shares of the Company.
No shares were issued during the fi nancial year by virtue of the exercise of options to take up unissued shares of the Company.
There were no unissued shares of the Company under option at the end of the fi nancial year.
Independent auditor
The independent auditor, PricewaterhouseCoopers LLP, has expressed its willingness to accept re-appointment.
On behalf of the directors
Naveen DuggalDirector
Frank Thong Mun LoongDirector
Singapore, 14th June 2013
REPORT OF THE DIRECTORS’

142
T H E D R X M E D I S PA P T E . LT D.
In the opinion of the directors,
(a) the fi nancial statements as set out on pages 5 to 22 are drawn up so as to give a true and fair view of the state of affairs of the Company as at 31 March 2013 and of the results of the business, changes in equity and cash fl ows of the Company for the fi nancial year then ended; and
(b) at the date of this statement, with the continuing fi nancial support from its intermediate holding corporation, there are reasonable grounds to believe that the Company will be able to pay its debts as and when they fall due.
On behalf of the directors
Naveen Duggal Director
Frank Thong Mun Loong Director
Singapore, 14th June 2013
STATEMENT BY DIRECTORS’

143
T H E D R X M E D I S PA P T E . LT D.
INDEPENDENT AUDITORS’ REPORTTO THE SHAREHOLDER OF THE DRX MEDISPA PTE LTD
Report on the Financial Statements
We have audited the accompanying fi nancial statements of The DRx Medispa Pte Ltd (the “Company”) set out on pages 5 to 22, which comprise the balance sheet as at 31 March 2013, the statement of comprehensive income, the statement of changes in equity and the statement of cash fl ows for the year then ended, and a summary of signifi cant accounting policies and other explanatory information.
Management’s Responsibility for the Financial Statements
Management is responsible for the preparation of fi nancial statements that give a true and fair view in accordance with the provisions of the Singapore Companies Act (the “Act”) and Singapore Financial Reporting Standards, and for devising and maintaining a system of internal accounting controls suffi cient to provide a reasonable assurance that assets are safeguarded against loss from unauthorised use or disposition; and transactions are properly authorised and that they are recorded as necessary to permit the preparation of true and fair profi t and loss accounts and balance sheets and to maintain accountability of assets.
Auditor’s Responsibility
Our responsibility is to express an opinion on these fi nancial statements based on our audit. We conducted our audit in accordance with Singapore Standards on Auditing. Those standards require that we comply with ethical requirements and plan and perform the audit to obtain reasonable assurance about whether the fi nancial statements are free from material misstatement.
An audit involves performing procedures to obtain audit evidence about the amounts and disclosures in the fi nancial statements. The procedures selected depend on the auditor’s judgement, including the assessment of the risks of material misstatement of the fi nancial statements, whether due to fraud or error. In making those risk assessments, the auditor considers internal control relevant to the entity’s preparation of fi nancial statements that give a true and fair view in order to design audit procedures that are appropriate in the circumstances, but not for the purpose of expressing an opinion on the effectiveness of the entity’s internal control. An audit also includes evaluating the appropriateness of accounting policies used and the reasonableness of accounting estimates made by management, as well as evaluating the overall presentation of the fi nancial statements.
We believe that the audit evidence we have obtained is suffi cient and appropriate to provide a basis for our audit opinion.
Opinion
In our opinion, the fi nancial statements of the Company are properly drawn up in accordance with the provisions of the Act and Singapore Financial Reporting Standards so as to give a true and fair view of the state of affairs of the Company as at 31 March 2013, and of the results, changes in equity and cash fl ows of the Company for the fi nancial year ended on that date.
Report on Other Legal and Regulatory Requirements
In our opinion, the accounting and other records required by the Act to be kept by the Company have been properly kept in accordance with the provisions of the Act.
PRICE WATERHOUSE COOPERS LLPPUBLIC ACCOUNTANTS AND CERTIFIED PUBLIC ACCOUNTANTS
Singapore, 14th June 2013

144
T H E D R X M E D I S PA P T E . LT D.
BALANCE SHEET AS AT 31 MARCH 2013
Note 2013 2012 2013 2012$ $ Rs. Crore Rs. Crore
ASSETSCurrent assetsCash and cash equivalents 8 402,000 588,000 1.76 2.40
Trade and other receivables 9 143,000 180,000 0.63 0.73
Inventories 10 123,000 69,000 0.54 0.28
Loan to immediate holding corporation 11 4,701,000 2,078,000 20.57 8.48
5,369,000 2,915,000 23.50 11.90 Non-current assetsPlant and equipment 12 338,000 420,000 1.48 1.71
338,000 420,000 1.48 1.71 Total assets 5,707,000 3,335,000 24.98 13.62 LIABILITIESCurrent liabilities
Trade and other payables 13 477,000 189,000 2.09 0.77
Deferred revenue 3,906,000 3,133,000 17.09 12.79
Current income tax liabilities 7 139,000 211,000 0.61 0.86
4,522,000 3,533,000 19.79 14.42 Non-current liabilitiesDeferred income tax liabilities 14 – 8,000 – 0.03
– 8,000 – 0.03 Total liabilities 4,522,000 3,541,000 19.79 14.46 NET LIABILITIES 1,185,000 (206,000) 5.19 (0.84)EQUITY
Share capital 15 100,000 100,000 0.44 0.41
Retained profi ts/(accumulated losses) 1,085,000 (306,000) 4.75 (1.25)
Total equity 1,185,000 (206,000) 5.19 (0.84)
The accompanying notes form an integral part of these fi nancial statements.
Note: The exchange rate used to convert SGD to Rs. <43.764> /(Previous year SGD to Rs.<40.829>).

145
T H E D R X M E D I S PA P T E . LT D.
STATEMENT OF COMPREHENSIVE INCOMEfor the fi nancial year ended 31st March 2013
Note 2013 2012 2013 2012$ $ Rs. Crore Rs. Crore
Revenue 3 6,805,000 6,561,000 29.78 25.05
Cost of sales 5 (1,286,000) (1,378,000) (5.63) (5.26)
Gross profi t 5,519,000 5,183,000 24.15 19.79 Other income 4 7,000 3,000 0.03 0.01
Expenses
- Distribution and marketing 5 (2,085,000) (16,000) (9.12) (0.06)
- Administrative 5 (1,799,000) (3,260,000) (7.87) (12.44)
Profi t before income tax 1,642,000 1,910,000 7.19 7.29 Income tax expense 7 (251,000) (241,000) (1.10) (0.92)
Profi t after tax representing total comprehensive income 1,391,000 1,669,000 6.09 6.37
The accompanying notes form an integral part of these fi nancial statements.
Note: The exchange rate used to convert SGD to Rs. <43.764> /(Previous year SGD to Rs.<40.829>).

146
T H E D R X M E D I S PA P T E . LT D.
STATEMENT OF CHANGES IN EQUITYFOR THE FINANCIAL YEAR ENDED 31ST MARCH 2013
Note Share Retained Totalcapital
$profi ts
$equity
$2013Beginning of fi nancial year 100,000 (306,000) (206,000)Total comprehensive income – 1,391,000 1,391,000
Dividends paid 16 – – –
End of fi nancial year 100,000 1,085,000 1,185,000 2012Beginning of fi nancial year 100,000 (1,225,000) (1,125,000)Total comprehensive income – 1,669,000 1,669,000
Dividends paid 16 – (750,000) (750,000)
End of fi nancial year 100,000 (306,000) (206,000)
Note Share Retained Totalcapital
Rs. Crore profi ts
Rs. Crore equity
Rs. Crore 2013Beginning of fi nancial year 0.44 (1.34) (0.90)Total comprehensive income – 6.09 6.09
Dividends paid 16 – – –
End of fi nancial year 0.44 4.75 5.19 2012Beginning of fi nancial year 0.41 (5.00) (4.59)Total comprehensive income – 6.81 6.81
Dividends paid 16 – (3.06) (3.06)
End of fi nancial year 0.41 (1.25) (0.84)
The accompanying notes form an integral part of these fi nancial statements
Note: The exchange rate used to convert SGD to Rs. <43.764> /(Previous year SGD to Rs.<40.829>).

147
T H E D R X M E D I S PA P T E . LT D.
STATEMENT OF CASH FLOWSFOR THE FINANCIAL YEAR ENDED 31ST MARCH 2013
Note 2013 2012 2013 2012$ $ Rs. Crore Rs. Crore
Cash fl ows from operating activities Profi t after tax 1,391,000 1,669,000 6.09 6.81
Adjustments for:
- Income tax expense 251,000 241,000 1.10 0.98
- Depreciation 201,000 166,000 0.88 0.68
1,843,000 2,076,000 8.07 8.48
Change in working capital: - Inventories (54,000) (45,000) (0.24) (0.18)
- Trade and other receivables 37,000 (118,000) 0.16 (0.48)
- Trade and other payables 288,000 85,000 1.26 0.35
- Deferred revenue 773,000 – 3.38 –
Cash generated from operations 2,887,000 1,998,000 12.63 8.16
Income tax paid (331,000) (217,000) (1.45) (0.89)
Net cash provided by operating activities 2,556,000 1,781,000 11.19 7.27
Cash fl ows from investing activitiesAdditions to property, plant and equipment (119,000) (515,000) (0.52) (2.10)Loan to immediate holding corporation (2,623,000) (1,984,000) (11.48) (8.10)
Net cash used in investing activities (2,742,000) (2,499,000) (12.00) (10.20)
Cash fl ows from fi nancing activities
Repayment of borrowings to related company
– (105,000) – (0.43)
Dividends paid – (750,000) – (3.06)Net cash used in fi nancing activities – (855,000) – (3.49)
Net decrease in cash and cash equivalents (186,000) (1,573,000) (0.81) (6.42)
Cash and cash equivalents at beginning of fi nancial year
8 588,000 2,161,000 2.57 8.82
Cash and cash equivalents at end of fi nancial year
8 402,000 588,000 1.76 2.40
Note: The exchange rate used to convert SGD to Rs. <43.764> /(Previous year SGD to Rs.<40.829>).

148
T H E D R X M E D I S PA P T E . LT D.
NOTES TO THE FINANCIAL STATEMENTS For the year ended 31 March, 2013
These notes form an integral part of and should be read in conjunction with the accompanying fi nancial statements.
1. General Information
The Company is incorporated and domiciled in Singapore. The address of its registered offi ce is 213 Henderson Road,
#01-08 Henderson Industrial Park, Singapore 159553
The principal activities of the Company are to provide therapeutic skin beauty treatments and import and distribute
health and beauty products. The Company’s principal place of business is located at 302 Orchard Road, #14-02/03 &
#16-02, Tong Building, Singapore 238862
2. Signifi cant accounting policies
2.1 Basis of preparation
The fi nancial statements have been prepared in accordance with Singapore Financial Reporting Standards (“FRS”)
under the historical cost convention, except as disclosed in the accounting policies below.
The preparation of these fi nancial statements in conformity with FRS requires management to exercise its judgement
in the process of applying the Company’s accounting policies. It also requires the use of certain accounting estimates
and assumptions. There are no areas in the fi nancial statements which involve the application of signifi cant estimates
or judgement.
On 1 April 2012, the Company adopted the new or amended FRS and Interpretations to FRS (“INT FRS”) that are
mandatory for application from that date. Changes to the Company’s accounting policies have been made as required,
in accordance with the transitional provisions in the respective FRS and INT FRS.
The adoption of these new or amended FRS and INT FRS did not result in substantial changes to the Company’s
accounting policies and had no material effect on the amounts reported for the current or prior fi nancial years.
2.2 Revenue recognition
(a) Sale of goods
Sale of goods comprises the fair value of the consideration received or receivable for the sale of health and
beauty products in the ordinary course of the Company’s activities.
Sales are recognized when the Company has delivered the products to the customers, the customers have
accepted the products and the collectability of the related receivables is reasonably assured. Sales are presented,
net of goods and services tax and discounts.
(b) Rendering of services
Service income is recognized when services are rendered and accepted by customers.
Collections from service packages are deferred and recognised as revenue as and when the services due are
provided to customers. Unused service packages are included in the balance sheet as deferred income.
(c) Interest income
Interest income is recognized using the effective interest method.
2.3 Employee compensation
(a) Defi ned contribution plans
The Company’s contributions to defi ned contribution plans are recognised as employee compensation expense
when the contributions are due, unless they can be capitalized as an asset.

149
T H E D R X M E D I S PA P T E . LT D.
(b) Employee leave entitlement
Employee entitlements to annual leave are recognized when they accrue to employees. A provision is made for the estimated liability for annual leave as a result of services rendered by employees up to the balance sheet date.
2.4 Operating leases Payments
Payments made under operating leases (net of any incentives received from the lessors) are recognised in profi t or loss on a straight-line basis over the period of the lease.
2.5 Income taxes
Current income tax is recognised at the amount expected to be paid to or recovered from the tax authorities.
Deferred income tax is recognised for all temporary differences except when the deferred income tax arises from the initial recognition of an asset or liability that affects neither accounting nor taxable profi t or loss at the time of the transaction.
Current and deferred income tax is measured using the tax rates and tax laws that have been enacted or substantively enacted by the balance sheet date, and are recognised as income or expenses in profi t or loss, except to the extent that the tax arises from a transaction which is recognised directly in equity.
2.6 Inventories
Inventories are carried at the lower of cost and net realisable value. Cost is determined using the weighted average method. Net realisable value is the estimated selling price in the ordinary course of business, less the estimated costs necessary to make the sale.
2.7 Plant and equipment
Plant and equipment are recognised at cost less accumulated depreciation and accumulated impairment losses.
Subsequent expenditure relating to plant and equipment that has already been recognised is added to the carrying amount of the asset only when it is probable that future economic benefi ts associated with the item will fl ow to the Company and the cost of the item can be measured reliably.
Depreciation is calculated using the straight-line method to allocate depreciable amounts over their estimated useful lives. The estimated useful lives are as follows:
Useful lives
Computers 3 years Furnitureand fi ttings 3 years Offi ce equipment 3 years Renovations 3 years Medicalequipment 3 years
The residual values, estimated useful lives and depreciation method of plant and equipment are reviewed, and adjusted as appropriate, at each balance sheet date. The effects of any revision are recognised in profi t or loss when the changes arise.
2.8 Impairment of non-fi nancial assets
Plant and equipment
Plant and equipment are reviewed for impairment whenever there is any indication that these assets may be impaired.
For the purpose of impairment testing, the recoverable amount (i.e. the higher of the fair value less cost to sell and
NOTES TO THE FINANCIAL STATEMENTS For the year ended 31 March, 2013

150
T H E D R X M E D I S PA P T E . LT D.
the value-in-use) is determined on an individual asset basis unless the asset does not generate cash infl ows that are largely independent of those from other assets. If this is the case, the recoverable amount is determined for the CGU to which the asset belongs.
If the recoverable amount of the asset (or CGU) is estimated to be less than its carrying amount, the carrying amount of the asset (or CGU) is reduced to its recoverable amount.
The difference between the carrying amount and recoverable amount is recognized as an impairment loss in profi t or loss.
An impairment loss for an asset is reversed if, and only if, there has been a change in the estimates used to determine the asset’s recoverable amount since the last impairment loss was recognised. The carrying amount of this asset is increased to its revised recoverable amount, provided that this amount does not exceed the carrying amount that would have been determined (net of any accumulated amortisation or depreciation) had no impairment loss been recognised for the asset in prior years. A reversal of impairmentloss for an asset is recognisedin profi t or loss.
2.9 Loans and receivables Cash and cash equivalents Trade and other receivablesLoan to immediate holding corporation
Cash and cash equivalents, trade and other receivables and loan to immediate holding corporation are initially recognised at their fair values plus transaction costs and subsequently carried at amortised cost using the effective interest method, less accumulated impairment losses.
The Company assesses at each balance sheet date whether there is objective evidence that these fi nancial assets are impaired and recognises an allowance for impairment when such evidence exists. Signifi cant fi nancial diffi culties of the debtor, probability that the debtor will enter bankruptcy and default or signifi cant delay in payments are objective evidence that these fi nancial assets are impaired.
The carrying amount of these assets is reduced through the use of an impairment allowance account which is calculated as the difference between the carrying amount and the present value of estimated future cash fl ows, discounted at the original effective interest rate.
These assets are presented as current assets except for those that are expected to be realised later than 12 months after the balance sheet date, which are presented as non-current assets.
2.10 Trade and other payables
Trade and other payables represent unpaid liabilities for goods and services provided to the Company prior to the end of the fi nancial year. They are classifi ed as current liabilities if payment is due within one year or less (or in the normal operating cycle of the business, if longer). If not, they are presented as non current liabilities.
Trade and other payables are initially recognised at fair value, and subsequently carried at amortised cost using the effective interest method.
2.11 Cash and cash equivalents
For the purpose of presentation in the statement of cash fl ows, cash and cash equivalents include cash on hand and deposits with fi nancial institutions which are subject to an insignifi cant risk of change in value.
NOTES TO THE FINANCIAL STATEMENTS For the year ended 31 March, 2013

151
T H E D R X M E D I S PA P T E . LT D.
2.12 Dividends
Dividends to the Company’s shareholders are recognised when the dividends are approved for payment.
2.13 Currency translation
The fi nancial statements are presented in Singapore Dollars, which is the functional currency of the Company.
Transactions in a currency other than the Singapore Dollar (“foreign currency”) are translated into Singapore Dollars using the exchange rates at the dates of the transactions. Currency translation differences resulting from the settlement of such transactions and from the translation of monetary assets and liabilities denominated in foreign currencies at the closing rates at the balance sheet date are recognised in profi t or loss.
2.14 Share capital
Ordinary shares are classifi ed as equity.
3 Revenue
2013 2012 2013 2012$ $ Rs. Crore Rs. Crore
Rendering of services 5,858,000 5,280,000 25.63 20.16
Sales of goods 947,000 1,281,000 4.14 4.89
6,805,000 6,561,000 29.78 25.05
4 Other Income
2013 2012 2013 2012$ $ Rs. Crore Rs. Crore
Miscellaneous income 7,000 2,000 0.03 0.01
Gain on disposal of fi xed asset – 1,000 – –
7,000 3,000 0.03 0.01
5 Expenses by nature
2013 2012 2013 2012$ $ Rs. Crore Rs. Crore
Cost of inventories included in cost of sales
1,286,000 1,378,000 5.63 5.26
Depreciation of property, plant and equipment(Note 12)
201,000 166,000 0.88 0.63
Employee compensation (Note 6) 2,327,000 1,788,000 10.18 6.83
Advertising expense 14,000 16,000 0.06 0.06
Rental on operating leases 579,000 575,000 2.53 2.19
Audit fees 19,000 23,000 0.08 0.09
Royalty 341,000 328,000 1.49 1.25
Bank charges 177,000 160,000 0.77 0.61
Other expenses 226,000 220,000 0.99 0.84
Total cost of sales, distribution andmarketing costs and administrative expenses
5,170,000 4,654,000 22.62 17.77
NOTES TO THE FINANCIAL STATEMENTS For the year ended 31 March, 2013

152
T H E D R X M E D I S PA P T E . LT D.
6 Employee Compensation
2013 2012 2013 2012$ $ Rs. Crore Rs. Crore
Wages and salaries 2,077,000 1,592,000 9.09 6.08
Employer’s contribution to Central Provident Fund
175,000 146,000 0.77 0.56
Other benefi ts 75,000 50,000 0.33 0.19
2,327,000 1,788,000 10.18 6.83
7 Income Taxes
a Income tax expense
2013 2012 2013 2012$ $ Rs. Crore Rs. Crore
Tax expense attributable to profi t is made up of:
- Current income tax 267,000 307,000 1.17 1.17
267,000 307,000 1.17 1.17
Overprovision in prior fi nancial years:
- Current income tax (8,000) (66,000) (0.04) (0.25)
- Deferred income tax (Note 14) (8,000) – (0.04) –
251,000 241,000 1.10 0.92
The tax on profi t before tax differs from the theoretical amount that would arise using the Singapore standard rate of income tax as follows:
2013 2012 2013 2012$ $ Rs. Crore Rs. Crore
Profi t before tax 1,642,000 1,910,000 7.19 7.80
Tax calculated at tax rate of 17% (2012: 17%)
279,000 325,000 1.22 1.24
Effects of:
- statutory stepped income exemption (26,000) (26,000) (0.11) (0.10)
- expenses not deductible for tax purposes 26,000 28,000 0.11 0.11
- income not subject to tax (2,000) (20,000) (0.01) (0.08)
- tax incentives (10,000) – (0.04) –
Tax charge 267,000 307,000 1.17 1.17
NOTES TO THE FINANCIAL STATEMENTS For the year ended 31 March, 2013

153
T H E D R X M E D I S PA P T E . LT D.
b Movements in current income tax liabilities
2013 2012 2013 2012$ $ Rs. Crore Rs. Crore
Beginning of fi nancial year 211,000 187,000 0.92 0.76 Income tax paid (331,000) (217,000) (1.45) (0.89)
Tax expense 267,000 307,000 1.17 1.25
Overprovision in prior fi nancial years (8,000) (66,000) (0.04) (0.27)
End of fi nancial year 139,000 211,000 0.61 0.86
8 Cash and cash equivalents
2013 2012 2013 2012$ $ Rs. Crore Rs. Crore
Cash at bank and on hand 402,000 588,000 1.76 2.40
For the purpose of presenting the statement of cash fl ows, cash and cash equivalents comprise the following:
2013 2012 2013 2012$ $ Rs. Crore Rs. Crore
Cash and bank balances (as above) 402,000 588,000 1.76 2.40
Cash and cash equivalents per statement of cash fl ows 402,000 588,000 1.76 2.40
9 Trade and other Receivables
2013 2012 2013 2012$ $ Rs. Crore Rs. Crore
Trade receivables 64,000 55,000 0.28 0.22
Other receivables 79,000 125,000 0.35 0.51
143,000 180,000 0.63 0.73
10 Inventories
2013 2012 2013 2012$ $ Rs. Crore Rs. Crore
Finished goods 123,000 69,000 0.54 0.28
11 Loan to Immediate holding corporation
The loan to the immediate holding corporation is unsecured, interest free and repayable on demand.
NOTES TO THE FINANCIAL STATEMENTS For the year ended 31 March, 2013

154
T H E D R X M E D I S PA P T E . LT D.
12 Plant and equipment
Computers Furniture & fi ttings
Renovations Offi ce equipments
Medical equipments
Total
2013 $ $ $ $ $ $Cost Beginning of fi nancial year 19,000 60,000 706,000 68,000 1,024,000 1,877,000 Additions 1,000 5,000 30,000 2,000 81,000 119,000 Disposals – (1,000) – – (89,000) (90,000)Transfers – 8,000 – (8,000) – – End of fi nancial year 20,000 72,000 736,000 62,000 1,016,000 1,906,000
Accumulated depreciation
Beginning of fi nancial year 19,000 56,000 390,000 65,000 927,000 1,457,000 Depreciation charge (Note 5) 1,000 3,000 143,000 1,000 53,000 201,000 Disposals – (1,000) – – (89,000) (90,000)Transfers – 8,000 – (8,000) – – End of fi nancial year 20,000 66,000 533,000 58,000 891,000 1,568,000
Net book value
End of fi nancial year – 6,000 203,000 4,000 125,000 338,000
2012
Cost
Beginning of fi nancial year 19,000 55,000 299,000 80,000 926,000 1,379,000 Additions – 5,000 407,000 5,000 98,000 515,000 Disposals – – – (17,000) – (17,000)End of fi nancial year 19,000 60,000 706,000 68,000 1,024,000 1,877,000
Accumulated depreciation
Beginning of fi nancial year 19,000 55,000 288,000 80,000 866,000 1,308,000 Depreciation charge (Note 5) – 1,000 102,000 2,000 61,000 166,000 Disposals – – – (17,000) – (17,000)End of fi nancial year 19,000 56,000 390,000 65,000 927,000 1,457,000
Net book value
End of fi nancial year – 4,000 316,000 3,000 97,000 420,000
NOTES TO THE FINANCIAL STATEMENTS For the year ended 31 March, 2013

155
T H E D R X M E D I S PA P T E . LT D.
12 Plant and equipment(Contd.)
Computers Furniture & fi ttings
Renovations Offi ce equipments
Medical equipments
Total
2013 Rs. Crore Rs. Crore Rs. Crore Rs. Crore Rs. Crore Rs. Crore Cost Beginning of fi nancial year 0.08 0.26 3.09 0.30 4.48 8.21
Additions – 0.02 0.13 0.01 0.35 0.52
Disposals – – – – (0.39) (0.39)
Transfers – 0.04 – (0.04) – –
End of fi nancial year 0.08 0.32 3.22 0.27 4.44 8.34
Accumulated depreciation
Beginning of fi nancial year 0.08 0.25 1.71 0.28 4.06 6.38
Depreciation charge (Note 5) – 0.01 0.63 – 0.23 0.88
Disposals – – – – (0.39) (0.39)
Transfers – 0.04 – (0.04) – –
End of fi nancial year 0.08 0.30 2.34 0.24 3.90 6.87
Net book value
End of fi nancial year – 0.02 0.88 0.03 0.54 1.47
2012
Cost
Beginning of fi nancial year 0.08 0.22 1.22 0.33 3.78 5.63
Additions – 0.02 1.66 0.02 0.40 2.10
Disposals – – – (0.07) – (0.07)
End of fi nancial year 0.08 0.24 2.88 0.28 4.18 7.66
Accumulated depreciation
Beginning of fi nancial year 0.08 0.22 1.18 0.33 3.54 5.34
Depreciation charge (Note 5) – – 0.42 0.01 0.25 0.68
Disposals – – – (0.07) – (0.07)
End of fi nancial year 0.08 0.23 1.59 0.27 3.78 5.95
Net book value
End of fi nancial year – 0.02 1.29 0.01 0.40 1.71
NOTES TO THE FINANCIAL STATEMENTS For the year ended 31 March, 2013

156
T H E D R X M E D I S PA P T E . LT D.
13 Trade and other payables
2013 2012 2013 2012$ $ Rs. Crore Rs. Crore
Trade payables to:
- Non-related parties 7,000 – 0.03 –
- Immediate holding corporation 94,000 – 0.41 –
- Fellow subsidiaries 81,000 – 0.35 –
182,000 – 0.80 –
Accruals for operating expenses 295,000 189,000 1.29 0.77
477,000 189,000 2.09 0.77
14 Deferred income taxes
2013 2012 2013 2012$ $ Rs. Crore Rs. Crore
Beginning of fi nancial year 8,000 8,000 0.04 0.03
Tax credited to:
- profi t or loss (Note 7(a)) (8,000) – (0.04) –
End of fi nancial year – 8,000 – 0.03
Net deferred income tax liabilities to be settled from the balance sheet date as follows:
2013 2012 2013 2012
$ $ Rs. Crore Rs. CroreTo be settled within one year – – – –
To be settled after one year – 8,000 – 0.04
– 8,000 – 0.04
15 Share capital
The Company’s share capital comprises fully paid-up 100,000 (2012: 100,000) ordinary shares with no par value, amounting to a total of $100,000 (2012: $100,000)
16 Dividends
2013 2012 2013 2012$ $ Rs. Crore Rs. Crore
Ordinary dividends paid or proposed
First interim dividend paid in respect of current fi nancial year of S$nil (2012: S$2.50) per share
– 250,000 – 1.02
Second interim dividend paid in respect of current fi nancial year of S$nil (2012: S$5.00) per share
– 500,000 – 2.04
– 750,000 – 3.06
NOTES TO THE FINANCIAL STATEMENTS For the year ended 31 March, 2013

157
T H E D R X M E D I S PA P T E . LT D.
17. Commitments
Operating lease commitments - where the Company is a lessee
“The Company leases business premises under non-cancellable operating lease agreements. The leases have varying terms, escalation clauses and renewal rights. The future minimum lease payabies under non-cancellable operating leases contracted for at the balance sheet date but not recognised as liabilities, are as follows:”
2013 2012 2013 2012$ $ Rs. Crore Rs. Crore
Not later than one year 591,000 591,000 2.59 2.41
Between one and fi ve years 307,000 918,000 1.34 3.75
898,000 1,509,000 3.93 6.16
18. Financial risk management
The Company is exposed to fi nancial risks arising from its operations and the use of fi nancial instruments. The key fi nancial risks are credit risk, interest rate risk and liquidity risk. The management reviews and agrees on policies for managing each of these risks and they are summarised below:
(a) Credit risk
Credit risk is the potential risk of fi nancial loss resulting from the failure of customers or other counterparties to settle their fi nancial and contractual obligations to the company as and when they fall due.
The Company’s exposure to credit risk arises primarily from trade and other receivables (including amounts owing by related parties). For other fi nancial assets (including cash and cash equivalents), the Company minimises credit risk by dealing with high credit rating counterparties.
Management regularly monitors credit risk exposure to counterparties. Management believes that concentration of credit risk is limited due to ongoing credit evaluations on all counterparties and, where necessary, maintaining an allowance for doubtful receivables which will adequately provide for potential credit risks.
Financial assets that are neither past due nor impaired
Trade and other receivables that are neither past due nor impaired are creditworthy debtors with a good payment record with the Company. Cash and cash equivalents that are neither past due nor impaired are mainly deposits placed with reputable fi nancial institutions with high credit-ratings.
There are no fi nancial assets that are past due or impaired as at the balance sheet date.
(b) Foriegn exchange risk
The Company does not have signifi cant foreign currency transactions, thus, the net exposure is not expected to be signifi cant.
(c) Interest rate risk
Interest rate risk is the risk that the fair value or future cash fl ows of the Company’s fi nancial instruments will fl uctuate because of changes in market interest rates.
The Company does not have any interest-bearing fi nancial liabilities. Its only exposure to changes in interest rates relates to interest-earning bank deposits. The Company monitors movements in interest rates to ensure deposits are placed with fi nancial institutions offering optimal rates of return.
NOTES TO THE FINANCIAL STATEMENTS For the year ended 31 March, 2013

158
T H E D R X M E D I S PA P T E . LT D.
(d) Liquidity risk
Liquidity risk is the risk that the Company will encounter diffi culty in meeting fi nancial obligations due to shortage of funds.
The Company monitors its liquidity risk by maintaining a level of cash and cash equivalents deemed adequate to fi nance the Company’s operations and to mitigate the effects of fl uctuations in cash fl ows.
All fi nancial liabilities of the Company are repayable on demand or mature within one year.
(e) Capital risk
The Company’s objectives when managing capital are to ensure that the Company is adequately capitalised and to maintain an optimal capital structure by issuing or redeeming additional equity and debt instruments when necessary.
The Company is not subject to externally imposed capital requirements. There were no changes to the Company’s approach to capital management during the period.
(f) Fair value measurements
The carrying amounts of cash and cash equivalents, receivables and payables approximate their fair values due to their short term nature.
(g) Financial instruments by category
The aggregate carrying amounts of loans and recievables and fi nancial liabilities at amortised cost are as follows:
2013 2012 2013 2012$ $ Rs. Crore Rs. Crore
Loans & Receivables 5,246,000 22.96 2,846,000 11.62
Financials liabilities at amortised cost 477,000 2.09 189,000 0.02
19. Immediate and ultimate holding corporation
The Company’s immediate holding corporation is Derma-Rx International Aesthetics Pte Ltd, incorporated in Singapore. The ultimate and intermediate holding corporation are Marico Limited and Kaya Limited respectively, both incorporated in India.
20 Related Party Transaction
In addition to the information disclosed elsewhere in the fi nancial statements, the following transactions took place between the Company and related parties at terms agreed between the parties:
(a) Sales & purchase of goods and services
2013 2012 2013 2012
$ $ Rs. Crore Rs. Crore(i) With immediate holding company
Royalty paid 341,000 328,000 1.49 1.25
Purchases 747,000 456,000 3.27 1.74
Management fee 96,000 96,000 0.42 0.37
(ii) With fellow subsidiaries
Sales 8,000 35,000 0.04 0.13
Purchases 419,000 882,000 1.83 3.37
Rental expenses 314,000 314,000 1.37 1.20
Consultation fee 132,000 132,000 0.58 0.50
Utilities 12,000 12,000 0.05 0.05
NOTES TO THE FINANCIAL STATEMENTS For the year ended 31 March, 2013

159
T H E D R X M E D I S PA P T E . LT D.
(b) Key management personnel compensation
Employee benefi ts expense includes key management personnel compensation as follows:
2013 2012 2013 2012$ $ Rs. Crore Rs. Crore
Short tem employee benefi ts
- Director’s remuneration 33,000 36,000 0.14 0.14
- Other key management personnel 143,000 136,000 0.63 0.52
176,000 172,000 0.77 0.66
21. New and revised accounting standards and interpretations
Certain new accounting standards, amendments and interpretations to existing standards have been published and are mandatory for the Company’s accounting periods beginning on or after 1 January 2013 or later periods and which the Company has not early adopted.
• Annual Improvements 2011 (effective for annual periods beginning on or after 1 January 2013). These annual improvements address six issues in the 2009 to 2011 reporting cycle. It includes changes to FRS 101 First time adoption, FRS 1 Presentation of Financial Statements, FRS 16 Property, plant and equipment, FRS 32 Financial Statements: Presentation and FRS 34 Interim Financial Reporting.
The management anticipates that the adoption of the above FRSs in the future periods will not have a material impact on the fi nancial statements of the Company in the period of their initial adoption.
22. Authorisation of fi nancial statements
These fi nancial statements were authorised for issue in accordance with a resolution of the Board of Directors of The DRx Medispa Pte Ltd on 14th June 2013
NOTES TO THE FINANCIAL STATEMENTS For the year ended 31 March, 2013

160
DRX INVESTMENT PTE. LTD(INCORPORATED IN THE REPUBLIC OF SINGAPORE)
Board of Directors Vijay S. Subramaniam
Dharmendra B Jain
FRANK THONG MUN LOONG
Naveen Duggal
Registered Offi ce 213, Henderson Road #01-08 Henderson Industrial Park Singapore 159553
Auditors Pricewaterhouse Coopers
Bankers UOB Bank

161
DRX INVESTMENT PTE. LTD(INCORPORATED IN THE REPUBLIC OF SINGAPORE)
DIRECTORS’ REPORTfor the fi nancial year ended 31 March 2013.
The directors present their report to the shareholder together with the audited fi nancial statements for the fi nancial year ended 31 March 2013.
Directors
The directors in offi ce at the date of this report are as follows:
Vijay S. Subramaniam (appointed on 1 May 2013)
Dharmendra B. Jain (appointed on 1 May 2013)
Frank Thong Mun Loong (appointed on 1 May 2013)
Naveen Duggal
Arrangements to enable directors to acquire shares and debentures
Neither at the end of nor at any time during the fi nancial year was the Company a party to any arrangement whose object was to enable the directors of the Company to acquire benefi ts by means of the acquisition of shares in, or debentures of, the Company or any other body corporate.
Directors' interests in shares or debentures
According to the register of directors' shareholdings, none of the directors holding offi ce at the end of the fi nancial year had any interest in the shares or debentures of the Company or its related corporations.
Directors' contractual benefi ts
Since the end of the previous fi nancial year, no director has received or become entitled to receive a benefi t by reason of a contract made by the Company or a related corporation with the director or with a fi rm of which he is a member or with a company in which he has a substantial fi nancial interest, except as disclosed in the accompanying fi nancial statements and in this report, and except that certain directors receive remuneration as a result of their employment with related corporations.
Share options
No options were granted during the fi nancial year to subscribe for unissued shares of the
Company.
No shares were issued during the fi nancial year by virtue of the exercise of options to take up unissued shares of the Company.
There were no unissued shares of the Company under option at the end of the fi nancial year.
Independent auditor
The independent auditor, PricewaterhouseCoopers LLP, has expressed its willingness to accept re-appointment.
In the opinion of the directors,
(a) the fi nancial statements as set out on pages 5 to 16 are drawn up so as to give a true and fair view of the state of affairs of the Company as at 31 March 2013 and of the results of the business, changes in equity and cash fl ows of the Company for the fi nancial year then ended; and
(b) at the date of this statement, with the continuing fi nancial support from its intermediate holding corporation, there are reasonable grounds to believe that the Company will be able to pay its debts as and when they fall due.
On behalf of the directors
Frank Thong Mun Loong Naveen Duggal Director Director
14th June 2013

162
DRX INVESTMENT PTE. LTD(INCORPORATED IN THE REPUBLIC OF SINGAPORE)
In the opinion of the directors,
(a) the fi nancial statements as set out on pages 5 to 16 are drawn up so as to give a true and fair view of the state of affairs of the Company as at 31 March 2013 and of the results of the business, changes in equity and cash fl ows of the Company for the fi nancial year then ended; and
(b) at the date of this statement, with the continuing fi nancial support from its intermediate holding corporation, there are reasonable grounds to believe that the Company will be able to pay its debts as and when they fall due.
On behalf of the directors
Frank Thong Mun Loong Naveen Duggal Director Director
14th June 2013
STATEMENT OF DIRECTORSFor the fi nancial year ended 31st March 2013
163
DRX INVESTMENT PTE. LTD(INCORPORATED IN THE REPUBLIC OF SINGAPORE)
INDEPENDENT AUDITORS’ REPORT TO THE SHAREHOLDER OF DRX
INVESTMENTS PTE LTD Report on the Financial Statements
We have audited the accompanying fi nancial statements of DRx Investments Pte Ltd set out on pages 5 to 16, which comprise the balance sheet as at 31 March 2013, the statement of comprehensive income, the statement of changes in equity and the statement of cash fl ows for the year then ended, and a summary of signifi cant accounting policies and other explanatory information.
Management's Responsibility for the Financial Statements
Management is responsible for the preparation of fi nancial statements that give a true and fair view in accordance with the provisions of the Singapore Companies Act (the "Act") and Singapore Financial Reporting Standards, and for devising and maintaining a system of internal accounting controls suffi cient to provide a reasonable assurance that assets are safeguarded against loss from unauthorised use or disposition; and transactions are properly authorised and that they are recorded as necessary to permit the preparation of true and fair profi t and loss accounts and balance sheets and to maintain accountability of assets.
Auditor's Responsibility
Our responsibility is to express an opinion on these fi nancial statements based on our audit. We conducted our audit in accordance with Singapore Standards on Auditing. Those standards require that we comply with ethical requirements and plan and perform the audit to obtain reasonable assurance about whether the fi nancial statements are free from material misstatement.
An audit involves performing procedures to obtain audit evidence about the amounts and disclosures in the fi nancial statements. The procedures selected depend on the auditor's judgement, including the assessment of the risks of material misstatement of the fi nancial statements, whether due to fraud or error. In making those risk assessments, the auditor considers internal control relevant to the entity's preparation of fi nancial statements that give a true and fair view in order to design audit procedures that are appropriate in the circumstances, but not for the purpose of expressing an opinion on the effectiveness of the entity's internal control. An audit also includes evaluating the appropriateness of accounting policies used and the reasonableness of accounting estimates made by management, as well as evaluating the overall presentation of the fi nancial statements.
We believe that the audit evidence we have obtained is suffi cient and appropriate to provide a basis for our audit opinion.
Opinion
In our opinion, the fi nancial statements of the Company are properly drawn up in accordance with the provisions of the Act and Singapore Financial Reporting Standards so as to give a true and fair view of the state of affairs of the Company as at 31 March 2013, and of the results, changes in equity and cash fl ows of the Company for the fi nancial year ended on that date.
Report on Other Legal and Regulatory Requirements
In our opinion, the accounting and other records required by the Act to be kept by the Company have been properly kept in accordance with the provisions of the Act.
PricewaterhouseCoopers LLP Public Accountants and Certifi ed Public Accountants Singapore, 14th June 2013

164
DRX INVESTMENT PTE. LTD(INCORPORATED IN THE REPUBLIC OF SINGAPORE)
STATEMENT OF COMPREHENSIVE INCOMEFor the fi nancial year ended 31st March 2013
Note 2013 2012 2013 2012
$ $ Rs.Crore Rs.Crore
Expenses
- Administrative 3 (12,000) (15,000) (0.05) (0.06)
Loss before income tax (12,000) (15,000) (0.05) (0.06)
Income tax expense 4 – – – –
Loss after tax and total comprehensive loss (12,000) (15,000) (0.05) (0.06)
The accompanying notes form an integral part of these fi nancial statements.
Note: The exchange rate used to convert SGD to Rs. <43.764> /(Previous year SGD to Rs.<40.829>).

165
DRX INVESTMENT PTE. LTD(INCORPORATED IN THE REPUBLIC OF SINGAPORE)
BALANCE SHEET AS AT SHEET as at 31st March 2013
Note 2013 2012 2013 2012
$ $ Rs.Crore Rs.Crore
ASSETSCurrent assetsCash and cash equivalents 5 12,000 17,000 0.05 0.07
Amount owing by a subsidiary 7 – – – –
12,000 17,000 0.05 0.07
Non current assets
Investment in subsidiary 6 – – – –
Total assets 12,000 17,000 0.05 0.07
LIABILITIES
Current liabilities
Other payables 8 12,000 10,000 0.05 0.04
Borrowings from a fellow subsidiary 9 23,000 18,000 0.10 0.07
Total liabilities 35,000 28,000 0.15 0.11
35,000 28,000 0.15 0.11
NET LIABILITIES (23,000) (11,000) (0.10) (0.04)
EQUITY
Share capital 10 748,000 748,000 3.27 3.05
Retained profi ts (771,000) (759,000) (3.37) (3.10)
Total equity (23,000) (11,000) (0.10) (0.04)
The accompanying notes form an integral part of these fi nancial statements.
Note: The exchange rate used to convert SGD to Rs. <43.764> /(Previous year SGD to Rs.<40.829>).

166
DRX INVESTMENT PTE. LTD(INCORPORATED IN THE REPUBLIC OF SINGAPORE)
STATEMENT OF CHANGES IN EQUITY as at 31st March 2013
Note Share capital
Retained profi ts
Total equity
Share capital
Retained profi ts
Total equity
$ $ $ Rs.Crore Rs.Crore Rs.Crore2013
Beginning of fi nancial year 748,000 (759,000) (11,000) 3.27 (3.32) (0.05)
Total comprehensive loss – (12,000) (12,000) – (0.05) (0.05)
End of fi nancial year 748,000 (771,000) (23,000) 3.27 (3.37) (0.10)2012
Beginning of fi nancial year 748,000 (744,000) 4,000 3.05 (3.04) 0.02
Total comprehensive loss – (15,000) (15,000) – (0.06) (0.06)
End of fi nancial year 748,000 (759,000) (11,000) 3.05 (3.10) (0.04)
The accompanying notes form an integral part of these fi nancial statements.
Note: The exchange rate used to convert SGD to Rs. <43.764> /(Previous year SGD to Rs.<40.829>).

167
DRX INVESTMENT PTE. LTD(INCORPORATED IN THE REPUBLIC OF SINGAPORE)
CASH FLOW STATEMENTFor the fi nancial year ended 31st March 2013
Note 2013 2012 2013 2012
$ $ Rs.Crore Rs.Crore
Cash fl ows from operating activitiesLoss after tax (12,000) (15,000) (0.05) (0.06)
Change in working capital:
- Trade and other payables 2,000 7,000 0.01 0.03
Cash generated from operations (10,000) (8,000) (0.04) (0.03)
Net cash used in operating activities (10,000) (8,000) (0.04) (0.03)
Cash fl ows from fi nancing activitiesProceeds from borrowings from related corporation 5,000 15,000 0.02 0.06
Capitalisation of loan from holding company – – –
Net cash provided by/(used in) fi nancing activities 5,000 15,000 0.02 0.06
Net increase/(decrease) in cash and cash equivalents (5,000) 7,000 (0.02) 0.03
Cash and cash equivalents at beginning of fi nancial year 5 17,000 10,000 0.07 0.04
Cash and cash equivalents at end of fi nancial year 5 12,000 17,000 0.05 0.07
The accompanying notes form an integral part of these fi nancial statements.
Note: The exchange rate used to convert SGD to Rs. <43.764> /(Previous year SGD to Rs.<40.829>).

168
DRX INVESTMENT PTE. LTD(INCORPORATED IN THE REPUBLIC OF SINGAPORE)
NOTES TO THE FINANCIAL STATEMENTSFor the year ended 31 March, 2013
These notes form an integral part of and should be read in conjunction with the accompanying fi nancial statements.
1. General Information
The Company is incorporated and domiciled in Singapore. The address of its registered offi ce is 213 Henderson Road, #01-08 Henderson Industrial Park, Singapore 159553.
The Company is an investment holding company of DRx Aesthetics Sdn. Bhd. incorporated in Malaysia.
As at 31 March 2013, the Company is in capital defi cit. The fi nancial statements have been prepared on a going concern basis due to the fi nancial support from its intermediate holding corporation.
2. Signifi cant accounting poncles
2.1 Basis of preparation
The fi nancial statements have been prepared in accordance with Singapore Financial Reporting Standards ("FRS"). The fi nancial statements have been prepared under the historical cost convention, except as disclosed in the accounting policies below.
These fi nancial statements are separate fi nancial statements under FRS 27 Consolidated and Separate Financial Statements. As provided under FRS 27 the Company has elected not to prepare consolidated fi nancial statements as it is a wholly-owned subsidiary of Marico Limited, which produces consolidated fi nancial statements for public use. The registered offi ce of Marico Limited is located at Rang Sharda Krishmachandra Marg, Bandra Reclamation, Branda (West), Mumbai 400050 India.
The preparation of these fi nancial statements in conformity with FRS requires management to exercise its judgement in the process of applying the Company's accounting policies. It also requires the use of certain accounting estimates and assumptions. There are no areas of the fi nancial statements which involve the application of signifi cant estimates or judgement.
Interpretations and amendments to published standards effective in 2012
On 1 April 2012, the Company adopted the new or amended FRS and Interpretations to FRS ("INT FRS") that are mandatory for application from that date. Changes to the Company's accounting policies have been made as required, in accordance with the transitional provisions in the respective FRS and INT FRS.
The adoption of these new or amended FRS and INT FRS did not result in substantial changes to the Company's accounting policies and had no material effect on the amounts reported for the current or prior fi nancial years.
2.2 Income taxes
Current income tax is recognised at the amount expected to be paid to or recovered from the tax authorities.
Deferred income tax is recognised for all temporary differences except when the deferred income tax arises from the initial recognition of an asset or liability that affects neither accounting nor taxable profi t or loss at the time of the transaction.
Current and deferred income tax is measured using the tax rates and tax laws that have been enacted or substantively enacted by the balance sheet date, and are recognised as income or expenses in profi t or loss, except to the extent that the tax arises from a transaction which is recognised directly in equity.
2.3 Loans and receivables Cash and cash equivalents Amount owing by a subsidiary
Cash and cash equivalents, and amount owing by a subsidiary are initially recognised at their fair values plus transaction costs and subsequently carried at amortised cost using the effective interest method, less accumulated impairment losses.

169
DRX INVESTMENT PTE. LTD(INCORPORATED IN THE REPUBLIC OF SINGAPORE)
NOTES TO THE FINANCIAL STATEMENTSFor the year ended 31 March, 2013
The Company assesses at each balance sheet date whether there is objective evidence that these fi nancial assets are impaired and recognises an allowance for impairment when such evidence exists. Signifi cant fi nancial diffi culties of the debtor, probability that the debtor will enter bankruptcy and default or signifi cant delay in payments are objective evidence that these fi nancial assets are impaired.
The carrying amount of these assets is reduced through the use of an impairment allowance account which is calculated as the difference between the carrying amount and the present value of estimated future cash fl ows, discounted at the original effective interest rate.
These assets are presented as current assets except for those that are expected to be realised later than 12 months after the balance sheet date, which are presented as non-current assets.
2.4 Cash and cash equivalents
For the purpose of presentation in the statement of cash fl ows, cash and cash equivalents include cash on hand and deposits with fi nancial institutions which are subject to an insignifi cant risk of change in value.
2.5 Investment in subsidiary
Investment in subsidiary is stated at cost less accumulated impairment losses in the balance sheet. On disposal of investment in subsidiary, the difference between net disposal proceeds and the carrying amount of the investment is recognised in profi t or loss.
2.6 Impairment of non-fi nancial assets
Investment in subsidiary is reviewed for impairment whenever there is any indication that this asset may be impaired.
If the recoverable amount of the asset is estimated to be less than its carrying amount, the carrying amount of the asset is reduced to its recoverable amount. The difference between the carrying amount and recoverable amount is recognised as an impairment loss in profi t or loss.
An impairment loss for an asset is reversed if, and only if, there has been a change in the estimates used to determine the asset's recoverable amount since the last impairment loss was recognised. The carrying amount of this asset is increased to its revised recoverable amount, provided that this amount does not exceed the carrying amount that would have been determined (net of accumulated depreciation) had no impairment loss been recognised for the asset in prior years. A reversal of impairment loss for an asset is recognised in profi t or loss.
2.7 Other payables
Other payables represent unpaid liabilities for goods and services provided to the Company prior to the end of fi nancial year. They are classifi ed as current liabilities if payment is due within one year or less (or in the normal operating cycle of the business, If longer) If not, they are presented as non-current liabilities.
Other payables are initially recognised at fair value, and subsequently carried at amortised cost using the effective interest method.
2.8 Share capital
Ordinary shares are classifi ed as equity,
3 Expenses by nature
2013 2012 2013 2012
$ $ Rs.Crore Rs.Crore
Audit fees 10000 14000 0.04 0.05
Other expenses 2000 1000 0.01 –
Total 12000 15000 0.05 0.06

170
DRX INVESTMENT PTE. LTD(INCORPORATED IN THE REPUBLIC OF SINGAPORE)
NOTES TO THE FINANCIAL STATEMENTSFor the year ended 31 March, 2013
4 Income Taxes
Income tax expense
The tax on loss before tax differs from the theoretical amount that would arise using the Singapore standard rate of income tax as follows:
2013 2012 2013 2012
$ $ Rs.Crore Rs.Crore
Loss for the period (12,000) (15,000) (0.05) (0.06)
Tax calculated at tax rate of 17% (2012: 17%)
(2,000) (3,000) (0.01) (0.01)
Effects of:
- expenses not deductible for tax purposes
2,000 3,000 0.01 0.01
Tax charge – – – –
5 Cash and cash equivalents
2013 2012 2013 2012
$ $ Rs.Crore Rs.Crore
Cash at bank and on hand 12,000 17,000 0.05 0.07
12,000 17,000 0.05 0.07
For the purpose of presenting the statement of cash fl ows, cash and cash equivalents comprise the following:
2013 2012 2013 2012
$ $ Rs.Crore Rs.Crore
Cash and bank deposits (as above) 12,000 17,000 0.05 0.07
Cash and cash equivalents per statement of cash fl ows
12,000 17,000 0.05 0.07
6 Investments in subsidiary
2013 2012 2013 2012
$ $ Rs.Crore Rs.Crore
Equity investments at cost
Beginning of fi nancial year 65,000 65,000 0.28 0.27
Less: Allowance for impairment (65,000) (65,000) (0.28) (0.27)
– – – –

171
DRX INVESTMENT PTE. LTD(INCORPORATED IN THE REPUBLIC OF SINGAPORE)
NOTES TO THE FINANCIAL STATEMENTSFor the year ended 31 March, 2013
At the balance sheet date, the details of the subsidiary are as follows:
Name of Companies Principle Activities
Country of Business
Incorporation
Equity Holding
2013%
2012%
DRx Aesthetics Sdn Bhd "Maintain private medical practiceand medical laboratoryservice and consultation "
Malaysia 100 100
7 Amount owing by a subsidiary
2013 2012 2013 2012
$ $ Rs.Crore Rs.Crore
Amount owing by a subsidiary – non-trade 634,000 634,000 2.77 2.59
Less: Allowance for doubtful debts (634,000) (634,000) (2.77) (2.59)– – – –
The amount owing by subsidiary is unsecured, interest-free and is repayable on demand.
8 Other Payables
2013 2012 2013 2012
$ $ Rs.Crore Rs.Crore
Accruals for operating expenses 12,000 10,000 0.05 0.04
12,000 10,000 0.05 0.04
9. Borrowings from a fellow subsidiary
Amount owing to a fellow subsidiary is unsecured, interest free and repayable on demand.
10. Share capital
The Company’s share capital comprises fully paid-up 748,343 (2012: 748,343) ordinary shares with no par value, amounting to a total of $748,343 (2012: $748,343)
11. Financial risk management
Financial risk factors
The Company is exposed to fi nancial risks arising from its operations. The key fi nancial risks are credit risk, interest rate risk and liquidity risk. The management reviews and agrees on policies for managing each of these risks and they are summarised below:
(a) Credit risk
Credit risk is the potential risk of fi nancial loss resulting from the failure of other counterparties to settle their fi nancial and contractual obligations to the company as and when they fall due.

172
DRX INVESTMENT PTE. LTD(INCORPORATED IN THE REPUBLIC OF SINGAPORE)
NOTES TO THE FINANCIAL STATEMENTSFor the year ended 31 March, 2013
The Company’s exposure to credit risk arises primarily from cash and cash equivalents. The Company minimises credit risk by dealing with high credit rating counterparties.
(i) Financial assets that are neither past due nor impaired
Cash and cash equivalents that are neither past due nor impaired are mainly deposits placed with reputable fi nancial institutions with high credit-ratings.
There are no fi nancial assets that are past due or impaired as at the balance sheet date.
(ii) Financial assets that are past due and impaired
There is no other class of fi nancial assets that is past due and impaired except for amount owing by a subsidiary.
The amount owing by subsidiary determined to be impaired is as follows:
2013 2012 2013 2012
$ $ Rs.Crore Rs.Crore
Gross Amount 634,000 634,000 2.77 2.59
Less: Allowance for
Impariment (634,000) (634,000) (2.77) (2.59)
b) Liquidity risk
Liquidity risk is the risk that the company will encounter diffi culty in meeting fi nancial obligations due to shortage of funds.
The company monitors its liquidity risk and maintains a level of cash and cash equivalents deemed adequate to fi nance the company’s operations and to mitigate the effects of fl uctuations in cash fl ows.
All fi nancial liabilities of the company will mature within one year or are repayable on demand.
(c) Capital risk
The Company’s objectives when managing capital are to ensure that the Company is adequately capitalised and to maintain an optimal capital structure by issuing or redeeming additional equity when necessary.
(d) Fair value measurements
The carrying amounts of cash and cash equivalents approximate their fair values due to their short term nature.
(e) Financial instruments by category
The aggregate carrying amounts of loans and receivables and fi nancial liabilities at amortised cost are as follows:
2013 2012 2013 2012
$ $ Rs.Crore Rs.Crore
Loans & Receivables 12,000 17,000 0.05 0.07
Financials liabilities at
amortised cost 35,000 28,000 0.15 0.11
12. Immediate and ultimate holding corporation
The Company’s immediate holding corporation is Derma-Rx International Aesthetics Pte Ltd, incorporated in Singapore. The ultimate and intermediate holding corporation are Marico Limited and Kaya Limited respectively, both incorporated in India.

173
DRX INVESTMENT PTE. LTD(INCORPORATED IN THE REPUBLIC OF SINGAPORE)
13. New or revised accounting standards and interpretations
Certain new accounting standards, amendments and interpretations to existing standards have been published and are mandatory for the Company’s accounting periods beginning on or after 1 January 2013 or later periods and which the Company has not early adopted.
• Annual Improvements 2011 (effective for annual periods beginning on or after 1 January 2013). These annual improvements address six issues in the 2009 to 2011 reporting cycle. It includes changes to FRS 101 First time adoption, FRS 1 Presentation of Financial Statements, FRS 16 Property, plant and equipment, FRS 32 Financial Statements: Presentation and FRS 34 Interim Financial Reporting.
The management anticipates that the adoption of the above FRSs in the future periods will not have a material impact on the fi nancial statements of the Company in the period of their initial adoption.
14. Authorisation of fi nancial statements
These fi nancial statements were authorised for issue in accordance with a resolution of the Board of Directors of DRx Investment Pte Ltd on 14th June 2013.
NOTES TO THE FINANCIAL STATEMENTSFor the year ended 31 March, 2013

174
DRX AESTHETICS SDN. BHD.(INCORPORATED IN MALAYSIA)
Board of Directors Frank Thong Mun Loong
Naveen Duggal
Dr. Tan Siak Khim
Janifer Yeo-Tan
Chin Chee Kee
Poh Shiow Mei
Registered Offi ce 339 Mezzanine Floor, Jalan Tuanka Abdul Rehman 50100 Kuala Lumpur, Malaysia
Factory N-1 -1 Plaza Damas, 60 Jalan Sri Hartamas 1, Sri Hartamas, 50480 Kuala Lumpur Malaysia
Auditors Sundar & Associates Chartered Accountants
Bankers Public Bank Berhad

175
DRX AESTHETICS SDN. BHD.(INCORPORATED IN MALAYSIA)
The directors have pleasure in submitting their report and the audited fi nancial statements for the fi nancial year ended 31 March 2013.
Principal activity
The principal activities of the Company are managing private medical practice and medical laboratory service and consultation as well as dealing in all kinds of medical and its related products. There has been no signifi cant change in the nature of these activities during the year.
Financial results
RM Rs. Crore
Profi t after taxation 51,177/- 0.09
Reserves and provisions
There were no material transfers to or from reserves or provisions during the fi nancial year.
Issue of shares and debentures
The Company has not issued any shares or debentures during the fi nancial year.
Directorate
The directors in offi ce since the date of last report are:DR. TAN SIAK KHIMJANIFER YEO-TAN
CHIN CHEE KEE
POH SHIOW MEI
AJAY PAHWA (Resigned w.e.f. 30.04.2013)
NAVEEN DUGGAL
FRANK THONG MUN LOONG (Apptd w.e.f 01.05.2013)
Particulars of interest in shares of the Company by the directors who held offi ce at the end of the fi nancial period are as follows:
Ordinary shares of RM1/- eachAs at 01/04/2012 Bought Sold As at 31/03/2013
DR. TAN SIAK KHIM _ _ _ _
JANIFER YEO -TAN _ _ _ _
POH SHIOW MEI _ _ _ _
AJAY PAHWA _ _ _ _
NAVEEN DUGGAL _ _ _ _
CHIN CHEE KEE _ _ _ _
Directors’ benefi ts
Neither at the end of the fi nancial year, nor at any time during this year, did there subsist any arrangement to which the Company or any of its related corporations was a party, whereby the directors might acquire benefi ts by means of the acquisition of shares in, or debentures of, the Company or any other body corporate.
Since the end of the previous fi nancial year, no director has received of become entitled to receive a benefi t by reason of a contract made by the Company or a related corporation with the director or with a fi rm of which he is a member, or with a Company in which he has a substantial fi nancial interest.
DIRECTORS’ REPORT

176
DRX AESTHETICS SDN. BHD.(INCORPORATED IN MALAYSIA)
Other statutory information
(a) Before the income statement and balance sheet were made out, the directors took reasonable steps :-
(i) to ascertain that action had been taken in relation to the writing off of bad debts and the making of provision for doubtful debts and satisfi ed themselves that all known bad debts have been written off and that adequate provision has been made for doubtful debts.
(ii) to ensure that any current assets which were unlikely to be realised in the ordinary course of business including their value as shown in the accounting records of the Company have been written down to an amount which they might be expected so to realise.
(b) At the date of this report, the directors are not aware of any circumstances :
(i) which would render the amount written off or provided for bad and doubtful debts of the Company inadequate to any substantial extent.
(ii) which would render the values attributed to current assets in the fi nancial statements of the Company misleading, or
(iii) which have arisen which render adherence to the existing method of valuation of assets or liabilities of the Company misleading or inappropriate.
(c) At the date of this report, there does not exist:
(i) any charge on the assets of the Company which has arisen since the end of the fi nancial year which secures the liabilities of any other person.
(ii) any contingent liability of the Company which has arisen since the end of the fi nancial period.
(d) No contingent or other liability has become enforceable or is likely to become enforceable within the period of twelve months after the end of the fi nancial year which, in the opinion of the directors, will or may substantially affect the ability of the Company to meet its obligations as and when they fall due.
(e) At the date of this report, the directors are not aware of any circumstances not otherwise dealt with in this report or the fi nancial statements which would render any amount stated in the fi nancial statements misleading.
(f) In the opinion of the directors,
(i) the results of the Company’s operations during the fi nancial year were not substantially affected by any item, transaction or event of a material and unusual nature;
(ii) there has not arisen in the interval between the end of the fi nancial year and the date of this report any item, transaction or event of a material and unusual nature likely to affect substantially the results of the operations of the Company for the current fi nancial period.
Ultimate holding company
The directors regard Marico Limited, a company incorporated in India as the ultimate holding company of the Company.
Auditors
Messrs. Sundar & Associates have expressed their willingness to continue in offi ce.
Signed on behalf of the Board of Directors in accordance with a resolution of the Directors dated 23rd May 2013
NAVEEN DUGGAL Director
FRANK THONG MUN LOONG Director
DIRECTORS’ REPORT (Contd.)

177
DRX AESTHETICS SDN. BHD.(INCORPORATED IN MALAYSIA)
STATEMENT BY DIRECTORS’ Pursuant to Section 169 (15) of the Companies Act, 1965
We, Frank Thong Mun Loong and Naveen Duggal, being two of the directors of DRX AESTHETICS SDN. BHD., do hereby state that, in the opinion of the directors, the accompanying balance sheet and statements of income, cash fl ows and changes in equity are drawn up in accordance with MASB approved accounting standards for private entities and the provisions of the Companies Act, 1965 so as to give a true and fair view of the state of affairs of the Company as at 31 March 2013 and of the results and the cash fl ows of the Company for the year then ended.
Signed on behalf of the Board of Directors in accordance
with a resolution of the Directors dated 23rd May 2013
NAVEEN DUGGAL Director
FRANK THONG MUN LOONG Director

178
DRX AESTHETICS SDN. BHD.(INCORPORATED IN MALAYSIA)
STATUTORY DECLARATION I, Naveen Duggal, being the director primarily responsible for the accounting records and fi nancial management of
DRX AESTHETICS SDN. BHD., do solemnly and sincerely declare that the accompanying balance sheet and statements
of income, cash fl ows and changes in equity are to the best of my knowledge and belief correct and I make this solemn
declaration conscientiously believing the same to be true, and by virtue of the provisions of the Statutory Declarations
Act, 1960.
Subscribed and solemnly declared by )
the abovenamed at Petaling Jaya in )
the Selangor Darul Ehsan this 23rd May 2013 )
NAVEEN DUGGAL Before me,
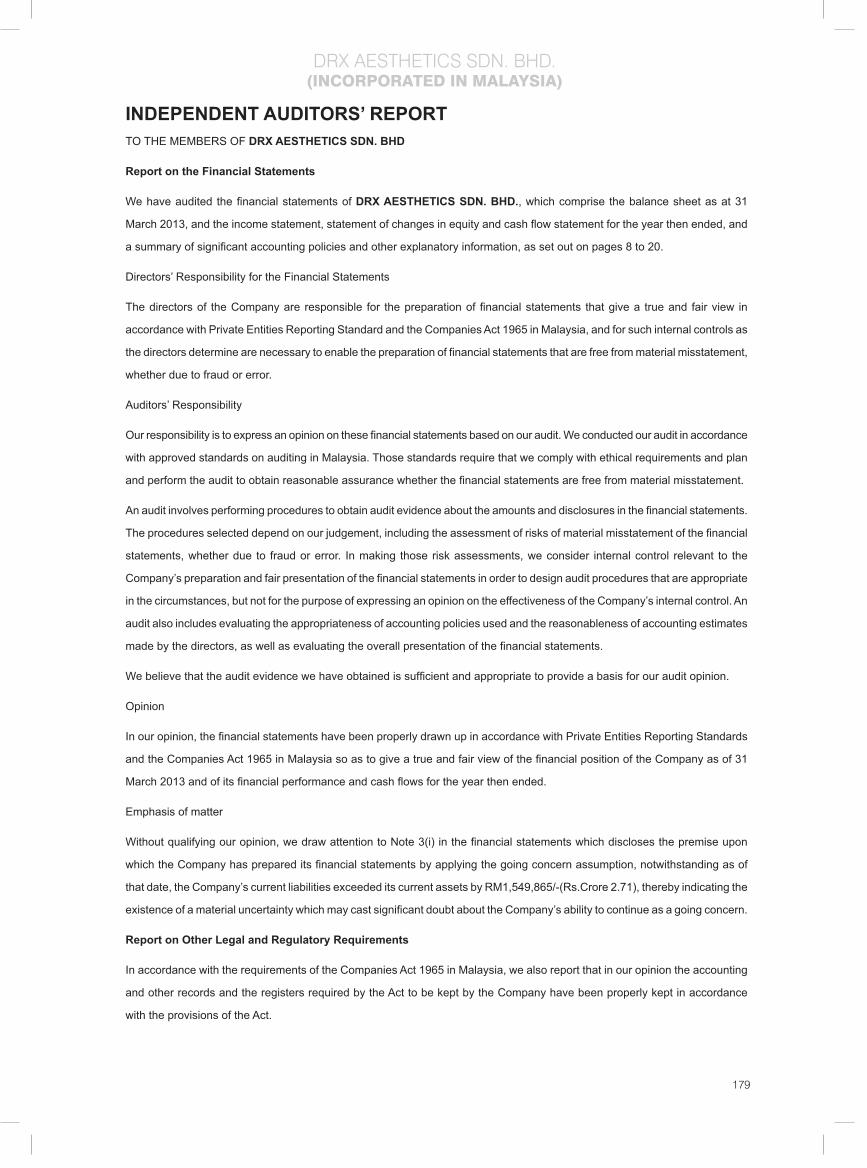
179
DRX AESTHETICS SDN. BHD.(INCORPORATED IN MALAYSIA)
INDEPENDENT AUDITORS’ REPORT TO THE MEMBERS OF DRX AESTHETICS SDN. BHD
Report on the Financial Statements
We have audited the fi nancial statements of DRX AESTHETICS SDN. BHD., which comprise the balance sheet as at 31
March 2013, and the income statement, statement of changes in equity and cash fl ow statement for the year then ended, and
a summary of signifi cant accounting policies and other explanatory information, as set out on pages 8 to 20.
Directors’ Responsibility for the Financial Statements
The directors of the Company are responsible for the preparation of fi nancial statements that give a true and fair view in
accordance with Private Entities Reporting Standard and the Companies Act 1965 in Malaysia, and for such internal controls as
the directors determine are necessary to enable the preparation of fi nancial statements that are free from material misstatement,
whether due to fraud or error.
Auditors’ Responsibility
Our responsibility is to express an opinion on these fi nancial statements based on our audit. We conducted our audit in accordance
with approved standards on auditing in Malaysia. Those standards require that we comply with ethical requirements and plan
and perform the audit to obtain reasonable assurance whether the fi nancial statements are free from material misstatement.
An audit involves performing procedures to obtain audit evidence about the amounts and disclosures in the fi nancial statements.
The procedures selected depend on our judgement, including the assessment of risks of material misstatement of the fi nancial
statements, whether due to fraud or error. In making those risk assessments, we consider internal control relevant to the
Company’s preparation and fair presentation of the fi nancial statements in order to design audit procedures that are appropriate
in the circumstances, but not for the purpose of expressing an opinion on the effectiveness of the Company’s internal control. An
audit also includes evaluating the appropriateness of accounting policies used and the reasonableness of accounting estimates
made by the directors, as well as evaluating the overall presentation of the fi nancial statements.
We believe that the audit evidence we have obtained is suffi cient and appropriate to provide a basis for our audit opinion.
Opinion
In our opinion, the fi nancial statements have been properly drawn up in accordance with Private Entities Reporting Standards
and the Companies Act 1965 in Malaysia so as to give a true and fair view of the fi nancial position of the Company as of 31
March 2013 and of its fi nancial performance and cash fl ows for the year then ended.
Emphasis of matter
Without qualifying our opinion, we draw attention to Note 3(i) in the fi nancial statements which discloses the premise upon
which the Company has prepared its fi nancial statements by applying the going concern assumption, notwithstanding as of
that date, the Company’s current liabilities exceeded its current assets by RM1,549,865/-(Rs.Crore 2.71), thereby indicating the
existence of a material uncertainty which may cast signifi cant doubt about the Company’s ability to continue as a going concern.
Report on Other Legal and Regulatory Requirements
In accordance with the requirements of the Companies Act 1965 in Malaysia, we also report that in our opinion the accounting
and other records and the registers required by the Act to be kept by the Company have been properly kept in accordance
with the provisions of the Act.

180
DRX AESTHETICS SDN. BHD.(INCORPORATED IN MALAYSIA)
Other Matters
This report is made solely to the members of the Company, as a body, in accordance with Section 174 of the Companies Act
1965 in Malaysia and for no other purpose. We do not assume responsibility to any other person for the content of this report.
SUNDARASAN A/L ARUMUGAM SUNDAR & ASSOCIATES 1876/02/14(J/PH) AF No: 1127
Chartered Accountant (M) Chartered Accountants (M)
Petaling Jaya
Date : 23rd May 2013
INDEPENDENT AUDITORS’ REPORT (Contd.)TO THE MEMBERS OF DRX AESTHETICS SDN. BHD

181
DRX AESTHETICS SDN. BHD.(INCORPORATED IN MALAYSIA)
Notes 2013 2012 2013 2012RM RM Rs. Crore Rs. Crore
Turnover 3 (ii) 1,273,619 746,150 2.24 1.17
Cost of sales (311,457) (234,329) (0.55) (0.37)
Gross profi t 962,162 511,821 1.69 0.80
Other income 7,824 3,960 0.01 0.01
Staff costs 5 (513,177) (63,664) (0.90) (0.10)
Depreciation (19,313) (5,992) (0.03) (0.01)
Other operating expenses (386,319) (337,598) (0.68) (0.53)
Profi t before taxation 6 51,177 108,527 0.09 0.17
Taxation 7 – 3,517 – 0.01
Profi t after taxation 51,177 112,044 0.09 0.18
The annexed notes form an integral part of these fi nancial statements.
INCOME STATEMENTfor the period ended 31 March 2013
Note: The exchange rate used to convert MYR to Rs. <17.534> /(Previous year MYR to Rs.<16.617>).

182
DRX AESTHETICS SDN. BHD.(INCORPORATED IN MALAYSIA)
Notes 2013 2012 2013 2012RM RM Rs. Crore Rs. Crore
Non-current assetPlant and equipment 8 82,418 46,479 0.14 0.08
Current assetsInventories 3(iv) / 9 140,242 33,098 0.25 0.05
Trade receivables 9,050 9,751 0.02 0.02
Other receivables , deposits and prepayment 10 81,159 92,014 0.14 0.15
Tax recoverable 65,385 38,385 0.11 0.06
Cash and bank balances 341,523 143,429 0.60 0.24
637,359 316,677 1.12 0.53
Current liabilitiesTrade payables 633,560 287,084 1.11 0.48
Other payables and accrued liabilities 11 19,867 60,899 0.03 0.10
Amount owing to holding company 12 1,533,797 1,533,797 2.69 2.55
2,187,224 1,881,780 3.83 3.13
Net current liabilities (1,549,865) (1,565,103) (2.71) (2.60)
(1,467,447) (1,518,624) (2.57) (2.52)
Financed by :
Share capital 13 990,000 990,000 1.74 1.65
Accumulated loss (2,457,447) (2,508,624) (4.31) (4.17)
(1,467,447) (1,518,624) (2.57) (2.52)
The annexed notes form an integral part of these fi nancial statements.
BALANCE SHEETAS AT 31 MARCH 2013
Note: The exchange rate used to convert MYR to Rs. <17.534> /(Previous year MYR to Rs.<16.617>).

183
DRX AESTHETICS SDN. BHD.(INCORPORATED IN MALAYSIA)
Share capital
Accumulatedloss Total
Share capital
Accumulated loss Total
RM RM RM Rs. Crore Rs. Crore Rs. CroreBalance as at 1 April 2012 990,000 (2,508,624) (1,518,624) 1.74 (4.40) (2.66)
Profi t after taxation – 51,177 51,177 – 0.09 0.09
Balance as at 31 March 2013 990,000 (2,457,447) (1,467,447) 1.74 (4.31) (2.57)
Balance as at 1 April 2011 990,000 (2,620,668) (1,630,668) 1.65 (4.35) (2.71)
Profi t after taxation – 112,044 112,044 – 0.19 0.19
Balance as at 31 March 2012 990,000 (2,508,624) (1,518,624) 1.65 (4.16) (2.52)
The annexed notes form an integral part of these fi nancial statements.
STATEMENT OF CHANGES IN EQUITYfor the period ended 31 March 2013
Note: The exchange rate used to convert MYR to Rs. <17.534> /(Previous year MYR to Rs.<16.617>).

184
DRX AESTHETICS SDN. BHD.(INCORPORATED IN MALAYSIA)
CASH FLOW STATEMENTfor the period ended 31 March 2013
2013 2012 2013 2012RM RM Rs. Crore Rs. Crore
Cash fl ows from operating activitiesProfi t before taxation 51,177 108,527 0.09 0.18
Adjustments for :
Depreciation on plant and equipment 19,313 5,992 0.03 0.01
Loss on foreign exchange - unrealised – 3,297 – 0.01
Bad debts written off – 39 – –
Operating profi t before working capital changes 70,490 117,855 0.12 0.20
Changes in working capital :
Inventories (107,144) (2,002) (0.19) –
Trade receivables 701 (6,680) – (0.01)
Other receivables, deposits and prepayment 10,855 (10,955) 0.02 (0.02)
Trade payables 346,476 (160,976) 0.62 (0.27)
Other payables and accrued liabilities (41,032) (5,287) (0.07) (0.01)
Cash generated from /(absorbed by) operations 280,346 (68,045) 0.50 (0.11)
Tax paid (27,000) (34,947) (0.05) (0.06)
Net cash fl ow from operating activities 253,346 (102,992) 0.45 (0.17)Cash fl ows from investing activityPurchase of plant and equipment (55,252) (49,315) (0.10) (0.08)
Net cash fl ow from investing activity (55,252) (49,315) (0.10) (0.08)
Net increase / (decrease) in cash and cash equivalents 198,094 (152,307) 0.35 (0.25)
Cash and cash equivalents brought forward 143,429 295,736 0.25 0.49
Cash and cash equivalent carried forward 341,523 143,429 0.60 0.24
Breakdown of cash and cash equivalents carried forwardCash and bank balances 341,523 143,429 0.60 0.24
The annexed notes form an integral part of these fi nancial statements.
Note: The exchange rate used to convert MYR to Rs. <17.534> /(Previous year MYR to Rs.<16.617>).

185
DRX AESTHETICS SDN. BHD.(INCORPORATED IN MALAYSIA)
1. Corporate information
The Company is a private limited liability company, incorporated and domiciled in Malaysia.
The registered offi ce of the company is located at 339,Mezzanine Floor, Jalan Tuanku Abdul Rahman, 50100 Kuala Lumpur and the principal place of business is located at N-1-1, Plaza Damas, No 60, Jalan Sri Hartamas 1, 50480 Kuala Lumpur.
2. Date of authorisation of issue
The fi nancial statements were authorised for issue by the Board of Directors on 23rd May 2013
3. Signifi cant accounting policies
(i) Basis of preparation
The fi nancial statements comply with applicable approved accounting standards for private entities issued by the Malaysian Accounting Standards Board and the provisions of the Companies Act, 1965.
As at 31 March 2013, the Company’s current liabilities exceeded its total assets by RM1,549,865/- (Rs.Crore2.71). However, the fi nancial statements have been prepared on the basis of accounting principle applicable to a going concern. This going concern basis presumes that the Company will be able to operate profi tably in the foreseeable future and continue to receive fi nancial support from the shareholders and consequently, the realisation of assets and the settlement of liabilities will occur in the ordinary course of business. In this connection, the directors are satisfi ed that the Company will be able to meet its fi nancial obligation as and when they fall due for the foreseeable future.
(ii) Revenue
Revenue is recognised when it is probable that the economic benefi ts associated with the transaction will fl ow to the enterprise and the amount of the revenue can be measured reliably.
Sale of goods
Revenue is recognised upon delivery of goods and customers’ acceptance and where applicable, net of returns and trade discounts.
Services rendered
Revenue is recognised upon rendering of services and when the outcome of the transactions can be estimated reliably. In the event the outcome of the transactions could not be estimated reliably, revenue is recognised to the extent of the expenses incurred that are recoverable.
(iii) Plant and equipment
Plant and equipment is stated at cost less accumulated depreciation.
Depreciation on plant and equipment is calculated on a straight-line method based on the estimated useful lives of the assets. The principal annual rates of depreciation used are as follows:
The principal annual rates of depreciation used are as follows:-
Computer and equipment 20% Furniture and fi ttings 20% Air-conditioners 20% Medical and surgical equipment 20% Renovations 20%
Plant and equipment is written down to recoverable amount if, the recoverable amount is less than their carrying value. Recoverable amount is the higher of an asset’s net selling price and its value in use.
(iv) Inventories
Inventories, encompassing fi nished goods purchased and held for resale, are stated at the lower of cost and net realisable value. Cost is determined on fi rst-in fi rst-out method and includes transport and handling costs.
NOTES TO THE FINANCIAL STATEMENTS for the period ended 31 March 2013

186
DRX AESTHETICS SDN. BHD.(INCORPORATED IN MALAYSIA)
NOTES TO THE FINANCIAL STATEMENTS for the period ended 31 March 2013
(v) Receivables
Trade and other receivables are carried at anticipated realisable value. Bad debts are written off in the period in which they are identifi ed. An estimate is made for doubtful debts based on a review of all outstanding amounts at the balance sheet date.
(vi) Cash and cash equivalents
Cash represent cash and bank balances. Cash equivalents comprises of investments maturing within three months from the date of acquisition and which are readily convertible to known amount of cash which are subject to an insignifi cant risk of change in value.
(vii) Payables
Payables are stated at cost which is the consideration to be paid in the future for products and services received.
(viii) Income tax
Income tax on the profi t or loss for the year comprises current and deferred tax. Current tax is the expected amount of income taxes payable in respect of the taxable profi t for the year and is measured using the tax rates that have been enacted at balance sheet date.
Deferred tax is provided for, using the liability method, on temporary differences at the balance sheet date between the tax bases of assets and liabilities and their carrying amounts in the fi nancial statements. In principle, deferred tax liabilities are recognised for all taxable temporary differences and deferred tax assets are recognised for all deductible temporary differences, unused tax losses and unused tax credits to the extent that it is probable that taxable profi t will be available against which the deductible temporary differences, unused tax losses and unused tax credits can be utilised.
Deferred tax is measured at the tax rates that are expected to apply in the period when the asset is realised or the liability is settled, based on the tax rates that have been enacted or substantively enacted at the balance sheet date.
Deferred tax is recognised in the income statement, except when it arises from a transaction which is recognised directly in equity.
(ix) Provisions
Provisions are recognised when the Company has a present legal and constructive obligation as a result of a past event, when it is probable that an outfl ow of resources embodying economic benefi ts will be required to settle the obligation, and when a reliable estimate can be made of the amount of the obligation.
(x) Employment benefi t
a. Short term benefi ts
Wages, salaries, bonuses and social security contributions are recognised as an expense in the fi nancial year in which the associated services are rendered by employees of the Company. Short term accumulating compensated absences such as paid annual leave are recognised when services are rendered by employees that increase their entitlement to future compensated absences, and short term non-accumulating compensated absences such as sick leave are recognised when the absences occur.
b. Defi ned contribution plan
As required by law, companies in Malaysia make contributions to the Employee Provident Fund (EPF). Such contributions are recognised as an expense in the income statement as incurred.
(xi) Impairment of assets
The carrying values of assets excluding inventories, deferred tax assets, assets arising from employee benefi ts and fi nancial assets are reviewed for impairment when there is an indication that the assets might be impaired. Impairment is measured by comparing the carrying values of the assets with their recoverable amounts. The recoverable amount

187
DRX AESTHETICS SDN. BHD.(INCORPORATED IN MALAYSIA)
is the higher of an asset’s net selling price and its value in use, which is measured by reference to discounted future cash fl ows. Recoverable amounts are estimated for individual assets, or if it not possible, for the cash-generating unit.
An impairment loss is charged to the income statement immediately, unless the asset is carried at revalued amount. Any impairment loss of a revalued asset is treated as a revaluation decrease to the extent of previously recognised revaluation surplus for the same asset.
Subsequent increase in the recoverable amount of an asset is treated as reversal of the previous impairment loss and is recognised to the extent of the carrying amount of the asset that would have been determined (net of amortisation and depreciation) had no impairment loss been recognised. The reversal is recognised in the income statement immediately, unless the asset is carried at revalued amount. A reversal of an impairment loss on a revalued asset is credited directly to revaluation surplus. However, to the extent that an impairment loss on the same revalued asset was previously recognized as an expense in the income statement, a reversal of that impairment loss is recognised as income in the income statement.
(xii) Currency conversion
Transactions in foreign currencies are translated to Malaysian Ringgit at rates of exchange ruling at the date of transaction. Monetary assets and liabilities denominated in foreign currencies are translated at the rates of exchange ruling at the balance sheet date. Foreign exchange differences arising on translation are recognised in the income statement.
The principal closing rates used in translation of foreign currency amount are as follows:
2013 2012 RM RM
Singapore Dollar 2.4911 2.4405
4. Principal activities
The principal activities of the Company are managing private medical practice and medical laboratory service and consultation as well as dealing in all kinds of medical and its related products.
5 Staff Costs
2013 2012 2013 2012RM RM Rs. Crore Rs. Crore
Salaries and related cost 457,245 57,149 0.80 0.09
Contribution to defi ned contribution plan 53,634 5,847 0.09 0.01
Other employees benefi t 2,298 668 – –
513,177 63,664 0.90 0.10
6 Profi t Before taxation
Profi t before taxation is stated after charging :-
2013 2012 2013 2012RM RM Rs. Crore Rs. Crore
Rental of offi ce 122,025 108,000 0.21 0.17
Royalties 56,887 34,559 0.10 0.05
Auditors’ remuneration 6,200 9,820 0.01 0.02
Loss on foreign exchange - realised – 9,685 – 0.02
Loss on foreign exchange - unrealised – 3,297 – 0.01
Bad debt written off and crediting : – 39 – –Gain on foreign exchange - realised 1,224 – – –
NOTES TO THE FINANCIAL STATEMENTS for the period ended 31 March 2013

188
DRX AESTHETICS SDN. BHD.(INCORPORATED IN MALAYSIA)
7 Taxation
Tax charge for the year is as follows:
2013 2012 2013 2012RM RM Rs. Crore Rs. Crore
Provision for the year – – – –
Overprovision in prior year – 3,517 – 0.01
– 3,517 – 0.01
A reconciliation of income tax expense applicable to profi t before taxation at the statutory income tax rate to income tax expense at the effective income tax rate of the Company is as follows :
2013 2012 2013 2012RM RM Rs. Crore Rs. Crore
Profi t before taxation 51,177 108,527 0.09 0.17 Taxation at Malaysian statutory tax rate of 25% 12,794 27,132 0.02 0.04
Expenses not deductible for tax purposes 3,235 – 0.01 –
Origination of deferred tax asset not recognised
(16,029) (22,444) (0.03) (0.04)
Proportion of profi t in respect of overlapping year
0 (8,205) – (0.01)
Tax expense for the year – (3,517) – (0.01)
Subject to agreement of the Inland Revenue Board, the Company has the following available for set-off against future taxable income.
2013 2012 2013 2012RM RM Rs. Crore Rs. Crore
Unutilised tax losses 928,791 928,791 1.63 1.45
Unutilised capital allowances 858,606 847,811 1.51 1.33
1,787,397 1,776,602 3.14 2.95
8 Plant and Equipment
The movement on plant and equipment is detailed on page 20.
(a) Included in the cost of plant and equipment are fully depreciated assets, which are still in use, as follows:
2013 2012 2013 2012RM RM Rs. Crore Rs. Crore
Medical and surgical equipment 145,730 506,730 0.26 0.84
Renovation 383,512 383,512 0.67 0.64
Computer and equipment 36,743 37,043 0.06 0.06
Air - conditioner 17,400 17,400 0.03 0.03
Furniture and fi ttings 4,768 10,367 0.01 0.02
588,153 955,052 1.03 1.59
NOTES TO THE FINANCIAL STATEMENTS for the period ended 31 March 2013

189
DRX AESTHETICS SDN. BHD.(INCORPORATED IN MALAYSIA)
Cos
tC
ompu
ter a
nd
equi
pmen
t Fu
rnitu
re a
nd
fi ttin
gsM
edic
al a
nd
surg
ical
eq
uipm
ent
Ren
ovat
ion
Air-
cond
ition
er S
ignb
oard
Tota
l
RM
RM
RM
RM
RM
RM
RM
B
alan
ce b
roug
ht fo
rwar
d 3
7,04
3 1
2,86
6 5
13,8
90
425
,667
1
7,40
0 2
,400
1
,009
,266
A
dditio
n 9
,116
4
,420
4
1,71
6 –
–
– 5
5,25
2
D
ispo
sal
300
5
,599
3
61,0
00
–
–
–
366
,899
B
alan
ce c
arrie
d fo
rwar
d 4
5,85
9 1
1,68
7 1
94,6
06
425
,667
1
7,40
0 2
,400
6
97,6
19
Acc
umul
ated
dep
reci
atio
nC
ompu
ter a
nd
equi
pmen
t Fu
rnitu
re a
nd
fi ttin
gsM
edic
al a
nd
surg
ical
eq
uipm
ent
Ren
ovat
ion
Air-
cond
ition
er S
ignb
oard
Tota
l
RM
RM
RM
RM
RM
RM
RM
B
alan
ce b
roug
ht fo
rwar
d 3
7,04
2 1
2,49
1 5
07,2
07
387
,727
1
7,40
0 9
20
962
,787
A
dditi
on 1
,455
1
,258
7
,689
8
,431
–
480
1
9,31
3
D
ispo
sal
300
5
,599
3
61,0
00
––
–
366
,899
B
alan
ce c
arrie
d fo
rwar
d 3
8,19
7 8
,150
1
53,8
96
396
,158
1
7,40
0 1
,400
6
15,2
01
Net
boo
k va
lue
Com
pute
r and
eq
uipm
ent
Furn
iture
and
fi t
tings
Med
ical
and
su
rgic
al
equi
pmen
t
Ren
ovat
ion
Air-
cond
ition
er S
ignb
oard
Tota
l
RM
RM
RM
RM
RM
RM
RM
2
013
7,6
62
3,5
37
40,
710
29,
509
– 1
,000
8
2,41
8
2
012
1
375
6
,683
3
7,94
0 –
1
,480
4
6,47
9
8.
Plan
t and
equ
ipm
ent
NO
TES
TO T
HE
FIN
AN
CIA
L ST
ATEM
ENTS
fo
r the
per
iod
ende
d 31
Mar
ch 2
013

190
DRX AESTHETICS SDN. BHD.(INCORPORATED IN MALAYSIA)
Cos
tC
ompu
ter a
nd
equi
pmen
t Fu
rnitu
re a
nd
fi ttin
gsM
edic
al a
nd
surg
ical
eq
uipm
ent
Ren
ovat
ion
Air-
cond
ition
er S
ignb
oard
Tota
l
Rs.
Cro
reR
s. C
rore
Rs.
Cro
reR
s. C
rore
Rs.
Cro
reR
s. C
rore
Rs.
Cro
re
Bal
ance
bro
ught
forw
ard
0.0
6 0
.02
0.8
5 0
.71
0.0
3 –
1.6
7
A
dditio
n 0
.02
0.0
1 0
.07
– –
– 0
.10
D
ispo
sal
–
0.0
1 0
.63
– –
–
0
.64
B
alan
ce c
arrie
d fo
rwar
d 0
.08
0.0
2 0
.29
0.7
1 0
.03
–
1.1
3
Acc
umul
ated
dep
reci
atio
nC
ompu
ter a
nd
equi
pmen
t Fu
rnitu
re a
nd
fi ttin
gsM
edic
al a
nd
surg
ical
eq
uipm
ent
Ren
ovat
ion
Air-
cond
ition
er S
ignb
oard
Tota
l
Rs.
Cro
reR
s.C
rore
Rs.
Cro
reR
s.C
rore
Rs.
Cro
reR
s.C
rore
Rs.
Cro
re
Bal
ance
bro
ught
forw
ard
0.0
6 0
.02
0.8
4 0
.64
0.0
3 –
1
.60
A
dditi
on –
–
0
.01
0.0
1 –
–
0
.03
D
ispo
sal
–
0.0
1 0
.63
–
–
–
0.6
4
B
alan
ce c
arrie
d fo
rwar
d 0
.06
0.0
1 0
.22
0.6
5 0
.03
–
0.9
9
Net
boo
k va
lue
Com
pute
r and
eq
uipm
ent
Furn
iture
and
fi t
tings
Med
ical
and
su
rgic
al
equi
pmen
t
Ren
ovat
ion
Air-
cond
ition
er S
ignb
oard
Tota
l
Rs.
Cro
reR
s.C
rore
Rs.
Cro
reR
s.C
rore
Rs.
Cro
reR
s.C
rore
Rs.
Cro
re
201
3 0
.02
0.0
1 0
.07
0.0
6 –
–
0
.14
2
012
–
–
0.0
1 0
.07
–
–
0.0
8
8.
Plan
t and
equ
ipm
ent (
Con
td.)
NO
TES
TO T
HE
FIN
AN
CIA
L ST
ATEM
ENTS
fo
r the
per
iod
ende
d 31
Mar
ch 2
013
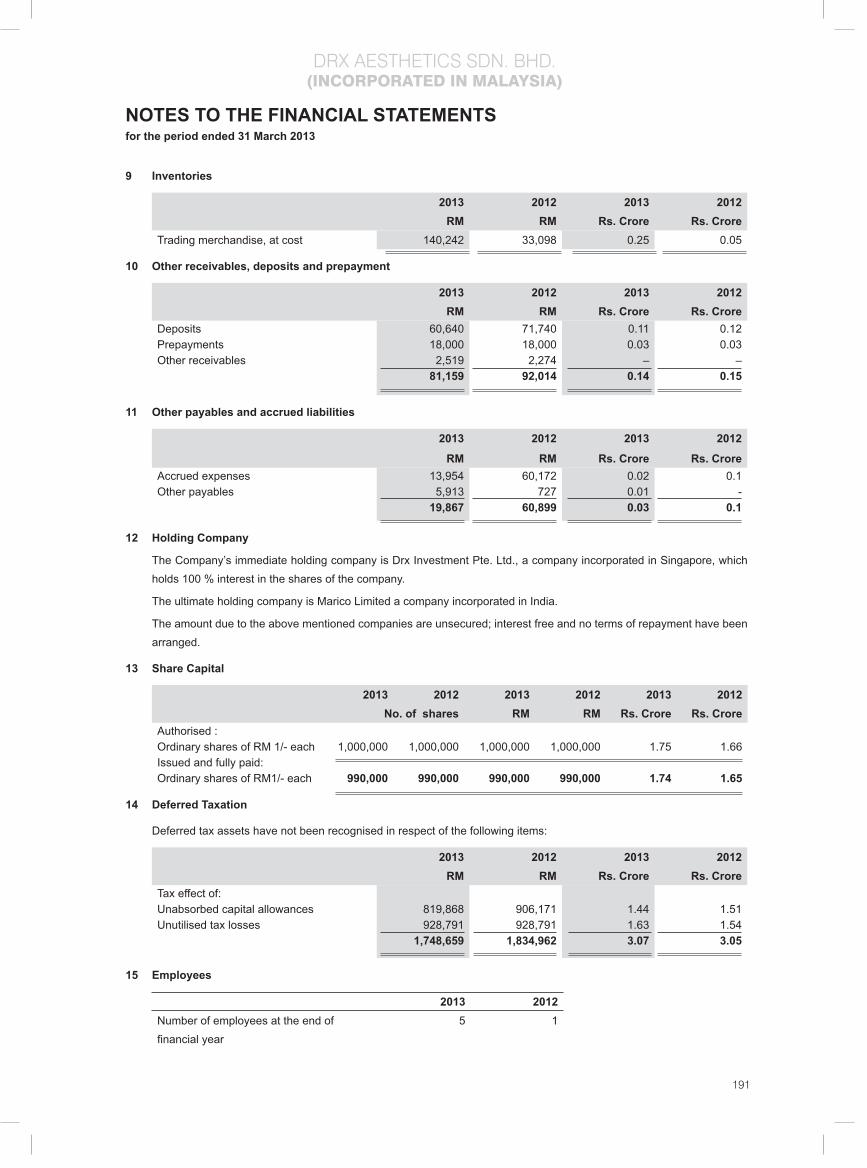
191
DRX AESTHETICS SDN. BHD.(INCORPORATED IN MALAYSIA)
9 Inventories
2013 2012 2013 2012RM RM Rs. Crore Rs. Crore
Trading merchandise, at cost 140,242 33,098 0.25 0.05
10 Other receivables, deposits and prepayment
2013 2012 2013 2012RM RM Rs. Crore Rs. Crore
Deposits 60,640 71,740 0.11 0.12 Prepayments 18,000 18,000 0.03 0.03 Other receivables 2,519 2,274 – –
81,159 92,014 0.14 0.15
11 Other payables and accrued liabilities
2013 2012 2013 2012
RM RM Rs. Crore Rs. CroreAccrued expenses 13,954 60,172 0.02 0.1Other payables 5,913 727 0.01 -
19,867 60,899 0.03 0.1
12 Holding Company
The Company’s immediate holding company is Drx Investment Pte. Ltd., a company incorporated in Singapore, which holds 100 % interest in the shares of the company.
The ultimate holding company is Marico Limited a company incorporated in India.
The amount due to the above mentioned companies are unsecured; interest free and no terms of repayment have been arranged.
13 Share Capital
2013 2012 2013 2012 2013 2012No. of shares RM RM Rs. Crore Rs. Crore
Authorised :Ordinary shares of RM 1/- each 1,000,000 1,000,000 1,000,000 1,000,000 1.75 1.66 Issued and fully paid:Ordinary shares of RM1/- each 990,000 990,000 990,000 990,000 1.74 1.65
14 Deferred Taxation
Deferred tax assets have not been recognised in respect of the following items:
2013 2012 2013 2012RM RM Rs. Crore Rs. Crore
Tax effect of:Unabsorbed capital allowances 819,868 906,171 1.44 1.51 Unutilised tax losses 928,791 928,791 1.63 1.54
1,748,659 1,834,962 3.07 3.05
15 Employees
2013 2012Number of employees at the end of fi nancial year
5 1
NOTES TO THE FINANCIAL STATEMENTS for the period ended 31 March 2013

192
DRX AESTHETICS SDN. BHD.(INCORPORATED IN MALAYSIA)
2013 2012 2013 2012RM RM Rs. Crore Rs. Crore
Turnover 1,273,619 746,150 2.24 1.17
Cost of sales :Inventories - 1 January 33,099 31,096 0.06 0.05
Purchases 414,513 231,867 0.73 0.36
Freight, forwarding and handling charges 4,087 4,465 0.01 0.01
Inventories - 31 March (140,242) (33,099) (0.25) (0.05)
311,457 234,329 0.55 0.37
Gross profi t 962,162 511,821 1.69 0.80
Other income :
Miscellaneous income 6,600 3,960 0.01 0.01
Gain on foreign exchange-realised 1,224 – – –
7,824 3,960 0.01 0.01
Staff costs Appendix I (513,177) (63,664) (0.90) (0.10)
Depreciation Appendix I (19,313) (5,992) (0.03) (0.01)
Other operating expenses Appendix I (386,319) (337,598) (0.68) (0.53)
Profi t for the year 51,177 108,527 0.09 0.17
This management income statement is prepared from information furnished by the management of Drx Aesthetics Sdn. Bhd. and does not form part of the audited fi nancial statements of the company.
INCOME STATEMENTfor the period ended 31 March 2013

193
DRX AESTHETICS SDN. BHD.(INCORPORATED IN MALAYSIA)
SCHEDULE OF EXPENSES for the period ended 31 March 2013
Appendix I2013 2012 2013 2012
RM RM Rs. Crore Rs. CroreStaff costsSalaries 286,903 35,161 0.50 0.05 Allowances 170,342 21,988 0.30 0.03 EPF 53,634 5,847 0.09 0.01 Socso 2,298 668 – –
513,177 63,664 0.89 0.09
DepreciationRenovation 8,431 4,215 0.01 0.01 Medical and surgical equipment 7,689 477 0.01 – Computer and equipment 1,455 320 – –Furniture and fi tting 1,258 500 – – Signboard 480 480 – –
19,313 5,992 0.02 0.01
Other operating expensesRental of offi ce 122,025 108,000 0.21 0.17 Royalties 56,887 34,559 0.10 0.05 Travelling 46,620 19,783 0.08 0.03 Professional fee 45,308 5,269 0.08 0.01 Staff accomodation 18,605 4,244 0.03 0.01 Credit card commission 17,750 10,163 0.03 0.02 Marketing fee 17,039 8,480 0.03 0.01 Electricity and water 8,857 6,684 0.02 0.01 Offi ce cleaning 7,281 7,343 0.01 0.01 Telephone charges 7,154 6,635 0.01 0.01 Repair and renewal 6,649 2,367 0.01 –Auditors' remuneration 6,200 9,820 0.01 0.02 Accounting fee 6,000 6,000 0.01 0.01 Offi ce maintenance 5,540 2,589 0.01 –Registration fee 4,036 3,983 0.01 0.01 Printing and stationery 3,431 2,233 0.01 – Insurance 3,240 1,675 0.01 – Staff welfare 1,940 160 – –General expenses 1,698 6,432 – 0.01 Tax fee 1,000 2,606 – – Secretarial fees 960 743 – – Penalty 200 1,464 – – Postage and courier 189 550 – –Bank charges 91 228 – – Newspaper and periodicals 80 54 – – Loss on foreign exchange - realised – 9,685 – 0.02 Loss on foreign exchange - unrealised – 3,297 – 0.01 Bad debts written off – 39 – – Recruitment fee (2,461) 72,513 – 0.11
386,319 337,598 0.68 0.53
This management schedule of expenses is prepared from information furnished by the management of Drx Aesthetics Sdn. Bhd. and does not form part of the audited fi nancial statements of the company.

194
MARICO MIDDLE EAST FZE
Board of Directors Saugata Gupta
B.Sridhar
Mukesh Kripalani
Debashish Neogi
Rohit Jaiswal
Souvik Mazumdar
Saumitra Bhat
Secretary, Manager, Negotiator Rohit Jaiswal
Registered Offi ce Offi ce No. LB15326, Jebel Ali, Dubai, UAE
Auditors M/s. PricewaterhouseCoopers
Dubai
Bankers Standard Chartered Bank
HSBC Bank
JPMORGAN Chase Bank .NA
Bank Mandri (Persero) TBK, Indonesia

195
MARICO MIDDLE EAST FZE
Report on the fi nancial statements
We have audited the accompanying fi nancial statements of Marico Middle East FZE(“the company”) which comprise the balance sheet as at 31 March 2013,the statements of comprehensive income, changes in equity and cash fl ows for the year then ended and a summary of signifi cant accounting policies and other explanatory notes.
Management’s responsibility for the fi nancial statements
Management is responsible for the preparation and fair presentation of these fi nancial statements in accordance with International Financial Reporting Standards, and for such internal control as management determines is necessary to enable the preparation of fi nancial statements that are free from material misstatement, whether due to fraud or error.
Auditor’s responsibility
Our responsibility is to express an opinion on these fi nancial statements based on our audit. We conducted our audit in accordance with International Standards on Auditing. Those standards require that we comply with ethical requirements and plan and perform the audit to obtain reasonable assurance whether the fi nancial statements are free of material misstatement.
An audit involves performing procedures to obtain audit evidence about the amounts and disclosures in the fi nancial statements. The procedures selected depend on the auditor’s judgement, including the assessment of the risks of material misstatement of the fi nancial statements, whether due to fraud or error. In making those risk assessments, the auditor considers internal control relevant to the entity’s preparation and fair presentation of the fi nancial statements in order to design audit procedures that are appropriate in the circumstances, but not for the purpose of expressing an opinion on the effectiveness of the entity’s internal control. An audit also includes evaluating the appropriateness of accounting policies used and the reasonableness of accounting estimates made by management, as well as evaluating the overall presentation of the fi nancial statements.
We believe that the audit evidence we have obtained is suffi cient and appropriate to provide a basis for our audit opinion.
Basis for qualifi edopinion
The fi nancial information of the company and its subsidiaries is consolidated into the ultimate holding company which prepares fi nancial statements in accordance with Indian Generally Accepted Accounting Principles (“IGAAP”).These fi nancial statements, prepared for statutory fi ling purposes, relate to the company only and do not consolidate the fi nancial position, results of operations and cash fl ows of its subsidiaries. In our opinion, this is a departure from the requirements of IAS 27, ‘Consolidated and Separate Financial Statements’ and clause 47 of the Implementing Regulations No. 1/92 pursuant to Law No. 9 of 1992 concerning the formation of Free Zone Establishments in the Jebel Ali Free Zone.
Qualifi ed opinion
In our opinion, except for the matter discussed in the basis of qualifi ed opinion paragraph, the accompanying fi nancial statements present fairly, in all material respects, the fi nancial position of the company as of 31 March 2013, and its fi nancial performance and its cash fl ows for year then ended in accordance with International Financial Reporting Standards.
Report on other legal and regulatory requirements
Further, we report that, except for the matter discussed in the basis for qualifi ed opinion paragraph, the fi nancial statements of the company comply, in all material respects, with the applicable provisions of the Implementing Regulations No. 1/92 pursuant to Law No. 9 of 1992 concerning the formation of Free Zone Establishments in the Jebel Ali Free Zone.
PricewaterhouseCoopers
Registered Auditor Number 309 Paul SuddabyDubai, United Arab Emirates14 May 2013
AUDITORS’ REPORT

196
MARICO MIDDLE EAST FZE
As at March 31st As at March 31st
2013 2012 2013 2012 Notes AED AED Rs. Crore Rs. Crore
ASSETS
Non-current assets
Property and equipment 4 463,127 525,276 0.68 0.73
Investments in susbidiaries 5 31,851,823 32,001,823 47.07 44.33
32,314,950 32,527,099 47.76 45.05
Current assets
Inventories 168,787 – 0.25 –
Trade and other receivables 6 20,124,777 46,272,336 29.74 64.09
Loan to subsidiairies 7 16,292,144 59,376,267 24.08 82.24
Due from related party 8 330,184 – 0.49 –
Cash and bank balances 9 3,189,603 604,474 4.71 0.84
40,105,495 106,253,077 59.27 147.17
Total assets 72,420,445 138,780,176 107.03 192.22
EQUITY
Capital and reserves
Share capital 10 22,000,000 22,000,000 32.51 30.47
Retained earnings (39,095,050) (1,733,589) (57.78) (2.40)
Total equity (17,095,050) 20,266,411 (25.26) 28.07
LIABILITIES
Non-current liabilities
Employees’ end of service benefi ts 11 668,663 379,394 0.99 0.53
668,663 379,394 0.99 0.53
Current liabilities
Trade and other payables 12 27,183,898 16,406,013 40.18 22.72
Due to related party 8 10,240,934 19,223,283 15.14 26.63
Bank borrowings 13 51,422,000 82,505,075 76.00 114.28
88,846,832 118,134,371 131.31 163.63
Total liabilities 89,515,495 118,513,765 132.29 164.15
Total equity and liabilities 72,420,445 138,780,176 107.03 192.22
These fi nancial statements were approved by the Board of Directors on 14 May 2013and signed on their behalf by:
BALANCE SHEET
As per our annexed report of same date.
Rahman Rahman Huq Debashish Neogi Saumitra Bhat
Auditors Managing Director Director
Place : DhakaDate : 14 May 2013
Note: The exchange rate use to convert AED to Rs.<14.779>/(Previous year AED to Rs.<13.851>)

197
MARICO MIDDLE EAST FZE
Year ended March 31,
2013 2012 2013 2012 AED AED Rs. Crore Rs. Crore
Income Statement
Revenue 70,070,655 151,012,513 103.74 196.94
Cost of sales (51,186,315) (95,185,675) (75.78) (124.13)
Gross profi t 18,884,340 55,826,838 27.96 72.80
Other income 19,826 128,532 0.03 0.17
Expenses
Staff cost (11,187,532) (9,421,294) (16.56) (12.29)
Depreciation expense (141,055) (128,728) (0.21) (0.17)
Other expenses (44,760,826) (46,531,483) (66.27) (60.68)
Operating Loss (37,185,247) (126,135) (55.05) (0.16)
Interest income 1,170,158 1,403,851 1.73 1.83
Finance costs (1,346,372) (1,986,794) (1.99) (2.59)
Loss for the year (37,361,461) (709,078) (55.31) (0.92)
Other comprehensive income – – – –
Total comprehensive income for the year (37,361,461) (709,078) (55.31) (0.92)
STATEMENT OF COMPREHENSIVE INCOME
For MARICO MIDDLE EAST FZE
Date : 14 April 2010 DIRECTOR
Note: The exchange rate use to convert AED to Rs.<14.779>/(Previous year AED to Rs.<13.851>)
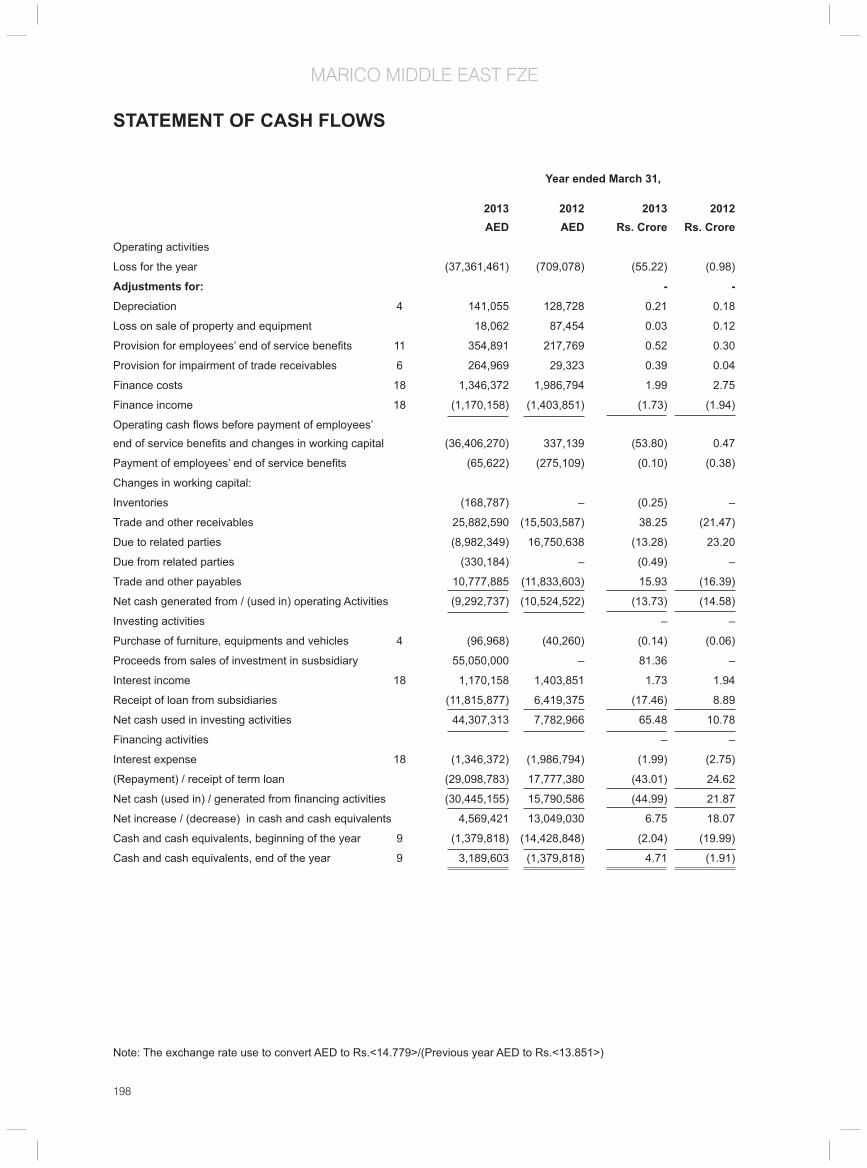
198
MARICO MIDDLE EAST FZE
Year ended March 31,
2013 2012 2013 2012 AED AED Rs. Crore Rs. Crore
Operating activities
Loss for the year (37,361,461) (709,078) (55.22) (0.98)
Adjustments for: - -
Depreciation 4 141,055 128,728 0.21 0.18
Loss on sale of property and equipment 18,062 87,454 0.03 0.12
Provision for employees’ end of service benefi ts 11 354,891 217,769 0.52 0.30
Provision for impairment of trade receivables 6 264,969 29,323 0.39 0.04
Finance costs 18 1,346,372 1,986,794 1.99 2.75
Finance income 18 (1,170,158) (1,403,851) (1.73) (1.94)
Operating cash fl ows before payment of employees’ end of service benefi ts and changes in working capital (36,406,270) 337,139 (53.80) 0.47
Payment of employees’ end of service benefi ts (65,622) (275,109) (0.10) (0.38)
Changes in working capital:
Inventories (168,787) – (0.25) –
Trade and other receivables 25,882,590 (15,503,587) 38.25 (21.47)
Due to related parties (8,982,349) 16,750,638 (13.28) 23.20
Due from related parties (330,184) – (0.49) –
Trade and other payables 10,777,885 (11,833,603) 15.93 (16.39)
Net cash generated from / (used in) operating Activities (9,292,737) (10,524,522) (13.73) (14.58)
Investing activities – –
Purchase of furniture, equipments and vehicles 4 (96,968) (40,260) (0.14) (0.06)
Proceeds from sales of investment in susbsidiary 55,050,000 – 81.36 –
Interest income 18 1,170,158 1,403,851 1.73 1.94
Receipt of loan from subsidiaries (11,815,877) 6,419,375 (17.46) 8.89
Net cash used in investing activities 44,307,313 7,782,966 65.48 10.78
Financing activities – –
Interest expense 18 (1,346,372) (1,986,794) (1.99) (2.75)
(Repayment) / receipt of term loan (29,098,783) 17,777,380 (43.01) 24.62
Net cash (used in) / generated from fi nancing activities (30,445,155) 15,790,586 (44.99) 21.87
Net increase / (decrease) in cash and cash equivalents 4,569,421 13,049,030 6.75 18.07
Cash and cash equivalents, beginning of the year 9 (1,379,818) (14,428,848) (2.04) (19.99)
Cash and cash equivalents, end of the year 9 3,189,603 (1,379,818) 4.71 (1.91)
STATEMENT OF CASH FLOWS
Note: The exchange rate use to convert AED to Rs.<14.779>/(Previous year AED to Rs.<13.851>)
199
MARICO MIDDLE EAST FZE
1 Legal status and activities
Marico Middle East FZE (“the company”) was incorporated in the Jebel Ali Free Zone, on 8 November 2005 as a Free Zone Establishment and operates under a trade license issued by the Jebel Ali Free Zone Authority. The registered address of the company is PO Box 50394, Dubai, United Arab Emirates.
The principal activity of the company is the trading of beauty and personal care, hair care, food and health care products, dried vegetables and fruits and equipments. The company is a wholly owned subsidiary of Marico Limited (“the parent company”), a company incorporated in India and listed on Bombay Stock Exchange Limited and National Stock Exchange of India Limited.
2 Going concern
At 31 March 2013, the company had net current liabilities of AED 48,741,337 and negative equity of AED 17,095,050. The ability of the company to continue as a going concern is contingent on the continued support of the parent company who has confi rmed its intention to continue to provide fi nancial support to the company for a period of at least twelve months from the date of approval of these fi nancial statements.
3 Summary of signifi cant accounting policies
The signifi cant accounting policies applied in the preparation of these fi nancial statements are set out below. These policies have been consistently applied to all the years presented, unless otherwise stated.
3.1 Basis of preparation
These fi nancial statements have been prepared in accordance with and comply with International Financial Reporting Standards (“IFRS”). These fi nancial statements have been prepared under the historical cost convention.
The company has prepared these separate fi nancial statements for statutory fi ling purposes. These fi nancial statements, however, do not include the results of the operations and the assets and liabilities of its subsidiaries (Note 7) which is a departure from the requirements of the International Accounting Standard 27, “Consolidated and Separate fi nancial statements” (”IAS27”). The fi nancial information of the company and its subsidiaries is consolidated into the ultimate holding company which prepares fi nancial statements in accordance with Indian Generally Accepted Accounting Principles (“IGAAP”). However, the exemption from preparing consolidated fi nancial statements included in IAS 27 is not applicable since the ultimate holding company prepares consolidated fi nancial statements in accordance with IGAAP and not IFRS.
The preparation of fi nancial statements in conformity with IFRS requires the use of certain critical accounting estimates. It also requires management to exercise its judgement in the process of applying the company’s accounting policies. The areas involving a higher degree of judgement or complexity, or areas where assumptions and estimates are signifi cant to the fi nancial statements are disclosed in Note 5.
3 Summary of signifi cant accounting policies(continued)
3.1 Basis of preparation(continued)
(a) New and amended standards adopted by the company
There are no IFRSs or IFRIC interpretations that are effective for the fi rst time for the fi nancial year beginning on or after 1 April 2012 that would be expected to have a material impact on the company.
(b) New standards and interpretations not yet adopted
A number of new standards and amendments to standards and interpretations areeffective for annual periods beginning after 1 April 2012, and have not beenapplied in preparing these consolidated fi nancial statements. None of these isexpected to have a signifi cant effect on the consolidated fi nancial statements of thecompany, except the following set out below:
NOTES TO THE FINANCIAL STATEMENTSFor the year ended 31 March 2013

200
MARICO MIDDLE EAST FZE
NOTES TO THE FINANCIAL STATEMENTSFor the year ended 31 March 2013
• IFRS 13, ‘Fair value measurement’, aims to improve consistency and reduce complexity by providing a precise defi nition of fair value and a single source of fair value measurement and disclosure requirements for use across IFRSs.
There are no other IFRSs or IFRIC interpretations that are not yet effective that wouldbe expected to have a material impact on the company.
3.2 Property and equipment
Property and equipmentare stated at cost less accumulated depreciation. The cost of Property and equipmentrepresents the purchase cost together with any incidental expenses on acquisition. Subsequent costs are included in the asset’s carrying amount or recognised as a separate asset, as appropriate, only when it is probable that future economic benefi ts associated with the item will fl ow to the company and the cost of the item can be measured reliably. All other repairs and maintenance costs are charged to the income statement during the fi nancial year in which they are incurred.
Depreciation is computed using the straight line method at rates calculated to reduce the cost of assets to their estimated residual values over their expected useful lives, as follows:
Years
Equipments 3
Fixtures and fi ttings 8
Motor vehicles 10
The assets’ residual values and useful lives are reviewed, and adjusted if appropriate, at each balance sheet date. An asset’s carrying amount is written down immediately to its recoverable amount if the asset’s carrying amount is greater than its estimated recoverable amount.
Gains and losses on disposals are determined by comparing proceeds with carrying amount.
These are included in the income statement.
3.3 Investments in subsidiaries
Subsidiaries are those entities over which the company has the power to govern the fi nancial and operating policies generally accompanying a shareholding of more than one half of the voting rights.
Investments in subsidiaries are stated at cost less provision for any impairment in value.
3.4 Impairment of non-fi nancial assets
Assets that are subject to amortisation are reviewed for impairment whenever events or changes in circumstances indicate that the carrying amount may not be recoverable. An impairment loss is recognised for the amount by which the asset’s carrying amount exceeds its recoverable amount. The recoverable amount is the higher of an asset’s fair value less costs to sell and value in use. For the purposes of assessing impairment, assets are grouped at the lowest levels for which there are separately identifi able cash fl ows (cash-generating units). Non-fi nancial assets that suffered an impairment are reviewed for possible reversal of the impairment at each reporting date.
3.5 Financial assets
The classifi cation of fi nancial assets depends on the purpose for which the assets were acquired. Management determines the classifi cation of its fi nancial assets at initial recognition. The company currently classifi es its fi nancial assets as loans and receivables.

201
MARICO MIDDLE EAST FZE
Loans and receivables
Loans and receivables are non-derivative fi nancial assets with fi xed or determinable payments that are not quoted in an active market. These are initially measured at fair value and carried at amortised cost less provision for impairment. The amortised cost is computed using the effective interest method. They are included in current assets, except for maturities greater than twelve months after the balance sheet date. These are classifi ed as non-current assets. The company’s loans and receivables comprise fi xed deposits, trade and other receivables (excluding prepayments),due from related parties, and cash and bank balances.
Recognition and measurement
Regular purchases and sales of fi nancial assets are recognised on the trade-date, the date on which the company commits to purchase or sell the asset. Financial assets are derecognised when the rights to receive cash fl ows from the investments have expired or have been transferred and the company has transferred substantially all risks and rewards of ownership.
Offsetting fi nancial instruments
Financial assets and liabilities are offset and the net amount reported in the balancesheet when there is a legally enforceable right to offset the recognised amounts andthere is an intention to settle on a net basis or realise the asset and settle the liabilitysimultaneously.
Impairment of fi nancial assets
The company assesses at the end of each reporting period whether there is objective evidence that a fi nancial asset or group of fi nancial assets is impaired. A fi nancial asset or a group of fi nancial assets is impaired and impairment losses are incurred only if there is objective evidence of impairment as a result of one or more events that occurred after the initial recognition of the asset (a ‘loss event’) and that loss event (or events) has an impact on the estimated future cash fl ows of the fi nancial asset or group of fi nancial assets that can be reliably estimated.
Evidence of impairment may include indications that the debtors or a group of debtors is experiencing signifi cant fi nancial diffi culty, default or delinquency in interest or principal payments, the probability that they will enter bankruptcy or other fi nancial reorganisation, and where observable data indicate that there is a measurable decrease in the estimated future cash fl ows, such as changes in arrears or economic conditions that correlate with defaults.
For loans and receivables category, the amount of the loss is measured as the difference between the asset’s carrying amount and the present value of estimated future cash fl ows (excluding future credit losses that have not been incurred) discounted at the fi nancial asset’s original effective interest rate. The carrying amount of the asset is reduced and the amount of the loss is recognised in the consolidated income statement. If a loan or held-to-maturity investment has a variable interest rate, the discount rate for measuring any impairment loss is the current effective interest rate determined under the contract. As a practical expedient, the company may measureimpairment on the basis of an instrument’s fair value using an observable marketprice.
If, in a subsequent period, the amount of the impairment loss decreases and thedecrease can be related objectively to an event occurring after the impairment wasrecognised (such as an improvement in the debtor’s credit rating), the reversal of thepreviously recognised impairment loss is recognised in the incomestatement.
3.6 Trade receivables
Trade receivables are amounts due from customers for merchandise sold in the ordinary course of business. If collection is expected in one year or less (or in the normal operating cycle of the business if longer), they are classifi ed as current assets. If not, they are presented as non-current assets.
Trade receivables are recognised initially at fair value and subsequently measured at amortised cost using the effective interest method, less provision for impairment.
NOTES TO THE FINANCIAL STATEMENTSFor the year ended 31 March 2013

202
MARICO MIDDLE EAST FZE
NOTES TO THE FINANCIAL STATEMENTSFor the year ended 31 March 2013
3.7 Inventories
Inventories are stated at the lower of cost and net realisable value. Cost is determined using the fi rst-in fi rst-out (FIFO) method and includes all costs incurred in acquiring the inventories and bringing them to their present location and condition. Net realisable value is the estimate of the selling price in the ordinary course of business, less variable selling expenses, if any.
3.8 Borrowings
Borrowings are recognised initially at fair value, net of transaction costs incurred. Borrowings are subsequently stated at amortised cost; any difference between the proceeds (net of transaction costs) and the redemption value is recognised in the statement of comprehensive income over the period of the borrowings using the effective interest method.
Borrowings are classifi ed as current liabilities unless the company has an unconditional right to defer settlement of the liability for at least twelve months after the balance sheet date.
3.9 Borrowing costs
General and specifi c borrowing costs directly attributable to the acquisition,construction or production of qualifying assets, which are assets that necessarilytake a substantial period of time to get ready for their intended use or sale, are addedto the cost of those assets, until such time as the assets are substantially ready fortheir intended use or sale.
Investment income earned on the temporary investment of specifi c borrowingspending their expenditure on qualifying assets is deducted from the borrowing costseligible for capitalisation.
All other borrowing costs are recognised in the income statement in the period in which theyare incurred.
3.10 Trade payables and provisions
Trade payables are obligations to pay for goods or services that have been acquiredin the ordinary course of business from suppliers. Accounts payable are classifi ed ascurrent liabilities if payment is due within one year or less (or in the normal operatingcycle of the business if longer). If not, they are presented as non-current liabilities.
Trade payables are recognised initially at fair value and subsequently measured atamortised cost using the effective interest method.
3.11 Provisions
Provisions are recognised when the company has a present legal or constructive obligation as a resultof past events; it is probable that an outfl ow of resources will be required to settle theobligation; and the amount has been reliably estimated.Provisions are not recognised for future operating losses.
Where there are a number of similar obligations, the likelihood that an outfl ow will berequired in settlement is determined by considering the class of obligations as awhole. A provision is recognised even if the likelihood of an outfl ow with respect toany one item included in the same class of obligations may be small.
Provisions are measured at the present value of the expenditures expected to berequired to settle the obligation using a pre-tax rate that refl ects current marketassessments of the time value of money and the risks specifi c to the obligation. Theincrease in the provision due to passage of time is recognised as interest expense.
3.12 Provision for employees’ benefi ts
A provision is made for the estimated liability for employees’ entitlements to annual leave and leave passage as a result of services rendered by the employees up to the balance sheet date. Provision is also made, using actuarial techniques, for the end of service benefi ts due to employees in accordance with UAE labour law and labour regulations of Jebel Ali Free Zone Authority.

203
MARICO MIDDLE EAST FZE
The provision relating to annual leave and leave passage is included in trade and other payables, while that relating to employees’ end of service benefi ts is disclosed as a non-current liability.
3.13 Revenue recognition
Revenue is measured at the fair value of the consideration received or receivable,and represents amounts receivable for goods supplied, stated net of discounts and returns. The company recognises revenue when the amount ofrevenue can be reliably measured; when it is probable that future economic benefi tswill fl ow to the entity; and when specifi c criteria have been met, as described below. The company bases its estimate of return on historicalresults, taking into consideration the type of customer, the type of transaction andthe specifi cs of each arrangement.
(a) Sales of goods – wholesale
The company sells a range of consumer goods in the wholesalemarket. Sales of goods are recognised when the goods are shipped to the wholesaler, the wholesaler has full discretion over the channel and price to sellthe products, and there is no unfulfi lled obligation that could affect the wholesaler’sacceptance of the products.
(b) Interest income
Interest income is recognised using the effective interest method. When a loan andreceivable is impaired, the company reduces the carrying amount to its recoverableamount, being the estimated future cash fl ow discounted at the original effectiveinterest rate of the instrument, and continues unwinding the discount as interestincome. Interest income on impaired loan and receivables is recognised using theoriginal effective interest rate.
3.14 Foreign currency translation
(a) Functional and presentation currency
Items included in the fi nancial statements are measured using the currency of the primary economic environment in which the entity operates (‘the functional currency’). The fi nancial statements are presented in UAE Dirhams (“AED”), which is the Company’s functional and presentation currency.
(b) Transactions and balances
Foreign currency transactions are translated into the functional currency using the exchange rates prevailing at the dates of the transactions. Foreign exchange gains and losses resulting from the settlement of such transactions and from the translation at year-end exchange rates of monetary assets and liabilities denominated in foreign currencies are recognised in the income statement, except when deferred in equity as qualifying for cash fl ow hedges and qualifying net investment hedges.
Balances and transactions denominated in US dollars (“USD”) have been translated into the presentation currency at a fi xed rate as the exchange rate of AED to USD has been pegged since 1981.
3.15 Cash and cash equivalents
Cash and cash equivalents comprise cash on hand and balancein current accounts.
3.16 Leases
Leases in which signifi cant portion of risks and rewards of ownership are retained by the lessor are classifi ed as operating leases. Payments made under operating leases (net of any incentives received from the lessor) are charged to the income statement on a straight-line basis over the period of the lease.
4 Financial risk management
4.1 Financial risk factors
The company’s activities expose it to a variety of fi nancial risks: market risk (including currency risk, price risk and cash fl ow and fair value interest rate risk), credit risk and liquidity risk.
NOTES TO THE FINANCIAL STATEMENTSFor the year ended 31 March 2013
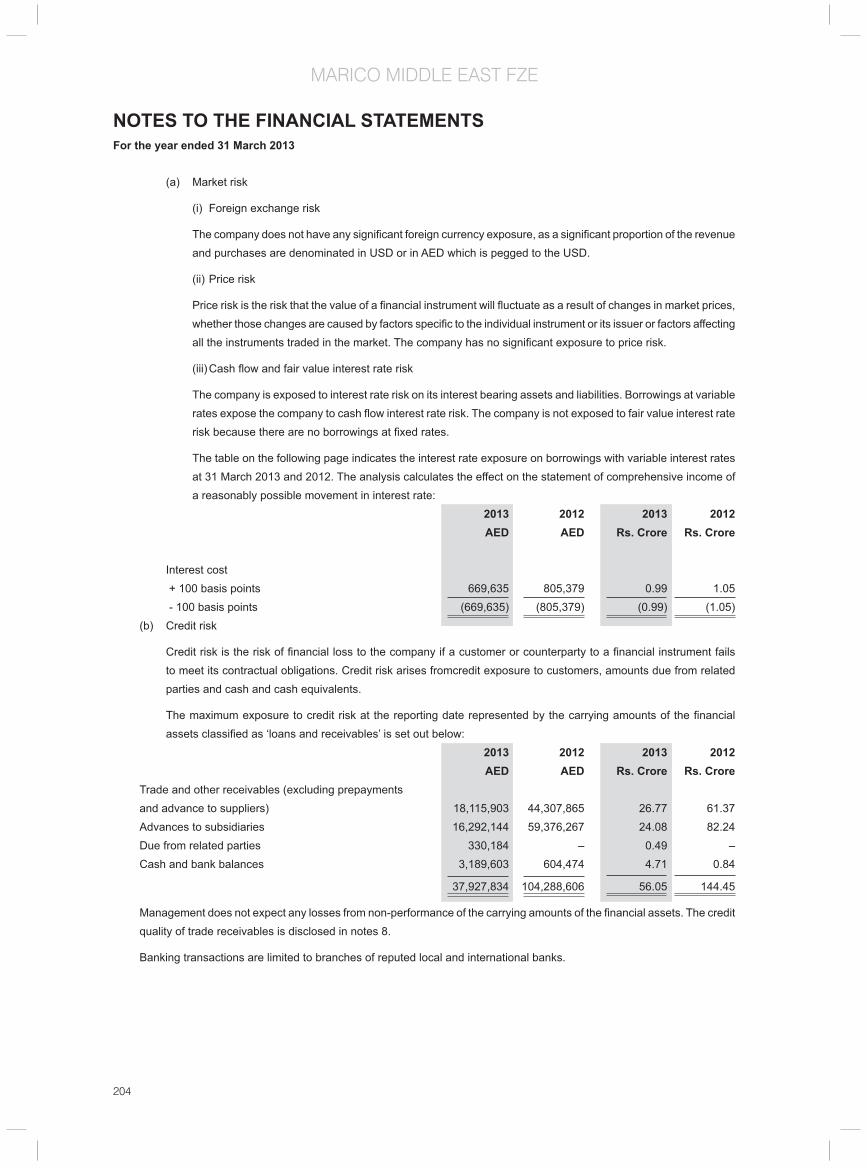
204
MARICO MIDDLE EAST FZE
(a) Market risk
(i) Foreign exchange risk
The company does not have any signifi cant foreign currency exposure, as a signifi cant proportion of the revenue and purchases are denominated in USD or in AED which is pegged to the USD.
(ii) Price risk
Price risk is the risk that the value of a fi nancial instrument will fl uctuate as a result of changes in market prices, whether those changes are caused by factors specifi c to the individual instrument or its issuer or factors affecting all the instruments traded in the market. The company has no signifi cant exposure to price risk.
(iii) Cash fl ow and fair value interest rate risk
The company is exposed to interest rate risk on its interest bearing assets and liabilities. Borrowings at variable rates expose the company to cash fl ow interest rate risk. The company is not exposed to fair value interest rate risk because there are no borrowings at fi xed rates.
The table on the following page indicates the interest rate exposure on borrowings with variable interest rates at 31 March 2013 and 2012. The analysis calculates the effect on the statement of comprehensive income of a reasonably possible movement in interest rate:
2013 2012 2013 2012 AED AED Rs. Crore Rs. Crore
Interest cost + 100 basis points 669,635 805,379 0.99 1.05 - 100 basis points (669,635) (805,379) (0.99) (1.05) (b) Credit risk
Credit risk is the risk of fi nancial loss to the company if a customer or counterparty to a fi nancial instrument fails to meet its contractual obligations. Credit risk arises fromcredit exposure to customers, amounts due from related parties and cash and cash equivalents.
The maximum exposure to credit risk at the reporting date represented by the carrying amounts of the fi nancial assets classifi ed as ‘loans and receivables’ is set out below:
2013 2012 2013 2012 AED AED Rs. Crore Rs. Crore Trade and other receivables (excluding prepayments and advance to suppliers) 18,115,903 44,307,865 26.77 61.37 Advances to subsidiaries 16,292,144 59,376,267 24.08 82.24 Due from related parties 330,184 – 0.49 – Cash and bank balances 3,189,603 604,474 4.71 0.84
37,927,834 104,288,606 56.05 144.45
Management does not expect any losses from non-performance of the carrying amounts of the fi nancial assets. The credit quality of trade receivables is disclosed in notes 8.
Banking transactions are limited to branches of reputed local and international banks.
NOTES TO THE FINANCIAL STATEMENTSFor the year ended 31 March 2013

205
MARICO MIDDLE EAST FZE
The table below shows the credit quality of cash and bank balances with external counterparties at the balance sheet date:
2013 2012 2013 2012 AED AED Rs. Crore Rs. Crore
Cash at bank with credit rating (Moody’s) A2 342 – – – Not rated 3,183,040 539,434 4.70 0.75 Cash on hand 6,221 65,040 0.01 0.09 Total 3,189,603 604,474 4.71 0.84
(c) Liquidity risk
Prudent liquidity risk management implies maintaining suffi cient cash and the availability of funding through an adequate amount of committed credit facilities. The company maintains fl exibility in funding by keeping committed credit lines available.
The table below analyses the company’s fi nancial liabilities classifi ed as ‘other liabilities’ into relevant maturity groupings based on the remaining period at the balance sheet date to the contractual maturity date. Balances due within 12 months equal their carrying balances as the impact of discounting is not signifi cant.
Carrying amount
Contractual cash fl ows
Less than 1 year
Between1 and 5 years
Over 5 years
AED AED AED AED AED
At 31 March 2013Trade and other payables (excluding advances from customers)
26,790,502 26,790,502 26,790,502 – –
Due to related parties 10,240,934 10,240,934 10,240,934 – –
Bank borrowings 51,422,000 52,945,805 52,945,805 – –
88,453,436 89,977,241 89,977,241 – –
Carrying amount
Contractual cash fl ows
Less than 1 year
Between1 and 5 years
Over 5 years
Rs.Crore Rs.Crore Rs.Crore Rs.Crore Rs.Crore
At 31 March 2013Trade and other payables (excluding advances from customers)
39.59 39.59 39.59 – –
Due to related parties 15.14 15.14 15.14 – –
Bank borrowings 76.00 78.25 78.25 – –
130.73 132.98 132.98 – –
13.851
Carrying amount
Contractual cash fl ows
Less than 1 year
Between1 and 5 years
Over 5 years
AED AED AED AED AED
At 31 March 2012Trade and other payables 16,406,013 16,406,013 16,406,013 - -
Due to related parties 19,223,283 19,223,283 19,223,283 - -
Bank borrowings 82,505,075 83,851,447 83,851,447 - -
118,134,371 119,480,743 119,480,743 - -
NOTES TO THE FINANCIAL STATEMENTSFor the year ended 31 March 2013

206
MARICO MIDDLE EAST FZE
NOTES TO THE FINANCIAL STATEMENTSFor the year ended 31 March 2013
Carrying amount
Contractual cash fl ows
Less than 1 year
Between1 and 5 years
Over 5 years
Rs.Crore Rs.Crore Rs.Crore Rs.Crore Rs.Crore
At 31 March 2012Trade and other payables 22.72 22.72 22.72 – –
Due to related parties 26.63 26.63 26.63 – –
Bank borrowings 114.28 116.14 116.14 – –
163.63 165.49 165.49 – –
(d) Capital risk management
The company’s objectives when managing capital are to safeguard the company’s ability to continue as a going concern in order to provide returns to its shareholder and benefi ts for other stakeholders and to maintain an optimal capital structure to reduce the cost of capital. In order to maintain or adjust the capital structure, the company may raise cash calls from its existing shareholder to increase or decrease its share capital.
The company monitors capital on the basis of the gearing ratio. This ratio is calculated as net debt divided by shareholder’s funds. Net debt represents ‘bank borrowings’less ‘cash and bank balances’ as shown in the balance sheet. Total capital is calculated as ‘equity’ as shown in the balance sheet plus net debt.
2013 2012 2013 2012 AED AED Rs. Crore Rs. Crore Total borrowings 51,422,000 82,505,075 76.00 114.28 Less: cash and bank balances (3,189,603) (604,474) (4.71) (0.84) Net debt 48,232,397 81,900,601 71.28 113.44 Total equity (17,095,050) 20,266,411 (25.26) 28.07 Total shareholder’s funds 31,137,347 102,167,012 46.02 141.51 Gearing ratio 155% 80%4.2 Fair value estimation
At 31 March 2013 and 2012, the carrying amount of fi nancial assets and liabilities of the company approximate their fair values.
5 Critical accounting estimates and judgements
Estimates and judgements are continually evaluated and are based on historical experience and other factors, including expectations of future events that are believed to be reasonable under the circumstances.
5.1 Critical accounting estimates and assumptions
The company makes estimates and assumptions concerning the future. The resulting accounting estimates will, by defi nition, seldom equal the related actual results.
(a) Impairment of investmentsin subsidiaries
The company follows the guidance of IAS 39 to determine when an investment in a subsidiary is impaired. This determination requires signifi cant judgement. In making this judgement, the company evaluates, among other factors, the duration and extent to which the fair value of an investment is less than its cost; and the fi nancial health of and business outlook for the investee, including factors such as industry and sector performance, changes in technology and operational and fi nancing cash fl ow.

207
MARICO MIDDLE EAST FZE
6 Property and equipment
Equipments, fi xture and
fi ttings
Motor vehicles
Total Equipments, fi xture and
fi ttings
Motor vehicles
Total
AED AED AED Rs. Crore Rs. Crore Rs. CroreCost
At 1 April 2011 835,787 47,545 883,332 1.16 0.07 1.22
Additions 40,260 – 40,260 0.06 0.06
Disposals (153,044) – (153,044) (0.21) (0.21)
At 31 March 2012 723,003 47,545 770,548 1.07 0.07 1.14
Additions 56,342 40,626 96,968 0.08 0.06 0.14
Disposals (22,101) – (22,101) (0.03) (0.03)
At 31 March 2013 757,244 88,171 845,415 1.12 0.13 1.25
Depreciation
At 1 April 2011 164,443 17,691 182,134 0.23 0.02 0.25
Charge for the year 124,210 4,518 128,728 0.17 0.01 0.18
Disposals (65,590) – (65,590) (0.09) (0.09)
At 31 March 2012 223,063 22,209 245,272 0.31 0.03 0.34
Charge of the year 135,861 5,194 141,055 0.20 0.01 0.21
Disposals (4,039) – (4,039) (0.01) (0.01)
At 31 March 2013 354,885 27,403 382,288 0.52 0.04 0.56
Net book amount
At 31 March 2013 402,359 60,768 463,127 0.59 0.09 0.68
At 31 March 2012 499,940 25,336 525,276 0.69 0.04 0.73
7 Investments in subsidiaries 2013 2012 2013 2012 AED AED Rs. Crore Rs. Crore Kaya Middle East FZE – 150,000 – 0.21 MEL Consumer Care Company 162,016 162,016 0.24 0.22 Egypt American Investment and Industrial Development Company (EAIIDC) 12,551,836 12,551,836 18.55 17.39 MBL Industries Limited 53,971 53,971 0.08 0.07 Marico Malaysia SDN. BHD 19,084,000 19,084,000 28.20 26.43 31,851,823 32,001,823 47.07 44.33
The company holds Nil % (2012: 100%) of the share capital of Kaya Middle East FZE, a free zone establishment operating in the United Arab Emirates under a trade license issued in Sharjah. During the year an advance given to Kaya Middle East FZE was converted to equity and the complete investment sold to a related party at the revised carrying value of AED 55,050,000.
The company also holds 100% (2012: 100%) of the share capital of MEL Consumer Care Company, an Egyptian Joint Stock company.
The company holds 100% (2012: 100%) of the share capital of EAIIDC, a company registered in Egypt.
The company also holds 100% (2012: 100%) of the share capital of MBL Industries Limited, a company registered in Bangladesh.
The company holds 100% (2012: 100%) of the share capital of Marico Malaysia SDN. BHD, a company registered in Malaysia.
NOTES TO THE FINANCIAL STATEMENTSFor the year ended 31 March 2013

208
MARICO MIDDLE EAST FZE
The management of the company carried out an impairment review of the carrying amount of its investments in its subsidiaries and does not consider them to be impaired as at 31 March 2013 and 31 March 2012.
8 Trade and other receivables 2013 2012 2013 2012 AED AED Rs. Crore Rs. Crore Trade receivables 16,554,968 41,690,535 24.47 57.75 Provision for impairment of trade receivables – (29,323) – (0.04) 16,554,968 41,661,212 24.47 57.70 Advances to suppliers 835,614 – 1.23 – Prepayments 1,173,260 1,993,794 1.73 2.76 Other receivables 1,560,935 2,617,330 2.31 3.63 20,124,777 46,272,336 29.74 64.09
At 31 March 2013, the company faced a concentration of credit risk with four customers (2012: four customers) accounting for 82% (2012: 79%) of trade receivables at that date.
As of 31 March 2013, trade receivables of AED15,203,361(2012: AED 40,883,834) were fully performing.
Trade receivables that are less than one year past due are not considered impaired. As of 31 March 2013, trade receivables of AED 1,351,607(2012: AED777,378) were past due but not impaired. These relate to a number of independent customers for whom there is no recent history of default. The ageing analysis of these trade receivables is as follows:
2013 2012 2013 2012 AED AED Rs. Crore Rs. Crore 0 - 3 months 1,351,607 284,151 2.00 0.39 Above 3 months – 493,227 – 0.68 1,351,607 777,378 2.00 1.08
Movement in the company’s provision for impairment of trade receivables is as follows:
2013 2012 2013 2012 AED AED Rs. Crore Rs. Crore At 1 April 29,323 360,808 0.04 0.50 Write-off of trade receivables (294,292) (360,808) (0.43) (0.50) Charge for the year (Note 17) 264,969 29,323 0.39 0.04 At 31 March – 29,323 – 0.04
The other classes within trade and other receivables do not contain impaired assets.
The maximum exposure to credit risk at the reporting date is the carrying amount of each class of receivable mentioned above.
The carrying amount of trade and other receivables are either denominated in AED or USD and approximate their fair value. The company does not hold any collateral as security.
NOTES TO THE FINANCIAL STATEMENTSFor the year ended 31 March 2013

209
MARICO MIDDLE EAST FZE
9 Advances to subsidiaries 2013 2012 2013 2012 AED AED Rs. Crore Rs. Crore
Advances to subsidiaries Kaya Middle East FZE (Note 9.1) – 44,140,625 – 61.14 MEL Consumer Care Company (Note 9.2) 6,578,106 6,578,106 9.72 9.11 Egypt American Investment and Industrial Development Company (EAIIDC) (Note 9.2) 7,145,038 7,145,038 10.56 9.90 Marico Malaysia SDN. BHD (Note 9.3) 2,569,000 1,512,498 3.80 2.09 16,292,144 59,376,267 24.08 82.24
9.1 This represented a long term advancegiven and carried interest rate of LIBOR+2.5%. During the year and additional AED 10,759,375 was advanced to this related party and the increased carrying value of AED 54,900,000 was converted to equity.
9.2 These represent interest free advances repayable within one year.
9.3 This represents a short term advance witha fi xed rate of interest of 5% and repayable within one year.
10 Related party transactions and balances
Related parties comprise the shareholder and directors of the company, associated companies and key management personnel.
(a) Related party transactions
During the year, the following signifi cant transactions were carried out with related parties: 2013 2012 2013 2012 AED AED Rs. Crore Rs. Crore Related party transactions
Purchases of goods 35,482,845 60,046,761 52.44 83.17
Sale of goods 19,093,458 39,632,063 28.22 54.89
Royalty expense 1,274,430 2,784,511 1.88 3.86
Sale of investment in Kaya Middle East FZE 55,050,000 – 81.36 –
Key management remuneration (including end of service benefi ts of AED 52,952 (2012: AED 30,707) 2,154,824 1,447,982 3.18 2.01
Amount advanced 11,815,877 – 17.46 –
(b) Related party balances
The company maintains signifi cant balances with the related parties which arise in the normal course of business from transactions that are carried out at terms mutually agreed between the parties.
NOTES TO THE FINANCIAL STATEMENTSFor the year ended 31 March 2013

210
MARICO MIDDLE EAST FZE
NOTES TO THE FINANCIAL STATEMENTSFor the year ended 31 March 2013
2013 2012 2013 2012 AED AED Rs. Crore Rs. Crore
Due from related parties
Affi liates 330,184 – 0.49 –
Due to related parties
Parent company 10,172,610 19,223,283 15.03 26.63
Affi liates 68,324 – 0.10 –
10,240,934 19,223,283 15.14 26.63
Advances to related parties
Subsidiaries 16,292,144 59,376,267 24.08 82.24
11 Cash and cash equivalents 2013 2012 2013 2012 AED AED Rs. Crore Rs. Crore
Cash at bank 3,183,382 539,434 4.70 0.75
Cash on hand 6,221 65,040 0.01 0.09
Cash and bank balances 3,189,603 604,474 4.71 0.84
Cash and cash equivalents include the following for the purposes of the statement of cash fl ows:
2013 2012 2013 2012 AED AED Rs. Crore Rs. Crore
Cash and bank balances 3,189,603 604,474 4.71 0.84
Bank overdrafts (Note 15) – (1,984,292) – (2.75)
Cash and cash equivalents 3,189,603 (1,379,818) 4.71 (1.91)
12 Share capital
Share capital comprises twenty-two shares of AED 1 million each (2012: twenty-two shares of AED 1 million each), which is fully paid up.
13 Employees’ end of service benefi ts
2013 2012 2013 2012 AED AED Rs. Crore Rs. Crore
At 1 April 379,394 436,734 0.56 0.60
Charge for the year (Note 16) 354,891 217,769 0.52 0.30
Payments (65,622) (275,109) (0.10) (0.38)
At 31 March 668,663 379,394 0.99 0.53
In accordance with the provisions of IAS 19, management has carried out an exercise to assess the present value of its obligation at 31 March 2013, using the projected unit credit method, in respect of employees’ end of service benefi ts payable under the labour regulations issued by Jebel Ali Free Zone Authority. Under this method, an assessment has been made of an employee’s expected service life with the company and the expected basic sa lary at the date of leaving the service. Management has assumed average increment/promotion costs 5% (2012: 5%). The expected liability at the date of leaving the service has been discounted to its net present value using a discount rate of 8% (2012: 4.25%).

211
MARICO MIDDLE EAST FZE
14 Trade and other payables
2013 2012 2013 2012 AED AED Rs. Crore Rs. Crore
Trade payables 3,504,128 331,690 5.18 0.46
Advances from customers 393,396 – 0.58 –
Accruals and other payables 23,286,374 16,074,323 34.41 22.26
27,183,898 16,406,013 40.18 22.72
15 Bank borrowings
2013 2012 2013 2012 AED AED Rs. Crore Rs. Crore
Term loan 51,422,000 80,520,783 76.00 111.53
Overdrafts (Note 11) – 1,984,292 – 2.75
51,422,000 82,505,075 76.00 114.28
Bank borrowings representterm loan and overdrafts availed from the banks for the purchases made by the company and these are repayable within 365 days from the date of issue. During the year, the interest rate on these bank borrowings ranged from LIBOR+0.9% to LIBOR+2.5% per annum (2012: LIBOR+0.7% to LIBOR+4.75%). These bank borrowings are secured by a standby letter of credit issued by the parent company.
16 Staff costs
2013 2012 2013 2012 AED AED Rs. Crore Rs. Crore
Salaries and wages 3,988,385 3,001,835 5.89 4.16
End of service benefi ts (Note 13) 354,891 217,769 0.52 0.30
Other benefi ts 6,844,256 6,201,690 10.12 8.59
11,187,532 9,421,294 16.53 13.05 17 Other expenses
2013 2012 2013 2012 AED AED Rs. Crore Rs. Crore
Selling expenses 37,588,040 37,124,528 55.55 51.42
Rent expense 442,653 438,619 0.65 0.61
Provision for doubtful debt 264,969 29,323 0.39 0.04
Loss on disposal of equipments 18,062 87,454 0.03 0.12
Other expenses 6,447,102 8,851,560 9.53 12.26
44,760,826 46,531,484 66.15 64.45 18 Finance income/(costs)
2013 2012 2013 2012 AED AED Rs. Crore Rs. Crore Finance costs Interest on bank borrowings (1,346,372) (1,986,794) (1.99) (2.75) Finance income Interest income on loans and advances 1,170,158 1,403,851 1.73 1.94
(176,214) (582,943) (0.26) (0.81)
NOTES TO THE FINANCIAL STATEMENTSFor the year ended 31 March 2013

212
MARICO MIDDLE EAST FZE
19 Commitments
(a) Operating lease commitments
The company had contracted to lease offi ce premises for a period of fi ve years until 15March 2015under non-cancellable operating lease agreements.Minimum lease payments under the leases are as follows:
2013 2012 2013 2012 AED AED Rs. Crore Rs. Crore
Not later than 1 year 400,231 137,063 0.59 0.19
2 to 5 years 252,900 505,800 0.37 0.70
653,131 642,863 0.97 0.89
(b) Other commitments
Commitments for services to be received at reporting period end were Nil (2012: AED 263,210).
20 Financial instruments by category
The As of 31March2013 and 2012, fi nancial assets comprised trade and other receivables (excluding prepayments and advance to suppliers), due from related parties and cash and bank balances. These fi nancial assets are classifi ed as loans and receivables. Financial liabilities comprised trade and other payables (excluding advance from customers), bank borrowings and due to related parties. These fi nancial liabilities are classifi ed as other fi nancial liabilities.
2013 2012 2013 2012 AED AED Rs. Crore Rs. Crore Financial assets - Loans and receivables
Trade receivables and other receivables (excluding prepayments and advance to suppliers) 18,115,903 44,307,865 26.77 61.37
Advances to subsidiaries 16,292,144 59,376,267 24.08 82.24
Due from related parties 330,184 – 0.49 –
Cash and bank balances 3,189,603 604,474 4.71 0.84
37,927,834 104,288,606 56.05 144.45
Financial liabilities - Other fi nancial liabilities
Trade and other payables (excluding advances from customers) 26,790,502 16,406,013 39.59 22.72
Due to related parties 10,240,934 19,223,283 15.14 26.63
Bank borrowings 51,422,000 82,505,075 76.00 114.28
88,453,436 118,134,371 130.73 163.63
21 Reclassifi cation
For the year ended 31 March 2012 AED 15,997,040 has been reclassifi ed from ‘trade and other payables’ (Note 14) to ‘due to related party’ (Note 10) to bring consistency with the current year presentation.
NOTES TO THE FINANCIAL STATEMENTSFor the year ended 31 March 2013

213213
KAYA MIDDLE EAST FZE
Board of Directors Vijay S. Subramaniam Debashish Neogi Kaustubh R Roplekar
Secretary, Manager, Negotiator Kaustubh R Roplekar (w.e.f. March 4, 2013)
Registered Offi ce Offi ce Bldg. 2, F-30, & 13 G - 04, P.O. Box 41756, Hamriyah Free Zone, Sharjah, UAE
Auditors PricewaterhouseCoopers Chartered Accountants
Bankers Standard Chartered Bank Mashreq Bank
Legal Advisors Galadhari Associates

214
KAYA MIDDLE EAST FZE
214
INDEPENDENT AUDITOR’S REPORTTO
THE SHAREHOLDER OF KAYA MIDDLE EAST FZE
Report on the fi nancial statements
We have audited the accompanying fi nancial statements of KAYA Middle East FZE (“the company”) which comprise the balance sheet as at 31 March 2013, and the statements of comprehensive income, changes in equity and cash fl ows for the year then ended, and a summary of signifi cant accounting policies and other explanatory notes.
Management’s responsibility for the fi nancial statements
Management is responsible for the preparation and fair presentation of these fi nancial statements in accordance with International Financial Reporting Standards, and for such internal control as management determines is necessary to enable the preparation of fi nancial statements that are free from material misstatement, whether due to fraud or error.
Auditor’s responsibility
Our responsibility is to express an opinion on these fi nancial statements based on our audit. We conducted our audit in accordance with International Standards on Auditing. Those standards require that we comply with ethical requirements and plan and perform the audit to obtain reasonable assurance about whether the fi nancial statements are free from material misstatement.
An audit involves performing procedures to obtain audit evidence about the amounts and disclosures in the fi nancial statements. The procedures selected depend on the auditor’s judgement, including the assessment of the risks of material misstatement of the fi nancial statements, whether due to fraud or error. In making those risk assessments, the auditor considers internal control relevant to the entity’s preparation and fair presentation of the fi nancial statements in order to design audit procedures that are appropriate in the circumstances, but not for the purpose of expressing an opinion on the effectiveness of the entity’s internal control. An audit also includes evaluating the appropriateness of accounting policies used and the reasonableness of accounting estimates made by management, as well as evaluating the overall presentation of the fi nancial statements.
We believe that the audit evidence we have obtained is suffi cient and appropriate to provide a basis for our audit opinion.
Opinion
In our opinion, the accompanying fi nancial statements present fairly, in all material respects, the fi nancial position of the company as at 31 March 2013 and its fi nancial performance and its cash fl ows for the year then ended in accordance with International Financial Reporting Standards.
Report on other legal and regulatory requirements
Further, we report that the fi nancial statements of the company comply, in all material respects, with the applicable provisions of the Implementing Rules and Regulations issued Pursuant to Sharjah Emiri Decree No. 6 of 1995, concerning the formation of Free Zone Establishments in the Hamriyah Free Zone.
PricewaterhouseCoopers30th May 2013
Paul SuddabyRegistered Auditor Number 309
Dubai, United Arab Emirates

215215
KAYA MIDDLE EAST FZE
BALANCE SHEET
As at 31 March As at 31 MarchNote 2013 2012 2013 2012
ASSETS AED AED Rs Crores Rs CroresNon-current assets
Property, plant and equipment 5 10,546,274 16,749,506 15.59 23.20
Capital advance – 109,023 – 0.15
10,546,274 16,858,529 15.59 23.35
Current assets 6
Inventories 7 4,659,719 4,851,301 6.89 6.72
Trade and other receivables 8 6,022,090 10,559,902 8.90 14.63
Cash and bank balances 4,493,911 9,706,271 6.64 13.44
15,175,720 25,117,474 22.43 34.79
Total assets 25,721,994 41,976,003 38.01 58.14EQUITY AND LIABILITIESCapital and reservesShare capital 9 55,050,000 150,000 81.36 0.21
Accumulated losses (57,492,198) (44,957,524) (84.97) (62.27)
Total equity (2,442,198) (44,807,524) (3.61) (62.06)Non-current liabilitiesProvision for employees’ end of service benefi ts
10 2,026,250 1,749,952 2.99 2.42
Loan from the shareholder 11 – 44,140,624 – 61.14
2,026,250 45,890,576 2.99 63.56Current liabilitiesBank overdraft 8 – 12,352,618 – 17.11
Trade and other payables 12 25,893,082 27,814,483 38.27 38.53
Due to related parties 11 244,860 725,850 0.36 1.01
26,137,942 40,892,951 38.63 56.64
Total liabilities 28,164,192 86,783,527 41.62 120.20Total equity and liabilities 25,721,994 41,976,003 38.01 58.14
These fi nancial statements were approved by the Board of Directors on 30th May 2013 and signed on its behalf by:
Director
Note: The exchange rate used to convert AED to Rs. <14.779> /(Previous year AED to Rs.<13.851>).

216
KAYA MIDDLE EAST FZE
216
STATEMENT OF COMPREHENSIVE INCOME
As at 31 March As at 31 MarchNote 2013 2012 2013 2012
AED AED Rs Crores Rs CroresRevenue 78,023,790 65,141,789 115.51 84.95
Direct costs 13 (52,601,309) (56,851,618) (77.88) (74.14)
Gross profi t 25,422,481 8,290,171 37.64 10.81
Other operating income 14 2,151 1,712,051 – 2.23
Expenses
Selling and marketing 15 (7,969,309) (9,572,455) (11.80) (12.48)
Administrative and general 16 (28,682,497) (30,760,533) (42.46) (40.11)
Loss from operations (11,227,174) (30,330,766) (16.62) (39.55)
Finance costs 17 (1,307,500) (1,443,548) (1.94) (1.88)
Loss for the year (12,534,674) (31,774,314) (18.56) (41.44)Other comprehensive income – – – –
Total comprehensive loss for the year (12,534,674) (31,774,314) (18.56) (41.44)
Note: The exchange rate used to convert AED to Rs. <14.779> /(Previous year AED to Rs.<13.851>).

217217
KAYA MIDDLE EAST FZE
STATEMENT OF CHANGES IN EQUITY
Note Share capital
Accumulated losses
Total Share capital
Accumulated losses
Total
AED AED AED Rs Crores
Rs Crores
Rs Crores
At 1 April 2011 150,000 (13,183,210) (13,033,210) 0.22 (19.48) (19.26)Comprehensive income
Total comprehensive loss for the year – (31,774,314) (31,774,314) – (46.96) (46.96)At 31 March 2012 150,000 (44,957,524) (44,807,524) 0.22 (66.44) (66.22)Comprehensive income
Total comprehensive loss for the year – (12,534,674) (12,534,674) – (18.52) (18.52)
Transaction with the shareholder
Capital introduced during the year 9 15,566,555 – 15,566,555 23.01 – 23.01
Loan converted to equity 9 39,333,445 – 39,333,445 58.13 – 58.13
At 31 March 2013 55,050,000 (57,492,198) (2,442,198) 81.36 (84.97) (3.61)
Note: The exchange rate used to convert AED to Rs. <14.779> /(Previous year AED to Rs.<13.851>).

218
KAYA MIDDLE EAST FZE
218
STATEMENT OF CASH FLOWS
As at 31 March As at 31 MarchNote 2013 2012 2013 2012
AED AED Rs Crores Rs Crores
Cash fl ows from operating activities
Loss for the year (12,534,674) (31,774,314) (18.52) (44.01)
Adjustments for:
Depreciation 5 4,004,343 4,192,898 5.92 5.81
Impairment of property, plant and equipment 5 4,119,429 830,000 6.09 1.15
Write offs of property, plant and equipment (net) 16 1,083,673 219,089 1.60 0.30
Provision for expired inventory 16 1,129,838 476,000 1.67 0.66
Provision for impairment of advances 16 – 905,000 – 1.25
Provision for employees' end of service benefi ts 10 539,379 712,371 0.80 0.99
Liabilities written back 14 – (1,700,844) – (2.36)
Finance costs 17 1,307,500 1,443,548 1.93 2.00
Operating loss before payment of employees' end of service benefi ts and changes in working capital
(350,512) (24,696,252) (0.52) (34.21)
Payment of employees' end of service benefi ts 10 (263,081) (390,823) (0.39) (0.54)
Changes in working capital:
Inventories before provision for expired inventory (938,256) 955,822 (1.39) 1.32
Trade and other receivables before adjustment for provision
4,537,812 5,771,539 6.71 7.99
Trade and other payables (1,921,401) 18,120,389 (2.84) 25.10
Due to related parties (480,990) (1,476,317) (0.71) (2.04)
583,572 (1,715,642) 0.86 (0.38)
Finance costs paid (1,307,500) (1,443,548) (1.93) (2.00)
Net cash used in operating activities (723,928) (3,159,190) (1.07) (4.38)
Cash fl ows from investing activities
Purchase of property, plant and equipment 5 (3,004,213) (4,024,005) (4.44) (5.57)
Movement in capital advance 109,023 2,543,842 0.16 3.52
Net cash used in investing activities (2,895,190) (1,480,163) (4.28) (2.05)
Cash fl ows from fi nancing activities
Repayment of loan taken from the shareholder (4,807,179) 1,294,498 (7.10) 1.79
Proceeds from issuance of shares 9 15,566,555 – 23.01 –
Net cash provided by fi nancing activities 10,759,376 1,294,498 15.90 1.79
Net increase/(decrease) in cash and cash equivalent
7,140,258 (3,344,855) 10.55 (4.63)
Cash and cash equivalents at beginning of year (2,646,347) 698,508 (3.91) 0.97
Cash and cash equivalents at end of year 8 4,493,911 (2,646,347) 6.64 (3.67)
Note: The exchange rate used to convert AED to Rs. <14.779> /(Previous year AED to Rs.<13.851>).

219219
KAYA MIDDLE EAST FZE
NOTES TO THE FINANCIAL STATEMENTSfor the year ended 31 March 2013
1 General information
KAYA Middle East FZE (the “company”) was incorporated in Sharjah Hamriyah Free Zone on 25 December 2005 as a Free Zone Company with a limited liability in pursuant to Emirate Decree No 6 of 1995 of H. H. Sheikh Dr. Sultan Bin Mohammed Al-Qassimi, Ruler of Sharjah. The principal place of business is P.O. Box 41756, Sharjah, UAE. The company commenced operations on 25 December 2005.
The company is engaged in the business of providing products and services in the area of skin care treatment and aesthetics and import, export, trading in skin care machinery, consumables and products and providing related services.
These fi nancial statements include assets, liabilities and the results of operations of skin care clinics operating in United Arab Emirates, Sultanate of Oman and Kingdom of Saudi Arabia under the local sponsorships.
On 18 March 2013, Marico Middle East FZE (“the parent company”) transferred its 100% shareholding in the company to Derma Rx International Aesthetics Pte Limited. Consequently, the company is a wholly owned subsidiary of “Derma Rx International Aesthetics Pte Limited” (“new parent company”) a company registered in the Singapore. The ultimate parent company is “Marico Limited”, a company registered in India.
2 Summary of signifi cant accounting policies
The principal accounting policies applied in the preparation of these fi nancial statements are set out below. These policies have been consistently applied to all the years presented, unless otherwise stated.
2.1 Going concern
As at 31 March 2013, the company had accumulated losses amounting to AED 57,492,198 INR 84.97 Crore (2012: AED 44,957,524 INR 67.27 Crore) and as of that date, its current liabilities exceeded its current assets by AED 10,962,222 INR 16.20 Crore (2012: AED 15,775,477 INR 21.85 Crore). These conditions indicate the existence of an uncertainty which may cast signifi cant doubt about the company’s ability to continue as a going concern. However, the parent company has confi rmed its intention to provide fi nancial support to the company to enable it to meet its liabilities as they fall due, as well as to carry on its business without signifi cant curtailment of its operations. Accordingly, these fi nancial statements have been prepared on a going concern basis. Further, since the net assets of the company are below 75% of its share capital, the directors will inform the Hamriya Free Zone Authority and remedy the situation in accordance with the Implementation procedures issued by the Hamriya Free Zone Authority pursuant to Sharjah Emiri Decree No. 6 of 1995 in due course.
2.2 Basis of preparation
These fi nancial statements have been prepared in accordance with and comply with International Financial Reporting Standards (“IFRSs”). These fi nancial statements have been prepared under the historical cost convention.
The preparation of fi nancial statements in conformity with IFRS requires the use of certain critical accounting estimates. It also requires management to exercise its judgement in the process of applying the company’s accounting policies. The areas involving a higher degree of judgement or complexity, or areas where assumptions and estimates are signifi cant to the fi nancial statements are disclosed in Note 4.
(a) New and amended standards adopted by the company
There are no IFRSs or IFRIC interpretations that are effective for the fi rst time for the fi nancial year beginning on or after 1 April 2012 that would be expected to have a material impact on the company.
(b) New standards, amendments and interpretations issued but not effective for the periods beginning after 1 April 2012 and are relevant to the company but not early adopted
A number of new standards and amendments to standards and interpretations are effective for annual periods beginning after 1 April 2012, and have not been applied in preparing these fi nancial statements. None of these is expected to have a signifi cant effect on the fi nancial statements of the company, except the following set out below:

220
KAYA MIDDLE EAST FZE
220
NOTES TO THE FINANCIAL STATEMENTSfor the year ended 31 March 2013
• IAS 19 (amendment), 'Employee benefi ts' (effective 1 January 2013);
• IAS 32 (amendment), ‘Financial instruments: Presentation’ on asset and liability offsetting’ (effective 1 January 2014);
• IFRS 7 (amendments), 'Financial instruments: Disclosures' on asset and liability offsetting' (effective 1 January 2013);
• IFRS 9, ‘Financial instruments’ (effective 1 January 2015); and
• IFRS 13, ‘Fair value measurement’ (effective 1 January 2013).
2.3 Foreign currency translation
(a) Functional and presentation currency
Items included in the fi nancial statements of the company are measured using the currency of the primary economic environment in which the company operates (“the functional currency”). The fi nancial statements are presented in United Arab Emirates Dirham (“AED”) which is the company’s functional and presentation currency.
(b) Transactions and balances
Foreign currency transactions are translated into AED using the exchange rates prevailing at the dates of the transactions. Foreign exchange gains and losses resulting from the settlement of such transactions and from the translation at year-end exchange rates of monetary assets and liabilities denominated in foreign currencies are recognised in the statement of comprehensive income.
2.4 Property, plant and equipment
All items of property, plant and equipment is stated at historical cost less accumulated depreciation and impairment. The historical cost of item includes expenditure that is directly attributable to the acquisition of assets. Subsequent costs are included in the asset’s carrying amount or recognised as a separate asset, as appropriate, only when it is probable that future economic benefi ts associated with the item will fl ow to the company and the cost of the item can be measured reliably. The carrying amount of the replaced part is derecognised. All other repairs and maintenance are charged to the statement of comprehensive income during the fi nancial period in which they are incurred.
Depreciation is calculated using the straight-line method to allocate the assets’ cost to their residual values over their estimated useful lives, as follows:
Years
Furniture and fi xtures 3 – 7
Machinery and clinic equipment 1 – 7
Offi ce equipment 2 – 7
Motor vehicles 5 Capital work-in-progress is not depreciated. This will be depreciated as per company policy from the date the relevant
assets are ready for use.
The assets’ residual values and useful lives are reviewed, and adjusted if appropriate, at the end of each reporting period. An asset’s carrying amount is written down immediately to its recoverable amount if the asset’s carrying amount is greater than its estimated recoverable amount (Note 2.5).
Gains and losses on disposals are determined by comparing the proceeds with the carrying amount and are recognised in the statement of comprehensive income.

221221
KAYA MIDDLE EAST FZE
NOTES TO THE FINANCIAL STATEMENTSfor the year ended 31 March 2013
2.5 Impairment of non-fi nancial assets
Assets that are subject to depreciation/amortisation are reviewed for impairment whenever events or changes in circumstances indicate that the carrying amount may not be recoverable. An impairment loss is recognised for the amount by which the asset’s carrying amount exceeds its recoverable amount. The recoverable amount is the higher of an asset’s fair value less costs to sell and value in use. For the purposes of assessing impairment, assets are grouped at the lowest levels for which there are separately identifi able cash fl ows (cash-generating units). Non-fi nancial assets that suffered impairment are reviewed for possible reversal of the impairment at each reporting date.
2.6 Inventories
Inventories comprise spare parts and consumables. Inventories are stated at the lower of cost and estimated net realisable value. Cost is determined using the weighted average cost method. Net realisable value is the estimated selling price in the ordinary course of business, less applicable variable selling expenses.
2.7 Financial assets
2.7.1 Classifi cation
The classifi cation depends on the purpose for which the fi nancial assets were acquired. Management determines the classifi cation of its fi nancial assets at initial recognition. The company classifi es its fi nancial assets in the categories of loans and receivables. Where permitted, fi nancial assets are reclassifi ed between categories if there is a change in management’s intent regarding the future use of the fi nancial asset.
Loans and receivables are non-derivative fi nancial assets with fi xed or determinable payments that are not quoted in an active market. They are included in current assets, except for maturities greater than 12 months after the end of the reporting period. These are classifi ed as non-current assets. The company’s loans and receivables comprise ‘trade and other receivables’ (excluding advances and prepayments) and ‘cash and bank balances’ in the balance sheet (Note 7 and 8).
2.7.2 Recognition and measurement
Regular purchases and sales of fi nancial assets are recognised on trade-date basis – the date on which the company commits to purchase or sell the asset. Loans and receivables are initially measured at fair value and subsequently carried at amortised cost using the effective interest method.
2.7.3 Impairment of fi nancial assets
The company assesses at the end of each reporting period whether there is objective evidence that a fi nancial asset or group of fi nancial assets is impaired. A fi nancial asset or a group of fi nancial assets is impaired and impairment losses are incurred only if there is objective evidence of impairment as a result of one or more events that occurred after the initial recognition of the asset (a ‘loss event’) and that loss event (or events) has an impact on the estimated future cash fl ows of the fi nancial asset or group of fi nancial assets that can be reliably estimated.
Evidence of impairment may include indications that the debtors or a group of debtors is experiencing signifi cant fi nancial diffi culty, default or delinquency in interest or principal payments, the probability that they will enter bankruptcy or other fi nancial reorganisation, and where observable data indicate that there is a measurable decrease in the estimated future cash fl ows, such as changes in arrears or economic conditions that correlate with defaults.
The amount of the loss is measured as the difference between the asset’s carrying amount and the present value of estimated future cash fl ows (excluding future credit losses that have not been incurred) discounted at the fi nancial asset’s original effective interest rate. The carrying amount of the asset is reduced and the amount of the loss is recognised in the statement of comprehensive income.
If, in a subsequent period, the amount of the impairment loss decreases and the decrease can be related objectively to an event occurring after the impairment was recognised (such as an improvement in the debtor’s credit rating), the reversal of the previously recognised impairment loss is recognised in the statement of comprehensive income.

222
KAYA MIDDLE EAST FZE
222
NOTES TO THE FINANCIAL STATEMENTSfor the year ended 31 March 2013
2.7.4 Offsetting fi nancial instruments
Financial assets and liabilities are offset and the net amount reported in the balance sheet when there is a legally enforceable right to offset the recognised amounts and there is an intention to settle on a net basis or realise the asset and settle the liability simultaneously.
2.8 Trade receivables
Trade receivables are amounts due from customers for merchandise sold or services performed in the ordinary course of business. If collection is expected in one year or less (or in the normal operating cycle of the business if longer), they are classifi ed as current assets. If not, they are presented as non-current assets.
Trade and other receivables are recognised initially at fair value and subsequently measured at amortised cost using the effective interest method, less provision for impairment.
2.9 Cash and cash equivalents
For the purposes of the statement of cash fl ows, cash and cash equivalents includes cash on hand, balances in current and deposit accounts with original maturity of less than or equal to three months, net of bank overdraft. Bank overdraft is presented within current liabilities in the balance sheet.
2.10 Share capital
Ordinary shares are classifi ed as equity.
2.11 Provision for employee benefi ts
A provision is made for the estimated liability for employees’ entitlement to annual leave and leave passage as a result of services rendered by the employees up to the balance sheet date.
A provision is also made, using actuarial techniques, for the full amount of end of service benefi ts due to employees in accordance with the UAE Labour Law for their periods of service up to the balance sheet date. The provision relating to annual leave and leave passage is disclosed as a current liability, while that relating to employees’ end of service benefi ts is disclosed as a non-current liability.
2.12 Trade payables and provisions
Trade payables are obligations to pay for goods or services that have been acquired in the ordinary course of business from suppliers. Accounts payable are classifi ed as current liabilities if payment is due within one year or less (or in the normal operating cycle of the business if longer). If not, they are presented as non-current liabilities.
Trade payables are recognised initially at fair value and subsequently measured at amortised cost using the effective interest method.
Provisions are recognised when the company has a present legal or constructive obligation as a result of past events, it is probable that an outfl ow of resources will be required to settle the obligation and the amount has been reliably estimated. Provisions are not recognised for future operating losses.
Provisions are measured at the present value of the expenditures expected to be required to settle the obligation using a rate that refl ects current market assessments of the time value of money and the risks specifi c to the obligation. The increase in the provision due to passage of time is recognised as interest expense.
2.13 Revenue recognition
Revenue comprises the fair value of the consideration received or receivable for the sale of goods and services in the ordinary course of the company’s activities. Revenue is shown net of discounts and returns. The company recognises revenue when the amount of revenue can be reliably measured, it is probable that future economic benefi ts will fl ow to the entity and when specifi c criteria have been met for each of the company’s activities as described below. The amount of revenue is not considered to be reliably measurable until all contingencies relating to the sale have been resolved.

223223
KAYA MIDDLE EAST FZE
NOTES TO THE FINANCIAL STATEMENTSfor the year ended 31 March 2013 Sales of goods
Revenue from sales of goods are recognised when the company has delivered products to the customer, the customer has full discretion over the channel and price to sell the products, and there is no unfulfi lled obligation that could affect the customer’s acceptance of the products. Delivery occurs when the risks of loss have been transferred to the customer, and either the customer has accepted the products in accordance with the sales contract, the acceptance provisions have lapsed, or the company has objective evidence that all criteria for acceptance have been satisfi ed.
Rendering of services
Revenue from the rendering of services is recognised when the company has provided the services to the customer.
2.14 Leases
Leases in which a signifi cant portion of the risks and rewards of ownership are retained by the lessor are classifi ed as operating leases. Payments made under operating leases (net of any incentives received from the lessor) are charged to the statement of comprehensive income on a straight-line basis over the period of the lease.
3 Financial risk management
3.1 Financial risk factors
The company’s activities expose it to a variety of fi nancial risks: market risk (including currency risk, price risk, cash fl ow and fair value interest rate risk), credit risk and liquidity risk. The company’s overall risk management programme focuses on the unpredictability of fi nancial markets and seeks to minimise potential adverse effects on the company’s fi nancial performance.
(a) Market risks
(i) Foreign exchange risk
The company is exposed to foreign exchange risk mainly on its transactions denominated in a currency other than the functional currency of the company.
The company does not have a signifi cant foreign currency risk exposure since majority of its transactions are denominated in AED, Omani Riyal, Saudi Riyal or US Dollar and these currencies are pegged with the US Dollar.
(ii) Price risk
Price risk is the risk that the value of a fi nancial instrument will fl uctuate as a result of changes in market prices. The company is not exposed to risk of changes in fair value or future cash fl ows of a fi nancial instrument that will fl uctuate because of changes in market prices as it does not hold any investments. The company is not exposed to commodity price risk.
(iii) Cash fl ow and fair value interest rate risk
Shareholder’s loan and borrowings are subject to fl oating interest rates at levels generally obtained in the UAE or from individual customer or industry.
At 31 March 2013, if interest rates on borrowings issued at variable rate had been 1% higher / lower with all other variables held constant, loss for the year would have been higher / lower by AED 479,133 (2012: AED 564,932).
(b) Credit risk
Credit risk is the risk that the counter party will cause a fi nancial loss to the company by failing to discharge an obligation. Credit risk mainly arises from bank balances, trade and other receivables (excluding advances and prepayments).
Credit risk arises from bank balances as well as credit exposures to customers, including outstanding receivables and committed transactions. Bank balances are with reputable banks. Signifi cant bank balances are with the banks having the following credit ratings as per Moody’s Investor Services.

224
KAYA MIDDLE EAST FZE
224
NOTES TO THE FINANCIAL STATEMENTSfor the year ended 31 March 2013
As at 31 March As at 31 March2013 2012 2013 2012
Balance Balance Balance BalanceAED AED Rs Crores Rs Crores
Bank Rating
A Baa2 2,888,255 4,207,732 4.27 5.83
B A1 834,421 3,579,381 1.23 4.96
C A1 298,571 667,529 0.44 0.92
D A1 29,226 – 0.04 –
4,050,473 8,454,642 5.99 11.71
(c) Liquidity risk
Prudent liquidity risk management implies maintaining suffi cient cash and the availability of funding through an adequate amount of credit facilities. The company relies mainly on funding from the parent company.
The company’s fi nancial liabilities comprise of trade and other payables (excluding advances from customers) and due to related parties. Balances due within 12 months equal their carrying balances as the impact of discounting is not signifi cant.
3.2 Capital risk management
The company’s objectives when managing capital are to safeguard the company’s ability to continue as a going concern in order to provide returns for owners and benefi ts for other stakeholders and to maintain an optimal capital structure to reduce the cost of capital.
In order to maintain or adjust the capital structure, the company may adjust the amount of distributions to owners, return capital to owners or sell assets to reduce debt. Currently, the company’s funding requirements are managed through a loan provided by the parent company.
3.3 Fair value estimation
At 31 March 2013 and 2012, the company does not have any fi nancial assets and liabilities that are measured at fair value.
4 Critical accounting estimates
Estimates and judgements are continually evaluated and are based on historical experience and other factors, including expectations of future events that are believed to be reasonable under the circumstances.
4.1 Critical accounting estimates and judgements
The company makes estimates and assumptions concerning the future. The resulting accounting estimates will, by defi nition, seldom equal the related actual results. The estimates and assumptions that have a signifi cant risk of causing a material adjustment to the carrying amounts of assets and liabilities within the next fi nancial year are addressed below:
(a) Provision of slow moving and non-moving inventory items
The provision refl ects estimates of slow moving and non-moving inventory. The charge is based on the ageing of the inventory items, technological obsolescence, present conditions and the historical experience. Changes to the estimated provisions may be required if the demand for slow moving items increases or decreases or a fi rm commitment from a customer has been received.
(b) Impairment of property, plant and equipment
Impairment of non-fi nancial assets is a key area involving management judgement, requiring assessment as to whether the carrying value of assets can be supported by the net present value of future cash fl ows derived from such assets using cash fl ow projections which have been discounted at an appropriate rate.

225225
KAYA MIDDLE EAST FZE
NOTES TO THE FINANCIAL STATEMENTSfor the year ended 31 March 2013
In calculating the net present value of the future cash fl ows, certain assumptions are required to be made in respect of the impairment reviews. The key assumptions on which management has based its cash fl ow projections when determining the recoverable amount of the assets are as follows:
• Management’s projections have been prepared on the basis of strategic plans, knowledge of the market, and management’s views on achievable growth in market share over the long term period of fi ve to seven years.
• The discount rates applied to cash fl ows are based on the group’s weighted average cost of capital with a risk premium refl ecting the relative risks in the markets in which the businesses operate.
• Year on year growth rate estimates are based on a conservative view of the long-term growth rate.
The key assumptions used are:
• Average useful life of the leasehold improvements in clinics is 7 years;
• Weighted average cost of capital is 10%; and
• Growth rate of revenue is 12% in fi rst year and ranges between 10%-11% thereafter.
5 Property, plant and equipment
Furniture and
fi xtures
Machinery and
equipment
Offi ce equipment
Motorvehicles
Capital work in progress
Total
AED AED AED AED AED AED
Cost
At 1 April 2011 12,311,745 10,605,874 598,530 314,205 3,941,999 27,772,353
Additions 1,370,892 2,566,757 86,356 – – 4,024,005
Disposals/ write-offs – (10,339) – (217,012) (227,351)
Transfers 2,185,460 1,063,273 34,506 – (3,283,239) –
At 31 March 2012 15,868,097 14,235,904 709,053 314,205 441,748 31,569,007
Additions 1,574,018 1,314,034 69,658 46,503 – 3,004,213
Write-offs (1,849,910) (23,607) (49,662) – – (1,923,179)
Transfers 133,666 263,256 40,310 – (437,232) –
At 31 March 2013 15,725,871 15,789,587 769,359 360,708 4,516 32,650,041
Depreciation
At 1 April 2011 5,271,861 4,182,185 286,406 64,413 – 9,804,865
Charge for the year 2,110,671 1,867,785 158,179 56,263 – 4,192,898
Impairment (Note 16) 608,862 176,030 45,108 – – 830,000
Write-offs – – (8,262) – – (8,262)
At 31 March 2012 7,991,394 6,226,000 481,431 120,676 – 14,819,501
Charge for the year 2,011,394 1,761,327 183,743 47,879 – 4,004,343
Impairment (Note 16) 3,117,388 1,002,041 – – – 4,119,429
Write-offs (796,866) (20,347) (22,293) – – (839,506)
At 31 March 2013 12,323,310 8,969,021 642,881 168,555 – 22,103,767
Net book value:
At 31 March 2013 3,402,561 6,820,566 126,478 192,153 4,516 10,546,274
At 31 March 2012 7,876,703 8,009,904 227,622 193,529 441,748 16,749,506

226
KAYA MIDDLE EAST FZE
226
NOTES TO THE FINANCIAL STATEMENTSfor the year ended 31 March 2013
Charge for the year is allocated as follows:
2013 2012 2013 2012AED AED Rs Crores Rs Crores
Direct costs (Note 13) 3,740,812 3,408,349 5.53 4.72
Administrative and general expenses (Note 16) 263,531 784,549 0.39 1.09
4,004,343 4,192,898 5.92 5.81
5 Property, plant and equipment
Furniture and
fi xtures
Machinery and
equipment
Offi ce equipment
Motorvehicles
Capital work in progress
Total
Rs Crores Rs Crores Rs Crores Rs Crores Rs Crores Rs Crores
Cost
At 1 April 2011 18.20 15.67 0.88 0.46 5.83 41.04
Additions 2.03 3.79 0.13 – – 5.95
Disposals/ write-offs – – (0.02) – (0.32) (0.34)
Transfers 3.23 1.57 0.05 – (4.85) –
At 31 March 2012 23.45 21.04 1.05 0.46 0.65 46.66
Additions 2.33 1.94 0.10 0.07 – 4.44
Write-offs (2.73) (0.03) (0.07) – – (2.84)
Transfers 0.20 0.39 0.06 – (0.65) –
At 31 March 2013 23.24 23.34 1.14 0.53 0.01 48.25
Depreciation
At 1 April 2011 7.79 6.18 0.42 0.10 – 14.49
Charge for the year 3.12 2.76 0.23 0.08 – 6.20
Impairment (Note 16) 0.90 0.26 0.07 – – 1.23
Write-offs – – (0.01) – – (0.01)
At 31 March 2012 11.81 9.20 0.71 0.18 – 21.90
Charge for the year 2.97 2.60 0.27 0.07 – 5.92
Impairment (Note 16) 4.61 1.48 0.00 – – 6.09
Write-offs (1.18) (0.03) (0.03) – – (1.24)
At 31 March 2013 18.21 13.26 0.95 0.25 – 32.67
Net book value:
At 31 March 2013 5.03 10.08 0.19 0.28 0.01 15.59
At 31 March 2012 10.91 11.09 0.32 0.27 0.61 23.20
6 Inventories
2013 2012 2013 2012AED AED Rs Crores Rs Crores
Consumable and spares 5,789,557 5,327,301 8.56 7.38
Less: provision for expired inventories (1,129,838) (476,000) (1.67) (0.66)
4,659,719 4,851,301 6.89 6.72

227227
KAYA MIDDLE EAST FZE
NOTES TO THE FINANCIAL STATEMENTSfor the year ended 31 March 2013
The cost of inventories recognised as an expense and included in ‘direct costs’ amounted to AED 15,217,525 INR 22.49 Crore (2012: AED 17,353,065 INR 24.04 Crore) (Note 13). Provision for slow moving and non-moving inventories of AED 476,000 INR 0.66 Crore has been written off during the year against provision (2012: Nil).
7 Trade and other receivables
2013 2012 2013 2012AED AED Rs Crores Rs Crores
Trade receivables 233,269 782,973 0.34 1.08
Advances - net of provision of AED nil (2012: AED 905,000 INR 1.25 Crore)
1,272,355 4,258,379 1.88 5.90
Prepayments 3,200,885 3,829,763 4.73 5.30
Deposits 1,315,581 1,688,787 1.94 2.34
6,022,090 10,559,902 8.90 14.63
Movement on the provision for impairment of advances are as follows:
2013 2012 2013 2012AED AED Rs Crores Rs Crores
At 1 April 905,000 – 1.34 0.00
Provision made during the year (Note 16) – 905,000 – 1.25
Written off during the year (905,000) – (1.34) –
At 31 March – 905,000 – 1.25
As at 31 March 2013, trade receivables of AED 233,269 INR 0.34 Crore (2012: AED 782,973 INR 1.08 Crore) were fully performing. Amounts charged to the allowance account are generally written off when there is no expectation of recovering additional cash. The other classes within trade and other receivables do not contain impaired assets.
The maximum exposure to credit risk at the reporting date is the carrying amount of each class of receivable mentioned above. The company does not hold any collateral as security.
The carrying amounts of trade and other receivables are denominated in AED.
8 Cash and cash equivalents
2013 2012 2013 2012AED AED Rs Crores Rs Crores
Cash on hand 443,438 1,251,629 0.66 1.73
Bank balances in current accounts 4,050,473 8,454,642 5.99 11.71
Cash and bank balances 4,493,911 9,706,271 6.64 13.44
Overdraft – (12,352,618) – (17.11)
Cash and cash equivalents 4,493,911 (2,646,347) 6.64 (3.67)
The overdraft was secured against promissory note for US$ 5,000,000 and stand-by letter of credit for US$ 5,000,000; and carried interest rate ranging from 2.80% to 2.85% per annum (2012: ranged from 2.18% to 2.51%)
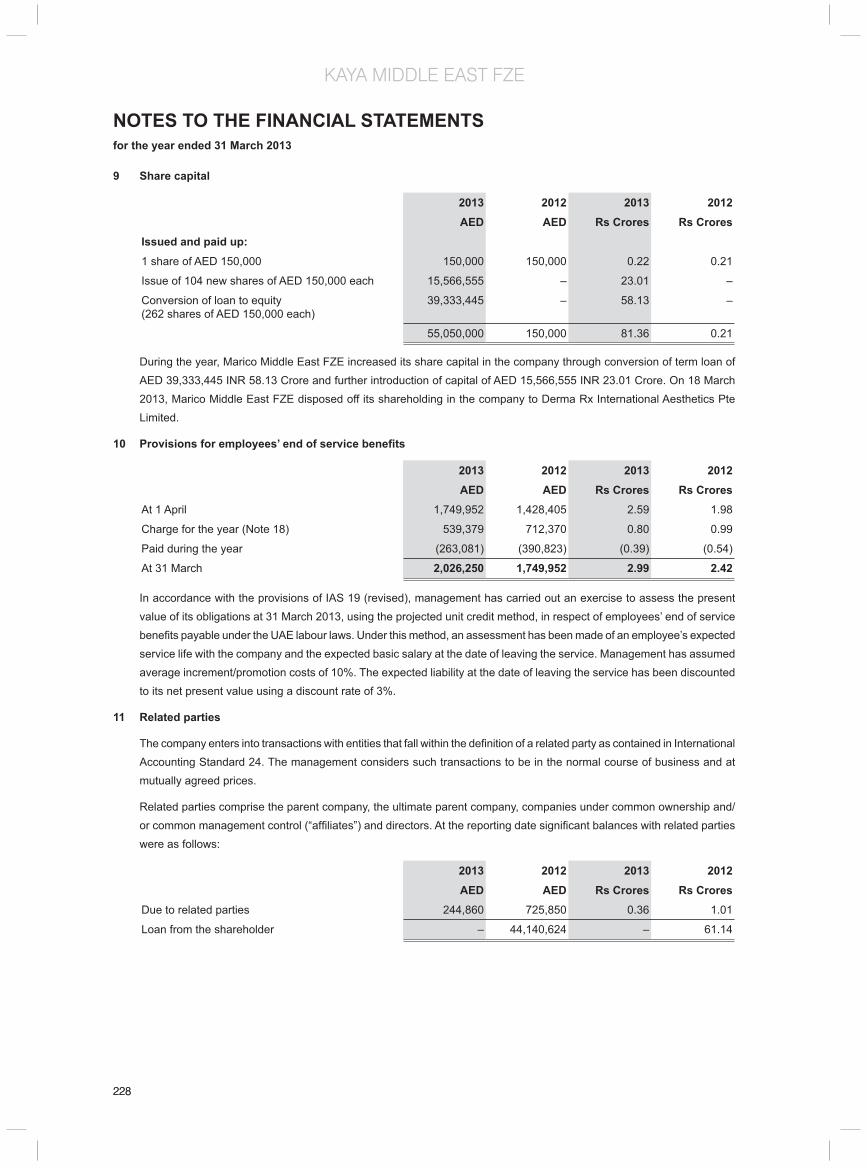
228
KAYA MIDDLE EAST FZE
228
NOTES TO THE FINANCIAL STATEMENTSfor the year ended 31 March 2013
9 Share capital
2013 2012 2013 2012AED AED Rs Crores Rs Crores
Issued and paid up:1 share of AED 150,000 150,000 150,000 0.22 0.21
Issue of 104 new shares of AED 150,000 each 15,566,555 – 23.01 –
Conversion of loan to equity (262 shares of AED 150,000 each)
39,333,445 – 58.13 –
55,050,000 150,000 81.36 0.21
During the year, Marico Middle East FZE increased its share capital in the company through conversion of term loan of AED 39,333,445 INR 58.13 Crore and further introduction of capital of AED 15,566,555 INR 23.01 Crore. On 18 March 2013, Marico Middle East FZE disposed off its shareholding in the company to Derma Rx International Aesthetics Pte Limited.
10 Provisions for employees’ end of service benefi ts
2013 2012 2013 2012AED AED Rs Crores Rs Crores
At 1 April 1,749,952 1,428,405 2.59 1.98
Charge for the year (Note 18) 539,379 712,370 0.80 0.99
Paid during the year (263,081) (390,823) (0.39) (0.54)
At 31 March 2,026,250 1,749,952 2.99 2.42
In accordance with the provisions of IAS 19 (revised), management has carried out an exercise to assess the present value of its obligations at 31 March 2013, using the projected unit credit method, in respect of employees’ end of service benefi ts payable under the UAE labour laws. Under this method, an assessment has been made of an employee’s expected service life with the company and the expected basic salary at the date of leaving the service. Management has assumed average increment/promotion costs of 10%. The expected liability at the date of leaving the service has been discounted to its net present value using a discount rate of 3%.
11 Related parties
The company enters into transactions with entities that fall within the defi nition of a related party as contained in International Accounting Standard 24. The management considers such transactions to be in the normal course of business and at mutually agreed prices.
Related parties comprise the parent company, the ultimate parent company, companies under common ownership and/or common management control (“affi liates”) and directors. At the reporting date signifi cant balances with related parties were as follows:
2013 2012 2013 2012AED AED Rs Crores Rs Crores
Due to related parties 244,860 725,850 0.36 1.01
Loan from the shareholder – 44,140,624 – 61.14

229229
KAYA MIDDLE EAST FZE
NOTES TO THE FINANCIAL STATEMENTSfor the year ended 31 March 2013
Long-term loan was obtained from the shareholder bearing fl oating interest rate (ranging between 2.80% to 2.85% per annum) but with no fi xed repayment schedule. During the year, the loan was converted into share capital (Note 9). Signifi cant transactions with related parties during the year were as follows:
2013 2012 2013 2012AED AED Rs Crores Rs Crores
Purchases of goods and services from affi liates 933,850 379,058 1.38 0.53
Key management personnel compensation
Salaries and benefi ts 1,674,253 1,466,360 2.47 2.03
End of service benefi ts 87,308 7,140 0.13 0.01
1,761,561 1,473,500 2.60 2.04
Interest expense on loan from parent company(Note 17)
1,037,211 1,330,642 1.53 1.84
Recharge of expenses to parent company 336,626 – 0.50 0.00
Recharge of expenses by an affi liate 680,326 559,474 1.01 0.77
Rent payment to the parent company 253,000 409,329 0.37 0.57
12 Trade and other payables
Trade payables 5,180,256 2,296,766 7.66 3.18
Accruals 4,639,514 8,692,374 6.86 12.04
Advances received from customers 16,073,312 16,825,343 23.75 23.30
25,893,082 27,814,483 38.27 38.53
13 Direct costs
Staff costs (Note 18) 23,913,027 27,132,781 35.40 35.38
Consumables 15,217,525 17,353,065 22.53 22.63
Rent 6,417,465 6,275,003 9.50 8.18
Depreciation (Note 5) 3,740,812 3,408,349 5.54 4.44
Repair and maintenance costs 3,057,124 2,508,098 4.53 3.27
Freight 255,356 174,322 0.38 0.23
52,601,309 56,851,618 77.88 74.14
14 Other income
Liabilities written back – 1,700,844 – 2.22
Miscellaneous income 2,151 11,207 – 0.01
2,151 1,712,051 – 2.23
15 Selling and marketing expenses
This includes the advertising expenses incurred on the various advertisement and marketing activities of the company.

230
KAYA MIDDLE EAST FZE
230
NOTES TO THE FINANCIAL STATEMENTSfor the year ended 31 March 2013
16 Administrative and general expenses
2013 2012 2013 2012AED AED Rs Crores Rs Crores
Staff costs (Note 18) 10,456,862 9,425,075 15.48 12.29
Legal and professional charges 4,671,325 7,917,341 6.92 10.33
Impairment of property, plant and equipment (Note 5)
4,119,429 830,000 6.10 1.08
Travelling expenses 1,580,770 4,447,142 2.34 5.80
License fee 1,137,911 1,722,224 1.68 2.25
Provision for expired inventory 1,129,838 476,000 1.67 0.62
Property, plant and equipment written off (net) 1,083,673 – 1.60 –
Bank charges 910,911 696,965 1.35 0.91
Rent 550,300 523,842 0.81 0.68
Laundry Charges 332,219 506,171 0.49 0.66
Depreciation (Note 5) 263,531 784,549 0.39 1.02
Training and seminar expenses 255,713 333,953 0.38 0.44
Postages and Courier 98,010 114,256 0.15 0.15
Provision for advances (Note 7) – 905,000 – 1.18
Other costs 2,092,005 2,078,015 3.10 2.71
28,682,497 30,760,533 42.46 40.11
17 Finance costs
Interest on loan from shareholder (Note 11) 1,037,211 1,330,642 1.54 1.74
Interest on bank borrowings 270,289 112,906 0.40 0.15
1,307,500 1,443,548 1.94 1.88
18 Staff costs
Salaries and benefi ts 33,830,510 35,845,486 50.09 46.75
End of service benefi ts (Note 10) 539,379 712,370 0.80 0.93
34,369,889 36,557,856 50.88 47.68
Staff costs are allocated as below:
Direct costs (Note 13) 23,913,027 27,132,781 35.40 35.38
Administrative and general expenses (Note 16) 10,456,862 9,425,075 15.48 12.29
34,369,889 36,557,856 50.88 47.68

231231
KAYA MIDDLE EAST FZE
NOTES TO THE FINANCIAL STATEMENTSfor the year ended 31 March 2013
19 Financial instruments
The accounting policies for fi nancial instruments have been applied to the line items below:
Loans and receivables Loans and receivables
2013 2012 2013 2012AED AED Rs Crores Rs Crores
Financial assets
Trade and other receivables (excluding prepayments and advances)
1,548,850 2,471,760 2.29 3.42
Cash and bank balances 4,493,911 9,706,271 6.64 13.44
6,042,761 12,178,031 8.93 16.87
Other fi nancial liabilities Other fi nancial liabilitiesFinancial liabilities
Loan from the shareholder – 44,140,624 – 61.14
Bank overdraft – 12,352,618 – 17.11
Trade and other payables (excluding advances from customers)
9,819,770 10,989,140 14.51 15.22
Due to related parties 244,860 725,850 0.36 1.01
10,064,630 68,208,232 14.87 94.48
20 Operating lease commitments
The company has entered into non-cancellable operating leases for rentals. The total of the future lease payments is as follows:
2013 2012 2013 2012AED AED Rs Crores Rs Crores
Not later than one year 6,196,070 5,803,332 9.16 8.04
Between one and fi ve years 7,766,246 10,552,815 11.48 14.62
13,962,316 16,356,147 20.63 22.65
21 Comparatives
Prior year figures have been regrouped and reclassified wherever applicable to conform to the current year presentation.

232
MEL CONSUMER CARE SAE
Board of Directors Debashish Neogi Milind Sarwate Padmanabh Maydeo Saumitra Bhat Marico Middle East represented by Vijay Subramaniam
Registered Offi ce 5th fl oor, 53, Lebanon Street, Mohandseen, Giza, Egypt
Auditors Moore Stephens
Bankers HSBC Limited
Legal Advisors Yasser Maharem Offi ce for Accounting & Auditing, Nassef Law fi rm

233
MEL CONSUMER CARE SAE
INDEPENDENT AUDITORS’ REPORTTo: the shareholders of MEL Consumer Care Company SAE
Report on the fi nancial statements
We have audited the accompanying unconsolidated Financial statements of MEL Consumer Care company SAE which comprise the unconsolidated balance sheet as at March 31, 2013 and the unconsolidated statements of income, changes in shareholders’ equity and cash fl ows for the year then ended and a summary of signifi cant accounting policies and other explanatory notes.
Management’s responsibility for the fi nancial statements
These unconsolidated fi nancial statements are the responsibility of the company’s management. The management is responsible for the preparation and fair presentation of these fi nancial statements in accordance with Egyptian Accounting Standards and in light of the prevailing Egyptian laws this responsibility includes designing, implementing and maintaining internal control relevant to the preparation and fair presentation of fi nancial statements that are free from material misstatement, whether due to fraud or error selecting and applying appropriate accounting policies and making accounting estimates that are reasonable in the circumstances.
Auditor’s responsibility
Our responsibility is to express an opinion on these unconsolidated fi nancial statements based on our audit. We conducted our audit in accordance with the Egyptian Auditing Standards and the relevant laws and regulations. Those standards require that we comply with ethical requirements to obtain reasonable assurance about whether the fi nancial statements are free from material misstatements.
An audit involves performing procedures to obtain audit evidence about the amounts and disclosures in the fi nancial statements. The procedures selected depend on the auditor’s judgment, including the assessment of the risks of material misstatement of the fi nancial statements, whether due to fraud or error. In making those risk assessment, the auditor considers internal control relevant to the entity’s preparation and fair presentation of the fi nancial statements in order to design audit procedures that are appropriate in the circumstances, but not for the purpose of expressing an opinion on the effectiveness of the entity’s internal control . An audit also includes evaluating the appropriateness of accounting policies used and the reasonableness of accounting estimates made by management, as well as evaluating the overall presentation of the fi nancial statements.
We believe that the audit evidence we have obtained is suffi cient and appropriate to provide a basis for our audit opinion.
Opinion
In our opinion, the unconsolidated fi nancial statements present fairly in all material respects, the fi nancial position of MEL Consumer Care Company SAE as of March 31, 2013 and of its unconsolidated fi nancial performance and its cash fl ows for the fi nancial year then ended in accordance with the Egyptian Accounting Standards and the relevant laws and regulations relating to the preparation of these unconsolidated fi nancial statements.
Emphasis of matter
Without considering that as a qualifi cation, the retained losses reached on 31/3/2013 EGP 9,316,651 including current year losses which exceeds the issued and paid capital, that requires an extra-ordinary general assembly according to article no. (69) of law no. 159 for year 1981 to decide on the continuity or not of the company according to article no. (60) of the article of association.
Kindly be informed that current liabilities exceed current assets of EGP 13,402,428 as of March 31, 2013.
Report on other legal and regulatory requirements
The company keeps proper accounting records, include all that is required by law to be recorded therein and the accompanying fi nancial statements are agreement therewith.
The fi nancial information included in the board of directors’ report in compliance with companies law No. 159 year 1981 and its executive regulation and its agreement with the accounting record of the company to the extent that such information is recorded therein.
Cairo 15 April 2013
Sherin NoureldinR.A.A 6809Moore Stephens Egypt

234
MEL CONSUMER CARE SAE
BALANCE SHEETAs at March 31,
Note 2013 2012 2013 2012No. EGP EGP Rs. Crore Rs. Crore
Long-term assets Fixed assets (net ) (2-5,5) 35 35 – –
Investments in subsidiaries (2-6,6) 3,116,358 3,116,358 2.49 2.62
Total Long-term Assets 3,116,393 3,116,393 2.49 2.62 Current assets
Due from related parties (2-11,7) 40,197,137 33,268,514 32.08 28.02
Debtors and other debit balances (3-1,8) 9,259 9,259 0.01 0.01
Cash at banks (9) 5,580 2,202 – –
Total current assets 40,211,976 33,279,975 32.09 28.03 Current liabilities
Claims provision (2-9) 203,197 203,197 0.16 0.17
Due to related parties (2-11,10) 53,371,207 45,015,512 42.60 37.92
Creditors and other credit balances (3-2,11) 40,000 40,000 0.03 0.03
Total current Liabilities 53,614,404 45,258,709 42.79 38.12 Excess of current liabilities over current assets (13,402,428) (11,978,734) (10.70) (10.09)
Total (defi cit investment) (10,286,035) (8,862,341) (8.21) (7.46)To be fi nanced as follows :
Shareholders’ equity
Issued and paid capital (12) 250,000 250,000 0.20 0.21
Legal reserve (2-14) 204,310 204,310 0.16 0.17
Accumulated (losses) (9,316,651) (9,169,297) (7.44) (7.72)
Net (losses ) of the year (1,423,694) (147,354) (1.14) (0.12)
Total shareholders’ equity (10,286,035) (8,862,341) (8.21) (7.46)
Total fi nance of working capital and long-term assets (10,286,035) (8,862,341) (8.21) (7.46)
- The accompanying notes from (1) to (16) form an integral part of these fi nancial statements and are to be read therewith. - Auditor’s report attached.
Chairman Financial Manager Debashish Neogi Saumitra Bhat
Sherin Noureldin R.A.A 6809 Moore Stephens Egypt
Note: The exchange rate use to convert EGP to Rs.<7.981>/(Previous year EGP to Rs.<8.423>)

235
MEL CONSUMER CARE SAE
INCOME STATEMENT
For the year ended March 31,
Note 2013 2012 2013 2012No. EGP EGP Rs. Crore Rs. Crore
Expenses General and administrative expenses (2-13) 61,940 103,279 0.05 0.09 Depreciation of fi xed assets (2-5) – 17,811 – 0.02 Bank charges – 1,645 – – Claims provision – 341 – – Add / (less) Losses from currency revaluation differences (2-4) 1,361,754 132,618 1.09 0.11 Capital (gains) – (108,340) – (0.09)Net (Losses) of the year (1,423,694) (147,354) (1.14) (0.12) (Losses) per share (2-17,13) (5,695) (589) – –
-The accompanying notes from (1) to (16) form an integral part of these fi nancial statements and are to be read therewith.
Note: The exchange rate use to convert EGP to Rs.<7.981>/(Previous year EGP to Rs.<8.423>)

236
MEL CONSUMER CARE SAE
UNCONSOLIDATED CHANGES IN SHAREHOLDERS’ EQUITY FOR THE FINANCIAL YEAR ENDED MARCH 31, 2013
Description Issued & paid capital
Legal reserve Accumulated (losses)
Net (Losses) of the year
Total
EGP EGP EGP EGP EGPBalance as at 31/3/2011 250,000 204,310 (8,509,452) (659,845) (8,714,987)
Retained (losses) – – (659,845) 659,845 –
Net(losses)of the year – – – (147,354) (147,354)
Balance as at 31/3/2012 250,000 204,310 (9,169,297) (147,354) (8,862,341)
Balance as at 1/4/2012 250,000 204,310 (9,169,297) (147,354) (8,862,341)
Transferred to retained (losses) – – (147,354) 147,354 –
Net (losses)of the year – – – (1,423,694) (1,423,694)
Balance as at 31/3/2012 250,000 204,310 (9,316,651) (1,423,694) (10,286,035)
-The accompanying notes from (1) to (16) form an integral part of these fi nancial statements and are to be read therewith.
Description Issued & paid capital
Legal reserve Accumulated (losses)
Net (Losses) of the year
Total
Rs. Crore Rs. Crore Rs. Crore Rs. Crore Rs. CroreBalance as at 31/3/2011 0.19 0.15 (6.37) (0.49) (6.52)
Retained (losses) – – (0.56) 0.56 –
Net(losses)of the year – – – (0.12) (0.12)
Balance as at 31/3/2012 0.21 0.17 (7.72) (0.12) (7.46)Balance as at 1/4/2012 0.19 0.15 (6.86) (0.11) (6.63)
Transferred to retained (losses) – – (0.12) 0.12 –
Net (losses)of the year – – – (1.20) (1.20)
Balance as at 31/3/2012 0.21 0.17 (7.85) (1.20) (8.66)
Note: The exchange rate use to convert EGP to Rs.<7.981>/(Previous year EGP to Rs.<8.423>)

237
MEL CONSUMER CARE SAE
CASH FLOW STATEMENT
Note 31/3/2013 31/3/2012 31/3/2013 31/3/2012No. EGP EGP Rs. Crore Rs. Crore
Cash fl ows from operating activities Net (losses) of the year (1,423,694) (147,354) (1.14) (0.12)Adjustments to reconcile (losses) to net cash ( used in) operating activities Depreciation of fi xed assets – 17,811 – 0.02 Formed from claims provision – 341 – – (Used from) claims provision – (31,144) – (0.03)Capital (gains) – (108,340) – (0.09)Operating (losses) before Change in working capital
(1,423,694) (268,686) (1.14) (0.23)
(Increase) in due from related parties (6,928,622) (6,636,511) (5.53) (5.59)Decrease in debtors and other debit balances – 8,575 – 0.01
Increase in due to related parties 8,355,694 6,766,747 6.67 5.70 Increase in creditors and other credit balances – 19,858 – 0.02 Net cash flows available from (used in) operating activities
3,378 (110,017) 0.05 (0.09)
Cash fl ows from investment activities
Received from sale of fi xed assets – 108,340 – 0.09 Net cash fl ows available from investment activities
– 108,340 – 0.09
Net change in cash at banks during the year 3,378 (1,677) 0.01 (0.01) Cash at banks at the beginning of the year 2,202 3,879 0.01 0.01 Cash at banks at the end of the year (2-16,9) 5,580 2,202 0.01 0.01
-The accompanying notes from (1) to (16) form an integral part of these fi nancial statements and are to be read therewith.
Note: The exchange rate use to convert EGP to Rs.<7.981>/(Previous year EGP to Rs.<8.423>)

238
MEL CONSUMER CARE SAE
NOTES TO THE UNCONSOLIDATED FINANCIAL STATEMENTSfor the fi nancial year ended March 31, 2013
(1) The company’s background and its activities
MEL Consumer Care Company - An Egyptian Joint Stock Company – was established under the provisions of law No. 159 of 1981 and its executive regulation. The company was registered in the commercial register under No.20683 dated October 1st 2006.
The objective of the company
The company’s main objective is to produce products related to consumer care and skin care at third party’s factories, selling and distributing these products.
The company may have an interest or participate in any manner with the companies and others who practice similar activities or may cooperate with the company to achieve its objectives in Egypt or abroad. The company may also merge into the aforementioned Entities, purchasing them or make them affi liated there to according to the provision of law and its executive regulations.
(2) Signifi cant accounting policies :-
2-1 - Accounting standards and Legal principles:-
The accompanying fi nancial statements have been prepared in accordance with Egyptian Accounting Standards and the related Egyptian laws and regulation in the light of the International Financial Reporting Standards to process cases weren’t stated in the Egyptian standards.
2-2 - Basis of preparation the unconsolidated fi nancial statements:-
- The fi nancial statements have been prepared at Egyptian pound.
- The fi nancial statements have been prepared according to historical cost and continuity presumption.
2-3 - Change in accounting principles:-
The accounting principles comply with those adopted in the previous year.
2-4 - Foreign currency translation:-
The company maintains its books in Egyptian pound. All transactions denominated in foreign currencies were translated into Egyptian pound at the rate determined on the transaction date, on the balance sheet, the monetary current assets and liabilities are evaluated accordance the rates announced on that date and the differences are charged to income statement.
2-5 - Fixed assets and its depreciation:
Recognition and preliminary measurement:
Furniture and offi ce equipment and computers are booked at historical cost less the accumulated depreciation and any impairment.
The cost include all direct cost for acquisition the assets also cost of getting of it and re-arranging the site where assets were present.
The Depreciation:
Fixed assets are depreciated using straight-line method according to estimated useful life of each asset in accordance with the following years:
Useful life YearFurniture & offi ce equipment 4
Computers 2

239
MEL CONSUMER CARE SAE
NOTES TO THE UNCONSOLIDATED FINANCIAL STATEMENTSfor the fi nancial year ended March 31, 2013
2-6 - Investment in subsidiaries:-
Subsidiary and affi liated companies are companies that are under the control of the Company. Such control is achieved when the company is in control of the fi nancial and operation policies of that company for the purpose of obtaining the benefi t result from its activities. When ascertaining the amount of future voting power and its affect on the control and domination, the company studies all the circumstances and facts that affect the future voting power.
The investment in subsidiary and affi liated companies is recorded at the acquisition cost. In case that there is a reduction in the fair value below the book value, the book value is amended to refl ect the reduced value and it is refl ected in the income statement under impairment in the value of investments in subsidiary and affi liated companies. In case that there is an appreciation in the fair value, it will be added to the same item to the extent that it has been charged in the income statement for previous periods for each investment separately.
The accounting for investments in subsidiary and affi liated companies is according to the cost method and the revenues generated from such investment is booked according to the amount collected by the company from the dividends of the company invested in which has been achieved after its acquisition. This is starting from the date of the resolution of the general assembly of the company invested in and that has approved such distribution.
2-7 - Impairment in the value of non-fi nancial assets:-
The book value of the Company’s non-fi nancial assets, other than inventory and deferred tax assets is reviewed at the date of each fi nancial position to ascertain the amount of impairment. The Company carries out a regular review to ascertain if there has been impairment in the value of an asset and in case that there is an indication of such impairment; the resale value is compared to the book value. If the book value is above the resale value, then there is impairment in the value of the asset and the resale value is reduced and the loss is charged in the income statement.
The amount of impairment may be returned in case that there is a change in the resale value to the extent that the amount was reduced in the past.
2-8 - Impairment in the value of fi nancial assets:-
On the date of each balance sheet, an objective estimate is carried out to ascertain if there is true indication that any of the assets have been impaired. Once there is a impairment in the value of an asset the loss is recorded only if there are objective proofs that the impairment of the value was due to an incident or more after the initial realization of the asset and that such incident or incidents had an effect that can be evaluated in a reliable manner for the expected future cash fl ow from the asset. In the case of fi nancial assets that are recorded according to their amortized cost impairment, the loss due to impairment of its value between the book value of such asset and the present value of the future cash fl ow that has been discounted by the original actual interest rate relating to this asset.
The book value of the fi nancial asset is reduced directly except in case of clients’ accounts that is reduced using provisions. Any amount that is not to be collected is to be written off from the provision and the amount of the realized loss will be reimbursed either directly or by settling the provisions account. It should be ensured that such reversal will not generate a book value for the asset which is higher than the amortized cost at the date of the writing off of the amount of impairment if such impairment has not been recognized. The amount of write off will be refl ected in the income statement.
2-9 - Provisions:-
A provision is recognized once the company has a current legal or actual obligation due to a previous incident which is likely to require the use of economic sources to settle such obligation while preparing a valuation of the value of the obligation. The provisions are to be reviewed on the date of the balance sheet and amended to refl ect the most accurate present valuation and in case that the present value of cash is of essence, then the amount recognized as provision is the present value of the expected expenses to settle the obligation.

240
MEL CONSUMER CARE SAE
NOTES TO THE UNCONSOLIDATED FINANCIAL STATEMENTSfor the fi nancial year ended March 31, 2013
2-10- Employees’ benefi ts:
• Social insurance & pension scheme :
The company contributes to the government social insurance system on behalf of the employees according to the social insurance law No. 79 year 1975 and its amendments.
The employees and the company contribute according to this law with a fi xed percentage of their salary and the company’s obligation is limited to its contribution. The company’s contribution is refl ected in the income statement according to the accrual bases.
• Employee profi t share:
According to its constitution, the company distributes part of the profi ts dividends to the employees as per the recommendations stipulated by the Board of Directors and approved by the General Assembly. The employee share of profi t will be recognized as distribution of profi t in shareholders’ equity statement and as an obligation for the period that the company’s shareholders approved such distribution.
2-11- Related parties’ transactions:-
All transactions with related parties are booked by the company in the same manner as any other normal transaction with other parties.
2-12 -Accounting estimates:-
According to Egyptian accounting standards the preparation of the fi nancial statement requires the management to make some approximations and predictions that affect the value of assets, obligations, income and expenses during the fi nancial year. The actual amounts could be quite different from these predictions.
2-13 -Expenses:-
All expense, including administrative and general expenses, are to be refl ected in the income statement for the fi nancial period that such expenses were incurred according to accrual bases.
2-14 -Legal reserve:-
According to law No. 159 year 1981, its executive directives and the constitution of the company, there should be legal reserve of no less 5% of the profi t of the company and such reserve should not be increased once this reserve amount reaches 50% of the company’s issued capital.
2-15 -Cash fl ows statement:-
The cash fl ow statement will be prepared according to the indirect method.
2-16- Cash and cash equivalent:-
For the purpose of the cash fl ows statement, cash and cash equivalent are to be considered cash at banks balances, short term fi xed deposits and checks under collection, if any.
2-17- Losses per share:-
Losses per share are calculated by the weighted average method according to the number of shares during the year.

241
MEL CONSUMER CARE SAE
NOTES TO THE UNCONSOLIDATED FINANCIAL STATEMENTSfor the fi nancial year ended March 31, 2013
(3) Financial Instruments :-
Financial instruments are made up of any contractual agreement that gives the right to fi nancial assets of the company and creates a fi nancial or shareholding obligation to the other side of the contact.
3-1- Debtors:-
Debtors are initially recognized at actual value and subsequently measured at amortized cost using the effective interest method, less any impairment in the value. Impairment in the value is established when there is objective evidence that the Company will not be able to collect all due amounts according to the original terms of the debtors. In the case there are signifi cant fi nancial diffi culties of the debtor, the probability that the debtor will enter bankruptcy or fi nancial reorganization, and default or delinquency in payments (more than granted credit limits) are considered indicators that the debtors is impaired. The amount of the provision is the difference between the asset’s carrying amount and the present value of the estimated future cash fl ows, discounted at the original effective interest rate used to determine the amortized cost. The carrying amount of the asset is reduced through the use of an allowance account, and the amount of the loss is recognized in the income statement. When a Debtor is uncollectible, it is written off against the allowance account for receivables.
3-2- Creditors:-
Creditors’ balances are record as per their actual value.
(4) fair value of fi nancial instruments:-
The fi nancial instruments are represented in monetary assets ( cash at banks and on hand, clients & notes receivables and debtors & other debit balances ) , monetary liabilities (due to related parties , suppliers and notes payables , creditors and other credit balances) the present values of these fi nancial instruments represent a reasonable estimate to their fair values . The notes of the fi nancial statements include the signifi cant polices used in recording and measuring signifi cant fi nancial instruments and the related revenues and expenses.
(5) fi xed assets (Net):-
Fixed assets (Net) as of March 31, 2013 represents as follows:-
Description Furniture & offi ce
equipment
Computers Total Furniture & offi ce
equipment
Computers Total
EGP EGP EGP Rs.Crore Rs.Crore Rs.CroreCost as of 1/4/2012 390,388 435,063 825,451 0.33 0.37 0.70
Cost as of 31/3/2013 390,388 435,063 825,451 0.31 0.35 0.66
Acc. depreciation at 1/4/2012 390,384 435,012 825,416 0.33 0.37 0.70
Depreciation of the year – – – – – –
Acc. depreciation at 31/3/2013 390,384 435,062 825,416 0.31 0.35 0.66
Net fi xed assets as of 31/3/2013 4 31 35 – – –
Net fi xed assets as of 31/3/2012 4 31 35 – – –
(6) Investments in subsidiaries:
The balance of investments in subsidiaries as of March 31, 2013 amounted to EGP 3 116 358 represents as follows:
31/3/2013 31/3/2012 31/3/2013 31/3/2012EGP EGP Rs.Crore Rs.Crore
Marico Egypt Industries Company (MEI) 1,506,718 1,506,718 1.20 1.27
MEL Consumer Care & its Partner Company (Wind) 1,609,640 1,609,640 1.28 1.36
3,116,358 3,116,358 2.49 2.62

242
MEL CONSUMER CARE SAE
NOTES TO THE UNCONSOLIDATED FINANCIAL STATEMENTSfor the fi nancial year ended March 31, 2013
- The contribution percentage in Marico Egypt Industries Company (MEI) is 99%.
- Marico Egypt Industries Company (MEI) is the new name for Pyramids Modern Industries.
- The contribution percentage in MEL Consumer Care & its Partner Company (Wind) is 99%.
(7) Due from related parties :-
The balance of due from related parties as of March 31, 2013 amounted to EGP 40 197 137 represents as follows:
31/3/2013 31/3/2012 31/3/2013 31/3/2012EGP EGP Rs.Crore Rs.Crore
MEL Consumer Care & its Partner Company (Wind) 36,918,514 30,683,736 29.46 25.84
Egyptian American Co. for investment and Industrial Development (EAIIDC)
3,278,623 2,584,778 2.62 2.18
40,197,137 33,268,514 32.08 28.02
(8) Debtors and other debit balances :-
The balance of debtors and other debit balances as of March 31, 2013 amounted to EGP 9 259 represents as follows:
31/3/2013 31/3/2012 31/3/2013 31/3/2012EGP EGP Rs.Crore Rs.Crore
Sundry debtors 9,259 9,259 0.01 0.01
9,259 9,259 0.01 0.01
(9) Cash at banks :-
The balance of cash at banks as of March 31, 2013 amounted to EGP 5 580 represents as follows:
31/3/2013 31/3/2012 31/3/2013 31/3/2012EGP EGP Rs.Crore Rs.Crore
HSBC Bank current accounts - EGP 5,576 2,090 0.01 0.01
HSBC Bank current accounts - USD 4 112 – –
5,580 2,202 0.01 0.01
(10) Due to related parties :-
The balance of due to related parties as of March 31, 2013 amounted to EGP 53 371 207 represents as follows:
31/3/2013 31/3/2012 31/3/2013 31/3/2012EGP EGP Rs.Crore Rs.Crore
Marico Middle East Company (MME) (holding company)
12,219,982 10,858,225 9.75 9.15
Marico Egypt for Industries Company (MEI) 41,151,225 34,157,287 32.84 28.77
53,371,207 45,015,512 42.6 37.92
(11) Creditors and other credit balances :-
The balance of creditors and other credit balances as of March 31, 2013 amounted to EGP 40 000 represents as follows:
31/3/2013 31/3/2012 31/3/2013 31/3/2012EGP EGP Rs.Crore Rs.Crore
Accrued expenses 40,000 40,000 0.03 0.03
40,000 40,000 0.03 0.03

243
MEL CONSUMER CARE SAE
NOTES TO THE UNCONSOLIDATED FINANCIAL STATEMENTSfor the fi nancial year ended March 31, 2013
(12) Issued and paid capital:-
The authorized capital was determined by EGP 2,500,000 (Two million fi ve hundred thousand Egyptian pounds) and the issued and paid capital is 250,000 (two hundred fi fty thousand Egyptian pounds) distributed into 250 shares (Two hundred fi fty shares), the nominal value of each share is EGP 1000 (One thousand Egyptian pounds), distributed among shareholders as follows:-
Name Nationality No. of share Issued & paid capital1- Harsh Charandas Mariwala Indian 1 1,000
2- Milind Shripad Sarwate Indian 1 1,000
3- Vijay Subramaniam Indian 1 1,000
4- Marico Middle East Emirates 247 247,000
250 250,000
(13) Losses per share:
Losses per share are made up as follows:
3/31/2013 3/31/2012 3/31/2013 3/31/2012EGP EGP Rs.Crore Rs.Crore
Net (losses) of the year (1,423,694) (147,354) (1.14) (0.12)
No. of Shares 250 250 – –
(Losses) Per share (EGP/Share) (5,695) (589) – –
(14) Related parties’ transactions :
The Related parties’ transactions as of March 31, 2013 represents as follows:
Party name Nature of Relation
Nature of transaction
Size of transaction
Size of transaction
EGP EGP Rs. Crore
MEL Consumer Care & Partner Company (Wind) Affi liated company Financing 6,234,777 4.98
Egyptian American Co. for investment and Industrial Development (EAIIDC)
Affi liated company Financing 693,845 0.55
Marico Middle East Company (MME) Affi liated company Financing 1,361,758 1.09
Marico Egypt for Industries Company (MEI) Affi liated company Financing 6,993,938 5.58
(15) Financial instruments and the related risk management:
The company’s fi nancial instruments are represented in cash at banks balances, some debtors and other debit balances, some creditors and other credit balances, short- term loans and credit bank accounts. The following shows the risks related to the fi nancial instruments and the procedures followed by the company managements to minimize the effect of such risks.
15-1- Foreign currency risk:
Exchange rate risk consists of the change in foreign currencies which affect revenues and expenses in foreign currencies and also evaluation of assets & liabilities in foreign currencies.
Foreign currency (Defi cit) Foreign Currency
U.S Dollar (1,791,786)
As stated in notes no. (2-4) foreign currency translation, assets and liabilities were reevaluated at year end at the exchange rate declared as of the date of balance sheet.

244
MEL CONSUMER CARE SAE
NOTES TO THE UNCONSOLIDATED FINANCIAL STATEMENTSfor the fi nancial year ended March 31, 2013
15-2 - Liquidity risk:
Liquidity risk is represented in the diffi culties which the company faces in gathering the necessary fund to meet its engagements of the fi nancial instruments. Liquidity risk may results from inability of selling the fi nancial asset by the value near from its fair value. Suitable procedures are taken to reduce that risk to the minimum according to the company policy.
15-3 - Interest risk:
Interest risk represents the change in currency rate which affect the results of business and this risk does not exist because the company depends on its resources to fi nance its current obligation and long term assets.
15-4 - Fair value of fi nancial instruments:
The fair value is the amount for which an asset could be exchanged or a liability settled between knowledgeable willing parties on an arm’s length basis and the book value is too close to the fair value.
(16) Tax status :-
First: corporate tax:
- The company didn’t examine till now.
- The company submits its tax return on the legal date.
Second: Salaries & wages tax:
- The company was examined from the beginning of activity till 31/3/2008.
- The company pays salaries & wages tax regularly.
Third: stamp duty:
- The company didn’t examine till now.
- The company pays stamp duty according to taxes system.
Fourth: withholding tax:
- The company pays withholding tax regularly.
- The company didn’t examine till now.
Fifth: sales tax:
- The company was examined from beginning of activity till 31/3/2011.
- The company submits the sales tax reports regularly.

245245
EGYPTIAN AMERICAN FOR INVESTMENT AND INDUSTRIAL DEVELOPMENT COMPANY S.A.E
Board of Directors Rohit Jaiswal
Debashish Neogi
Padmanabh Maydeo Saumitra Bhat Ashutosh Telang Sridhar Balakrishnan
Registered Offi ce 11B Hegaz Sq., Mohandeseen, Giza, Egypt
Auditors Moore Stephens
Bankers HSBC Limited NSGB
Legal Advisors Yasser Maharem Offi ce for Accounting and Auditing Nassef Law Firm

246
EGYPTIAN AMERICAN FOR INVESTMENT AND INDUSTRIAL DEVELOPMENT COMPANY S.A.E
246
INDEPENDENT AUDITOR’S REPORTTo
The shareholders of Egyptian American Co. For Investment and Industrial Development SAE
Report on the fi nancial statements
We have audited the accompanying balance sheet of Egyptian American Co. For Investment and Industrial Development SAE as of December 31, 2012 and the related statements of income, cash fl ows and changes in shareholders’ equity for the year then ended and a summary of signifi cant accounting policies and other explanatory notes.
Management’s responsibility for the fi nancial statements
These fi nancial statements are the responsibility of the company’s management. The management is responsible for the preparation and fair presentation of these fi nancial statements in accordance with Egyptian Accounting Standards and in the light of the Egyptian laws. This responsibility includes designing, implementing and maintaining internal control relevant to the preparation and fair presentation of fi nancial statements that are free from material misstatement, whether due to fraud or error, selecting and applying appropriate accounting policies and making accounting estimates that are reasonable to the circumstances.
Auditor’s responsibility
Our responsibility is to express an opinion on these fi nancial statements based on our audit. We conducted our audit in accordance with the Egyptian Auditing Standards and the relevant laws and regulations. Those standards require planning and audit performance to obtain reasonable assurance about whether the fi nancial statements are free from material misstatements.
An audit involves performing procedures to obtain audit evidence about the amounts and disclosures in the fi nancial statements. The procedures selected depend on the auditor’s judgment, including the assessment of the risks of material misstatement of the fi nancial statements, whether due to fraud or error. In making those risk assessment, the auditor consider internal control relevant to the entity’s preparation and fair presentation of the fi nancial statements in order to design audit procedures that are appropriate in the circumstances, but not for the purpose of expressing an opinion on the effectiveness of the entity’s internal control . An audit also includes evaluating the appropriateness of accounting policies used and the reasonableness of accounting estimates made by management, as well as evaluating the overall presentation of the fi nancial statements.
We believe that the audit evidence we have obtained is suffi cient and appropriate to provide a basis for our audit opinion.
Opinion
In our opinion, the fi nancial statements present fairly in all material respects, the fi nancial position of Egyptian American Co. For Investment and Industrial Development SAE as of December 31, 2012 and of its fi nancial performance and its cash fl ows for the fi nancial year then ended in accordance with the Egyptian Accounting Standards and the relevant laws and regulations.
Emphasis of matter
Without considering that a qualifi cation, the net forward losses amount including the current fi scal year reached EGP16 753 390 on 31/12/2012 and has exceeded the issued and paid capital which requires extraordinary general assembly according to article No. (69) of law No. 159 of year 1981 to consider the continuity of the company.
Report on other legal and regulatory requirements
The company keeps proper accounting records, include all that is required by law to be recorded therein and the accompanying fi nancial statements are agreement therewith, the company applies a suffi cient costing system. Inventory count and valuation was made by the company’s management and in accordance with the proper process.
The fi nancial information included in the board of directors’ report in compliance with companies law No. 159 year 1981 and its executive regulation and it’s agreed with the accounting record of the company to the extent that such information is recorded therein.
Sherin NoureldinR.A.A. 6809Moore Stephns Egypt Cairo 17/1/2013

247247
EGYPTIAN AMERICAN FOR INVESTMENT AND INDUSTRIAL DEVELOPMENT COMPANY S.A.E
BALANCE SHEET
As at December 31,NoteNo
2012 2011 2012 2011
EGP EGP Rs.Crore Rs.CroreAssetsLong-term assets
Fixed assets (net) (2/5,4) 1,579,086 2,023,410 1.37 1.78
Project in progress (2/7,5) 33,701 33,701 0.03 0.03
Total long-term assets 1,612,787 2,057,111 1.39 1.81Current assetsInventory (net) (2/6,6) 4,057,968 3,440,584 3.51 3.03
Receivables (3/1,7) 2,618,295 5,710,261 2.26 5.02
Debtors and other debit balance (3/1,8) 140,201 171,412 0.12 0.15
Cash at banks and equivalent (9) 2,172,258 1,872,276 1.88 1.65
Total current assets 8,988,722 11,194,533 7.77 9.85Current liabilitiesBanks overdraft 168,294 659,261 0.15 0.58
Due to related parties (10) 14,993,775 15,482,328 12.96 13.62
Payables and notes payables (3/2,11) 3,434,388 6,555,361 2.97 5.77
Creditors and other credit balances (3/2,12) 1,406,488 1,773,778 1.22 1.56
Total current liabilities 20,002,945 24,470,728 17.29 21.53Decrease in working capital 11,014,223 13,276,195 9.52 11.68Total Investment 9,401,436 11,219,084 8.13 9.87To be fi nanced as followsShareholders' EquityIssued and paid capital ( 13/B) 6,892,000 6,892,000 5.96 6.06
Legal reserve (2/16) 374,360 374,360 0.32 0.33
Other reserves 493 493 – –
Forward losses 18,571,038 14,153,814 16.06 12.45
Net profi t (losses) for the year 1,817,648 4,417,224 1.57 3.89
Total Shareholders' Equity 9,486,537 11,304,185 8.20 9.95
Long-term liabilities
Deferred tax liabilities (2/20,14) 85,101 85,101 0.07 0.07
Total Shareholders' Equity and long-term liabilities 9,401,436 11,219,084 8.13 9.87Total fi nancing of working capital and long-term assets 9,401,436 11,219,084 8.13 9.87
- The accompanying notes from (1) to (21) form an integral part of these fi nancial statements and are to be read therewith. - Auditor’s report attached.
Chairman Financial manager
Sherin NoureldinR.A.A. 6809Moore Stephns Egypt
Note: The exchange rate use to convert EGP to Rs.<7.981>/(Previous year EGP to Rs.<8.423>)

248
EGYPTIAN AMERICAN FOR INVESTMENT AND INDUSTRIAL DEVELOPMENT COMPANY S.A.E
248
INCOME STATEMENT
Year ended December 31,Note 2012 2011 /2012 2011No EGP EGP Rs.Crore Rs. Crore
Sales (net) (2/10,15) 23,467,308 18,406,203 20.29 16.2
Less : Cost of sales 18,589,494 13,616,099 16.07 11.98
Gross profi t 4,877,814 4,790,104 4.22 4.21Less : Selling and distribution expenses 1,493,139 6,860,403 1.29 6.04
General and administrative expenses 791,333 1,697,917 0.68 1.49
Depreciation of fi xed assets 283,649 340,521 0.25 0.3
Royalty 119,174 90,600 0.1 0.08
2,687,295 8,989,441 2.32 7.91Operating income (loss) 2,190,519 4,199,337 1.89 3.69Add / (Less):Capital gains 150,659 160,214 0.13 0.14
(Losses) from currency reveuation differences (2/4) 676,243 452,222 0.58 0.40
Revenues from exports subsidies 24,981 – 0.02 –
Scrap sales 127,732 74,121 0.11 0.07
Total 372,871 217,887 0.32 0.19 Net profi t (losses) for the year 1,817,648 4,417,224 1.57 3.89 Earnings (losses) per share (EGP/Share) (2/21,16) 26.37 64.09 – –
The accompanying notes from (1) to (21) form an integral part of these fi nancial statements and are to be read therewith.
Sherin NoureldinR.A.A. 6809Moore Stephns Egypt
Note: The exchange rate use to convert EGP to Rs.<7.981>/(Previous year EGP to Rs.<8.423>)

249249
EGYPTIAN AMERICAN FOR INVESTMENT AND INDUSTRIAL DEVELOPMENT COMPANY S.A.E
STATEMENT OF CHANGES IN EQUITY
year ended December 31, 2012
Description Issued & paid capital
Legal reserve
Other reserves
Forwardlosses
Net profi t(losses) for
the year
Total
EGP EGP EGP EGP EGP EGPBalance as of December 31.2010 6,892,000 374,360 493 10,847,488 3,306,326 6,886,961
Transferred to forward losses – – – 3,306,326 3,306,326 –
Net (losses) for the year – – – – 4,417,224 4,417,224
Balance as of December 31.2011 6,892,000 374,360 493 14,153,814 4,417,224 11,304,185 Balance as of 1/1/2012 6,892,000 374,360 493 14,153,814 4,417,224 11,304,185 Transferred to forward losses – – – 4,417,224 4,417,224 –
Net profi t (losses) for the year – – – – 1,817,648 1,817,648
Balance as of December 31.2012 6,892,000 374,360 493 18,571,038 1,817,648 9,486,537
Description Issued & paid capital
Legal reserve
Other reserves
Forwardlosses
Net profi t(losses) for
the year
Total
Rs. Crore Rs. Crore Rs. Crore Rs. Crore Rs. Crore Rs. CroreBalance as of December 31.2010 5.31 0.29 – 8.35 2.55 5.30
Transferred to forward losses – – – 2.91 2.91 5.82
Net (losses) for the year – – – – 3.89 3.89
Balance as of December 31.2011 6.06 0.33 – 12.45 3.89 9.95 Balance as of 1/1/2012 6.06 0.33 – 12.45 3.89 9.95
Transferred to forward losses – – – 3.82 3.82 –
Net profi t (losses) for the year – – – – 1.57 1.57
Balance as of December 31.2012 5.96 0.32 – 16.06 1.57 8.38
- The accompanying notes from (1) to (21) form an integral part of these fi nancial statements and are to be read therewith.
Note: The exchange rate use to convert EGP to Rs.<7.981>/(Previous year EGP to Rs.<8.423>)

250
EGYPTIAN AMERICAN FOR INVESTMENT AND INDUSTRIAL DEVELOPMENT COMPANY S.A.E
250
CASH FLOWS STATEMENT
year ended December 31,
Note 2012 2011 2012 2011
EGP EGP Rs. Crore Rs.CroreCash fl ows from operating activities
Net profi t (losses) of the year 1,817,648 4,417,224 1.57 3.89
Adjustments to reconcile net (losses) with Cash fl ows from operating activities Depreciation of fi xed assets 428,345 636,507 0.37 0.56
Capital gains 150,659 160,2 14 0.13 0.14
Impairment in the value of inventory 500,000 – 0.43 –
Net profi t (loss) before changing in working capital
2,595,334 3,940,931 2.24 3.47
Change in working capital (Increase) in inventory 1,117,384 1,278,014 0.97 1.12
Decrease in receivable 3,091,966 2,759,933 2.67 2.43
Decrease in debtors and other debit balances 31,211 562,112 0.03 0.49
(Decrease) in due to related parties 488,553 1,897,484 0.42 1.67
(Decrease) Increase in payables and notes payables
3,120,973 3,538,958 2.7 3.11
(Decrease) Increase in creditors and other credit balances
367,290 177,693 0.32 0.16
Net cash flows (used in) provided from operating activities
624,311 77,733 0.54 0.07
Cash fl ows from investment activities (Payments) for purchase fi xed assets 43,175 435,341 0.04 0.38
Received from sale fi xed assets 209,813 252,917 0.18 0.22
(Payments) in projects in progress – 33,701 – 0.03
Net cash flows (used in) investment activities
166,638 216,125 0.14 0.19
Net change in cash fl ows during the year 790,949 293,858 0.68 0.26 Cash and cash equivalents at the beginning of the year
1,213,015 1,506,873 1.05 1.33
Cash and cash equivalents at the end of the year
(2/18,17) 2,003,964 1,213,015 1.73 1.07
- The accompanying notes from (1) to (21) form an integral part of these fi nancial statements and are to be read therewith.
Note: The exchange rate use to convert EGP to Rs.<7.981>/(Previous year EGP to Rs.<8.423>)

251251
EGYPTIAN AMERICAN FOR INVESTMENT AND INDUSTRIAL DEVELOPMENT COMPANY S.A.E
NOTES TO THE FINANCIAL STATEMENTSfor the fi nancial year ended December 31 ,2012
(1) The company’s background and its activities:
Egyptian American Co. for Investment and Industrial Development” Redico-An Egyptian Joint Stock Company – was established under the provisions of law No. 159 of 1981 and its executive regulation. The company was registered in the commercial register under no.117830, dated 14/12/1997.
According to decision of the Extraordinary General Assembly Meeting held on 16/12/2006 and the resolution issued by Chairman of General Authority For Investments & Free Zone (GAFI) No.235/2 for the year 2007 concerning the division licensing of the Egyptian American Co. for Investment and Industrial Development –Redico- in order to be divided into two companies (split company and split off company) and according to what will be mentioned below , the recent name of the company is, the Egyptian American Co. for Investment and Industrial Development.
The aforementioned amendment concerning the name of the company was registered in the commercial register on 15/3/2007.
The objective of the company:
1 Manufacturing cosmetics, perfumes and essential oils – Ready Rose – Five Flowers -Top Girl and the new lines of production that can develop in the fi eld of manufacturing cosmetics.
2 Importing equipment, machines, tools and raw materials required in order to execute the objectives of the company.
3 Import, export and commercial agencies.
All the above mentioned objectives are carried out in conformity with the provisions, regulations and the applicable decrees provided that all licenses required practicing such activities are issued.
The company may have an interest to participate in any manner with the companies and others who proactive similar activities or may cooperate with the company to achieve its objectives in Egypt or abroad. The company may also merge into the previously mentioned entities, purchasing them or to make them affi liated there to according to the provision of law and its regulations.
According to General Authority For Investment & Free Zone (GAFI) chairman’s decision No.235/2 for the year 2007 regarding the license to divide Egyptian American Co. for Investment and Industrial Development (Redico), referred there to as the split company , into two joint stock companies according to the below – mentioned data, and based upon the decision of the Extraordinary General Assembly Meeting , held on 16/12/2006.It was approved to amend the objective of the company to be as follows :
4 Manufacturing cosmetics, perfumes and essential oils.
5 Importing equipment, machines, tools and raw materials required to execute the objectives of the company.
6 Import, export and commercial agencies.
(2) Signifi cant accounting policies :-
2-1- Upholding accounting standards and legal principles:-
The accompanying fi nancial statements have been prepared in accordance with the Egyptian accounting standards and the related Egyptian laws and regulations in the light of the international fi nancial reporting standards to process cases weren’t stated in the Egyptian standards.
2-2- Basis preparation of the fi nancial statements:-
-The fi nancial statements have been prepared at Egyptian pound.
-The fi nancial statements have been prepared according to historical cost and continuity presumption.

252
EGYPTIAN AMERICAN FOR INVESTMENT AND INDUSTRIAL DEVELOPMENT COMPANY S.A.E
252
NOTES TO THE FINANCIAL STATEMENTSfor the fi nancial year ended December 31 ,2012
2-3- Change in accounting principles:-
The accounting principles comply with those adopted in the previous year.
2-4- Foreign currencies translation:-
The company maintains its books in Egyptian pound. All transactions denominated in foreign currencies were translated into Egyptian pound at the rate determined on the transaction date, on the balance sheet, the monetary current assets and liabilities are revaluated accordance the rates announced on that date and the differences are charged to income statement.
2-5- Fixed assets (net):-
Recognition and preliminary measurement:
Buildings, constructions, infrastructures, machines and equipments are booked at historical cost less the accumulated depreciation and any impairment in value.
The cost includes all direct cost for acquisition the asset also cost of its disposal and re-arranging the site where assets were present.
The Depreciation:
Fixed assets are shown in the balance sheet at historical cost, are depreciated using straight line method and according to estimated useful life of each asset in accordance with the following rates:
Estimated useful life / year
Buildings & constructions 12
Furniture & offi ce equipment 4
Vehicles 4
Machinery 4
Tools & equipment 4
Computers 2
2-6- Inventory (net):-
Inventories are stated at the lower of cost or net realizable value. Cost is determined using the weighted average method. The cost of fi nished goods and work in progress comprises raw materials, direct labour and other direct costs. Net realisable value is the estimated selling price in the ordinary operating cases less all variable selling expenses. Provision is made up when cost is less than the realizable value.
2-7- Projects in progress:-
Projects under progress are stated at cost, and include all direct expenses required to prepare the asset to be in a state of operation and for the purpose for which it was acquired. Projects under progress are recorded as fi xed assets once it is fi nished and it is available for the purpose it was acquired for. Projects under progress are valued at the date of the balance sheet according to its cost and deducting the impairment in its value if any.
2-8- Impairment in the value of non-fi nancial assets:-
The book value of the Company’s non-fi nancial assets, other than inventory and deferred tax assets is reviewed at the date of each fi nancial position to ascertain the amount of impairment. The Company carries out a regular review to ascertain if there has been impairment in the value of an asset and in case that there is an indication of such impairment, the resale value is compared to the book value. If the book value is above the resale value, then there is impairment in the value of the asset and the resale value is reduced and the loss is charged in the income statement. The amount of impairment may be returned in case that there is a change in the resale value to the extent that the amount was reduced in the past.

253253
EGYPTIAN AMERICAN FOR INVESTMENT AND INDUSTRIAL DEVELOPMENT COMPANY S.A.E
NOTES TO THE FINANCIAL STATEMENTSfor the fi nancial year ended December 31 ,2012
2-9- Impairment in the value of fi nancial assets:-
On the anniversary of each balance sheet, an objective estimate is carried out to ascertain if there is true indication that any of the assets have been impaired. Once there is a impairment in the value of an asset the loss is recorded only if there are objective proofs that the impairment of the value was due to an incident or more after the initial realization of the asset and that such incident or incidents had an affect that can be evaluated in a reliable manner for the expected future cash fl ow from the asset. In the case of fi nancial assets that are recorded according to their amortized cost, the impairment losses are represented in the difference between the book value of such asset and the present value of the future cash fl ow that has been discounted by the original actual interest rate relating to this asset.
The book value of the fi nancial asset is reduced directly except in case of clients accounts that is reduced using provisions. Any amount that is not to be collected is to be written-off from the provision and the amount of the realized loss will be reimbursed either directly or by settling the provisions account. It should be ensured that such reversal will not generate a book value for the asset which is higher than the amortized cost at the date of the writing-off of the amount of impairment if such impairment has not been recognized. The amount of write-off will be refl ected in the income statement.
2-10- Revenue recognition:-
Revenue is recognized once the service has been carried out and invoice has been issued according to the accrual principle.
Regarding the revenues from dividends due on fi nancial notes and investments in subsidiary companies, this income is recognized once the general assembly has approved the distribution to its investors.
2-11- Provisions:-
A provision is recognized once the company has a current legal or actual obligation due to a previous incident which is likely to require the use of economic sources to settle such obligation while preparing a valuation of the value of the obligation. The provisions are to be reviewed on the anniversary of the balance sheet and amended to refl ect the most accurate present valuation and in case that the present value of cash is of essence, then the amount recognized as provision is the present value of the expected expenses to settle the obligation.
2-12- Employees’ benefi ts
1- Social insurance & pension scheme :
The company contributes to the government social insurance system on behalf of the employees according to the social insurance law No. 79 year 1975 and its amendments. The employees and the company contribute according to this law with a fi xed percentage of their salary and the company’s obligation is limited to its contribution. The company’s contribution is refl ected in the income statement according to the accrual principle.
2- Employee profi t share :
According to its constitution, the company distributes part of the dividends to the employees as per according to the recommendations stipulated by the Board of Directors and approved by the General Assembly. The employee share of profi t will be recognized as distribution of profi t in shareholders’ equity statement and as an obligation for the period that the company’s shareholders approved such distribution.
2-13- Related parties transactions:-
All transactions with related parties are booked by the company in the same manner as any other normal transaction with other parties.

254
EGYPTIAN AMERICAN FOR INVESTMENT AND INDUSTRIAL DEVELOPMENT COMPANY S.A.E
254
NOTES TO THE FINANCIAL STATEMENTSfor the fi nancial year ended December 31 ,2012
2-14- Accounting estimates:-
According to the Egyptian accounting standards the preparation of the fi nancial statement requires the management to make some approximations and predictions that affect the value of assets, obligations, revenues and expenses during the fi nancial year. The actual amounts could be quite different from these predictions.
2-15- Expenses:-
All expense, including administrative and general expenses, are to be refl ected in the income statement for the fi nancial period that such expenses were incurred according to accrual bases.
2-16- Legal reserve:-
According to law No. 159 year 1981, its executive directives and the constitution of the company , there should be legal reserve of no less than 5% of the profi t of the company and such reserve should not be increased once this reserve amount reaches 50% of the company’s issued capital.
2-17- Cash fl ows statement:-
The cash fl ow statement will be prepared according to the indirect method.
2-18- Cash and cash equivalents:-
For the purpose of the cash fl ows statement, cash and cash equivalents are to be considered cash on hand and at banks, short term fi xed deposits, cheques under collection and letters of guarantee cover, if any.
2-19- Comparative Figures:-
Comparative fi gures are reclassifi ed whenever it is necessary to amend the presentation used during the current period
2-20- Deferred income tax:-
Income tax is recognized by using liabilities method on the temporary difference between the recognized value for the asset or liability for tax purpose (tax base) and its value which shown in the balance sheet (accounting base) and that by using the applicable tax rate.
Deferred income tax is recognized as asset when there is a strong possibility of using this asset to reduce the future tax profi ts, and the asset is reduced by the part which will not achieve future benefi t.
Deferred tax is included as revenue or expense to the income statement, except for the tax that result from transaction, event in the same or other period which is directly included to the equity .
2-21- Earning (losses) per share:-
Earning (losses) per share is calculated by the weighted average method according to the number of common shares during the year after deducting the employees share and the board of directors’ allowance from the profi ts.
(3) Financial Instruments :-
Financial instruments are made up of any contractual agreement that gives the right to fi nancial assets of the company and creates a fi nancial or shareholding obligation to the other side of the contact.
3-1- Receivables and debtors :-
Receivables and debtors are recognized initially at fair value and subsequently measured at amortized cost using the effective interest method, less provision for impairment. A provision for impairment of receivables is established when there is objective evidence that the company will not be able to collect all amounts due according to the original terms of the receivables.
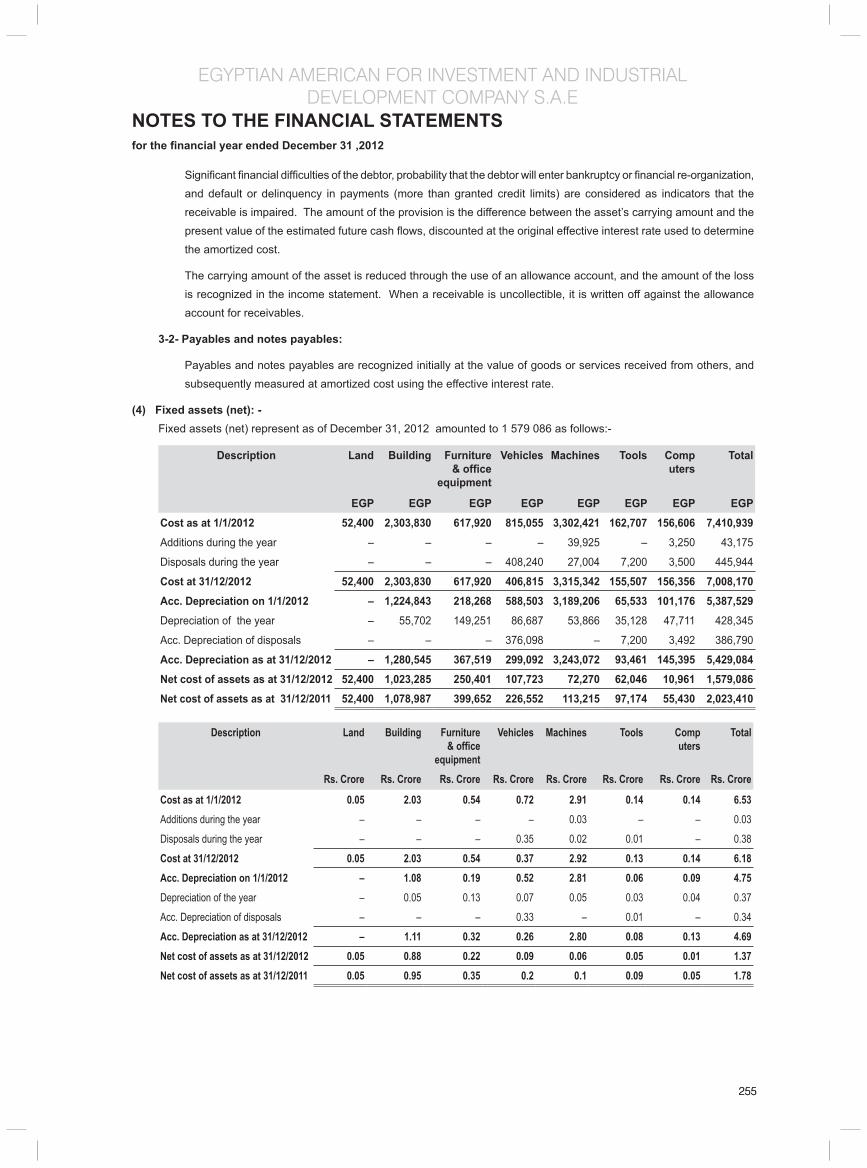
255255
EGYPTIAN AMERICAN FOR INVESTMENT AND INDUSTRIAL DEVELOPMENT COMPANY S.A.E
NOTES TO THE FINANCIAL STATEMENTSfor the fi nancial year ended December 31 ,2012 Signifi cant fi nancial diffi culties of the debtor, probability that the debtor will enter bankruptcy or fi nancial re-organization,
and default or delinquency in payments (more than granted credit limits) are considered as indicators that the receivable is impaired. The amount of the provision is the difference between the asset’s carrying amount and the present value of the estimated future cash fl ows, discounted at the original effective interest rate used to determine the amortized cost.
The carrying amount of the asset is reduced through the use of an allowance account, and the amount of the loss is recognized in the income statement. When a receivable is uncollectible, it is written off against the allowance account for receivables.
3-2- Payables and notes payables:
Payables and notes payables are recognized initially at the value of goods or services received from others, and subsequently measured at amortized cost using the effective interest rate.
(4) Fixed assets (net): - Fixed assets (net) represent as of December 31, 2012 amounted to 1 579 086 as follows:-
Description Land Building Furniture& offi ce
equipment
Vehicles Machines Tools Computers
Total
EGP EGP EGP EGP EGP EGP EGP EGPCost as at 1/1/2012 52,400 2,303,830 617,920 815,055 3,302,421 162,707 156,606 7,410,939 Additions during the year – – – – 39,925 – 3,250 43,175
Disposals during the year – – – 408,240 27,004 7,200 3,500 445,944
Cost at 31/12/2012 52,400 2,303,830 617,920 406,815 3,315,342 155,507 156,356 7,008,170 Acc. Depreciation on 1/1/2012 – 1,224,843 218,268 588,503 3,189,206 65,533 101,176 5,387,529 Depreciation of the year – 55,702 149,251 86,687 53,866 35,128 47,711 428,345
Acc. Depreciation of disposals – – – 376,098 – 7,200 3,492 386,790
Acc. Depreciation as at 31/12/2012 – 1,280,545 367,519 299,092 3,243,072 93,461 145,395 5,429,084 Net cost of assets as at 31/12/2012 52,400 1,023,285 250,401 107,723 72,270 62,046 10,961 1,579,086 Net cost of assets as at 31/12/2011 52,400 1,078,987 399,652 226,552 113,215 97,174 55,430 2,023,410
Description Land Building Furniture& offi ce
equipment
Vehicles Machines Tools Computers
Total
Rs. Crore Rs. Crore Rs. Crore Rs. Crore Rs. Crore Rs. Crore Rs. Crore Rs. Crore
Cost as at 1/1/2012 0.05 2.03 0.54 0.72 2.91 0.14 0.14 6.53Additions during the year – – – – 0.03 – – 0.03
Disposals during the year – – – 0.35 0.02 0.01 – 0.38
Cost at 31/12/2012 0.05 2.03 0.54 0.37 2.92 0.13 0.14 6.18Acc. Depreciation on 1/1/2012 – 1.08 0.19 0.52 2.81 0.06 0.09 4.75Depreciation of the year – 0.05 0.13 0.07 0.05 0.03 0.04 0.37
Acc. Depreciation of disposals – – – 0.33 – 0.01 – 0.34
Acc. Depreciation as at 31/12/2012 – 1.11 0.32 0.26 2.80 0.08 0.13 4.69Net cost of assets as at 31/12/2012 0.05 0.88 0.22 0.09 0.06 0.05 0.01 1.37Net cost of assets as at 31/12/2011 0.05 0.95 0.35 0.2 0.1 0.09 0.05 1.78

256
EGYPTIAN AMERICAN FOR INVESTMENT AND INDUSTRIAL DEVELOPMENT COMPANY S.A.E
256
NOTES TO THE FINANCIAL STATEMENTSfor the fi nancial year ended December 31 ,2012
The depreciation charged as follows:-
Description Depreciationof the year
Charged tocost of
sales
Charged toincome
statement
Depreciationof the year
Charged tocost of
sales
Charged toincome
statement
EGP EGP EGP Rs. Crore Rs. Crore Rs.CroreBuilding and constructions 55,702 55,702 – 0.05 0.05 –
Furniture & offi ce equipment 149,251 – 149,251 0.13 – 0.13
Vehicles 86,687 – 86,687 0.07 – 0.07
Tools & equipment 53,866 53,866 – 0.05 0.05 –Machinery 35,128 35,128 – 0.03 0.03 –Computers 47,711 – 47,711 0.04 – 0.04
Total 428,345 144,696 283,649 0.37 0.13 0.24
(5) Projects in progress :-
Projects in progress represent as of December 31, 2012 amounted to EGP 33, 701 as follows:
year ended December 31,2012 2011 2012 2011EGP EGP Rs. Crore Rs. Crore
Tools & equipments 33,701 33,701 0.03 0.03
33,701 33,701 0.03 0.03
(6) Inventory :-
Inventory represent as of December 31, 2012 amounted to EGP 4, 057, 968 as follows:
Packing & packaging materials
2,118,186 928,499 1.83 0.82
Raw materials 1,654,940 2,159,549 1.43 1.9
Finished production 729,985 290,389 0.63 0.26
Work in process production 54,857 62,147 0.05 0.05
4,557,968 3,440,584 3.94 3.03
LessImpairment in the value of inventory
500,000 – 0.43 –
4,057,968 3,440,584 3.51 3.03
(7) Receivables:-
Receivables represent as of December 31, 2012 amounted to EGP 2, 618, 295 as follows:
Local receivable 2,618,295 5,710,261 2.26 5.02
2,618,295 5,710,261 2.26 5.02

257257
EGYPTIAN AMERICAN FOR INVESTMENT AND INDUSTRIAL DEVELOPMENT COMPANY S.A.E
NOTES TO THE FINANCIAL STATEMENTSfor the fi nancial year ended December 31 ,2012
(8) Debtors and other debit balances:
Debtors and other debit balances represent as of December 31, 2012 amounted to EGP 140, 201 as follows:
year ended December 31,2012 2011 2012 2011EGP EGP Rs.Crore Rs.Crore
Suppliers –advanced payments 120,013 135,887 0.10 0.12
Prepaid expenses 7,446 18,846 0.01 0.02
Deposits with others – 8,639 – 0.01
Employees loans – 1,597 – –
Other debit accounts 12,742 6,443 0.01 0.01
140,201 171,412 0.12 0.15
(9) Cash at banks and equivalent:-
Cash at banks and equivalent represent as of December 31, 2012 amounted to EGP 2, 172, 258 as follows:
Cheques under collection (less than 3 months
2,127,270 1,643,993 1.84 1.45
Banks – local currency 44,897 41,613 0.04 0.04
Banks – foreign currency 91 186,670 – 0.16
2,172,258 1,872,276 1.88 1.65
(10) Due to related parties: -
Due to related parties represent as of December 31, 2012 amounted to EGP 14, 993, 775 as follows:
Marico Middle East Company 12,440,543 11,778,467 10.76 10.36
MEL Consumer Care Company
2,522,495 3,647,465 2.18 3.21
Marico limited Company - India
30,737 56,396 0.03 0.05
14,993,775 15,482,328 12.96 13.62
(11) Payables and notes payable:-
Payables and notes payable represent as of December 31, 2012 amounted to EGP 3, 434, 388 as follows:
Payables 1,433,367 3,202,514 1.24 2.82
Notes payables 2,001,021 3,352,847 1.73 2.95
3,434,388 6,555,361 2.97 5.77

258
EGYPTIAN AMERICAN FOR INVESTMENT AND INDUSTRIAL DEVELOPMENT COMPANY S.A.E
258
NOTES TO THE FINANCIAL STATEMENTSfor the fi nancial year ended December 31 ,2012
(12) Creditors and other credit balances:-
Creditors and other credit balances represent as of December 31, 2012 amounted to EGP 1, 406, 488 as follows:
12/31/2012 12/31/2011 12/31/2012 12/31/2011EGP EGP Rs.Crore Rs.Crore
Accrued expenses 635,067 676,498 0.55 0.60
Sales tax 588,533 612,207 0.51 0.54
Clients - advanced payments – 286,673 – 0.25
Stamp tax 103,797 122,685 0.09 0.11
Withholding tax 29,937 20,990 0.03 0.02
Salaries & wages tax 12,308 15,860 0.01 0.01
Social insurance authority 12,730 13,296 0.01 0.01
Other credit balances 24,116 25,569 0.02 0.02
1,406,488 1,773,778 1.22 1.56
(13) Capital:-
A - Authorized capital :-
The company’s authorized capital amounted to EGP 25 million (twenty fi ve million Egyptian pound) distributed over 250000 share, the nominal value of each share is EGP 100 (one hundred Egyptian pound).
A - Issued and paid capital :-
- The issued capital was determined by EGP 6,892,000 (six million and eight hundred ninety two thousand Egyptian pound) distributed over 68920 share (sixty eight thousand and nine hundred twenty share) , the per value of each share is EGP 100 ( one hundred Egyptian pound ) and all of which are nominal cash shares which is fully paid, according to general authority for investment and free zones decision No. 235/2 for year 2007 the company issued capital is determined by EGP 6892000 after excluding an amount of EGP 493 and being carried forward to the reserves.
- The shareholder Mr/ Brajesh Bajpai sold all his shares which represented in 50 shares of per value of share EGP 100 to Mr/ Aditya Kumar and this is in accordance the certifi cate which issued by the Egyptian stock exchange session on January 4, 2010.
- The shareholder Mr/ Aditya Kumar sold all his shares which represented in 50 shares of per value of share EGP 100 to Mr/ Sumatra Baht and this is in accordance to the certifi cate which issued by the Egyptian stock exchange session on March 22, 2012.
- The Issued and paid capital is distributed as follows:
Name Nationality No. of share
Value of each share
Amount Amount
EGP EGP Rs.Crore
Mr. Harsh Charandas Mariwala Indian 320 100 32,000 0.03
Mr. Milind Shripad Sarwate Indian 320 100 32,000 0.03
Mr. Sumatra Baht Indian 50 100 5,000 –
Marico Middle East Emirates 68 230 100 6,823,000 5.90
68 920 6,892,000 5.96

259259
EGYPTIAN AMERICAN FOR INVESTMENT AND INDUSTRIAL DEVELOPMENT COMPANY S.A.E
NOTES TO THE FINANCIAL STATEMENTSfor the fi nancial year ended December 31 ,2012
(14) Deferred tax liabilities:
This item is made up as follows:
year ended December 31,
Liabilities Liabilities Liabilities Liabilities
12/31/2012 12/31/2011 12/31/2012 12/31/2011
EGP EGP Rs.Crore Rs.Crore
Fixed assets 85,101 85,101 0.07 0.07
85,101 85,101 0.07 0.07
(15) Sales (net):
This item is made up as follows:
Activity revenues 41,590,979 32,974,090 35.96 29.01
Less :
Trade discount 18,123,671 14,567,887 15.67 12.82
23,467,308 18,406,203 20.29 16.2
(16) Earning (losses) per share:
Earning (losses) per share are determined as follows:
Net profi ts (losses) of the year 1,817,647 4,417,224 1.57 3.89
Number of shares 68,920 68,920 – –
Earning (losses) per share (EGP /share) 26.37 64.09 – –
(17) Cash & its equivalent (for the purpose of preparing statement of cash fl ows):
This item is made up as follows:
Cash at banks & its equivalent 2,172,258 1,872,276 1.88 1.65
Less:
Banks (over darft) 168,294 659,261 0.15 0.58
2,003,964 1,213,015 1.73 1.07
(18) Related parties transactions:-
This item is made up as follows:
Name of company Type of relationship Nature of dealing Transactionvolume per year
Transaction volumeper year - INR
Marico Limited India Related party Royalty expense 119,174 0.10
Marico Limited India Related party Finance 25,659 0.02
Marico Middle East Related party Finance 662,076 0.57
MEL Consumer Care Related party Finance 1,124,970 0.97

260
EGYPTIAN AMERICAN FOR INVESTMENT AND INDUSTRIAL DEVELOPMENT COMPANY S.A.E
260
NOTES TO THE FINANCIAL STATEMENTSfor the fi nancial year ended December 31 ,2012
(19) Tax status:-
A. Corporate tax:
- The company has tax exemption according to article No. (16) of law No. (8) for year 1997 and up to December 31,2012 .
- The company was not examined from the beginning of its activity till now.
B. Salaries & wages tax:
- The company was examined from the beginning of its activity till year December 31, 2008
- The company currently examine the period from January 1, 2009 to December 31, 2010
C. Stamp duty tax:
The company was examined from the beginning of the activity till December 31, 2010 and all difference have been settled.
D. Sales tax:
The company was examined from the beginning of the activity till December 31, 2010 and all the difference have been settled.
E. Withholding tax:
The company was examined from the beginning of the activity till 31/12/2010.
(2) Financial Instruments & Risk Management:
20-1- Fair value of fi nancial instruments:
The company’s fi nancial instruments are represented in cash on hand & at bank, clients and creditors. The fair value of the fi nancial instruments does not materially differ from its book value at year end.
20-2- Credit risk:
Credit risk is represented in the disability of the clients to pay their duties, this risk is considered a limited risk as the company distribute this risk among a number of private sector clients which has strong & stable fi nancial position. The company is preparing a provision for bad debts to face the client’s disability to pay their debts.
20-3- Exchange rate risk:
Foreign currency translation consists of the change in foreign currencies which affect payments and proceeds in foreign currencies and also evaluation of assets & liabilities in foreign currencies. Here is the net value of foreign currencies balances in the date of the balance sheet:
Foreign currency (Defi ciency) (Defi ciency) (Defi ciency)
Foreign currency Egyptian Pound INR
U.S Dollar (15,593) (99,639) (0.09)
As stated in note no. (2-4) of foreign currency translation, assets and liabilities were reevaluated at year end at the exchange rate declared as of that date.
20-4- Interest risk:
Interest risk represents the change in currency rate which affect the results of business and this risk does not exist because the company does not depend on bank credit facilities to fi nance working capital and long term assets.
(21) Comparison fi gures have been reclassifi ed to confi rm with current year classifi cation.

261
MARICO EGYPT FOR INDUSTRIES (SAE)
Board of Directors Rohit Jaiswal
Debashish Neogi
Padmanabh Maydeo
Saumitra Bhat
Ashutosh Telang
Sridhar Balakrishanan
Registered Offi ce 11B Hegaz Sq., Mohandesen, Giza, Egypt
Auditors Moore Stephens
Bankers HSBC Limited
NSGB
Legal Advisors Yasser Maharem Offi ce for Accounting & Auditing Nassef Law fi rm

262
MARICO EGYPT FOR INDUSTRIES (SAE)
To: The shareholders of Marico Egypt For Industries (SAE)
Report on the fi nancial statement
We have audited the accompanying balance sheet of Marico Egypt for industries SAE as of December 31, 2012 and the related statements of income, changes in shareholders’ equity and cash fl ows for the year then ended and a summary of signifi cant accounting policies and other explanatory notes.
Management’s responsibility for the fi nancial statements
These fi nancial statements are the responsibility of the company’s management. The management is responsible for the preparation and fair presentation of these fi nancial statements in accordance with Egyptian Accounting Standards and in the light of the Egyptian laws. This responsibility includes designing , implementing and maintaining internal control relevant to the preparation and fair presentation of fi nancial statements that are free from material misstatement , whether due to fraud or error, selecting and applying appropriate accounting policies and making accounting estimates that are reasonable in the circumstances .
Auditor’s responsibility
Our responsibility is to express an opinion on these fi nancial statements based on our audit. We conducted our audit in accordance with the Egyptian Auditing Standards and the relevant laws and regulations. Those standards require planning and audit performance to obtain reasonable assurance about whether the fi nancial statements are free from material misstatements.
An audit involves performing procedures to obtain audit evidence about the amounts and disclosures in the fi nancial statements. The procedures selected depend on the auditor’s personal judgment, including the assessment of the risks of material misstatement of the fi nancial statements. Whether due to fraud or error. In making those risk assessment, the auditor considers internal control relevant to the entity’s preparation and fair presentation of the fi nancial statements in order to design audit procedures that are appropriate in the circumstances, but not for the purpose of expressing an opinion on the effectiveness of the entity ‘s internal control . An audit also includes evaluating the appropriateness of accounting policies used and the reasonableness of accounting estimates made by management, as well as evaluating the overall presentation of the fi nancial statements.
We believe that the audit evidence we have obtained is suffi cient and appropriate to provide a basis for our audit opinion.
Opinion
In our opinion the fi nancial statement present fairly in all material respects, the fi nancial position of Marico Egypt for industries SAE as of December 31, 2012 and of its fi nancial performance and its cash fl ows for the fi nancial year then ended, in accordance with the Egyptian Accounting Standards and the relevant laws and regulations.
Report on other Legal and regulatory requirements
The company keeps proper accounting records, include all that is required by law to be recorded therein and the accompanying fi nancial statements are agreement therewith, the company applies a suffi cient costing system. Inventory count and valuation was made by the company’s management and in accordance with the proper process.
The fi nancial information included in the board of directors’ report in compliance with companies law no. 159 year 1981 and its executive regulation and it’s agreed with the accounting record of the company to the extent that such information is recorded therein.
Cairo 17/01/2013
Sherin Noureldin
R.A.A. 6809
Moore Stephens Egypt
INDEPENDENT AUDITORS’ REPORT
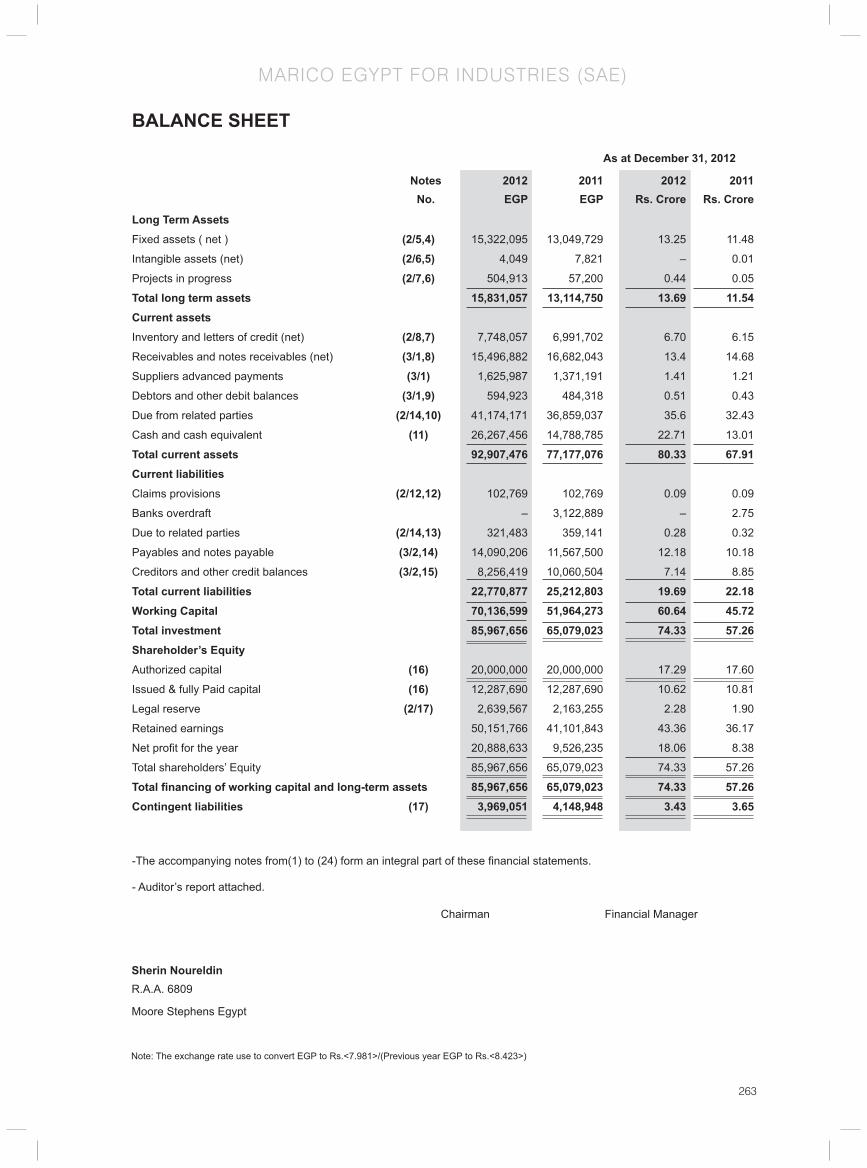
263
MARICO EGYPT FOR INDUSTRIES (SAE)
BALANCE SHEET
As at December 31, 2012
Notes 2012 2011 2012 2011 No. EGP EGP Rs. Crore Rs. Crore
Long Term Assets
Fixed assets ( net ) (2/5,4) 15,322,095 13,049,729 13.25 11.48
Intangible assets (net) (2/6,5) 4,049 7,821 – 0.01
Projects in progress (2/7,6) 504,913 57,200 0.44 0.05
Total long term assets 15,831,057 13,114,750 13.69 11.54Current assets Inventory and letters of credit (net) (2/8,7) 7,748,057 6,991,702 6.70 6.15
Receivables and notes receivables (net) (3/1,8) 15,496,882 16,682,043 13.4 14.68
Suppliers advanced payments (3/1) 1,625,987 1,371,191 1.41 1.21
Debtors and other debit balances (3/1,9) 594,923 484,318 0.51 0.43
Due from related parties (2/14,10) 41,174,171 36,859,037 35.6 32.43
Cash and cash equivalent (11) 26,267,456 14,788,785 22.71 13.01
Total current assets 92,907,476 77,177,076 80.33 67.91Current liabilities Claims provisions (2/12,12) 102,769 102,769 0.09 0.09
Banks overdraft – 3,122,889 – 2.75
Due to related parties (2/14,13) 321,483 359,141 0.28 0.32
Payables and notes payable (3/2,14) 14,090,206 11,567,500 12.18 10.18
Creditors and other credit balances (3/2,15) 8,256,419 10,060,504 7.14 8.85
Total current liabilities 22,770,877 25,212,803 19.69 22.18Working Capital 70,136,599 51,964,273 60.64 45.72Total investment 85,967,656 65,079,023 74.33 57.26Shareholder’s Equity Authorized capital (16) 20,000,000 20,000,000 17.29 17.60
Issued & fully Paid capital (16) 12,287,690 12,287,690 10.62 10.81
Legal reserve (2/17) 2,639,567 2,163,255 2.28 1.90
Retained earnings 50,151,766 41,101,843 43.36 36.17
Net profi t for the year 20,888,633 9,526,235 18.06 8.38
Total shareholders’ Equity 85,967,656 65,079,023 74.33 57.26
Total fi nancing of working capital and long-term assets 85,967,656 65,079,023 74.33 57.26Contingent liabilities (17) 3,969,051 4,148,948 3.43 3.65
-The accompanying notes from(1) to (24) form an integral part of these fi nancial statements.
- Auditor’s report attached. Mukesh Kriplani Aditya Shome Chairman Financial Manager
Sherin Noureldin R.A.A. 6809
Moore Stephens Egypt
Note: The exchange rate use to convert EGP to Rs.<7.981>/(Previous year EGP to Rs.<8.423>)484 / EGP (Rs. 8.858 / EGP)

264
MARICO EGYPT FOR INDUSTRIES (SAE)
Note: The exchange rate use to convert EGP to Rs.<7.981>/(Previous year EGP to Rs.<8.423>)484 / EGP (Rs. 8.858 / EGP)
Year ended December 31, 2012
Notes 2012 2011 2012 2011 EGP EGP Rs. Crore Rs. Crore
Sales (net) (2/11) 101,635,142 71,772,634 87.87 63.15
Less
Cost of sales 53,157,494 36,726,644 45.96 32.32
Gross profi t of activity 48,477,648 35,045,990 41.91 30.84
Less
Selling & distribution expenses 15,484,362 15,602,390 13.39 13.73
General & administrative expenses 11,124,393 9,778,516 9.62 8.60
Depreciation and amortization (4) 451,920 379,621 0.39 0.33
Royalty 524,883 401,188 0.45 0.35
Debit interest 223,364 55,263 0.19 0.05
27,808,922 26,216,978 24.04 23.07
Operating income 20,668,726 8,829,012 17.87 7.77
Add / (less)
Gains from currency revaluation differences (2/4) 160,567 370,420 0.14 0.33
Revenues from sale of scrap 88,132 65,430 0.08 0.06
Capital gains (Loss) 28,792 1,373 0.02 –
Provisions no longer required – 260,000 – 0.23
Net Profi t for the year 20,888,633 9,526,235 18.06 8.38
Earning per share (EGP/Share) (18,2/20) 17 8 Rs. 146.982 Rs. 70.392
-The accompanying notes from(1) to (24) form an integral part of these fi nancial statements.
INCOME STATEMENT
Chairman Financial Manager

265
MARICO EGYPT FOR INDUSTRIES (SAE)
STATEMENT OF CHANGES IN SHAREHOLDERS’ EQUITY
Year ended December 31, 2012
Description Issued and fully Legal Retained Profi ts Total paid capital Reserves Profi ts (losses) for (losses) the year EGP EGP EGP EGP EGP
Balance as of 1/1/2011 12,287,690 1,447,026 27,493,476 14,324,596 55,552,788
Transferred to legal reserve – 716,229 716,229 – –
Transferred to retained earnings – – 14,324,596 14,324,596 –
Net profi t of the year 2011 – – – 9,526,235 9,526,235
Balance as of 31/12/2011 12,287,690 2,163,255 41,101,843 9,526,235 65,079,023
Balance as of 1/1/2012 12,287,690 2,163,255 41,101,843 9,526,235 65,079,023
Transferred to legal reserve – 476,312 476,312 – –
Transferred to retained earnings – – 9,526,235 9,526,235 –
Net profi t of the year 2012 – – – 20,888,633 20,888,633
Balance as of 31/12/2012 12,287,690 2,639,567 50,151,766 20,888,633 85,967,656
Statement of changes in shareholder’s equity For the year ended December 31, 2012
Description Issued and fully Legal Retained Profi ts Total paid capital Reserves Profi ts (losses) for (losses) the year Rs. Crore Rs. Crore Rs. Crore Rs. Crore Rs. Crore
Balance as of 1/1/2011 9.46 1.11 21.17 11.03 42.78
Transferred to legal reserve – 0.63 0.63 – –
Transferred to retained earnings – – 12.60 12.60 –
Net profi t of the year 2011 – – – 8.38 8.38
Balance as of 31/12/2011 10.81 1.90 36.17 8.38 57.26
Balance as of 1/1/2012 10.81 1.90 36.17 8.38 57.26
Transferred to legal reserve – 0.41 0.41 – –
Transferred to retained earnings – – 8.24 8.24 –
Net profi t of the year 2012 – – – 18.06 18.06
Balance as of 31/12/2012 10.62 2.28 43.36 18.06 74.33
Note: The exchange rate use to convert EGP to Rs.<7.981>/(Previous year EGP to Rs.<8.423>)484 / EGP (Rs. 8.858 / EGP)
Mukesh Kriplani Aditya Shome Chairman Financial Manager

266
MARICO EGYPT FOR INDUSTRIES (SAE)
Year ended December 31, 2012
Notes 2012 2011 2012 2011 EGP EGP Rs. Crore Rs. Crore
Cash fl ows from operating activities
Net profi t from income statement 20,888,633 9,526,235 18.06 8.38
Adjustments to reconcile net profi t with nonemonetary items in income statement
Depreciation and amortization 2,000,625 1,260,900 1.73 1.11
Adjustments to fi xed assets 291 – 0.01 –
Capital losses (gains) 28,792 1,373 0.02 0.01
Created from Impairment on current assets (19) 400,000 750,000 0.35 0.66
Used from impairment on current assets (19) 759,703 – 0.66 –
Provisions no longer required – 1,660,000 – 1.46
used of claims provision – 159,292 – 0.14
Net profi t before change in working capital 22,558,638 9,716,470 19.50 8.55
(Increase ) in inventory and letters of credit (Net) 406,355 1,407,950 0.35 1.24
Decrease in receivables and notes receivables (Net) 1,194,864 3,328,281 1.03 2.93
(Increase ) in suppliers advanced payments 254,796 968,536 0.22 0.85
(Increase) Decrease in debtors and other debit balances 110,605 4,020,681 0.10 3.54
(Increase ) in due from related parties 4,315,134 10,771,018 3.73 9.48
(Decrease) Increase in due to related parties 37,658 112,830 0.03 0.10
Increase in payables & notes payable 2,522,706 3,012,502 2.18 2.65
(Decrease) Increase in creditors and other credit balances 1,804,085 1,685,108 1.56 1.48
Net cash provided from operating activities 19,347,575 8,728,368 16.73 7.68
Cash fl ows from investment activities
Proceeds from Sale of Fixed assets 12,727 3,600 0.01 –
(Payments) for Purchase of fi xed assets 4,253,829 9,178,660 3.68 8.08
(Payments) for projects in progress 504,913 57,200 0.44 0.05
Net cash (used in) investment activities 4,746,015 9,232,260 4.10 8.12
Net Cash resulting during the year 14,601,560 503,892 12.62 0.44
Cash and cash equivalent at the beginning of the year 11,665,896 12,169,788 10.09 10.71
Cash and cash equivalent at the end of the year (20,2/19) 26,267,456 11,665,896 22.71 10.26
-The accompanying notes from (1) to (24) form an integral part of these fi nancial statements.-Auditor’s report attached
CASH FLOW STATEMENT
Mukesh Kriplani Aditya Shome Chairman Financial Manager
Note: The exchange rate use to convert EGP to Rs.<7.981>/(Previous year EGP to Rs.<8.423>)484 / EGP (Rs. 8.858 / EGP)

267
MARICO EGYPT FOR INDUSTRIES (SAE)
NOTES TO THE FINANCIAL STATEMENTSas of 31 December, 2012
(1) The Company :
The Company was incorporated according to the law No 8 year 1997 of investment guarantees and its executive regulations and was registered in the commercial register under No 79585 dated 26/2/1998 and issued tax card No 253/54/5 in tax investment offi ce under the name “ Pyramids for new Industries Company” .
- The company was amended according to the decree of chairman of the general authority for investment and free zones No 161/P year 2006 which approved to amend of the article No (5) from the company contact according to the decision of the partners meeting which was held on 13/12/2006 and the approving of the amendment project dated 28/12/2006 which was ratifi ed in public notary offi ce on 9/1/2007 under ratifi cation No 15 A for year 2007 to change the name of the company to .Mel Co. for Consumer Care products & its partners “Pyramids modern Industries“ (PMI) “General Partnership Co.”
- According to the decision of chairman of general authority for investment and free zones No2/532 year 2011 and the contract to change the legal entity of the company from general partnership Co to joint stock company according to the law No 8 year 1997 and change the name of the company to Marico Egypt For Industries SAE .
Purpose of the company :-
Manufacture all cosmetics and hair and skin care products also soap, toothpaste, hair shampoo and oil processed and hair dyes and the production of various cleaning materials, pesticides, disinfectants and varnish, all sorts of adhesives and packing the products mentioned .
(2) Signifi cant Accounting Policies :-
2-1- Accounting standards and Legal principles:-
The accompanying fi nancial statements have been prepared in accordance with the Egyptian accounting standards and the related Egyptian laws and regulations in the light of the international fi nancial reporting standards to process cases weren’t stated in the Egyptian standards.
2-2- Basis of preparation of the fi nancial statements:-
- The fi nancial statements have been prepared in Egyptian pounds.
- The fi nancial statements have been prepared according to historical cost and continuity presumption.
2-3- Change in accounting principles:-
The accounting principles comply with those adopted in the previous year.
2-4- Foreign currency translation:-
The company maintains its books in Egyptian pounds. All transactions denominated in foreign currencies were translated into Egyptian pounds at the rate determined on the transaction date, and on the balance sheet. The monetary current assets and liabilities are revaluated accordance to the rates announced on that date and the differences are charged to income statement.
2-5- Fixed assets (net):-
Recognition and preliminary measurement:
Buildings, constructions, infrastructures, machines and equipment are booked at historical cost less the accumulated depreciation and any impairment.
The cost includes all direct cost for acquisition the assets also cost of its disposal and rearranging the site where assets were present.

268
MARICO EGYPT FOR INDUSTRIES (SAE)
The Deprecation
Fixed assets are presented in the balance sheet at historical cost, are deprecated using straight line method and according to estimated useful life of each asset in accordance with the following.
- Building 5% Straight line method
- Machinery 12.50% Declining method
- Equipment & Lab (S.O.E) 25% Declining method
- Computers 50% Declining method
- Furniture and offi ces Equipment 25% Declining method
- Vehicles 25% Declining method
2-6- Intangible assets:
Recognition:
Assets that have non-monetary nature which can be identifi ed and have no physical presence and acquired for the activity that expected future benefi ts as tangible assets. Intangible assets represent in the use of computer programs.
Preliminary measurement:
Intangible assets are measured at the cost which is represented in monetary price at the date of acquisition, and it is included net after deduction of accumulated amortization and impairment losses in the value of assets.
Amortization:
The value of Amortization charged to income statement in accordance with the straight line method over the estimated useful lives of intangible assets, if its useful lives are not defi nite. The impairment in the value of intangible assets is calculated at the date of balance sheet and amortized from the date it becomes available for use according to the following rates:
Description Estimated life
Year
Computer programs 2
2-7- Projects in progress:
Projects under progress are stated at cost and include all direct expenses required to prepare the asset to be in a state of operation and for the purpose for which it was acquired. Projects under progress are recorded as fi xed assets once it is fi nished and it is available for the purpose it was acquired for. Projects under progress are valued at the date of the balance sheet by to its cost after deducting the impairment in its value if any.
2-8- Inventory (net):
Inventories are stated at the lower of cost and net realizable value. Cost is determined using the weighted average method. The cost of fi nished goods and work in progress comprises raw materials, direct labor and other direct costs. Net realizable value is the estimated selling price in the ordinary operating case, less all variable selling expenses. Provision is made up in case of impairment in value.
2-9- Impairment in the Value of non-Financial Assets:
The book value of the Company’s non-fi nancial assets, other than inventory and deferred tax assets, is reviewed at the date of each fi nancial position to ascertain the amount of impairment. The Company carries out a regular
NOTES TO THE FINANCIAL STATEMENTSas of 31 December 2012

269
MARICO EGYPT FOR INDUSTRIES (SAE)
review to ascertain if there has been impairment in the value of an asset and in case that there is an indication of such impairment; the resale value of the asset is compared with the book value. If the book value is above the resale value, then there is impairment in the value of the asset and is reduced to its resale value and the loss is charged in the income statement. The impairment loss which is previously recognized may be returned in case that there is a change in the resale value to the extent that the amount was reduced in the past.
2-10- Impairment in the Value of Financial Assets:
Annually on each balance sheet date, an objective estimate is carried out to ascertain if there is true indication that any of the assets have been impaired. Once there is a impairment in the value of an asset the loss is recorded only if there are objective proofs that the impairment of the value was due to an incident or more after the initial realization of the asset and that such incident or incidents had an affect that can be evaluated in a reliable manner for the expected future cash fl ow from the asset. In the case of fi nancial assets that are recorded according to their amortized cost , the losses due to impairment are represented in the difference between the book value of such asset and the present value of the future cash fl ow that has been discounted by the original actual interest rate relating to this asset.
The book value of the fi nancial asset is reduced directly except in case of clients accounts that is reduced using provisions. Any amount that is not to be collected is to be written off from the provision and the amount of the realized loss will be reimbursed either directly or by settling the provisions account. It should be ensured that such reversal will not generate a book value for the asset which is higher than the amortized cost at the date of the writing off of the amount of impairment if such impairment has not been recognized. The amount of write off will be refl ected in the income statement.
2-11- Revenue Recognition:
Revenue is recognized once the service has been carried out and invoice has been issued according to the accrual principle.
Regarding the revenues from dividends due on fi nancial notes and investments in subsidiary companies, this income is recognized once the general assembly has approved the distribution to its investors.
2-12- Provisions:
A provision is recognized once the Company has a current legal or actual obligation due to a previous incident which is likely to require the use of economic sources to settle such obligation while preparing a valuation of the value of the obligation. The provisions are to be reviewed on the anniversary of the balance sheet and amended to refl ect the most accurate present valuation and in case that the present value of cash is of essence, then the amount which is recognized as provision is the present value of the expected expenses to settle the obligation.
2-13- Employees Benefi ts:
Social insurance & Pension Scheme
The Company contributes to the government social insurance system on behalf of the employees according to the social insurance law No. 79 year 1975 and its amendments. The employees and the Company contribute according to this law with a fi xed percentage of their salary and the Company’s obligation is limited to its contribution. The Company’s contribution is refl ected in the income statement according to the accrual principle.
Employee profi t share
According to its constitution, the Company distributes part of the dividends to the employees as per according to the recommendations stipulated by the Board of Directors and approved by the General Assembly. The employee share of profi t will be recognized as distribution of profi t in shareholder’s equity statement and as an obligation for the period that the Company’s shareholders approved such distribution.
NOTES TO THE FINANCIAL STATEMENTSas of 31 December 2012

270
MARICO EGYPT FOR INDUSTRIES (SAE)
2-14- Related parties’ transactions:
All transactions with related parties are booked by the Company in the same manner as any other normal transaction with other parties.
2-15- Accounting Estimates:
According to the Egyptian accounting standards the preparation of the fi nancial statement requires the management to make some approximations and predictions that affect the value of assets, obligations, revenues and expenses during the fi nancial year. The actual amounts could be quite different from these predictions.
2-16- Expenses:
All expense, including administrative and general expenses, are to be refl ected in the income statement for the fi nancial period that such expenses were incurred according to accrual bases.
2-17- Legal Reserve:
According to Law No. 159 year1981, its executive directives and the constitution of the Company, there should be a legal reserve of no less than 5% of the profi t of the Company and such reserve should not be increased once this reserve amount reaches 50% of the Company’s issued share capital.
2-18- Cash Flows Statement:
The cash fl ow statement will be prepared according to the indirect method.
2-19- Cash and cash equivalent:
For the purpose of the cash fl ows statement, cash and cash equivalents are to be considered cash on hand and at banks, short term fi xed deposits, cheques under collection and letters of guarantee cover, if any.
2-20- Earning (losses) per share:
Earning per share is calculated by the weighted average method according to the number of common shares during the year after deducting the employees share and the board of directors’ allowance from the profi ts.
2-21- Income Tax:
Income tax is calculated by using balance sheet liability method, on temporary differences arising between the tax bases of assets and liabilities and their carrying amounts in the fi nancial (accounting basis) by using the tax rate. Deferred income tax assets are recognized only to the extent that it is probable that future taxable profi t will be available against which the temporary differences can be utilized.
Deferred tax are charged as revenue or expenses to income statement with the exception of tax that results from the transaction in the same period or other period directly charged to equity.
2-22- Comparative fi gures:
Comparative fi gures are reclassifi ed whenever it is necessary to amend the presentation used during the current period.
3 Financial Instruments
Financial instruments are made up of any contractual agreement that gives the right to fi nancial assets of the company and creates a fi nancial or shareholding obligation to the other side of the contact.
3-1- Receivables, debtors and notes receivables (net) :-
Receivables, debtors and notes receivables are recognized initially at fair value and subsequently measured at amortized cost using the effective interest method, less provision for impairment. A provision for impairment of receivables is established when there is objective evidence that the Company will not be able to collect all amounts
NOTES TO THE FINANCIAL STATEMENTSas of 31 December, 2012

271
MARICO EGYPT FOR INDUSTRIES (SAE)
due according to the original terms of the receivables. Signifi cant fi nancial diffi culties of the debtor, probability that the debtor will enter bankruptcy or fi nancial re-organization, and default or delinquency in payments (more than granted credit limits) are considered as indicators that the receivable is impaired. The amount of the provision is the difference between the asset’s carrying amount and the present value of the estimated future cash fl ows, discounted at the original effective interest rate used to determine the amortized cost. The carrying amount of the asset is reduced through the use of an allowance account, and the amount of the loss is recognized in the income statement. When a receivable is uncollectible, it is written off against the allowance account for receivables.
3-2- Payables and notes payables:-
Payables and notes payables are recognized initially at the value of goods or services received from others, and subsequently measured at amortized cost using the effective interest rate.
(4) Fixed Assets (Net) :
Fixed assets (net) represent as of December 31, 2012 amounted to EGP 15,322,095 as follows:-
Description Land Building Machines Equipment
& lab
Computers Furintureand
offi cesEquipment
Vehicles Total
EGP EGP EGP EGP EGP EGP EGP EGPCost as of 1/1/2012 199,530 3,266,638 11,479,875 373,931 206,609 1,196,414 559,500 17,282,497
Additions during the year – – 3,426,935 212,683 43,949 267,462 360,000 4,311,029
Disposals during the year – – 150,000 – – – – (150,000)
Adjustment to the beginning cost – – 185,728 903 763 164 – 183,898
Cost as of 31/12/2012 199,530 3,266,638 14,942,538 585,711 249,795 1,463,712 919,500 21,627,424
Acc . Deperciation at 1/1/2012 – 447,411 3,078,828 112,082 113,215 416,170 65,062 4,232,768
Depreciation of the year – 164,239 1,299,365 85,101 56,007 231,131 161,009 1,996,852
Acc. Depreciation of disposals – – 108,481 – – – – (108,481)
Adjustment to Acc.Depreciation – – 185,226 8 847 181 – 184,190
Acc . Deperciation at 31/12/2012 – 611,650 4,454,938 197,175 168,375 647,120 226,071 6,305,329
Fixed assets (Net) as of 31/12/2012 199,530 2,654,988 10,487,600 388,536 81,420 816,592 693,429 15,322,095
Fixed assets (Net) as of 31/12/2011 199,530 2,819,227 8,401,047 261,849 93,394 780,244 494,438 13,049,729
Description Land Building Machines Equipment
& lab
Computers Furintureand
offi cesEquipment
Vehicles Total
Rs. Crore Rs. Crore Rs. Crore Rs. Crore Rs. Crore Rs. Crore Rs. Crore Rs. CroreCost as of 1/1/2012 0.18 2.87 10.10 0.33 0.18 1.05 0.49 15.21
Additions during the year – – 2.96 0.18 0.04 0.23 0.31 3.73
Disposals during the year – – 0.13 – – – – 0.13
Adjustment to the beginning cost – – 0.16 – – – – 0.16
Cost as of 31/12/2012 0.17 2.82 12.92 0.51 0.22 1.27 0.79 18.97 Acc . Deperciation at 1/1/2012 – 0.39 2.71 0.10 0.10 0.37 0.06 3.72
Depreciation of the year – 0.14 1.12 0.07 0.05 0.20 0.14 1.73
Acc. Depreciation of disposals – – 0.09 – – – – 0.09
Adjustment to Acc.Depreciation – – 0.16 – – – – 0.16
Acc . Deperciation at 31/12/2012 – 0.53 3.85 0.17 0.15 0.56 0.20 5.45
Fixed assets (Net) as of 31/12/2012 0.17 2.30 9.07 0.34 0.07 0.71 0.60 13.25 Fixed assets (Net) as of 31/12/2011 0.18 2.48 7.39 0.23 0.08 0.69 0.44 11.48
There is no mortgages or restrictions on ownership of assets
There are no fi xed assets unused or not working temporarily The depreciation charged as follows:-
NOTES TO THE FINANCIAL STATEMENTSas of 31 December 2012

272
MARICO EGYPT FOR INDUSTRIES (SAE)
The depreciation charged as follows:-
Description Total Charged to Charged to Total Charged to Charged toCost of Income Cost of Income
Sales Statement Sales StatementEGP EGP EGP Rs. Crore Rs. Crore Rs. Crore
Building 164,239 164,239 – 0.14 0.14 –
Machines 1,299,365 1,299,365 – 1.12 1.12 –
Equipment & lab (S.O.E) 85,101 85,101 – 0.07 0.07 –
Computer 56,007 – 56,007 0.05 – 0.05
Vehicles 161,009 – 161,009 0.14 – 0.14
Furniture and offi ces Equipment 231,131 – 231,131 0.20 – 0.20
1,996,852 1,548,705 448,147 1.72 1.33 0.39 Amortization of intangible assets 3,773 – 3,773 – –
Total 2,000,625 1,548,705 451,920 1.72 1.33 0.39
(5) Intangible assets (net) :
The intangible assets represent as of December 31, 2012 amounted to EGP 4,049 as follows :
31/12/2012 31/12/2011 31/12/2012 31/12/2011EGP EGP Rs. Crore Rs. Crore
Cost as of December 31 79,043 79,043 0.07 0.07
Less:
Accumulated amortization till December 31 74,994 71,222 0.06 0.06
4,049 7,821 0.01 0.01
(6) Projects in progress :
Projects in progress represent as of December 31, 2012 amounted to EGP 504,913 as follows :
31/12/2012 31/12/2011 31/12/2012 31/12/2011EGP EGP Rs. Crore Rs. Crore
Machinery 504,913 – 0.44 –
Equipment & lab (S.O.E) – 57,200 – 0.05
504,913 57,200 0.44 0.05
(7) Inventory and letters of credit (net) :
The inventory and letters of credit represent as of December 31, 2012 amounted to EGP 7,748,057 as follows:
31/12/2012 31/12/2011 31/12/2012 31/12/2011EGP EGP Rs. Crore Rs. Crore
Raw materials 3,620,378 3,500,241 3.13 3.08
Packing & Packaging materials 3,475,313 3,561,407 3.00 3.13
Finished production 700,003 449,783 0.61 0.40
Work in process production 123,396 46,190 0.11 0.04
7,919,090 7,557,621 6.85 6.65 228,967 184,081 0.20 0.16
Letter of credit 8,148,057 7,741,702 7.05 6.81 Impairment in inventory balances 400,000 750,000 0.35 0.66
7,748,057 6,991,702 6.70 6.15
NOTES TO THE FINANCIAL STATEMENTSas of 31 December 2012

273
MARICO EGYPT FOR INDUSTRIES (SAE)
(8) Receivables and Notes receivable (net):
Receivables and notes receivable represent as of December 31, 2012 amounted to EGP 15,496,882 as follows:
31/12/2012 31/12/2011 31/12/2012 31/12/2011EGP EGP Rs. Crore Rs. Crore
Local Receivables 13,213,451 15,502,947 11.42 13.64
Less:Bad debit provision – 9,703 – 0.01
13,213,451 15,493,244 11.42 13.63
Export Receivables 283,431 181,860 0.25 0.16 13,496,882 15,675,104 11.67 13.79
Notes Receivable 2,000,000 1,006,939 1.73 0.89
15,496,882 16,682,043 13.40 14.68
(9) Debtors and other debit balances :
Debtors and other debit balances represent as of December 31, 2012 amounted to EGP 594,923 as follows:
31/12/2012 31/12/2011 31/12/2012 31/12/2011EGP EGP Rs. Crore Rs. Crore
Employees loans 249,728 132,670 0.22 0.12
Prepaid expenses 219,403 220,935 0.19 0.19
Deposits with others 116,229 129,029 0.10 0.11
Other debit balances 9,563 1,684 0.01 0.01
594,923 484,318 0.52 0.43
(10) Due from related parties :
Related parties represent as of December 31, 2012 amounted to EGP 41,174,171 as follows:
31/12/2012 31/12/2011 31/12/2012 31/12/2011EGP EGP Rs. Crore Rs. Crore
MEL company for consumer care 41,174,171 36,854,146 35.60 32.43
Marico Middle East – 4,891 – 0.01
41,174,171 36,859,037 35.60 32.43
(11) Cash and cash equivalent :
Cash and cash equivalent represent as of December 31, 2012 amounted to EGP 26,267,456 as follows:
31/12/2012 31/12/2011 31/12/2012 31/12/2011EGP EGP Rs. Crore Rs. Crore
Banks current accounts – local currency 1,596,217 195,580 1.38 0.17
Banks current accounts – foreign currency 20,862 181,995 0.02 0.16
Deposits 2,000,000 1,762,424 1.73 1.55
Cheques under collection ( less than 3 months) 22,650,377 12,648,786 19.58 11.13
26,267,456 14,788,785 22.71 13.01
NOTES TO THE FINANCIAL STATEMENTSas of 31 December 2012
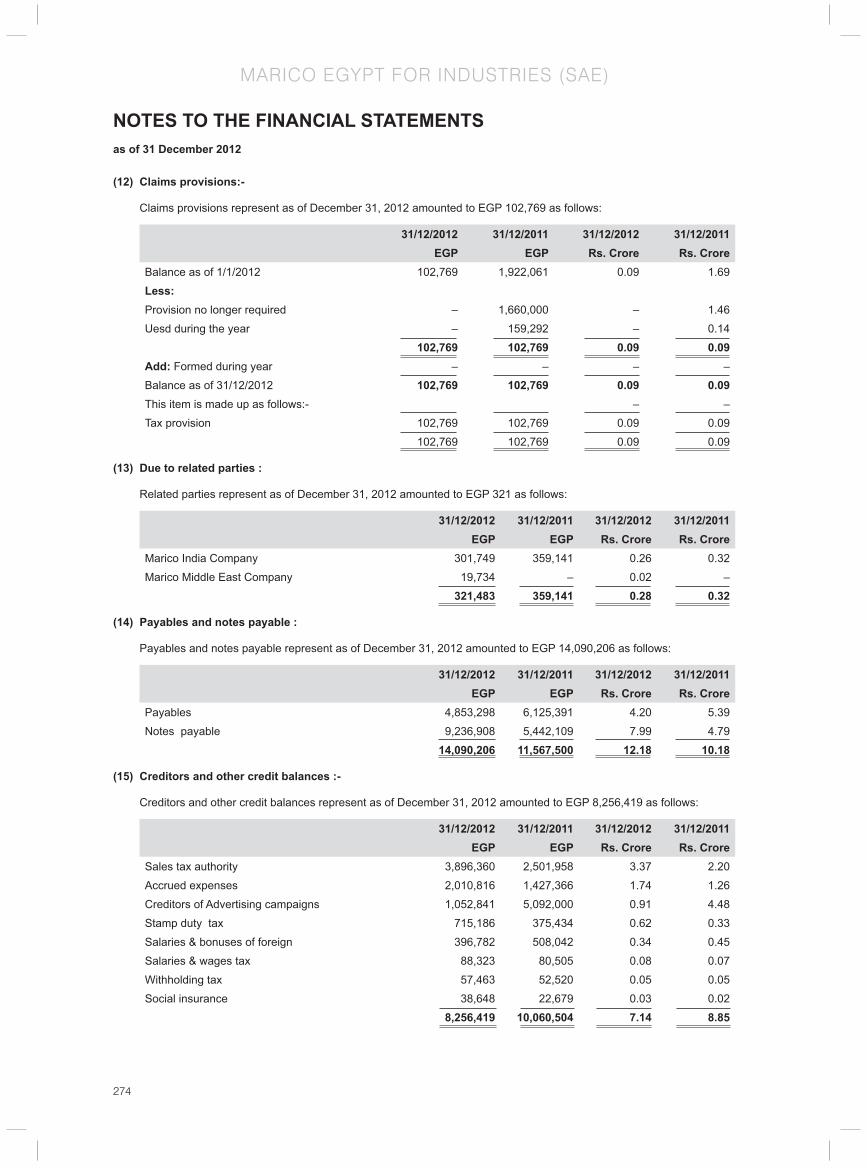
274
MARICO EGYPT FOR INDUSTRIES (SAE)
(12) Claims provisions:-
Claims provisions represent as of December 31, 2012 amounted to EGP 102,769 as follows:
31/12/2012 31/12/2011 31/12/2012 31/12/2011EGP EGP Rs. Crore Rs. Crore
Balance as of 1/1/2012 102,769 1,922,061 0.09 1.69
Less:Provision no longer required – 1,660,000 – 1.46
Uesd during the year – 159,292 – 0.14
102,769 102,769 0.09 0.09 Add: Formed during year – – – –
Balance as of 31/12/2012 102,769 102,769 0.09 0.09 This item is made up as follows:- – –
Tax provision 102,769 102,769 0.09 0.09
102,769 102,769 0.09 0.09
(13) Due to related parties :
Related parties represent as of December 31, 2012 amounted to EGP 321 as follows:
31/12/2012 31/12/2011 31/12/2012 31/12/2011EGP EGP Rs. Crore Rs. Crore
Marico India Company 301,749 359,141 0.26 0.32
Marico Middle East Company 19,734 – 0.02 –
321,483 359,141 0.28 0.32
(14) Payables and notes payable :
Payables and notes payable represent as of December 31, 2012 amounted to EGP 14,090,206 as follows:
31/12/2012 31/12/2011 31/12/2012 31/12/2011EGP EGP Rs. Crore Rs. Crore
Payables 4,853,298 6,125,391 4.20 5.39
Notes payable 9,236,908 5,442,109 7.99 4.79
14,090,206 11,567,500 12.18 10.18
(15) Creditors and other credit balances :-
Creditors and other credit balances represent as of December 31, 2012 amounted to EGP 8,256,419 as follows:
31/12/2012 31/12/2011 31/12/2012 31/12/2011EGP EGP Rs. Crore Rs. Crore
Sales tax authority 3,896,360 2,501,958 3.37 2.20
Accrued expenses 2,010,816 1,427,366 1.74 1.26
Creditors of Advertising campaigns 1,052,841 5,092,000 0.91 4.48
Stamp duty tax 715,186 375,434 0.62 0.33
Salaries & bonuses of foreign 396,782 508,042 0.34 0.45
Salaries & wages tax 88,323 80,505 0.08 0.07
Withholding tax 57,463 52,520 0.05 0.05
Social insurance 38,648 22,679 0.03 0.02
8,256,419 10,060,504 7.14 8.85
NOTES TO THE FINANCIAL STATEMENTSas of 31 December 2012

275
MARICO EGYPT FOR INDUSTRIES (SAE)
(16) Capital :
The company’s authorized capital is EGP 20,000,000 (Twenty million Egyptian pounds) and the issued capital is EGP 12,287,690 (Twelve million two hundred eighty seven thousand and six hundred ninety Egyptian pounds) distributed into 1,228,769 shares, the per value of each share is EGP 10 distributed among the shareholders.
The shareholder Mr. Aditya Kumar sold all his shares which represented in 6144 shares of per value of share EGP 10 to Mr. Saumitra Baht and this is in accordance to the certifi cate which issued by the Egyptian stock exchange session on March 22, 2012
The issued and paid capital is distributed as follows:
Name Nationality Amount of Share ShareShare EGP Rs. Crore
MEL CO. for Consumer Care Products SAE (according to law No159/1981) represented by Mr. Ravin Mody
SAE 1,216,481 12,164,810 1.05
Mr.Saumitra Bhat Indian 6,144 61,440 0.01
Mr.Ravin Mody Indian 6,144 61,440 0.01
Total 1,228,769 12,287,690 1.07
(17) Contingent liabilities:
This item is made up as follows:-
L/C L/C L/C L/C L/C L/CValue Cover Non cover Value Cover Non coverEGP EGP EGP Rs. Crore Rs. Crore Rs. Crore
L/C - Raw material 4,702,931 733,880 3,969,051 4.07 0.63 3.43
4,702,931 733,880 3,969,051 4.07 0.63 3.43
(18) Earning per share:
Earning per share is determined as follows:-
31/12/2012 31/12/2011 31/12/2012 31/12/2011EGP EGP Rs. Crore Rs. Crore
Net Profi t for the year 20,888,633 9,526,235 18.06 8.38
No. of shares 1,228,769 1,228,769 – –
Profi t per share (EGP/Share) 16.99 7.75 – –
(19) Impairment in current assets balances :-
Balance as of
1/1/2012
Formed during
the year
Used during
the year
Balance as of
12/31/2012
Balance as of
1/1/2012
Formed during
the year
Used during
the year
Balance as of
12/31/2012
EGP EGP EGP EGP Rs. Crore Rs. Crore Rs. Crore Rs. Crore
Inventory 750,000 400,000 750,000 400,000 0.66 0.35 0.65 0.35
Receivables 9,703 – 9,703 – 0.01 – 0.01 –
759,703 400,000 759,703 400,000 0.67 0.35 0.66 0.35
NOTES TO THE FINANCIAL STATEMENTSas of 31 December 2012

276
MARICO EGYPT FOR INDUSTRIES (SAE)
(20) Cash and Cash equivalent (for the purpose of preparing Statement of cash fl ows):
Notes 31/12/2012 31/12/2011 31/12/2012 31/12/2011EGP EGP Rs. Crore Rs. Crore
Cash and cash equivalent (11) 26,267,456 14,788,785 22.71 13.01
Less:
Banks overdraft – 3,122,889 – 2.75
26,267,456 11,665,896 22.71 10.26
(21) Related parties transactions:-
Name of company Types of relationship Nature of Transaction Transaction volume Transaction volumeduring the year during the year
MEL Consumer Care Related party Financing 4,320,025 3.74
Marico Limited India Related party Royalty expense 5,248,836 4.54
Marico Limited India Related party Financing 57,392 0.05
Marico Middle East Related party Financing 24,625 0.02
(22) Tax status :
First: Income tax:-
The company is exempted from 1/1/2007 till 31/12/2016 according to the company tax card.
- The company is not scrutinized from the beginning of the activity till now.
Second: Sales tax:-
The company’s books were examined till December 31, 2011 and the tax differences were fully paid.
Third: Salary and wages tax:-
The company’s books were examined till December 31, 2010 and the examination is result in differences amounted to EGP 27,177 and the company about to pay it.
The company have inspection for year 2011.
Fourth: Stamp tax:-
The company was examined till December 31,2010 and the tax differences were fully paid.
Fifth: Withholding tax:-
The company was examined till the period ending 31/12/2010 and the tax differences were fully paid.
(23) Financial Instruments & Risk Management:
(24) Comparison fi gures have been reclassifi ed to confi rm with current year classifi cation.
24-1- Fair value fi nancial instruments:
The company’s fi nancial instruments are represented in cash on hand & at bank, clients and creditors. The fair value of the fi nancial instruments does not materially differ from its book value at year end.
24-2- Credit risk:
Credit risk is represented in the disability of the clients to pay their duties, this risk is considered a limited risk as the company distribute this risk among a number of private sector clients which has strong & stable fi nancial position, the company deals with client through accepted contracts and agreements . The provision is prepared for the clients bad debts .
NOTES TO THE FINANCIAL STATEMENTSas of 31 December 2012

277
MARICO EGYPT FOR INDUSTRIES (SAE)
24-3- Exchange rate risk
Exchange rate risk consists of the change in foreign currencies which affect revenues and expenses in foreign currencies and also evaluation of assets & liabilities in foreign currencies.
Foreign currency Surplus Surplus Surplus(Defi ciency) (Defi ciency) (Defi ciency)
Foreign Currency Egyptian Pound Rs. CroreU.S Dollar 79,465 781,507 0.01
Euro 75,454 77,636 0.01
As stated in notes no. (2-4) foreign currency translation, assets and liabilities were revaluated at year end at the exchange rate declared as of the date of balance sheet.
24-4 - Interest risk
Interest risk represents the change in currency rate which affect the results of business and this risk does not exist because the company does not depend on bank credit facilities to fi nance working capital and long term assets.
NOTES TO THE FINANCIAL STATEMENTSas of 31 December 2012

278
MARICO SOUTH AFRICA CONSUMER CARE (PTY) LIMITED
278
Registration number: 2007/025470/07
Board of Director: Saugata Gupta (Appointed on July 5, 2013) Pawan Agrawal (Appointed on July 5, 2013) Jaques Nieuwenhuys (Appointed on July 5, 2013) John Richard Mason
Harsh Mariwala (Resigned on July 5, 2013) Milind Sarswate (Resigned on July 5, 2013) Vijay Subramaniam (Resigned on July 5, 2013) Padmanabh Maydeo (Resigned on July 5, 2013)
Registered offi ce: 1474 South Coast Road Mobeni 4051
Postal address: P.O. Box 72625 Mobeni 4060
Auditors: PricewaterhouseCoopers Inc. Durban
Bankers: Standard Bank of South Africa Limited
These fi nancial statements have been prepared in accordance with the Companies Act of South Africa, 2008 under the supervision of Z Rayman (Financial Manager) and have been audited by our external auditors PricewaterhouseCoopers Inc.

279279
MARICO SOUTH AFRICA CONSUMER CARE (PTY) LIMITED
The directors are responsible for the preparation, integrity and fair presentation of the fi nancial statements of Marico South Africa Consumer Care Proprietary Limited and its subsidiary. The fi nancial statements have been prepared in accordance with the International Financial Reporting Standards (IFRS) and in a manner required by the Companies Act of South Africa, and include amounts based on judgements and estimates made by management.
The directors consider that in preparing the fi nancial statements they have used the most appropriate accounting policies, consistently applied and supported by reasonable and prudent judgements and estimates, and that all statements of IFRS that they consider to be applicable have been followed. The directors are satisfi ed that the information contained in the fi nancial statements fairly presents the group and separate results of operations for the year and the fi nancial position of Marico South Africa Consumer Care Proprietary Limited and its subsidiary as at 31 March 2013.
The directors have the responsibility of ensuring that accounting records are kept. The accounting records should disclose with reasonable accuracy the fi nancial position of the group to enable the directors to ensure that the fi nancial statements comply with the relevant legislation.
Marico South Africa Consumer Care Proprietary Limited operated in an established control environment, which is documented and reviewed. This incorporates risk management and internal control procedures, which are designed to provide reasonable, but not absolute, assurance that assets are safeguarded and the risks facing the business are being controlled.
The going concern basis has been adopted in preparing the fi nancial statements. The directors have no reason to believe that the group and separate company will not be a going concern in the foreseeable future. The company’s external auditors, PricewaterhouseCoopers Inc, audited the fi nancial statements and their report is presented.
The fi nancial statements set out were approved by the board of directors and are signed on their behalf.
John Richard Mason Vijay SubramaniamDirector Director
STATEMENT OF DIRECTORS’ RESPONSIBILITYFOR THE YEAR ENDED 31 MARCH 2013

280
MARICO SOUTH AFRICA CONSUMER CARE (PTY) LIMITED
280
INDEPENDENT AUDITOR’S REPORTFOR THE YEAR ENDED 31 MARCH 2013
TOTHE SHAREHOLDERS OF MARICO SOUTH AFRICA CONSUMER CARE PROPRIETARY LIMITED
We have audited the annual fi nancial statements of Marico South Africa Consumer Care Proprietary Limited and its subsidiary which comprise the statement of fi nancial position and the consolidated statement of fi nancial position as at 31 March 2013, the statement of comprehensive income and the consolidated statement of comprehensive income, the statement of changes in equity and the consolidated statement of changes in equity, the statement of cash fl ows and the consolidated statement of cash fl ows for the year then ended, and a summary of signifi cant accounting policies and other explanatory notes, as set out on pages 6 to 37.
Directors’ Responsibility for the Financial Statements
The Company’s directors are responsible for the preparation and fair presentation of these fi nancial statements in accordance with the International Financial Reporting Standards and the requirements of the Companies Act of South Africa, and for such internal control as directors determine is necessary to enable the preparation of fi nancial statements that are free from material misstatements, whether due to fraud or error.
Auditor’s Responsibility
Our responsibility is to express an opinion on these fi nancial statements based on our audit. We conducted our audit in accordance with International Standards on Auditing. Those standards require that we comply with ethical requirements and plan and perform the audit to obtain reasonable assurance whether the fi nancial statements are free from material misstatement.
An audit involves performing procedures to obtain audit evidence about the amounts and disclosures in the fi nancial statements. The procedures selected depend on the auditor’s judgement, including the assessment of the risks of material misstatement of the fi nancial statements, whether due to fraud or error. In making those risk assessments, the auditor considers internal control relevant to the entity’s preparation and fair presentation of the fi nancial statements in order to design audit procedures that are appropriate in the circumstances, but not for the purpose of expressing an opinion on the effectiveness of the entity’s internal control. An audit also includes evaluating the appropriateness of accounting policies used and the reasonableness of accounting estimates made by management, as well as evaluating the overall presentation of the fi nancial statements.
We believe that the audit evidence we have obtained is suffi cient and appropriate to provide a basis for our audit opinion.
Opinion
In our opinion, the fi nancial statements present fairly, in all material respects, the consolidated and separate fi nancial position of Marico South Africa Consumer Care Proprietary Limited as at 31 March 2013, and its consolidated and separate fi nancial performance and its consolidated and separate statement of cash fl ow for the year then ended in accordance with International Financial Reporting Standards, and the requirements of the Companies Act of South Africa.
Other reports required by the Companies Act
As part of our audit of the fi nancial statements for the year ended 31 March 2013, we have read the Directors’ Report for the purpose of identifying whether there are material inconsistencies between the report and the audited fi nancial statements. The report is the responsibility of the Directors. Based on reading the report we have not identifi ed material inconsistencies between the report and the audited fi nancial statements. However, we have not audited the report and accordingly do not express an opinion on the report.
PricewaterhouseCoopers Inc.Director : N RamlaganRegistered AuditorDurban8 May 2013

281281
MARICO SOUTH AFRICA CONSUMER CARE (PTY) LIMITED
REPORT OF THE DIRECTORS’FOR THE YEAR ENDED 31 MARCH 2013
The directors present their annual report, which forms part of the audited fi nancial statements of the company and of the group for the year ended 31 March 2013.
NATURE OF BUSINESSThe company is an investment holding company with an interest in Marico South Africa Proprietary Limited which manufactures and distributes a wide range of personal care and affordable complementary health care products.
Marico South Africa Consumer Care Proprietary Limited and its subsidiary was incorporated on 6 September 2007 to act as an investment holding company in South Africa for its holding company, Marico Limited which is incorporated in India. The company subsequently purchased the entire share capital of Marico South Africa Proprietary Limited effective on the 31 October 2007.
As the company is the ultimate South African parent, consolidated fi nancial statements have also been presented which include the fi nancial results of Marico South Africa Proprietary Limited.
DIVIDENDSNo dividends have been declared during the period and none are recommended (2012: R Nil).
SHARE CAPITALThe authorised and issued share capital has remained unchanged.
DIRECTORS AND SECRETARYThe present directors of the company are:
JR Mason H Mariwala (Indian) M Sarwate (Indian)V Subramanian (Indian)P Maydeo (Indian)The Company Secretary is KPMG.
HOLDING COMPANYMarico Limited holds 100% of the company’s issued share capital. Marico Limited is incorporated in Mumbai, India.
SUBSIDIARYThe company holds 100% of the issued share capital of Marico South Africa Proprietary Limited.
MATERIAL EVENTS AFTER YEAR-ENDNo matter which is material to the fi nancial affairs of the company and group has occurred between the statement of fi nancial position date and the date of approval of the fi nancial statements.
AUDITORSPricewaterhouseCoopers Inc. will continue in offi ce in accordance with the Companies Act, 71 of 2008.
GOING CONCERNThe company generated a loss for the period of R380 076 (2012: R419 982). At 31 March 2013 the company’s total assets exceeded its total liabilities by R 39 743 065 (2012: R40 123 141).
The group generated a loss for the period of R638 850 (2012: profi t of R794 826). At 31 March 2013 the group’s total assets exceeded its total liabilities by R36 132 078 (2012: R36 770 928).
The company has no external loans apart from its loan from the holding company.
The company is in the process of converting the long term loan from Marico Limited into equity. This would have the impact of reducing interest costs and increasing profi t before tax by an estimated amount of R 4 207 740 per annum.
Accordingly, the fi nancial statements are prepared on the basis of accounting policies applicable to a going concern.

282
MARICO SOUTH AFRICA CONSUMER CARE (PTY) LIMITED
282
BALANCE SHEETfor the year ended 31 March 2013
Group Company
Note 2013 2012 2013 2012 2013 2012 2013 2012
R R Rs. Crore Rs. Crore R R Rs. Crore Rs. Crore
ASSETS
Non-current assets
Property, plant and equipment 6 1,859,397 3,746,295 1.09 2.49 – – – –
Intangible assets 7 47,993,319 48,062,924 28.14 31.88 – – – –
Investment in subsidiary 8 – – – – 45,485,555 45,485,555 26.67 30.18
Deferred income tax assets 14 6,646,542 7,077,135 3.90 4.69 – – – –
Goodwill 15 37,686,823 37,686,823 22.10 25.00 – – – –
Amount due from related party 19 – – – – 53,876,041 55,688 008 31.59 36.94
94,186,081 96,573,177 55.23 64.07 99,361,596 101,173,563 58.27 67.12
Current assets
Trade and other receivables 10 27,704,018 23,109,432 16.25 15.33 – – – –
Inventories 9 17,627,985 17,591,204 10.34 11.67 – – – –
Cash and cash equivalents 11 4,664,856 4,961,765 2.74 3.29 191,137 195,577 0.11 0.13
Amounts due from related party 19 – – – – 20,528,070 22,492,444 12.04 14.92
49,996,859 45,662,401 29.32 30.29 20,719,207 22,688,021 12.15 15.05
Non-current asset held for sale 12 1,077,786 – 0.63 – – – – –
Total assets 145,260,726 142,235,578 85.18 94.36 120,080,803 123,861,584 70.42 82.17
EQUITY
Capital and reserves attributable
to equity holders of the company
Share capital 13 800 800 0.01 0.01 800 800 0.01 0.01
Share premium 13 43,799,900 43,799,900 25.68 29.06 43,799,900 43,799,900 25.68 29.06
Accumulated loss (7,668,623) (7,029,772) (4.50) (4.66) (4,057,635) (3,677,559) (2.38) (2.44)
Total equity 36,132,077 36,770,928 21.20 24.40 39,743,065 40,123,141 23.32 26.63
LIABILITIES
Non-current liabilities
Borrowings 17 59,809,668 61,225,999 35.07 40.62 59,809,668 61,225,999 35.07 40.62
Share-based payment liability 18 124,232 – 0.07 – – – – –
59,933,900 61,225,999 35.15 40.62 59,809,668 61,225,999 35.07 40.62
Current liabilities
Trade and other payables 16 27,803,554 21,746,207 16.30 14.43 – 20 000 – 0.01
Borrowings 17 20,528,070 22,492,444 12.03 14.91 20,528,070 22,492,444 12.03 14.91
Share-based payment liability 18 863,125 – 0.51 – – – – –
49,194,749 44,238,651 28.84 29.34 20,528,070 22,512,444 12.03 14.92
Total liabilities 109,128,649 105,464,650 63.98 69.96 80,337,738 83,738,443 47.10 55.54
Total equity and liabilities 145,260,726 142,235,578 85.18 94.36 120,080,803 123,861,584 70.42 82.17
Note: The exchange rate use to convert Zar to Rs. 5.864 / (Previous year Zar to Rs. 6.634)484 / EGP (Rs. 8.858 / EGP)

283283
MARICO SOUTH AFRICA CONSUMER CARE (PTY) LIMITED
INCOME STATEMENTfor the year ended 31 March 2013
Group Company
Note 2013 2012 2013 2012 2013 2012 2013 2012
R R Rs. Crore Rs. Crore R R Rs. Crore Rs. Crore
Revenue 164,070,681 154,354,988 96.21 102.40 – – – –
Cost of sales (94,329,358) (86,643,985) (55.31) (57.48) – – – –
Gross profi t 69,741,323 67,711 003 40.90 44.92 – – – –
Operating expenses (64,006,081) (60,269,188) (37.53) (39.98) 8,165 (3,945) 0.01 (0.01)
Other income 192,689 146,321 0.11 0.10 – – – –
Operating profi t/(loss) 5,927,931 7,588,136 3.48 5.03 8,165 (3,945) 0.01 (0.1)
Finance income 4 227,934 83,900 0.13 0.06 5,975,882 5,845,527 3.50 3.88
Finance costs 4 (6,364,123) (6,261,564) (3.73) (4.15) (6,364,123) (6,261,564) (3.73) (4.15)
(Loss)/profi t before income tax (208,258) 1,410,472 (0.12) 0.94 (380,076) (419,982) (0.22) (0.28)
Income tax expense 5 (430,593) (615,646) (0.25) (0.41) – – – –
Total comprehensive (loss)/profi t for the year (638,851) 794,826 (0.37) 0.53 (380,076) (419,982) (0.22) (0.28)
Note: The exchange rate use to convert Zar to Rs. 5.864 / (Previous year Zar to Rs. 6.634)484 / EGP (Rs. 8.858 / EGP)

284
MARICO SOUTH AFRICA CONSUMER CARE (PTY) LIMITED
284
STATEMENT OF CHANGES IN EQUITYfor the year ended 31 March 2013
Share capital
Share premium
Accumula-ted losses
Total Share capital
Share premium
Accumula-ted losses
Total
R R R R Rs. Crores
Rs.Crores
Rs.Crores
Rs. Crores
GroupYear ended 31 March 2013Balance at 1 April 2012 800 43,799,900 (7,029,772) 36,770,928 0.01 25.68 (4.12) 21.57Total comprehensive loss for the year – – (638,851) (638,851) – – (0.37) (0.37)
Balance at 31 March 2013 800 43,799,900 (7,668,623) 36,132,077 0.01 25.68 (4.50) 21.20
Year ended 31 March 2013Balance at 1 April 2011 800 43,799,900 (7,824,598) 35,976,102 0.01 29.06 (5.19) 23.88Total comprehensive profi t for the year
– – 794,826 794,826 – – 0.53 0.53
Balance at 31 March 2012 800 43,799,900 (7,029,772) 36,770,928 0.01 29.06 (4.66) 24.40
Company
Year ended 31 March 2013
Balance at 1 April 2012 800 43,799,900 (3,677,559) 40,123,141 0.01 25.68 (2.16) 23.54
Total comprehensive loss for the year
– – (380,076) (380,076) – – (0.22) (0.22)
Balance at 31 March 2013 800 43,799,900 (4,057,635) 39,743,065 0.01 25.68 (2.38) 23.32
Year ended 31 March 2013
Balance at 1 April 2011 800 43,799,900 (3,257,577) 40,543,123 0.01 29.06 (2.16) 26.91
Total comprehensive profi t for the year
– – (419,982) (419,982) – – (0.28) (0.28)
Balance at 31 March 2012 800 43,799,900 (3,677,559) 40,123,141 0.01 29.06 (2.44) 26.63
Note: The exchange rate use to convert Zar to Rs. 5.864 / (Previous year Zar to Rs. 6.634)484 / EGP (Rs. 8.858 / EGP)

285285
MARICO SOUTH AFRICA CONSUMER CARE (PTY) LIMITED
STATEMENT OF CASH FLOWSfor the year ended 31 March 2013
Group Company
Note 2013 2012 2013 2012 2013 2012 2013 2012
R R Rs. Crore Rs. Crore R R Rs. Crore Rs. Crore
Cash fl ow from operating activities
Cash fl ow from operations 21 9,290,138 4,509,077 5.45 2.99 (11,835) (3,945) (0.01) 0.01
Finance costs 4 (6,364,123) (6,261,564) (3.73) (4.15) (6,364,123) (6,261,564) (3.73) (4.15)
Finance income 4 227,934 83,900 0.13 0.06 5,975,882 5,845,527 3.50 3.88
Net cash used in operating activities
3,153,949 (1,668,587) 1.85 (1.11) (400,076) (419,982) (0.23) (0.27)
Cash fl ow from investing activities(Decrease)/increase in loans to related party
– – – – 3,776,341 (2,078,266) 2.21 (1.39)
Additions to property, plant and equipment
(420,443) (737,585) (0.25) (0.49) – – – –
Proceeds on disposal of property, plant and equipment
350,290 1,002,499 0.21 0.67 – – – –
Net cash from/( used in) investing activities
(70,153) 264,914 (0.04) 0.18 3,776,341 (2,078,266) 2.21 (1.39)
Cash fl ow from fi nancing activities(Repayment)/receipt of borrowings
(3,380,705) 2,406,110 (1.98) 1.60 (3,380,705) 2,406,110 (1.98) 1.60
Net cash generated from fi nancing activities
(3,380,705) 2,406,110 (1.98) 1.60 (3,380,705) 2,406,110 (1.98) 1.60
Net increase/(decrease) in cash and cash equivalents
(296,909) 1,002,437 (0.17) 0.67 (4,440) (92,138) – (0.06)
Cash and cash equivalents at beginning of year
11 4,961,765 3,959,328 195,577 287,715 2.91 2.63 0.11 0.19
Cash and cash equivalents at end of year
114,664,856 4,961,765 191,137 195,577 2.74 3.29 0.11 0.13
Note: The exchange rate use to convert Zar to Rs. 5.864 / (Previous year Zar to Rs. 6.634)484 / EGP (Rs. 8.858 / EGP)

286
MARICO SOUTH AFRICA CONSUMER CARE (PTY) LIMITED
286
NOTES TO THE FINANCIAL STATEMENTSfor the year ended 31 March 2013
1. Summary of signifi cant accounting policies
The principle accounting policies applied in the preparation of these consolidated fi nancial statements are set out below. These policies have been consistently applied to all the years presented, unless otherwise stated.
1.1 Basis of preparation
The fi nancial statements have been prepared in accordance with the International Financial Reporting Standards (IFRS). The fi nancial statements have been prepared under the historical cost convention.
The preparation of the fi nancial statements in conformity with IFRS requires the use of estimates and assumptions that affect the reported amounts of assets and liabilities and disclosure of contingent assets and liabilities at the date of the fi nancial statements and the reported amounts of revenues and expenses during the reporting period based on management’s best knowledge of current events and actions. Actual results may ultimately differ from these estimates. During the current period, areas involving a higher degree of judgment or complexity, or areas where assumptions and estimates are signifi cant to the fi nancial statements, have been disclosed in note 1.24.
1.2 Consolidation
Subsidiaries are all entities (including special purpose entities) over which the group has the power to govern the fi nancial and operating policies generally accompanying a shareholding of more than one half of the voting rights. The existence and effect of potential voting rights that are currently exercisable or convertible are considered when assessing whether the group controls another entity. Subsidiaries are fully consolidated from the date on which control is transferred to the group. They are de-consolidated from the date that control ceases.
The purchase method of accounting is used to account for the acquisition of subsidiaries by the group. The cost of an acquisition is measured as the fair value of the assets given, equity instruments issued and liabilities incurred or assumed at the date of exchange, plus costs directly attributable to the acquisition. Identifi able assets acquired and liabilities and contingent liabilities assumed in a business combination are measured initially at their fair values at the acquisition date, irrespective of the extent of any minority interest. The excess of the cost of acquisition over the fair value of the group’s share of the identifi able net assets acquired is recorded as goodwill. If the cost of acquisition is less than the fair value of the net assets of the subsidiary acquired, the difference is recognised directly in the statement of comprehensive income.
Inter-company transactions, balances and unrealised gains on transactions between group companies are eliminated. Unrealised losses are also eliminated but considered an impairment indicator of the asset transferred. Accounting policies of subsidiaries consistent with the policies adopted by the group.
Investments in subsidiaries are accounted for at cost less accumulated impairment losses in the stand-alone fi nancial statements of the company.
1.3 Property, plant and equipment
All property, plant and equipment are stated at historical cost less accumulated depreciation and impairment losses.
Historical cost includes expenditure that is directly attributable to the acquisition of the items.
Subsequent costs are included in the asset’s carrying amount or recognised as a separate asset, as appropriate, only when it is probable that future economic benefi ts associated with the item will fl ow to the company and the cost of the item can be measured reliably. All other repairs and maintenance are charged to the statement of comprehensive income during the fi nancial period in which they are incurred.
Depreciation is calculated using the straight-line basis so as to write off the cost of the assets to their residual values over their expected useful lives. The expected useful lives are as follows:
Leasehold improvements 10 years
Plant and machinery 5 – 15 years

287287
MARICO SOUTH AFRICA CONSUMER CARE (PTY) LIMITED
NOTES TO THE FINANCIAL STATEMENTSfor the year ended 31 March 2013
Motor vehicles 3,33 years
Offi ce equipment 5 years
Furniture and fi ttings 10 years
Computer equipment 5 years
The assets’ residual values and useful lives are reviewed, and adjusted if appropriate, at each statement of fi nancial position date.
An assets’ carrying amount is written down immediately to its recoverable amount if the asset’s carrying amount is greater than its estimated recoverable amount (note 1.6).
Gains and losses on disposals are determined by comparing the proceeds with the carrying amount and are recognised in the statement of comprehensive income.
1.4 Non-current assets held for sale
Non-current assets and disposal groups are classifi ed as held for sale if their carrying amount will be recovered through a sale transaction rather than through continuing use. This condition is regarded as met only when the sale is highly probable and the asset (or disposal group) is available for immediate sale in its present condition.
Management must be committed to the sale, which should be expected to qualify for recognition as a completed sale within one year from the date of classifi cation.
Non-current assets held for sale (or disposal group) are measured at the lower of its carrying amount and fair value less costs to sell.
A non-current asset is not depreciated (or amortised) while it is classifi ed as held for sale, or while it is part of a disposal group classifi ed as held for sale.
1.5 Intangible assets
(a) Goodwill
Goodwill represents the excess of the cost of an acquisition over the fair value of the company’s share of the net identifi able assets at the date of acquisition. Goodwill on acquisitions of subsidiaries is included in ‘intangible assets’. Separately recognised goodwill is assessed annually for impairment and carried at cost less accumulated impairment losses. Impairment losses on goodwill are not reversed. Gains and losses on the disposal of an entity include the carrying amount of goodwill relating to the entity sold.
Goodwill is allocated to cash-generating units for the purpose of impairment testing. The allocation is made to those cash-generating units or groups of cash-generating units that are expected to benefi t from the business combination in which the goodwill arose.
(b) Brands
The useful lives of all intangible assets acquired by the company are assessed to determine if the useful life is fi nite or indefi nite. Useful lives of intangible assets are reviewed at least at the end of each fi nancial period and altered if estimates have changed signifi cantly. Any change is accounted for by changing the amortisation charge for the current and future periods.
Intangibles assets with fi nite useful lives are measured at cost less accumulated amortisation and accumulated impairment losses. Amortisation is recognised in profi t or loss on a straight-line basis over the estimate useful lives of intangible assets from the date that they are available for use.
Intangibles assets with indefi nite useful lives are measured at cost and are not amortized, but are tested for impairment at least annually or whenever any indication of impairment exists.

288
MARICO SOUTH AFRICA CONSUMER CARE (PTY) LIMITED
288
NOTES TO THE FINANCIAL STATEMENTSfor the year ended 31 March 2013
The following intangible assets currently have an indefi nite useful life:
▪ product registrations; and
▪ brands
Subsequent expenditure
Subsequent expenditure is capitalised only when it increases the future economic benefi ts embodied in the specifi c asset to which it relates. All other expenditure, including expenditure on internally generated goodwill and brands, is recognised in profi t or loss when incurred.
1.6 Impairment of assets
Assets that have an indefi nite useful life are not subject to amortisation and are tested annually for impairment. Assets that are subject to amortisation are reviewed for impairment whenever events or changes in circumstances indicate that the carrying amount may not be recoverable. An impairment loss is recognised for the amount by which the asset’s carrying amount exceeds its recoverable amount. The recoverable amount is the higher of an asset’s fair value less costs to sell and value in use. For the purposes of assessing impairment, assets are grouped at the lowest levels for which there are separately identifi able cash fl ows (cash-generating units).
1.7 Leased assets
Leases of assets under which all the risks and benefi ts of ownership are effectively retained by The lesser are classifi ed as operating leases. Payments made under operating leases are charged to the statement of comprehensive income on a straight-line basis over the period of the lease. When an operating lease is terminated before the lease period has expired, any payment required to be made to the lesser by ways of penalty is recognized as an expense in the period in which termination takes place.
1.8 Inventory
Inventories are stated at the lower of cost and selling price less costs to complete and sell. Cost is determined using the weighted average cost method. The cost of fi nished goods and work in progress comprises raw materials, direct labour, other direct costs and related production overheads (based on normal operating capacity). Net realisable value is the estimated selling price in the ordinary course of business, less applicable variable selling expenses.
1.9 Financial assets
1.9.1 Classifi cation
The company classifi es its fi nancial assets in the following categories: at fair value through profi t or loss and loans and receivables. The classifi cation depends on the purpose for which the fi nancial assets were acquired. Management determines the classifi cation of its fi nancial assets at initial recognition.
(a) Financial assets at fair value through profi t or loss
Financial assets at fair value through profi t or loss are fi nancial assets held for trading. A fi nancial asset is classifi ed in this category if acquired principally for the purpose of selling in the short term. Derivatives are also categorised as held for trading unless they are designated as hedges. Assets in this category are classifi ed as current assets if expected to be settled within 12 months; otherwise, they are classifi ed as non-current.
(b) Loans and receivables
Loans and receivables are non-derivative fi nancial assets with fi xed or determinable payments that are not quoted in an active market. They are included in current assets, except for maturities greater than 12 months after the end of the reporting period. These are classifi ed as non-current assets. The company’s loans and receivables comprise ‘trade and other receivables’ and ‘cash and cash equivalents’ in the statement of fi nancial position (notes 1.9 and 1.10).

289289
MARICO SOUTH AFRICA CONSUMER CARE (PTY) LIMITED
NOTES TO THE FINANCIAL STATEMENTSfor the year ended 31 March 2013
1.9.2 Recognition and measurement
Financial assets carried at fair value through profi t or loss are initially recognised at fair value, and transaction costs are expensed in the statement of comprehensive income. Financial assets are derecognised when the rights to receive cash fl ows from the investments have expired or have been transferred and the company has transferred substantially all risks and rewards of ownership. Loans and receivables are subsequently carried at amortised cost using the effective interest method.
Gains or losses arising from changes in the fair value of the ‘fi nancial assets at fair value through profi t or loss’ category are presented in the statement of comprehensive income within ‘operating expenses - net’ in the period in which they arise. Dividend income from fi nancial assets at fair value through profi t or loss is recognised in the statement of comprehensive income as part of other income when the company’s right to receive payments is established.
1.10 Trade receivables
Trade receivables are measured at amortised cost using the effective interest rate method, less provision for impairment. A provision for impairment of trade receivables is established when there is objective evidence that the group will not be able to collect all amounts due according to the original terms of the receivables. The amount of the provision is the difference between the asset’s carrying amount and the present value of estimated future cash fl ows, discounted at the original effective interest rate. The carrying amount of the asset is reduced through the use of an allowance account, and the amount of the loss is recognised in the statement of comprehensive income within ‘operating expenses’. When a trade receivable is uncollectible, it is written off against the allowance account for trade receivables. Subsequent recoveries of amounts previously written off are credited in the statement of comprehensive income.
1.11 Cash and cash equivalents
Cash and cash equivalents includes cash in hand, deposits held at call with banks, other short-term highly liquid investments with original maturities of three months or less, and bank overdrafts. Bank overdrafts are shown within borrowings in current liabilities on the statement of fi nancial position.
1.12 Current and deferred income tax
The tax expense for the period comprises current and deferred tax. Tax is recognised in the statement of comprehensive income, except to the extent that it relates to items recognised in other comprehensive income or directly in equity. In this case, the tax is also recognised in other comprehensive income or directly in equity, respectively.
The current income tax charge is calculated on the basis of the tax laws enacted or substantively enacted at the statement of fi nancial position date in the countries where the company and its subsidiaries operate and generate taxable income. Management periodically evaluates positions taken in tax returns with respect to situations in which applicable tax regulation is subject to interpretation. It establishes provisions where appropriate on the basis of amounts expected to be paid to the tax aythorities.
Deferred income tax is recognised, using the liability method, on temporary differences arising between the tax bases of assets and liabilities and their carrying amounts in the fi nancial statements. However, deferred tax liabilities are not recognised if they arise from the initial recognition of goodwill; deferred income tax is not accounted for if it arises from initial recognition of an asset or liability in a transaction other than a business combination that at the time of the transaction affects neither accounting nor taxable profi t or loss. Deferred income tax is determined using tax rates (and laws) that have been enacted or substantially enacted by the statement of fi nancial position date and are expected to apply when the related deferred income tax asset is realised or the deferred income tax liability is settled.
Deferred income tax assets are recognised only to the extent that it is probable that future taxable profi t will be available against which the temporary differences can be utilised.

290
MARICO SOUTH AFRICA CONSUMER CARE (PTY) LIMITED
290
NOTES TO THE FINANCIAL STATEMENTSfor the year ended 31 March 2013
Deferred income tax assets and liabilities are offset when there is a legally enforceable right to offset current tax assets against current tax liabilities and when the deferred income taxes assets and liabilities relate to income taxes levied by the same taxation authority on either the same taxable entity or different taxable entities where there is an intention to settle the balances on a net basis.
1.13 Trade payables
Trade payables are carried initially at the fair value of the consideration to be paid in future for goods or services that have been received or supplied and invoiced or formally agreed with the supplier, and subsequently measured at amortised cost using the effective interest rate method.
Employee entitlements to annual leave are recognised when they accrue to employees. An accrual is made for the estimated liability for annual leave as a result of services rendered by employees up to the statement of fi nancial position date.
1.14 Provisions
Provisions are recognised when the company has a present legal or constructive obligation as a result of past events; it is more likely than not that an outfl ow of resources will be required to settle the obligation; and the amount has been reliably estimated. Provisions are not recognised for future operating losses. Where there are a number of similar obligations, the likelihood that an outfl ow will be required in settlement is determined by considering the class of obligations as a whole. A provision is recognised even if the likelihood of an outfl ow with respect to any one item included in the same class of obligations may be small.
Provisions are measured at the present value of the expenditures expected to be required to settle the obligation using a pre-tax rate that refl ects current market assessments of the time value of money and the risks specifi c to the obligation. The increase in the provision due to passage of time is recognised as interest expense.
1.15 Share-based payment
The company operates share-based compensation plans under which the company receives services from employees as consideration for equity based instruments (options and rights) of Marico Limited. The fair value of the employees’ services received in exchange for the grant of the options or rights is recognised as an expense.
The fair value is determined at each statement of fi nancial position date and is expensed on a straight-line basis over the vesting period with a corresponding increase in the liability and is based on the company’s estimate of options that will eventually vest. Non-market vesting conditions are included in assumptions about the number of options and rights that are expected to vest.
At each statement of fi nancial position date, the company assesses its estimates of the number of options or rights that are expected to vest. The company recognises the impact on the original estimates, if any, in the statement of comprehensive income with a corresponding adjustment to the share option liability as appropriate.
The cash settled share-based payment, on maturity, will be computed in Indian Rupee and will be converted at the prevalent exchange rate and paid to senior management in the currency of the location of senior management.
1.16 Financial risk management
(1) Financial risk factors
The group’s activities expose it to a variety of fi nancial risks, including the effects of changes in interest rates and foreign currency exchange rates. The group’s overall risk management programme focuses on the unpredictability of fi nancial markets and seeks to minimise potential adverse effects on the fi nancial performance of the group. The group does not use derivative fi nancial instruments, such as interest rate swaps and forward exchange contracts, to hedge certain exposures.
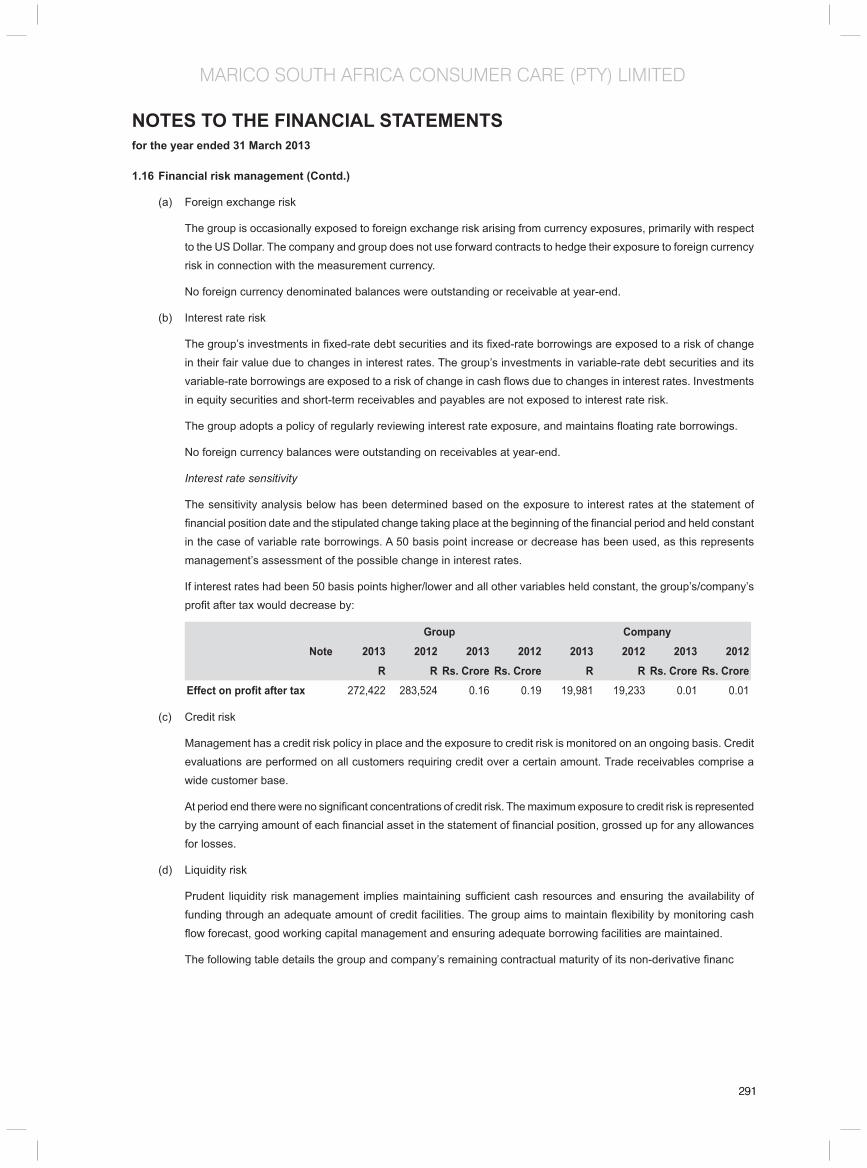
291291
MARICO SOUTH AFRICA CONSUMER CARE (PTY) LIMITED
1.16 Financial risk management (Contd.)
(a) Foreign exchange risk
The group is occasionally exposed to foreign exchange risk arising from currency exposures, primarily with respect to the US Dollar. The company and group does not use forward contracts to hedge their exposure to foreign currency risk in connection with the measurement currency.
No foreign currency denominated balances were outstanding or receivable at year-end.
(b) Interest rate risk
The group’s investments in fi xed-rate debt securities and its fi xed-rate borrowings are exposed to a risk of change in their fair value due to changes in interest rates. The group’s investments in variable-rate debt securities and its variable-rate borrowings are exposed to a risk of change in cash fl ows due to changes in interest rates. Investments in equity securities and short-term receivables and payables are not exposed to interest rate risk.
The group adopts a policy of regularly reviewing interest rate exposure, and maintains fl oating rate borrowings.
No foreign currency balances were outstanding on receivables at year-end.
Interest rate sensitivity
The sensitivity analysis below has been determined based on the exposure to interest rates at the statement of fi nancial position date and the stipulated change taking place at the beginning of the fi nancial period and held constant in the case of variable rate borrowings. A 50 basis point increase or decrease has been used, as this represents management’s assessment of the possible change in interest rates.
If interest rates had been 50 basis points higher/lower and all other variables held constant, the group’s/company’s profi t after tax would decrease by:
Group CompanyNote 2013 2012 2013 2012 2013 2012 2013 2012
R R Rs. Crore Rs. Crore R R Rs. Crore Rs. CroreEffect on profi t after tax 272,422 283,524 0.16 0.19 19,981 19,233 0.01 0.01
(c) Credit risk
Management has a credit risk policy in place and the exposure to credit risk is monitored on an ongoing basis. Credit evaluations are performed on all customers requiring credit over a certain amount. Trade receivables comprise a wide customer base.
At period end there were no signifi cant concentrations of credit risk. The maximum exposure to credit risk is represented by the carrying amount of each fi nancial asset in the statement of fi nancial position, grossed up for any allowances for losses.
(d) Liquidity risk
Prudent liquidity risk management implies maintaining suffi cient cash resources and ensuring the availability of funding through an adequate amount of credit facilities. The group aims to maintain fl exibility by monitoring cash fl ow forecast, good working capital management and ensuring adequate borrowing facilities are maintained.
The following table details the group and company’s remaining contractual maturity of its non-derivative fi nanc
NOTES TO THE FINANCIAL STATEMENTSfor the year ended 31 March 2013

292
MARICO SOUTH AFRICA CONSUMER CARE (PTY) LIMITED
292
NOTES TO THE FINANCIAL STATEMENTSfor the year ended 31 March 2013
Average interest
rate
Within 1 period
Greater than 2
periods
Total Within 1 period
Greater than 2
periods
Total
R R R Rs. Crore Rs. Crore Rs. CroreGroup 2013Trade and other payables 24,175,094 24,175,094 14.18 – 14.18
Interest bearing shareholders loan from Marico Limited
- Non-current portion 7.52% – 59,809,668 59,809,668 – 35.07 35.07
- Current potion 8.50% 20,528,070 – 20,528,070 12.04 – 12.04
44,703,164 59,809,668 104,512,832 26.21 35.07 61.29
Group 2012
Trade and other payables 19,239,256 – 19,239,256 11.28 – 11.28
Interest bearing shareholders loan from Marico Limited
- Non-current portion 7,61% – 61,225,999 61,225,999 – 35.90 35.90
- Current potion 9% 22,492,444 – 22,492,444 13.19 – 13.19
41,731,700 61,225,999 102,957,699 24.47 35.90 60.37
Average interest
rate
Within 1 period
Greater than 2
periods
Total Within 1 period
Greater than 2
periods
Total
R R R Rs. Crore Rs. Crore Rs. Crore
Company 2013
Trade and other payables – – – – – – –
Interest bearing shareholders loan from Marico Limited
- Non-current portion 7.52% – 59,809,668 59,809,668 – 35.07 35.07
- Current potion 8.50% 20,528,070 – 20,528,070 12.04 – 12.04
20,528,070 59,809,668 80,337,738 12.04 35.07 47.11
Company 2012Trade and other payables 20,000 20,000 0.01 – 0.01
Interest bearing shareholders loan from Marico Limited
- Non-current portion 7,61% – 61,225,999 61,225,999 – 35.90 35.90
- Current potion 9% 22,492,444 – 22,492,444 13.19 – 13.19
22,512,444 61,225,999 83,738,443 13.20 35.90 49.10
Capital risk management
The group’s objectives when managing capital are to safeguard the group’s ability to continue as a going concern in order to provide returns for shareholders, benefi ts for other stakeholders and to maintain an optimal capital structure to reduce the cost of capital.
In order to maintain or adjust the capital structure, the group may adjust the amount of dividends paid to shareholders, return capital to shareholders, issue new shares or sell assets to reduce debt.

293293
MARICO SOUTH AFRICA CONSUMER CARE (PTY) LIMITED
NOTES TO THE FINANCIAL STATEMENTSfor the year ended 31 March 2013
1.17 Share capital
Ordinary shares are classifi ed as equity.
Incremental costs directly attributable to the issue of new shares or options are shown in equity as a deduction, net of tax, from the proceeds. The difference between the proceeds received and the par value of ordinary shares issued are shown within equity as share premium.
1.18 Revenue recognition
Revenue comprises the fair value of the consideration received or receivable for the sale of goods and services in the ordinary course of the company’s activities. Revenue is shown net of value-added tax, estimated returns, rebates and discounts. Revenue is recognised as follows:
(a) Sales of goods
Sales of goods are recognised when the company has delivered products to the customer, the customer has accepted the products and collectability of the related receivables is reasonably assured. It is the company’s policy to sell its products to the end customer with a right of return. Accumulated experience is used to estimate and provide for such returns at the time of sale.
1.18 Revenue recognition (continued)
(b Interest income
Interest income is recognised on a time-proportion basis using the effective interest rate method.
1.19 Research and development costs
Research and development costs are recognised as an expense to the extent that such expenditure are not expected to have future benefi ts.
1.20 Employee benefi ts
The group operates two retirement benefi t schemes. These are both defi ned contribution funds. A defi ned contribution fund is a retirement benefi t plan under which the group pays fi xed contributions into a separate entity. The group has no legal or constructive obligations to pay further contributions if the fund does not hold suffi cient assets to pay all employees the benefi ts relating to employee service in the current and prior periods.
The group pays contributions on a contractual basis and contributions are recognised as an expense when they are due.
1.21 Borrowings
Borrowings are recognised initially at fair value, net of transaction costs incurred. Borrowings are subsequently stated at amortised cost. Any difference between the proceeds (net of transaction costs) and the redemption value is recognised in the statement of comprehensive income over the period of the borrowings using the effective interest rate method.
Borrowings are classifi ed as current liabilities unless the group has an unconditional right to defer settlement of the liability for at least 12 months after the statement of fi nancial position date.
1.22 Dividend distribution
Dividend distribution to the company’s shareholders is recognised as a liability in the fi nancial statements in the period in which the dividends are approved by the shareholders.
1.23 Changes in accounting policy and disclosures
Standards and interpretations effective and adopted in the current year
The company has adopted all of the new and revised Standards and Interpretations issued by the International Accounting Standards Board (the IASB) and the International Financial Reporting Interpretations Committee (IFRIC) for the IASB that are relevant to its operations.

294
MARICO SOUTH AFRICA CONSUMER CARE (PTY) LIMITED
294
NOTES TO THE FINANCIAL STATEMENTSfor the year ended 31 March 2013
Standards and interpretations not yet effective
The company has chosen not to early adopt the following standards and interpretations, which have been published and are mandatory for the company’s accounting periods beginning on or after 1 July 2013 or later periods:
Standard/ Interpretation: Effective date:
Disclosures – Offsetting Financial Assets and
Financial Liabilities (Amendments to IFRS 7) 1-Jan-13
Offsetting Financial Assets and Financial Liabilities
(Amendments to IAS 32) 1-Jan-14
IAS 1 Annual Improvements for 2009 – 2011 cycle 1-Jan-13
IAS 16 Annual Improvements for 2009 – 2011 cycle 1-Jan-13
IAS 32 Annual Improvements for 2009 – 2011 cycle 1-Jan-13
Standards and interpretations not yet effective or relevant
The following standards and interpretations have been published and are mandatory for the company’s accounting periods beginning on or after 1 January 2013 or later periods but are not relevant to its operations:
Standard/ Interpretation: Effective date:
2010 Annual Improvements Project: Amendments to
IFRS 7 (AC 144) Financial Instruments: Disclosures 1-Jan-11
IAS 27 (AC 132) Separate Financial Statements 1-Jan-13
IFRS 11 (AC148) Joint Arrangements 1-Jan-13
IFRS 12 (AC 149) Disclosure of Interests in Other Entities 1-Jan-13
IFRS 13 (AC 150) Fair Value Measurement 1-Jan-13
IAS 1 (AC101) Presentation of Financial Statements 1-Jul-12
IAS 19 (AC 116) Employee Benefi ts Revised 1-Jan-13
Government Loans (Amendment to IFRS 1) 1-Jan-13
IFRS 1 Annual Improvements for 2009 – 2011 cycle 1-Jan-13
IAS 34 Annual Improvements for 2009 – 2011 cycle 1-Jan-13
Consolidated Financial Statements, Joint
Arrangements and Disclosures of Interests in Other
Entities: Transition Guidance. 1-Jan-13
IFRIC 20 Stripping Costs in the Production Phase of a Surface Mine. 1-Jan-13
The company is in the process of evaluating the effects of these new standards and interpretations
1.24 Critical accounting estimates and judgements
Estimates and judgments are continually evaluated and are based on historical and other factors, including expectations of future events that are believed to be reasonable under the circumstances.
1.24.1 Critical accounting estimates and assumptions
The company makes estimates and assumptions concerning the future. The resulting accounting estimates will, by defi nition, rarely equal the related actual results. The estimates and assumptions that have a signifi cant risk of causing a material adjustment to the carrying amounts of assets and liabilities within the next fi nancial year are outlined below.

295295
MARICO SOUTH AFRICA CONSUMER CARE (PTY) LIMITED
NOTES TO THE FINANCIAL STATEMENTSfor the year ended 31 March 2013
(a) Estimated impairment of intangible assets
The company tests annually whether intangible assets have suffered any impairment, in accordance with the accounting policy stated in note 1.5. The recoverable amounts of cash-generating units has been determined based on value-in use calculations. These calculations require the use of estimates (refer note 7).
If the revised estimated discounting rate applied was 1% lower/higher than management’s estimates, the company will not have to recognise an impairment against intangible assets.
2 Operating profi t/(loss)
2.1 The following items have been charged/(credited) in arriving at operating profi t/(loss):
Group Company
2013 2012 2013 2012 2013 2012 2013 2012R R Rs. Crore Rs. Crore R R Rs. Crore Rs. Crore
Depreciation on property,
plant and equipment
1,085,166 1,114,763 0.64 0.74 – – – –
(A detailed breakdown of
the depreciation expense
is presented in note 6)
Profi t on disposal of
property, plant and
equipment
205,901 79,640 0.12 0.05 – – – –
Impairment of intangible
assets
69,605 – 0.04 – – – – –
Loss on disposal of
intangible asset
– 367,565 – 0.24 – – – –
Auditor’s remuneration:
Audit fees
current year provision 379,800 360,000 0.22 0.24 – 20,000 – 0.01
prior year under/(over)
provision
– 293,541 – 0.19 20,000 – 0.01 –
379,800 653,541 0.22 0.43 20,000 20,000 0.01 0.01
Lease rentals
Buildings 4,077,092 3,411,440 2.39 2.26 – – – –
Computers 306,888 355,943 0.18 0.24 – – – –
4,383,980 3,767,383 2.57 2.50 – – – –
Directors’ emoluments
Salaries 1,571,876 1,462,689 0.92 0.97 – – – –
Other 943,702 1,126,635 0.55 0.75 – – – –
2,515,578 2,589,324 1.48 1.72 – – – –
Staff costs (see note 3) 20,659,101 18,799,707 12.11 12.47 – – – –

296
MARICO SOUTH AFRICA CONSUMER CARE (PTY) LIMITED
296
NOTES TO THE FINANCIAL STATEMENTSfor the year ended 31 March 2013
2.2 Expenses by nature
Group Company
2013 2012 2013 2012 2013 2012 2013 2012R R Rs. Crore Rs. Crore R R Rs. Crore Rs. Crore
Depreciation 1,085,166 1,114,763 0.64 0.74 – – – –
Directors’ emoluments 2,515,578 2,589,324 1.48 1.72 – – – –
Operating lease rentals 4,383,980 3,767,383 2.57 2.50 – – – –
Staff costs 20,659,101 18,799,707 12.11 12.47 – – – –
Cost of sales 94,329,358 86,643,985 55.31 57.48 – – – –
Commission 5,204,770 4,855,264 3.05 3.22 – – – –
Advertising 13,540,050 12,199,723 7.94 8.09 – – – –
Freight 8,478,970 9,066,861 4.97 6.01 – – – –
Other 8,138,466 7,876,163 4.77 5.23 8,165 3,945 0.01 0.01
Total cost of sales and operating expenses
158,335,439 146,913,173 92.85 97.46 8,165 3,945 0.01 0.01
3 Staff Costs
Group Company
2013 2012 2013 2012 2013 2012 2013 2012R R Rs. Crore Rs. Crore R R Rs. Crore Rs. Crore
Salaries and wages 17,424,905 15,433,476 10.22 10.24 – – – –
Other 3,234,196 3,366,231 1.90 2.23 – – – –
20,659,101 18,799,707 12.11 12.47 – – – –Average number of persons employed:
- Full time 114 117
4 Finance (costs)/income
4.1 Finance cost Group Company
2013 2012 2013 2012 2013 2012 2013 2012R R Rs. Crore Rs. Crore R R Rs. Crore Rs. Crore
Related party (refer note 22) (6,364,123) (6,261,564) (3.73) (4.15) (6,364,123) (6,261,564) (3.73) (4.15)

297297
MARICO SOUTH AFRICA CONSUMER CARE (PTY) LIMITED
4.2 Finance income
Group Company
2013 2012 2013 2012 2013 2012 2013 2012R R Rs. Crore Rs. Crore R R Rs. Crore Rs. Crore
Bank 227,934 83,900 0.13 0.06 7,395 19,812 – 0.01
Related party (refer note 22) _ _ – – 5,968,487 5,825,715 3.50 3.86
227,934 83,900 0.13 0.06 5,975,882 5,845,527 3.50 3.88
Net fi nance costs (6,136,189) (6,177,664) (3.60) (4.10) (388,241) (416,037) (0.23) (0.28)
5 Income tax expense
Group Company
2013 2012 2013 2012 2013 2012 2013 2012R R Rs. Crore Rs. Crore R R Rs. Crore Rs. Crore
Deferred tax
- current year (39,547) 296,509 (0.02) 0.20 – – – –
- prior year underprovision 470,140 319,137 0.28 0.21 – – – –
430,593 615,646 0.25 0.41 – – – –
The tax on the company (loss)/profi t before tax differs from the theoretical amount that would arise using basic rates as follows:
(Loss)/profi t before tax (208,258) 1,410,472 (0.12) 0.94 (380,076.00) (419,982.00) (0.22) (0.28)
Tax calculated at a rate of 28%
(58,312) 394,932 (0.03) 0.26 (106,421.00) (117,595.00) (0.06) (0.08)
Deferred tax – prior year underprovision
470,140 319,137 0.28 0.21 – – – –
Permanent differences 75,562 (98,423) 0.04 (0.07) 106,421.00 117,595.00 0.06 0.08
Prior year unutilized capital assessed loss
(56,797) – (0.03) – – – – –
Tax charge 430,593 615,646 0.25 0.41 – – – –
No provision has been made for current taxation as the group has a computed/estimated tax loss of R 13,937,601 (Rs. 8.17 Crore) (2012: R 15,144,432 (Rs. 10.05 Crore)). The group recognises deferred tax assets to the extent that future taxable profi ts will be available against which the unused tax losses and deductible temporary differences can be utilised.
Management has assessed recoverability of the deferred tax asset based on company budgets and forecasted earnings and the assessed loss is considered recoverable against future taxable profi ts.
NOTES TO THE FINANCIAL STATEMENTSfor the year ended 31 March 2013

298
MARICO SOUTH AFRICA CONSUMER CARE (PTY) LIMITED
298
NOTES TO THE FINANCIAL STATEMENTSfor the year ended 31 March 2013
6 Property, plant and equipment
Group Year ended 31 March 2013
Leasehold improvements
Plant and machinery
Motor vehicles
Offi ce furniture and
computer equipment
Capital work-in-
progress
Total
R R R R R ROpening net carrying amount 1,379,641 1,723,594 87,435 489,175 66,450 3,746,295
Additions 121,385 135,152 – 163,906 _ 420,443
Transfer – 66,450 – (66,450) –
Depreciation (286,521) (436,836) (36,278) (325,531) _ (1,085,166)
Disposals – (108,963) – (35,426) – (144,389)
Transfer to non-current assets held for sale
– (1,077,786) – – – (1,077,786)
Closing net carrying amount 1,214,505 301,611 51,157 292,124 – 1,859,397
Cost 2,972,425 2,937,394 279,664 1,820,796 – 8,010,279
Accumulated depreciation and impairment
(1,757,920) (2,635,783) (228,507) (1,528,672) – (6,150,882)
Closing net carrying amount 1,214,505 301,611 51,157 292,124 – 1,859,397
Year ended 31 March 2012
Leasehold improvements
Plant and machinery
Motor vehicles
Offi ce furniture and
computer equipment
Capital work-in-progress
Total
Rs. Crore Rs. Crore Rs. Crore Rs. Crore Rs. Crore Rs. CroreOpening net carrying amount 0.81 1.01 0.05 0.29 0.04 2.20
Additions 0.07 0.08 – 0.10 – 0.25
Transfer – 0.04 – – (0.04) –
Depreciation (0.17) (0.26) (0.02) (0.19) – (0.64)
Disposals – (0.06) – (0.02) – (0.08)
Transfer to non-current assets held for sale
– (0.63) – – – (0.63)
Closing net carrying amount 0.71 0.18 0.03 0.17 – 1.09
Cost 1.74 1.72 0.16 1.07 – 4.70
Accumulated depreciation and impairment
(1.03) (1.55) (0.13) (0.90) – (3.61)
Closing net carrying amount 0.71 0.18 0.03 0.17 – 1.09

299299
MARICO SOUTH AFRICA CONSUMER CARE (PTY) LIMITED
NOTES TO THE FINANCIAL STATEMENTSfor the year ended 31 March 2013
Depreciation charge of R 1,085,166 (Rs. 0.64 Crore) (2012: R 1,114,763 (Rs. 0.74 Crore)) has been charged to operating expenses.
Group Year ended 31 March 2012
Leasehold improvements
Plant and machinery
Motor vehicles
Offi ce furniture and
computer equipment
Capital work-in-
progress
Total
R R R R R ROpening net carrying amount 1,664,804 1,818,430 25,232 637,867 – 4,146,333
Additions 369,476 108,333 193,326 66,450 737,585
Depreciation (285,163) (464,312) (46,130) (319,158) – (1,114,763)
Disposals – – – (22,860) – (22,860)
Closing net carrying amount 1,379,641 1,723,594 87,435 489,175 66,450 3,746,295
Cost 2,851,041 5,334,704 325,382 1,781,763 66,450 10,359,340Accumulated depreciation and impairment
(1,471,400) (3,611,110) (237,947) (1,292,588) – (6,613,045)
Closing net carrying amount 1,379,641 1,723,594 87,435 489,175 66,450 3,746,295
Year ended 31 March 2012
Leasehold improvements
Plant and machinery
Motor vehicles
Offi ce furniture and
computer equipment
Capital work-in-progress
Total
Rs. Crore Rs. Crore Rs. Crore Rs. Crore Rs. Crore Rs. CroreOpening net carrying amount 1.10 1.21 0.02 0.42 – 2.75
Additions – 0.25 0.07 0.13 0.04 0.49
Depreciation (0.19) (0.31) (0.03) (0.21) – (0.74)
Disposals – – – (0.02) – (0.02)
Closing net carrying amount 0.92 1.14 0.06 0.32 0.04 2.49
Cost 1.89 3.54 0.22 1.18 0.04 6.87
Accumulated depreciation and impairment
(0.98) (2.40) (0.16) (0.86) – (4.39)
Closing net carrying amount 0.92 1.14 0.06 0.32 0.04 2.49
Company:No items of property, plant and equipment are held at company level.

300
MARICO SOUTH AFRICA CONSUMER CARE (PTY) LIMITED
300
7 Intangible assets
Group Year ended 31 March 2013
Brands Total Brands Total
R R Rs. Crore Rs. CroreOpening carrying amount 48,062,924 48,062,924 28.18 28.18
Impairment (69,605) (69,605) (0.04) (0.04)
Closing carrying amount 47,993,319 47,993,319 28.14 28.14
Cost 50,062,924 50,062,924 29.36 29.36
Accumulated impairment (2,069,605) (2,069,605) (1.21) (1.21)
Closing carrying amount 47,993,319 47,993,319 28.14 28.14
Year ended 31 March 2012
Brands Total Brands Total
R R Rs. Crore Rs. CroreOpening carrying amount 49,330,489 49,330,489 32.73 32.73
Impairment (1,267,565) (1,267,565) (0.84) (0.84)
Closing carrying amount 48,062,924 48,062,924 31.88 31.88
Cost 50,062,924 50,062,924 33.21 33.21
Accumulated impairment (2,000,000) (2,000,000) (1.33) (1.33)
Closing carrying amount 48,062,924 48,062,924 31.88 31.88
The group has classifi ed its intangible assets as having indefi nite useful lives. This conclusion is supported by the fact
that the group is expected to be able to use the brands for the foreseeable future and that the typical product life cycles
for the brands, acquired from public information on estimates of useful lives, indicate that the intangible asset has an
indefi nite period of foreseeable usage. This is further supported by the stability and the strong demand in markets within
which these products are marketed and sold.
Detailed impairment testing is performed for the indefi nite-life intangible assets annually. The impairment review process
is as follows:
Each period and whenever impairment indicators are present, management calculate the fair value of the asset and record
an impairment loss for the excess of the carrying value over the fair value, if any.
The fair value is generally measured as the net present value of projected cash fl ows. In addition, a revaluation of the
remaining useful life of the asset is performed to determine whether continuing to characterise the asset as having an
indefi nite life is appropriate.
The recoverable amounts have been determined based on a value-in-use calculation. The calculation uses a free cash
fl ow model that discounts the free cash fl ow available from profi t after tax generated by the intangible asset. If the resulting
net present value exceeds the carrying value of the intangible asset, the intangible asset is not impaired. However, if the
resulting net present value is less than the carrying value an impairment charge is raised.
The key assumptions used for the value-in-use calculations are as follows:
2013 2012
Growth rate *1 2.50% 5.70%
Discount rate *2 10.60% 8%
NOTES TO THE FINANCIAL STATEMENTSfor the year ended 31 March 2013

301301
MARICO SOUTH AFRICA CONSUMER CARE (PTY) LIMITED
*1 Weighted average growth rate used to extrapolate cash fl ows beyond the budget period. *2 Post-tax discount rate applied to the cash fl ow projections.
8 Investment in subsidiary
Group Company
2013 2012 2013 2012 2013 2012 2013 2012R R Rs. Crore Rs. Crore R R Rs. Crore Rs. Crore
Marico South Africa Proprietary Limited
Investment in shares at cost – – – – 45,485,555 45,485,555 26.67 30.18
The group’s share of the results of its subsidiary, which is unlisted, are as follows:
NameCountry of
incorporationProfi t/(Loss) after
taxProfi t/(Loss) after
taxR Rs. Crore
2013
Marico South Africa Proprietary Limited South Africa (R 258,775) 0.15
2012
Marico South Africa Proprietary Limited South Africa R 1,214,807 0.81
The following information relates to the company’s fi nancial interest in its subsidiary:
Name Number of shares held
Proportionheld Nature of business
Subsidiary
Marico South Africa Proprietary Limited 5,000 100% Manufacturing and distributing of wide range of personal care and affordable complementary health care products
9 Inventories
Group Company
2013 2012 2013 2012 2013 2012 2013 2012R R Rs. Crore Rs. Crore R R Rs. Crore Rs. Crore
Raw materials 8,208,091 7,174,683 4.81 4.76 – – – –
Work in progress 468,113 503,445 0.27 0.33 – – – –
Finished goods 8,951,781 9,913,076 5.25 6.58 – – – –
17,627,985 17,591,204 10.34 11.67 – – – –Amount included in inventory balance as write down to net realisable value (2,122,337) (1,260,058) (1.24) (0.84) – – – –
The cost of inventories recognised as an expense and included in cost of sales amounted to 94,329,358 (Rs. 55.31 Crore) (2012: R 86,643,985 (Rs. 57.48 Crore)). R
NOTES TO THE FINANCIAL STATEMENTSfor the year ended 31 March 2013

302
MARICO SOUTH AFRICA CONSUMER CARE (PTY) LIMITED
302
10 Trade and other receivables
Group Company
2013 2012 2013 2012 2013 2012 2013 2012R R Rs. Crore Rs. Crore R R Rs. Crore Rs. Crore
Trade receivables 27,381,600 22,704,651 16.06 15.06 – – – –
Provision for doubtful debts
(6,057) (14,967) (0.01) (0.01) – – – –
Net trade receivables 27,375,543 22,689,684 16.05 15.05 – – – –
Other receivables 328,475 419,748 0.19 0.28 – –
27,704,018 23,109,432 16.25 15.33 – – – –The group grants credit of 30 days to its customers. The analysis of trade receivables which are past due and not impaired at year end is as follows:
Past due by 30 days 12,905,530 9,730,463 7.57 6.46 – – – –
Past due by 60 days 4,154,420 2,984,244 2.44 1.98 – – – –
Past due by 90 days 1,243,742 1,494,603 0.73 0.99 – – – –
18,303,692 14,209,310 10.73 9.43 – – – –The carrying value of the trade and other receivables approximates their fair value.
11 Cash and cash equivalents
Group Company
2013 2012 2013 2012 2013 2012 2013 2012R R Rs. Crore Rs. Crore R R Rs. Crore Rs. Crore
For the purpose of the statement of cash fl ows, the year end cash and cash equivalents comprise the following:
Bank balances 4,664,856 4,961,765 2.74 3.29 191,137 195,577 0.11 0.13
Credit quality of cash at bank: BBB+
NOTES TO THE FINANCIAL STATEMENTSfor the year ended 31 March 2013

303303
MARICO SOUTH AFRICA CONSUMER CARE (PTY) LIMITED
12 Non-current assets held for sale
Group Company
2013 2012 2013 2012 2013 2012 2013 2012R R Rs. Crore Rs. Crore R R Rs. Crore Rs. Crore
The non-current assets held for sale relate to plant and machinery that is being sold to Sikuniko Impilo Proprietary Limited, effective as of
2 May 2013.
The purchase consideration is in excess of the carrying amount of the non-current assets held for sale, therefore no impairment is considered necessary.
Plant and machinery 1,077,786 – 0.63 – – – 0.63 –
13 Share capital and share premium
Group Company
2013 2012 2013 2012 2013 2012 2013 2012R R Rs. Crore Rs. Crore R R Rs. Crore Rs. Crore
Authorised
1,000 Ordinary shares of R1 each 1,000 1,000 0.01 0.01 1,000 1,000 0.01 0.01
Issued
800 Ordinary shares of R1 each 800 800 0.01 0.01 800 800 0.01 0.01
Share premium 43,799,900 43,799,900 25.68 25.68 43,799,900 43,799,900 25.68 25.68
NOTES TO THE FINANCIAL STATEMENTSfor the year ended 31 March 2013

304
MARICO SOUTH AFRICA CONSUMER CARE (PTY) LIMITED
304
14 Deferred income tax assets
Group Company
2013 2012 2013 2012 2013 2012 2013 2012R R Rs. Crore Rs. Crore R R Rs. Crore Rs. Crore
Defer red income taxes are calculated on a l l temporary differences under the liability method using a principal tax rate of 28% (2012: 28%).
The movement on the deferred income tax asset account is as follows:
At beginning of year7,077,135 7,692,781 4.16 4.52 – – – –
Current year 39,547 (296,509) 0.03 (0.16) – – – –
Prior year underprovision (470,140) (319,137) (0.27) (0.18) – – – –
At end of year6,646,542 7,077,135 3.93 4.18 – – – –
Deferred tax assets may be analysed as follows:
Property, plant and equipment (83,190) (64,584) (0.04) (0.03) – – – –
Other provisions2,449,744 3,051,896 1.45 1.80 – – – –
Tax losses carried forward 4,279,988 4,089,823 2.52 2.41 – – – –
No deferred tax asset has been recognised at company level as it is not probable that future taxable profi ts will be available against which temporary differences can be utilised.
NOTES TO THE FINANCIAL STATEMENTSfor the year ended 31 March 2013

305305
MARICO SOUTH AFRICA CONSUMER CARE (PTY) LIMITED
15 Goodwill
Group Company
2013 2012 2013 2012 2013 2012 2013 2012R R Rs. Crore Rs. Crore R R Rs. Crore Rs. Crore
Carrying value at the end of the year 37,686,823 37,686,823 22.10 25.00 – – – –
Goodwill relates to the acquisition of Marico South Africa Proprietary Limited in 2007.
Goodwill has been assessed for impairment in terms of IAS 36. Based on future expected cash fl ows from the subsidiary, Marico South Africa Proprietary Limited, no impairment is considered necessary.
16 Trade and other payables
Group Company
2013 2012 2013 2012 2013 2012 2013 2012R R Rs. Crore Rs. Crore R R Rs. Crore Rs. Crore
Trade payables 20,077,269 16,540,204 11.77 10.97 – – – –
Amount due to related party (refer note 22) 341,184 158,242 0.20 0.10 – – – –
Accruals 2,220,323 1,899,305 1.30 1.26 – – – –
Audit fee provision 389,800 386,080 0.23 0.26 – 20,000 – 0.01
Bonus provision 1,829,765 1,834,833 1.07 1.22 – – – –
Leave pay provision 786,579 672,118 0.46 0.45 – – – –
Other payables 2,158,634 255,425 1.27 0.17 – – – –
27,803,554 21,746,207 16.30 14.43 – 20,000 – 0.01
The carrying value of the trade and other payables approximates their fair value.
NOTES TO THE FINANCIAL STATEMENTSfor the year ended 31 March 2013

306
MARICO SOUTH AFRICA CONSUMER CARE (PTY) LIMITED
306
17 Borrowings
Group Company
2013 2012 2013 2012 2013 2012 2013 2012R R Rs. Crore Rs. Crore R R Rs. Crore Rs. Crore
Related party (refer note 22)
- Non-current portion 59,809,668 61,225,999 35.07 40.62 59,809,668 61,225,999 35.07 40.62
- Current portion 20,528,070 22,492,444 12.04 14.92 20,528,070 22,492,444 12.04 14.92
80,337,738 83,718,443 47.11 55.54 80,337,738 83,718,443 47.11 55.54The loan is unsecured. T h e n o n - c u r r e n t portion of the loan is repayable in four years and bears interest at the 6 month London Interbank Offered Rate plus 7%. The current portion of the loan is repayable within 12 months and bears interest at a rate of 9% (2012: 8.5).
Maturity of borrowings
Due within 1 year 20,528,070 22,492,444 12.04 14.92 20,528,070 22,492,444 12.04 14.92
Due within 2 – 5 years 59,809,668 61,225,999 35.07 40.62 59,809,668 61,225,999 35.07 40.62
80,337,738 83,718,443 47.11 55.54 80,337,738 83,718,443 47.11 55.54
18 Share-based payments
Marico Limited granted senior management of Marico South Africa Proprietary Limited a STAR grant bonus in respect of the share appreciation rights scheme.
The liability in respect of the share appreciation rights scheme is to be settled by Marico South Africa (Proprietary Limited). The value is determined by the market price of equity shares and no minimum guarantee amount is provided.
The STAR grant value on maturity will be computed in INR and will be converted at the prevalent exchange rate as decided by Marico Group Corporate Finance Function, and paid to senior management in the currency of location of senior management.
Award price Indian Rupee
(INR)
Date Rights Awarded
Rights Awarded Vesting Date Rights Exercisable at 31
March 2013
129 28/03/2011 75,500 30/09/2013 –
149 1/12/2011 25,500 30/11/2014 –
NOTES TO THE FINANCIAL STATEMENTSfor the year ended 31 March 2013

307307
MARICO SOUTH AFRICA CONSUMER CARE (PTY) LIMITED
The share price at 31 March 2013 used to compute the share option liability in INR 213. No options were exercised or forfeited during the year.
Group Company
2013 2012 2013 2012 2013 2012 2013 2012R R Rs. Crore Rs. Crore R R Rs. Crore Rs. Crore
Current portion 863,125 – 0.51 – – – – –
Non-current portion 124,232 – 0.07 – – – – –
987,357 – 0.58 – – – – –
19 Amount due from related party
Group Company
2013 2012 2013 2012 2013 2012 2013 2012R R Rs. Crore Rs. Crore R R Rs. Crore Rs. Crore
Related party (refer note 22)
– – – – 53,876,041 55,688,008 31.59 36.94
- Non-current portion – – – – 20,528,070 22,492,444 12.04 14.92
- Current portion – – – – 74,404,111 78,180,452 43.63 51.86
The loan is unsecured. The non-current portion of the loan is repayable in four years and bears interest at the 6 month London Interbank Offered Rate plus 7%. The current portion of the loan is repayable within 12 months and bears interest at a rate of 8.5% (2012: 9%).
Maturity of borrowings
Due within 1 year – – – – 20,528,070 22,492,444 12.04 14.92
Due within 2 – 5 years – – 53,876,041 55,688,008 31.59 36.94
– – – – 74,404,111 78,180,452 43.63 51.86
20 Financial risk management
The group’s fi nancial instruments consist primarily of deposits with banks, short term investments, trade accounts receivable and payable and loans to and from the holding company and its subsidiary. Financial instruments are carried at fair value or amounts that approximate fair value.
Financial assets
Loans and receivables:
Group Company
2013 2012 2013 2012 2013 2012 2013 2012R R Rs. Crore Rs. Crore R R Rs. Crore Rs. Crore
Assets as per the statement of fi nancial position
NOTES TO THE FINANCIAL STATEMENTSfor the year ended 31 March 2013

308
MARICO SOUTH AFRICA CONSUMER CARE (PTY) LIMITED
308
Group Company
2013 2012 2013 2012 2013 2012 2013 2012R R Rs. Crore Rs. Crore R R Rs. Crore Rs. Crore
Trade and other receivables 27,704,018 23,109,432 16.25 15.33 – – – –
Cash and cash equivalents 4,664,856 4,961,765 2.74 3.29 191,137 195,577 0.11 0.13
Amount due from related party – – – – 74,404,111 78,180,452 43.63 51.86
32,368,874 28,071,197 18.98 18.62 74,595,248 78,376,029 43.74 51.99
Financial liabilities
Financial liabilities at amortised cost:
Liabilities as per the statement of fi nancial position
Interest bearing liabilities 80,337,738 83,718,443 47.11 55.54 80,337,738 83,718,443 47.11 55.54
Trade and other payables 24,175,094 19,239,256 14.18 12.76 – 20,000 – 0.01
104,512,832 102,957,699 61.29 68.30 80,337,738 83,738,443 47.11 55.55
21 Cash fl ow from operating activities
Group Company
2013 2012 2013 2012 2013 2012 2013 2012R R Rs. Crore Rs. Crore R R Rs. Crore Rs. Crore
Operating profi t/(loss)
5,927,931 7,588,136 3.48 5.03 8,165 (3,945) – 0.01
Adjusted for:
Non-cash items
Depreciation 1,085,166 1,114,763 0.64 0.74 – – – –
Profi t on sale of assets (205,901) (79,640) (0.12) (0.05) – – – –
Loss on disposal of intangible asset – 367,565 – 0.24 – – – –
Impairment of intangible asset 69,605 – 0.04 – – – – –
Share-based payment expense 987,357 – 0.58 – – – – –
Operating profi t before working
capital changes:
NOTES TO THE FINANCIAL STATEMENTSfor the year ended 31 March 2013
20 Financial risk management (Contd.)

309309
MARICO SOUTH AFRICA CONSUMER CARE (PTY) LIMITED
Group Company
2013 2012 2013 2012 2013 2012 2013 2012R R Rs. Crore Rs. Crore R R Rs. Crore Rs. Crore
Decrease/(increase) in trade and other receivables (4,594,586) 1,629,827 (2.69) 1.08 – – – –
Decrease/(increase) in inventories (36,781) 512,375 (0.02) 0.34 – – – –
(Decrease)/increase in trade and other payables 6,057,347 (6,623,949) 3.55 (4.39) (20,000) – (0.01) –
9,290,138 4,509,077 5.45 2.99 (11,835) (3,945) (0.01) (0.01)
22 Related party transactions
The group has a related party relationship with its holding company, subsidiary and with its directors and key management personnel.
Transactions with related parties:
The following transactions were carried out by the company with related parties:
Interest income earned (refer note 4.2)
Group Company
2013 2012 2013 2012 2013 2012 2013 2012R R Rs. Crore Rs. Crore R R Rs. Crore Rs. Crore
Marico South Africa Proprietary Limited – – – – 5,968,487 5,825,715 3.50 3.86
Technical Support 341,184 158,242 0.20 0.10 – – – –
- Marico Limited
Interest expense incurred (refer note 4.1)
Marico Limited 6,364,123 6,261,564 3.73 4.15 6,364,123 6,261,564 3.73 4.15
Directors’ emoluments (refer note 2) 2,515,578 2,589,324 1.48 1.72 – – – –
Investment in subsidiary (refer note 8):
NOTES TO THE FINANCIAL STATEMENTSfor the year ended 31 March 2013
21 Cash fl ow from operating activities (Contd.)

310
MARICO SOUTH AFRICA CONSUMER CARE (PTY) LIMITED
310
Group Company
2013 2012 2013 2012 2013 2012 2013 2012R R Rs. Crore Rs. Crore R R Rs. Crore Rs. Crore
Marico South Africa Proprietary Limited – – 45,485,555 45,485,555 26.67 30.18
Amounts due from related parties
Amounts due from subsidiary (refer note 17):
Marico South Africa Proprietary Limited – – 74,404,111 78,180,452 43.63 51.86
Amoun ts due t o related parties
Amoun ts due t o ho ld ing company (refer note 17):
Marico Limited 80,337,738 83,718,443 47.11 55.54 80,337,738 83,718,443 – –
Included in trade and other payables (refer note 16):
Marico Limited 341,184 158,242 0.20 0.10 – – – –
23 Commitments
Group Company
2013 2012 2013 2012 2013 2012 2013 2012R R Rs. Crore Rs. Crore R R Rs. Crore Rs. Crore
Operating lease commitments
The future minimum lease payments payable under non-cancellable operating leases are as follows:
Within 1 year 1,699,379 1,769,054 1.00 1.17 – – – –
Between 2 and 5 years 3,710,674 5,971,197 2.18 3.96 – – – –
Over 5 years
5,410,053 7,740,251 3.17 5.13 – – – –
The group leases certain factory facilities under sub-operating leases. The leases run for a period of up to 10 years, with an option to renew the lease after that date.
NOTES TO THE FINANCIAL STATEMENTSfor the year ended 31 March 2013
22 Related party transactions (Contd.)

311311
MARICO SOUTH AFRICA (PTY) LIMITED
Registration number: 1977/001752/07
Board of Director: Saugata Gupta (Appointed on July 5, 2013) Pawan Agrawal (Appointed on July 5, 2013) Jaques Nieuwenhuys (Appointed on July 5, 2013) John Richard Mason
Harsh Mariwala (Resigned on July 5, 2013) Milind Sarswate (Resigned on July 5, 2013) Vijay Subramaniam (Resigned on July 5, 2013) Padmanabh Maydeo (Resigned on July 5, 2013)
Registered Offi ce: 1474 South Coast Road Mobeni 4051
Postal address: P.O. Box 72625 Mobeni 4060
Auditors: PricewaterhouseCoopers Inc. Durban
Bankers: Standard Bank of South Africa Limited
These fi nancial statements have been prepared in accordance with the Companies Act of South Africa, 2008 under the supervision of Z Rayman (Financial Manager) and have been audited by our external auditors PricewaterhouseCoopers Inc.

312
MARICO SOUTH AFRICA (PTY) LIMITED
312
The directors are responsible for the preparation, integrity and fair presentation of the fi nancial statements of Marico South Africa Proprietary Limited. The fi nancial statements have been prepared in accordance with the International Financial Reporting Standards (IFRS) and in a manner required by the Companies Act of South Africa, and include amounts based on judgements and estimates made by management.
The directors consider that in preparing the fi nancial statements they have used the most appropriate accounting policies, consistently applied and supported by reasonable and prudent judgements and estimates, and that all statements of IFRS that they consider to be applicable have been followed. The directors are satisfi ed that the information contained in the fi nancial statements fairly presents the results of operations for the year and the fi nancial positions of the company at year end.
The directors have the responsibility of ensuring that accounting records are kept. The accounting records should disclose with reasonable accuracy the fi nancial positions of the company to enable the directors to ensure that the fi nancial statements comply with the relevant legislation.
Marico South Africa Proprietary Limited operated in an established control environment, which is documented and reviewed. This incorporates risk management and internal control procedures, which are designed to provide reasonable, but not absolute, assurance that assets are safeguarded and the risks facing the business are being controlled.
The going concern basis has been adopted in preparing the fi nancial statements. The directors have no reason to believe that the company will not be a going concern in the foreseeable future. The company's external auditors, PricewaterhouseCoopers Inc, audited the fi nancial statements and their report is presented.
The fi nancial statements set out were approved by the board of directors and are signed on their behalf.
John Richard Mason Vijay Subramaniam
Director Director
STATEMENT OF DIRECTORS’ RESPONSIBILITY

313313
MARICO SOUTH AFRICA (PTY) LIMITED
INDEPENDENT AUDITOR’S REPORT
TO
THE SHAREHOLDERS OF MARICO SOUTH AFRICA PROPRIETARY LIMITED
We have audited the annual fi nancial statements of Marico South Africa Proprietary Limited, which comprise the statement of fi nancial position as at 31 March 2013, and the statements of comprehensive income, changes in equity and cash fl ows for the year then ended, and a summary of signifi cant accounting policies and other explanatory notes, as set out on pages 5 to 30.
Directors’ Responsibility for the Financial Statements
The company’s directors are responsible for the preparation and fair presentation of these fi nancial statements in accordance with the International Financial Reporting Standards and in the manner required by the Companies Act of South Africa, and for such internal control as directors determine is necessary to enable the preparation of fi nancial statements that are free from material misstatements, whether due to fraud or error.
Auditor’s Responsibility
Our responsibility is to express an opinion on these fi nancial statements based on our audit. We conducted our audit in accordance with International Standards on Auditing. Those standards require that we comply with ethical requirements and plan and perform the audit to obtain reasonable assurance whether the fi nancial statements are free from material misstatement.
An audit involves performing procedures to obtain audit evidence about the amounts and disclosures in the fi nancial statements. The procedures selected depend on the auditor’s judgement, including the assessment of the risks of material misstatement of the fi nancial statements, whether due to fraud or error. In making those risk assessments, the auditor considers internal control relevant to the entity’s preparation and fair presentation of the fi nancial statements in order to design audit procedures that are appropriate in the circumstances, but not for the purpose of expressing an opinion on the effectiveness of the entity’s internal control. An audit also includes evaluating the appropriateness of accounting policies used and the reasonableness of accounting estimates made by management, as well as evaluating the overall presentation of the fi nancial statements.
We believe that the audit evidence we have obtained is suffi cient and appropriate to provide a basis for our audit opinion.
Opinion
In our opinion, the fi nancial statements present fairly, in all material respects, the fi nancial position of Marico South Africa Proprietary Limited at 31 March 2013, and its fi nancial performance and cash fl ows for the year then ended in accordance with the International Financial Reporting Standards, and in the manner required by the Companies Act of South Africa.
Other reports required by the Companies Act
As part of our audit of the fi nancial statements for the year ended 31 March 2013, we have read the Directors’ Report for the purpose of identifying whether there are material inconsistencies between the report and the audited fi nancial statements. The report is the responsibility of the Directors. Based on reading the report we have not identifi ed material inconsistencies between the report and the audited fi nancial statements. However, we have not audited the report and accordingly do not express an opinion on the report.
PricewaterhouseCoopers Inc.Director : N RamlaganRegistered AuditorDurban8 May 2013

314
MARICO SOUTH AFRICA (PTY) LIMITED
314
DIRECTORS’ REPORTFor the year ended 31 March 2013
The directors present their annual report, which forms part of the audited fi nancial statements of the company for the year ended 31 March 2013.
NATURE OF BUSINESSThe Company manufactures and distributes a wide range of personal care and affordable complementary health care products.
DIVIDENDSNo dividends have been declared during the period and none are recommended (2012: R Nil).
SHARE CAPITALThe authorised and issued share capital has remained unchanged.
DIRECTORS AND SECRETARYThe present directors of the company are:
JR Mason H Mariwala (Indian) M Sarwate (Indian)V Subramanian (Indian)P Maydeo (Indian)The Company Secretary is KPMG.
HOLDING COMPANYMarico South Africa Consumer Care Proprietary Limited holds 100% of the company’s issued share capital. The ultimate holding company is Marico Limited, a listed company incorporated in Mumbai, India.
MATERIAL EVENTS AFTER YEAR-ENDNo matter which is material to the fi nancial affairs of the company has occurred between the statement of fi nancial position date and the date of approval of the fi nancial statements.
AUDITORSPricewaterhouseCoopers Inc. will continue in offi ce in accordance with Section 90(2) of the Companies Act 71 of 2008.
GOING CONCERNThe company generated a net loss for the period of R258 775 (2012: profi t of R1 214 807). At 31 March 2013 the company’s total assets exceeded its total liabilities by R4 187 744 (2012: R4 446 519).
The company has no external loans apart from its loan from the holding company.
The company is in the process of converting the long-term loan from Marico South Africa Consumer Care into equity. This would have had the impact of reducing interest costs and increasing profi t before tax by an estimated amount of R 4 207 440 per annum.
Accordingly, the annual fi nancial statements are prepared on the basis of accounting policies applicable to a going concern.

315315
MARICO SOUTH AFRICA (PTY) LIMITED
STATEMENT OF FINANCIAL POSITIONAs at 31 March 2013
As at 31 March As at 31 MarchNote 2013 2012 2013 2012
ASSETS R R Rs. Crore Rs. CroreNon-current assetsProperty, plant and equipment 6 1,859,397 3,746,295 1.09 2.49
Intangible assets 7 47,993,319 48,062,924 28.14 31.88
Deferred income tax asset 13 6,646,542 7,077,135 3.90 4.69
56,499,258 58,886,354 33.13 39.07
Current assetsTrade and other receivables 9 27,704,018 23,109,432 16.25 15.33
Inventories 8 17,627,985 17,591,204 10.34 11.67
Cash and cash equivalents 10 4,473,719 4,766,188 2.68 3.22
49,805,722 45,466,824 29.21 30.16
Non-current assets held for sale 11 1,077,786 – 0.63 –
50,883,508 45,466,824 29.84 30.16
TOTAL ASSETS 107,382,766 104,353,178 63.03 69.29
EQUITYCapital and reserves attributable to equity holders of the companyShare capital 12 5,000 5,000 0.01 0.01
Share premium 12 22,863,735 22,863,735 13.41 15.17
Accumulated loss (18,680,991) (18,422,216) (10.95) (12.22)
Total equity 4,187,744 4,446,519 2.47 2.96
LIABILITIESNon-current liabilitiesBorrowings 15 53,876,041 55,688,008 31.60 36.95
Share-based payment liability 16 124,232 – 0.08 –
54,000,273 55,688,008 31.69 36.96Current liabilitiesTrade and other payables 14 27,803,554 21,726,207 16.31 14.42
Borrowings 15 20,528,070 22,492,444 12.05 14.93
Share-based payment liability 16 863,125 – 0.52 –
49,194,749 44,218,651 28.88 29.36
Total liabilities 103,195,022 99,906,659 60.56 66.33
Total equity and liabilities 107,382,766 104,353,178 63.03 69.29
These fi nancial statements were approved by the Board of Directors on 30th May 2013 and signed on its behalf by:
Director
Note: The exchange rate use to convert Zar to Rs. 5.864 / (Previous year Zar to Rs. 6.634)484 / EGP (Rs. 8.858 / EGP)

316
MARICO SOUTH AFRICA (PTY) LIMITED
316
INCOME STATEMENTFor the year ended 31 March 2013
As at 31 March As at 31 MarchNote 2013 2012 2013 2012
R R Rs. Crore Rs. CroreRevenue 164,070,681 154,354,988 96.21 102.40
Cost of sales (94,329,358) (86,643,985) (55.31) (57.48)
Gross profi t 69,741,323 67,711,003 40.90 44.92
Operating expenses (64,014,246) (60,265,244) (42.47) (39.98)
Other income 192,689 146,321 0.13 0.10
Operating profi t 2 5,919,766 7,592,080 (1.44) 5.04
Finance income 4 220,539 64,088 0.15 0.04
Finance costs 4 (5,968,487) (5,825,715) (3.96) (3.86)
Profi t before income tax 171,818 1,830,453 (5.26) 1.21
Income tax expense 5 (430,593) (615,646) (0.29) (0.41)
Total comprehensive (loss)/profi t for the year (258,775) 1,214,807 (5.54) 0.81
Note: The exchange rate use to convert Zar to Rs. 5.864 / (Previous year Zar to Rs. 6.634)484 / EGP (Rs. 8.858 / EGP)

317317
MARICO SOUTH AFRICA (PTY) LIMITED
STATEMENT OF CHANGES IN EQUITYFor the year ended 31 March 2013
Share capital
Share premium
Accumula-ted losses
Total Share capital
Share premium
Accumula-ted losses
Total
R R R R Rs. Crore
Rs.Crore
Rs.Crore
Rs. Crore
Balance at 1 April 2012 5,000 22,863,735 (18,422,216) 4,446,519 0.01 13.41 (10.80) 2.61
Total comprehensive loss for the year – – (258,775) (258,775) – – (0.15) (0.15)Balance at 31 March 2013 5,000 22,863,735 (18,680,991) 4,187,744 0.01 13.41 (10.95) 2.46
Year ended 31 March 2012
Share capital
Share premium
Accumula-ted losses
Total Share capital
Share premium
Accumula-ted losses
Total
R R R Rs. Crore
Rs.Crore
RsCrore
Rs Crore
Balance at 1 April 2011 5,000 22,863,735 (19,637,023) 3,231,712 0.01 13.41 (11.52) 1.90
Total comprehensive profi t for the year
– – 1,214,807 1,214,807 – – 0.71 0.71
Balance at 31 March 2012 5,000 22,863,735 (18,422,216) 4,446,519 0.01 13.41 (10.80) 2.61
Note: The exchange rate use to convert Zar to Rs. 5.864 / (Previous year Zar to Rs. 6.634)484 / EGP (Rs. 8.858 / EGP)

318
MARICO SOUTH AFRICA (PTY) LIMITED
318
STATEMENT OF CASH FLOWSFor the year ended 31 March 2013
As at 31 March As at 31 MarchNote 2013 2012 2013 2012
R R Rs. Crore Rs. Crore
Cash fl ow from operating activities
Cash fl ow from operations 17 9,301,973 4,513,021 5.45 2.99
Finance costs 4 (5,968,487) (5,825,715) (3.50) (3.86)
Finance income 4 220,539 64,088 0.13 0.04
Net cash used in operating activities 3,554,025 (1,248,606) 2.08 (0.83)
Cash fl ow from investing activities
Additions to property, plant and equipment (420,443) (737,585) (0.25) (0.49)
Proceeds on disposal of property, plant and equipment
350,290 1,002,499 0.21 0.67
Net cash used in investing activities (70,153) 264,914 (0.04) 0.18
Cash fl ow from fi nancing activities
(Repayment)/receipt of borrowings (3,776,341) 2,078,267 (2.21) 1.38
Net cash generated from fi nancing activities (3,776,341) 2,078,267 (2.21) 1.38
Net increase in cash and cash equivalents (292,469) 1,094,575 (0.17) 0.73
Cash and cash equivalents at beginning of year 4,766,188 3,671,613 2.79 2.44
Cash and cash equivalents at end of year 10 4,473,719 4,766,188 2.62 3.16
Note: The exchange rate use to convert Zar to Rs. 5.864 / (Previous year Zar to Rs. 6.634)484 / EGP (Rs. 8.858 / EGP)

319319
MARICO SOUTH AFRICA (PTY) LIMITED
NOTES TO THE ANNUAL FINANCIAL STATEMENTSFor the year ended 31 March 2013
1 Accounting policies The principle accounting policies applied in the preparation of these fi nancial statements are set out below. These policies
have been consistently applied to all the years presented, unless otherwise stated.
1.1 Basis of preparation
The fi nancial statements have been prepared in accordance with the International Financial Reporting Standards (IFRS). The fi nancial statements have been prepared under the historical cost convention.
The preparation of the fi nancial statements in conformity with IFRS requires the use of estimates and assumptions that affect the reported amounts of assets and liabilities and disclosure of contingent assets and liabilities at the date of the fi nancial statements and the reported amounts of revenues and expenses during the reporting period based on management’s best knowledge of current events and actions. Actual results may ultimately differ from these estimates. The areas involving a higher degree of judgment or complexity, or areas where assumptions and estimates are signifi cant to the fi nancial statements, are disclosed in note 1.23.
1.2 Property, plant and equipment
All property, plant and equipment are stated at historical cost less accumulated depreciation and impairment losses.
Historical cost includes expenditure that is directly attributable to the acquisition of the items.
Subsequent costs are included in the asset’s carrying amount or recognised as a separate asset, as appropriate, only when it is probable that future economic benefi ts associated with the item will fl ow to the company and the cost of the item can be measured reliably. All other repairs and maintenance are charged to the statement of comprehensive income during the fi nancial period in which they are incurred.
Depreciation is calculated using the straight-line basis so as to write off the cost of the assets to their residual values over their expected useful lives. The expected useful lives are as follows:
Leasehold improvements 10 years
Plant and machinery 5 – 15 years
Motor vehicles 3,33 years
Offi ce equipment 5 years
Furniture and fi ttings 10 years
Computer equipment 5 years
The assets’ residual values and useful lives are reviewed, and adjusted if appropriate, at each statement of fi nancial position date.
An assets’ carrying amount is written down immediately to its recoverable amount if the asset’s carrying amount is greater than its estimated recoverable amount (note 1.5).
Gains and losses on disposals are determined by comparing the proceeds with the carrying amount and are recognised in the statement of comprehensive income.
1.3 Non-current assets held for sale
Non-current assets and disposal groups are classifi ed as held for sale if their carrying amount will be recovered through a sale transaction rather than through continuing use. This condition is regarded as met only when the sale is highly probable and the asset (or disposal group) is available for immediate sale in its present condition.
Management must be committed to the sale, which should be expected to qualify for recognition as a completed sale within one year from the date of classifi cation.

320
MARICO SOUTH AFRICA (PTY) LIMITED
320
NOTES TO THE ANNUAL FINANCIAL STATEMENTSfor the year ended 31 March 2013
Non-current assets held for sale (or disposal group) are measured at the lower of its carrying amount and fair value less costs to sell.
A non-current asset is not depreciated (or amortised) while it is classifi ed as held for sale, or while it is part of a disposal group classifi ed as held for sale.
1.4 Intangible assets
Brands
The useful lives of all intangible assets acquired by the company are assessed to determine if the useful life is fi nite or indefi nite. Useful lives of intangible assets are reviewed at least at the end of each fi nancial period and altered if estimates have changed signifi cantly. Any change is accounted for by changing the amortisation charge for the current and future periods.
Intangibles assets with fi nite useful lives are measured at cost less accumulated amortization and accumulated impairment losses. Amortisation is recognised in profi t or loss on a straight-line basis over the estimate useful lives of intangible assets from the date that they are available for use.
Intangibles assets with indefi nite useful lives are measured at cost and are not amortised, but are tested for impairment at least annually or whenever any indication of impairment exists.
The following intangible assets currently have an indefi nite useful life:
· product registrations; and· brands
Subsequent expenditure
Subsequent expenditure is capitalised only when it increases the future economic benefi ts embodied in the specifi c asset to which it relates. All other expenditure, including expenditure on internally generated goodwill and brands, is recognised in profi t or loss when incurred.
1.5 Impairment of non-fi nancial assets
Assets that have an indefi nite useful life are not subject to amortisation and are tested annually for impairment. Assets that are subject to amortisation are reviewed for impairment whenever events or changes in circumstances indicate that the carrying amount may not be recoverable. An impairment loss is recognised for the amount by which the asset’s carrying amount exceeds its recoverable amount. The recoverable amount is the higher of an asset’s fair value less costs to sell and value in use. For the purposes of assessing impairment, assets are grouped at the lowest levels for which there are separately identifi able cash fl ows (cash-generating units).
1.6 Leased assets
Leases of assets under which all the risks and benefi ts of ownership are effectively retained by the lessor are classifi ed as operating leases. Payments made under operating leases are charged to the statement of comprehensive income on a straight-line basis over the period of the lease. When an operating lease is terminated before the lease period has expired, any payment required to be made to the lessor by ways of a penalty is recognised as an expense in the period in which termination takes place.
1.7 Inventory
Inventories are stated at the lower of cost and selling price less costs to complete and sell. Cost is determined using the weighted average cost method. The cost of fi nished goods and work in progress comprises raw materials, direct labour, other direct costs and related production overheads (based on normal operating capacity). Net realisable value is the estimated selling price in the ordinary course of business, less applicable variable selling expenses.

321321
MARICO SOUTH AFRICA (PTY) LIMITED
NOTES TO THE ANNUAL FINANCIAL STATEMENTSfor the year ended 31 March 2013
1.8 Financial assets
1.8.1 Classifi cation
The company classifi es its fi nancial assets in the following categories: at fair value through profi t or loss and loans and receivables. The classifi cation depends on the purpose for which the fi nancial assets were acquired. Management determines the classifi cation of its fi nancial assets at initial recognition.
(a) Financial assets at fair value through profi t or loss
Financial assets at fair value through profi t or loss are fi nancial assets held for trading. A fi nancial asset is classifi ed in this category if acquired principally for the purpose of selling in the short term. Derivatives are also categorised as held for trading unless they are designated as hedges. Assets in this category are classifi ed as current assets if expected to be settled within 12 months; otherwise, they are classifi ed as non-current.
(b) Loans and receivables
Loans and receivables are non-derivative fi nancial assets with fi xed or determinable payments that are not quoted in an active market. They are included in current assets, except for maturities greater than 12 months after the end of the reporting period. These are classifi ed as non-current assets. The company’s loans and receivables comprise ‘trade and other receivables’ and ‘cash and cash equivalents’ in the statement of fi nancial position (notes 1.10 and 1.11).
1.8.2 Recognition and measurement
Financial assets carried at fair value through profi t or loss are initially recognised at fair value, and transaction costs are expensed in the statement of comprehensive income. Financial assets are derecognised when the rights to receive cash fl ows from the investments have expired or have been transferred and the company has transferred substantially all risks and rewards of ownership. Loans and receivables are subsequently carried at amortised cost using the effective interest method.
Gains or losses arising from changes in the fair value of the ‘fi nancial assets at fair value through profi t or loss’ category are presented in the statement of comprehensive income within operating expenses in the period in which they arise.
1.9 Impairment of fi nancial assets
(a) Assets carried at amortised cost
The company assesses at the end of each reporting period whether there is objective evidence that a fi nancial asset or group of fi nancial assets is impaired. A fi nancial asset or a group of fi nancial assets is impaired and impairment losses are incurred only if there is objective evidence of impairment as a result of one or more events that occurred after the initial recognition of the asset (a ‘loss event’) and that loss event (or events) has an impact on the estimated future cash fl ows of the fi nancial asset or company of fi nancial assets that can be reliably estimated.
Evidence of impairment may include indications that the debtors or a group of debtors is experiencing signifi cant fi nancial diffi culty, default or delinquency in interest or principal payments, the probability that they will enter bankruptcy or other fi nancial reorganisation, and where observable data indicate that there is a measurable decrease in the estimated future cash fl ows, such as changes in arrears or economic conditions that correlate with defaults.
For loans and receivables category, the amount of the loss is measured as the difference between the asset’s carrying amount and the present value of estimated future cash fl ows (excluding future credit losses that have not been incurred) discounted at the fi nancial asset’s original effective interest rate. The carrying amount of the asset is reduced and the amount of the loss is recognised in the statement of comprehensive income. If a loan has a variable interest rate, the discount rate for measuring any impairment loss is the current effective interest rate determined under the contract.
If, in a subsequent period, the amount of the impairment loss decreases and the decrease can be related objectively

322
MARICO SOUTH AFRICA (PTY) LIMITED
322
NOTES TO THE ANNUAL FINANCIAL STATEMENTSfor the year ended 31 March 2013
to an event occurring after the impairment was recognised, the reversal of the previously recognised impairment loss is recognised in the statement of comprehensive income.
1.10 Trade receivables
Trade receivables are measured at amortised cost using the effective interest rate method, less provision for impairment. A provision for impairment of trade receivables is established when there is objective evidence that the group will not be able to collect all amounts due according to the original terms of the receivables. The amount of the provision is the difference between the asset’s carrying amount and the present value of estimated future cash fl ows, discounted at the original effective interest rate. The carrying amount of the asset is reduced through the use of an allowance account, and the amount of the loss is recognised in the statement of comprehensive income within ‘operating expenses’. When a trade receivable is uncollectible, it is written off against the allowance account for trade receivables. Subsequent recoveries of amounts previously written off are credited in the statement of comprehensive income.
1.11 Cash and cash equivalents
Cash and cash equivalents includes cash in hand, deposits held at call with banks, other short-term highly liquid investments with original maturities of three months or less, and bank overdrafts. Bank overdrafts are shown within borrowings in current liabilities on the statement of fi nancial position.
1.12 Current and deferred income tax
The tax expense for the period comprises current and deferred tax. Tax is recognised in the statement of comprehensive income, except to the extent that it relates to items recognised in other comprehensive income or directly in equity. In this case, the tax is also recognised in other comprehensive income or directly in equity, respectively.
The current income tax charge is calculated on the basis of the tax laws enacted or substantively enacted at the statement of fi nancial position date in the countries where the company and its subsidiaries operate and generate taxable income. Management periodically evaluates positions taken in tax returns with respect to situations in which applicable tax regulation is subject to interpretation. It establishes provisions where appropriate on the basis of amounts expected to be paid to the tax authorities.
Deferred income tax is recognised, using the liability method, on temporary differences arising between the tax bases of assets and liabilities and their carrying amounts in the fi nancial statements. However, deferred tax liabilities are not recognised if they arise from the initial recognition of goodwill; deferred income tax is not accounted for if it arises from initial recognition of an asset or liability in a transaction other than a business combination that at the time of the transaction affects neither accounting nor taxable profi t or loss. Deferred income tax is determined using tax rates (and laws) that have been enacted or substantially enacted by the statement of fi nancial position date and are expected to apply when the related deferred income tax asset is realised or the deferred income tax liability is settled.
Deferred income tax assets are recognised only to the extent that it is probable that future taxable profi t will be available against which the temporary differences can be utilised.
Deferred income tax assets and liabilities are offset when there is a legally enforceable right to offset current tax assets against current tax liabilities and when the deferred income tax assets and liabilities relate to income taxes levied by the same taxation authority on either the same taxable entity or different taxable entities where there is an intention to settle the balances on a net basis.
1.13 Trade payables
Trade payables are carried initially at the fair value of the consideration to be paid in future for goods or services that have been received or supplied and invoiced or formally agreed with the supplier, and subsequently measured at amortised cost using the effective interest rate method.
Employee entitlements to annual leave are recognised when they accrue to employees. An accrual is made for the estimated liability for annual leave as a result of services rendered by employees up to the statement of fi nancial position date.

323323
MARICO SOUTH AFRICA (PTY) LIMITED
NOTES TO THE ANNUAL FINANCIAL STATEMENTSfor the year ended 31 March 2013
1.14 Provisions
Provisions are recognised when the company has a present legal or constructive obligation as a result of past events; it is more likely than not that an outfl ow of resources will be required to settle the obligation; and the amount has been reliably estimated. Provisions are not recognised for future operating losses. Where there are a number of similar obligations, the likelihood that an outfl ow will be required in settlement is determined by considering the class of obligations as a whole. A provision is recognised even if the likelihood of an outfl ow with respect to any one item included in the same class of obligations may be small.
Provisions are measured at the present value of the expenditures expected to be required to settle the obligation using a pre-tax rate that refl ects current market assessments of the time value of money and the risks specifi c to the obligation. The increase in the provision due to passage of time is recognised as interest expense.
1.15 Share-based payment
The company operates share-based compensation under which the company receives services from employees as consideration for equity based instruments (options and rights) of Marico Limited. The fair value of the employees’ services received in exchange for the grant of the options or rights is recognised as an expense.
The fair value is determined at each statement of fi nancial position date and is expensed on a straight-line basis over the vesting period with a corresponding increase in the liability and is based on the company’s estimate of options that will eventually vest. Non-market vesting conditions are included in assumptions about the number of options and rights that are expected to vest.
At each statement of fi nancial position date, the company assesses its estimates of the number of options or rights that are expected to vest. The company recognises the impact on the original estimates, if any, in the statement of comprehensive income with a corresponding adjustment to the share option liability as appropriate.
The cash settled share-based payment, on maturity, will be computed in Indian Rupee and will be converted at the prevalent exchange rate and paid to senior management in the currency of the location of senior management.
1.16 Financial risk management
(1) Financial risk factors
The company’s activities expose it to a variety of fi nancial risks, including the effects of changes in interest rates and foreign currency exchange rates. The company’s overall risk management programme focuses on the unpredictability of fi nancial markets and seeks to minimise potential adverse effects on the fi nancial performance of the group. The company does not use derivative fi nancial instruments, such as interest rate swaps and forward exchange contracts, to hedge certain exposures.
(a) Foreign exchange risk
The company is occasionally exposed to foreign exchange risk arising from currency exposures, primarily with respect to the US Dollar. The company does not use forward contracts to hedge their exposure to foreign currency risk in connection with the measurement currency.
No foreign currency denominated balances were outstanding or receivable at year-end.
(b) Interest rate risk
The company’s investments in fi xed-rate debt securities and its fi xed-rate borrowings are exposed to a risk of change in their fair value due to changes in interest rates. The company’s investments in variable-rate debt securities and its variable-rate borrowings are exposed to a risk of change in cash fl ows due to changes in interest rates. Investments in equity securities and short-term receivables and payables are not exposed to interest rate risk.
The company adopts a policy of regularly reviewing interest rate exposure, and maintains fl oating rate borrowings.

324
MARICO SOUTH AFRICA (PTY) LIMITED
324
Interest rate sensitivity
The sensitivity analysis below has been determined based on the exposure to interest rates at the statement of fi nancial position date and the stipulated change taking place at the beginning of the fi nancial period and held constant in the case of variable rate borrowings. A 50 basis point increase or decrease has been used, as this represents management’s assessment of the possible change in interest rates.
If interest rates has been 50 basis points higher/lower and all other variables held constant, the company’s profi t after tax would decrease by:
2013 2012 2013 2012
R R Rs. Crore Rs. CroreEffect on profi t after tax 265,823 276,621 0.16 0.18
1.16 Financial risk management (continued)
(c) Credit risk
Management has a credit risk policy in place and the exposure to credit risk is monitored on an ongoing basis. Credit evaluations are performed on all customers requiring credit over a certain amount. Trade receivables comprise a wide customer base.
At period end there were no signifi cant concentrations of credit risk. The maximum exposure to credit risk is represented by the carrying amount of each fi nancial asset in the statement of fi nancial position, grossed up for any allowances for losses.
(d) Liquidity risk
Prudent liquidity risk management implies maintaining suffi cient cash resources and ensuring the availability of funding through an adequate amount of credit facilities. The company aims to maintain fl exibility by monitoring cash fl ow forecast, good working capital management and ensuring adequate borrowing facilities are maintained.
The following table details the company and company’s remaining contractual maturity of its non-derivative fi nancial liabilities.
Average interest rate
Within 1 period
Greater than 2 periods
Total Within 1 period
Greater than 2 periods
Total
R R R Rs. Crore Rs. Crore Rs. Crore
2013
Trade and other payables 24,175,094 – 24,175,094 14.18 – 14.18
Interest bearing shareholder loan 8,15% 20,528,070 53,876,041 74,404,111 12.04 31.59 43.63
44,703,164 53,876,041 98,579,205 26.21 31.59 57.812012Trade and other payables 19,219,256 – 19,219,256 12.75 – 12.75
Interest bearing shareholder loan 8,26% 22,492,444 55,688,008 78,180,452 14.92 36.94 51.86
41,711,700 55,688,008 97,399,708 27.67 36.94 64.61
Capital risk management
The company’s objectives when managing capital are to safeguard the company’s ability to continue as a going concern in order to provide returns for shareholders, benefi ts for other stakeholders and to maintain an optimal capital structure to reduce the cost of capital.
NOTES TO THE ANNUAL FINANCIAL STATEMENTSfor the year ended 31 March 2013

325325
MARICO SOUTH AFRICA (PTY) LIMITED
NOTES TO THE ANNUAL FINANCIAL STATEMENTSfor the year ended 31 March 2013
In order to maintain or adjust the capital structure, the company may adjust the amount of dividends paid to shareholders, return capital to shareholders, issue new shares or sell assets to reduce debt.
1.17 Share capital
Ordinary shares are classifi ed as equity.
Incremental costs directly attributable to the issue of new shares or options are shown in equity as a deduction, net of tax, from the proceeds. The difference between the proceeds received and the par value of ordinary shares issued are shown within equity as share premium.
1.18 Revenue recognition
Revenue comprises the fair value of the consideration received or receivable for the sale of goods and services in the ordinary course of the company’s activities. Revenue is shown net of value-added tax, estimated returns, rebates and discounts. Revenue is recognised as follows:
(a) Sales of goods
Sales of goods are recognised when the company has delivered products to the customer, the customer has accepted the products and collectability of the related receivables is reasonably assured. It is the company’s policy to sell its products to the end customer with a right of return. Accumulated experience is used to estimate and provide for such returns at the time of sale.
(b) Interest income
Interest income is recognised on a time-proportion basis using the effective interest rate method.
1.19 Research and development costs
Research and development costs are recognised as an expense to the extent that such expenditure are not expected to have future benefi ts.
1.20 Employee benefi ts
The company operates two retirement benefi t schemes. These are both defi ned contribution funds. A defi ned contribution fund is a retirement benefi t plan under which the company pays fi xed contributions into a separate entity. The company has no legal or constructive obligations to pay further contributions if the fund does not hold suffi cient assets to pay all employees the benefi ts relating to employee service in the current and prior periods.
The company pays contributions on a contractual basis and contributions are recognised as an expense when they are due.
1.21 Borrowings
Borrowings are recognised initially at fair value, net of transaction costs incurred. Borrowings are subsequently stated at amortised cost. Any difference between the proceeds (net of transaction costs) and the redemption value is recognised in the statement of comprehensive income over the period of the borrowings using the effective interest rate method.
Borrowings are classifi ed as current liabilities unless the company has an unconditional right to defer settlement of the liability for at least 12 months after the statement of fi nancial position date.
1.22 Changes in accounting policy and disclosures
Standards and interpretations effective and adopted in the current year
The company has adopted all of the new and revised Standards and Interpretations issued by the International Accounting Standards Board (the IASB) and the International Financial Reporting Interpretations Committee (IFRIC) for the IASB that are relevant to its operations.

326
MARICO SOUTH AFRICA (PTY) LIMITED
326
NOTES TO THE ANNUAL FINANCIAL STATEMENTSfor the year ended 31 March 2013
Standards and interpretations not yet effective
The company has chosen not to early adopt the following standards and interpretations, which have been published and are mandatory for the company’s accounting periods beginning on or after 1 July 2013 or later periods:
Standard/ Interpretation: Effective date:
Disclosures – Offsetting Financial Assets and
Financial Liabilities (Amendments to IFRS 7) 1-Jan-13
Offsetting Financial Assets and Financial Liabilities
(Amendments to IAS 32) 1-Jan-14
IAS 1 Annual Improvements for 2009 – 2011 cycle 1-Jan-13
IAS 16 Annual Improvements for 2009 – 2011 cycle 1-Jan-13
IAS 32 Annual Improvements for 2009 – 2011 cycle 1-Jan-13
Standards and interpretations not yet effective or relevant
The following standards and interpretations have been published and are mandatory for the company’s accounting periods beginning on or after 1 January 2013 or later periods but are not relevant to its operations:
Standard/ Interpretation: Effective date:
IAS 27 (AC 132) Separate Financial Statements 1-Jan-13
IFRS 11 (AC148) Joint Arrangements 1-Jan-13
IFRS 12 (AC 149) Disclosure of Interests in Other Entities 1-Jan-13
IFRS 13 (AC 150) Fair Value Measurement 1-Jan-13
IAS 1 (AC101) Presentation of Financial Statements 1-Jul-12
IAS 19 (AC 116) Employee Benefi ts Revised 1-Jan-13
Government Loans (Amendment to IFRS 1) 1-Jan-13
IFRS 1 Annual Improvements for 2009 – 2011 cycle 1-Jan-13
IAS 34 Annual Improvements for 2009 – 2011 cycle 1-Jan-13
Consolidated Financial Statements, Joint
Arrangements and Disclosures of Interests in Other
Entities: Transition Guidance. 1-Jan-13
IFRIC 20 Stripping Costs in the Production Phase of a Surface Mine. 1-Jan-13
The company is in the process of evaluating the effects of these new standards and interpretations
1.23 Critical accounting estimates and judgements
Estimates and judgments are continually evaluated and are based on historical and other factors, including expectations of future events that are believed to be reasonable under the circumstances.
1.23.1Critical accounting estimates and assumptions
The company makes estimates and assumptions concerning the future. The resulting accounting estimates will, by defi nition, rarely equal the related actual results. The estimates and assumptions that have a signifi cant risk of causing a material adjustment to the carrying amounts of assets and liabilities within the next fi nancial year are outlined below.
(a) Estimated impairment of intangible assets The company tests annually whether intangible assets have suffered any impairment, in accordance with the accounting policy stated in note

327327
MARICO SOUTH AFRICA (PTY) LIMITED
NOTES TO THE ANNUAL FINANCIAL STATEMENTSfor the year ended 31 March 2013
2. Operating profi t
2.1 The following items have been charged/(credited) in arriving at operating profi t :
For the year ended March 31,
2013R
2012R
2013Rs. Crore
2012Rs. Crore
Depreciation on property, plant and equipment 1,085,166 1,114,763 0.64 0.74
(A detailed breakdown of the depreciation expense is presented in note 6)Profi t on disposal of property, plant and equipment
(205,901) (79,640) (0.12) (0.05)Impairment of intangible assets 69,605 – 0.04 –
Auditor’s remuneration: – 367,565 – 0.24
Audit fees
- current year provision 379,800 360,000 0.22 0.24
- prior year underprovision – 293,541 – 0.19
379,800 653,541 0.22 0.43
Lease rentals
- Buildings 4,077,092 3,411,440 2.39 2.26
- Computers 306,888 355,943 0.18 0.24
4,383,980 3,767,383 2.57 2.50
Directors’ emoluments (refer note 18)
Salaries 1,571,876 1,462,689 0.92 0.97
Other 943,702 1,126,635 0.55 0.75
2,515,578 2,589,324 1.48 1.72
Staff costs (see note 3) 20,659,101 18,799,707 12.11 12.47
2.2 Expenses by nature
2013R
2012R
2013Rs. Crore
2012Rs. Crore
Depreciation 1,085,166 1,114,763 0.64 0.74
Directors’ emoluments 2,515,578 2,589,324 1.48 1.72
Operating lease rentals 4,383,980 3,767,383 2.57 2.50
Staff costs 20,659,101 18,799,707 12.11 12.47
Cost of sales 94,329,358 86,643,985 55.31 57.48
Commission 5,204,770 4,855,264 3.05 3.22
Advertising 13,540,050 12,199,723 7.94 8.09
Freight 8,478,970 9,066,861 4.97 6.01
Other 8,146,631 7,872,219 4.78 5.22
Total cost of sales and operating expenses 158,343,604 146,909,229 92.85 97.46

328
MARICO SOUTH AFRICA (PTY) LIMITED
328
NOTES TO THE FINANCIAL STATEMENTSfor the year ended 31 March 2013
3 Staff costs
For the year ended March 31,
2013R
2012R
2013Rs. Crore
2012Rs. Crore
Salaries and wages 17,424,905 15,433,476 10.22 10.24
Other 3,234,196 3,366,231 1.90 2.23
20,659,101 18,799,707 12.11 12.47
Average number of persons employed:
- Full time 114 117
4 Finance (costs)/income
2013R
2012R
2013Rs. Crore
2012Rs. Crore
Finance income – Bank 220,539 64,088 0.13 0.04
Finance costs
Related party (refer note 18) (5,968,487) (5,825,715) (3.50) (3.86)
Net fi nance costs (5,747,948) (5,761,627) (3.37) (3.82)
5 Income tax expense
2013R
2012R
2013Rs. Crore
2012Rs. Crore
Deferred tax
- current year (39,547) 296,509 (0.02) 0.20
- prior year underprovision 470,140 319,137 0.28 0.21
430,593 615,646 0.25 0.41
The tax on the company profi t before tax differs from the theoretical amount that would arise using basic rates as follows:
2013R
2012R
2013Rs. Crore
2012Rs. Crore
Profi t before tax 171,818 1,830,453 0.10 1.21
Tax calculated at a rate of 28% 48,109 512,527 0.03 0.34
Deferred tax – prior year underprovision 470,140 319,137 0.28 0.21
Prior year unutilised capital assessed loss (56,797) – (0.03) –
Permanent differences (30,859) (216,018) (0.02) (0.14)
Tax charge 430,593 615,646 0.25 0.41
No provision has been made for current taxation as the company has a computed/estimated assessed loss of R 13,937,601 (2012: R15,144,432 (Rs. 8.88 Crore). The company recognises deferred tax assets to the extent that future taxable profi ts will be available against which the unused tax losses and deductible temporary differences can be utilised.
Management has assessed recoverability of the deferred tax asset based on company budgets and forecasted earnings and the assessed loss is considered recoverable against future taxable profi ts. 6 Property, plant and equipment (conti

329329
MARICO SOUTH AFRICA (PTY) LIMITED
NOTES TO THE FINANCIAL STATEMENTSfor the year ended 31 March 2013
6 Property, plant and equipment
Leasehold improvements
Plant and machinery
Motor vehicles
Offi ce furniture
and computer
equipment
Capital work-in-
progress
Total
R R R R R R
Year ended 31 March 2013
Opening net carrying amount 1,379,641 1,723,594 87,435 489,175 66,450 3,746,295
Additions 121,385 135,152 – 163,906 420,443
Transfer – 66,450 – – (66,450) –
Depreciation (286,521) (436,836) (36,278) (325,531) – (1,085,166)
Disposals – (108,963) – (35,426) – (144,389)
Transfer to non-current assets held for sale
– (1,077,786) – – – (1,077,786)
Closing net carrying amount 1,214,505 301,611 51,157 292,124 – 1,859,397
Cost 2,972,425 2,937,394 279,664 1,820,796 – 8,010,279
Accumulated depreciation and impairment
(1,757,920) (2,635,783) (228,507) (1,528,672) – (6,150,882)
Closing net carrying amount 1,214,505 301,611 51,157 292,124 – 1,859,397
Leasehold improvements
Plant and machinery
Motor vehicles
Offi ce furniture
and computer
equipment
Capital work-in-
progress
Total
Rs. Crore Rs. Crore Rs. Crore Rs. Crore Rs. Crore Rs. Crore
Year ended 31 March 2013Opening net carrying amount 0.81 1.01 0.05 0.29 0.04 2.20
Additions 0.07 0.08 – 0.10 – 0.25
Transfer – 0.04 – – (0.04) –
Depreciation (0.17) (0.26) (0.02) (0.19) – (0.64)
Disposals – (0.06) – (0.02) – (0.08)
Transfer to non-current assets held for sale
– (0.63) – – – (0.63)
Closing net carrying amount 0.71 0.18 0.03 0.17 0.00 1.09
Cost 1.74 1.72 0.16 1.07 – 4.70
Accumulated depreciation and impairment
(1.03) (1.55) (0.13) (0.90) – (3.61)
Closing net carrying amount 0.71 0.18 0.03 0.17 – 1.09

330
MARICO SOUTH AFRICA (PTY) LIMITED
330
6 Property, plant and equipment (Continued)
Leasehold improvements
Plant and machinery
Motor vehicles
Offi ce furniture
and computer
equipment
Capital work-in-
progress
Total
R R R R R R
Year ended 31 March 2012
Opening net carrying amount 1,664,804 1,818,430 25,232 637,867 – 4,146,333
Additions – 369,476 108,333 193,326 66,450 737,585
Depreciation (285,163) (464,312) (46,130) (319,158) – (1,114,763)
Disposals – – – (22,860) – (22,860)
Closing net carrying amount 1,379,641 1,723,594 87,435 489,175 66,450 3,746,295
Cost 2,851,041 5,334,704 325,382 1,781,763 66,450 10,359,340
Accumulated depreciation and impairment
(1,471,400) (3,611,110) (237,947) (1,292,588) – (6,613,045)
Closing net carrying amount 1,379,641 1,723,594 87,435 489,175 66,450 3,746,295
Leasehold improvements
Plant and machinery
Motor vehicles
Offi ce furniture
and computer
equipment
Capital work-in-
progress
Total
Rs. Crore Rs. Crore Rs. Crore Rs. Crore Rs. Crore Rs. Crore
Year ended 31 March 2012
Opening net carrying amount 1.10 1.21 0.02 0.42 – 2.75
Additions – 0.25 0.07 0.13 0.04 0.49
Depreciation (0.19) (0.31) (0.03) (0.21) – (0.74)
Disposals – – – (0.02) – (0.02)
Closing net carrying amount 0.92 1.14 0.06 0.32 0.04 2.49
Cost 1.89 3.54 0.22 1.18 0.04 6.87
Accumulated depreciation and impairment
(0.98) (2.40) (0.16) (0.86) – (4.39)
Closing net carrying amount 0.92 1.14 0.06 0.32 0.04 2.49
NOTES TO THE FINANCIAL STATEMENTSfor the year ended 31 March 2013

331331
MARICO SOUTH AFRICA (PTY) LIMITED
NOTES TO THE FINANCIAL STATEMENTSfor the year ended 31 March 2013
7 Intangible assets
2013R
2012R
2013Rs. Crore
2012Rs. Crore
Year ended 31 March 2013Opening carrying amount 48,062,924 48,062,924 28.18 28.18
Impairment (69,605) (69,605) (0.04) (0.04)
Closing carrying amount 47,993,319 47,993,319 28.14 28.14
Cost 50,062,924 50,062,924 29.36 29.36
Accumulated impairment (2,069,605) (2,069,605) (1.21) (1.21)
Closing carrying amount 47,993,319 47,993,319 28.14 28.14
Year ended 31 March 2012Opening carrying amount 49,330,489 49,330,489 32.73 32.73
Additions (1,267,565) (1,267,565) (0.84) (0.84)
Closing carrying amount 48,062,924 48,062,924 31.88 31.88
Cost 50,062,924 50,062,924 33.21 33.21
Accumulated amortisation (2,000,000) (2,000,000) (1.33) (1.33)
Closing carrying amount 48,062,924 48,062,924 31.88 31.88
The company has classifi ed its intangible assets as having indefi nite useful lives. This conclusion is supported by the fact that the company is expected to be able to use the brands for the foreseeable future and that the typical product life cycles for the brands, acquired from public information on estimates of useful lives, indicate that the intangible asset has an indefi nite period of foreseeable usage. This is further supported by the stability and the strong demand in markets within which these products are marketed and sold.
Detailed impairment testing is performed for the indefi nite-life intangible assets annually. The impairment review process is as follows:
Each period and whenever impairment indicators are present, management calculate the fair value of the asset and record an impairment loss for the excess of the carrying value over the fair value, if any.
The fair value is generally measured as the net present value of projected cash fl ows. In addition, a re-evaluation of the remaining useful life of the asset is performed to determine whether continuing to characterise the asset as having an indefi nite life is appropriate.
The recoverable amounts have been determined based on a value-in-use calculation. The calculation uses a free cash fl ow model that discounts the free cash fl ow available from profi t after tax generated by the intangible asset. If the resulting net present value exceeds the carrying value of the intangible asset, the intangible asset is not impaired. However, if the resulting net present value is less than the carrying value an impairment charge is raised. The key assumptions used for the value-in-use calculations are as follows:
2013 2012Growth rate *1 2.50% 5.70%
Discount rate *2 10.60% 8%
*1 Weighted average growth rate used to extrapolate cash fl ows beyond the budget period. *2 Post-tax discount rate applied to the cash fl ow projections.

332
MARICO SOUTH AFRICA (PTY) LIMITED
332
NOTES TO THE FINANCIAL STATEMENTSfor the year ended 31 March 2013
8 Inventories
2013R
2012R
2013Rs. Crore
2012Rs. Crore
Raw materials 8,208,091 7,174,683 4.81 4.76
Work in progress 468,113 503,445 0.27 0.33
Finished goods 8,951,781 9,913,076 5.25 6.58
17,627,985 17,591,204 10.34 11.67
Amount included in inventory balance as write down to net realisable value
(2,122,337) (1,260,058) (1.24) (0.84)
The cost of inventories recognised as an expense and included in cost of sales amounted to R 94,329,358 (Rs. 55.31 Crore) (2012: R 86,643,985 (Rs. 57.48 Crore)).
9 Trade and other receivables
2013R
2012R
2013Rs. Crore
2012Rs. Crore
Trade receivables 27,381,600 22,704,651 16.06 15.06
Provision for doubtful debts (6,057) (14,967) 0.01 (0.01)
Net trade receivables 27,375,543 22,689,684 16.06 15.05
Other receivables 328,475 419,748 0.19 0.28
27,704,018 23,109,432 16.26 15.33
The company grants credit of 30 days to its customers. The analysis of trade receivables which are past due and not impaired at year end is as follows:
2013R
2012R
2013Rs. Crore
2012Rs. Crore
Past due by 30 days 12,905,530 9,730,463 7.57 6.46
Past due by 60 days 4,154,420 2,984,244 2.44 1.98
Past due by 90 days 1,243,742 1,494,603 0.73 0.99
Other receivables 18,303,692 14,209,310 10.73 9.43
The carrying value of the trade and other receivables approximates their fair value.
10 Cash and cash equivalents
For the purpose of the statement of cash fl ows, the year end cash and cash equivalents comprise the following:
2013R
2012R
2013Rs. Crore
2012Rs. Crore
Bank balances 4,473,719 4,766,188 2.62 3.16
Credit quality of cash at bank: BBB+

333333
MARICO SOUTH AFRICA (PTY) LIMITED
NOTES TO THE FINANCIAL STATEMENTSfor the year ended 31 March 2013
11 Non-current assets held for sale
The non-current assets held for sale relate to plant and machinery that is being sold to Sikuniko Impilo Proprietary Limited, effective as of 2 May 2013.
The purchase consideration is in excess of the carrying amount of the non-current assets held for sale, therefore no impairment is considered necessary.
2013R
2012R
2013Rs. Crore
2012Rs. Crore
Plant and machinery 1,077,786 – 0.63 –
12 Share capital and share premium
2013R
2012R
2013Rs. Crore
2012Rs. Crore
Authorised600,000 Ordinary shares of R1 each 6,000 6,000 0.01 0.01
Issued500,000 Ordinary shares of R1 each 5,000 5,000 0.01 0.01
Share premium 22,863,735 22,863,735 13.41 15.17
13 Deferred income tax assets
Deferred income taxes are calculated on all temporary differences under the liability method using a principal tax rate of 28% (2011: 28%).
The movement on the deferred income tax asset account is as follows:
2013R
2012R
2013Rs. Crore
2012Rs. Crore
At beginning of year 7,077,135 7,692,781 4.15 5.10Current year 39,547 (296,509) 0.02 (0.20)Prior year underprovision (470,140) (319,137) (0.28) (0.21)At end of year 6,646,542 7,077,135 3.90 4.69
Deferred tax assets may be analysed as follows:
Property, plant and equipment (83,190) (64,584) (0.05) (0.04)Other provisions 2,449,744 3,051,896 1.44 2.02Tax losses carried forward 4,279,988 4,089,823 2.51 2.71
6,646,542 7,077,135 3.90 4.69
14 Trade and other payables
2013R
2012R
2013Rs. Crore
2012Rs. Crore
Trade payables 20,077,269 16,540,204 11.77 10.97
Amount due to related party (refer note 18) 341,184 158,242 0.20 0.10
Accruals 2,220,323 1,899,305 1.30 1.26
Audit fee provision 389,800 366,080 0.23 0.24
Bonus provision 1,829,765 1,834,833 1.07 1.22Leave pay provision 786,579 672,118 0.46 0.45
Other payables 2,158,634 255,425 1.27 0.17
27,803,554 21,726,207 16.30 14.41

334
MARICO SOUTH AFRICA (PTY) LIMITED
334
15 Borrowings
2013R
2012R
2013Rs. Crore
2012Rs. Crore
Related party (refer note 18)
- Non-current portion 53,876,041 55,688,008 31.59 36.94
- Current portion 20,528,070 22,492,444 12.04 14.92
74,404,111 78,180,452 43.63 51.86
The loan is unsecured. The non-current portion of the loan is repayable in four years and bears interest at the 6 month
London Interbank Offered Rate plus 7%. The current portion of the loan is repayable within 12 months and bears interest
at a rate of 8,5% (2012: 9%).
2013R
2012R
2013Rs. Crore
2012Rs. Crore
Maturity Borrowing
Due within 1 year 20,528,070 22,492,444 12.04 14.92
Due within 2 – 5 years 53,876,041 55,688,008 31.59 36.94
74,404,111 78,180,452 43.63 51.86
16 Share-based payments
Marico Limited granted senior management of Marico South Africa Proprietary Limited a STAR grant bonus in respect of
the share appreciation rights scheme.
The liability in respect of the share appreciation rights scheme is to be settled by Marico South Africa Proprietary Limited.
The value is determined by the market price of Marico Limited equity shares and no minimum guarantee amount is
provided.
The STAR grant value on maturity will be computed in INR and will be converted at the prevalent exchange rate as
decided by Marico Group Corporate Finance Function, and paid to senior management in the currency of location of
senior management.
Award price Indian Rupee (INR)
Date Rights Awarded Rights Awarded Vesting Date Rights Exercisable at 31 March 2013
129 28-Mar-11 75,500 30-Sep-13 –
149 01-Dec-11 25,500 30-Nov-14 –
The share price at 31 March 2013 used to compute the share option liability in INR 213. No options were exercised or forfeited during the year.
2013 2012 2013 2012
R R Rs. Crore Rs. CroreCurrent portion 863,125 – 0.51 –
Non-current portion 124,232 – 0.07 –
987,357 – 0.58 –
NOTES TO THE FINANCIAL STATEMENTSfor the year ended 31 March 2013

335335
MARICO SOUTH AFRICA (PTY) LIMITED
17 Cash fl ow from operating activities
2013R
2012R
2013Rs. Crore
2012Rs. Crore
Operating profi t 5,919,766 7,592,080 3.47 5.04
Adjusted for:
Non-cash items
Depreciation 1,085,166 1,114,763 0.64 0.74
Impairment of intangible asset 69,605 – 0.04 –
Share-based payment expense 987,357 – 0.58 –
Profi t on disposal of property, plant and equipment (205,901) (79,640) (0.12) (0.05)
Loss on disposal of intangible asset – 367,565 – 0.24
Operating profi t before working capital changes:
Decrease/ (increase) in trade and other receivables (4,594,586) 1,629,828 (2.69) 1.08
Decrease/ (increase) in inventories (36,781) 512,375 (0.02) 0.34
(Decrease)/ increase in trade and other payables 6,077,347 (6,623,950) 3.56 (4.39)
9,301,973 4,513,021 5.45 2.99
18 Related party transactions
Transactions with related parties:
The following transactions were carried out by the company with related parties:
Finance costs (refer note 4.2):
2013R
2012R
2013Rs. Crore
2012Rs. Crore
Marico South Africa Consumer Care Proprietary Limited 5,968,487 5,825,715 3.50 3.86
Directors’ emoluments (refer note 2) 2,515,578 2,589,324 1.48 1.72
Technical support
-Marico Limited 341,184 158,242 0.20 0.10
Amounts due to related parties
Amounts due to holding company (refer note 15):
2013R
2012R
2013Rs. Crore
2012Rs. Crore
Marico South Africa Consumer Care Proprietary Limited 74,404,111 78,180,452 43.63 51.86
Included in trade payables (refer note14):
MaricoLimited 341,184 158,242 0.20 0.10
NOTES TO THE FINANCIAL STATEMENTSfor the year ended 31 March 2013

336
MARICO SOUTH AFRICA (PTY) LIMITED
336
19 Commitments
Operating lease commitments
The future minimum lease payments payable under non-cancellable operating leases are as follows:
2013R
2012R
2013Rs. Crore
2012Rs. Crore
- Within 1 year 1,699,379 1,769,054 1.00 1.17
- Between 2 and 5 years 3,710,674 5,971,197 2.18 3.96
- Over 5 years – – – –
5,410,053 7,740,251 3.17 5.13
20 Financial risk management
The company’s fi nancial instruments consist primarily of deposits with banks, trade accounts receivable and payable and loans to and from the holding company. Financial instruments are carried at fair value or amounts that approximate fair value.
2013R
2012R
2013Rs. Crore
2012Rs. Crore
Financial assets
Loans and receivables:
Assets as per the statement of fi nancial position
Trade and other receivables 27,704,018 23,109,432 16.25 15.33
Cash and cash equivalents 4,473,719 4,766,188 2.62 3.16
32,177,737 27,875,620 18.87 18.49Financial liabilities
Financial liabilities at amortised cost:
Liabilities as per the statement of fi nancial position
Interest bearing liabilities 74,404,111 78,180,452 43.63 51.86
Trade and other payables 24,175,094 19,219,256 14.18 12.75
98,579,205 97,399,708 57.81 64.61
NOTES TO THE FINANCIAL STATEMENTSfor the year ended 31 March 2013

337
M A R I C O M A L AY S I A S D N . B H D.
Board of Directors Chin Chee Kee, JP
Poh Shiow Mei
Harshraj Charandas Mariwala
Vijay Subramaniam
Registered Offi ce Ground Floor, Lot 7, Block F, Saguking Commercial Building, Jalan Patau 87000, Labuan F.T. Malaysia
Auditors Sundar & Associates
Bankers HSBC Bank Malaysia Berhad Public Bank

338
M A R I C O M A L AY S I A S D N . B H D.
DIRECTORS’ REPORT
The directors have pleasure in submitting their report and the audited fi nancial statements for the fi nancial year ended 31 March 2013.
Principal activities
The principal activity of the Company is as distributor of perfumery, cosmetics, toiletries and related beauty products. There has been no signifi cant change in the nature of this activity during the year.
Financial results
RM
Loss after taxation 3,119,266/-
Reserves and provisions
There were no material transfers to or from reserves or provisions during the fi nancial year.
Issue of shares and debentures
The Company has not issued any shares or debentures during the fi nancial year.
Directorate
The directors in offi ce since the date of last report are:-
DATUK CHIN CHEE KEE, JP
HARSHRAJ CHARANDAS MARIWALA
POH SHIOW MEI (F)
VIJAY SUBRAMANIAN
Particulars of interest in shares of the Company by the directors who held offi ce at the end of the fi nancial year is as follows:
Ordinary shares of RM 1/- each
As at As at 01/04/2012 Bought Sold 31/03/2013
Company – – – –
DATUK CHIN CHEE KEE, JP – – – –
HARSHRAJ CHARANDAS MARIWALA – – – –
POH SHIOW MEI (F) – – – –
VIJAY SUBRAMANIAN – – – –
Ordinary shares of INR 1/- each
As at Bought Sold As at 01-04-2012 31-03-2013
Marico Limited
HARSHRAJ CHARANDAS MARIWALA 23,254,600 – – 23,254,600
The Director retiring by rotation is Poh Shiow Mei (f) who being eligible, offer herself for re-election.
Directors’ benefi ts
Neither at the end of the fi nancial year, nor at any time during the year, did there subsist any arrangement to which the Company was a party whereby the directors might acquire benefi ts by means of the acquisition of shares in, or debentures of the Company or any other body corporate.
Since the end of the previous fi nancial period, no director has received or become entitled to receive a benefi t by reason of

339
M A R I C O M A L AY S I A S D N . B H D.
a contract made by the Company or a related corporation with the director or with a fi rm of which he is a member, or with a Company in which he has a substantial fi nancial interest.
Other statutory information
(a) Before the income statement and balance sheet were made out, the directors took reasonable steps :-
(i) to ascertain that action had been taken in relation to the writing off of bad debts and the making of provision for doubtful debts and satisfi ed themselves that there were no known bad debts and that no provision for doubtful debts was necessary; and
(ii) to ensure that any current assets which were unlikely to be realised in the ordinary course of business including their value as shown in the accounting records of the Company have been written down to an amount which they might be expected so to realise.
(b) At the date of this report, the directors are not aware of any circumstances:
(i) which would render it necessary to write off any bad debts or to make any provisions for doubtful debts in respect of the fi nancial statements of the Company; and
(ii) which would render the values attributed to current assets in the fi nancial statements of the Company misleading, or
(iii) which have arisen which render adherence to the existing method of valuation of assets or liabilities of the Company misleading or inappropriate.
(c) At the date of this report, there does not exist:
(i) any charge on the assets of the Company which has arisen since the end of the fi nancial year which secures the liabilities of any other person.
(ii) any contingent liability of the Company which has arisen since the end of the fi nancial year.
(d) No contingent or other liability has become enforceable or is likely to become enforceable within the period of twelve months after the end of the fi nancial year which, in the opinion of the directors, will or may substantially affect the ability of the Company to meet its obligations as and when they fall due.
(e) At the date of this report, the directors are not aware of any circumstances not otherwise dealt with in this report or the fi nancial statements which would render any amount stated in the fi nancial statements misleading.
(f) In the opinion of the directors,
(i) the results of the Company’s operations during the fi nancial year were not substantially affected by any item, transaction or event of a material and unusual nature;
(ii) there has not arisen in the interval between the end of the fi nancial year and the date of this report any item, transaction or event of a material and unusual nature likely to affect substantially the results of the operations of the Company for the current fi nancial year.
Ultimate holding company
The directors regard Marico Limited, a company incorporated in India, as the ultimate holding company of the Company.
Auditors
Messrs. Sundar & Associates have indicated their willingness to continue in offi ce.
Signed on behalf of the Board of Directors in accordancewith a resolution of the Directors dated 15 April 2013
DATUK CHIN CHEE KEE, JP POH SHIOW MEI (F)
Director DirectorFederal Territory of Labuan
DIRECTORS’ REPORT (contd.)

340
M A R I C O M A L AY S I A S D N . B H D.
STATEMENT BY DIRECTORSPURSUANT TO SECTION 169 (15) OF THE COMPANIES ACT, 1965
We, Datuk Chin Chee Kee, JP and Poh Shiow Mei (F), being two of the directors of MARICO MALAYSIA SDN BHD., do hereby state that, in the opinion of the directors, the accompanying balance sheet and statements of income, cash fl ows and changes in equity are drawn up in accordance with MASB approved accounting standards for private entities and the provisions of the Companies Act, 1965 so as to give a true and fair view of the state of affairs of the Company as at 31 March 2013 and of the results and the cash fl ows of the Company for the year then ended.
Signed on behalf of the Board of Directors in accordancewith a resolution of the Directors dated 15 April 2013
DATUK CHIN CHEE KEE, JP POH SHIOW MEI (F)
Director DirectorFederal Territory of Labuan
STATUTORY DECLARATIONI, Poh Shiow Mei (F), being the director primarily responsible for the accounting records and fi nancial management of MARICO MALAYSIA SDN BHD., do solemnly and sincerely declare that the accompanying balance sheet and statements of income, cash fl ows and changes in equity are to the best of my knowledge and belief correct and I make this solemn declaration conscientiously believing the same to be true, and by virtue of the provisions of the Statutory Declarations Act, 1960.
Subscribed and solemnly declared by POH SHIOW MEI (F)the abovenamed at Federal Territory Before me, of Labuan this

341
M A R I C O M A L AY S I A S D N . B H D.
To the Members of
MARICO MALAYSIA SDN. BHD. (881499-V)
Report on the Financial Statements
We have audited the fi nancial statements of MARICO MALAYSIA SDN. BHD. which comprise the balance sheet as at 31 March 2013, and the income statement, statements of changes in equity and cash fl ow statements for the year then ended, and a summary of signifi cant accounting policies and other explanatory information, as set out on pages 8 to 21.
Directors’ Responsibility for the Financial Statements
The directors of the Company are responsible for the preparation of fi nancial statements that give a true and fair view in accordance with Private Entities Reporting Standards and the Companies Act 1965 in Malaysia, and for such internal control as the directors determine are necessary to enable the preparation of fi nancial statements that are free from material misstatement, whether due to fraud or error.
Auditors’ Responsibility
Our responsibility is to express an opinion on these fi nancial statements based on our audit. We conducted our audit in accordance with approved standards on auditing in Malaysia. Those standards require that we comply with ethical requirements and plan and perform the audit to obtain reasonable assurance about whether the fi nancial statements are free from material misstatement.
An audit involves performing procedures to obtain audit evidence about the amounts and disclosures in the fi nancial statements. The procedures selected depend on our judgement, including the assessment of risks of material misstatement of the fi nancial statements, whether due to fraud or error. In making those risk assessments, we consider internal control relevant to the entity’s preparation of fi nancial statements that give a true and fair view in order to design audit procedures that are appropriate in the circumstances, but not for the purpose of expressing an opinion on the effectiveness of the entity’s internal control. An audit also includes evaluating the appropriateness of accounting policies used and the reasonableness of accounting estimates made by the directors, as well as evaluating the overall presentation of the fi nancial statements.
We believe that the audit evidence we have obtained is suffi cient and appropriate to provide a basis for our audit opinion.
Opinion
In our opinion, the fi nancial statements have been properly drawn up in accordance with Private Entities Reporting Standards and the Companies Act 1965 in Malaysia so as to give a true and fair view of the fi nancial position of the Company as of 31 March 2013 and of its fi nancial performance and cash fl ows for the period then ended.
Report on Other Legal and Regulatory Requirements
In accordance with the requirements of the Companies Act 1965 in Malaysia, we also report that in our opinion the accounting and other records and the registers required by the Act to be kept by the Company have been properly kept in accordance with the provisions of the Act.
Other Matters
This report is made solely to the members of the Company, as a body, in accordance with Section 174 of the Companies Act 1965 in Malaysia and for no other purpose. We do not assume responsibility to any other person for the content of this report.
SUNDAR & ASSOCIATES AF No: 1127 SUNDARASAN A/L ARUMU
Chartered Accountants (M)
SUNDARASAN A/L ARUMUGAM 1876/02/14(J/PH)Chartered Accountant (M)
Petaling Jaya
Date : 15 April, 2013
INDEPENDENT AUDITORS’ REPORT

342
M A R I C O M A L AY S I A S D N . B H D.
BALANCE SHEET As at 31 March 2013
Notes 2013 2012 2013 2012 RM RM Rs.Crore Rs.Crore
Non-current assetsPlant and equipment 8 62,891 380,342 0.11 0.63
Intangible asset 9 16,382,300 16,382,300 28.73 27.22
16,445,191 16,762,642 28.84 27.85 Current assetsInventories 3 (iv)/10 834,615 213,391 1.46 0.35
Trade receivables 2,269,788 5,564,910 3.98 9.25
Other receivables and deposits 11 464,298 208,070 0.81 0.35
Cash and bank balances 137,229 1,113,709 0.24 1.85
3,705,930 7,100,080 6.49 11.80 Current liabilitiesTrade payables 193,574 1,506,598 0.34 2.50
Bills payable 12 1,550,488 922,359 2.72 1.53
Other payables and accrued liabilities 13 2,484,662 4,182,843 4.36 6.95
Amount due to holding company 14 2,165,624 1,262,957 3.80 2.10
Amount due to ultimate holding company 14 844,540 – 1.48 –
Short-term borrowings 15 1,575,784 1,532,250 2.76 2.55
8,814,672 9,407,007 15.46 15.63
Net current liabilities (5,108,742) (2,306,927) (8.97) (3.83)
11,336,449 14,455,715 19.87 24.02 Financed by :
Share capital 16 17,660,240 17,660,240 30.97 29.35
Accumulated loss (6,323,791) (3,204,525) (11.09) (5.32)
11,336,449 14,455,715 19.87 24.02
The annexed notes form an integral part of these fi nancial statements.
Note: The exchange rate use to convert MYR to Rs.<17.537>/(Previous year MYR to Rs.<16.617>)

343
M A R I C O M A L AY S I A S D N . B H D.
INCOME STATEMENT For the year ended 31 March 2013
Notes 2013 2012 2013 2012 RM RM Rs.Crore Rs.Crore
Revenue 3(ii) 7,162,989 13,216,878 12.56 21.96
Cost of sales (4,482,448) (7,705,743) (7.86) (12.80)
Gross profi t 2,680,541 5,511,135 4.70 9.16
Other income 312,580 18,138 0.55 0.03
Staff costs 5 (906,610) (1,018,033) (1.59) (1.69)
Depreciation (93,853) (105,072) (0.16) (0.17)
Other operating expenses (4,931,843) (5,530,018) (8.65) (9.19)
Operating loss (2,939,185) (1,123,850) (5.15) (1.86)
Finance cost (180,081) (99,291) (0.32) (0.16)
Loss before taxation 6 (3,119,266) (1,223,141) (5.47) (2.02)
Taxation 7 – – – –
Loss after taxation (3,119,266) (1,223,141) (5.47) (2.02)
Note: The exchange rate use to convert MYR to Rs.<17.537>/(Previous year MYR to Rs.<16.617>)
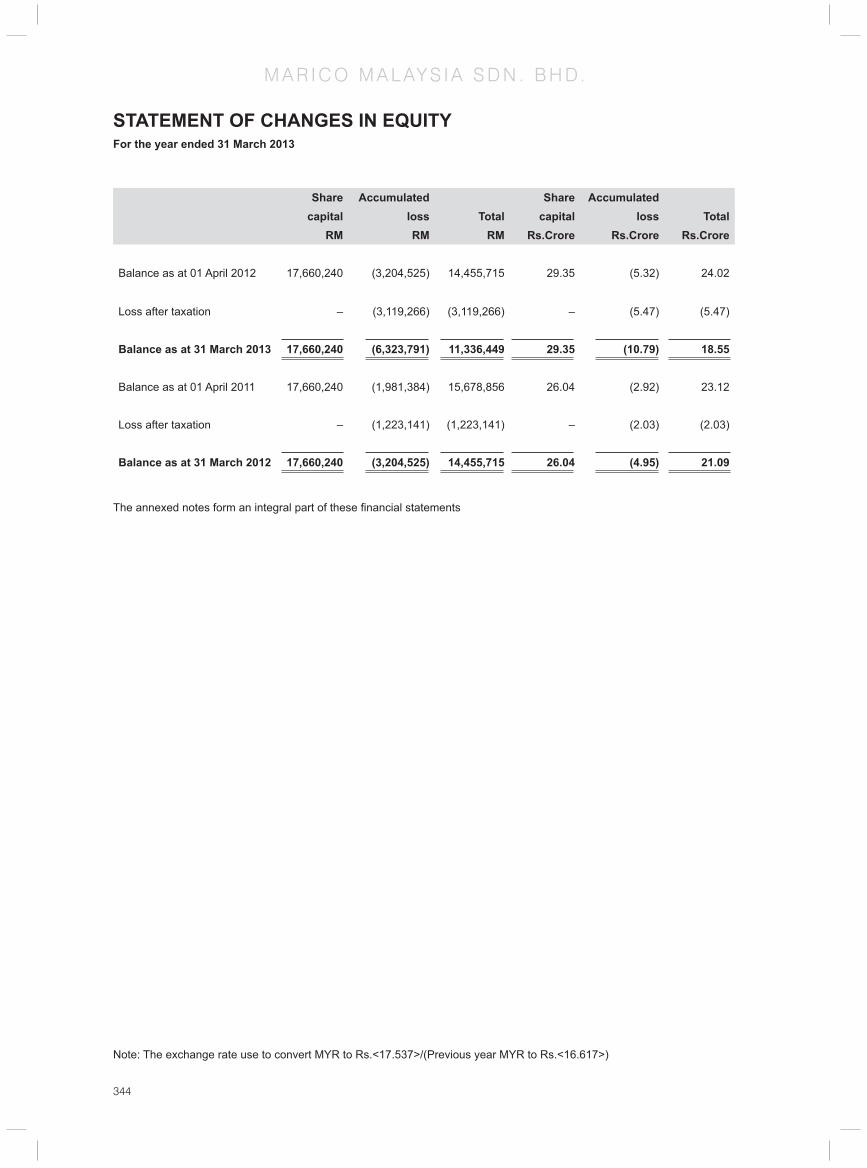
344
M A R I C O M A L AY S I A S D N . B H D.
STATEMENT OF CHANGES IN EQUITYFor the year ended 31 March 2013
Share Accumulated Share Accumulated capital loss Total capital loss Total
RM RM RM Rs.Crore Rs.Crore Rs.Crore
Balance as at 01 April 2012 17,660,240 (3,204,525) 14,455,715 29.35 (5.32) 24.02
Loss after taxation – (3,119,266) (3,119,266) – (5.47) (5.47)
Balance as at 31 March 2013 17,660,240 (6,323,791) 11,336,449 29.35 (10.79) 18.55
Balance as at 01 April 2011 17,660,240 (1,981,384) 15,678,856 26.04 (2.92) 23.12
Loss after taxation – (1,223,141) (1,223,141) – (2.03) (2.03)
Balance as at 31 March 2012 17,660,240 (3,204,525) 14,455,715 26.04 (4.95) 21.09
The annexed notes form an integral part of these fi nancial statements
Note: The exchange rate use to convert MYR to Rs.<17.537>/(Previous year MYR to Rs.<16.617>)

345
M A R I C O M A L AY S I A S D N . B H D.
CASH FLOW STATEMENTFor the year ended 31 March 2013
2013 2012 2013 2012 RM RM Rs.Crore Rs.Crore
Cash fl ows from operating activitiesLoss before taxation (3,119,266) (1,223,141) (5.47) (2.03)
Adjustments for:
Gain on foreign exchange - unrealised – 17,612 – 0.03
Depreciation on plant and equipment 93,853 105,072 0.16 0.17
Gain on disposal of property, plant and equipment (68,811) – (0.12) –
Loan interest 180,081 99,291 0.32 0.16
Operating loss before working capital changes (2,914,143) (1,001,166) (5.11) (1.67)
Working capital :
Inventories (621,224) (100,109) (1.09) (0.17)
Trade receivables 3,295,122 (3,224,290) 5.78 (5.36)
Other receivables and deposits (256,228) 274,660 (0.45) 0.46
Trade payables (1,313,024) 405,112 (2.30) 0.67
Other payables and accrued liabilities (1,698,181) 2,911,394 (2.98) 4.84
Amount due to related company – (142,144) – (0.24)
Amount due to ultimate holding company 844,540 – 1.48 –
Amount due to holding company 902,667 960,388 1.58 1.60
Cash (absorbed by) / generated from operations (1,760,471) 83,845 (3.09) 0.13
Loan interest (180,081) (99,291) (0.32) (0.16)
Net cash fl ows from operating activities (1,940,552) (15,446) (3.41) (0.03)
Cash fl ow from investing activitiesPurchase of plant and equipment – (508,187) – (0.84)
Proceed from disposal of property, plant and equipment
292,409 – 0.51 –
Net cash fl ow from investing activities 292,409 (508,187) 0.51 (0.84)
Cash fl ows from fi nancing activitiesBills payable 628,129 922,359 1.10 1.53
Short-term borrowings 43,534 19,401 0.08 0.03
Net cash fl ow from fi nancing activities 671,663 941,760 1.18 1.56
Net (decrease) / increase in cash and cash equivalents (976,480) 418,127 (1.71) 0.69
Cash and cash equivalents brought forward 1,113,709 695,582 1.95 1.16
Cash and cash equivalents carried forward 137,229 1,113,709 0.24 1.85
Breakdown of cash and cash equivalents carried forwardCash and bank balances 137,229 1,113,709 0.24 1.85
The annexed notes form an integral part of these fi nancial statements
Note: The exchange rate use to convert MYR to Rs.<17.537>/(Previous year MYR to Rs.<16.617>)

346
M A R I C O M A L AY S I A S D N . B H D.
NOTES TO THE FINANCIAL STATEMENTS 31 March 2013
1. Corporate information
The Company is a private limited liability company, incorporated and domiciled in Malaysia.
The registered offi ce of the Company is located at Ground Floor, Lot 7, Block F, Saguking Commercial Building, Jalan Patau-Patau, 87000 Labuan Ft and the principal place of business is located at 806 Block A, Phileo Damansara 1, No 9, Jalan 16/11, Jalan Damansara, 46350 Petaling Jaya, Selangor.
2. Date of authorisation of issue
The fi nancial statements were authorised for issue by the Board of Directors on
3. Signifi cant accounting policies
(i) Basis of preparation
The fi nancial statements comply with applicable approved accounting standards for private entities issued by the Malaysian Accounting Standards Board and the provisions of the Companies Act, 1965.
The fi nancial statements have been prepared under the historical cost convention.
(ii) Revenue recognition
Revenue is recognised when it is probable that the economic benefi ts associated with the transaction will fl ow to the enterprise and the amount of the revenue can be measured reliably.
Sale of goods
Revenue is recognised upon delivery of goods and customers’ acceptance and where applicable, net of returns and trade discounts.
(iii) Plant and equipment
Plant and equipment is stated at cost less accumulated depreciation and impairment loss.
Depreciation on plant and equipment is calculated on a straight – line method based on the estimated useful lives of the assets.
The principal annual rates of depreciation used are as follows:
Computer 33.33%
Furniture and fi ttings 33.33%
Offi ce equipment 33.33%
Motor vehicles 27%
Moulds 20%
Notes to the fi nancial statements – 31 March 2013 (cont’d)
Plant and equipment is written down to recoverable amount if, the recoverable amount is less than their carrying value. Recoverable amount is the higher of an asset’s net selling price and its value in use.
(iv) Inventories
Inventories comprises of trading merchandise which are valued at the lower of cost and net realisable value. Cost is determined on weighted average method. Costs of trading merchandise comprise the cost of purchase plus the cost of bringing the inventories to their present location and condition.

347
M A R I C O M A L AY S I A S D N . B H D.
(v) Income tax
Income tax on the profi t or loss for the year comprises current and deferred tax. Current tax is the expected amount of income taxes payable in respect of the taxable profi t for the year and is measured using the tax rates that have been enacted at balance sheet date.
Deferred tax is provided for, using the liability method, on temporary differences at the balance sheet date between the tax bases of assets and liabilities and their carrying amounts in the fi nancial statements. In principle, deferred tax liabilities are recognised for all taxable temporary differences and deferred tax assets are recognised for all deductible temporary differences, unused tax losses and unused tax credits to the extent that it is probable that taxable profi t will be available against which the deductible temporary differences, unused tax losses and unused tax credits can be utilised.
Deferred tax measured at the tax rates that are expected to apply in the period when the asset is realised or the liability is settled, based on the tax rates that have been enacted or substantively enacted at the balance sheet date.
Deferred tax is recognised in the income statement, except when it arises from a transaction which is recognised directly in equity.
(vi) Provisions
Provisions are recognised when the Company has a present legal and constructive obligation as a result of a past event, when it is probable that an outfl ow of resources embodying economic benefi ts will be required to settle the obligation, and when a reliable estimate can be made of the amount of the obligation.
(vii) Cash and cash equivalents
Cash comprises of cash and bank balances. Cash equivalents comprises of investments maturing within three months from the date of acquisition and which are readily convertible to known amount of cash which are subject to an insignifi cant risk of change in value.
(viii) Receivables
Trade and other receivables are carried at anticipated realisable value. Bad debts are written off in the period in which they are identifi ed. An estimate is made for doubtful debts based on review of all outstanding amounts at the year end.
(ix) Payables
Payables are stated at cost which is the consideration to be paid in the future for products and services received.
(x) Intangible assets
Trademarks acquired are measured at cost less any accumulated impairment losses. Trademarks with indefi nite useful lives are not amortised but is tested for impairment annually and whenever there is an indication that the asset may be impaired.
(xi) Impairment of assets
The carrying values of assets excluding inventories, deferred tax assets, assets arising from employee benefi ts and fi nancial assets are reviewed for impairment when there is an indication that the assets might be impaired. Impairment is measured by comparing the carrying values of the assets with their recoverable amounts. The recoverable amount is the higher of an asset’s net selling price and its value in use, which is measured by reference to discounted future cash fl ows. Recoverable amounts are estimated for individual assets, or if it not possible, for the cash-generating unit.
An impairment loss is charged to the income statement immediately, unless the asset is carried at revalued amount. Any impairment loss of a revalued asset is treated as a revaluation decrease to the extent of previously recognised revaluation surplus for the same asset.
NOTES TO THE FINANCIAL STATEMENTS 31 March 2013

348
M A R I C O M A L AY S I A S D N . B H D.
(xi) Impairment of assets (cont’d)
Subsequent increase in the recoverable amount of an asset is treated as reversal of the previous impairment loss and is recognised to the extent of the carrying amount of the asset that would have been determined (net of amortisation and depreciation) had no impairment loss been recognised. The reversal is recognised in the income statement immediately, unless the asset is carried at revalued amount. A reversal of an impairment loss on a revalued asset is credited directly to revaluation surplus. However, to the extent that an impairment loss on the same revalued asset was previously recognised as an expense in the income statement, a reversal of that impairment loss is recognised as income in the income statement.
(xii) Currency conversion
Transactions in foreign currencies are translated to Malaysian Ringgit at rates of exchange ruling at the date of transaction. Monetary assets and liabilities denominated in foreign currencies are translated at the rates of exchange ruling at the balance sheet date. Foreign exchange differences arising on translation are recognised in the income statement.
The principal closing rates used in translation of foreign currency amount are as follows:
2013 2012
RM RM
United States Dollar 3.09375 3.06450
Singapore Dollar 2.4911 2.4410
(xiii) Borrowings
Borrowings are reported at their face value.
All borrowing costs are charged to the income statement in the period in which they are incurred.
(xiv) Employment benefi t
a. Short term benefi ts
Wages, salaries, bonuses and social security contributions are recognised as an expense in the fi nancial year in which the associated services are rendered by employees of the Company. Short term accumulating compensated absences such as paid annual leave are recognised when services are rendered by employees that increase their entitlement to future compensated absences, and short term non-accumulating compensated absences such as sick leave are recognised when the absences occurred.
b. Defi ned contribution plan
As required by law, companies in Malaysia make contributions to the Employee Provident Fund (EPF). Such contributions are recognised as an expense in the income statement as incurred
4. Principal activity
The principal activity of the Company is as distributor of perfumery, cosmetics, toiletries and related beauty products.
5. Staff cost
2013 2012 2013 2012 RM RM Rs. Crore Rs. Crore
Salaries, bonuses and allowance 899,529 1,012,605 1.58 1.68
Contribution to defi ned contribution plan 6,461 4,860 0.01 0.01
Other employees benefi ts 620 568 0.01 0.01
906,610 1,018,033 1.59 1.69
NOTES TO THE FINANCIAL STATEMENTS 31 March 2013

349
M A R I C O M A L AY S I A S D N . B H D.
6. Loss before taxation
Loss before taxation is stated after charging:-
2013 2012 2013 2012 RM RM Rs. Crore Rs. Crore
Loan interest 180,081 99,291 0.32 0.16
Loss on foreign exchange – realised 143,156 61,670 0.25 0.10
Rental of offi ce 42,000 51,780 0.07 0.09
Auditors’ remuneration 8,000 8,000 0.01 0.01
Provision for closure costs – 77,000 – 0.13and crediting :-
Gain on foreign exchange – realised 240,830 – 0.42 –
Gain on disposal of moulds 68,811 – 0.12 –
Royalty income 2,896 – 0.01 –
Interest income 43 526 0.01 0.01
Gain on foreign exchange – unrealised – 17,612 – 0.03
7. Taxation
Tax charge for the year is as follows:
2013 2012 2013 2012 RM RM Rs. Crore Rs. Crore
Transferred to deferred taxation (note 16)
- Deferred tax liabilities 3,280,146 2,488,760 5.75 4.14
- Deferred tax assets (3,280,146) (2,488,760) (5.75) (4.14)
A reconciliation of income tax expense applicable to loss before taxation at the statutory income tax rate to income tax expense at the effective income tax rate of the Company is as follows:
2013 2012 2013 2012 RM RM Rs. Crore Rs. Crore
Loss before taxation 3,119,266 (1,223,141) 5.47 (2.03)
Tax at Malaysian statutory tax rate of 25% (779,817) (305,785) (1.37) (0.51)
Expenses not deductible for tax purposes 25,831 28,401 0.05 0.05
Non taxable income – (4,403) – (0.01)
Double deduction 3,823 (9,764) 0.01 (0.02)
Deferred tax assets not recognised 750,163 91,680 1.32 0.15
Proportion of loss in respect of overlapping year
– 199,871 – 0.33
Tax expense for the period – – – –
Subject to agreement of the Inland Revenue Board, the Company has the following available for set-off against future taxable income.
2013 2012 2013 2012 RM RM Rs. Crore Rs. Crore
Unutilised tax losses 13,208,040 10,078,096 23.16 16.75
Unutilised capital allowances 6,097,073 3,029,242 10.69 5.03
19,305,113 13,107,338 33.86 21.78
NOTES TO THE FINANCIAL STATEMENTS 31 March 2013

350
M A R I C O M A L AY S I A S D N . B H D.
NO
TES
TO T
HE
FIN
AN
CIA
L ST
ATEM
ENTS
31
Mar
ch 2
013
Cos
tFu
rnitu
re a
nd
fi ttin
gsC
ompu
ter
Offi
ce
equi
pmen
tM
otor
ve
hicl
esM
ould
s To
tal
Furn
iture
and
fi t
tings
Com
pute
rO
ffi ce
eq
uipm
ent
Mot
or
vehi
cles
Mou
lds
Tota
l
RM
RM
RM
RM
RM
RM
Rs.
Cro
reR
s. C
rore
Rs.
Cro
reR
s. C
rore
Rs.
Cro
reR
s. C
rore
Bal
ance
bro
ught
forw
ard
3,7
68
12,
128
43,
200
91,
252
353
,049
5
03,3
97
–
0.0
1 0
.04
0.0
4 0
.12
0.2
0
Add
ition
–
––
––
– –
–
–
–
–
–
Dis
posa
l–
– –
–
353
,049
3
53,0
49
–
–
– –
0.6
2 0
.62
Bal
ance
car
ried
forw
ard
3,7
68
12,
128
43,
200
91,
252
–
150
,348
–
0
.01
0.0
4 0
.04
(0.5
0) (0
.42)
Acc
umul
ated
dep
reci
atio
nFu
rnitu
re a
nd C
ompu
ter
Offi
ceM
otor
M
ould
s To
talF
urni
ture
and
C
ompu
ter
Offi
ceM
otor
M
ould
s To
tal
fi ttin
gs
equi
pmen
tve
hicl
esfi t
tings
eq
uipm
ent
vehi
cles
RM
RM
RM
RM
RM
RM
Rs.
Cro
reR
s. C
rore
Rs.
Cro
reR
s. C
rore
Rs.
Cro
reR
s. C
rore
Bal
ance
bro
ught
forw
ard
1,8
84
4,1
24
22,
800
23,
637
70,
610
123
,055
–
0
.01
0.0
4 0
.04
0.1
2 0
.20
Cur
rent
cha
rge
1,2
56
4,0
43
14,
400
15,
313
58,
841
93,
853
– 0
.01
0.0
3 0
.03
0.1
0 0
.16
Dep
reci
atio
n on
dis
posa
l –
–
–
–
129
,451
1
29,4
51
–
– –
–
0
.23
0.2
3
Bal
ance
car
ried
forw
ard
3,1
40
8,1
67
37,
200
38,
950
– 8
7,45
7 –
0.0
2 0
.07
0.0
7 (0
.01)
0.1
3
Net
boo
k va
lue
Furn
iture
and
Com
pute
rO
ffi ce
Mot
or
Mou
lds
Tota
lFur
nitu
re a
nd
Com
pute
rO
ffi ce
Mot
or
Mou
lds
Tota
lfi t
tings
eq
uipm
ent
vehi
cles
fi ttin
gs
equi
pmen
tve
hicl
esR
MR
MR
MR
MR
MR
MR
s. C
rore
Rs.
Cro
reR
s. C
rore
Rs.
Cro
reR
s. C
rore
Rs.
Cro
re
2013
628
3
,961
6
,000
5
2,30
2 –
62,
891
0.0
1 0
.01
0.0
3 0
.03
– 0
.55
2012
1,8
84
8,0
04
20,
400
67,
615
282
,439
3
80,3
42
0.01
0.01
0.01
0.01
0.01
0.01

351
M A R I C O M A L AY S I A S D N . B H D.
NOTES TO THE FINANCIAL STATEMENTS 31 March 2013
9. Intangible assets
2013 2012 2013 2012 RM RM Rs. Crore Rs. Crore
Cost
At 1 April 16,382,300 16,235,500 28.73 26.98
Acquisition – 146,800 – 0.24
At 31 March 16,382,300 16,382,300 28.73 27.22
Trademarks related to the “Code 10” brand name were acquired by way of an assignment of full and absolute rights thereto from the registered proprietor. As those rights were assigned without a specifi ed time frame and management believes that is no foreseeable limit to the period over which the brand is expected to generate cash infl ows for the Company, the trademarks were assessed as having an indefi nite useful life subject to use in good faith.
10. Inventories
2013 2012 2013 2012 RM RM Rs. Crore Rs. Crore
At costs :
Trading merchandise 834,615 213,391 1.46 0.35
11. Other receivables and deposits
2013 2012 2013 2012 RM RM Rs. Crore Rs. Crore
Other receivables 256,228 – 0.45 –
Deposits 208,070 208,070 0.36 0.35
464,298 208,070 0.81 0.35
12. Credit facility
2013 2012 2013 2012
RM RM Rs. Crore Rs. Crore Trade bills 1,500,000 1,500,000 2.63 2.49
The facility is secured as follows :
i Standby letter of credit of USD 500,000 or other currency equivalent thereof from a foreign bank.
ii Trade Financing General Agreement from the Company.
The interest rate chargeable on the facility is as follows: Rate (%)
Amanah Documentary Credit 0.10% per month.
Amanah Accepted Bills 1.25% acceptance commission. Margin of profi t will based on rate quoted by bank at the time of fi nancing.
Trust Receipt 1.25% above the bank’s prescribed base fi nancing rate
Clean Import Financing 1.25% above the bank’s prescribed base fi nancing rate
Clean Export Financing 1.25% + Cost of fund

352
M A R I C O M A L AY S I A S D N . B H D.
NOTES TO THE FINANCIAL STATEMENTS 31 March 2013
13. Other payables and accrued liabilities
2013 2012 2013 2012 RM RM Rs. Crore Rs. Crore
Accrued expenses 2,484,662 4,053,242 4.36 6.71
Other payables – 129,601 – 0.22
2,484,662 4,182,843 4.36 6.92
14. Holding company
The Company’s immediate holding company is Marico Middle East FZE, a company incorporated in Dubai, United Arab Emirates which holds 100 % interest in the shares of the Company.
The ultimate holding company is Marico Limited a company incorporated in India
15. Short term -borrowing
During the fi nancial year, the Company obtained short term revolving facility from a foreign bank that was utilised to make full settlement of the existing short term loan. The borrowing is secured by a standby letter of credit issued in favour of the lender by another foreign bank for an amount of USD 550,000/-. The interest is chargeable at 1.1% above LIBOR per annum. The loan is repayable on 30th of November 2013.
16. Share capital
2013 2012 2013 2012 RM RM Rs. Crore Rs. Crore
Authorised :
24,000,000 Ordinary shares of RM 1/- each 24,000,000 24,000,000 42.09 39.88
1,000,000 Redeemable Preference shares of RM 1/- each
1,000,000 1,000,000 1.75 1.66
25,000,000 25,000,000 43.84 41.54Issued and fully paid:
17,660,240 Ordinary shares of RM1/- each 17,660,240 17,660,240 30.97 29.35
17. Deferred tax assets
2013 2012 2013 2012
RM RM Rs. Crore Rs. Crore At 1 April /on incorporation
Recognised in income statement
- Deferred tax liabilities 3,280,146 2,488,760 5.75 4.14
- Deferred tax assets (3,280,146) (2,488,760) (5.75) (4.14)At 31March – – – –
No deferred tax asset is recognised for
the following items:
Unabsorbed tax capital allowances 87,456 123,055 0.15 0.20
Unutilised tax losses 6,097,073 3,029,242 10.69 5.03
6,184,529 3,152,297 10.85 5.24
18. Employees
2013 2012Number of employees at the end of the fi nancial year 3 3

353
M A R I C O M A L AY S I A S D N . B H D.
INCOME STATEMENTFor the year ended 31 March 2013
Notes 2013 2012 2013 2012 RM RM Rs.Crore Rs.Crore
Revenue 7,162,989 13,216,878 12.56 21.96
Less: Cost of salesInventories - at beginning of the year 213,391 97,825 0.37 0.16
Purchases 4,799,061 7,274,440 8.42 12.09
Freight charges 252,993 517,812 0.44 0.86
R&D material consumed 2,086 – – –
Warehouse charges 49,532 29,057 0.09 0.05
Inventories - at end of the year (834,615) (213,391) (1.46) (0.35)
4,482,448 7,705,743 7.86 12.81
Gross profi t 2,680,541 5,511,135 4.70 9.15
Other income :Gain on foreign exchange - realised 240,830 – 0.42 –
Gain on disposal of moulds 68,811 – 0.12 –
Royalty income 2,896 – 0.01 –
Interest income 43 526 – –
Gain on foreign exchange - unrealised – 17,612 – 0.03
312,580 18,138 0.55 0.03
Staff costs Appendix I (906,610) (1,018,033) (1.59) (1.69)
Depreciation Appendix I (93,853) (105,072) (0.17) (0.18)
Other operating expenses Appendix II (4,931,843) (5,530,018) (8.65) (9.19)
Operating loss (2,939,185) (1,123,850) (5.16) (1.88)
Finance cost Appendix II (180,081) (99,291) (0.32) (0.16)
Loss for the year (3,119,266) (1,223,141) (5.48) (2.04)
This management income statement is prepared from information furnished by the management of Marico Malaysia Sdn. Bhd. and does not form part of the audited fi nancial statements of the Company.

354
M A R I C O M A L AY S I A S D N . B H D.
SCHEDULE OF EXPENSESFor the year ended 31 March 2013
2013 2012 2013 2012RM RM Rs.Crore Rs.Crore
Staff costs
Salary and wages 809,075 662,480 1.42 1.10
Bonus 90,454 350,125 0.16 0.58
EPF - staff 6,461 4,860 0.01 0.01
SOSCO- staff 620 568 – –
906,610 1,018,033 1.59 1.69
DepreciationMoulds 58,841 70,610 0.10 0.12
Motor vehicles 15,313 15,313 0.03 0.03
Offi ce equipment 14,400 14,400 0.03 0.02
Computer 4,043 3,493 0.01 0.01
Furniture and fi ttings 1,256 1,256 – –
93,853 105,072 0.17 0.18
Other operating expensesAdvertisement 4,158,696 4,237,415 7.29 7.04
Professional charges 154,525 97,061 0.27 0.16
Sampling expenses 146,980 405 0.26 –
Loss on foreign exchange - realised 143,156 61,670 0.25 0.10
Travelling expenses 136,887 165,866 0.24 0.28
Visibility windows display 46,900 740,667 0.08 1.23
Rental of offi ce 42,000 51,780 0.07 0.09
Telephone, fax and internet 27,387 40,598 0.05 0.07
Bank charges 23,016 11,970 0.04 0.02
Road tax and insurance 21,247 8,646 0.04 0.01
Miscellaneous expenses 15,608 17,847 0.03 0.03
Auditors' remuneration 8,000 8,000 0.01 0.01
Tax fee 3,500 3,500 0.01 0.01
Postage and courier 3,374 6,433 0.01 0.01
Printing and stationery 567 861 – –
Provision for closure cost – 77,000 – 0.13
Donation – 299 – –
4,931,843 5,530,018 8.65 9.19
Finance costLoan interest 180,081 99,291 0.32 0.16
180,081 99,291 0.32 0.16
This management schedule of expenses is prepared from information furnished by the management of Marico Malaysia Sdn. Bhd. and does not form part of the audited fi nancial statements of the Company.
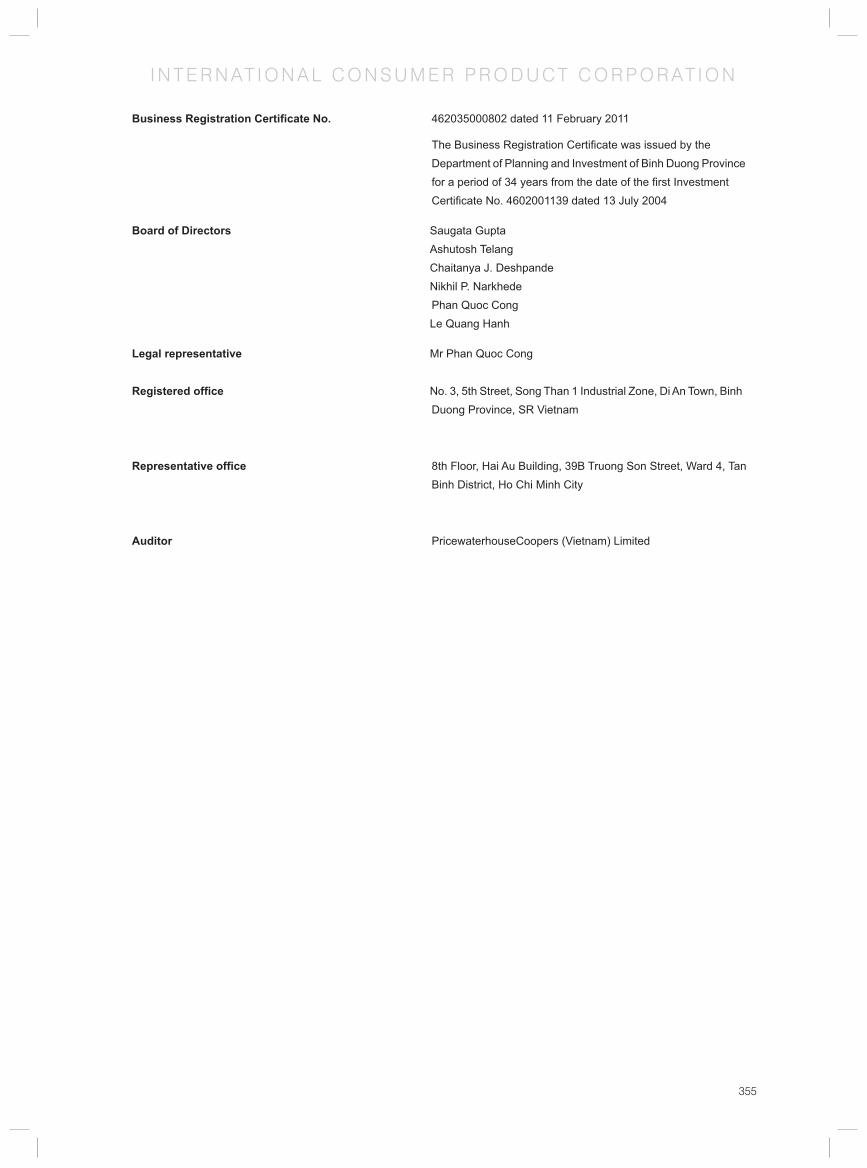
355
I N T E R N AT I O N A L C O N S U M E R P R O D U C T C O R P O R AT I O N
Business Registration Certifi cate No. 462035000802 dated 11 February 2011
The Business Registration Certifi cate was issued by the Department of Planning and Investment of Binh Duong Province for a period of 34 years from the date of the fi rst Investment Certifi cate No. 4602001139 dated 13 July 2004
Board of Directors Saugata Gupta Ashutosh Telang Chaitanya J. Deshpande Nikhil P. Narkhede Phan Quoc Cong Le Quang Hanh
Legal representative Mr Phan Quoc Cong
Registered offi ce No. 3, 5th Street, Song Than 1 Industrial Zone, Di An Town, Binh Duong Province, SR Vietnam
Representative offi ce 8th Floor, Hai Au Building, 39B Truong Son Street, Ward 4, Tan Binh District, Ho Chi Minh City
Auditor PricewaterhouseCoopers (Vietnam) Limited

356
I N T E R N AT I O N A L C O N S U M E R P R O D U C T C O R P O R AT I O N
STATEMENT OF THE RESPONSIBILITY OF THE BOARD OF DIRECTORS OF THE COMPANY IN RESPECT OF THE FINANCIAL STATEMENTSThe Board of Directors of the Company is responsible for fi nancial statements which give a true and fair view of the fi nancial position of the Company as at 31 December 2012 and the results of its operations and cash fl ows for the year then ended. In preparing these fi nancial statements, the management is required to:
▪ select suitable accounting policies and then apply them consistently;
▪ make judgments and estimates that are reasonable and prudent; and
▪ prepare the fi nancial statements on a going concern basis unless it is inappropriate to presume that the Company will continue in business.
The Board of Directors is responsible for ensuring that proper accounting records are kept which disclose, with reasonable accuracy at any time, the fi nancial position of the Company and which enable fi nancial statements to be prepared which comply with the basis of accounting set out in Note 2 to the fi nancial statements. The Board of Directors is also responsible for safeguarding the assets of the Company and hence for taking reasonable steps for the prevention and detection of fraud and other irregularities.
APPROVAL OF THE FINANCIAL STATEMENTS
I hereby approve the accompanying fi nancial statements which give a true and fair view of the fi nancial position of the Company as at 31 December 2012 and of the results of its operations and cash fl ows for the year then ended in accordance with Vietnamese Accounting Standards, the Vietnamese Accounting System and applicable regulations in SR Vietnam.
Phan Quoc CongGeneral DirectorBinh Duong Province, SR Vietnam11 March 2013

357
I N T E R N AT I O N A L C O N S U M E R P R O D U C T C O R P O R AT I O N
We have audited the accompanying fi nancial statements of International Consumer Products Corporation (“the Company”) which were approved by The Board of Directors on 11 March 2013. The fi nancial statements comprise the balance sheet as at 31 December 2012, the income statement and cash fl ow statement for the year then ended, and explanatory notes to the fi nancial statements including signifi cant accounting policies, as set out on pages 5 to 31.
The Board of Directors’ Responsibility for the Financial Statements
The Board of Directors of the Company is responsible for the preparation and fair presentation of these fi nancial statements in accordance with Vietnamese Accounting Standards, the Vietnamese Accounting System and applicable regulations in SR Vietnam. This responsibility includes: designing, implementing and maintaining internal controls relevant to the preparation and fair presentation of fi nancial statements that are free from material misstatement, whether due to fraud or error; selecting and applying appropriate accounting policies and making accounting estimates that are reasonable in the circumstances.
Auditor’s Responsibility
Our responsibility is to express an opinion on these fi nancial statements based on our audit. We conducted our audit in accordance with Vietnamese Standards on Auditing. Those standards require that we comply with ethical requirements and plan and perform the audit in order to obtain reasonable assurance as to whether the fi nancial statements are free from material misstatement.
An audit involves performing procedures to obtain audit evidence about the amounts and disclosures in the fi nancial statements. The procedures selected depend on the auditor’s judgment, including an assessment of the risks of material misstatement of the fi nancial statements, whether due to fraud or error. In making those risk assessments, the auditor considers internal controls relevant to the entity’s preparation and fair presentation of the fi nancial statements in order to design audit procedures that are appropriate in the circumstances, but not for the purpose of expressing an opinion on the effectiveness of the entity’s internal controls. An audit also includes evaluating the appropriateness of accounting policies used and the reasonableness of accounting estimates made by management, as well as evaluating the overall presentation of the fi nancial statements.
We believe that the audit evidence we have obtained is suffi cient and appropriate to provide a basis for our audit opinion.
Opinion
In our opinion, the fi nancial statements present fairly, in all material respects, the fi nancial position of the Company as at 31 December 2012, and its fi nancial performance and cash fl ows for the year then ended in accordance with Vietnamese Accounting Standards, the Vietnamese Accounting System and applicable regulations in SR Vietnam.
Dang Quoc Tuan Ngo Thi Nhat GiaoAC No. 0620/KTV AC No. 2415/KTVDirectorAuthorised signatory
PricewaterhouseCoopers (Vietnam) LimitedHo Chi Minh City, SR VietnamAudit report number HCM341211-Mar-13
INDEPENDENT AUDITORS’ REPORT

358
I N T E R N AT I O N A L C O N S U M E R P R O D U C T C O R P O R AT I O N
BALANCE SHEET As at 31 December 2012
As at 31 December As at 31 December 2012 2011 2012 2011
ASSETS Note VND VND Rs. Crore Rs. Crore
CURRENT ASSETS 315,256,211,872 180,924,095,964 83.25 45.64
Cash and cash equivalents 3 75,872,154,527 50,353,360,852 20.04 12.70 Cash 9,672,154,527 19,353,360,852 2.55 4.88
Cash equivalents 66,200,000,000 31,000,000,000 17.48 7.82
Short-term investments 4 120,600,000,000 10,000,000,000 31.85 2.52 Short-term investments 120,600,000,000 10,000,000,000 31.85 2.52
Accounts receivable 44,810,153,404 50,402,315,038 11.83 12.71 Trade accounts receivable 5 23,539,962,759 20,927,965,578 6.22 5.28
PREPAYMENTS TO SUPPLIERS 6 15,939,167,901 25,768,449,151 4.21 6.50
Other receivables 7 5,331,022,744 3,705,900,309 1.41 0.93
Inventories 8 73,013,093,592 68,575,340,964 19.28 17.30 Inventories 76,796,698,250 70,146,746,720 20.28 17.70
Provision for decline in value of inventories (3,783,604,658) (1,571,405,756) (1.00) (0.40)
Other current assets 960,810,349 1,593,079,110 0.25 0.40 Short-term prepayments 405,708,575 305,421,609 0.11 0.08
Other taxes receivable – 100,141,901 – 0.03
Other current assets 555,101,774 1,187,515,600 0.15 0.30
NON-CURRENT ASSETS 158,329,258,553 159,569,706,314 41.81 40.25 Fixed assets 13,565,376,565 14,384,942,261 3.58 3.63 Tangible fi xed assets 9(a) 9,553,350,534 12,189,999,980 2.52 3.08
Cost 33,004,251,780 32,002,356,896 8.72 8.07
Accumulated Depreciation (23,450,901,246) (19,812,356,916) (6.19) (5.00)
Intangible Fixed Assets 9(b) 3,253,386,534 2,194,942,281 0.86 0.55
Cost 13,964,467,563 10,528,721,363 3.69 2.66
Accumulated Amortisation (10,711,081,029) (8,333,779,082) (2.83) (2.10)
Construction In Progress 9(c) 758,639,497 – 0.20 –
Investment Properties 10 23,397,254,557 23,843,388,652 6.18 6.01 Cost 23,843,388,652 23,843,388,652 6.30 6.01
Accumulated Depreciation (446,134,095) – (0.12) –
Long-Term Investments 116,187,001,308 113,743,051,308 30.68 28.69 Investments In Subsidiaries 11 116,187,001,308 113,743,051,308 30.68 28.69
Other Long-Term Assets 5,179,626,123 7,598,324,093 1.37 1.92 Long-Term Prepayments 12 3,388,861,656 5,101,995,663 0.89 1.29
Deferred Income Tax Assets 28 272,503,055 978,067,018 0.07 0.25
Other Long-Term Assets 1,518,261,412 1,518,261,412 0.40 0.38
Total Assets 473,585,470,425 340,493,802,278 125.07 85.90
Note: The exchange rate use to convert VND to Rs.<0.00259>/(Previous year VND to Rs.<0.00244>)

359
I N T E R N AT I O N A L C O N S U M E R P R O D U C T C O R P O R AT I O N
As at 31 December As at 31 December 2012 2011 2012 2011
RESOURCES Note VND VND Rs. Crore Rs. Crore
LIABILITIES 112,982,984,033 56,079,079,600 29.84 14.15
Current liabilities 111,264,413,957 54,735,545,766 29.38 13.81 Short-term borrowings 13 4,000,000,000 - 1.06 -
Trade accounts payable 14 37,196,036,416 29,338,982,324 9.82 7.40
Advances from customers 1,361,304,608 696,476,420 0.36 0.18
Taxes and other payables to the State Budget
15 4,374,516,943 7,178,602,006 1.16 1.81
Payable to employees – 49,990,730 – 0.01
Accrued expenses 16 62,558,453,332 17,327,357,021 16.52 4.37
Other payables 17 1,774,102,658 144,137,265 0.47 0.04
Long-term liabilities 1,718,570,076 1,343,533,834 0.45 0.34 Provision for severance allowances 1,718,570,076 1,343,533,834 0.45 0.34
OWNERS’ EQUITY 360,602,486,392 284,414,722,678 95.23 71.75
Capital and reserves 360,602,486,392 284,414,722,678 95.23 71.75
Owners’ capital 18,19 112,177,600,000 112,177,600,000 29.62 28.30
Share premium 19 112,213,880,000 112,213,880,000 29.63 28.31
Undistributed earnings 19 136,211,006,392 60,023,242,678 35.97 15.14
TOTAL RESOURCES 473,585,470,425 340,493,802,278 125.07 85.90
OFF BALANCE SHEET ITEMS
As at 31 December As at 31 December2012 2011 2012 2011
Rs. Crore Rs. Crore
USD 41,579 4,543 0.23 0.02
Tran Le Kim Loan Phan Quoc CongChief accountant General Director
The notes on pages 9 to 31 are an integral part of these fi nancial statements.
BALANCE SHEET As at 31 December 2012
Note: The exchange rate use to convert VND to Rs.<0.00259>/(Previous year VND to Rs.<0.00244>)

360
I N T E R N AT I O N A L C O N S U M E R P R O D U C T C O R P O R AT I O N
INCOME STATEMENTAs at 31 December 2012
Year ended 31 December Year ended 31 December2012 2011 2012 2011
RESOURCES Note VND VND Rs. Crore Rs. Crore
Sales 773,784,822,581 593,413,258,318 204.34 149.70
Less deductions (41,021,506,612) (43,091,599,645) (10.83) (10.87)
Net sales 20 732,763,315,969 550,321,658,673 199.51 138.83
Cost of sales 21 (333,678,060,037) (286,039,336,393) (88.12) (72.16)
Gross profi t 399,085,255,932 264,282,322,280 105.39 66.67
Financial income 22 12,797,229,377 2,508,892,157 3.38 0.63
Financial expenses 23 (81,911,528) (809,707,922) (0.02) (0.20)
Selling expenses 24 (271,616,381,024) (174,514,523,264) (71.73) (44.02)
General and administration expenses 25 (51,005,274,621) (38,010,391,997) (13.47) (9.59)
Operating profi t 89,178,918,136 53,456,591,254 23.55 13.49
Other income 269,518,637 298,342,235 0.07 0.08
Other expenses (88,523,669) (172,936,391) (0.02) (0.04)
Net other income 26 180,994,968 125,405,844 0.05 0.03
Net accounting profi t before tax 89,359,913,104 53,581,997,098 23.60 13.52
Business income tax - current 29 (12,466,585,427) (7,423,621,196) (3.29) (1.87)Business income tax - deferred 28, 29 (705,563,963) 1,495,239,428 (0.19) 0.38
Net profi t after tax 76,187,763,714 47,653,615,330 20.12 12.02
Tran Le Kim Loan Phan Quoc CongChief accountant General Director
The notes on pages 9 to 31 are an integral part of these fi nancial statements.
Note: The exchange rate use to convert VND to Rs.<0.00259>/(Previous year VND to Rs.<0.00244>)

361
I N T E R N AT I O N A L C O N S U M E R P R O D U C T C O R P O R AT I O N
CASH FLOW STATEMENT (INDIRECT METHOD) As at 31 December 2012
Year ended 31 December Year ended 31 December2012 2011 2012 2011
RESOURCES Note VND VND Rs. Crore Rs. Crore CASH FLOWS FROM OPERATING ACTIVITIESNet profi t before tax 89,359,913,104 53,581,997,098 23.60 13.52 Adjustments for:
Depreciation and amortisation 6,701,972,434 7,159,082,880 1.77 1.81 Provisions 2,212,198,902 1,411,298,859 0.58 0.36 Unrealised foreign exchange
losses/(gains)
82,882 (18,317,743) 0.01 ( 0.01)
Gains from investing activities (12,604,261,050) (2,467,460,283) (3.33) (0.62) Interest expense 7,095,890 69,093,274 0.01 0.02
Operating profi t/(loss) before changes in working capital 85,677,002,162 59,735,694,085 22.63 15.07 Decrease/(increase) in receivables 7,712,743,689 (17,671,855,659) 2.04 (4.46) Increase in inventories (6,649,951,530) (11,674,496,517) (1.76) (2.95) Increase in payables 52,607,026,668 16,393,847,856 13.89 4.14 Decrease in prepaid expenses 1,612,847,041 287,111,921 0.43 0.07 Interest paid (7,095,890) (69,093,274) 0.01 (0.02) Business income tax paid (14,430,692,151) (6,108,710,597) (3.81) (1.54) Other receipts from operating activities 2,518,362,073 – 0.67 – Other payments on operating activities 374,953,360 (123,392,018) 0.08 (0.03) Net cash infl ows from operating activities 129,415,195,422 40,769,105,797 34.18 10.28
CASH FLOWS FROM INVESTING ACTIVITIESPurchases of fi xed assets (5,517,465,277) (15,948,907,980) (1.46) (4.02) Proceeds from disposals of fi xed
assets
5,029,517 67,513,808 0.01 0.02
Investments in term deposit at banks (110,600,000,000) (10,000,000,000) (29.21) (2.52) Investments in other entities (2,443,950,000) (4,988,865,000) (0.65) (1.26)Dividends and interest
received
10,659,984,013 2,193,865,419 2.82 0.55
Net cash outfl ows from investing activities
(107,896,401,747) (28,676,393,753) (28.49) (7.23)
CASH FLOWS FROM FINANCING ACTIVITIESProceeds from borrowings 4,000,000,000 – 1.06 – Net cash outfl ows from fi nancing activities
134,000,000,000 – 1.06 –
Net increase in cash and cash equivalents 25,518,793,675 12,092,712,044 6.74 3.05
Cash and cash equivalents at beginning of year
3 50,353,360,852 38,241,076,815 13.30 9.64
Effect of foreign exchange differences – 19,571,993 – 0.01
Cash and cash equivalents at end of year
375,872,154,527 50,353,360,852 20.04 12.70
Tran Le Kim Loan Phan Quoc CongChief accountant General Director
The notes on pages 9 to 31 are an integral part of these fi nancial statements.
Note: The exchange rate use to convert VND to Rs.<0.00259>/(Previous year VND to Rs.<0.00244>)

362
I N T E R N AT I O N A L C O N S U M E R P R O D U C T C O R P O R AT I O N
NOTES TO THE FINANCIAL STATEMENTS For the year ended 31 december 2012
1 GENERAL INFORMATION
International Consumer Products Corporation (“the Company”) was established in SR Vietnam pursuant to Business Registration Certifi cate No. 4602001139 issued by the Department of Planning and Investment of Binh Duong Province on 13 July 2004 and the following amended Business Registration Certifi cates:
Amended Business Registration Certifi cate No. Date4603000346 – 1st amendment 9-May-07
4603000346 – 2nd amendment 5-Oct-07
4603000346 – 3rd amendment 13-Nov-07
4603000346 – 4th amendment 25-Mar-08
4603000346 – 5th amendment 4-Jul-08
3700579324 – 6th amendment 28-Dec-09
3700579324 – 7th amendment 7-Apr-10
Investment Certifi cate No. Date
462035000802 11-Feb-11
462035000802 – 1st amendment 29-Sep-11
The principal activities of the Group, through the Company and its subsidiaries, are producing and trading in cosmetics, cosmetic materials and food products.
As at 31 December 2012, the Company had 389 employees (2011: 380 employees).
2 ACCOUNTING SYSTEM AND ACCOUNTING POLICIES
2.1 Basis of preparation of fi nancial statements
The fi nancial statements have been prepared in accordance with Vietnamese Accounting Standards, the Vietnamese Accounting System and applicable regulations in SR Vietnam. The fi nancial statements have been prepared under the historical cost convention.
The accompanying fi nancial statements are not intended to present the fi nancial position and results of operations and cash fl ows in accordance with accounting principles and practices generally accepted in countries and jurisdictions other than SR Vietnam. The accounting principles and practices utilised in SR Vietnam may differ from those generally accepted in countries and jurisdictions other than SR Vietnam.
2.2 Fiscal year
The Company’s fi scal year is from 1 January to 31 December.
2.3 Currency
The fi nancial statements are measured in Vietnamese Dong and presented using Vietnamese Dong.
Transactions arising in foreign currencies are translated at exchange rates ruling at the transaction dates. Foreign exchange differences arising from these transactions are recognised in the income statement.
Monetary assets and liabilities denominated in foreign currencies at the balance sheet date are translated at the rates of exchange ruling at the balance sheet date. Foreign exchange differences arising from these translations are recognised in the income statement.
2.4 Form of records applied
The Company uses accounting software to record its transactions.
2.5 Cash and cash equivalents
Cash and cash equivalents comprise cash on hand, cash at bank, cash in transit, demand deposits and other short-term investments with an original maturity of three months or less.

363
I N T E R N AT I O N A L C O N S U M E R P R O D U C T C O R P O R AT I O N
NOTES TO THE FINANCIAL STATEMENTS For the year ended 31 december 2012
2.6 Trade receivables
Trade receivables are carried at original invoice amount less an estimate made for doubtful receivables based on a review by the Board of Directors of all outstanding amounts at the year end. Bad debts are written off when identifi ed.
2.7 Inventories
Inventories are stated at the lower of cost and net realisable value. Cost is determined by the weighted average method and includes all costs of purchase, costs of conversion and other costs incurred in bringing the inventories to their present location and condition. In the case of manufactured products, cost includes all direct expenditure and production overheads based on normal levels of operating activity. Net realisable value is the estimated selling price in the normal course of business, less the estimated costs of completion and selling expenses. Provision is made, where necessary, for obsolete, slow-moving and defective inventory items.
2.8 Investments
(a) Short-term investments
Short-term investments are investments with maturities less than 12 months from the balance sheet date and investments that are held with the intention to dispose within 12 months from the balance sheet date. Short-term investments are initially accounted for at cost. Provision for diminution is recognised for short term equity securities where the cost exceeds the fair value of such securities.
(b) Investments in subsidiaries
Investments in subsidiaries are accounted for at cost less provision for diminution in value.
2.9 Fixed assets
Tangible and intangible fi xed assets
Fixed assets are stated at historical cost less accumulated depreciation. Historical cost includes expenditure that is directly attributable to the acquisition of the fi xed assets.
Depreciation
Fixed assets are depreciated using the straight-line method so as to write off the cost of the assets over their estimated useful lives. The principal annual rates used are:
Buildings 25 years
Machinery 5 - 7 years
Motor vehicles 4 years
Offi ce equipment 4 - 5 years
Patent/Copyright 4 years
Software 3 - 6 years
Other intangible fi xed assets 4 years
Disposals
Gains and losses on disposals are determined by comparing net disposal proceeds with the carrying amount and are recognised as income or expense in the income statement.

364
I N T E R N AT I O N A L C O N S U M E R P R O D U C T C O R P O R AT I O N
NOTES TO THE FINANCIAL STATEMENTS For the year ended 31 december 2012
2.10 Investment properties
Investment properties are stated at historical cost less accumulated depreciation. Historical cost includes expenditure that is directly attributable to the acquisition of the investment properties.
Disposals
Investment properties are depreciated on the straight-line method to write off the cost of the assets over their estimated useful lives. The principal annual rates used are:
Land use rights 41 years
Disposals
Gains or losses on disposals are determined by comparing net disposal proceeds with the net book value and are recognised as income or expense in the income statement.
2.11 Revenue recognition
(a) Sales of goods
Revenue from the sale of goods is recognised in the income statement when the signifi cant risks and rewards of ownership have been transferred to the buyer. No revenue is recognised if there are signifi cant uncertainties regarding recovery of the consideration due or the possible return of goods.
(b) Interest income
Interest income is recognised on an earned basis.
2.12 Current and deferred income tax
Income taxes include all income taxes which are based on taxable profi ts including profi ts generated from production and trading activities in other countries that the Socialist Republic of Vietnam has not signed any double tax relief agreement. Income tax expense comprises current tax expense and deferred tax expense.
Current income tax is the amount of income taxes payable or recoverable in respect of the current year taxable profi t and the current tax rates. Current and deferred tax should be recognized as income or an expense and included in profi t or loss for the period, except to the extent that the tax arises from a transaction or event which is recognized, in the same or a different period, directly in equity.
Deferred income tax is provided in full, using the liability method, on temporary differences arising between the tax bases of assets and liabilities and their carrying amounts in the fi nancial statements. Deferred income tax is not accounted for if it arises from initial recognition of an asset or liability in a transaction other than a business combination that at the time of occurrence affects neither the accounting nor the taxable profi t or loss. Deferred income tax is determined at the tax rates that are expected to apply to the fi nancial year when the asset is realised or the liability is settled, based on tax rates that have been enacted or substantively enacted by the balance sheet date. Deferred income tax assets are recognised to the extent that it is probable that future taxable profi t will be available against which the temporary differences can be utilised.
2.13 Dividend distribution
Dividend distribution to the Company’s shareholders is recognised as a liability in the Company’s fi nancial statements in the period in which the dividends are approved by the Company’s Shareholders.
2.14 Related parties
Enterprises and individuals that directly, or indirectly through one or more intermediaries, control, or are controlled by, or are under common control with, the Company, including holding companies, subsidiaries and fellow subsidiaries are related parties of the Company. Associates and individuals owning, directly or indirectly, an interest in the

365
I N T E R N AT I O N A L C O N S U M E R P R O D U C T C O R P O R AT I O N
NOTES TO THE FINANCIAL STATEMENTS For the year ended 31 december 2012
voting power of the Company that gives them signifi cant infl uence over the enterprise, key management personnel, including directors and offi cers of the Company and close members of the family of these individuals and companies associated with these individuals also constitute related parties.
In considering each possible related party relationship, attention is directed to the substance of the relationship, and not merely the legal form.
2.15 Provisions
Provisions are recognised when: the Company has a present legal or constructive obligation as a result of past events; it is probable that an outfl ow of resources will be required to settle the obligation; and the amount has been reliably estimated. Provisions are not recognised for future operating losses.
Provisions are measured at the expenditures expected to be required to settle the obligation. If the time value of money is material, provisions will be measured at their present value using a pre-tax rate that refl ects current market assessments of the time value of money and the risks specifi c to the obligation. The increase in the provision due to passage of time is recognised as interest expenses.
2.16 Provision for severance allowances
In accordance with Vietnamese labour laws, employees of the Company are entitled to a severance allowance based on their years of service. This will be paid as a lump sum when the employee leaves the Company. A provision for severance allowance is made for the estimated liability for employment termination as a result of services rendered by employees. Pursuant to Law on Social Insurance, effective from 1 January 2009, the Company is required to contribute to an unemployment insurance fund managed by the Vietnam Social Insurance Agency.
With the implementation of the unemployment scheme, the Company is no longer required to provide for the service period after 1 January 2009. However, provision for severance allowance as of 31 December 2012 is determined based on the employees’ number of years of service up to 31 December 2008 and their average salary for the six-month period prior to the balance sheet date.
2.17 Share capital
Ordinary shares in issue are classifi ed as equity. Incremental costs directly attributable to the issuance of new shares or options are shown in equity as a deduction from the proceeds.
Where the Company purchase the Company’s equity share capital (treasury shares), the consideration paid, including directly attributable incremental costs, is deducted from equity attributable to the Company’s equity holders until the shares are cancelled or reissued. Where such shares are subsequently sold or reissued, any consideration received less any directly attributable incremental transaction costs is included in equity attributable to the Company’s equity holders.
3 CASH AND CASH EQUIVALENTS
2012 2011 2012 2011
VND VND Rs. Crore Rs. Crore
Cash on hand 151,329,314 246,062,581 0.04 0.06
Cash at bank 9,520,825,213 19,107,298,271 2.51 4.82
Cash equivalents (*) 66,200,000,000 31,000,000,000 17.48 7.82
75,872,154,527 50,353,360,852 20.04 12.70
(*) Cash equivalents comprise short-term bank deposits with maturity of within 3 months, which are easily convertible and subject to least liquidity risks at short-term deposit rate of 9-11.8% per annum.

366
I N T E R N AT I O N A L C O N S U M E R P R O D U C T C O R P O R AT I O N
NOTES TO THE FINANCIAL STATEMENTS For the year ended 31 december 2012
4 SHORT-TERM INVESTMENT
As at 31 December 2012, short-term investment represents the bank deposits with maturity within one year and earns an interest at 10.7-12.5% per annum.
5 TRADE ACCOUNTS RECEIVABLE
2012 2011 2012 2011
VND VND Rs. Crore Rs. Crore
Third parties 23,539,962,759 20,927,965,578 6.22 5.28
6 PREPAYMENTS TO SUPPLIERS
2012 2011 2012 2011
VND VND Rs. Crore Rs. Crore
Third parties 2,241,721,526 3,419,438,006 0.59 0.86
Related parties (Note 31(b)) 13,697,446,375 22,349,011,145 3.62 5.64
15,939,167,901 25,768,449,151 4.21 6.50
7 OTHER RECEIVABLES
2012 2011 2012 2011
VND VND Rs. Crore Rs. Crore
Others 2,331,022,744 705,900,309 0.62 0.18
Related parties (Note 31(b)) 3,000,000,000 3,000,000,000 0.79 0.76
5,331,022,744 3,705,900,309 1.41 0.93
8 INVENTORIES
2012 2011 2012 2011
VND VND Rs. Crore Rs. Crore
Goods in transit 3,122,350,430 – 0.82 –
Raw materials 17,743,826,142 18,995,435,581 4.69 4.79
Tools 16,430,091,429 13,347,572,419 4.34 3.37
Work in progress 671,675,893 801,459,918 0.18 0.20
Finished goods 29,513,555,072 28,845,524,963 7.79 7.28
Merchandises 9,315,199,284 8,156,753,839 2.46 2.06
76,796,698,250 70,146,746,720 20.28 17.70
Provision for decline in value of inventory (3,783,604,658) (1,571,405,756) (1.00) (0.40)
73,013,093,592 68,575,340,964 19.28 17.30
Movements in the provision for inventories during the year were as follows:
2012 2011 2012 2011
VND VND Rs. Crore Rs. Crore
Opening balance (1,571,405,756) (160,106,897) (0.41) (0.04)
Increase (2,562,921,585) (1,411,298,859) (0.68) (0.36)
Reversal 350,722,683 _ 0.09 –
Closing balance (3,783,604,658) (1,571,405,756) (1.00) (0.40)

367
I N T E R N AT I O N A L C O N S U M E R P R O D U C T C O R P O R AT I O N
NOTES TO THE FINANCIAL STATEMENTS For the year ended 31 december 2012
9 FIXED ASSETS
(a) Tangible fi xed assets
Buildings Machinery Motor vehicles
Offi ce equipment
Total
VND VND VND VND VNDHistorical costAt 1 January 2012 4,835,166,682 21,127,394,753 3,378,524,601 2,661,270,860 32,002,356,896New purchases – 856,511,261 133,334,400 333,233,919 1,323,079,580Disposals – (136,891,836) (16,730,476) (167,562,384) (321,184,696)At 31 December 2012 4,835,166,682 21,847,014,178 3,495,128,525 2,826,942,395 33,004,251,780Accumulated depreciationAt 1 January 2012 (1,343,705,396) (14,482,876,764) (2,387,254,284) (1,598,520,472) (19,812,356,916)Charge for the year (207,718,539) (2,505,312,631) (639,191,996) (526,313,226) (3,878,536,392)Disposals – 87,421,661 16,730,469 135,839,932 239,992,062At 31 December 2012 (1,551,423,935) (16,900,767,734) (3,009,715,811) (1,988,993,766) (23,450,901,246)Net book valueAt 1 January 2012 3,491,461,286 6,644,517,989 991,270,317 1,062,750,388 12,189,999,980At 31 December 2012 3,283,742,747 4,946,246,444 485,412,714 837,948,629 9,553,350,534
Buildings Machinery Motor vehicles
Offi ce equipment
Total
Rs. Crore Rs. Crore Rs. Crore Rs. Crore Rs. CroreHistorical costAt 1 January 2012 1.28 5.58 0.89 0.70 8.45
New purchases – 0.23 0.04 0.09 0.35
Disposals – (0.04) – (0.04) (0.08)
At 31 December 2012 1.28 5.77 0.92 0.75 8.72 Accumulated depreciationAt 1 January 2012 (0.35) (3.82) (0.63) (0.42) (5.23)
Charge for the year (0.05) (0.66) (0.17) (0.14) (1.02)
Disposals – 0.02 – 0.04 0.06
At 31 December 2012 (0.41) (4.46) (0.79) (0.53) (6.19) Net book valueAt 1 January 2012 0.92 1.75 0.26 0.28 3.22 At 31 December 2012 0.87 1.31 0.13 0.22 2.52
2012 2011 2012 2011
VND VND Rs. Crore Rs. Crore
Cost of fully depreciated fi xed assets 12,830,944,930 6,286,302,610 3.39 1.59

368
I N T E R N AT I O N A L C O N S U M E R P R O D U C T C O R P O R AT I O N
NOTES TO THE FINANCIAL STATEMENTS For the year ended 31 december 2012
(b) Intangible fi xed assets
Copyright Computer software Others Total
VND VND VND VNDHistorical costAt 1 January 2012 179,493,840 8,367,970,834 1,981,256,689 10,528,721,363
New purchases – – 2,840,131,776 2,840,131,776
Transfer from construction in progress (Note 9(c))
– 595,614,424 – 595,614,424
At 31 December 2012 179,493,840 8,963,585,258 4,821,388,465 13,964,467,563Accumulated amortisation
At 1 January 2012 (179,493,840) (6,651,604,783) (1,502,680,459) (8,333,779,082)
Charge for the year – (1,721,863,866) (655,438,081) (2,377,301,947)
At 31 December 2012 (179,493,840) (8,373,468,649) (2,158,118,540) (10,711,081,029)Net book valueAt 1 January 2012 – 1,716,366,051 478,576,230 2,194,942,281
At 31 December 2012 – 590,116,609 2,663,269,925 3,253,386,534
Copyright Computer software Others TotalRs. Crore Rs. Crore Rs. Crore Rs. Crore
Historical costAt 1 January 2012 0.05 2.21 0.52 2.78
New purchases – – 0.75 0.75
Transfer from construction in progress (Note 9(c))
– 0.16 – 0.16
At 31 December 2012 0.05 2.37 1.27 3.69 Accumulated amortisation
At 1 January 2012 (0.05 ) (1.76) (0.40 ) (2.20)
Charge for the year – (0.45) (0.17 ) (0.63)
At 31 December 2012 (0.05 ) (2.21) (0.57) (2.83) Net book valueAt 1 January 2012 – 0.45 0.13 0.58
At 31 December 2012 – 0.16 0.70 0.86
2012 2011 2012 2011
VND VND Rs. Crore Rs. Crore
Cost of fully amortised fi xed assets 8,475,397,580 1,672,405,091 2.24 0.42
(c) Construction in progress
2012 2011 2012 2011
VND VND Rs. Crore Rs. Crore
Beginning of year – 11,975,203,864 – 3.02
Additions 1,354,253,921 14,477,761,379 0.36 3.65
Transfers to intangible fi xed assets (Note 9(b)) (595,614,424) – (0.16) –
Transfers to tangible fi xed assets – (2,609,576,591) – (0.66)
Transfers to investment property – (23,843,388,652) – (6.01)
End of year 758,639,497 – 0.20 –

369
I N T E R N AT I O N A L C O N S U M E R P R O D U C T C O R P O R AT I O N
NOTES TO THE FINANCIAL STATEMENTS For the year ended 31 december 2012
10 INVESTMENT PROPERTIES
This represents the acquisition cost of land use right at Lot B2-29, 39 Tan Dong Hiep Industrial Zone, Di An District, Binh Duong Province in accordance with the land lease contract No. 317/07/HDT.TDHB dated 25 August 2007.
The Company’s management has a plan to sell this land use right in the near future.
Land use right Land use right
VND Rs. Crore
Historical cost
At 1 January 2012 and 31 December 2012 23,843,388,652 6.30
Accumulated depreciation
At 1 January 2012 – –
Charge for the year 446,134,095 0.12
At 31 December 2012 446,134,095 0.12
Net book value
At 1 January 2012 23,843,388,652 6.30
At 31 December 2012 23,397,254,557 6.18
11 INVESTMENTS IN SUBSIDIARIES
2012 2011 2012 2011
VND VND Rs. Crore Rs. Crore
Thuan Phat Foodstuff Joint Stock Company 96,387,001,308 93,943,051,308 25.45 23.70
Beauté Cosmétique Societé Par Actions 19,800,000,000 19,800,000,000 5.23 4.99
116,187,001,308 113,743,051,308 30.68 28.69
Details of the Company’s subsidiaries as at 31 December 2012 are as follows:
Name of subsidiaries Interest Cost of investment
Cost of investment
No. of shares
Business
% VND Rs. CroreBeauté Cosmétique Societé Par Actions (i)
99.00% 19,800,000,000 5.23 1,980,000 Cosmetics and cosmetic materials
Thuan Phat Foodstuff Joint Stock Company (ii)
99.71% 96,387,001,308 25.45 3,130,752 Foodstuff
116,187,001,308 30.68
Details of the Company’s subsidiaries as at 31 December 2011 are as follows:
Name of subsidiaries Interest Cost of investment
Cost of investment
No. of shares
Business
% VND Rs. Crore
Beauté Cosmétique Societé Par Actions (i)
99.00% 19,800,000,000 5.23 1,980,000 C o s m e t i c s a n d cosmetic materials
Thuan Phat Foodstuff Joint Stock Company (ii)
96.20% 93,943,051,308 23.70 3,021,394 Foodstuff
113,743,051,308 28.69

370
I N T E R N AT I O N A L C O N S U M E R P R O D U C T C O R P O R AT I O N
NOTES TO THE FINANCIAL STATEMENTS For the year ended 31 december 2012
(i) Beauté Cosmétique Societé Par Actions (“BCS”), a shareholding company, was established in accordance with Business Registration Certifi cate No. 4103010586 issued by the Department of Planning and Investment of Ho Chi Minh City on 12 June, 2008.
As at 31 December 2011, Company holds a 99% equity share in this subsidiary.
(ii) Thuan Phat Foodstuff Joint Stock Company (“Thuan Phat”), a shareholding company, was established in accordance with Business Registration Certifi cate No. 41030067667 issued by the Department of Planning and Investment of Ho Chi Minh City on 18 May 2007. During the year, the Company has acquired further 3.51% ownership of Thuan Phat from non-controlling shareholders, thus ownership of the Company has increased from 96.2% to 99.71%.
As at 31 December 2012, Company holds a 99.71% (2011: 96.2%) equity share in this subsidiary.
12 LONG-TERM PREPAYMENTS
Details of long-term prepayments are presented as follows:
2012 2011 2012 2011
VND VND Rs. Crore Rs. Crore
Leasehold improvement at representative offi ce 503,062,452 1,710,412,332 0.13 0.43
Land rental 2,137,183,020 2,202,595,560 0.56 0.56
Others 748,616,184 1,188,987,771 0.20 0.30
3,388,861,656 5,101,995,663 0.89 1.29
Movement of long-term prepayments is as follows:
2012 2011 2012 2011
VND VND Rs. Crore Rs. Crore
Beginning of year 5,101,995,663 6,499,794,766 1.35 1.64
Additions 701,923,321 1,459,657,829 0.18 0.37
Amortisation for the year (2,415,057,328) (2,857,456,932) (0.64) (0.72)
End of year 3,388,861,656 5,101,995,663 0.89 1.29
13 SHORT-TERM BORROWINGS
Short-term borrowing represents the loan at Asia Commercial Bank at rate of 12.95% per annum. This borrowing has used the term deposit at the same bank as a pledge asset.
14 TRADE ACCOUNTS PAYABLE
2012 2011 2012 2011
VND VND Rs. Crore Rs. Crore
Third parties 37,120,634,418 29,338,982,324 9.80 7.40
Related parties (Note 31(b)) 75,401,998 – 0.02 –
37,196,036,416 29,338,982,324 9.82 7.40

371
I N T E R N AT I O N A L C O N S U M E R P R O D U C T C O R P O R AT I O N
NOTES TO THE FINANCIAL STATEMENTS For the year ended 31 december 2012
15 TAXES AND OTHER PAYABLES TO THE STATE BUDGET
2012 2011 2012 2011
VND VND Rs. Crore Rs. Crore
Business income tax – current 2,312,478,374 4,276,585,098 0.61 1.08
Value added tax 946,166,045 2,206,264,283 0.25 0.56
Personal income tax 1,030,623,520 695,752,625 0.28 0.18
Other tax obligations 85,249,004 – 0.02 –
4,374,516,943 7,178,602,006 1.16 1.81
16 ACCRUED EXPENSES
2012 2011 2012 2011
VND VND Rs. Crore Rs. Crore
Promotion expenses 30,408,658,389 8,311,464,705 8.03 2.10
Salary for outsource sale persons 8,623,747,515 5,306,210,284 2.28 1.34
Advertising expenses 4,894,784,688 1,422,557,247 1.29 0.36
Salary, bonus 12,936,831,801 – 3.42 –
Consultant fee 1,669,500,000 – 0.44 –
Transportation expenses 1,543,197,052 – 0.41 –
Others 2,481,733,887 2,287,124,785 0.65 0.57
62,558,453,332 17,327,357,021 16.52 4.37
17 OTHER PAYABLES
2012 2011 2012 2011
VND VND Rs. Crore Rs. Crore
Social insurance 873,226,339 74,983,112 0.23 0.02
Union fee 718,336,269 69,154,153 0.19 0.02
Other payables 182,540,050 – 0.05 –
1,774,102,658 144,137,265 0.47 0.04
18 OWNERS’ CAPITAL
(a) Number of shares
2012
Ordinary shares
(share)
2011
Ordinary shares
(share)
Number of shares registered 11,217,760 11,217,760
Number of shares issued 11,217,760 11,217,760
Number of existing shares in issue 11,217,760 11,217,760

372
I N T E R N AT I O N A L C O N S U M E R P R O D U C T C O R P O R AT I O N
NOTES TO THE FINANCIAL STATEMENTS For the year ended 31 december 2012
(b) Details of owners’ shareholding
2012Ordinary shares
(share) %
2011Ordinary shares
(share) %
Marico Limited 9,535,495 85 9,535,495 85
Phan Quoc Cong 1,497,571 13.35 1,497,571 13.35
Nguyen Yen Lam 184,694 1.65 184,694 1.65
11,217,760 100 11,217,760 100
(c) Movement of share capital
Number of share capital
Ordinary shares
Total Ordinary shares
Total
(share) VND VND Rs. Crore Rs. Crore
At 1st January 2011 and 31 December 2012
11,217,760 112,177,600,000 112,177,600,000 29.62 28.30
19 MOVEMENTS IN OWNERS’ EQUITY
Owners’
capital
Share
premium
Undistributed earnings
Total
VND VND VND VND
As at 1st January 2011 112,177,600,000 112,213,880,000 12,369,627,348 236,761,107,348
Profi t for the year – – 47,653,615,330 47,653,615,330
As at 31st December 2011 112,177,600,000 112,213,880,000 60,023,242,678 284,414,722,678
Profi t for the year – – 76,187,763,714 76,187,763,714
As at 31st December 2012 112,177,600,000 112,213,880,000 136,211,006,392 360,602,486,392
Owners’
capital
Share
premium
Undistributed earnings
Total
Rs. Crore Rs. Crore Rs. Crore Rs. Crore
As at 1st January 2011 28.30 28.31 3.12 59.73
Profi t for the year – – 12.02 12.02
As at 31st December 2011 28.30 28.31 15.14 71.75
Profi t for the year – – 20.12 20.12
As at 31 December 2012 29.62 29.63 35.97 95.22

373
I N T E R N AT I O N A L C O N S U M E R P R O D U C T C O R P O R AT I O N
NOTES TO THE FINANCIAL STATEMENTS For the year ended 31 december 2012
20 REVENUE
2012 2011 2012 2011
VND VND Rs. Crore Rs. Crore
Sales
Sales of goods 773,784,822,581 593,413,258,318 204.34 149.70
Sales deductions
Trade discounts (39,490,942,563) (29,672,713,339) (10.43) (7.49)
Sales returns (1,530,564,049) (13,418,886,306) (0.40 (3.39)
(41,021,506,612) (43,091,599,645) (10.83) (10.87)
732,763,315,969 550,321,658,673 193.51 138.83
21 COST OF SALES
2012 2011 2012 2011
VND VND Rs. Crore Rs. Crore
Cost of merchandises sold 91,712,127,355 86,722,612,411 24.22 21.88
Cost of fi nished goods sold 237,907,937,076 197,842,068,008 62.83 49.91
Inventory losses (330,876,139) (283,739,418) (0.09) (0.07)
Provision for decline in value of inventories (2,562,921,585) (1,571,405,756) (0.68) (0.40)
Other expenses 6,951,793,330 3,329,801,148 1.84 0.84
333,678,060,037 286,039,336,393 88.12 72.16
22 FINANCIAL INCOME
2012 2011 2012 2011
VND VND Rs. Crore Rs. Crore
Interest income from deposits and loans 12,680,424,167 2,458,522,953 3.35 0.62
Realised foreign exchange gains 116,805,210 32,051,461 0.03 0.01
Net unrealised foreign exchange gains – 18,317,743 – –
12,797,229,377 2,508,892,157 3.38 0.63
23 FINANCIAL EXPENSES
2012 2011 2012 2011
VND VND Rs. Crore Rs. Crore
Interest expense 7,095,890 69,093,274 0.01 0.02
Realised foreign exchange losses 74,732,756 740,614,648 0.02 0.18
Net unrealised foreign exchange losses 82,882 – (0.01) –
81,911,528 809,707,922 0.02 0.20

374
I N T E R N AT I O N A L C O N S U M E R P R O D U C T C O R P O R AT I O N
NOTES TO THE FINANCIAL STATEMENTS For the year ended 31 december 2012
24 SELLING EXPENSES
2012 2011 2012 2011
VND VND Rs. Crore Rs. Crore
Staff costs 105,616,099,781 73,692,025,230 27.89 18.59
Advertising expenses 55,681,830,083 35,785,140,104 14.70 9.03
Marketing support expenses 67,146,451,499 32,398,500,296 17.73 8.17
Marketing and research expenses 4,413,714,057 2,287,296,636 1.17 0.58
Depreciation expenses 61,591,625 146,873,147 0.02 0.04
Utilities 356,833,684 223,936,443 0.09 0.06
Rental fee 8,477,190,100 7,431,703,459 2.24 1.87
Transportation expenses 19,378,345,610 14,472,940,468 5.12 3.65
Travelling expenses 6,813,749,378 5,390,152,691 1.80 1.36
Others 3,670,575,207 2,685,954,790 0.97 0.67
271,616,381,024 174,514,523,264 71.73 44.02
25 GENERAL AND ADMINISTRATION EXPENSES
2012 2011 2012 2011
VND VND Rs. Crore Rs. Crore
Staff costs 24,410,834,486 15,979,423,939 6.45 4.03
Utilities 1,275,156,866 1,168,892,171 0.34 0.29
Depreciation expenses 3,491,184,340 3,698,576,357 0.92 0.93
Professional fee 4,654,276,929 2,558,287,680 1.23 0.65
Rental fee 6,783,051,343 6,929,076,887 1.79 1.75
Recruitment, training expenses 1,961,923,538 882,822,646 0.52 0.22
Meeting, conference 1,086,414,187 862,607,735 0.29 0.22
Travelling expenses 1,759,481,433 1,026,132,726 0.46 0.26
Others 5,582,951,499 4,904,571,856 1.47 1.24
51,005,274,621 38,010,391,997 13.47 9.59
26 NET OTHER INCOME
2012 2011 2012 2011
VND VND Rs. Crore Rs. Crore
Other incomeGains on disposal of fi xed assets 5,029,517 – 0.01 –
Others 264,489,120 298,342,235 0.06 0.08
269,518,637 298,342,235 0.07 0.08
Other expensesOthers (88,523,669) (172,936,391) (0.02) (0.05)
Net other income 180,994,968 125,405,844 0.05 0.03

375
I N T E R N AT I O N A L C O N S U M E R P R O D U C T C O R P O R AT I O N
NOTES TO THE FINANCIAL STATEMENTS For the year ended 31 december 2012
27 COST OF GOODS MANUFACTURED BY FACTORY
2012 2011 2012 2011
VND VND Rs. Crore Rs. Crore
Raw materials 304,835,036,335 262,508,873,552 80.50 66.22
Labour costs 147,841,258,417 60,678,408,755 39.04 15.31
Depreciation expense 6,255,838,339 7,159,082,880 1.65 1.81
Outside service expenses 160,870,789,565 165,715,193,168 42.48 41.80
Other expenses 36,496,793,026 2,502,693,299 9.65 0.63
656,299,715,682 498,564,251,654 173.32 125.77
28 DEFERRED INCOME TAX
Deferred income tax assets and liabilities are offset when there is a legally enforceable right to offset current tax assets against current tax liabilities and when the deferred income taxes relate to the same taxation authority. The offset amounts are as follows:
2012 2011 2012 2011
VND VND Rs. Crore Rs. Crore
Deferred tax assets:
Deferred tax asset to be recovered after more than 12 months 128,892,756 100,765,038 0.03 0.03
Deferred tax asset to be recovered within 12 months 143,610,300 877,301,980 0.04 0.22
272,503,055 978,067,018 0.07 0.25
The gross movement in the deferred income tax, without taking into consideration the offsetting of balances within the same tax jurisdiction, is as follows:
2012 2011 2012 2011
VND VND Rs. Crore Rs. Crore
Beginning of year 978,067,018 -517,172,410 0.26 (0.13)
Income statement charge/(credit) (705,563,963) 1,495,239,428 (0.19) 0.38
End of year 272,503,055 978,067,018 0.07 0.25
The deferred income tax was mainly raising from the tax effect on the net amount of temporary difference between accounting base and tax base of provision for severance allowances and provision for decline in value of inventory.
29 TAXATION
For manufacturing activities, Company has the obligation to pay corporate income tax (“CIT”) at the rate of 15% of taxable profi ts for twelve years starting from its commercial operations and at the rate of 25% for the years thereafter. For trading activities and others, the Company pay CIT at the rate of 25%.
In accordance with the Offi cial Letter No. 3270/TCT-PCCS dated 1 September 2006 issued by the General Department of Tax, the Company is entitled to an exemption from CIT for three years commencing with the fi rst year of making profi ts, and a 50% reduction for the following seven years. The Company made its initial profi t in 2004.

376
I N T E R N AT I O N A L C O N S U M E R P R O D U C T C O R P O R AT I O N
NOTES TO THE FINANCIAL STATEMENTS For the year ended 31 december 2012
2012 2011 2012 2011
VND VND Rs. Crore Rs. Crore
Net accounting profi t before tax 89,359,913,104 53,456,591,254 23.60 13.49
Tax calculated at a rate of 25% 3,238,812,454 486,003,454 0.86 0.12
Tax calculated at a rate of 15% 11,460,699,494 7,745,697,492 3.03 1.95
Effect of:
Income not subject to tax (505,110,039) – (0.13) –
Expenses not deductible for tax purposes 8,708,856,520 4,535,644,245 2.30 1.14
Impact of tax reduction (9,731,109,039) (6,838,963,423) (2.57) (1.73)
Business income tax charge 13,172,149,390 5,928,381,768 3.48 1.50
Charged/(credited) to income statement:
Business income tax – current 12,466,585,427 7,423,621,196 3.29 1.87
Business income tax – deferred (Note 28) 705,563,963 (1,495,239,428) 0.19 (0.38)
13,172,149,390 5,928,381,768 3.48 1.50
The business income tax charge for the year is based on estimated taxable income and is subject to review and possible adjustment by the tax authorities.
30 FINANCIAL RISK MANAGEMENT
The Company’s activities expose it to market risk (including currency risk and interest rate risk), credit risk and liquidity risk. The Company’s overall risk management strategy seeks to minimise adverse effect of these risks on the Company’s fi nancial performance.
(1) Market risk
(a) Currency risk
The Company’s business is exposed to foreign currency risk arising from various currency exposures, primarily United States Dollar (“US$”).
The Company ensures that the net exposure to this risk is kept to an acceptable level by buying or selling foreign currencies at spot rates where necessary to address short-term imbalances. The Company does not enter into currency hedging transactions since it considers that the cost of such instruments outweigh the potential risk of exchange rate fl uctuations.
The Company’s currency exposure to the US$ is as follows:
2012 2011US$ Equivalent to VND Rs. Crore US$ Equivalent to VND Rs. Crore
Financial assetsCash and bank deposits 41,579 868,077,763 0.23 4,543 95,448,650 0.02
Prepayments to suppliers 13,440 280,492,800 0.07 30,975 651,125,475 0.16
55,019 1,148,570,563 0.30 35,518 746,574,125 0.19
Financial liabilities
Trade and other payables (227,128) (4,729,844,210) (1.25) (50,170) (1,054,121,870) (0.27)
Currency exposure (172,109) (3,581,273,647) (0.95) (14,652) (307,547,745) (0.08)
At 31 December 2012, if the VND had strengthened/weakened by 10% against the US$ with all other variables being held constant, the Company’s profi t before tax profi t for the year would have been VND268,595,524 (2011: VND23,066,081) lower/higher as a result of foreign exchange losses/gains on translation of US$-denominated fi nancial instruments etc.

377
I N T E R N AT I O N A L C O N S U M E R P R O D U C T C O R P O R AT I O N
NOTES TO THE FINANCIAL STATEMENTS For the year ended 31 december 2012
(b) Interest rate risk
The Company is not exposed to signifi cant interest rate risk as all the Company’s borrowings are on fi xed rates.
(2) Credit risk
Credit risk is the risk of fi nancial loss to the Company if a customer or counterparty to a fi nancial instrument fails to meet its contractual obligations. The Company adopts the policy of dealing with customers of appropriate credit history to mitigate credit risk.
(3) Liquidity risk
The table below analyses the Company’s non-derivative fi nancial liabilities into relevant maturity groupings based on the remaining period from the balance sheet date to the contractual maturity date. The amounts disclosed in the table are the contractual undiscounted cash fl ows.
Less than 1 year
2012 2011 2012 2011
VND VND Rs. Crore Rs. Crore
Short-term borrowings 4,000,000,000 – 1.06 –
Trade and other payables 37,196,036,416 29,338,982,324 9.82 7.40
Advance from suppliers 1,361,304,608 696,476,420 0.36 0.18
42,557,341,024 30,035,458,744 11.24 7.58
The Company did not have derivative fi nancial liabilities as at 31 December 2011 and 31 December 2012.
31 RELATED PARTY TRANSACTIONS
The Company is controlled by Marico Group which owns 85% of the Company’s legal capital. The ultimate parent of the Company is Marico Limited, a company incorporated in India.
(a) Related party transactions
During the year, the following transactions were carried out with related parties:
i) Sales of goods and services
2012 2011 2012 2011
VND VND Rs. Crore Rs. Crore
Subsidiaries 1,991,326,725 2,659,087,957 0.53 0.67
Fellow group subsidiaries 9,859,159,140 – 2.60 –
11,850,485,865 2,659,087,957 3.13 0.67
ii) Purchases of goods and services
2012 2011 2012 2011
VND VND Rs. Crore Rs. Crore
Subsidiaries 95,544,963,465 89,109,065,579 25.23 22.48
iii) Sales of fi xed assets
2012 2011 2012 2011
VND VND Rs. Crore Rs. Crore
Subsidiaries – 45,454,545 – 0.01

378
I N T E R N AT I O N A L C O N S U M E R P R O D U C T C O R P O R AT I O N
NOTES TO THE FINANCIAL STATEMENTS For the year ended 31 december 2012
iv) Compensation of key management
2012 2011 2012 2011
VND VND Rs. Crore Rs. Crore
Gross salaries and other benefi ts 22,087,349,359 8,539,000,000 5.83 2.15
v) Financing activities
2012 2011 2012 2011
VND VND Rs. Crore Rs. Crore
Subsidiaries (*) – 3,000,000,000 – 0.76
(*) The Company provided an non-interest bearing borrowing to an subsidiary in order to support the working capital in the year.
(b) Year end balances with related parties
2012 2011 2012 2011
VND VND Rs. Crore Rs. Crore
Advance to suppliers (Note 6)
Subsidiaries 13,697,446,375 22,349,011,145 3.62 5.64
Other receivables (Note 7)
Subsidiaries 3,000,000,000 3,000,000,000 0.79 0.76
Trade accounts payable (Note 14)
Subsidiaries 75,401,998 – 0.02 –
32 COMMITMENTS UNDER OPERATING LEASES
The future minimum lease payments under non-cancellable operating leases are as follows:
Property Property
2012 2011 2012 2011
VND VND Rs. Crore Rs. Crore
Within 1 year 2,993,652,267 2,727,954,944 0.79 0.69
Between 1 and 5 years 4,272,239,360 7,997,045,760 1.13 2.02
Total minimum payments 7,265,891,627 10,725,000,704 1.92 2.71
The fi nancial statements were approved by the Board of Directors on 11 March 2013.

379
BEAUTÉ COSMÉTIQUE SOCIETÉ PAR ACTIONS
379
Business Registration Certifi cate No. 4102033640 dated 4 October 2005, was issued by the Department of Planning and Investment of Ho Chi Minh City.
Board of Directors Saugata Gupta
Ashutosh Telang
Chaitanya J. Deshpande
Nikhil p. Narkhede
Le Quang Hanh
Phan Quoc Cong
Registered Offi ce 8th fl oor, 39 B Hai Au Building, Truong Son Street, Ward 4, Tan Binh District, Ho Chi Minh City, Vietnam
Legal representative Pham Thi My Hanh
Auditors PricewaterhouseCoopers (Vietnam) Limited

380
BEAUTÉ COSMÉTIQUE SOCIETÉ PAR ACTIONS
380
The Board of Directors of the Company is responsible for fi nancial statements which give a true and fair view of the fi nancial position of the Company as at 31 December 2012 and the results of its operations and cash fl ows for the year then ended. In preparing these fi nancial statements, the Board of Directors is required to:
• select suitable accounting policies and then apply them consistently;
• make judgments and estimates that are reasonable and prudent; and
• prepare the fi nancial statements on a going concern basis unless it is inappropriate to presume that the Company will continue in business.
The Board of Directors is responsible for ensuring that proper accounting records are kept which disclose, with reasonable accuracy at any time, the fi nancial position of the Company and which enable fi nancial statements to be prepared which comply with the basis of accounting set out in Note 2 to the fi nancial statements. The Board of Directors is also responsible for safeguarding the assets of the Company and hence for taking reasonable steps for the prevention and detection of fraud and other irregularities.
APPROVAL OF THE FINANCIAL STATEMENTS
We hereby approve the accompanying fi nancial statements as set out on pages 5 to 25 which give a true and fair view of the fi nancial position of the Company as at 31 December 2012 and of the results of its operations and cash fl ows for the year then ended in accordance with Vietnamese Accounting Standards, the Vietnamese Accounting System and applicable regulations in SR Vietnam.
On behalf of the Board of Directors
Pham Thi My Hanh General Director
Ho Chi Minh City, SR Vietnam11 March 2013
STATEMENT OF THE RESPONSIBILITY OF THE BOARD OF DIRECTORS’OF THE COMPANY IN RESPECT OF THE FINANCIAL STATEMENTS

381
BEAUTÉ COSMÉTIQUE SOCIETÉ PAR ACTIONS
381
INDEPENDENT AUDITORS’ REPORT
TO THE SHAREHOLDERS OF BEAUTÉ COSMÉTIQUE SOCIETÉ PAR ACTIONS
We have audited the accompanying fi nancial statements of Beauté Cosmétique Societé Par Actions (“the Company”) which were approved by the Board of Directors on 11 March 2013. The fi nancial statements comprise the balance sheet as at 31 December 2012, the income statement and cash fl ow statement for the year then ended, and explanatory notes to the fi nancial statements including signifi cant accounting policies, as set out on pages 5 to 25.
The Board of Directors’ Responsibility for the Financial Statements
Management of the Company is responsible for the preparation and fair presentation of these fi nancial statements in accordance with Vietnamese Accounting Standards, the Vietnamese Accounting System and applicable regulations in SR Vietnam. This responsibility includes: designing, implementing and maintaining internal controls relevant to the preparation and fair presentation of fi nancial statements that are free from material misstatement, whether due to fraud or error; selecting and applying appropriate accounting policies and making accounting estimates that are reasonable in the circumstances.
Auditor’s Responsibility
Our responsibility is to express an opinion on these fi nancial statements based on our audit. We conducted our audit in accordance with Vietnamese Standards on Auditing. Those standards require that we comply with ethical requirements and plan and perform the audit in order to obtain reasonable assurance as to whether the fi nancial statements are free from material misstatement.
An audit involves performing procedures to obtain audit evidence about the amounts and disclosures in the fi nancial statements. The procedures selected depend on the auditor’s judgment, including an assessment of the risks of material misstatement of the fi nancial statements, whether due to fraud or error. In making those risk assessments, the auditor considers internal controls relevant to the entity’s preparation and fair presentation of the fi nancial statements in order to design audit procedures that are appropriate in the circumstances, but not for the purpose of expressing an opinion on the effectiveness of the entity’s internal controls. An audit also includes evaluating the appropriateness of accounting policies used and the reasonableness of accounting estimates made by The Board of Directors, as well as evaluating the overall presentation of the fi nancial statements.
We believe that the audit evidence we have obtained is suffi cient and appropriate to provide a basis for our audit opinion.
Opinion
In our opinion, the fi nancial statements present fairly, in all material respects, the fi nancial position of the Company as at 31 December 2012, and its fi nancial performance and cash fl ows for the year then ended in accordance with Vietnamese Accounting Standards, the Vietnamese Accounting System and applicable regulations in SR Vietnam.
Dang Quoc Tuan Ngo Thi Nhat Giao
AC No. 0620/KTV AC No. 2415/KTV
Director
Authorised signatory
PricewaterhouseCoopers (Vietnam) Limited
Ho Chi Minh City, SR Vietnam
Audit report number HCM3414
11 March 2013
As indicated in Note 2.1 to the fi nancial statements, the accompanying fi nancial statements are not intended to present the fi nancial position and results of operations and cash fl ows in accordance with accounting principles and practices generally accepted in countries and jurisdictions other than SR Vietnam, and furthermore their utilisation is not designed for those who are not informed about SR Vietnam’s accounting principles, procedures and practices.

382
BEAUTÉ COSMÉTIQUE SOCIETÉ PAR ACTIONS
382
BALANCE SHEETas at 31 December 2012
ASSETS Notes As at 31 December As at 31 December
2012 2011 2012 2011VND VND Rs. Crore Rs. Crore
CURRENT ASSETS 38,874,769,590 39,024,716,913 10.27 9.84
Cash and cash equivalents 3 19,242,690,904 18,699,854,770 5.08 4.72
Cash 4,242,690,904 4,699,854,770 1.12 1.19
Cash equivalents 15,000,000,000 14,000,000,000 3.96 3.53
Accounts receivable 1,061,134,379 2,162,515,353 0.28 0.55
Trade accounts receivable 4 262,685,843 99,560,393 0.07 0.03
Prepayments to suppliers 159,948,343 1,560,930,034 0.04 0.39
Other receivables 5 638,500,193 502,024,926 0.17 0.13
Inventories 6 17,166,784,574 17,658,954,485 4.53 4.45
Inventories 17,413,451,221 17,658,954,485 4.60 4.45
Provision for decline in value of inventories
(246,666,647) – (0.07) –
Other current assets 1,404,159,733 503,392,305 0.37 0.13
Short-term prepayments 423,718,533 463,344,305 0.11 0.12
Other current assets 980,441,200 40,048,000 0.26 0.01
NON-CURRENT ASSETS 2,473,464,064 4,085,945,831 0.65 1.03
Fixed assets 427,665,609 418,439,238 0.11 0.11
Tangible fi xed assets 7(a) 338,493,623 193,413,601 0.09 0.05
Cost 1,361,674,336 1,101,933,726 0.36 0.28
Accumulated depreciation (1,023,180,713) (908,520,125) (0.27) (0.23)
Intangible fi xed assets 7(b) 89,171,986 225,025,637 0.02 0.06
Cost 509,396,314 509,396,314 0.13 0.13
Accumulated amortisation (420,224,328) (284,370,677) (0.11) (0.07)
Other long-term assets 2,045,798,455 3,667,506,593 0.54 0.93
Long-term prepayments 8 1,066,685,725 2,416,899,036 0.28 0.61
Deferred income tax assets 14 239,268,870 164,092,676 0.06 0.04
Other long-term assets 9 739,843,860 1,086,514,881 0.20 0.27
TOTAL ASSETS 41,348,233,654 43,110,662,744 10.91 10.89
Note: The exchange rate use to convert VND to Rs.<0.00259>/(Previous year VND to Rs.<0.00244>)

383
BEAUTÉ COSMÉTIQUE SOCIETÉ PAR ACTIONS
383
BALANCE SHEET (contd.)as at 31 December 2012
LIABILITIES Notes As at 31 December As at 31 December
2012 2011 2012 2011VND VND Rs. Crore Rs. Crore
Current liabilities 11,009,474,375 13,411,273,450 2.90 3.39 Short-term borrowings 10 3,000,000,000 3,000,000,000 0.79 0.76
Trade accounts payable 11 241,134,141 2,546,337,029 0.06 0.64 Advances from customers 246,135,477 782,711,604 0.06 0.20 Taxes and other payables to the State Budget
12 2,346,432,833 2,606,106,392 0.62 0.66
Payable to employees 2,229,338,286 3,695,653,823 0.59 0.93 Accrued expenses 13 2,946,433,638 780,464,602 0.78 0.20
Long-term liabilities 740,408,834 656,370,705 0.20 0.17 Other long-term payables 30,000,000 – 0.01 – Provision for severance allowances 710,408,834 656,370,705 0.19 0.17
OWNERS’ EQUITY 29,598,350,445 29,043,018,589 7.81 7.33
Capital and reserves 29,598,350,445 29,043,018,589 7.81 7.33 Owners’ capital 15,16 20,000,000,000 20,000,000,000 5.28 5.05 Differences upon asset revaluation – 27,292,841 – 0.01 Undistributed earnings 17 9,598,350,445 9,015,725,748 2.53 2.27
TOTAL RESOURCES 41,348,233,654 43,110,662,744 10.91 10.89
Off Balance Sheet Items
As at 31 December As at 31 December 2012 2011 2012 2011
Foreign currencies VND VND Rs. Crore Rs. Crore- United states dollar (US$) 985.32 1,165.98 0.01 0.01
Nguyen Van Chin Phan Thi My HanhChief Accountant General Director
11 March, 2013
The notes on pages 9 to 25 are an integral part of these fi nancial statements.
Note: The exchange rate use to convert VND to Rs.<0.00259>/(Previous year VND to Rs.<0.00244>)

384
BEAUTÉ COSMÉTIQUE SOCIETÉ PAR ACTIONS
384
INCOME STATEMENTfor the year ended 31 December 2012
Nguyen Van Chin Pham Thi My HanhChief Accountant General Director
Monday, March, 2013
Notes Year ended 31 December Year ended 31 December2012 2011 2012 2011
VND VND Rs. Crore Rs. Crore
Sales 85,176,325,046 97,537,357,560 22.49 24.61
Less deductions (4,368,641,591) (1,788,279,840) (1.15) (0.46)
Net sales 17 80,807,683,455 95,749,077,720 21.34 24.15
Cost of sales 18 (14,492,346,244) (19,968,448,601) (3.83) (5.03)
Gross profi t 66,315,337,211 75,780,629,119 17.51 19.12
Financial income 19 1,360,101,127 1,290,281,129 0.36 0.33
Financial expenses 20 (134,524,394) (382,848,925) (0.04) (0.10)
Selling expenses 21 (54,609,555,421) (57,320,649,388) (14.42) (14.46)
General and administration expenses 22 (11,968,550,803) (10,616,781,088) (3.16) (2.68)
Operating profi t 962,807,720 8,750,630,847 0.25 2.21
Other income 176,137,087 481,060,374 0.05 0.12
Other expenses (251,695,505 ) (68,156,171) (0.07) (0.02)
Net other (expenses)/income (75,558,418) 412,904,203 (0.02) 0.10
Net accounting profi t before tax 887,249,302 9,163,535,050 0.23 2.31
Business income tax - current 23 (379,800,799) (2,665,030,316) (0.10) (0.68)
Business income tax - deferred 23, 14 75,176,194 12,142,989 0.02 0.01
Net profi t after tax 582,624,697 6,510,647,723 0.15 1.64
Note: The exchange rate use to convert VND to Rs.<0.00259>/(Previous year VND to Rs.<0.00244>)

385
BEAUTÉ COSMÉTIQUE SOCIETÉ PAR ACTIONS
385
CASH FLOW STATEMENTFor the year ended 31 December 2012
ASSETS Notes Year ended 31 December Year ended 31 December
2012 2011 2012 2011VND VND Rs. Crore Rs. Crore
Net profi t before tax 887,249,302 9,163,535,050 0.23 2.31
Adjustments for:
Depreciation and amortisation 292,889,159 309,573,291 0.08 0.08
Provisions 246,666,647 – 0.07 –
Unrealised foreign exchange gains (36,712,000) (36,981,140) (0.01) (0.01)
Profi ts from investing activities (1,163,377,428) (472,174,922) (0.31) (0.12)
Operating profi t before changes in working capital
226,715,680 8,963,952,279 0.06 2.26
Decrease in receivables 1,101,380,974 4,766,499,307 0.29 1.20
Decrease/(increase) in inventories 245,503,264 (3,557,422,996) 0.06 (0.90)
(Decrease)/increase in payables (1,403,492,791) 4,229,119,790 (0.37) 1.07
Decrease in prepaid expenses 1,389,839,083 222,092,758 0.37 0.06
Business income tax paid (1,246,185,601) (3,034,208,836) (0.33) (0.77)
Other payments on operating activities (632,186,373) 27,292,841 (0.17) 0.01
Net cash (outflows)/inflows from operating activities
(318,425,764) 11,617,325,143 (0.08) 2.93
CASH FLOWS FROM INVESTING ACTIVITIES
Purchases of fi xed assets (302,115,530) (260,535,637) (0.08) (0.07)
Proceeds from disposals of fi xed assets 7,000,000 – 0.01 –
Interest received 1,156,377,428 412,286,033 0.31 0.10
Net cash inflows from investing activities
861,261,898 151,750,396 0.23 0.04
Net increase in cash and cash equivalents
542,836,134 11,769,075,539 0.14 2.97
Cash and cash equivalents at beginning of year
3 18,699,854,770 6,930,779,231 4.94 1.75
Cash and cash equivalents at end of year
3 19,242,690,904 18,699,854,770 5.08 4.72
Nguyen Van Chin Pham Thi My HanhChief Accountant General Director
Monday, March, 2013
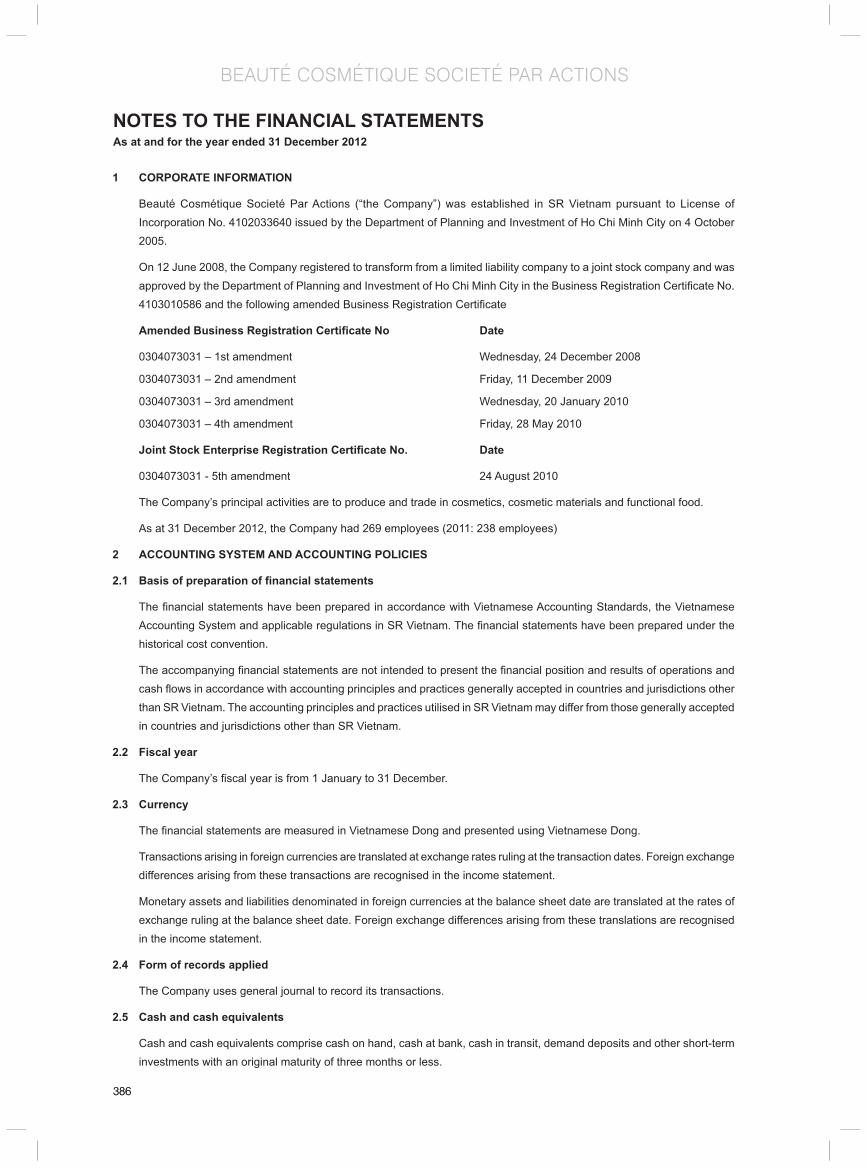
386
BEAUTÉ COSMÉTIQUE SOCIETÉ PAR ACTIONS
386
NOTES TO THE FINANCIAL STATEMENTSAs at and for the year ended 31 December 2012
1 CORPORATE INFORMATION
Beauté Cosmétique Societé Par Actions (“the Company”) was established in SR Vietnam pursuant to License of Incorporation No. 4102033640 issued by the Department of Planning and Investment of Ho Chi Minh City on 4 October 2005.
On 12 June 2008, the Company registered to transform from a limited liability company to a joint stock company and was approved by the Department of Planning and Investment of Ho Chi Minh City in the Business Registration Certifi cate No. 4103010586 and the following amended Business Registration Certifi cate
Amended Business Registration Certifi cate No Date
0304073031 – 1st amendment Wednesday, 24 December 2008
0304073031 – 2nd amendment Friday, 11 December 2009
0304073031 – 3rd amendment Wednesday, 20 January 2010
0304073031 – 4th amendment Friday, 28 May 2010
Joint Stock Enterprise Registration Certifi cate No. Date
0304073031 - 5th amendment 24 August 2010
The Company’s principal activities are to produce and trade in cosmetics, cosmetic materials and functional food.
As at 31 December 2012, the Company had 269 employees (2011: 238 employees)
2 ACCOUNTING SYSTEM AND ACCOUNTING POLICIES
2.1 Basis of preparation of fi nancial statements
The fi nancial statements have been prepared in accordance with Vietnamese Accounting Standards, the Vietnamese Accounting System and applicable regulations in SR Vietnam. The fi nancial statements have been prepared under the historical cost convention.
The accompanying fi nancial statements are not intended to present the fi nancial position and results of operations and cash fl ows in accordance with accounting principles and practices generally accepted in countries and jurisdictions other than SR Vietnam. The accounting principles and practices utilised in SR Vietnam may differ from those generally accepted in countries and jurisdictions other than SR Vietnam.
2.2 Fiscal year
The Company’s fi scal year is from 1 January to 31 December.
2.3 Currency
The fi nancial statements are measured in Vietnamese Dong and presented using Vietnamese Dong.
Transactions arising in foreign currencies are translated at exchange rates ruling at the transaction dates. Foreign exchange differences arising from these transactions are recognised in the income statement.
Monetary assets and liabilities denominated in foreign currencies at the balance sheet date are translated at the rates of exchange ruling at the balance sheet date. Foreign exchange differences arising from these translations are recognised in the income statement.
2.4 Form of records applied
The Company uses general journal to record its transactions.
2.5 Cash and cash equivalents
Cash and cash equivalents comprise cash on hand, cash at bank, cash in transit, demand deposits and other short-term investments with an original maturity of three months or less.

387
BEAUTÉ COSMÉTIQUE SOCIETÉ PAR ACTIONS
387
2.6 Trade receivables
Trade receivables are carried at original invoice amount less an estimate made for doubtful receivables based on a review by the Board of Directors of all outstanding amounts at the year end. Bad debts are written off when identifi ed.
2.7 Inventories
Inventories are stated at the lower of cost and net realisable value. Cost is determined by the weighted average method and includes all costs of purchase, costs of conversion and other costs incurred in bringing the inventories to their present location and condition. In the case of manufactured products, cost includes all direct expenditure and production overheads based on normal levels of operating activity. Net realisable value is the estimated selling price in the normal course of business, less the estimated costs of completion and selling expenses. Provision is made, where necessary, for obsolete, slow-moving and defective inventory items.
2.8 Fixed assets
Tangible and intangible fi xed assets
Fixed assets are stated at historical cost less accumulated depreciation. Historical cost includes expenditure that is directly attributable to the acquisition of the fi xed assets.
Depreciation
Fixed assets are depreciated using the straight-line method so as to write off the cost of the assets over their estimated useful lives. The principal annual rates used are:
Plant and machinery 3-5 years
Offi ce equipment 3-5 years
Computer software 3 years
Disposals
Gains and losses on disposals are determined by comparing net disposal proceeds with the carrying amount and are recognised as income or expense in the income statement.
2.9 Revenue recognition
(a) Sales of goods
Revenue from the sale of goods is recognised in the income statement when the signifi cant risks and rewards of ownership have been transferred to the buyer. No revenue is recognised if there are signifi cant uncertainties regarding recovery of the consideration due or the possible return of goods.
(b) Interest income
Interest income is recognised on an earned basis.
2.10 Current and deferred income tax
Income taxes include all income taxes which are based on taxable profi ts including profi ts generated from production and trading activities in other countries that the Socialist Republic of Vietnam has not signed any double tax relief agreement. Income tax expense comprises current tax expense and deferred tax expense.
Current income tax is the amount of income taxes payable or recoverable in respect of the current year taxable profi t and the current tax rates. Current and deferred tax should be recognized as income or an expense and included in profi t or loss for the period, except to the extent that the tax arises from a transaction or event which is recognized, in the same or a different period, directly in equity.
Deferred income tax is provided in full, using the liability method, on temporary differences arising between the tax bases
NOTES TO THE FINANCIAL STATEMENTSAs at and for the year ended 31 December 2012

388
BEAUTÉ COSMÉTIQUE SOCIETÉ PAR ACTIONS
388
of assets and liabilities and their carrying amounts in the fi nancial statements. Deferred income tax is not accounted for if it arises from initial recognition of an asset or liability in a transaction other than a business combination that at the time of occurrence affects neither the accounting nor the taxable profi t or loss. Deferred income tax is determined at the tax rates that are expected to apply to the fi nancial year when the asset is realised or the liability is settled, based on tax rates that have been enacted or substantively enacted by the balance sheet date.
Deferred income tax assets are recognised to the extent that it is probable that future taxable profi t will be available against which the temporary differences can be utilised.
2.11 Dividend distribution
Dividend distribution to the Company’s shareholders is recognised as a liability in the Company’s fi nancial statements in the period in which the dividends are approved by the Company’s shareholders.
2.12 Related parties
Enterprises and individuals that directly, or indirectly through one or more intermediaries, control, or are controlled by, or are under common control with, the Company, including holding companies, subsidiaries and fellow subsidiaries are related parties of the Company. Associates and individuals owning, directly or indirectly, an interest in the voting power of the Company that gives them signifi cant infl uence over the enterprise, key management personnel, including directors and offi cers of the Company and close members of the family of these individuals and companies associated with these individuals also constitute related parties.
In considering each possible related party relationship, attention is directed to the substance of the relationship, and not merely the legal form.
2.13 Provisions
Provisions are recognised when: the Company has a present legal or constructive obligation as a result of past events; it is probable that an outfl ow of resources will be required to settle the obligation; and the amount has been reliably estimated. Provisions are not recognised for future operating losses.
Provisions are measured at the expenditures expected to be required to settle the obligation. If the time value of money is material, provisions will be measured at their present value using a pre-tax rate that refl ects current market assessments of the time value of money and the risks specifi c to the obligation. The increase in the provision due to passage of time is recognised as interest expenses.
2.14 Provision for severance allowances
In accordance with Vietnamese labour laws, employees of the Company are entitled to a severance allowance based on their years of service. This will be paid as a lump sum when the employee leaves the Company. A provision for severance allowance is made for the estimated liability for employment termination as a result of services rendered by employees. Pursuant to Law on Social Insurance, effective from 1 January 2009, the Company is required to contribute to an unemployment insurance fund managed by the Vietnam Social Insurance Agency. With the implementation of the unemployment scheme, the Company is no longer required to provide for the service period after 1 January 2009. However, provision for severance allowance as of 31 December 2012 is determined based on the employees’ number of years of service up to 31 December 2008 and their average salary for the six-month period prior to the balance sheet date.
2.15 Share capital
Ordinary shares in issue are classifi ed as equity. Incremental costs directly attributable to the issuance of new shares or options are shown in equity as a deduction from the proceeds.
Where the Company purchase the Company’s equity share capital (treasury shares), the consideration paid, including
NOTES TO THE FINANCIAL STATEMENTSAs at and for the year ended 31 December 2012

389
BEAUTÉ COSMÉTIQUE SOCIETÉ PAR ACTIONS
389
NOTES TO THE FINANCIAL STATEMENTSAs at and for the year ended 31 December 2012
directly attributable incremental costs, is deducted from equity attributable to the Company’s equity holders until the shares are cancelled or reissued. Where such shares are subsequently sold or reissued, any consideration received less any directly attributable incremental transaction costs is included in equity attributable to the Company’s equity holders.
3 CASH AND CASH EQUIVALENTS
2012 2011 2012 2011VND VND Rs. Crore Rs. Crore
Cash on hand 1,819,722,313 2,197,115,872 0.48 0.55
Cash at bank 2,422,968,591 2,502,738,898 0.64 0.63
Cash equivalents (*) 15,000,000,000 14,000,000,000 3.96 3.54
19,242,690,904 18,699,854,770 5.08 4.72
*Cash equivalents comprise short-term bank deposits with maturity of one month.
4 TRADE ACCOUNTS RECEIVABLE
2012 2011 2012 2011VND VND Rs. Crore Rs. Crore
Third parties 162,137,845 99,560,393 0.04 0.03
Related parties (Note 25(b)) 100,547,998 – 0.03 –
262,685,843 99,560,393 0.07 0.03
5 OTHER RECEIVABLES
2012 2011 2012 2011VND VND Rs. Crore Rs. Crore
Social Insurance 443,443,555 363,366,010 0.12 0.09
Deposit interest 35,194,444 77,388,889 0.01 0.02
Others 159,862,194 61,270,027 0.04 0.02
638,500,193 502,024,926 0.17 0.13
6 INVENTORIES
2012 2011 2012 2011
VND VND Rs. Crore Rs. CroreGoods in transit – 727,232,995 – 0.18
Raw materials 1,227,391,892 893,602,118 0.32 0.23
Merchandises 16,186,059,329 16,038,119,372 4.28 4.04
17,413,451,221 17,658,954,485 4.60 4.45
Provision for decline in value of inventory
(246,666,647) – (0.07) –
17,166,784,574 17,658,954,485 4.53 4.45
Movements in the provision for inventories during the year were as follows:
2012 2011 2012 2011
VND VND Rs. Crore Rs. CroreOpening balance – – – –
Increase (246,666,647) – (0.07) –
Closing balance (246,666,647) – (0.07) –

390
BEAUTÉ COSMÉTIQUE SOCIETÉ PAR ACTIONS
390
NOTES TO THE FINANCIAL STATEMENTSAs at and for the year ended 31 December 2012
7 FIXED ASSETS
(a) Tangible fi xed assets
Plant and machinery
Offi ce equipment
Total Plant and machinery
Offi ceequipment
Total
VND VND VND Rs. Crore Rs. Crore Rs. Crore
Historical cost
At 1 January 2012 687,238,079 414,695,647 1,101,933,726 0.18 0.11 0.29
New purchases 279,394,546 22,720,984 302,115,530 0.08 0.01 0.08
Disposals (18,077,720) (24,297,200) (42,374,920) (0.01) (0.01) (0.01)
At 31 December 2012 948,554,905 413,119,431 1,361,674,336 0.24 0.11 0.36
Accumulated depreciation
At 1 January 2012 515,357,055 393,163,070 908,520,125 0.14 0.10 0.24
Charge for the year 148,424,344 8,611,160 157,035,504 0.03 0.01 0.04
Disposals (18,077,720) (24,297,196) (42,374,916) (0.01) (0.01) (0.01)
At 31 December 2012 645,703,679 377,477,034 1,023,180,713 0.16 0.10 0.27
Net book value
At 1 January 2012 171,881,024 21,532,577 193,413,601 0.04 0.01 0.05
At 31 December 2012 302,851,226 35,642,397 338,493,623 0.08 0.01 0.09
Cost of fully depreciated tangible fi xed assets but still in use as at 31 December 2012 was VND 788,380,464 (2011: VND 624,081,754).
(b) Intangible fi xed assets
Computer software Computer software VND Rs. Crore
Historical cost
At 1 January 2012 and 31 December 2012 509,396,314 0.13
Accumulated amortisation
At 1 January 2012 284,370,677 0.07
Charge for the year 135,853,651 0.04
At 31 December 2012 420,224,328 0.11
Net book value
At 1 January 2012 225,025,637 0.06
At 31 December 2012 89,171,986 0.02
Cost of fully depreciated intangible fi xed assets but still in use as at 31 December 2012 was VND 257,696,314 (2011: VND101,836,064).
8 LONG-TERM PREPAID EXPENSES
2012 2011 2012 2011VND VND Rs. Crore Rs. Crore
Repair expenses for office and store
807,405,255 2,025,861,641 0.21 0.51
Tools and supplies 259,280,470 391,037,395 0.07 0.10
1,066,685,725 2,416,899,036 0.28 0.61

391
BEAUTÉ COSMÉTIQUE SOCIETÉ PAR ACTIONS
391
NOTES TO THE FINANCIAL STATEMENTSAs at and for the year ended 31 December 2012
9 OTHER LONG-TERM ASSETS
2012 2011 2012 2011VND VND Rs. Crore Rs. Crore
Deposit for rental 421,788,860 1,086,514,881 0.12 0.27
Other long-term assets 318,055,000 – 0.08 –
739,843,860 1,086,514,881 0.20 0.27
10 SHORT-TERM BORROWINGS
2012 2011 2012 2011VND VND Rs. Crore Rs. Crore
Related parties (Note 25(b)) 3,000,000,000 3,000,000,000 0.79 0.76
The short-term borrowing represents the non-interest bearing loan from Parent company, International Consumer Products Corporation.
11 TRADE ACCOUNTS PAYABLE
2012 2011 2012 2011VND VND Rs. Crore Rs. Crore
Third parties 241,134,141 2,546,337,029 0.06 0.64
12 TAXES AND OTHER PAYABLES TO THE STATE BUDGET
2012 2011 2012 2011VND VND Rs. Crore Rs. Crore
Business income tax - current 415,545,310 1,149,686,830 0.11 0.29
Value added tax 1,404,473,847 791,093,116 0.37 0.20
Personal income tax 526,413,676 665,326,446 0.14 0.17
2,346,432,833 2,606,106,392 0.62 0.66
13 ACCRUED EXPENSES
2012 2011 2012 2011VND VND Rs. Crore Rs. Crore
Bonus for employees 1,013,281,950 423,000,000 0.27 0.11
Outing trip for sales department 816,000,000 – 0.22 –
Offi ce renovation 294,139,974 – 0.08 –
Others 823,011,714 357,464,602 0.21 0.09
2,946,433,638 780,464,602 0.78 0.20

392
BEAUTÉ COSMÉTIQUE SOCIETÉ PAR ACTIONS
392
NOTES TO THE FINANCIAL STATEMENTSAs at and for the year ended 31 December 2012
14 DEFERRED INCOME TAX
Deferred income tax assets and liabilities are offset when there is a legally enforceable right to offset current income tax assets against current income tax liabilities and when the deferred income taxes relate to the same taxation authority. The offset amounts are as follows:
2012 2011 2012 2011VND VND Rs. Crore Rs. Crore
Deferred tax assets:
Deferred tax asset to be recovered after more than 12 months
1,177,602,208 164,092,676 0.31 0.04
Deferred tax asset to be recovered within 12 months
61,666,662 – 0.02 –
239,268,870 164,092,676 0.06 0.04
The gross movement in the deferred income tax, without taking into consideration the offsetting of balances within the same tax jurisdiction, is as follows:
2012 2011 2012 2011VND VND Rs. Crore Rs. Crore
Beginning of year 164,092,676 151,949,687 0.04 0.04
Income statement credit 75,176,194 12,142,989 0.02 0.01
End of year 239,268,870 164,092,676 0.06 0.04
15 OWNERS’ CAPITAL
(a) Number of shares
2012 2011Ordinary shares Ordinary shares
(shares) (shares)
Number of shares registered 2,000,000 2,000,000
Number of existing shares in use issue 2,000,000 2,000,000
(b) Details of owners’ shareholding
2012 2011
Ordinary shares % Ordinary shares %
International Consumer Products Corporation 1,980,000 99% 1,980,000 99%
Nguyen Khanh Ngoc 10,000 0.50% 10,000 0.50%
Nguyen Thi Tuyet Suong 10,000 0.50% 10,000 0.50%
(c) Movement of share capital
Number of share capital
(shares)
Ordinary shares
Total Ordinary shares
Total
VND VND Rs. Crore Rs. Crore
As at 1 January 2011 and 31 December 2012
2,000,000 20,000,000,000 20,000,000,000 5.28 5.05
Par value per share: VND10,000.

393
BEAUTÉ COSMÉTIQUE SOCIETÉ PAR ACTIONS
393
16 MOVEMENTS IN OWNERS’ EQUITY
Owners’ Capital Difference upon assets revaluation
Undistributed earnings
Total
VND VND VND VNDAs at 1 January 2011 20,000,000,000 – 2,505,078,025 22,505,078,025
Profi t for the year – – 6,510,647,723 6,510,647,723
Increase difference upon assets
revaluation
– 27,292,841 – 27,292,841
As at 31 December 2011 20,000,000,000 27,292,841 9,015,725,748 29,043,018,589
Profi t for the year – – 582,624,697 582,624,697
Decrease difference upon assets
revaluation
– -27,292,841 – (27,292,841)
As at 31 December 2012 20,000,000,000 – 9,598,350,445 29,598,350,445
Owners’ Capital Difference upon
assets revaluation Undistributed
earningsTotal
Rs. Crore Rs. Crore Rs. Crore Rs. CroreAs at 1 January 2011 5.05 – 0.63 5.68
Profi t for the year – – 1.64 1.64
Increase difference upon assets revaluation
– 0.01 – 0.01
As at 31 December 2011 5.05 0.01 2.27 7.33
Profi t for the year – – 0.15 0.15
Decrease difference upon assets revaluation
– (0.01) – (0.01)
As at 31 December 2012 5.28 – 2.53 7.82
17 REVENUE
2012 2011 2012 2011VND VND Rs. Crore Rs. Crore
Sales
Sales of goods 85,176,325,046 97,537,357,560 22.49 24.61
Sales deductions
Trade discounts 3,751,886,314 1,091,374,793 0.99 0.28
Sales returns 616,755,277 696,905,047 0.16 0.18
4,368,641,591 1,788,279,840 1.15 0.46
Net revenue from sales of goods
Net revenue from sales of goods 80,807,683,455 95,749,077,720 21.34 24.15
80,807,683,455 95,749,077,720 21.34 24.15
NOTES TO THE FINANCIAL STATEMENTSAs at and for the year ended 31 December 2012

394
BEAUTÉ COSMÉTIQUE SOCIETÉ PAR ACTIONS
394
18 COST OF SALES
2012 2011 2012 2011VND VND Rs. Crore Rs. Crore
Cost of merchandises sold 14,245,679,597 19,968,448,601 3.76 5.04
Provision for decline in value of inventories
246,666,647 – 0.07 –-
14,492,346,244 19,968, 448,601 3.83 5.04
19 FINANCIAL INCOME
2012 2011 2012 2011VND VND Rs. Crore Rs. Crore
Interest income from term deposits 1,156,377,428 472,174,922 0.31 0.12
Net realised foreign exchange gains 167,011,699 781,125,067 0.04 0.20
Net gain from foreign currency translation at year-end
36,712,000 36,981,140 0.01 0.01
1,360,101,127 1,290,281,129 0.36 0.33
20 FINANCIAL EXPENSES
2012 2011 2012 2011VND VND Rs. Crore Rs. Crore
Net realised foreign exchange losses 134,524,394 382,848,925 0.04 0.10
21 SELLING EXPENSES
The following items have been included in selling expenses:
2012 2011 2012 2011VND VND Rs. Crore Rs. Crore
Staff costs 32,735,354,966 33,556,115,219 8.64 8.47
Rental fee 5,539,780,187 5,897,632,620 1.46 1.49
Trade promotion 4,267,585,979 4,845,979,825 1.13 1.22
Recruitment, training expenses 1,383,156,432 1,144,077,662 0.37 0.29
Maintenance expenses 1,207,132,587 1,163,566,248 0.32 0.29
Other expenses 9,476,545,270 10,713,277,814 2.50 2.70
22 GENERAL AND ADMINISTRATION EXPENSES
The following items have been included in general and administration expenses:
2012 2011 2012 2011VND VND Rs. Crore Rs. Crore
Staff costs 7,394,868,683 6,153,354,278 1.95 1.55
Rental fee 3,337,425,030 2,629,351,350 0.88 0.66
Repair and maintenance expense 224,652,198 388,570,760 0.06 0.10
Other expenses 1,011,604,892 1,445,504,700 0.27 0.36
NOTES TO THE FINANCIAL STATEMENTSAs at and for the year ended 31 December 2012

395
BEAUTÉ COSMÉTIQUE SOCIETÉ PAR ACTIONS
395
23 TAXATION
The tax on the Company’s profi t before tax differs from the theoretical amount that would arise using the tax rate of 25%. In accordance with Circular 140/2012/TT-BTC dated 21 August 2012 provided guidance about Business income tax calculated for small and medium entrepreneur, the Company is entitled to an reduction of 30% from CIT for the fi scal year 2012.
2012 2011 2012 2011VND VND Rs. Crore Rs. Crore
Net accounting profi t before tax 887,249,302 9,163,535,050 0.23 2.31
Tax calculated at a rate of 25% 221,812,326 2,290,883,763 0.06 0.58
Effect of:
Expenses not deductible for tax purpose 213,365,681 362,003,564 0.06 0.09
30% tax reduction (130,553,402) – (0.03) –
Business income tax charge 304,624,605 2,652,887,327 0.08 0.67
Charged/(credited) to income statement:
Business income tax – current 379,800,799 2,665,030,316 0.10 0.67
Business income tax – deferred (Note 14)
(75,176,194) (12,142,989) (0.02) –
304,624,605 2,652,887,327 0.08 0.67
The business income tax charge for the year is based on estimated taxable income and is subject to review and possible adjustment by the tax authorities.
24 COST OF GOODS MANUFACTURED BY FACTORS
2012 2011 2012 2011VND VND Rs. Crore Rs. Crore
Raw materials 14,492,346,244 19,968,448,601 3.83 5.04
Labour costs 40,130,223,649 39,709,469,497 10.60 10.02
Depreciation expense 292,888,933 309,573,291 0.08 0.08
Outside service expenses 25,275,695,490 27,042,726,296 6.67 6.82
Other cash expenses 879,298,152 875,661,392 0.23 0.22
81,070,452,468 87,905,879,077 21.41 22.18
25 FINANCIAL RISK MANAGEMENT
The Company’s activities expose it to market risk (including currency risk and interest rate risk) credit risk and liquidity risk. The Company’s overall risk management strategy seeks to minimise adverse effect of these risks on the Company’s fi nancial performance.
(1) Market risk
(a) Currency risk
The Company’s business is exposed to foreign currency risk arising from various currency exposures, primarily United States Dollar (“US$”).
The Company ensures that the net exposure to this risk is kept to an acceptable level by buying or selling foreign currencies at spot rates where necessary to address short-term imbalances. The Company does not enter into currency hedging transactions since it considers that the cost of such instruments outweigh the potential risk of exchange rate fl uctuations.
NOTES TO THE FINANCIAL STATEMENTSAs at and for the year ended 31 December 2012
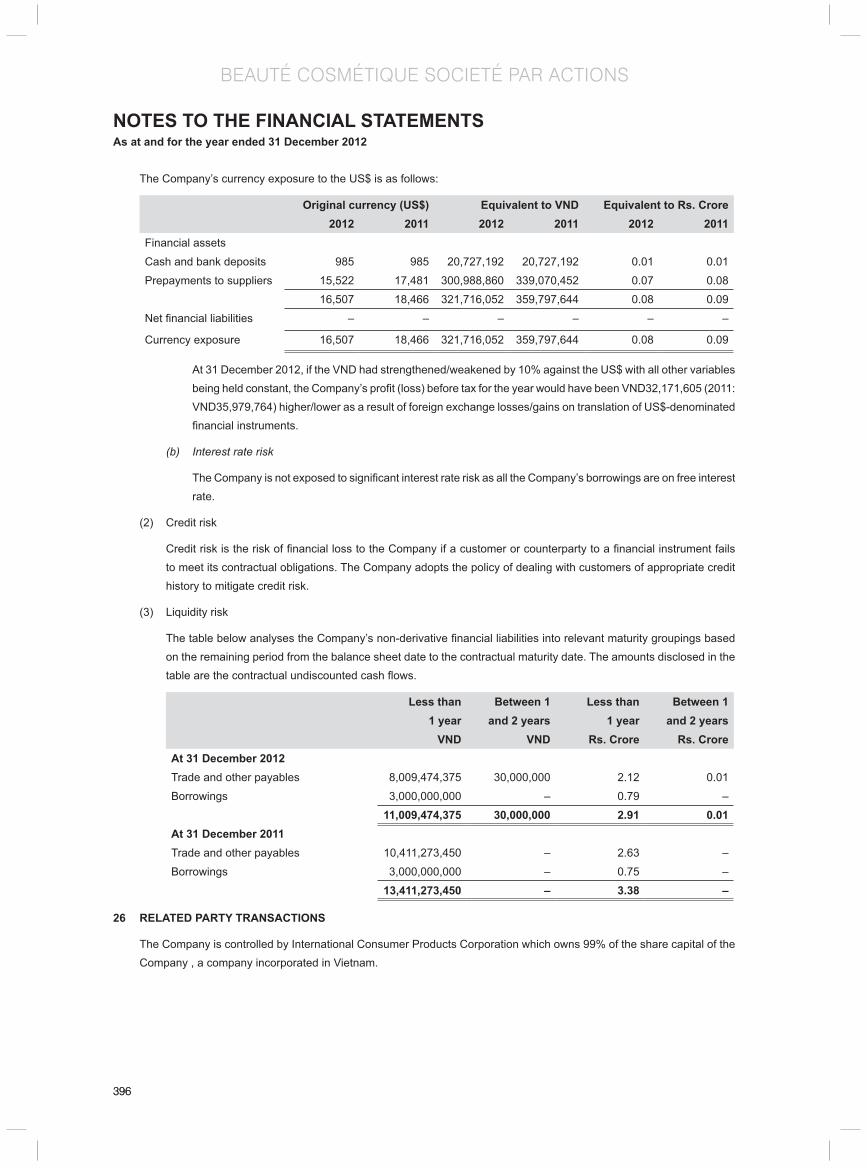
396
BEAUTÉ COSMÉTIQUE SOCIETÉ PAR ACTIONS
396
The Company’s currency exposure to the US$ is as follows:
Original currency (US$) Equivalent to VND Equivalent to Rs. Crore2012 2011 2012 2011 2012 2011
Financial assets
Cash and bank deposits 985 985 20,727,192 20,727,192 0.01 0.01
Prepayments to suppliers 15,522 17,481 300,988,860 339,070,452 0.07 0.08
16,507 18,466 321,716,052 359,797,644 0.08 0.09
Net fi nancial liabilities – – – – – –
Currency exposure 16,507 18,466 321,716,052 359,797,644 0.08 0.09
At 31 December 2012, if the VND had strengthened/weakened by 10% against the US$ with all other variables being held constant, the Company’s profi t (loss) before tax for the year would have been VND32,171,605 (2011: VND35,979,764) higher/lower as a result of foreign exchange losses/gains on translation of US$-denominated fi nancial instruments.
(b) Interest rate risk
The Company is not exposed to signifi cant interest rate risk as all the Company’s borrowings are on free interest rate.
(2) Credit risk
Credit risk is the risk of fi nancial loss to the Company if a customer or counterparty to a fi nancial instrument fails to meet its contractual obligations. The Company adopts the policy of dealing with customers of appropriate credit history to mitigate credit risk.
(3) Liquidity risk
The table below analyses the Company’s non-derivative fi nancial liabilities into relevant maturity groupings based on the remaining period from the balance sheet date to the contractual maturity date. The amounts disclosed in the table are the contractual undiscounted cash fl ows.
Less than Between 1 Less than Between 1 1 year and 2 years 1 year and 2 years
VND VND Rs. Crore Rs. CroreAt 31 December 2012Trade and other payables 8,009,474,375 30,000,000 2.12 0.01
Borrowings 3,000,000,000 – 0.79 –
11,009,474,375 30,000,000 2.91 0.01 At 31 December 2011Trade and other payables 10,411,273,450 – 2.63 –
Borrowings 3,000,000,000 – 0.75 –
13,411,273,450 – 3.38 –
26 RELATED PARTY TRANSACTIONS
The Company is controlled by International Consumer Products Corporation which owns 99% of the share capital of the Company , a company incorporated in Vietnam.
NOTES TO THE FINANCIAL STATEMENTSAs at and for the year ended 31 December 2012

397
BEAUTÉ COSMÉTIQUE SOCIETÉ PAR ACTIONS
397
(a) Related party transactions
i) Sale of goods & Services
2012 2011 2012 2011VND VND Rs. Crore Rs. Crore
International Consumer Products Corporation
322,090,951 106,001,471 0.08 0.03
Fellow group subsidiaries 22,860,000 – 0.01 –
344,950,951 106,001,471 0.09 0.03
ii) Purchases of goods and services
2012 2011 2012 2011VND VND Rs. Crore Rs. Crore
International Consumer Products Corporation
1,991,326,725 2,392,692,445 0.53 0.60
iii) Return of goods
2012 2011 2012 2011VND VND Rs. Crore Rs. Crore
International Consumer Products Corporation
119,192,000 802,620,320 0.03 0.20
iv) Compensation of key management
2012 2011 2012 2011VND VND Rs. Crore Rs. Crore
Gross salaries and other benefi ts 1,599,797,507 1,291,331,312 0.42 0.33
v) Financing activities
2012 2011 2012 2011VND VND Rs. Crore Rs. Crore
Free interest rate loan from International Consumer Products Corporation
– 3,000,000,000 – 0.76
(b) Year end balances with related parties
2012 2011 2012 2011VND VND Rs. Crore Rs. Crore
International Consumer Products Corporation
75,401,998 – 0.02 –
Fellow group subsidiaries 25,146,000 – 0.01 –
100,547,998 – 0.03 –Borrowing International Consumer Products Corporation
3,000,000,000 3,000,000,000 0.79 0.76
The fi nancial statements were approved by the Board of Directors on 11 March 2013.
NOTES TO THE FINANCIAL STATEMENTSAs at and for the year ended 31 December 2012
Nguyen Van Chin Pham Thi My HanhChief Accountant General Director
Monday, March, 2013

398
THUAN PHAT FOODSTUFF JOINT STOCK COMPANY
Business Registration Certifi cate No. 4103006767 dated 18 May 2007, was issued by the Department of Planning and Investment of Ho Chi Minh City.
The 7th amended Business Registration Certifi cate No. 0304979919 dated 14 November 2012 was issued by the Department of Planning and Investment of Ho Chi Minh City.
Board of Directors Saugata Gupta
Ashutosh Telang
Chaitanya J. Deshpande
Nikhil P. Narkhede
Phan Quoc Cong
Le Quang Hanh
Registered offi ce 7th Floor, Hai Au Building, 39B Truong Son Street, Ward 4, Tan Binh District, Ho Chi Minh City, Vietnam
Legal representative Phan Cong Thanh
Auditor PricewaterhouseCoopers (Vietnam) Limited

399
THUAN PHAT FOODSTUFF JOINT STOCK COMPANY
The Board of Directors of the Company is responsible for fi nancial statements which give a true and fair view of the fi nancial position of the Company as at 31 December 2012 and the results of its operations and cash fl ows for the year then ended. In preparing these fi nancial statements, the management is required to:
• select suitable accounting policies and then apply them consistently;
• make judgments and estimates that are reasonable and prudent; and
• prepare the fi nancial statements on a going concern basis unless it is inappropriate to presume that the Company will continue in business.
The Board of Directors is responsible for ensuring that proper accounting records are kept which disclose, with reasonable accuracy at any time, the fi nancial position of the Company and which enable fi nancial statements to be prepared which comply with the basis of accounting set out in Note 2 to the fi nancial statements. The Board of Director is also responsible for safeguarding the assets of the Company and hence for taking reasonable steps for the prevention and detection of fraud and other irregularities.
APPROVAL OF THE FINANCIAL STATEMENTS
I hereby approve the accompanying fi nancial statements as set out which give a true and fair view of the fi nancial position of the Company as at 31 December 2012 and of the results of its operations and cash fl ows for the year then ended in accordance with Vietnamese Accounting Standards, the Vietnamese Accounting System and applicable regulations in SR Vietnam.
On behalf of the Board of Directors
Phan Cong Thanh General Director
Ho Chi Minh City, SR VietnamMarch 11, 2013
STATEMENT OF THE RESPONSIBILITY OF THE BOARD OF DIRECTORS’ OF THE COMPANY IN RESPECT OF THE FINANCIAL STATEMENTS

400
THUAN PHAT FOODSTUFF JOINT STOCK COMPANY
INDEPENDENT AUDITOR’S REPORT
TO THE SHAREHOLDERS OF THUAN PHAT FOODSTUFF JSC
We have audited the accompanying fi nancial statements of Thuan Phat Foodstuff JSC (“the Company”) which were approved by the Board of Directors on [date]. The fi nancial statements comprise the balance sheet as at 31 December 2012, the income statement and cash fl ow statement for the year then ended, and explanatory notes to the fi nancial statements including signifi cant accounting policies, as set out on pages 5 to 21.
The Board of Directors’ Responsibility for the Financial Statements
The Board of Directors of the Company is responsible for the preparation and fair presentation of these fi nancial statements in accordance with Vietnamese Accounting Standards, the Vietnamese Accounting System and applicable regulations in SR Vietnam. This responsibility includes: designing, implementing and maintaining internal controls relevant to the preparation and fair presentation of fi nancial statements that are free from material misstatement, whether due to fraud or error; selecting and applying appropriate accounting policies and making accounting estimates that are reasonable in the circumstances.
Auditor’s Responsibility
Our responsibility is to express an opinion on these fi nancial statements based on our audit. We conducted our audit in accordance with Vietnamese Standards on Auditing. Those standards require that we comply with ethical requirements and plan and perform the audit in order to obtain reasonable assurance as to whether the fi nancial statements are free from material misstatement.
An audit involves performing procedures to obtain audit evidence about the amounts and disclosures in the fi nancial statements. The procedures selected depend on the auditor’s judgment, including an assessment of the risks of material misstatement of the fi nancial statements, whether due to fraud or error. In making those risk assessments, the auditor considers internal controls relevant to the entity’s preparation and fair presentation of the fi nancial statements in order to design audit procedures that are appropriate in the circumstances, but not for the purpose of expressing an opinion on the effectiveness of the entity’s internal controls. An audit also includes evaluating the appropriateness of accounting policies used and the reasonableness of accounting estimates made by the Board of Directors, as well as evaluating the overall presentation of the fi nancial statements.
We believe that the audit evidence we have obtained is suffi cient and appropriate to provide a basis for our audit opinion.
Opinion
In our opinion, the fi nancial statements present fairly, in all material respects, the fi nancial position of the Company as at 31 December 2012, and its fi nancial performance and cash fl ows for the year then ended in accordance with Vietnamese Accounting Standards, the Vietnamese Accounting System and applicable regulations in SR Vietnam.
Dang Quoc Tuan Nguyen Cao Nguyen
AC No. 0620/KTV AC No. 1184/KTV
Director
Authorised signatory
PricewaterhouseCoopers (Vietnam) Limited
Ho Chi Minh City, SR Vietnam
Audit report number HCMxxx

401
THUAN PHAT FOODSTUFF JOINT STOCK COMPANY
BALANCE SHEETAs at 31 December 2012
Notes As at 31 December As at 31 December
2012 2011 2012 2011VND VND Rs. Crore Rs. Crore
CURRENT ASSETS 22,263,846,604 23,172,728,731 5.88 5.85
Cash and cash equivalents 3 1,806,290,992 1,859,981,712 0.48 0.47
Cash 1,806,290,992 1,859,981,712 0.48 0.47
Accounts receivable 234,700,700 894,911,378 0.06 0.23
Trade accounts receivable – 2,845,998 – 0.01
Prepayments to suppliers 34,700,700 45,480,000 0.01 0.02
Other receivables 4 200,000,000 846,585,380 0.05 0.21
Inventories 5 19,934,322,137 20,039,508,674 5.26 5.06
Inventories 19,934,322,137 20,460,591,117 5.26 5.17
Provision for decline in value of inventories
– (421,082,443) – (0.11)
Other current assets 288,532,775 378,326,967 0.08 0.10
Short-term prepayments 203,918,913 280,963,105 0.05 0.07
Other taxes receivable 6 56,473,862 56,473,862 0.01 0.01
Other current assets 28,140,000 40,890,000 0.02 0.02
NON-CURRENT ASSETS 33,023,559,355 35,649,794,514 8.72 8.99
Fixed assets 32,058,764,443 34,614,358,046 8.47 8.73
Tangible fi xed assets 7(a) 11,187,562,509 12,142,132,046 2.96 3.06
Cost 20,128,128,047 19,402,298,282 5.32 4.89
Accumulated depreciation (8,940,565,538) (7,260,166,236) (2.36) (1.83)
Intangible fi xed assets 7(b) 20,871,201,934 22,459,650,779 5.51 5.67
Cost 22,399,278,817 23,399,278,817 5.92 5.90
Accumulated amortisation (1,528,076,883) (939,628,038) (0.41) (0.23)
Construction in progress – 12,575,221 – –
Other long-term assets 964,794,912 1,035,436,468 0.25 0.26
Long-term prepayments 964,794,912 1,035,436,468 0.25 0.26
TOTAL ASSETS 55,287,405,959 58,822,523,245 14.60 14.85
Note : The exchange rate use to convert VND to Rs.<0.00259>/(Previous year VND to Rs.<0.00244>)

402
THUAN PHAT FOODSTUFF JOINT STOCK COMPANY
BALANCE SHEET (CONTD.)As at 31 December 2012
OFF BALANCE SHEET ITEM
As at 31 December 2012, cash and cash equivalents are balances held in foreign currencies of US$1,153 (2011: US$1,166).
Notes As at 31 December As at 31 December
2012 2011 2012 2011VND VND Rs. Crore Rs. Crore
LIABILITIES 25,327,132,895 30,255,844,718 6.69 7.64
Current liabilities 24,329,336,117 29,888,410,536 6.43 7.55
Trade accounts payable 8 8,180,477,209 5,744,829,167 2.16 1.45
Advances from customers 9 13,697,446,375 22,349,011,145 3.63 5.64
Taxes and other payables to the State Budget
10 686,817,738 513,007,768 0.18 0.13
Payable to employees 1,250,353,600 – 0.33 –
Accrued expenses 11 390,630,883 977,490,061 0.10 0.25
Other payables 12 123,610,312 304,072,395 0.03 0.08
Long-term liabilities 997,796,778 367,434,182 0.26 0.09
Provision for severance allowances 997,796,778 367,434,182 0.26 0.09
OWNERS’ EQUITY 29,960,273,064 28,566,678,527 7.91 7.21
Capital and reserves 29,960,273,064 28,566,678,527 7.91 7.21
Owners’ capital 13 31,400,000,000 31,400,000,000 8.29 7.92
Undistributed earnings 14 (1,439,726,936) (2,833,321,473) (0.38) (0.71)
TOTAL RESOURCES 55,287,405,959 58,822,523,245 14.60 14.85
Hoang Van Nghien Phan Cong ThanhChief Accountant General Director Monday, March 11, 2013
Note : The exchange rate use to convert VND to Rs.<0.00259>/(Previous year VND to Rs.<0.00244>)

403
THUAN PHAT FOODSTUFF JOINT STOCK COMPANY
INCOME STATEMENTfor the year ended 31 December 2012
Hoang Van Nghien Phan Cong Thanh
Chief Accountant General Director
Monday, March 11, 2012
ASSETS Notes Year ended 31 December Year ended 31 December
2012 2011 2012 2011
VND VND Rs. Crore Rs. Crore
Sales 96,343,821,388 91,590,543,853 25.44 23.11
Less deductions (401,986,980) (1,602,434,212) (0.11) (0.41)
Net sales 15 95,941,834,408 89,988,109,641 25.34 22.70
Cost of sales 16 (86,671,092,717) (80,767,751,768) (22.89) (20.37)
Gross profi t 9,270,741,691 9,220,357,873 2.45 2.33
Financial income 17 39,271,226 74,942,059 0.01 0.02
Financial expenses – (187,728,956) – (0.05)
Selling expenses 18 (1,338,823,511) (6,075,012,343) (0.35) (1.53)
General and administration expenses 19 (6,652,582,847) (9,545,233,906) (1.76) (2.41)
Operating profi t/(loss) 1,318,606,559 (6,512,675,273) 0.35 (1.64)
Other income 1,309,623,758 121,728,397 0.35 0.03
Other expenses (1,234,635,780) (185,296,046) (0.33) (0.05)
Net other income/(expenses) 20 74,987,978 (63,567,649) 0.02 (0.02)
Net accounting profi t/(loss) before tax
1,393,594,537 (6,576,242,922) 0.37 (1.66)
Business income tax - current 21 – – – –
Business income tax - deferred 21 – – – –
Net profi t/(loss) after tax 1,393,594,537 (6,576,242,922) 0.37 (1.66)
The note on page 9 to 21 are in the integral part of fi nancial statement.
Note : The exchange rate use to convert VND to Rs.<0.00259>/(Previous year VND to Rs.<0.00244>)

404
THUAN PHAT FOODSTUFF JOINT STOCK COMPANY
Hoang Van Nghien Phan Cong Thanh
Chief Accountant General Director
Monday, March 11, 2012
CASH FLOW STATEMENTas at and for the year ended 31 December 2012
Notes Year ended 31 December Year ended 31 December2012 2011 2012 2011VND VND Rs. Crore Rs. Crore
CASH FLOWS FROM OPERATING ACTIVITIESNet profi t/(loss) before tax 1,393,594,537 (6,576,242,922) 0.37 (1.66)
Adjustments for:
Depreciation and amortisation 2,731,388,589 2,495,569,016 0.72 0.63
Provisions (421,082,443) 336,380,014 (0.11) 0.08
Unrealised foreign exchange gains – (42,284,258) – (0.01)
(Profi ts)/losses from investing activities (120,483,957) 180,302,141 (0.03) 0.05
Operating profi t/(loss) before changes in working capital
3,583,416,726 (3,606,276,009) 0.95 (0.91)
Decrease in receivables 660,210,678 1,646,641,807 0.17 0.42
Decrease/(increase) in inventories 526,268,980 (161,462,661) 0.14 (0.04)
(Decrease)/increase in payables (4,928,711,823) 10,195,361,413 (1.30) 2.57
Decrease in prepaid expenses 147,685,748 466,486,835 0.04 0.12
Interest paid – (180,302,141) – (0.05)
Other receipts from operating activities 25,325,221 – 0.01 –
Net cash infl ows from operating activities
14,195,530 8,360,449,244 0.01 2.11
CASH FLOWS FROM INVESTING ACTIVITIESPurchases of fi xed assets (1,320,061,250) (1,400,141,044) (0.35) (0.35)
Proceeds from disposals of fi xed assets 1,252,175,000 – 0.33 –
Interest received – 42,284,258 – 0.01
Net cash outfl ows from investing activities
(67,886,250) (1,357,856,786) (0.02) (0.34)
CASH FLOWS FROM FINANCING ACTIVITIESProceeds from borrowings – 4,525,139,479 – 1.14
Repayments of borrowings – (10,196,842,892) – (2.57)
Net cash outfl ows from fi nancing activities
– (5,671,703,413) – (1.43)
Net increase in cash and cash equivalents
(53,690,720) 1,330,889,045 (0.01) 0.34
Cash and cash equivalents at beginning of year
31,859,981,712 529,092,667 0.49 0.13
Cash and cash equivalents at end of year
31,806,290,992 1,859,981,712 0.48 0.47
Note : The exchange rate use to convert VND to Rs.<0.00259>/(Previous year VND to Rs.<0.00244>)

405
THUAN PHAT FOODSTUFF JOINT STOCK COMPANY
NOTES TO THE FINANCIAL STATEMENTSNotes to the fi nancial Statements as of 31 December 2012
1 GENERAL INFORMATION
Thuan Phat Foodstuff JSC (“the Company”) was established in SR Vietnam pursuant to Business Registration Certifi cate No. 4103006767 issued by the Department of Planning and Investment of Ho Chi Minh City on 18 May 2007 and the 7th amended Business Registration Certifi cates No. 0304979919 dated 14 November 2012 issued by the Department of Planning and Investment of Ho Chi Minh City.
In accordance with the Business Registration Certifi cate No. 0304979919 dated 14 November 2012, the Department of Planning and Investment of Ho Chi Minh City approved the change in the Company’s legal representative and incorporation of the Company’s branch. Accordingly, the Company’s legal representative was changed to Mr Phan Cong Thanh. The branch is located at Lot D2, 7A Street, Tan Nhut Ward, Le Minh Xuan Industrial Park, Binh Chanh District, Ho Chi Minh City, Vietnam.
The principal activities of the Company are to manufacture, process and trade food products and materials.
As at 31 December 2012, the Company had 142 employees (2011: 163 employees).
2 ACCOUNTING SYSTEM AND ACCOUNTING POLICIES
2.1 Basis of preparation of fi nancial statements
The fi nancial statements have been prepared in accordance with Vietnamese Accounting Standards, the Vietnamese Accounting System and applicable regulations in SR Vietnam. The fi nancial statements have been prepared under the historical cost convention.
The accompanying fi nancial statements are not intended to present the fi nancial position and results of operations and cash fl ows in accordance with accounting principles and practices generally accepted in countries and jurisdictions other than SR Vietnam. The accounting principles and practices utilised in SR Vietnam may differ from those generally accepted in countries and jurisdictions other than SR Vietnam.
2.2 Fiscal year
The Company’s fi scal year is from 1 January to 31 December.
2.3 Currency
The fi nancial statements are measured in Vietnamese Dong and presented using Vietnamese Dong.
Transactions arising in foreign currencies are translated at exchange rates ruling at the transaction dates. Foreign exchange differences arising from these transactions are recognized in the income statement.
Monetary assets and liabilities denominated in foreign currencies at the balance sheet date are translated at the rates of exchange ruling at the balance sheet date. Foreign exchange differences arising from these translations are recognized in the income statement.
2.4 Form of records applied
The Company uses accounting software to record its transactions.
2.5 Cash and cash equivalents
Cash and cash equivalents comprise cash on hand, cash at bank, cash in transit, demand deposits and other short-term investments with an original maturity of three months or less.
2.6 Trade receivables
Trade receivables are carried at original invoice amount less an estimate made for doubtful receivables based on a review by the Board of Directors of all outstanding amounts at the year end. Bad debts are written off when identifi ed.

406
THUAN PHAT FOODSTUFF JOINT STOCK COMPANY
NOTES TO THE FINANCIAL STATEMENTSFor the year ended 31 December 2012
2.7 Inventories
Inventories are stated at the lower of cost and net realisable value. Cost is determined by the weighted average method and includes all costs of purchase, costs of conversion and other costs incurred in bringing the inventories to their present location and condition. In the case of manufactured products, cost includes all direct expenditure and production overheads based on normal levels of operating activity. Net realisable value is the estimated selling price in the normal course of business, less the estimated costs of completion and selling expenses. Provision is made, where necessary, for obsolete, slow-moving and defective inventory items.
The work in progress (WIP) balance of fi sh sauce at year end is recognized based on the selling price of Phu Quoc Fish sauce Association and is deducted by 20% at the end of the accounting period. The quantity of WIP of fi sh sauce at the end of accounting period is determined based on the estimated number of fi sh sauce shall be extracted and current the corresponding protein degree.
2.8 Fixed assets
Tangible and intangible fi xed assets
Fixed assets are stated at historical cost less accumulated depreciation. Historical cost includes expenditure that is directly attributable to the acquisition of the fi xed assets.
Depreciation
Fixed assets are depreciated using the straight-line method so as to write off the cost of the assets over their estimated useful lives. The principal annual rates used are:
Buildings 22-25 years
Plant and machinery 3-10 years
Motor vehicles 5-6 years
Offi ce equipment 3-4 years
Land use right 40 years
Computer software 8 years
Patents 5 years
Disposals
Gains and losses on disposals are determined by comparing net disposal proceeds with the carrying amount and are recognised as income or expense in the income statement.
2.9 Revenue recognition
(a) Sales of goods
Revenue from the sale of goods is recognised in the income statement when the signifi cant risks and rewards of ownership have been transferred to the buyer. No revenue is recognised if there are signifi cant uncertainties regarding recovery of the consideration due or the possible return of goods.
(b) Interest income
Interest income is recognised on an earned basis.
2.10 Current and deferred income tax
Income taxes include all income taxes which are based on taxable profi ts including profi ts generated from production and trading activities in other countries that the Socialist Republic of Vietnam has not signed any double tax relief agreement. Income tax expense comprises current tax expense and deferred tax expense.

407
THUAN PHAT FOODSTUFF JOINT STOCK COMPANY
NOTES TO THE FINANCIAL STATEMENTSNotes to the fi nancial Statements as of 31 December 2012
Deferred income tax is provided in full, using the liability method, on temporary differences arising between the tax bases of assets and liabilities and their carrying amounts in the fi nancial statements. Deferred income tax is not accounted for if it arises from initial recognition of an asset or liability in a transaction other than a business combination that at the time of occurrence affects neither the accounting nor the taxable profi t or loss. Deferred income tax is determined at the tax rates that are expected to apply to the fi nancial year when the asset is realised or the liability is settled, based on tax rates that have been enacted or substantively enacted by the balance sheet date.
Deferred income tax assets are recognised to the extent that it is probable that future taxable profi t will be available against which the temporary differences can be utilised.
2.11 Dividend distribution
Dividend distribution to the Company’s shareholders is recognised as a liability in the Company’s fi nancial statements in the period in which the dividends are approved by the Company’s Board of Management.
2.12 Related parties
Enterprises and individuals that directly, or indirectly through one or more intermediaries, control, or are controlled by, or are under common control with, the Company, including holding companies, subsidiaries and fellow subsidiaries are related parties of the Company. Associates and individuals owning, directly or indirectly, an interest in the voting power of the Company that gives them signifi cant infl uence over the enterprise, key management personnel, including directors and offi cers of the Company and close members of the family of these individuals and companies associated with these individuals also constitute related parties.
In considering each possible related party relationship, attention is directed to the substance of the relationship, and not merely the legal form.
2.11 Provisions
Provisions are recognised when: the Company has a present legal or constructive obligation as a result of past events; it is probable that an outfl ow of resources will be required to settle the obligation; and the amount has been reliably estimated. Provisions are not recognised for future operating losses.
Provisions are measured at the expenditures expected to be required to settle the obligation. If the time value of money is material, provisions will be measured at their present value using a pre-tax rate that refl ects current market assessments of the time value of money and the risks specifi c to the obligation. The increase in the provision due to passage of time is recognized as interest expenses.
2.12 Provision for severance allowances
In accordance with Vietnamese labour laws, employees of the Company are entitled to a severance allowance based on their years of service. This will be paid as a lump sum when the employee leaves the Company. A provision for severance allowance is made for the estimated liability for employment termination as a result of services rendered by employees. Pursuant to Law on Social Insurance, effective from 1 January 2009, the Company is required to contribute to an unemployment insurance fund managed by the Vietnam Social Insurance Agency. With the implementation of the unemployment scheme, the Company is no longer required to provide for the service period after 1 January 2009. However, provision for severance allowance as of 31 December 2012 is determined based on the employees’ number of years of service up to 31 December 2008 and their average salary for the six-month period prior to the balance sheet date.
2.13 Share capital
Ordinary shares in issue are classifi ed as equity. Incremental costs directly attributable to the issuance of new shares or options are shown in equity as a deduction from the proceeds.
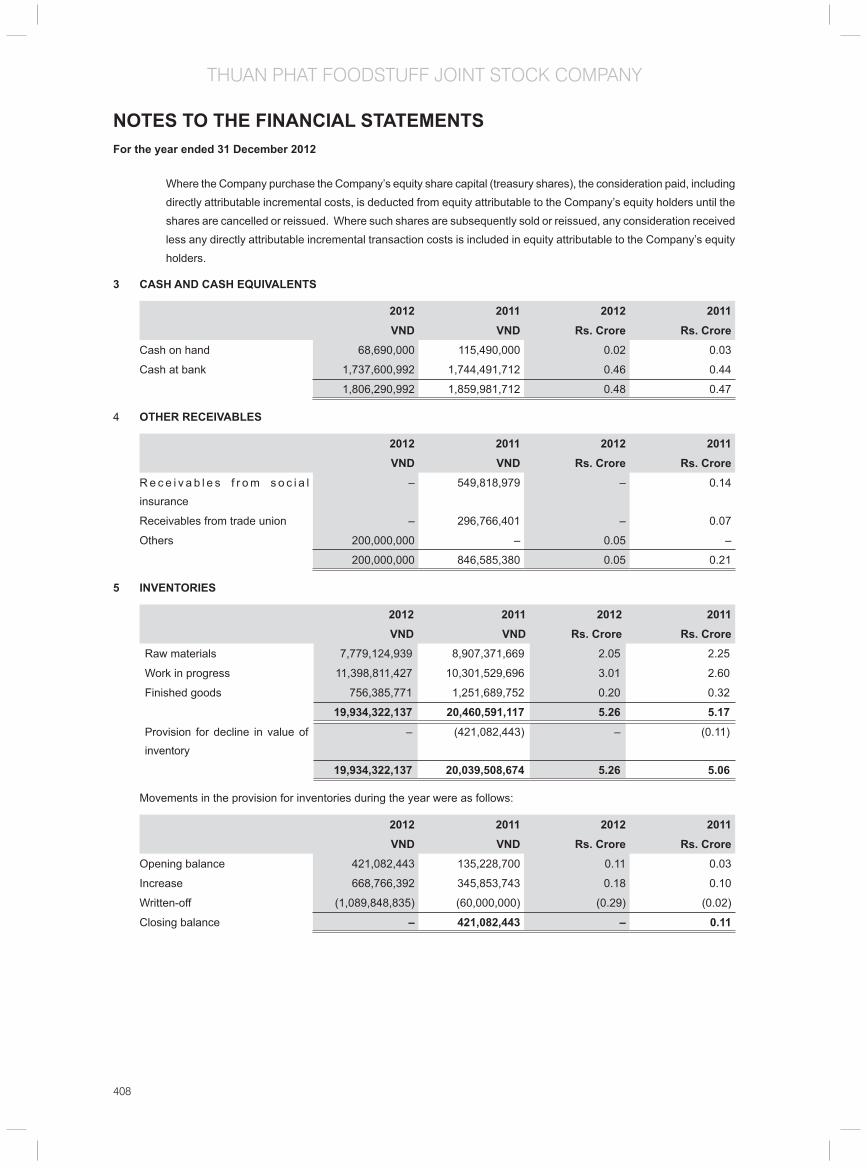
408
THUAN PHAT FOODSTUFF JOINT STOCK COMPANY
NOTES TO THE FINANCIAL STATEMENTSFor the year ended 31 December 2012
Where the Company purchase the Company’s equity share capital (treasury shares), the consideration paid, including directly attributable incremental costs, is deducted from equity attributable to the Company’s equity holders until the shares are cancelled or reissued. Where such shares are subsequently sold or reissued, any consideration received less any directly attributable incremental transaction costs is included in equity attributable to the Company’s equity holders.
3 CASH AND CASH EQUIVALENTS
2012 2011 2012 2011VND VND Rs. Crore Rs. Crore
Cash on hand 68,690,000 115,490,000 0.02 0.03
Cash at bank 1,737,600,992 1,744,491,712 0.46 0.44
1,806,290,992 1,859,981,712 0.48 0.47
4 OTHER RECEIVABLES
2012 2011 2012 2011VND VND Rs. Crore Rs. Crore
R e c e i v a b l e s f r o m s o c i a l insurance
– 549,818,979 – 0.14
Receivables from trade union – 296,766,401 – 0.07
Others 200,000,000 – 0.05 –
200,000,000 846,585,380 0.05 0.21
5 INVENTORIES
2012 2011 2012 2011VND VND Rs. Crore Rs. Crore
Raw materials 7,779,124,939 8,907,371,669 2.05 2.25
Work in progress 11,398,811,427 10,301,529,696 3.01 2.60
Finished goods 756,385,771 1,251,689,752 0.20 0.32
19,934,322,137 20,460,591,117 5.26 5.17
Provision for decline in value of inventory
– (421,082,443) – (0.11)
19,934,322,137 20,039,508,674 5.26 5.06
Movements in the provision for inventories during the year were as follows:
2012 2011 2012 2011VND VND Rs. Crore Rs. Crore
Opening balance 421,082,443 135,228,700 0.11 0.03
Increase 668,766,392 345,853,743 0.18 0.10
Written-off (1,089,848,835) (60,000,000) (0.29) (0.02)
Closing balance – 421,082,443 – 0.11

409
THUAN PHAT FOODSTUFF JOINT STOCK COMPANY
NOTES TO THE FINANCIAL STATEMENTSNotes to the fi nancial Statements as of 31 December 2012
6 OTHER TAXES RECEIVABLE
2012 2011 2012 2011VND VND Rs. Crore Rs. Crore
Business income tax refundable 56,473,862 56,473,862 0.01 0.01
7 TANGIBLE FIXED ASSETS
(a) Tangible fi xed assets
Buildings and
structures
Plant and
machinery
Motor
vehicles
Offi ce equipment
Total
VND VND VND VND VNDHistorical costAt 1 January 2012 7,078,660,854 11,301,987,412 649,038,822 372,611,194 19,402,298,282
New purchases 211,516,000 844,621,000 100,000,004 163,924,246 1,320,061,250
Disposals – (577,811,847) – (16,419,638) (594,231,485)
At 31 December 2012 7,290,176,854 11,568,796,565 749,038,826 520,115,802 20,128,128,047
Accumulated depreciationAt 1 January 2012 (1,273,529,615) (5,225,451,793) (443,492,803) (317,692,025) (7,260,166,236)
Charge for the year (425,884,424 ) (1,519,160,625) (112,752,814) (63,977,865) (2,121,775,728)
Disposals – 424,956,788 – 16,419,638 441,376,426
At 31 December 2012 (1,699,414,039) (6,319,655,630) (556,245,617) (365,250,252) (8,940,565,538) Net book valueAt 1 January 2012 5,805,131,239 6,076,535,619 205,546,019 54,919,169 12,142,132,046
At 31 December 2012 5,590,762,815 5,249,140,935 192,793,209 154,865,550 11,187,562,509
Buildings and
structures
Plant and
machinery
Motor
vehicles
Offi ce equipment
Total
Rs. Crore Rs. Crore Rs. Crore Rs. Crore Rs. CroreHistorical costAt 1 January 2012 1.87 2.98 0.17 0.10 5.12
New purchases 0.06 0.22 0.03 0.04 0.35
Disposals – (0.15) – – (0.16)
At 31 December 2012 1.93 3.06 0.20 0.14 5.32
Accumulated depreciation 1.93 3.06 0.20 0.14 5.32
At 1 January 2012
Charge for the year (0.34) (1.38) (0.12) (0.08) (1.92)
Disposals (0.11) (0.40) (0.03) (0.02) (0.56 )
At 31 December 2012 (0.45) (1.67 ) (0.15) (0.10) (2.36)
Net book value (0.45) (1.67 ) (0.15) (0.10) (2.36)
At 1 January 2012 1.53 1.60 0.05 0.01 3.21
At 31 December 2012 1.48 1.39 0.05 0.04 2.95
2012 2011 2012 2011VND VND Rs. Crore Rs. Crore
Cost of fully depreciated fi xed assets 2,119,623,040 477,037,137 0.56 0.12

410
THUAN PHAT FOODSTUFF JOINT STOCK COMPANY
NOTES TO THE FINANCIAL STATEMENTSFor the year ended 31 December 2012
(b) Intangible fi xed assets
Land use rights Computer software
Patents Total
VND VND VND VNDHistorical costAt 1 January 2012 22,515,101,000 163,360,000 720,817,817 23,399,278,817
Decreases 1,000,000,000 – – 1,000,000,000
At 31 December 2012 21,515,101,000 163,360,000 720,817,817 22,399,278,817
Accumulated amortisation
At 1 January 2012 (730,288,000 ) (5,104,998) (204,235,040) (939,628,038)
Charge for the year (445,024,869) (20,419,992) (144,168,000) (609,612,861)
Decreases 21,164,016 – – 21,164,016
At 31 December 2012 (1,154,148,853 ) (25,524,990) (348,403,040 ) (1,528,076,883)
Net book valueAt 1 January 2012 21,784,813,000 158,255,002 516,582,777 22,459,650,779
At 31 December 2012 20,360,952,147 137,835,010 372,414,777 20,871,201,934
Land use rights Computer software
Patents Total
Rs. Crore Rs. Crore Rs. Crore Rs. CroreHistorical costAt 1 January 2012 5.95 0.04 0.19 6.18
Decreases 0.26 – – 0.26
At 31 December 2012 5.68 0.04 0.19 5.92
Accumulated amortisation
At 1 January 2012 (0.19) (0.01) (0.05) (0.25)
Charge for the year (0.12) (0.01) (0.04) (0.16)
Decreases 0.01 – – 0.01
At 31 December 2012 (0.30) (0.01) (0.09) (0.40)
Net book valueAt 1 January 2012 5.75 0.04 0.14 5.93
At 31 December 2012 5.38 0.04 0.10 5.51
8 TRADE ACCOUNTS PAYABLE
2012 2011 2012 2011VND VND Rs. Crore Rs. Crore
Third parties 8,180,477,209 5,744,829,167 2.16 1.45
9 ADVANCE FROM CUSTOMERS
2012 2011 2012 2011VND VND Rs. Crore Rs. Crore
Related party (Note 24(b)) 13,697,446,375 22,349,011,145 3.62 5.64

411
THUAN PHAT FOODSTUFF JOINT STOCK COMPANY
NOTES TO THE FINANCIAL STATEMENTSNotes to the fi nancial Statements as of 31 December 2012
10 TAXES AND OTHER PAYABLES TO THE STATE BUDGET
2012 2011 2012 2011VND VND Rs. Crore Rs. Crore
Value Added Tax on domestic sales
600,645,848 435,458,710 0.16 0.11
Other taxes 86,171,890 77,549,058 0.02 0.02
686,817,738 513,007,768 0.18 0.13
11 ACCRUED EXPENSES
2012 2011 2012 2011VND VND Rs. Crore Rs. Crore
Marketing expenses 67,407,983 831,690,061 0.02 0.21
Service fees – 37,000,000 – 0.01
Others 323,222,900 108,800,000 0.08 0.03
390,630,883 977,490,061 0.10 0.25
12 OTHER PAYABLES
2012 2011 2012 2011VND VND Rs. Crore Rs. Crore
Social insurance and health insurance
72,301,814 204,567,441 0.02 0.05
Other payables 51,308,498 99,504,954 0.01 0.03
123,610,312 304,072,395 0.03 0.08
13 OWNERS’ CAPITAL
(a) Number of shares
2012 2011Ordinary shares Ordinary shares
Number of shares registered 3,140,000 3,140,000Number of existing shares in issue 3,140,000 3,140,000
(b) Movement of share capital
Charter capital Amount contributedVND % VND Rs. Crore
International Consumer Products Corporation
31,307,520,000 99.705 31,307,520,000 8.27
Others 92,480,000 2.95 92,480,000 0.0231,400,000,000 100 31,400,000,000 8.29
(c) Movement of share capital
Number of share capital
Ordinaryshares
Total Ordinaryshares
Total
(shares) VND VND Rs. Crore Rs. Crore
At 1 January 2012 3,140,000 31,400,000,000 31,400,000,000 8.29 8.29
At 31 December 2012 3,140,000 31,400,000,000 31,400,000,000 7.92 7.92
Par value per share: VND10,000.

412
THUAN PHAT FOODSTUFF JOINT STOCK COMPANY
NOTES TO THE FINANCIAL STATEMENTSFor the year ended 31 December 2012
14 MOVEMENTS IN OWNERS’ EQUITY
Owners’ capital
Accumulated losses
Total Owners’ capital
Accumulated losses
Total
VND VND VND Rs.Crore Rs. Crore Rs. Crore
As at 1 January 2011 31,400,000,000 3,742,921,449 35,142,921,449 8.29 0.99 9.28
Loss for the year – (6,576,242,922) (6,576,242,922) – (1.74) (1.74)
As at 31 December 2011 31,400,000,000 (2,833,321,473) 28,566,678,527 8.29 (0.75) 7.54
Profi t for the year – 1,393,594,537 1,393,594,537 – 0.37 0.37
As at 31 December 2012 31,400,000,000 (1,439,726,936) 29,960,273,064 8.29 (0.38) 7.91
15 REVENUE
2012 2011 2012 2011VND VND Rs. Crore Rs. Crore
Sales
Sales of goods 96,343,821,388 91,590,543,853 25.44 23.11
Sales deductions
Sales returns (401,986,980) (1,602,434,212) (0.11) (0.40)
Net revenue from sales of goods 95,941,834,408 89,988,109,641 25.34 22.70
16 COST OF SALES
2012 2011 2012 2011VND VND Rs. Crore Rs. Crore
Cost of fi nished goods sold 87,092,175,160 80,481,898,025 23.00 20.30
Provision for decline in value of inventories
(421,082,443) 285,853,743 (0.11) 0.07
86,671,092,717 80,767,751,768 22.89 20.37
17 FINANCIAL INCOME
2012 2011 2012 2011VND VND Rs. Crore Rs. Crore
Interest income from deposits and loans
– 42,284,258 – 0.01
Realised foreign exchange gain 39,271,226 32,657,801 0.01 0.01
39,271,226 74,942,059 0.01 0.02
18 SELLING EXPENSES
2012 2011 2012 2011VND VND Rs. Crore Rs. Crore
Labour cost 1,278,070,962 1,653,022,435 0.34 0.42
Depreciation cost 148,732,000 194,767,890 0.04 0.05
External services expenses 160,131,565 482,065,886 0.04 0.12

413
THUAN PHAT FOODSTUFF JOINT STOCK COMPANY
NOTES TO THE FINANCIAL STATEMENTSNotes to the fi nancial Statements as of 31 December 2012
19 GENERAL AND ADMINISTRATION EXPENSES
The following items have been included in general and administration expenses:
2012 2011 2012 2011VND VND Rs. Crore Rs. Crore
Labour cost 3,318,215,844 5,012,778,283 0.88 1.26
Depreciation cost 159,600,484 127,961,985 0.04 0.03
External services expenses 2,146,834,249 2,569,154,647 0.57 0.65
20 NET OTHER INCOME/EXPENSES
2012 2011 2012 2011VND VND Rs. Crore Rs. Crore
Other incomeGains on disposal of fi xed assets 1,252,175,000 – 0.33 –
Others 57,448,758 121,728,397 0.02 0.03
1,309,623,758 121,728,397 0.35 0.03
Other expensesLosses on disposal of fi xed assets (1,131,691,043) – (0.30) –
Damaged raw materials and fi nish goods – (23,284,500) – (0.01)
Others (102,944,737) (162,011,546) (0.03) (0.04)
(1,234,635,780) (185,296,046) (0.33) (0.05)
Net other income/expenses 74,987,978 (63,567,649) 0.02 (0.02)
21 TAXATION
The tax on the Company’s profi t before tax differs from the theoretical amount that would arise using the tax rate of 25% regulated in the Business Registration Certifi cate of the Company as follows:
2012 2011 2012 2011VND VND Rs. Crore Rs. Crore
Net accounting profi t/(loss) before tax 1,393,594,537 (6,576,242,922) 0.37 (1.66)
Tax calculated at a rate of 25% 348,398,634 1,644,060,731 0.09 0.41
Effect of:
Expenses not deductible for tax purposes 493,183,059 398,105,385 0.13 0.10
Utilised tax losses (841,581,694) – (0.22) –
Tax losses for which no deferred income tax
asset was recognised – 1,245,955,346 – 0.31
Business income tax charge – – – –
The Company’s tax losses can be carried forward to offset against future taxable profi ts for a maximum period of no more than fi ve consecutive years from the year right after the year in which the loss was incurred. The actual amount of tax losses that can be carried forward is subject to review and approval of the tax authorities and may be different from the fi gures presented. The estimated amount of tax losses available for offset against the Company’s future taxable profi ts are:

414
THUAN PHAT FOODSTUFF JOINT STOCK COMPANY
NOTES TO THE FINANCIAL STATEMENTSFor the year ended 31 December 2012
21 TAXATION (Cont.)
Year of tax loss Status of tax authorities’ review
Losses available Status of tax authorities’ review
Losses available
VND Rs. Crore
2010 Finalised 392,271,000 Finalised 0.10
2011 Outstanding 4,983,821,383 Outstanding 1.26
The Company did not recognise deferred income tax assets relating to the above tax losses carried forward, as the realisation of the related tax benefi t through future taxable profi t currently cannot be assessed as probable.
22 COST OF GOODS MANUFACTURED BY FACTORS
2012 2011 2012 2011VND VND Rs. Crore Rs. Crore
Raw materials 69,638,986,807 69,428,281,122 18.39 17.51
Labour costs 12,950,267,339 12,272,356,474 3.42 3.10
Depreciation expense 2,716,999,844 2,495,569,016 0.72 0.63
Outside service expenses 4,560,600,701 5,117,524,174 1.20 1.29
Other cash expenses 4,795,644,384 7,074,267,231 1.27 1.79
94,662,499,075 96,387,998,017 25.00 24.32
23 FINANCIAL RISK MANAGEMENT
The Company’s activities expose it to including liquidity risk. The Company’s overall risk management strategy seeks to minimise adverse effect of these risks on the Company’s fi nancial performance.
Liquidity risk
As at 31 December 2012, the Company had the fi nancial liabilities comprising trade and other payables amounting to VND8,694,718,404 (2011: VND7,026,391,623) which represented contractual undiscounted cash outfl ows payable in less than 1 year.
24 RELATED PARTY TRANSACTIONS
(a) Related party transactions
During the year, the following transactions were carried out with related parties:
i) Sales of goods and services
2012 2011 2012 2011VND VND Rs. Crore Rs. Crore
International Consumer Products Corporation
95,222,872,514 87,282,837,875 25.15 22.02

415
THUAN PHAT FOODSTUFF JOINT STOCK COMPANY
NOTES TO THE FINANCIAL STATEMENTSNotes to the fi nancial Statements as of 31 December 2012
ii) Purchases of goods and services
2012 2011 2012 2011VND VND Rs. Crore Rs. Crore
International Consumer Products Corporation
107,590,735 324,382,149 0.03 0.08
Beauti Cosmetique Societe Par Actions
25,000,000 – 0.01 –-
132,590,735 324,382,149 0.04 0.08
iii) Compensation of key management
2012 2011 2012 2011VND VND Rs. Crore Rs. Crore
International Consumer Products Corporation
13,697,446,375 22,349,011,145 3.62 5.64
(b) Year end balances with related parties
i) Advance from customers (Note 9)
2012 2011 2012 2011VND VND Rs. Crore Rs. Crore
International Consumer Products Corporation
13,697,446,375 22,349,011,145 3.62 5.64
ii) Accrued expenses
2012 2011 2012 2011VND VND Rs. Crore Rs. Crore
Beauti Cosmetique Societe Par Actions
25,000,000 – 0.01 –
25 COMMITMENTS UNDER OPERATING LEASES
The future minimum lease payments under non-cancellable operating leases are as follows:
2012 2011 2012 2011VND VND Rs. Crore Rs. Crore
Within 1 year 799,795,200 801,986,420 0.21 0.20
Between 1 and 5 years 1,401,832,820 2,201,628,020 0.37 0.56
Total minimum payments 2,201,628,020 3,003,614,440 0.58 0.76
The fi nancial statements were approved by the Board of Directors on 11 March, 2013.
Hoang Van Nghien Phan Cong Thanh
Chief Accountant General Director

416
M A R I C O C O N S U M E R C A R E L I M I T E D
Board of Directors Harsh Mariwala Milind Sarwate Saugata Gupta
Registered Offi ce 7th Floor, Grande Palladium, 175, CST Road, Kalina, Santacruz (East), Mumbai - 400 098. (w.e.f. July 9, 2013)
Auditors M/s. Price Waterhouse Chartered Accountants
Bankers HSBC Bank, Mumbai

417
M A R I C O C O N S U M E R C A R E L I M I T E D
DIRECTORS’ REPORTToThe Members
Your Board of Directors (“Board”) is pleased to present the First Annual Report together with audited accounts of your Company for the period from April 20, 2012 to March 31, 2013 (‘the period under review’, ‘the period’ or ‘FY13’).
FINANCIAL RESULTS - AN OVERVIEW
Your Company was incorporated on April 20, 2012 and the Certifi cate of Commencement of Business was issued on May 4, 2012, by the Ministry of Corporate Affairs, Registrar of Companies, Mumbai. During the period under review, your Company reported total revenue of Rs. 5,20,13,415 and incurred a profi t after tax of Rs. 3,29,06,105.
Period ended March 31,2013 2012
Rs. Crore Rs. CroreProfi t before exceptional & extraordinary item and Tax (1,10,93,095) Nil
Less : Exceptional items (detailed later in this Report) 5,91,33,273 Nil
Profi t before Tax 4,80,40,178 Nil
Less: Current Tax 1,51,34,073 Nil
Profi t after Tax 3,29,06,105 Nil
Add: Profi t brought forward Nil Nil
Less: Transfer to General Reserve Nil Nil
Balance carried forward 3,29,06,105 Nil
DISTRIBUTION TO SHAREHOLDERS
With a view to conserve resources for funding any future business requirements and expansion plans, your Directors do not recommended any dividend on Equity Shares for the period under review.
ACQUSITION OF BUSINESS AND REDUCTION OF CAPITAL
During the year under review, on May 29, 2012, the Company acquired 100% stake in Halite Personal Care India Private Limited (“Halite”) for a consideration of Rs.745,60,00,899 from Reckitt Benckiser, Singapore. To fund the purchase consideration, your Company issued 7,45,65,000 equity shares of face value of Rs. 10 each to Marico Limited, its holding company, at a premium of Rs. 90/- per share.
Your Company, as the sole shareholder of Halite resolved that Halite be voluntarily liquidated vide a special resolution at the extra ordinary general meeting held on January 18, 2013. Your Company also appointed a liquidator. In view of the liquidation, the liquidator, on March 25, 2013, distributed the assets of Halite (viz. intellectual property rights, cash at bank and tangible fi xed assets) to your Company, being the sole shareholder of Halite. The Company has taken over assets of Halite at fair values, determined by an independent valuer, as applicable. On distribution, the Company received assets in excess of its Equity investment in Halite, resulting in profi t of Rs. 5,91,33,273 which is shown as an exceptional item. (Refer the fi nancial results above)
The members of your Company at their meeting held on April 1, 2013 decided to adjust the carrying costs of acquired intellectual property rights upon voluntary liquidation of Halite (refer the paragraph above), directly against the net worth of your Company, in accordance with the provisions of Section 78 (read with sections 100 to 103) of the Companies Act, 1956. The said Reduction of Capital is subject to the approval of the Hon’ble High Court of judicature at Bombay (“the Court”). The Company has fi led a Petition with the High Court on April 22, 2013.
DIRECTORS
Mr. Harsh Mariwala, Mr. Milind Sarwate and Mr. Saugata Gupta were appointed as the First Directors of the Company with effect from the date of incorporation of the Company i.e. April 20, 2012. Mr. Saugata Gupta was appointed as Managing Director of the Company for a period of fi ve years with effect from November 2, 2012 in the Extra Ordinary General Meeting of the Company held on November 2, 2012.

418
M A R I C O C O N S U M E R C A R E L I M I T E D
None of the Directors are retiring by rotation this year, as in terms of Section 256 of the Act, Directors liable to retire by rotation are those Directors appointed by the shareholders at the General Meeting. In terms of Article 129 (c) of the Articles of Association of the Company, Mr. Saugata Gupta being the Managing Director is not liable to retire by rotation. Mr. Harsh Mariwala and Mr. Milind Sarwate who were appointed as First Directors at the time of Incorporation are now being regularized as Directors at the ensuing Annual General Meeting.
CONSTITUTION OF AUDIT COMMITTEE
Pursuant to provisions of sub-section (4) of Section 292 A of the Companies Act, 1956, your Company has constituted an Audit Committee of its Board of Directors at their meeting held on March 25, 2013. The Audit Committee comprises the following:
Harsh Mariwala – Chairman of the Committee
Milind Sarwate – Member
Saugata Gupta – Member
Vishal Jain – Secretary to the Committee
The terms governing the constitution of the Audit Committee are as follows:
i. the Quorum for the Audit Committee shall be two Directors present in person;
ii. the functions of Audit Committee shall be:
a. Discussions with auditors periodically about internal control systems, scope of audit including the observations of the auditors;
b. Review the annual fi nancial statements before submission to the Board;
c. Ensuring compliance with internal control systems;
d. Making recommendations to the Board on the matters relating to the fi nancial management and audit report;
e. Recommending to the Board, the appointment, re-appointment and, if required, the replacement or removal of the statutory auditor and the fi xation of audit fees;
f. Approval of payment to statutory auditors for any other services rendered by the statutory auditors;
g. Seeking information from any employee;
h. Obtaining external Legal/Professional advice;
i. Inviting external experts, if necessary;
j. Investigation into any activity referred to it;
PUBLIC DEPOSITS
During the period under review, your Company neither accepted nor renewed any deposits within the meaning of Section 58A of the Companies Act, 1956 and rules made there under.
PARTICULARS OF EMPLOYEES
There are no employees covered under Section 217 (2A) of the Companies Act, 1956 read with Companies (Particulars of Employees) Rules, 1975 as amended from time to time.
CONSERVATION OF ENERGY, TECHNOLOGY ABSORPTION & FOREIGN EXCHANGE
Provisions to Section 217(1)(e) of the Companies Act, 1956 read with Companies (Disclosure of Particulars in the Report of Board of Directors) Rules,1998 is not applicable to the Company as the Company does not have any manufacturing activities. There is no foreign exchange earning and outgo during the period under review.
DIRECTORS’ REPORT (contd.)
419
M A R I C O C O N S U M E R C A R E L I M I T E D
DIRECTORS’ REPORT (contd.)
DIRECTORS’ RESPONSIBILITY STATEMENT
Pursuant to Section 217(2AA) of the Companies Act, 1956 (the Act), amended by the Companies (Amendment) Act, 2000, the Directors confi rm that:
1. In preparation of the Annual Accounts of your Company, the Accounting Standards, laid down by the Institute of Chartered Accountants of India from time to time, have been followed and that no material departures have been made from the same;
2. Appropriate accounting policies have been selected and applied consistently, and reasonable and prudent judgment and estimates have been made so as to ensure that the accounts give a true and fair view of the state of affairs of your Company as at March 31, 2013 and the profi ts of your Company for the period ended on that date;
3. Proper and suffi cient care has been taken for maintenance of appropriate accounting records in accordance with the provisions of the Act for safeguarding the assets of your Company and for preventing and detecting fraud and other irregularities;
4. The annual accounts have been prepared on a going concern basis;
Further, your Directors also confi rm that the observations of the Auditors in their report to the Members have been adequately dealt with in the relevant notes to the accounts. Hence no additional explanation is considered necessary.
STATUTORY AUDITORS
M/s. Price Waterhouse, Chartered Accountants, fi rst statutory auditors of the Company retire at the ensuing Annual General Meeting and have confi rmed their eligibility for reappointment.
ACKNOWLEDGEMENT
The Board takes this opportunity to thank, the Company’s Bankers, its business associates and all other regulatory authorities for the co-operation and support extended by them from time to time and look forward to continued support of all these partners in progress.
On behalf of the Board of Directors
Saugata Gupta Milind Sarwate Managing Director Director
Place : Mumbai Date : April 30, 2013

420
M A R I C O C O N S U M E R C A R E L I M I T E D
To the Members of Marico Consumer Care Limited
Report on the Financial Statements
1. We have audited the accompanying fi nancial statements of Marico Consumer Care Limited (the “Company”), which comprise the Balance Sheet as at March 31, 2013, and the Statement of Profi t and Loss and Cash Flow Statement for the period April 20, 2012 to March 31, 2013, and a summary of signifi cant accounting policies and other explanatory information, which we have signed under reference to this report.
Management’s Responsibility for the Financial Statements
2. The Company’s Management is responsible for the preparation of these fi nancial statements that give a true and fair view of the fi nancial position, fi nancial performance and cash fl ows of the Company in accordance with the Accounting Standards referred to in sub-section (3C) of section 211 of ‘the Companies Act, 1956’ of India (the “Act”). This responsibility includes the design, implementation and maintenance of internal control relevant to the preparation and presentation of the fi nancial statements that give a true and fair view and are free from material misstatement, whether due to fraud or error.
Auditors’ Responsibility
3. Our responsibility is to express an opinion on these fi nancial statements based on our audit. We conducted our audit in accordance with the Standards on Auditing issued by the Institute of Chartered Accountants of India. Those Standards require that we comply with ethical requirements and plan and perform the audit to obtain reasonable assurance about whether the fi nancial statements are free from material misstatement.
4. An audit involves performing procedures to obtain audit evidence, about the amounts and disclosures in the fi nancial statements. The procedures selected depend on the auditors’ judgment, including the assessment of the risks of material misstatement of the fi nancial statements, whether due to fraud or error. In making those risk assessments, the auditors consider internal control relevant to the Company’s preparation and fair presentation of the fi nancial statements in order to design audit procedures that are appropriate in the circumstances. An audit also includes evaluating the appropriateness of accounting policies used and the reasonableness of the accounting estimates made by Management, as well as evaluating the overall presentation of the fi nancial statements.
5. We believe that the audit evidence we have obtained is suffi cient and appropriate to provide a basis for our audit opinion.
Opinion
6. In our opinion, and to the best of our information and according to the explanations given to us, the accompanying fi nancial statements give the information required by the Act in the manner so required and give a true and fair view in conformity with the accounting principles generally accepted in India:
(a) in the case of the Balance Sheet, of the state of affairs of the Company as at March 31, 2013;
(b) in the case of the Statement of Profi t and Loss, of the profi t for the period April 20,2012 to March 31,2013 on that date; and
(c) in the case of the Cash Flow Statement, of the cash fl ows for the period April 20,2012 to March 31,2013 ended on that date.
Report on Other Legal and Regulatory Requirements
7. As required by ‘the Companies (Auditor’s Report) Order, 2003’, as amended by ‘the Companies (Auditor’s Report) (Amendment) Order, 2004’, issued by the Central Government of India in terms of sub-section (4A) of section 227 of the Act (hereinafter referred to as the “Order”), and on the basis of such checks of the books and records of the Company as we considered appropriate and according to the information and explanations given to us, we give in the Annexure a statement on the matters specifi ed in paragraphs 4 and 5 of the Order.
INDEPENDENT AUDITORS’ REPORT

421
M A R I C O C O N S U M E R C A R E L I M I T E D
INDEPENDENT AUDITORS’ REPORT (Contd.)
8. As required by section 227(3) of the Act, we report that:
(a) We have obtained all the information and explanations which, to the best of our knowledge and belief, were necessary for the purpose of our audit;
(b) In our opinion, proper books of account as required by law have been kept by the Company so far as appears from our examination of those books;
(c) The Balance Sheet, Statement of Profi t and Loss, and Cash Flow Statement dealt with by this Report are in agreement with the books of account;
(d) In our opinion, the Balance Sheet, Statement of Profi t and Loss, and Cash Flow Statement dealt with by this report comply with the Accounting Standards referred to in sub-section (3C) of section 211 of the Act;
(e) On the basis of written representations received from the directors as on March 31, 2013, and taken on record by the Board of Directors, none of the directors is disqualifi ed as on March 31, 2013, from being appointed as a director in terms of clause (g) of sub-section (1) of section 274 of the Act.
For Price Waterhouse Firm Registration Number: 301112E Chartered Accountants
Uday ShahPlace : Mumbai PartnerDate : April 30, 2013 Membership Number: 46061

422
M A R I C O C O N S U M E R C A R E L I M I T E D
BALANCE SHEET As at 31 March 2013
Notes As at 31 March 2013Rs. Crore
EQUITY AND LIABILITIES
Shareholders’ fundsShare capital 3 74.62
Reserves and surplus 4 673.05
747.67
Current liabilitiesShort-term borrowings 5 1.34
Trade payables 6 0.02
Other current liabilities 7 0.01
1.37
TOTAL 749.04
ASSETS
Non-current assets Fixed assets
Tangible assets 8A 0.72
Intangible assets 8B 723.72
724.44
Long-term loans and advances 9 0.03
724.47
Current assetsCurrent investments 10 24.54
Cash and bank balances 11 0.01
Short-term loans and advances 12 0.02
24.57
TOTAL 749.04
Signifi cant accounting policies 2
The notes referred to above form an integral part of the fi nancial statements.
As per our report of even date attached.
For Price Waterhouse For and on behalf ofChartered Accountants Marico Consumer Care LimitedFirm Registration Number: 301112E
Harsh Mariwala Director
Uday ShahPartner Saugata Gupta DirectorMembership No.: 46061
Vishal Jain Company SecretoryPlace: Mumbai Place: Mumbai Place: MumbaiDate: April 30, 2013 Date: April 30, 2013 Date: April 30, 2013

423
M A R I C O C O N S U M E R C A R E L I M I T E D
Notes For the period from April 20, 2012 to March
31, 2013Rs. Crore
Other income
13 5.20
Total revenue 5.20
Expenses
Finance cost 14 0.01
Depreciation and amortisation 15 6.09
Other expenses 16 0.21
Total expenses 6.31
PROFIT / (LOSS) BEFORE EXCEPTIONAL AND EXTRAORDINARY ITEMS AND TAX (1.11)
Exceptional items 20 5.91
Profi t before tax 4.80
Tax expense:
Current tax 1.51
Profi t for the period 3.29
Basic and diluted earnings per equity share (nominal value of share Rs. 10) 0.50
Signifi cant accounting policies 2
The notes referred to above form an integral part of the fi nancial statements.
As per our report of even date attached.
For Price Waterhouse For and on behalf ofChartered Accountants Marico Consumer Care LimitedFirm Registration Number: 301112E
Harsh Mariwala Director
Uday ShahPartner Saugata Gupta DirectorMembership No.: 46061
Vishal Jain Company SecretoryPlace: Mumbai Place: Mumbai Place: MumbaiDate: April 30, 2013 Date: April 30, 2013 Date: April 30, 2013
PROFIT AND LOSS As at 31 March 2013

424
M A R I C O C O N S U M E R C A R E L I M I T E D
CASH FLOW STATEMENTFor the year ended 31 March 2013
Year ended March 31, 2013Rs. Crore
A CASH FLOW FROM OPERATING ACTIVITIES
PROFIT BEFORE TAXATION AND AFTER EXCEPTIONAL ITEMS 4.80 Adjustments for:Depreciation, amortisation and impairment 6.09 Finance charges – (Profi t) / Loss on sale of investments (net) – Dividend income (5.11)
0.98
Operating profi t before working capital changes 5.78
Adjustments for:(Increase)/ Decrease in inventories – (Increase)/ Decrease in sundry debtors –(Increase)/ Decrease in loans and advances and other assets –Increase/( Decrease) in current liabilities and provisions 0.03
Changes in Working Capital 0.03
Cash generated from Operations 5.82
Taxes paid (net of refunds) (1.55)
NET CASH INFLOW FROM OPERATING ACTIVITIES 4.27
B CASH FLOW FROM INVESTING ACTIVITIES
Purchase of fi xed assets (730.53)(Purchase) / Sale of investments (net) (24.52)Loans and advances repaid by related parties (0.03)Loans and advances given to related parties – Dividend income received 5.11 Interest received –
NET CASH OUTFLOW FROM INVESTING ACTIVITIES (749.98)
C CASH FLOW FROM FINANCING ACTIVITIES
Proceeds from issuance of Share Capital on exercise of stock option 744.38 Issue / (Redemption) of commercial papers (net) 1.34 Finance charges paid – Equity dividend paid (inclusive of dividend distribution tax) –
NET CASH INFLOW FROM FINANCING ACTIVITIES 745.72
D NET INCREASE / (DECREASE) IN CASH & CASH EQUIVALENTS (A+B+C) 0.01
E Cash and cash equivalents - opening balance (as at April 1) –
F Cash and cash equivalents - closing balance (as at March 31) 0.01
As per our report of even date attached.
For Price Waterhouse For and on behalf ofChartered Accountants Marico Consumer Care LimitedFirm Registration Number: 301112E
Harsh Mariwala Director
Uday ShahPartner Saugata Gupta DirectorMembership No.: 46061
Vishal Jain Company SecretoryPlace: Mumbai Place: Mumbai Place: MumbaiDate: April 30, 2013 Date: April 30, 2013 Date: April 30, 2013

425
M A R I C O C O N S U M E R C A R E L I M I T E D
NOTES TO THE FINANCIAL STATEMENTS 31 March 2013
1 The Company and nature of its operations:
Marico Consumer Care Limited(‘MCCL’ or ‘the Company’)was incorporated on April 20, 2012 with paid-up share capital of Rs.500,000. MCCL is 100% subsidiary of Marico Limited (‘ML’). MCCL headquartered in Mumbai, Maharashtra, India, carries on business in branded consumer products.
2. Summary of signifi cant accounting policies:
(a) Basis of preparation of fi nancial statements
The fi nancial statements are prepared in accordance with the Generally Accepted Accounting Principles (“GAAP”) in India under the historical cost convention on an accrual basis and are in conformity with mandatory accounting standards, as prescribed by the Companies (Accounting Standards) Rules, 2006, the provisions of the Companies Act, 1956.
All assets and liabilities have been classifi ed as current or non-current as per the Company’s normal operating cycle and other criteria set out in the Schedule VI to the Companies Act, 1956.
(b) Use of estimates
The preparation of the fi nancial statements in conformity with GAAP requires the management to make estimates and assumptions that affect the reported balances of assets and liabilities and disclosures relating to contingent assets and liabilities as at the date of the fi nancial statements and reported amounts of income and expenses during the period. Examples of such estimates include provisions for income taxes, the useful lives and provision for impairment of fi xed assets and intangible assets.
Management believes that the estimates used in the preparation of fi nancial statements are prudent and reasonable. Future results could differ from these estimates.
(c) Tangible assets, intangible assets and capital work-in-progress
Tangible assets and intangible assets are stated at cost of acquisition, less accumulated depreciation/amortisation and impairments, if any. Cost includes taxes, duties, freight and other incidental expenses related to acquisition and installation. Borrowing costs attributable to acquisition, construction of qualifying asset are capitalized until such time as the assets are substantially ready for their intended use. Other pre-operative expenses for major projects are also capitalised, where appropriate.
(d) Depreciation and amortisation
I. Tangible assets
(i) Depreciation is provided at higher of the rates based on useful lives of the assets as estimated by the management or those stipulated in Schedule XIV to the Companies Act, 1956. The depreciation rates considered for the following items are higher than the rates stipulated in Schedule XIV to the Companies Act, 1956:
Asset Rates (p.a.)Computer hardware and related peripherals 33.33%
Moulds 16.21%
II. Intangible assets
Intangible assets are amortised on a straight line basis at the rates based on estimated useful lives of respective assets, but not exceeding the rates given here under:
Asset Rates (p.a.)Trademarks, copyrights and business and commercial rights 10%
Computer software 33.33%
A rebuttable presumption that the useful life of an intangible asset will not exceed ten years from the date when the asset is available for use is considered by the management.

426
M A R I C O C O N S U M E R C A R E L I M I T E D
III. Assets individually costing Rs.5,000 or less are fully depreciated during the year of acquisition.
(e) Investments
(i) Long term investments are valued at cost. Provision for diminution, if any, in the value of investments is made to recognise a decline in value, other than temporary.
(ii) Current investments are valued at lower of cost and fair value, computed individually for each investment. In case of investments in mutual funds which are unquoted, net asset value is taken as fair value.
(f) Accounting for taxes on income
Provision for current tax is made, based on the tax payable under the Income Tax Act, 1961. Minimum Alternative Tax (MAT) credit, which is equal to the excess of MAT (calculated in accordance with provisions of Section 115JB of the Income tax Act, 1961) over normal income-tax is recognized as an asset by crediting the Statement of Profi t and Loss only when and to the extent there is convincing evidence that the Company will be able to avail the said credit against normal tax payable during the period of ten succeeding assessment years.
(g) Impairment
The Company reviews the carrying values of tangible and intangible assets for any possible impairment at each balance sheet date. An impairment loss is recognised when the carrying amount of an asset exceeds its recoverable amount. The recoverable amount is the greater of net selling price and value in use. In assessing the value in use, the estimated future cash fl ows are discounted to their present value at appropriate discount rates. If at the balance sheet date there is an indication that a previously assessed impairment loss no longer exists, the recoverable amount is reassessed and the asset is refl ected at the recoverable amount.
(h) Provisions and Contingent Liabilities
Contingent Liabilities are disclosed in respect of possible obligations that arise from past events but their existence will be confi rmed by the occurrence or non occurrence of one or more uncertain future events not wholly within the control of the Company or where any present obligation cannot be measured in terms of future outfl ow of resources or where a reliable estimate of the obligation cannot be made.
A Provision is made based on a reliable estimate when it is probable that an outfl ow of resources embodying economic benefi ts will be required to settle an obligation and in respect of which a reliable estimate can be made. Provision is not discounted and is determined based on best estimate required to settle the obligation at the year end date. Contingent Assets are not recognized or disclosed in the fi nancial statements.
(i) Share issue Expenses
Expenses incurred on issues of shares are adjusted against Securities Premium Reserve.
(j) Cash and Cash Equivalents
In the cash fl ow statement, cash and cash equivalents includes cash in hand, demand deposits with banks, other short-term highly liquid investments with original maturities of three months or less.
(k) Earnings Per Share
Basic earnings per share is calculated by dividing the net profi t or loss for the period attributable to equity shareholders by the weighted average number of equity shares outstanding during the period. Earnings considered in ascertaining the Company’s earnings per share is the net profi t for the period after deducting preference dividends and any attributable tax thereto for the period. The weighted average number of equity shares outstanding during the period and for all periods presented is adjusted for events, such as bonus shares, other than the conversion of potential equity shares, that have changed the number of equity shares outstanding, without a corresponding change in resources.
NOTES TO THE FINANCIAL STATEMENTS 31 March 2013

427
M A R I C O C O N S U M E R C A R E L I M I T E D
NOTES TO THE FINANCIAL STATEMENTS 31 March 2013
3. Share capital
As at 31 March 2013 Rupees
Authorised share capital
80,000,000 equity shares of Rs. 10 each 80.00
80.00
Issued, subscribed and paid-up
74,615,000 equity shares of Rs. 10 each fully paid-up 74.62
74.62
a. Reconciliation of shares outstanding at the beginning and at the end of the reporting periodEquity Shares
As at 31 March 2013Number of shares Rupees
At the time of incorporation i.e. April 20, 2012 50,000 0.05
Issued during the period 74,565,000 74.57
As at the end of the period 74,615,000 74.62
b. Rights of equity shareholders
The Company has a single class of equity shares. Accordingly, all equity shares rank equally with regard to dividends and share in the company’s residual assets. The equity shares are entitled to receive dividend as declared. On winding up of the company, the holders of equity shares will be entitled to receive the residual assets of the Company, remaining after distribution of all preferential amounts in proportion of the number of equity shares held.
c. Shares held by holding company
As at 31 March 2013Number of shares Rupees
Equity shares of Rs.10 each fully paid up held by
Marico Limited and its nominees 74,615,000 74.62
74,615,000 74.62
d. Particulars of shareholders holding more than 5% shares of a class of shares
As at 31 March 2013Number of shares Rupees
Equity shares of Rs.10 each fully paid-up held by
Marico Limited and its nominees 74,615,000 100.00%

428
M A R I C O C O N S U M E R C A R E L I M I T E D
NOTES TO THE FINANCIAL STATEMENTS 31 March 2013
4. Reserves and surplus
As at 31 March 2013
As at 31 March 2013
Rupees Rs. Crore Securities Premium ReserveAt the commencement of the year – –
Add: during the year 6,710,850,000 671.09
Less: Amount adjusted towards share issue expenses 13,222,039 1.32
6,697,627,961 669.77
Surplus in Statement of Profi t and Loss
At the commencement of the year – –
Add: Profi t/ (loss) for the period 32,906,106 3.29
32,906,106 3.29
Total reserves and surplus 6,730,534,067 673.06
5. Short-term borrowings
As at 31 March 2013
As at 31 March 2013
Rupees Rs. Crore Loans and advances from Holding CompanyMarico Limited 13,350,148 1.34
Total 13,350,148 1.34
6. Trade payables
As at 31 March 2013
As at 31 March 2013
Rupees Rs. Crore Trade payables - due to micro and small enterprises – –
- due to others 207,866 0.02
207,866 0.02
7. Other current liabilities
As at 31 March 2013
As at 31 March 2013
Rupees Rs. Crore Other payables Amount payable - Statutroy / Government Authorities 108,795 0.01
Total 108,795 0.01

429
M A R I C O C O N S U M E R C A R E L I M I T E D
NO
TES
TO T
HE
FIN
AN
CIA
L ST
ATEM
ENTS
31
Mar
ch 2
013
8A In
tang
ible
ass
ets
In R
upee
sPa
rtic
ular
sG
ross
blo
ckD
epre
ciat
ion/
am
ortis
atio
nN
et b
lock
As
at
30 A
pril
2012
Acq
uisi
tion
Add
ition
sD
elet
ion
As
at
31 M
arch
201
3A
s at
30
Apr
il 20
12A
cqui
sitio
nFo
r the
pe
riod
Ded
uctio
ns /
Adj
ustm
ents
As
at
31 M
arch
201
3A
s at
31
Mar
ch 2
013
Tang
ible
Ass
ets
Pla
nt a
nd m
achi
nery
(Not
e a,
g &
h)
– 0
.73
––
0.7
3 –
– 0
.01
0.01
0.
72
Com
pute
rs–
––
– –
––
– –
Tota
l–
0.7
3 –
– 0
.73
––
0.0
1 0.
010.
72
8B In
tang
ible
ass
ets
Part
icul
ars
Gro
ss b
lock
Dep
reci
atio
n/ a
mor
tisat
ion
Net
blo
ckA
s at
30
Apr
il 20
12A
djus
tmen
tA
dditi
ons
Del
etio
nA
s at
31
Mar
ch 2
013
As
at
30 A
pril
2012
Adju
stm
ent
For t
he
perio
dD
educ
tions
/ A
djus
tmen
ts A
s at
31
Mar
ch 2
013
As
at
31 M
arch
201
3
Inta
ngib
le a
sset
s
Trad
emar
ks–
729
.80
––
729
.80
––
6.08
–6.
0872
3.72
Tota
l–
729
.80
––
729
.80
––
6.08
–6.
0872
3.72
(a)
Trad
emar
ks o
f Rs.
729
.80
Cro
re a
re p
endi
ng re
gist
ratio
n / r
ecor
ding
in
nam
e of
the
Com
pany
.
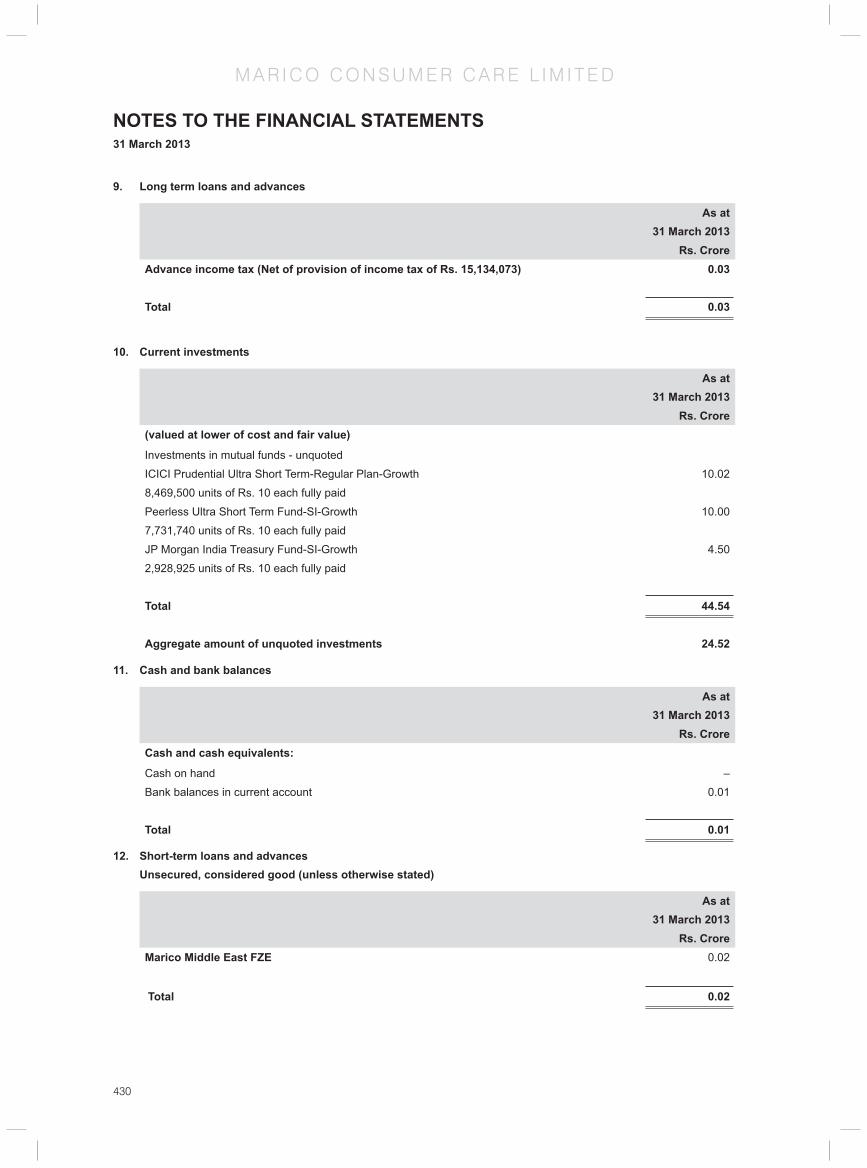
430
M A R I C O C O N S U M E R C A R E L I M I T E D
9. Long term loans and advances
As at 31 March 2013
Rs. Crore Advance income tax (Net of provision of income tax of Rs. 15,134,073) 0.03
Total 0.03
10. Current investments
As at 31 March 2013
Rs. Crore (valued at lower of cost and fair value)
Investments in mutual funds - unquoted
ICICI Prudential Ultra Short Term-Regular Plan-Growth 10.02
8,469,500 units of Rs. 10 each fully paid
Peerless Ultra Short Term Fund-SI-Growth 10.00
7,731,740 units of Rs. 10 each fully paid
JP Morgan India Treasury Fund-SI-Growth 4.50
2,928,925 units of Rs. 10 each fully paid
Total 44.54
Aggregate amount of unquoted investments 24.52
11. Cash and bank balances
As at 31 March 2013
Rs. Crore Cash and cash equivalents:
Cash on hand –
Bank balances in current account 0.01
Total 0.01
12. Short-term loans and advancesUnsecured, considered good (unless otherwise stated)
As at 31 March 2013
Rs. Crore Marico Middle East FZE 0.02
Total 0.02
NOTES TO THE FINANCIAL STATEMENTS 31 March 2013

431
M A R I C O C O N S U M E R C A R E L I M I T E D
13. Other income
For the period from April 20, 2012 to March 31, 2013
Rs. CroreDividend Income
On current investments 0.06
From subsidiary 5.06
Total 5.12
Net Gain on sale of Current Investments –Total 5.12
Royalty income 0.08
Total 5.20
14. Finance cost
For the period from April 20, 2012 to March 31, 2013
Rs. CroreInterest Cost 0.01
Bank and other fi nancial charges –
Total 0.01
15. Depreciation and amortisation
For the period from April 20, 2012 to March 31, 2013
Rs. CroreDepreciation on tangible assets 0.01
Amortisation of Intangible assets 6.08
Total 6.09
16. Other expenses
For the period from April 20, 2012 to March 31, 2013
Rs. CroreLegal and professional charges 0.19
Payments to the auditor as Statutory Audit fees 0.03
Miscellaneous expenses 0.01
Total 0.22
NOTES TO THE FINANCIAL STATEMENTS 31 March 2013

432
M A R I C O C O N S U M E R C A R E L I M I T E D
17. There are no contingent liabilities as at 31st March, 2013.
18. Capital Commitments
There are no contracts remaining to be executed on capital account and not provided for as at March 31, 2013.
19. The Company, on May 29th, 2012, concluded the effective acquisition of the personal care business of Paras Pharmaceuticals Limited (“PPL”) for a consideration of Rs. 74,560 lacs. MCCL acquired 100 % equity stake in Halite Personal Care India Private Limited (“Halite”) from Halite’s erstwhile owners. The personal care business had been demerged from PPL into Halite effective March 1, 2012 under a Scheme of amalgamation and arrangements approved by the High Court of Punjab and Haryana.
20. The shareholders of Halite vide special resolution at their extra ordinary general meeting held on January 18, 2013, placed the company into Voluntary Liquidation. In view of the liquidation, the assets of Halite (viz. Intellectual property rights, cash and fi xed assets) have been distributed to MCCL, being the sole shareholder of Halite. MCCL has taken over fi xed assets of Halite at their carrying amounts and intangibles at fair values as per the valuation report.
MCCL received below assets on distribution
Asset Name Value as on March 31, 2013 (in Re. Crore)Brands 7,29.80
Plant & Machinery 0.73
21. The shareholders shareholders of MCCL, in their extraordinary general meeting held on April 1, 2013 decided to adjust the carrying costs of acquired Intangible Assets upon voluntary liquidation of Halite, viz the IPRs, directly against net worth of the company, in accordance with the provisions of Section 78 (read with sections 100 to 103) of the Companies Act 1956. The said capital reduction scheme is in the process of being fi lled with the Honorable High Court of Bombay
22. There is no reportable segment in terms of Accounting Standard 17 ‘Segment reporting’ mandated by Rule 3 of the Companies (Accounting Standard) Rules 2006.
23. Related party disclosure
a) Name of Related parties and nature of relationship :
Holding Company : Marico LimitedSubsidiary : Halite Personal Care Private Limited
NOTES TO THE FINANCIAL STATEMENTS 31 March 2013

433
M A R I C O C O N S U M E R C A R E L I M I T E D
Fellow subsidiaries:
Name of the Company Holding Company Country of incorporation
Percentage of ownership
interest as at 31st March 2013
Marico Bangladesh Limited (MBL) Marico Ltd Bangladesh 90
Marico Middle East FZE (MME) Marico Ltd UAE 100
- MBL Industries Limited (MBLIL) MME Bangladesh 100
- MEL Consumer Care SAE (MELCC) MME Egypt 100
- Marico Egypt Industries Company (MEIC) MELCC Egypt 100
- Egyptian American Investment & Industrial Development Company (EAIIDC)
MME Egypt 100
- Marico Malaysia Sdn. Bhd. (MMSB) MME Malaysia 100
Marico South Africa Consumer Care (Pty) Limited (MSACC)
Marico Ltd South Africa 100
- Marico South Africa (Pty) Limited (MSA) MSACC South Africa 100
Kaya Limited Marico Ltd India 100
- Derma – Rx International Aesthetics Pte. Ltd. (DIAL)
Kaya Limited Singapore 100
- Kaya Middle East FZE (KME)(Refer Note (a) below)
DIAL UAE 100
- The DRx Clinic Pte. Ltd. (DCPL) DIAL Singapore 100
- The DRxMedispa Pte. Ltd. (DMSPL) DIAL Singapore 100
- DRx Investments Pte. Ltd. (DIPL) DIAL Singapore 100
- DRx Aesthetics Sdn. Bhd. (DASB) DIAL Malaysia 100
International Consumer Products Corporation (ICP)
Marico Ltd Vietnam 85
- BeauteCosmetiqueSociete Par Actions (BCS) ICP99% equity held by ICP (Previous Year : 99%)
Vietnam 84.85
- ThuanPhat Foodstuff Joint Stock company (TPF)
ICP98.6% equity held by ICP (Previous Year: 98.6%)
Vietnam 83.81
Marico Innovation Foundation Marico Ltd India N.A

434
M A R I C O C O N S U M E R C A R E L I M I T E D
b) Transactions with related parties
Particulars Amount (Rs. Crore)Marico Limited
Royalty income 0.06
Loan and advances received 5.16
Loan and advances repaid 4.35
Expenses incurred 0.59
Equity capital during incorporation 0.05
Issue of Equity share of Rs 10 each at a premium of Rs 90 745.65
Halite Personal Care Private India LimitedDividend received 5.06
Distribution of assets and liabilities from Halite Personal Care Private IndiaLimited 20.98
Brands 729.80
Plant and machinery 0.73
Marico Middle East FZERoyalty Income 0.02
c) Outstanding balances as at the period end
Particulars As at 31 March 2013Rs. Crore
Marico Limited 1.34
Marico Middle East FZE 0.02
24. Earnings per share :
Particulars Amount in Rs. Crore
Net profi t after tax for the year (A) 3.29
Number of equity shares as at April 20, 2012 50,000
Number of shares issued in May 2012 74,565,000
Weighted average number of equity shares used as denominator for calculating basic / diluted earnings per share. (B)
66,425,780
Nominal value of equity share 10
Basic / Diluted Earnings per share (A)/(B) 0.50
25. Previous Year Figures
Previous year’s fi gures have not been shown as this is the fi rst year of the Company’s operations.
The notes referred to above form an integral part of the fi nancial statements.
As per our report of even date attached.
For Price Waterhouse For and on behalf ofChartered Accountants Marico Consumer Care LimitedFirm Registration Number: 301112E
Harsh Mariwala Director
Uday ShahPartner Saugata Gupta DirectorMembership No.: 46061
Vishal Jain Company SecretoryPlace: Mumbai Place: Mumbai Place: MumbaiDate: April 30, 2013 Date: April 30, 2013 Date: April 30, 2013

435
H A L I T E P E R S O N A L C A R E I N D I A P V T LT D(A COMPANY UNDER VOLUNTARY LIQUIDATION)
Registered Offi ce Rang Sharda, Krishnachandra Marg, Bandra Reclamation, Bandra (West), Mumbai 400 050
Auditors M/s. B S S R & Co, Chartered Accountants
Bankers The Hongkong & Shanghai Banking Corporation Limited (HSBC) Bank, Gurgaon
Liquidator Rajiv Doshi

436
H A L I T E P E R S O N A L C A R E I N D I A P V T LT D(A COMPANY UNDER VOLUNTARY LIQUIDATION)
To the Price Waterhouse – India, Marico Limited group Audit Team(for information to Liquidator and Board of Directors)
Report on the special purpose fi nancial information
1. As requested in your instruction ‘Marico Limited – Inter-fi rm instructions’ dated March 18, 2013, we have audited, for the purpose of your audit of consolidated fi nancial statements of Marico Limited, the accompanying special purpose fi nancial information of Halite Personal Care India Private Limited (the “Company”), which comprise the Balance Sheet as at 31 March 2013 and the Statement of Profi t and Loss for the period 29 May 2012 to 31 March 2013 and other explanatory information, which we have signed under reference to this report. This special purpose fi nancial information has been prepared solely to enable Marico Limited to prepare its consolidated fi nancial statements and accordingly do not contain cash fl ow statement and comparative fi gures.
Management’s responsibility for the special purpose fi nancial information
2. The Company’s management is responsible for the preparation of these special purpose fi nancial information that give a true and fair view of the fi nancial position and fi nancial performance of the Company in conformity with the accounting principles generally accepted in India and in accordance with the accounting policies followed by Marico Limited and in the manner prescribed in Appendix L. This responsibility includes the design, implementation and maintenance of internal control relevant to the preparation and presentation of the special purpose fi nancial information that give a true and fair view and are free from material misstatement, whether due to fraud or error.
Auditors’ responsibility
3. Our responsibility is to express an opinion on the special purpose fi nancial information based on our audit. We conducted our audit in accordance with the Standards on Auditing issued by the Institute of Chartered Accountants of India. Those Standards require that we comply with ethical requirements and plan and perform the audit to obtain reasonable assurance about whether the special purpose fi nancial information are free from material misstatement. As requested by you, we planned and performed our audit using the materiality level specifi ed in your instructions, which is different than the materiality level that we would have used had we been designing the audit to express an opinion on the special purpose fi nancial information of the component alone.
4. An audit involves performing procedures to obtain audit evidence, about the amounts and disclosures in the special purpose fi nancial information. The procedures selected depend on the auditors’ judgment, including the assessment of the risks of material misstatement of the special purpose fi nancial information, whether due to fraud or error. In making those risk assessments, the auditors consider internal control relevant to the Company’s preparation and fair presentation of the special purpose fi nancial information in order to design audit procedures that are appropriate in the circumstances. An audit also includes evaluating the appropriateness of accounting policies used and the reasonableness of the accounting estimates made by management, as well as evaluating the overall presentation of the special purpose fi nancial information.
5. We believe that the audit evidence we have obtained is suffi cient and appropriate to provide a basis for our audit opinion. The conclusions reached in forming our opinion are based on the component materiality level specifi ed by you in the context of the audit of the consolidated fi nancial statements of the group.
Opinion
7. In our opinion, and to the best of our information and according to the explanations given to us, the accompanying special purpose fi nancial information give the information required by the Act in the manner so required and give a true and fair view in conformity with the accounting principles generally accepted in India except as far as it related to presentation of cash fl ow statement and fi nancial information for the comparative period, and in accordance with the accounting policies followed by Marico Limited and in the manner prescribed in Appendix L:
(a) in the case of the Balance Sheet, of the state of affairs of the Company as at 31 March 2013; and
(b) in the case of the Statement of Profi t and Loss, of the profi t for the period 29 May 2012 to 31 March 2013.
REPORT TO PRINCIPAL AUDITORS

437
H A L I T E P E R S O N A L C A R E I N D I A P V T LT D(A COMPANY UNDER VOLUNTARY LIQUIDATION)
Emphasis of matter
8. We draw attention to note 1.2 to the accompanying special purpose fi nancial statements, wherein it is explained that the shareholders had passed a special resolution in the extra ordinary general meeting to voluntarily winding up the Company. Accordingly, assets are refl ected at the lower of their historical costs and estimated net realisable values and liabilities are refl ected at the values at which they are expected to be discharged/ settled. Our opinion is not qualifi ed in respect of this matter.
9. We draw attention to note 3.3 to the accompanying special purpose fi nancial statements, wherein it is explained that tangible and intangible assets are realised and is distributed to the shareholders of the Company. Our opinion is not qualifi ed in respect of this matter.
Restriction on use
10. This special purpose fi nancial information has been prepared for purposes of providing information to Marico Limited to enable it to prepare the consolidated fi nancial statements of the group. As a result, the special purpose fi nancial information is not a complete set of fi nancial statements of Halite Personal Care India Private Limited in accordance with accounting principles generally accepted in India except as far as it related to presentation of cash fl ow statement and fi nancial information for the comparative period and is not intended to present fairly, in all material respects, the fi nancial position of Halite Personal Care India Private Limited as of 31 March 2013, and of its fi nancial performance for the period 29 May 2012 to 31 March 2013 in accordance with accounting principles generally accepted in India. The special purpose fi nancial information may, therefore, not be suitable for another purpose.
This report is not intended for general circulation or publication and is not to be reproduced or used for any purpose without our prior written consent, other than for the purpose stated above.
This report has been provided by B S S R & Co. has been prepared solely for Price Waterhouse – Mumbai.
For B S S R & CoChartered AccountantsFirm Registration Number: 131317W
Sandeep BatraPartnerMembership No.093320
Place: Goregaon
Date: 26 April, 2013
REPORT TO PRINCIPAL AUDITORS (contd.)

438
H A L I T E P E R S O N A L C A R E I N D I A P V T LT D(A COMPANY UNDER VOLUNTARY LIQUIDATION)
BALANCE SHEET As at 31 March 2013
Note As at 31 March 2013Rs. Crore
Shareholders’ fundsShare capital 3 0.47
Reserves and surplus 4 0.02
0.49 Current liabilities
Trade payables 5 0.13
Other current liabilities 6 0.01
0.14
Total 0.63
ASSETS
Current assetsTangible assets 7A Nil
Intangible assets 7B Nil
Cash and bank balances 8 0.58
Short-term loans and advances 9 0.04
Other current assets 10 0.01
Total 0.63
Signifi cant accounting policies 2
The notes referred to above form an integral part of the fi nancial statements.
As per our report of even date attached.
For B S S R & Co For and on behalf ofChartered Accountants Halite Personal Care India Private LimitedFirm registration number: 131317W
Sandeep Batra Rajiv Doshi Harsh Mariwala Milind SarwatePartner Liquidator Director Director Membership No.: 093320
Place: Goregaon Place: Goregaon Place: Goregaon Place: GoregaonDate: 26 April, 2013 Date: 26 April, 2013 Date: 26 April, 2013 Date: 26 April, 2013
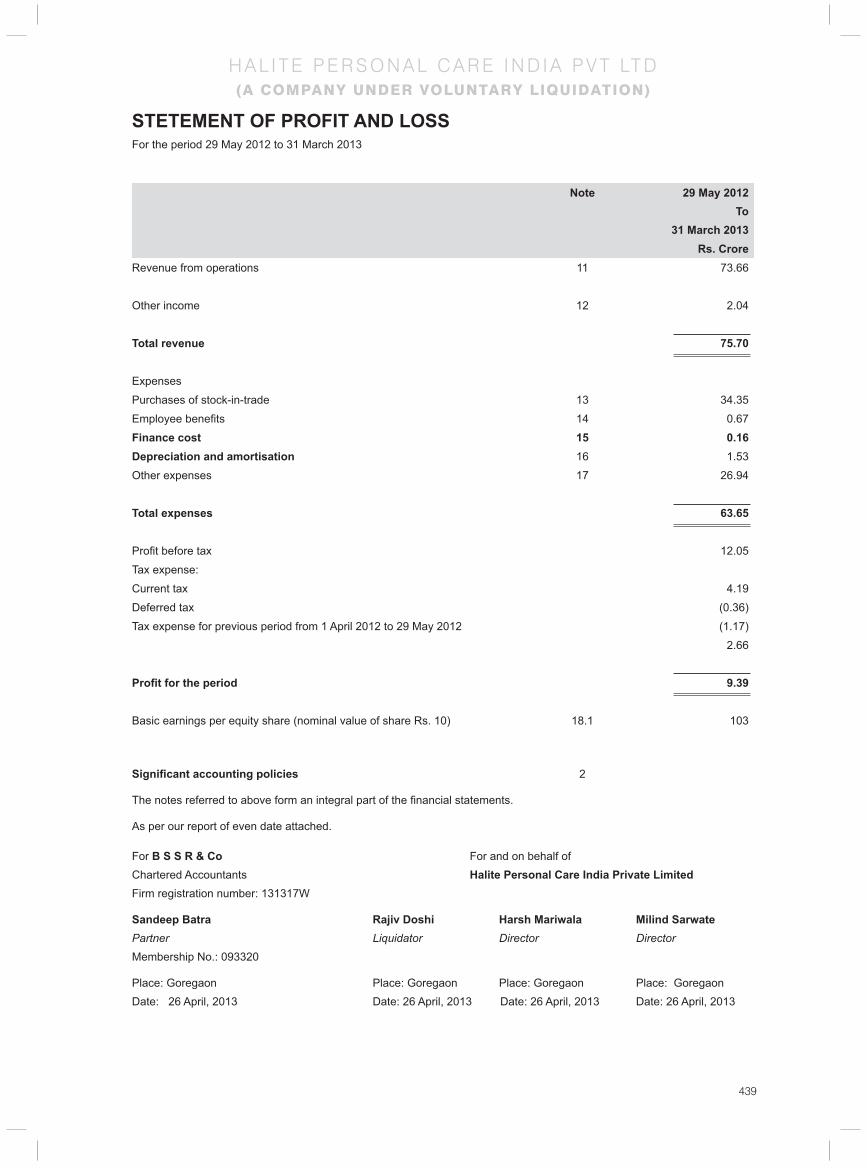
439
H A L I T E P E R S O N A L C A R E I N D I A P V T LT D(A COMPANY UNDER VOLUNTARY LIQUIDATION)
STETEMENT OF PROFIT AND LOSS For the period 29 May 2012 to 31 March 2013
Note 29 May 2012 To
31 March 2013Rs. Crore
Revenue from operations 11 73.66
Other income 12 2.04
Total revenue 75.70
Expenses
Purchases of stock-in-trade 13 34.35
Employee benefi ts 14 0.67
Finance cost 15 0.16 Depreciation and amortisation 16 1.53
Other expenses 17 26.94
Total expenses 63.65
Profi t before tax 12.05
Tax expense:
Current tax 4.19
Deferred tax (0.36)
Tax expense for previous period from 1 April 2012 to 29 May 2012 (1.17)
2.66
Profi t for the period 9.39
Basic earnings per equity share (nominal value of share Rs. 10) 18.1 103
Signifi cant accounting policies 2
The notes referred to above form an integral part of the fi nancial statements.
As per our report of even date attached.
For B S S R & Co For and on behalf ofChartered Accountants Halite Personal Care India Private LimitedFirm registration number: 131317W
Sandeep Batra Rajiv Doshi Harsh Mariwala Milind SarwatePartner Liquidator Director Director Membership No.: 093320
Place: Goregaon Place: Goregaon Place: Goregaon Place: GoregaonDate: 26 April, 2013 Date: 26 April, 2013 Date: 26 April, 2013 Date: 26 April, 2013

440
H A L I T E P E R S O N A L C A R E I N D I A P V T LT D(A COMPANY UNDER VOLUNTARY LIQUIDATION)
NOTES TO THE FINANCIAL STATEMENTS 31 March 2013
1 Nature of Operations
Halite Personal Care India Private Limited (“the Company”) was incorporated on 15 June 2011 and is registered under Registrar of Companies of NCT Delhi and Haryana. The Company is engaged in the business of trading in personal care products.
Pursuant to the order dated 18 April 2012 passed by the Hon’ble High Court of Punjab and Harayana, approving the Scheme of Amalgamation and Arrangement (“Scheme”) amongst Reckitt Benckiser Investments India Private limited (RBIIPL), Paras Pharmaceuticals Limited (PPL) and Halite Personal Care India Private Limited (HPCIPL), the Order was fi led with the Registrar of Companies, NCT of Delhi and Haryana on 19 May 2012. Accordingly, the business of RBIIPL and PPL was merged and subsequently, the personal care division of PPL was demerged into HPCIPL. Accordingly, the entire business including all assets, liabilities and reserves of erstwhile RBIIPL were transferred to and vested in the PPL with effect from appointed date (as defi ned in the scheme) i.e. 1 July 2011 and thereafter the entire business including all assets, liabilities and reserves relating to personal care division of PPL were transferred to and vested in Halite Personal Care India Private Limited with effect from the appointed date (as defi ned in the scheme) i.e. 1 March 2012.
On 29 May 2012, Marico Consumer Care Limited (“MCCL”) (100% subsidiary of Marico Limited), acquired 100% shares of the Company from Reckitt Benckiser (Singapore) Pte Ltd.
1.1 On demerger, shares were issued on the basis of share swap ratio of 1 fully paid equity shares of Halite Personal Care India Private Limited of Rs.10 each against the 10 equity shares of Paras Pharmaceuticals Limited as defi ned in paragraph 13.1.1 of the Scheme of Amalgamation and Arrangements.
1.2 Pursuant to Section 484 (1)(b), section 490 of the Companies Act, 1956 read with Article 92 of the Article of Association of the Company, the shareholders had passed a special resolution in their extra ordinary general meeting held on 18 January 2013 to voluntarily wind up the Company and appointed a liquidator. Further, Pursuant to section 488 of the Companies Act, 1956, the Board of Directors had fi led Declaration of Solvency and the Statement of estimated realisable value of assets and liabilities with the Registrar of Companies in Form 149 as per the Companies (Court) Rules, 1959. The fi nancial statements have therefore not been prepared on the going concern basis. Adjustments have been made to the assets and liabilities, which had earlier been shown on the basis of historical cost convention. As a result of these adjustments, the assets are refl ected at the lower of their historical costs and estimated net realisable values. Liabilities are refl ected at the values at which they are expected to be discharged.
2 Signifi cant Accounting Policies
2.1 Basis of preparation
The books of accounts have been prepared under the historical cost convention on the accrual basis of accounting in accordance with the Generally Accepted Accounting Principles (‘GAAP’) in India and mandatory accounting standards prescribed by the Companies (Accounting Standards) Rules, 2006, to the extent applicable and presentation requirements of the Companies Act, 1956 except for AS-3 Cash Flow Statement. However, the fi nancial statements incorporate adjustments to the values of assets and liabilities, whereby assets are refl ected at the lower of their historical costs and estimated net realisable values and liabilities are refl ected at the values at which they are expected to be discharged. These special purpose fi nancial statements are prepared for the purpose of consolidation with the parent company.
The Company is in the process of liquidation. Accordingly, all assets and liabilities have been classifi ed as current in the fi nancial statements.
2.3 Use of estimates
The preparation of fi nancial statements in conformity with generally accepted accounting principles which requires management to make estimates and assumptions that affect the reported amounts of assets and liabilities and disclosure of contingent liabilities at the date of the fi nancial statements and the results of operations during the reporting period. Although these estimates are based upon management’s best knowledge of current events and actions, actual results could differ from these estimates.

441
H A L I T E P E R S O N A L C A R E I N D I A P V T LT D(A COMPANY UNDER VOLUNTARY LIQUIDATION)
NOTES TO THE FINANCIAL STATEMENTS 31 March 2013
2.4 Tangible assets
Fixed assets are recorded at cost less accumulated depreciation and impairment losses if any. Cost comprises the purchase price and any attributable cost of bringing the asset to its working condition for its intended use. Financial statements incorporate adjustments to the values of fi xed assets, whereby assets are refl ected at the lower of their historical costs and estimated net realisable values.
2.5 Depreciation and amortisation
Depreciation is provided using the written down value method at the rates specifi ed under Schedule XIV of the Companies Act, 1956, except for moulds which are depreciated at the rate of 30%. In respect of fi xed assets purchased during the year, depreciation is provided on a pro-rata basis from the date on which such asset is ready to be put to use.
Assets costing individually Rs 5,000 or less are depreciated fully in the year of acquisition.
Goodwill is tested for impairment annually as per scheme of Amalgamation and Arrangement approved by the Hon’ble High Court.
2.6 Impairment
The carrying amounts of assets are reviewed at each balance sheet date if there is any indication of impairment based on internal/external factors and other indicators if any. An impairment loss is recognized wherever the carrying amount of an asset exceeds its recoverable amount. The recoverable amount is the greater of the asset’s net selling price and value in use. In assessing value in use, the estimated future cash fl ows are discounted to their present value using a pre-tax discount rate that refl ects current market assessments of the time value of money and risks specifi c to the asset. After impairment, depreciation is provided on the revised carrying amount of the asset over its remaining useful life.
2.7 Leases
Leases where the lessor effectively retains substantially all the risks and benefi ts of ownership of the leased item, are classifi ed as operating leases. Operating lease payments are recognized as an expense in the Statement of Profi t and Loss account on a straight-line basis over the lease term.
2.8 Inventories
Inventories are valued at the lower of cost and net realizable value. Cost includes all applicable costs incurred in bringing goods to their present location and condition, determined on weighted average basis.
Obsolescence of inventory is determined based on the specifi c review and is accordingly provided for.
Net realizable value is the estimated selling price in the ordinary course of business, less estimated costs of completion and estimated costs necessary to make the sale.
2.9 Revenue recognition
Revenue is recognized to the extent that it is probable that the economic benefi ts will fl ow to the Company and the revenue can be reliably measured.
Sale of goods
Revenue is recognized when the signifi cant risks and rewards of ownership of the goods have passed to the buyer. Excise duty deducted from Sales (gross) is the amount that is included in the amount of Sales (gross) and not the entire amount of liability arised during the year.
Interest
Income is recognized on a time proportion basis taking into account the amount outstanding and the rate applicable.
Royalty Income
Revenue from royalty income is recognised on accrual basis.

442
H A L I T E P E R S O N A L C A R E I N D I A P V T LT D(A COMPANY UNDER VOLUNTARY LIQUIDATION)
2.9 Foreign currency transactions
(i) Initial recognition
Foreign currency transactions are recorded in the reporting currency, by applying to the foreign currency amount the exchange rate between the reporting currency and the foreign currency at the date of the transaction.
(ii) Conversion
Foreign currency monetary items are reported using the closing rate. Non-monetary items which are carried in terms of historical cost denominated in a foreign currency are reported using the exchange rate at the date of the transaction.
(iii) Exchange differences
Exchange differences arising on the settlement of monetary items or on reporting such monetary items at rates different from those at which they were initially recorded during the year, or reported in previous fi nancial statements, are recognised as income or as expenses in the year in which they arise.
2.10 Cash and cash equivalents
Cash and cash equivalents comprise cash at bank and in hand, short-term investments with an original maturity of three months or less and remittances in transit.
2.11 Income taxes
Tax expense comprises current and deferred tax.
Current income tax is measured at the amount expected to be paid to the tax authorities in accordance with the Income-tax Act, 1961 enacted in India.
Deferred income taxes refl ect the impact of current year timing differences between taxable income and accounting income for the year and reversal of timing differences of earlier years.
Deferred tax is measured based on the tax rates and the tax laws enacted or substantively enacted at the balance sheet date. Deferred tax assets are recognized only to the extent that there is reasonable certainty that suffi cient future taxable income will be available against which such deferred tax assets can be realized. In situations where the company has unabsorbed depreciation or carry forward tax losses, all deferred tax assets are recognized only if there is virtual certainty supported by convincing evidence that they can be realized against future taxable profi ts.
The carrying amount of deferred tax assets is reviewed at each balance sheet date. The company writes-down the carrying amount of a deferred tax asset to the extent that it is no longer reasonably certain or virtually certain, as the case may be, that suffi cient future taxable income will be available against which deferred tax asset can be realized. Any such write-down is reversed to the extent that it becomes reasonably certain or virtually certain, as the case may be, that suffi cient future taxable income will be available.
2.12 Earnings per share
Basic earnings per share are calculated by dividing the net profi t or loss for the period attributable to equity shareholders by the weighted average number of equity shares outstanding during the period. The weighted average number of equity shares outstanding during the period is adjusted for in the event of a bonus issue.
For the purpose of calculating diluted earnings per share, the net profi t or loss for the period attributable to equity shareholders and the weighted average number of shares outstanding during the period are adjusted for the effects of all dilutive potential equity shares.
2.13 Provisions and Contingent Liabilities
A provision is recognised when an enterprise has a present obligation as a result of past event; it is probable that an outfl ow of resources will be required to settle the obligation, in respect of which a reliable estimate can be made. Provisions are
NOTES TO THE FINANCIAL STATEMENTS 31 March 2013

443
H A L I T E P E R S O N A L C A R E I N D I A P V T LT D(A COMPANY UNDER VOLUNTARY LIQUIDATION)
3 Share capital
As at 31 March 2013 Number of shares Rs. Crore
Authorised share capital 2,000,000 (previous period 1000,000) equity shares of Rs. 10 each 2,000,000 2.00
2,000,000 2.00 Issued, subscribed and paid-up
Equity shares of Rs. 10 each fully paid-up 470,563 0.47
470,563 0.47 a. Reconciliation of shares outstanding at the beginning and at the end of the reporting period
Equity Shares
As at 31 March 2013 Number of shares Rs. Crore
At the commencement of the period - -
Shares issued under the scheme of demerger 919,097 0.92
Adjusted in distribution of assets 448,534 0.45
470,563 0.47
b. Rights of equity shareholdersThe Company has a single class of equity shares. Accordingly, all equity shares rank equally with regard to dividends and share in the company's residual assets. On winding up of the company, the holders of equity shares will be entitled to receive the residual assets of the Company, remaining after distribution of all preferential amounts in proportion of the number of equity shares held.
c. Shares held by holding companyAs at 31 March 2013
Number of shares Rs. Crore Equity shares of Rs.10 each fully paid up held by
Marico Consumer Care Limited 470,563 0.47
470,563 0.47
d. Particulars of shareholders holding more than 5% shares of a class of sharesAs at 31 March 2013
Number of shares Rs. Crore
Equity shares of USD 1 each fully paid up held by
Marico Consumer Care Limited 470,563 100.00%
not discounted to its present value and are determined based on best estimate required to settle the obligation at the balance sheet date. These are reviewed at each balance sheet date and adjusted to refl ect the current best estimates.
Contingent liabilities are disclosed when there is a possible obligation arising from past events, the existence of which will be confi rmed only by the occurrence or non occurrence of one or more uncertain future events not wholly within the control of the company or a present obligation that arises from past events where it is either not probable that an outfl ow resources will be required to settle or a reliable estimate of the amount cannot be made.
NOTES TO THE FINANCIAL STATEMENTS 31 March 2013

444
H A L I T E P E R S O N A L C A R E I N D I A P V T LT D(A COMPANY UNDER VOLUNTARY LIQUIDATION)
NOTES TO THE FINANCIAL STATEMENTS 31 March 2013
4 Reserves and surplus
As at 31 March 2013Rs. Crore
Securities Premium At the commencement of the year –
Additions under the scheme of demerger 635.79
Less: Distribution on liquidation (635.79)
–
General Reserve
At the commencement of the year –
Add : Amount transferred from Surplus in the Statement of Profi t and Loss 0.72
Less: Distribution on liquidation (0.72)
Balance as at the end of the year –
Surplus (Profi t and loss balance)
At the commencement of the year (1.71)
Add: Profi t/ (loss) for the period 9.39
Less: Appropriations :
Interim dividend 5.06
Dividend distribution tax on Interim dividend 1.04
Transfer to General Reserve 0.72
Distributed on liquidation 0.84
0.02
Total reserves and surplus 0.02
5 Trade payables
As at 31 March 2013Rs. Crore
Trade payables
- due to micro and small enterprises (refer note 3.5) –
- due to others 0.13
0.13
6 Other current liabilities
As at 31 March 2013Rs. Crore
Other payables
Tax deducted at source payable 0.01
0.01

445
H A L I T E P E R S O N A L C A R E I N D I A P V T LT D(A COMPANY UNDER VOLUNTARY LIQUIDATION)
7A In
tang
ible
ass
ets
Part
icul
ars
Gro
ss b
lock
Dep
reci
atio
n/ a
mor
tisat
ion
Net
blo
ckA
s at
29
May
20
12
Acq
uisi
tion
Add
ition
sD
elet
ion
As
at
31 M
arch
20
13
As
at
29 M
ay
2012
Acq
uisi
tion
For t
he
perio
dIm
pairm
ent
Ded
uctio
ns /
Adj
ustm
ents
As
at 3
1 M
arch
20
13
As
at
31 M
arch
20
13
As
at
29 M
ay
2012
Tang
ible
Ass
ets
Pla
nt a
nd m
achi
nery
(Not
e a,
g &
h)
– 3
.65
– 3
.65
––
1.2
1 1
.53
1.2
0 3
.94
––
–
Com
pute
rs–
0.0
2 –
0.0
2 –
– 0
.01
0.0
1 -
0.0
2 –
––
Tota
l–
3.6
7 –
3.6
7 –
– 1
.22
2
1.2
0 3
.96
––
–
7B In
tang
ible
ass
ets
Part
icul
ars
Gro
ss b
lock
Dep
reci
atio
n/ a
mor
tisat
ion
Net
blo
ckA
s at
Ja
nuar
y 1,
20
12
Adj
ustm
ent
Add
ition
sD
elet
ion
As
at
31 M
arch
20
13
As
at
Janu
ary
1, 2
012
Adj
ustm
ent
For t
he
perio
dD
educ
tions
/ adj
ustm
ents
As
at
31 M
arch
20
13
As
at
31 M
arch
20
13
As
at
Janu
ary
1, 2
012
Inta
ngib
le a
sset
s
Goo
dwill
– 6
16.1
0 –
616
.10
616
.10
––
––
––
–
Tota
l–
616
.10
– 6
16.1
0 –
––
––
––
NO
TES
TO T
HE
FIN
AN
CIA
L ST
ATEM
ENTS
31
Mar
ch 2
013

446
H A L I T E P E R S O N A L C A R E I N D I A P V T LT D(A COMPANY UNDER VOLUNTARY LIQUIDATION)
8 Cash and bank balances
As at 31 March 2013Rs. Crore
Cash and cash equivalents:
Cash on hand 0.01
Bank balances in current account 0.54
Long term deposits with banks with maturity period of more than twelve months 0.03
Total 0.58
9 Short-term loans and advancesUnsecured, considered good (unless otherwise stated)
As at 31 March 2013Rs. Crore
Loans and advances to related parties :
Marico Middle East FZE 0.02
"Advance income tax (net of provision for Income Tax of Rs. 4.36 Crore)" 0.02
Balances with government authorities –
Total 0.04
10 Other current assetsUnsecured, considered good (unless otherwise stated)
As at 31 March 2013Rs. Crore
Interest accrued on fi xed deposits 0.01
Total 0.01
11 Revenue from operations
From 29 May 2012 toAs at 31 March 2013
Rs. CroreSale of personal care products:
Traded goods 73.66
Total 73.66
12 Other income
From 29 May 2012 toAs at 31 March 2013
Rs. CroreInterest Income
On fi xed deposits with banks 0.08
Dividend Income
On current investments 0.75
Other non-operating income :
Royalty income 1.17
Excess provision write back 0.03
Other misc income 0.01
2.04
NOTES TO THE FINANCIAL STATEMENTS 31 March 2013

447
H A L I T E P E R S O N A L C A R E I N D I A P V T LT D(A COMPANY UNDER VOLUNTARY LIQUIDATION)
13 Cost of materials consumed
From 29 May 2012 toAs at 31 March 2013
Rs. CrorePurchase of stock-in-trade 34.35
Total 34.35
14 Employee benefi ts
From 29 May 2012 toAs at 31 March 2013
Rs. CroreSalaries, wages and bonus (refer note 24.3) 0.67
Total 0.67
15 Finance cost
From 29 May 2012 toAs at 31 March 2013
Rs. CroreInterest cost 0.01
Bank and other fi nancial charges 0.15
Total 0.16
16 Depreciation and impairment
From 29 May 2012 toAs at 31 March 2013
Rs. CroreDepreciation and impairment on tangible assets 1.53
Total 1.53
17 Other expenses
From 29 May 2012 toAs at 31 March 2013
Rs. CroreContract manufacturing charges 0.02
Advertisement and sales promotion 26.29 Rates and taxes 0.01 Legal and professional charges 0.61 Miscellaneous expenses 0.02 Total 26.94
NOTES TO THE FINANCIAL STATEMENTS 31 March 2013

448
H A L I T E P E R S O N A L C A R E I N D I A P V T LT D(A COMPANY UNDER VOLUNTARY LIQUIDATION)
18.1 Earnings per share
The calculation of earnings per share for the period ended 31 March, 2013 was based on the profi t attributable to equity shareholders of Rs. 93,937,046 and the number of equity shares outstanding being 470,563.
Particulars Rs. in CroreNet profi t after tax for the year (A) 9.39
Number of equity shares as at 29 May 2013 919,097
Number of shares distributed on 25 March 2013 448,534
Weighted average number of equity shares outstanding during the year (B) 910,331
Nominal value of equity share 10
Earnings per share of face value of Rs. 10 each (A)/(B) 103
18.2 The Company is engaged in the business of personal care. The entire operations are governed by same set of risk and returns. All these activities are primarily within the Country and India represents one geographical segment and these activities represent one business segment in the context of Accounting Standard 17 on “Segment Reporting”, notifi ed by the Companies (Accounting Standards) Rules, 2006.
18.3 On 25 March 2013, the liquidator has distributed the Company’s assets in species to Marico Consumer Care Limited (the parent company). The net book value of assets transferred is given below:
Particulars Rs. in CrorePlant and machinery 0.68
Computers 0.01
Moulds 0.06
Intellectual Property Rights represented by Goodwill in the books 616.10
Net book value of assets distributed 616.83
Further, the liquidator has also distributed a bank balance of Rs.209,800,000 to parent company. The detail of distribution made to the shareholders is given below:
Particulars Rs. in CroreBalance of securities premium 635.79
Balance of general reserve 0.72
Balance of profi t and loss account 0.85
Equity shares 0.45
Subtotal of amount payable to shareholders 637.81Less: net value of assets distributed 616.83
Balance paid to parent company 20.98
18.4 Related party transactions
a) Related parties where control exists
Ultimate Holding CompanyMarico Limited
Holding CompanyMarico Consumer Care Limited
NOTES TO THE FINANCIAL STATEMENTS 31 March 2013

449
H A L I T E P E R S O N A L C A R E I N D I A P V T LT D(A COMPANY UNDER VOLUNTARY LIQUIDATION)
b) Related parties with whom transactions have taken place during the period
Fellow Subsidiaries
• Marico Middle East FZE
c) Transactions with related parties
Particulars Rs. in CroreMarico Limited
Sale of goods 73.66
Employee cost paid by Marico Limited on behalf of Halite 0.67
Royalty income 1.15
Secondary discounts 3.80
Expenses paid by Marico Limited on behalf of Halite 0.83
Compensation towards the bad stocks that Marico purchased from RBIL 11.09
Marico Middle East FZERoyalty Income 0.02
Marico Consumer Care LimitedDistribution of Assets and liabilities to Marico Consumer Care limited 20.98
d) Outstanding balances as at the period end
Particulars Rs. in CroreLoans & Advances Marico Middle East FZE 0.02
18.5 The Ministry of Micro, Small and Medium Enterprises has issued an Offi ce Memorandum dated 26 August, 2008 which recommends that the Micro and Small Enterprises should mention in their correspondence with its customers the Entrepreneurs Memorandum Number as allocated after fi ling of the Memorandum. Based on the information available with the management, there are no over dues outstanding to micro and small enterprises as defi ned under the Micro, Small and Medium Enterprises Development Act, 2006. Further, the Company has not received any claim for interest from any supplier under the said Act.
18.6 The equity shares of Company is acquired by MCCL on 29 May, 2012, therefore no previous period fi gures have been disclosed.
For B S S R & Co For and on behalf ofChartered Accountants Halite Personal Care India Private LimitedFirm registration number: 131317W
Sandeep Batra Rajiv Doshi Harsh Mariwala Milind SarwatePartner Liquidator Director Director Membership No.: 093320
Place: Goregaon Place: Goregaon Place: Goregaon Place: GoregaonDate: 26 April, 2013 Date: 26 April, 2013 Date: 26 April, 2013 Date: 26 April, 2013
NOTES TO THE FINANCIAL STATEMENTS 31 March 2013

450
M A R I C O K AYA E N T E R P R I S E S L I M I T E D
Board of Directors Harsh Mariwala Milind Sarwate Chaitanya Deshpande
Registered Offi ce Rang Sharda, Krishnachandra Marg, Bandra Reclamation, Bandra (West), Mumbai 400 050
Auditors Kirtane and Pandit, Chartered Accountants
Bankers HDFC Bank

451
M A R I C O K AYA E N T E R P R I S E S L I M I T E D
To the Members of Marico Kaya Enterprises Limited
Report on the Financial Statements
We have audited the accompanying fi nancial statements of Marico Kaya Enterprises Limited which comprise the Balance Sheet as at March 31, 2013, and the Statement of Profi t and Loss for the period then ended, and a summary of signifi cant accounting policies and other explanatory information.
Management’s Responsibility for the Financial Statements
Management is responsible for the preparation of these fi nancial statements that give a true and fair view of the fi nancial position, fi nancial performance of the Company in accordance with the Accounting Standards referred to in sub-section (3C) of section 211 of the Companies Act, 1956 (“the Act”). This responsibility includes the design, implementation and maintenance of internal control relevant to the preparation and presentation of the fi nancial statements that give a true and fair view and are free from material misstatement, whether due to fraud or error.
Auditor’s Responsibility
Our responsibility is to express an opinion on these fi nancial statements based on our audit. We conducted our audit in accordance with the Standards on Auditing issued by the Institute of Chartered Accountants of India. Those Standards require that we comply with ethical requirements and plan and perform the audit to obtain reasonable assurance about whether the fi nancial statements are free from material misstatement.
An audit involves performing procedures to obtain audit evidence about the amounts and disclosures in the fi nancial statements. The procedures selected depend on the auditor’s judgment, including the assessment of the risks of material misstatement of the fi nancial statements, whether due to fraud or error. In making those risk assessments, the auditor considers internal control relevant to the Company’s preparation and fair presentation of the fi nancial statements in order to design audit procedures that are appropriate in the circumstances. An audit also includes evaluating the appropriateness of accounting policies used and the reasonableness of the accounting estimates made by management, as well as evaluating the overall presentation of the fi nancial statements.
We believe that the audit evidence we have obtained is suffi cient and appropriate to provide a basis for our audit opinion.
Opinion
In our opinion and to the best of our information and according to the explanations given to us, the fi nancial statements give the information required by the Act in the manner so required and give a true and fair view in conformity with the accounting principles generally accepted in India:
a) in the case of the Balance Sheet, of the state of affairs of the Company as at March 31, 2013;
b) in the case of the Statement of Profi t and Loss of the Loss for the period ended on that date; and
Report on Other Legal and Regulatory Requirements
1. As required by section 227(3) of the Act, we report that:
a) we have obtained all the information and explanations which to the best of our knowledge and belief were necessary for the purpose of our audit;
b) in our opinion proper books of account as required by law have been kept by the Company so far as appears from our examination of those books
c) the Balance Sheet, and Statement of Profi t and Loss dealt with by this Report are in agreement with the books of account.
d) in our opinion, the Balance Sheet, and Statement of Profi t and Loss, comply with the Accounting Standards referred to in subsection (3C) of section 211 of the Companies Act, 1956;
INDEPENDENT AUDITORS’ REPORT

452
M A R I C O K AYA E N T E R P R I S E S L I M I T E D
INDEPENDENT AUDITORS’ REPORT (Contd.)
e) on the basis of written representations received from the directors as on March 31, 2013, and taken on record by the Board of Directors, none of the directors is disqualifi ed as on March 31, 2013, from being appointed as a director in terms of clause (g) of sub-section (1) of section 274 of the Companies Act, 1956.
f) Since the Central Government has not issued any notifi cation as to the rate at which the cess is to be paid under section 441A of the Companies Act, 1956 nor has it issued any Rules under the said section, prescribing the manner in which such cess is to be paid, no cess is due and payable by the Company.
For Kirtane & PanditChartered Accountants
FRN: 105215W
PartnerPlace:-MumbaiDate:-31st May, 2013

453
M A R I C O K AYA E N T E R P R I S E S L I M I T E D
BALANCE SHEET As at 31 March 2013
Notes As at 31 March 2013Rs. Crore
Share capital 3 0.10
Reserves and surplus 4 (0.12)
(0.02)
Trade payables 5 0.01
Other current liabilities 6 0.12
0.13
TOTAL 0.11
Cash and bank balances 7 0.11
0.11
TOTAL 0.11
For Kirtane and Pandit For and on behalf of Chartered Accountants Marico Kaya Enterprise Limited FRN : 105215W
Harsh Mariwala Director
Partner
Milind Sarwate Director
Chaitanya Deshpande Director
Place: MumbaiDate: 31st May, 2013

454
M A R I C O K AYA E N T E R P R I S E S L I M I T E D
Notes For the period from January 19, 2012 to
March 31, 2013Rs. Crore
Expenses:
Other expenses 8 0.11
Total expenses 0.11
Profi t before exceptional and extraordinary items and tax (0.11)
Exceptional items –
Profi t before tax (0.11)
Tax expense: –
Current tax –
Profi t for the period (0.11)
Basic earnings per equity share (nominal value of share Rs. 10) (11.46)
Signifi cant accounting policies 2
The notes referred to above form an integral part of the fi nancial statements.
As per our report of even date attached.
PROFIT AND LOSS As at 31 March 2013
As per our report of even date attached.
For Kirtane and Pandit For and on behalf of Chartered Accountants Marico Kaya Enterprise Limited FRN : 105215W
Harsh Mariwala Director
Partner
Milind Sarwate Director
Chaitanya Deshpande Director
Place: MumbaiDate: 31st May, 2013

455
M A R I C O K AYA E N T E R P R I S E S L I M I T E D
NOTES TO THE FINANCIAL STATEMENTS 31 March 2013
1 GENERAL INFORMATION
On January 7, 2013, the Board of Directors’ of Marico Limited approved a Scheme of Arrangement for demerger of the business undertaking of Kaya (“Kaya Business”) with effect from appointed date, April 1, 2013 (‘the Scheme’) subject to all regulatory and statutory approvals. The Scheme envisages the de-merger of Kaya Business into a new company, “Marico Kaya Enterprises Limited (‘MaKE’)”, and it was incorporated on January 19, 2013 for the purpose.
2 SUMMARY OF SIGNIFICANT ACCOUNTING POLICIES
a) Basis of preparation of fi nancial statements:
The fi nancial statements are prepared in accordance with Indian Generally Accepted Accounting Principles (“GAAP”) under the historical cost convention on an accrual basis and are in conformity with mandatory accounting standards, as specifi ed in the Companies (Accounting Standards) Rules, 2006 and the other relevant provisions of the Companies Act, 1956.
All assets and liabilities have been classifi ed as current or non-current as per the Company’s normal operating cycle and other criteria set out in the Schedule VI to the Companies Act, 1956.
b) Use of Estimates:
The preparation of the fi nancial statements in conformity with GAAP requires management to make estimates and assumptions that affect the reported balances of assets and liabilities and disclosures relating to contingent assets and liabilities as at the date of the fi nancial statements and reported amounts of income and expenses during the year. Examples of such estimates include provision for doubtful debts, future obligations under employee retirement benefi t plans, income taxes, the useful lives and provision for impairment of fi xed assets and intangible assets.
Management believes that the estimates used in the preparation of fi nancial statements are prudent and reasonable. Future results could differ from these estimates.
c) Tangible assets, intangible assets and capital work-in-progress:
Tangible assets and intangible assets are stated at cost of acquisition, less accumulated depreciation / amortisation and impairment loss, if any. Cost includes taxes, duties, freight and other incidental expenses related to acquisition and installation. Pre-operative expenses incidental and related to setting up of new clinics have been included under capital work-in-progress. Such expenditure are capitalised to fi xed asset upon start of operations of the clinic.
Capital work in progress comprises cost of fi xed assets that are not yet ready for their intended use at the year end.
d) Depreciation / amortization:
1) Tangible assets
(i) Depreciation is provided on Straight line basis at higher of the rates based on useful lives of the assets as estimated by the management or those stipulated in Schedule XIV to the Companies Act, 1956. The useful lives of the following assets as estimated by the management are higher from the rates prescribed under Schedule XIV to the Companies Act, 1956:
Computer hardware, related peripherals etc. - 33.33%
Technologically advanced machineries - 14.29% to 50%
Other plant and equipment - 11.11% to 50%
Furniture and fi xtures (Including lease hold improvements) - 11.11%
(ii) The useful life of leasehold improvements are estimated taking into consideration lease period including the renewal option. Leasehold improvements includes provision for site restoration costs which are recognised based on the estimates made by management for probable liability towards restoration of these premises at the end of lease period.
(iii) Assets individually costing Rs. 5,000 or less are depreciated fully in the year of acquisition.
(iv) Depreciation on additions during the year is charged from the month in which the assets are capitalized and for deletions up to the month prior to the month in which the asset is disposed off.

456
M A R I C O K AYA E N T E R P R I S E S L I M I T E D
2) Intangible assets
Intangible assets are amortised over their respective individual estimated useful lives on a straight line basis, but not exceeding the period given here under:
Computer softwares - 33.33%
Trade marks / copyrights - 10.00%
e) Impairment:
Assessment is done at each Balance Sheet date as to whether there is any indication that an asset (tangible and intangible) may be impaired. For the purpose of assessing impairment, the smallest identifi able group of assets that generates cash infl ows from continuing use that are largely independent of the cash infl ows from other assets or groups of assets, is considered as a cash generating unit. If any such indication exists, an estimate of the recoverable amount of the asset/cash generating unit is made. Assets whose carrying value exceeds their recoverable amount are written down to the recoverable amount. Recoverable amount is higher of an asset’s or cash generating unit’s net selling price and its value in use. Value in use is the present value of estimated future cash fl ows expected to arise from the continuing use of an asset and from its disposal at the end of its useful life. Assessment is also done at each Balance Sheet date as to whether there is any indication that an impairment loss recognised for an asset in prior accounting periods may no longer exist or may have decreased.
f) Investments:
Long-term investments are valued at cost. Provision for diminution, if any, in the value of investments is made to recognize a decline, other than temporary. Current investments are valued at lower of cost and fair value, computed individually for each investment. In case of investments in mutual funds which are unquoted, net asset value is taken as fair value.
g) Inventories:
1) Raw materials, packing materials, stores, spares and consumables are valued at lower of cost and net realizable value. However, these items are considered to be realizable at cost if the fi nished products in which they will be used are expected to be sold at or above cost.
2) Finished goods, stock-in-trade and work-in-progress are valued at lower of cost and net realizable value.
3) Cost is ascertained on weighted average method and in case of fi nished products and work-in-progress, it includes appropriate production overheads and duties.
h) Research and development:
Capital expenditure on research and development is capitalized and depreciated. Revenue expenditure is charged off in the year in which it is incurred.
i) Revenue recognition:
1) Income from services is recognized on rendering of services and are recorded net of discounts and service tax.
2) Income from package sale is recognized based on the utilisation of sessions by the customers.
3) Sale of products is recognized on delivery, which is when risks and rewards of ownership passed to the customers, and are recorded net of trade discounts, sales tax and value added tax.
j) Retirement benefi ts:
1) Long-term employee benefi ts
(i) Defi ned contribution plans
The Company has defi ned contribution plan for post employment benefi ts in the form of provident fund. The Company’s contributions to defi ned contribution plans are charged to the Statement of Profi t and Loss as incurred.
NOTES TO THE FINANCIAL STATEMENTS 31 March 2013

457
M A R I C O K AYA E N T E R P R I S E S L I M I T E D
3 Share capital
As at 31 March 2013 Rs. Crore
Authorised share capital
14,000,000 equity shares of Rs. 10 each 14.00
14.00
Issued, subscribed and paid-up
100,000 equity shares of Rs. 10 each fully paid-up 0.10
0.10
a. Reconciliation of shares outstanding at the beginning and at the end of the reporting periodEquity Shares
As at 31 March 2013Number of shares Rs. Crore
At the time of incorporation i.e. January 19, 2013 100,000 0.10
Issued during the period – –
As at the end of the period 100,000 0.10
b. Rights of equity shareholders
The Company has a single class of equity shares. Accordingly, all equity shares rank equally with regard to dividends and share in the company’s residual assets. The equity shares are entitled to receive dividend as declared. On winding up of the company, the holders of equity shares will be entitled to receive the residual assets of the Company, remaining after distribution of all preferential amounts in proportion of the number of equity shares held.
c. Shares held by holding company
As at 31 March 2013Number of shares Rs. Crore
Equity shares of Rs.10 each fully paid up held by
Marico Limited 100,000 0.10
100,000 0.10
d. Particulars of shareholders holding more than 5% shares of a class of shares
As at 31 March 2013Number of shares Rs. Crore
Equity shares of Rs.10 each fully paid up held by
Marico Limited
100,000 100.00%
4 Reserves and surplus
As at 31 March 2013
Rs. Crore Surplus (Profi t and loss balance)At the commencement of the year 0.00Add: Profi t/ (loss) for the period (0.12)
Total reserves and surplus (0.12)
NOTES TO THE FINANCIAL STATEMENTS 31 March 2013

458
M A R I C O K AYA E N T E R P R I S E S L I M I T E D
5 Trade payables
As at 31 March 2013
Rs. Crore Trade payables - due to others 0.01
0.01
6 Other current liabilities
As at 31 March 2013
Rs. Crore Due to related parties
Marico Limited 0.11
Other payables
Amount payable Statutroy / Government Authorities 0.01
Total 0.12
7 Cash and bank balances
As at 31 March 2013
Rs. Crore Cash and cash equivalents:
Cash on hand 0.00
Bank balances in current account 0.11
Total 0.11
8 Other expenses
For the period from April 20, 2012 to March 31, 2013
Rs. CrorePayments to the auditor as Statutory Audit fees 0.01
Legal and professional charges 0.03
Printing & Stationery 0.01
Miscellaneous expenses - MCA fi lling fees 0.08
Total 0.13
NOTES TO THE FINANCIAL STATEMENTS 31 March 2013

459
M A R I C O I N N OVAT I O N F O U N D AT I O N
Board of Directors Harsh Mariwala Milind Sarwate
Registered Offi ce Rang Sharda, Krishnachandra Marg, Bandra Reclamation, Bandra (West), Mumbai 400 050
Auditors Kirtane and Pandit, Chartered Accountants
Bankers Corporation Bank

460
M A R I C O I N N OVAT I O N F O U N D AT I O N
To the Members
Your Board of Directors (‘Board’) present their Fourth Report together with the audited annual accounts for the year ended March 31, 2013.
AN OVERVIEW OF THE FINANCIAL OPERATIONS
During the year under review, your Company (also referred as “Foundation” elsewhere in this Report) received donations aggregating Rs.1,70,94,620 from Marico Limited.
DISTRIBUTION TO SHAREHOLDERS
Being a Company registered under Section 25 of the Companies Act, 1956, the Company is not allowed to distribute its surplus by way of dividend or otherwise to its members.
REVIEW OF OPERATIONS
Your Company is engaged in promoting and encouraging leadership with focus on innovation in the fi eld of business, education, social, cultural, creative and sports related activities and to promote, obtain, disseminate and impart expertise and knowledge on various matters including but not limited to trade, marketing, management of corporate and various other educational, social, cultural, creative and sports related activities. Your Company is also engaged with other entities / organizations to identify, support and help deserving interest groups in the area of innovation and acts as a catalyst to share knowledge and best practices on innovation case studies and to identify, undertake, promote and engage in research activities related to innovation.
Your company through its committed, diligent, consistent and systematic efforts contributes to the innovation cause in India, through a Thought-Leadership based framework. It provides a platform where the business and the social sector can leverage innovation for quantum growth thereby creating a sustained innovation impact.
Your Company launched its Social Innovation Acceleration programme in 2011 to provide customized capacity building, strategic advisory support and acceleration facilitation over a 12–18 month period, for organizations working on innovative social enterprise models and seeking to scale the impact of their work. The Company continued its efforts on this project during the year under review.
The Foundation through its sustained efforts has successfully accelerated fi ve Social Enterprise Projects over the last two years - Yuva Parivartan and Waste Wise Trust in 2011 and Akshay Patra’s (model : hub-and-spoke kitchen system), Fractal Microspin’s (model : Product to business model transformation) & Yuva Parivartan (model : Employment Exchange for rural school dropout youth) in 2012.
The Foundation also launched a quarterly magazine “Innowin”- India’s fi rst publication dedicated to innovation to continuously generate and disseminate knowledge on Innovation.
PUBLIC DEPOSITS
During the year, your Company has not accepted any Fixed Deposits, under section 58A of the Companies Act 1956, read with Companies (Acceptance of Deposits) Rules, 1975.
CORPORATE DEVELOPMENTS
During the year under review, Mr. Harsh Mariwala and Mr. Milind Sarwate resigned as Members of the Company in their individual capacity as per Article 13 of the Articles of Association of the Company and on 15th March 2013 Marico Limited joined as 100% member of the Company along with Mr. Harsh Mariwala as Nominee member of Marico Limited. Accordingly, your Company has become a wholly owned subsidiary company of Marico Limited.
DIRECTORS
During the year under review, the existing Directors of the Company have resigned from the directorship in their individual capacities and were appointed as Directors of the Company as Nominees acting for and on behalf of Marico Limited with effect from March 15, 2013.
DIRECTORS’ REPORT

461
M A R I C O I N N OVAT I O N F O U N D AT I O N
PARTICULARS OF EMPLOYEES AND OTHER MATTERS
Your Company has no employee of the category under Section 217(2A) of the Companies Act, 1956 read with the Companies (Particulars of Employees) Rules, 1975 as amended from time to time.
Since the Company does not own any manufacturing facility, the disclosure of information on other matters required to be disclosed in terms of Section 217(1)(e) of the Companies Act, 1956 read with the Companies (Disclosure of Particulars in the Report of Board of Directors) Rules, 1998, are not applicable and hence not given.
DIRECTORS’ RESPONSIBILITY STATEMENT
Pursuant to Section 217(2AA) of the Companies Act, 1956 (the Act), amended by the Companies (Amendment) Act, 2000, the Directors confi rm that:
1. In preparation of the Annual Accounts of your Company, the Accounting Standards, laid down by the Institute of Chartered Accountants of India from time to time, have been followed and that no material departures have been made from the same;
2. Appropriate accounting policies have been selected and applied consistently, and reasonable and prudent judgment and estimates have been made so as to ensure that the accounts give a true and fair view of the state of affairs of your Company as at March 31, 2013 and the Income and Expenditure of your Company for the period ended March 31, 2013;
3. Proper and suffi cient care has been taken for maintenance of appropriate accounting records in accordance with the provisions of the Act for safeguarding the assets of your Company and for preventing and detecting fraud and other irregularities;
4. The annual accounts have been prepared on a going concern basis;
Further, your Directors also confi rm that the observations of the Auditors in their report to the Members have been adequately dealt with in the relevant notes to the accounts. Hence, no additional explanation is considered necessary.
STATUTORY AUDITORS
Your Company’s Auditors, M/s. Kirtane & Pandit, Chartered Accountants, retire at the ensuing Annual General Meeting and have confi rmed their eligibility for reappointment.
ACKNOWLEDGEMENT
Your Company acknowledges and appreciates the co-operation of the statutory authorities, bankers and other associates and looks forward to their continued support in future.
For and on behalf of the Board of Directors,Marico Innovation Foundation
Harsh Mariwala Milind Sarwate Director Director
Place : MumbaiDate : May 30, 2013
DIRECTORS’ REPORT (contd.)
462
M A R I C O I N N OVAT I O N F O U N D AT I O N
To the Members of Marico Innovation Foundation
Report on the Financial Statements
We have audited the accompanying fi nancial statements of Marico Innovation Foundation which comprise the Balance Sheet as at March 31, 2013, and the Statement of Income and Expenditure for the period then ended, and a summary of signifi cant accounting policies and other explanatory information.
Management’s Responsibility for the Financial Statements
Management is responsible for the preparation of these fi nancial statements that give a true and fair view of the fi nancial position, fi nancial performance of the Company in accordance with the Accounting Standards referred to in sub-section (3C) of section 211 of the Companies Act, 1956 (“the Act”). This responsibility includes the design, implementation and maintenance of internal control relevant to the preparation and presentation of the fi nancial statements that give a true and fair view and are free from material misstatement, whether due to fraud or error.
The Foundation Was Incorporated on 19th June 2009 under Section 25 of the Companies Act 1956 as a Company Limited by Guarantee. The license to operate under section 25 was issued by ministry of Corporate Affairs Vide Reference No. RD/25(i)/2/10/1883 dated 4th June 2009.
Auditor’s Responsibility
Our responsibility is to express an opinion on these fi nancial statements based on our audit. We conducted our audit in accordance with the Standards on Auditing issued by the Institute of Chartered Accountants of India. Those Standards require that we comply with ethical requirements and plan and perform the audit to obtain reasonable assurance about whether the fi nancial statements are free from material misstatement.
An audit involves performing procedures to obtain audit evidence about the amounts and disclosures in the fi nancial statements. The procedures selected depend on the auditor’s judgment, including the assessment of the risks of material misstatement of the fi nancial statements, whether due to fraud or error. In making those risk assessments, the auditor considers internal control relevant to the Company’s preparation and fair presentation of the fi nancial statements in order to design audit procedures that are appropriate in the circumstances. An audit also includes evaluating the appropriateness of accounting policies used and the reasonableness of the accounting estimates made by management, as well as evaluating the overall presentation of the fi nancial statements.
We believe that the audit evidence we have obtained is suffi cient and appropriate to provide a basis for our audit opinion.
Opinion
In our opinion and to the best of our information and according to the explanations given to us, the fi nancial statements give the information required by the Act in the manner so required and give a true and fair view in conformity with the accounting principles generally accepted in India:
a) in the case of the Balance Sheet, of the state of affairs of the Company as at March 31, 2013;
b) in the case of the Statement of Income and Expenditure, of the Surplus/ Defi cit for the period ended on that date; and
Report on Other Legal and Regulatory Requirements
1. As required by section 227(3) of the Act, we report that:
a) we have obtained all the information and explanations which to the best of our knowledge and belief were necessary for the purpose of our audit;
b) in our opinion proper books of account as required by law have been kept by the Company so far as appears from our examination of those books
c) the Balance Sheet, and Statement of Income and Expenditure dealt with by this Report are in agreement with the books of account.
INDEPENDENT AUDITORS’ REPORT

463
M A R I C O I N N OVAT I O N F O U N D AT I O N
INDEPENDENT AUDITORS’ REPORT (Contd.)
d) in our opinion, the Balance Sheet, and Statement of Income and Expenditure, comply with the Accounting Standards referred to in subsection (3C) of section 211 of the Companies Act, 1956;
e) on the basis of written representations received from the directors as on March 31, 2013, and taken on record by the Board of Directors, none of the directors is disqualifi ed as on March 31, 2013, from being appointed as a director in terms of clause (g) of sub-section (1) of section 274 of the Companies Act, 1956.
f) Since the Central Government has not issued any notifi cation as to the rate at which the cess is to be paid under section 441A of the Companies Act, 1956 nor has it issued any Rules under the said section, prescribing the manner in which such cess is to be paid, no cess is due and payable by the Company.
For Kirtane & PanditChartered Accountants
FRN: 105215W
PartnerPlace : MumbaiDate : 30 May, 2013

464
M A R I C O I N N OVAT I O N F O U N D AT I O N
Notes FY 2012-13(Rs. Crore)
FY 2011-12(Rs. Crore)
Shareholders’ funds(a) Reserves and Surplus 1.1 0.10 (0.63)
Non-current liabilities
Current liabilities(b) Trade Payables 1.2 0.02 –
(c) Other Current Liabilities 1.3 0.02 0.67
(d) Short-term Provisions 1.4 0.01 –
TOTAL 0.15 0.04
ASSETS
Current assets(d) Cash and Bank Balance 1.5 0.02 0.01
(f) Other Current Assets 1.6 0.13 0.03
TOTAL 0.15 0.04
For Kirtane and Pandit For and on behalf of Board of DirectorsChartered Accountants Marico INNOVATION FOUNDATION FRN : 105215W
Partner Harsh Mariwala Milind Sarwate Director Director
Place: MumbaiDate: 30 May, 2013
BALANCE SHEET As at 31 March 2013

465
M A R I C O I N N OVAT I O N F O U N D AT I O N
Notes FY 2012-13(Rs. Crore)
FY 2011-12(Rs. Crore)
Income:Revenue from Operations 1.71 0.05
Total Income 1.71 0.05
Expenditure:Direct Expenses 2.1 0.98 0.69
Total expenditure 0.98 0.69
Surplus/(Defi cit) for the period 0.73 (0.64)
For Kirtane and Pandit For and on behalf of Board of DirectorsChartered Accountants Marico INNOVATION FOUNDATION FRN : 105215W
Partner Harsh Mariwala Milind Sarwate Director Director
Place: MumbaiDate: 30 May, 2013
INCOME AND EXPENDITURE STATEMENT for the year ended March 31, 2013

466
M A R I C O I N N OVAT I O N F O U N D AT I O N
1.1 Reserves and surplus
As at 31 March 2013
As at 31 March 2012
Rs. Crore Rs. Crore Surplus in the Statement of Income & ExpenditureOpening balance (0.63) 0.01
(+) Surplus/(Defi cit) for the period 0.73 (0.64)
Closing Balance 0.10 (0.63)
Total 0.10 (0.63)
1.2 Trade payables
As at 31 March 2013
As at 31 March 2012
Rs. Crore Rs. Crore Sundry Creditors 0.02 –
Total 0.02 –
1.3 Other current liabilities
As at 31 March 2013
As at 31 March 2012
Rs. Crore Rs. Crore Statutory liabilities 0.01 0.01
Advances received from Marico Ltd. 0.65
Audit Fees payable 0.01 0.01
Total 0.02 0.67
1.4 Short Term Provisions
As at 31 March 2013
As at 31 March 2012
Rs. Crore Rs. Crore (a) Other Provisions 0.01 –
Total 0.01 –
1.5 Cash And Bank Balances
As at 31 March 2013
As at 31 March 2012
Rs. Crore Rs. Crore a. Balances with banks
Bank Balance 0.02 0.01
Total 0.02 0.01
NOTES TO THE FINANCIAL STATEMENTS 31 March 2013

467
M A R I C O I N N OVAT I O N F O U N D AT I O N
1.6 Other Current Assets
As at 31 March 2013
As at 31 March 2012
Rs. Crore Rs. Crore Advance paid to Alok Nanda & Company – 0.02
Advance paid to NCPA – 0.01
Innovation Alchemy 0.13 –
Total 0.13 0.03
2.1 Direct Expenses
As at 31 March 2013
As at 31 March 2012
Rs. Crore Rs. Crore Advertisement 0.06 0.01
Audit Fees 0.01 0.01
Awards Function 0.03 –
Books & Periodicals – 0.01
Car Hire Charges 0.01 0.01
Conference – 0.06
Data Card Expenses – 0.01
Donations – 0.01
Event Expenses – 0.10
Hotel Rent 0.01 0.01
Magazine Publication 0.17 –
Mobile – 0.01
Printing & Stationery – 0.01
Professional and Legal Expenses 0.64 0.38
Seminar Expenses – 0.01
Telephone – 0.03
Trainee Allowance – 0.01
Travelling 0.05 0.01
0.98 0.69
2.2 Auditor’s Remuneration(Excluding service tax)
As at 31 March 2013
As at 31 March 2012
Rs. Crore Rs. Crore For Audit 0.01 0.01
Total 0.01 0.01
NOTES TO THE FINANCIAL STATEMENTS 31 March 2013

468
M A R I C O I N N OVAT I O N F O U N D AT I O N
3 Related Party TransactionDuring the year the company has entered into following related party transactions:
Name of Related Party Nature Of transactionNature of
RelationshipAmount
(in Rs. Crore)
MARICO LTD. Donations Received Holding Company 1.71
Marico Innovation Foundation became a Wholly Owned Subsidiary of Marico Limited
NOTES TO THE FINANCIAL STATEMENTS 31 March 2013
For Kirtane and Pandit For and on behalf of Board of DirectorsChartered Accountants Marico INNOVATION FOUNDATION FRN : 105215W
Partner Harsh Mariwala Milind Sarwate Director Director
Place: MumbaiDate: 30 May, 2013

26500159
Des
igne
dby
Alo
kN
anda
and
Com
pany
,Prin
ted
byD
hote
Of fs
etTe
chno
kraf
tsP
vt. L
td.