0 3 5 - - munich personal repec archive · eren erdog an and osman nuri aras and mustafa o zt urk...
TRANSCRIPT

MPRAMunich Personal RePEc Archive
Does Overvalued Turkish Lira AffectTurkey’s Foreign Trade Competitiveness?
Eren Erdogan and Osman Nuri Aras and Mustafa Ozturk
2012
Online at https://mpra.ub.uni-muenchen.de/81857/MPRA Paper No. 81857, posted 10 October 2017 12:41 UTC

Seediscussions,stats,andauthorprofilesforthispublicationat:https://www.researchgate.net/publication/256042881
DoesOvervaluedTurkishLiraAffectTurkey'sForeignTradeCompetitiveness?
Article·December2012
CITATIONS
0
READS
12
3authors,including:
OsmanNuriAras
93PUBLICATIONS66CITATIONS
SEEPROFILE
AllcontentfollowingthispagewasuploadedbyOsmanNuriArason01January2017.
Theuserhasrequestedenhancementofthedownloadedfile.

INTERNATIONAL JOURNAL OF SOCIAL SCIENCES AND HUMANITY STUDIES Vol 4, No 2, 2012 ISSN: 1309-8063 (Online)
159
DOES OVERVALUED TURKISH LIRA AFFECT TURKEY’S FOREIGN TRADE COMPETITIVENESS? Eren ERDOGAN Fatih University Res. Assist E-mail: [email protected]
Osman Nuri ARAS Fatih University Assoc. Prof. E-mail: [email protected]
Mustafa OZTURK Fatih University Assistant Prof. E-mail: [email protected]
Abstract Turkey's export growth has been increasing since 1980 and reached its peak in 2011 despite declines in different periods. The 2008 economic crisis that overvalued the exchange rates was a big obstacle to overcome for the Turkish exporters, and this diminishes their returns and thus lessened Turkey’s global strategic competitiveness. This study examines Turkey’s competition power against the BRIC countries seen as strong competitors to Turkey based on exchange rates and purchasing power parity. This study which is about purchasing power parity and exchange rates shows that real exchange rates affect trade volumes and Turkey’s RER has appreciated especially after 2010 and it lessened the competitiveness of Turkish companies. Key Words: International Competitiveness, Exchange Rates, Competitiveness Indicators. JEL Classification: F10, F13, F14, F40.
1. INTRODUCTION Liberal trade has rapidly progressed since 1980s- the period of free trade emerged, and countries tended to make more business over the globe to increase their welfare and betterment. To capture a higher trading volume has always been a crucial tool for states’ development and advancement; however, this revealed the fact that the level of export should be at least at the similar level as that of import both in order for the states to provide balance of payments and to attain returns out of the business made.
INTERNATIONAL JOURNAL OF SOCIAL SCIENCES AND HUMANITY STUDIES Vol 4, No 2, 2012 ISSN: 1309-8063 (Online)
160
The increasing number of players in the global market -as more states now tend to conduct liberal trade- suppresses the countries which intend to export and/or get better returns, but this also encourages them to increase their “competitiveness”. In simpler terms, competitiveness which is used to determine how competitive one state is also functions to be a measurement tool to see where the given state stands in this competitiveness. Different studies were performed to measure the competitiveness so far (Balassa,1965:99-124, Vollrath,1991:265-279, Fagerberg, Srholec and Knell,2007:1595-1620, Siggel,2006:137-159, Clark and Guy,1998:363-395, Porter,1990:73-84, Di Bella, Lewis and Martin,2007:1-46, Turner and Van’t dack:1-149). The remarkable point on the studies listed and not listed above is the occurrence of different results. Structural differences, data sets, interval, country structures and the numbers of the factors used at calculations of competitiveness are the primary reason on this occurrence. The purpose of this study is to determine the competitiveness of Turkey against the BRIC countries which are described as big rivals of Turkey, by determining the effects of exchange rate on export between 2007- 2011 in Turkey. By this purpose, competitiveness will be defined and the factors which effect competitiveness will be emphasized. Then the method of the study will be explained and in the last part results of the analysis will be interpreted.
2. COMPETITION POWER, EXCHANGE RATES AND EXPORT
2.1. Definition of Competitiveness Competitiveness is not a notion to be reached consensus about its definition due to the reasons on getting together of numerous indicators such as the firmal and sectoral analysis and the usage or discussion by one indicator. Competitiveness can be defined by the ability of firm to depreciate against rival brands or producing and selling high quality goods at firms level. However the competitiveness at the sectoral level is considered with the competitiveness of the big companies that are involved by the sector. Competitiveness at country level is not only export or the ability to approve balance of trade but also increasing the level of income and employment; achieving a reputable and processing increasements on the quality of living and the ability of increasing the share on international markets. (Aktan 2004:18)
There are many factors affecting competiveness. Aktan (2004) grouped them as;

INTERNATIONAL JOURNAL OF SOCIAL SCIENCES AND HUMANITY STUDIES Vol 4, No 2, 2012 ISSN: 1309-8063 (Online)
161
• Internal Firm Factors: The quality of products, costs and the price; manpower costs, capital costs, import costs, tax costs, social security costs, e.g. can be enumerated within the costs. On the other hand efficiency, profitability, IT, the structure of organization and management, effective use of the sources, innovation and creativity can be enumerated in the intra-firm factors.
• External Firm Factors: The interventions of government and government's place at economy, international commerce system, the level of consumer awareness’s, elasticity level at labor markets, country's economic stability, natural resources and natural richness can be enumerated in the external factors.
In this study, competition power will be investigated in country level, Thus, just real exchange rates (RER) and purchase power parity(PPP) will be investigated, under assumption that all other variables are constant.
2.2. Real Exchange Rate and Purchase Power Parity Reel exchange rate, conceptually, is described as relative prices of tradable and non-tradable goods (Kotan,2002:2) and it is one of the most important determiner of foreign trade (Levis and Driver,1998:3). It is reported by (Arize,1995), (Spitaller,1980:320-348), (In and Mennon,1996:1075-7080) and more that change in real exchange rates effect trade balances.
Despite its extensive uses as a tool for measuring international competition, this value is calculated for only one currency and it can’t represent the competition accurately thus it is suggested that using reel effective exchange rate (REER) which is acquired by deflating the real exchange rate movements with relative prices if there are more than one currency. (Ghose and Kharas,1993:377-398) However, due to difficulty in finding data for BRIC countries, real exchange rates are used in this work. Real exchange rates (RER) can be defined in two topics, first one is tradable and non-tradable goods and the other one is Purchase Power Parity as known PPP. In their study, Aslan and Kambur said that “the PPP is defined as the currency conversion rate in the application of the single price law to all product markets rather than one product which dispose the price level differentiations among the countries. The ratio of the countries general price levels to each other is equal. This is used in international comparisons to measure the price-exchange rate relation” (Aslan and Kanbur,2007:14). Generally following formula is used for PPP;

INTERNATIONAL JOURNAL OF SOCIAL SCIENCES AND HUMANITY STUDIES Vol 4, No 2, 2012 ISSN: 1309-8063 (Online)
162
PPP, tells us about both inflation and competitiveness. If P>P*, this means inflation rate in the domestic markets is relatively higher than the foreign markets. This is due to a higher nominal exchange rate than the real exchange rate which points an artificially overvalued domestic currency. Hence, competition power of the country declines in international markets. Otherwise, if the domestic inflation rate is lower than foreign inflation rate, it causes higher nominal change rate than the real exchange rate which means undervaluation of domestic currency, competition power of the country increases in international markets. For the formula;
P*: Foreign Prices (USA’s CPI used as Foreign Prices for all countries) P: Domestic Prices (Countries’ own CPI used as Domestic Price for each one) e: Nominal Exchange Rates (Between USA and Each Country) For measuring PPP, some variables, such as CPI of all countries, the nominal exchange rate of Turkey and BRIC countries against each other, also the nominal exchange rates among Turkish and BRIC countries and export volume of Turkey and BRIC countries to whole world. Time series can be monthly, quarterly or annual but in this study, monthly series were used to see every sensitive change in these series (see Notes 1 to 6). Our method is for RER;
By the reason of table’s size, it can’t be represented here but it is clearly visible from figure-1 that nominal exchange rate between Turkey and China in terms of value of China’s currency in Turkish domestic currency is lower than the real exchange rates during all period of analysis. CPI of China is 103.94 (2005=100) in January 2007 and in the end of the period it is up to 123.29 by increasing % 19. In the same period CPI of Turkey is 115.63 (2005=100) in 2007 and 170.96 in December 2011 by increasing %48. Due to high domestic prices, Turkish competition power has declined in this period under assumption that all other variables are constant.

INTERNATIONAL JOURNAL OF SOCIAL SCIENCES AND HUMANITY STUDIES Vol 4, No 2, 2012 ISSN: 1309-8063 (Online)
163
Figure-1: Turkey’s RER against BRIC countries
Source: For CPIs, (2005=100) OECD Database, for nominal exchange rates www.oanda.com. CPI of Brazil is again lower than CPI of Turkish during the all 2007-2011 period. Brazil’s CPI is 106.02 in January 2007 and 137.39 in December 2011 by increasing %30 while CPI of Turkey is 115.63 in the beginning of 2007 and 170.96 at the end of 2011. It can also be seen on figure-1 that Brazil’s and China’s RER is declining. This means during this period Turkish prices are higher than both China’s and Brazil’s prices and it makes Turkey less competitive against these countries.
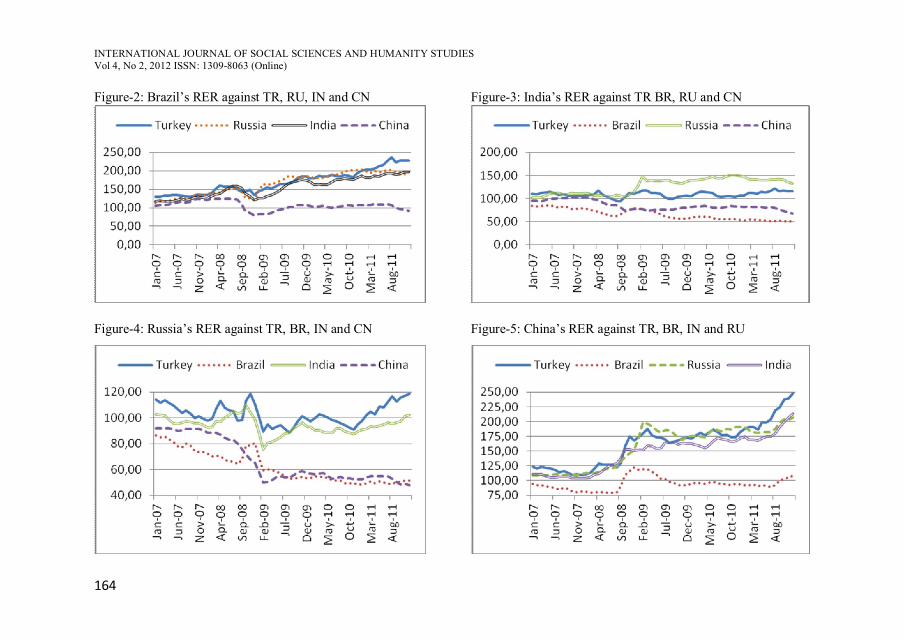
India and Russia has floating RER during 2007-2011 (figure-1). In January 2007, CPI of Russia and India are 114.44 and 109.31, in December 2011 179.12 and 169.56. In 2007-2011, Turkey’s CPI is almost the same as Russia’s and India’s. Fluctuates in figure-1 for Russia’s and India’s RER shows that in some months Turkey’s CPI is lower than this countries and it makes Turkey more competitive in the these months. But except these months, RERs show that India’s and Russia’s CPI are lower than Turkey’s CPI on average. During 2007-2011, China seems most competitive country due to figure-2, 3, 4 and 5. In figure-5, China’s RER is always higher than 100 in 2007-2011 period. As it seems Brazil’s prices are only competitive one against China’s prices. Brazil’s prices are lower than all countries except China. On the other hand, India is more competitive than Russia and Turkey. Russia’s prices are slightly better than Turkey’s prices in 2007-2008 and 2011but in total they are the second less competitive prices.
INTERNATIONAL JOURNAL OF SOCIAL SCIENCES AND HUMANITY STUDIES Vol 4, No 2, 2012 ISSN: 1309-8063 (Online)
164
Figure-2: Brazil’s RER against TR, RU, IN and CN Figure-3: India’s RER against TR BR, RU and CN
Figure-4: Russia’s RER against TR, BR, IN and CN Figure-5: China’s RER against TR, BR, IN and RU

INTERNATIONAL JOURNAL OF SOCIAL SCIENCES AND HUMANITY STUDIES Vol 4, No 2, 2012 ISSN: 1309-8063 (Online)
165
Figure-6: Turkey’s and BRIC countries’ export volumes (million $)
Source: See notes 3, 4, 5, 6 and 7

INTERNATIONAL JOURNAL OF SOCIAL SCIENCES AND HUMANITY STUDIES Vol 4, No 2, 2012 ISSN: 1309-8063 (Online)
166
However, changes in RER can’t be meaningful for competition power without trade volumes of countries. Even RER with the trade volumes may not make any sense since absence of the other factors such as unit labor cost, GDP changes in foreign markets, quality and innovation etc. in analyze. In figure-6 export volumes of countries are shown. When we look at the Turkey’s export volume, we see an increasing trend January 2007 to September 2008. After a peak in September 2008 a sharp decline is seen on the figure-6. This is an acceptable decline due to economic recession at all over the world since all BRIC countries have performance a sharp decline too. But while a recovery period has been shown in 2010 to 2011, Turkey’s export volume isn’t shown the same performance. Between October 2010 and October 2011 export volume has got a drag in same values. Despite Turkey’s drag on export volume, all countries had better numbers than the numbers which they had before the crisis.
In BRIC countries, after Turkey, Russia is the less competitive country due to RER. After crisis, Russia had a recovery period too but it is less powerful than the other countries. China, Brazil and India are more successful than Russia and Turkey during the period. These three countries have achieved better numbers than the numbers before crisis.
3. CONCLUSION In this study, we tried to investigate the relationship among export volume, competition power and exchange rate. What we got from the analysis, the real exchange rates has a significant impact on export volumes. It seems that export volumes and real exchange rate performances are relevant, since the countries which have lower RER from others have shown better export performance. Also, figure-6 shows that, export volume has also influenced from World’s GDP too by the reason of countries’ showed performances have same trend with changes in World’s GDP like a decline by %5 effected all countries’ export volume in 2009. According to figures, while Turkey is the less competitive country owing to domestic prices, China is the most competitive country among the BRIC countries. After China, India has performed the second good performance on total export volume despite Brazil has the second good RER. Since Brazil’s products for highly domestic markets, it might effects its trade performance. Among these five countries, due to Russia’s most important export item is fuel-oil, it is highly sensitive to all economic fluctuations. During the crises, since fuel-oil prices are floating, Russia’s export volume might be affected from unsteady prices.
INTERNATIONAL JOURNAL OF SOCIAL SCIENCES AND HUMANITY STUDIES Vol 4, No 2, 2012 ISSN: 1309-8063 (Online)
167
By virtue of higher Turkish domestic currency, lower export volumes can be waited in next couple months. Export volume in 2012 without amount of precious stones and metals (because it is not permanent) can be start of happening forecast.
Notes 1. In these tables base year was 2005. Values in 2005 were accepted equal to 100.
2. CPI of all countries can be obtained using OECD statistic page. 3. Brazilian trade data set has got from the Central Bank of Brazil.
4. Russian trade data set has got from the Central Bank of Russia. There is no special series for trade data but it can be obtained using annual balance of payments series.
5. Indian trade data set has got from the Reserve Bank of India. 6. Chinese trade data set has got from cnki.net (it’s based on National Bureau of Statistics of China). In series there were some missing sets and the missing sets obtained by calculating them due to the news statistics for China.
7. Turkish trade data set has got from the Turkish Statistics Institute.
BIBLIOGRAPHY Cockburn John, Eckhard Siggel, Massaoly Coulibaly and Sylvian Vézina (1998), Measuring Competitiveness and Its Sources: The Case of Mali’s Manufacturing Sector, African Economic Paper; Discussion Paper:16. Washington D.C: United States Agency for International Development Bureau. Michael Eugene Porter (1998), The Competitive Advantage of Nations, New York: The Free Press, pp.73-84. Rainer Feurer ve Kazem Chaharbaghi (1994), “Defining Competitiveness: A Holistic Approach”, Management Decision, Vol.32, No.2, pp.49-58. James R. Markusen, Productivity, Competitiveness, Trade Performance and Real Income: The Nexus Amonf Four Concepts in Coşkun Can Aktan ve İstiklal Y. Vural (2004), Rekabet Dizisi: 2 Rekabet Gücü ve Rekabet Stratejileri, Ankara: Türkiye İş Veren Sendikaları Konfederasyonu. Coşkun Can Aktan ve İstiklal Y. Vural (2004), Rekabet Dizisi: 2 Rekabet Gücü ve Rekabet Stratejileri, Ankara: Türkiye İş Veren Sendikaları Konfederasyonu. Bela Balassa (1965), “Trade Liberalization and ʻRevealedʼ Comparative Advantage”, The Manchester School, Vol.33, pp.99-123.

INTERNATIONAL JOURNAL OF SOCIAL SCIENCES AND HUMANITY STUDIES Vol 4, No 2, 2012 ISSN: 1309-8063 (Online)
168
Thomas L. Vollrath (1991), “A Theoretical Evaluation of Alternative Trade Intensity Measures of Revealed Comparative Advantage”, Review of World Economics, Vol.127, No.2, pp.265-280. Jan Fagerberg, Martin Srholec and Mark Knell (2007), “The Competitiveness of Nations: Why Some Countries Prosper While Others Fall Behind?”, World Development, Vol.35(10), pp.1595-1620. Eckhard Siggel (2006), “International Competitiveness and Comparative Advantage: A Survey and a Proposal for Measurement”, Journal of Industry, Competition and Trade, Vo l.6, No.2, pp.137-159. John Clark and Ken Guy (1998), “Innovation and Competitiveness: A Review”, Technology Analysis and Strategic Management, Vol.10, No.3, pp.363-395. Gabriel Di Bella, Mark Lewis and Aurélie Martin (2007), Assessing Competitiveness and Real Exchange Rate Misalignments in Low Income Countries, IMF WP Series, No.07/201, International Monetary Fund. Philip Turner and Jozef van’t Dack (1993), Measuring International Price and Cost Competitiveness, Bank for International Settlements Economic Paper Series, No.39. Zelal Kotan (2002), Uluslararası Rekabet Gücü Göstergeleri Türkiye Örneği, TCMB Çalışma Tebliği. Devajyoti Ghose and Homi Kharas (1993), International Competitiveness, the Demand for Exports and Real Effective Exchange Rates in Developing Countries, Journal of Development Economics, Vol.41(2), pp.377-398. S. W. Kevis and R. Driver (1998), Real Exchange Rates for the Year 2000 (Policy Analyses in International Economics), Institute for International Economics, May. Nurdan Aslan and Ayşe N. Kanbur (2007), “Türkiye’de 1980 Sonrası Satın Alma Gücü Paritesi Yaklaşımı”, Marmara Üniversitesi İ.İ.B.F. Dergisi, Vol.23(2), pp.9-43. Augustine C. Arize, “The Effects of Exchange-Rate Volatility on U.S. Exports: An Empirical Investigation”, Southern Economic Journal, Vol.62(1), pp. 33-43. Erich Spitaller (1980), Short-Run Effects of Exchange Rate Changes on Terms of Trade and Trade Balance, IMF Staff Papers, Vol.27, No.2, pp.320-348. Francis In and Jayant Menon (1996), “The Long - Run Relationship Between the Real Exchange Rate and Terms of Trade in OECD Countries”, Applied Economics, Vol. 28(9), pp.1075-1080.
View publication statsView publication stats