· web viewotis elevator herbert gibson director of facilities all indicators met standards....
TRANSCRIPT

QUARTERLY REPORT ON ORGANIZATIONAL PERFORMANCE EXCELLENCE
FOURTH STATE FISCAL QUARTER 2016April, May, June 2016
Sharon Sprague SuperintendentAugust 10, 2016


THIS PAGE INTENTIONALLY LEFT BLANK
Table of Contents
Introduction.............................................................................................................................1
Comparative Statistics..............................................................................................................4
Joint Commission Performance MeasuresHospital Based Inpatient Psychiatric Services (ORYX Measures)............................................15
Admissions Screening.................................................................................................17Physical Restraint.......................................................................................................18Seclusion.................................................................................................................... 19Multiple Antipsychotic Medications...........................................................................20Justification of Multiple Antipsychotic Medications...................................................22Post Discharge Continuing Care Plan.........................................................................24Transmission of Post Discharge Continuing Care Plan...............................................25
Joint Commission Priority Focus AreasContracts Management..............................................................................................26Medication Management...........................................................................................28Consumer Surveys......................................................................................................31Fall Reduction Strategies............................................................................................40Pain Assessment.........................................................................................................44
Strategic Performance ExcellenceProcess Improvement Plans...................................................................................................50
Dietary........................................................................................................................53Health Information Management..............................................................................54Human Resources...................................................................................................... 56Infection Control........................................................................................................62Medical Staff.............................................................................................................. 67Nursing.......................................................................................................................73Outpatient Services....................................................................................................82Pharmacy Services......................................................................................................87Social Services............................................................................................................96Staff Education and Development..............................................................................99Therapeutic Services................................................................................................107

THIS PAGE INTENTIONALLY LEFT BLANK

Introduction
This edition of the Dorothea Dix Psychiatric Center Quarterly Report on Organizational Performance Excellence is designed to address overall organizational performance in a systems improvement approach instead of a purely compliance approach. The structure of the report also reflects a shift to this focus on meaningful measures of organizational process improvement, while maintaining measures of compliance that are mandated though regulatory and legal standards.
This change was inspired, in part by the work done for both Riverview and Dorothea Dix Psychiatric Centers by Courtemanche and Associates, during a Joint Commission Mock Survey in February 2012. During this visit, the consultants identified a gap in the methods used to evaluate and improve organizational performance. It was recommended that the methodology used for organizational performance improvement be transitioned from a process that relied completely on meeting regulatory standards, collection, and reporting on information as a matter of routine, to a more focused approach that sought out areas for improvement that were clearly identified as performance priorities. In addition, a review of current practices in quality management represented by the work of groups such as the American Society for Quality, National Quality Forum, Baldrige National Quality Program and the National Patient Safety Foundation, all recommend a systems-based approach where organizational improvement activities are focused on strategic priorities rather than compliance standards.
There are three major sections that make up this modified report:
The first section reflects traditional measures related to Comparative Statistics.
The second section describes the hospital’s performance with regard to Joint Commission performance measures that are derived from the Hospital Based Inpatient Psychiatric Services (HBIPS) that are reflected in the Joint Commissions quarterly ORYX Report and priority focus areas that are referenced in the Joint Commission standards:
I. Data Collection (PI.01.01.01)II. Data Analysis (PI.02.01.01, PI.02.01.03)III. Performance Improvement (PI.03.01.01)
The third section encompasses those departmental process improvement projects that are designed to improve the overall effectiveness and efficiency of the hospital’s operations and contribute to the system’s overall strategic performance excellence.
Page 5

As with any change in how organizations operate, there are early adopters and those whose adoption of system changes is delayed. It is anticipated that over the next year, further contributors to this section of strategic performance excellence will be added as opportunities for improvement and methods of improving operational functions are defined.
Respectfully Submitted,
Joseph RiddickJoseph RiddickDirector of Integrated Quality and Informatics
Page 6

THIS PAGE INTENTIONALLY LEFT BLANK
Page 7

The comparative statistics reports include the following elements:
Patient Injury Rate
Elopement Rate
30 Day Readmit Rate
Percent of Patients Restrained
Hours of Restraint
Percent of Patients Secluded
Hours of Seclusion
Confinement Event Breakdown
Page 8

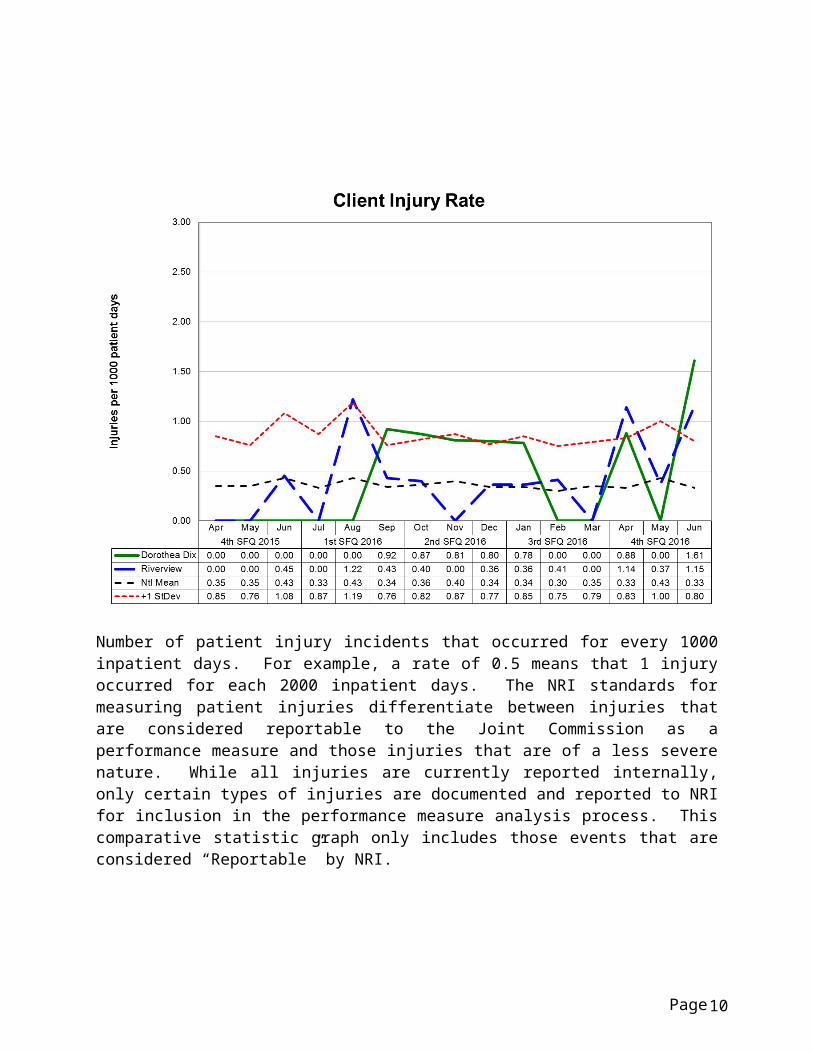
Number of patient injury incidents that occurred for every 1000 inpatient days. For example, a rate of 0.5 means that 1 injury occurred for each 2000 inpatient days. The NRI standards for measuring patient injuries differentiate between injuries that are considered reportable to the Joint Commission as a performance measure and those injuries that are of a less severe nature. While all injuries are currently reported internally, only certain types of injuries are documented and reported to NRI for inclusion in the performance measure analysis process. This comparative statistic graph only includes those events that are considered “Reportable” by NRI.
Page 9
COMPARATIVE STATISTICS
“Reportable” injuries include those that require: Medical Intervention Hospitalization Death Occurred
“Non-reportable” injuries include those that require: No Treatment Minor First Aid
Injury Severity:
No Treatment – The injury received by a patient may be examined by a clinician but no treatment is applied to the injury.
Minor First Aid – The injury received is of minor severity and requires the administration of minor first aid.
Medical Intervention Needed – The injury received is severe enough to require the treatment of the patient by a licensed practitioner, but does not require hospitalization.
Hospitalization Required – The injury is so severe that it requires medical intervention and treatment as well as care of the injured patient at a general acute care medical ward within the facility or at a general acute care hospital outside the facility.
Death Occurred – The injury received was so severe that it resulted in, or complications of the injury lead to, the termination of the life of the injured patient.
Page 10

COMPARATIVE STATISTICS
Type and Cause of Injury by Month
Type - Cause Apr May June 4Q2016Accident 1 1 5 7Fall 2 1 2 5Other 2 2 4Patient to Patient Incident 4 1 5Self-Injurious Behavior 3 1 2 6Total 12 6 9 27
Severity of Injury by Month
Severity Apr May June 4Q2016No Treatment 7 4 4 15Minor First Aid 5 1 5 11Medical Intervention Required 1 1Hospitalization RequiredDeath OccurredTotal 12 6 9 27
Page 11

COMPARATIVE STATISTICS
Number of elopement incidents that occurred for every 1000 inpatient days. For example, a rate of 0.25 means that 1 elopement occurred for each 4000 inpatient days.
Page 12

COMPARATIVE STATISTICS
Percent of discharges from the facility that returned within 30 days of a discharge of the same patient from the same facility. For example, a rate of 10.0 means that 10% of all discharges were readmitted within 30 days.
Readmissions may be attributable to several factors including court ordered returns related to non-compliance with PTP parameters. The information contained in this graph does not differentiate between those returns that are court ordered and those that may be attributable to other factors related to patient care.
Page 13

COMPARATIVE STATISTICS
Percent of unique patients who were restrained at least once. The NRI and Joint Commission standards require that all types of restraint, including manual holds of less than 5 minutes be included in this indicator. For example, rates of 4.0 means that 4% of the unique patients served were restrained at least once, for any amount of time.
Page 14

COMPARATIVE STATISTICS
Number of hours patients spent in restraint for every 1000 inpatient hours. For example, a rate of 1.6 means that 2 hours were spent in restraint for each 1250 inpatient hours.
Page 15

COMPARATIVE STATISTICS
Percent of unique patients who were secluded at least once. For example, a rate of 3.0 means that 3% of the unique patients served were secluded at least once.
Page 16

COMPARATIVE STATISTICS
Number of hours patients spent in seclusion for every 1000 inpatient hours. For example, a rate of 0.8 means that 1 hour was spent in seclusion for each 1250 inpatient hours.
Page 17

COMPARATIVE STATISTICS
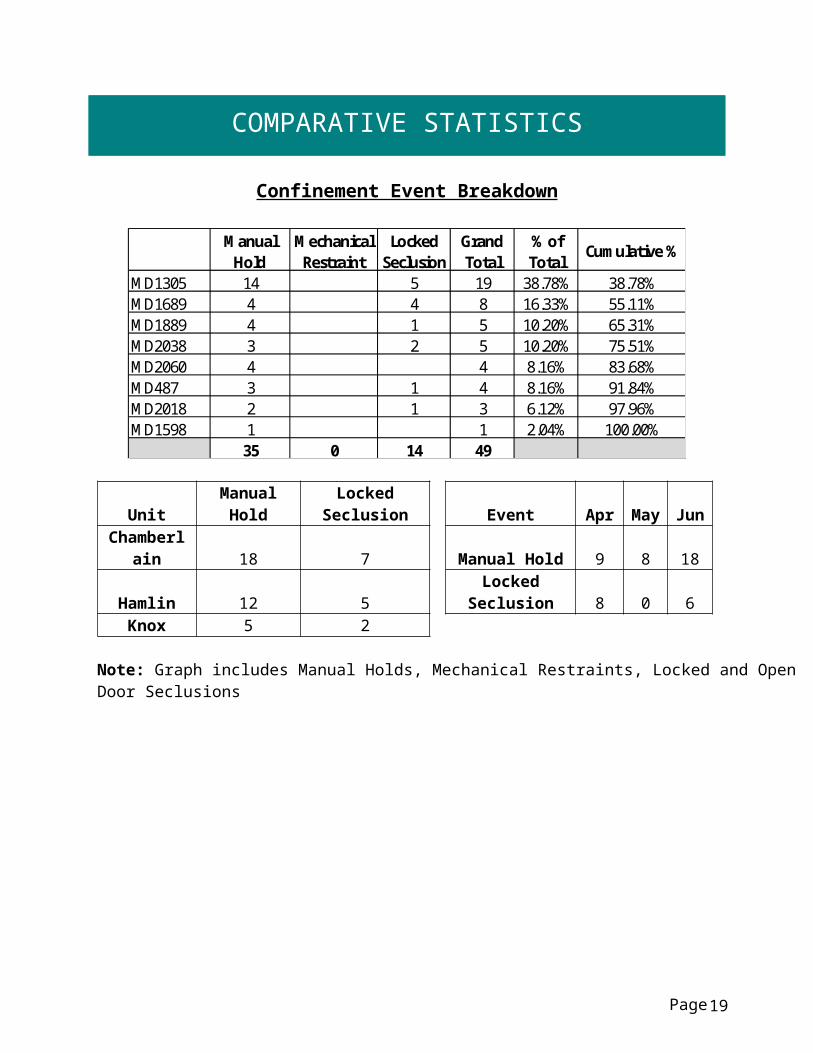
Confinement Event Breakdown
Manual Hold
Mechanical Restraint
Locked Seclusion
Grand Total
% of Total
Cumulative %
MD1305 14 5 19 38.78% 38.78%MD1689 4 4 8 16.33% 55.11%MD1889 4 1 5 10.20% 65.31%MD2038 3 2 5 10.20% 75.51%MD2060 4 4 8.16% 83.68%MD487 3 1 4 8.16% 91.84%MD2018 2 1 3 6.12% 97.96%MD1598 1 1 2.04% 100.00%
35 0 14 49
Unit Manual Hold Locked Seclusion Event AprMay Jun
Chamberlain 18 7 Manual Hold 9 8 18
Hamlin 12 5 Locked Seclusion 8 0 6Knox 5 2
Note: Graph includes Manual Holds, Mechanical Restraints, Locked and Open Door Seclusions
Page 18
COMPARATIVE STATISTICS
Page 19

JOINT COMMISSION
Hospital Based Inpatient Psychiatric Services (ORYX Data Elements)
The Joint Commission Quality Initiatives
In 1987, The Joint Commission announced its Agenda for Change, which outlined a series of major steps designed to modernize the accreditation process. A key component of the Agenda for Change was the eventual introduction of standardized core performance measures into the accreditation process. As the vision to integrate performance measurement into accreditation became more focused, the name ORYX® was chosen for the entire initiative. The ORYX initiative became operational in March of 1999, when performance measurement systems began transmitting data to The Joint Commission on behalf of accredited hospitals and long term care organizations. Since that time, home care and behavioral healthcare organizations have been included in the ORYX initiative.
The initial phase of the ORYX initiative provided healthcare organizations a great degree of flexibility, offering greater than 100 measurement systems capable of meeting an accredited organization’s internal measurement goals and the Joint Commission’s ORYX requirements. This flexibility, however, also presented certain challenges. The most significant challenge was the lack of standardization of measure specifications across systems. Although many ORYX measures appeared to be similar, valid comparisons could only be made between healthcare organizations using the same measures that were designed and collected based on standard specifications. The availability of over 8,000 disparate ORYX measures also limited the size of some comparison groups and hindered statistically valid data analyses. To address these challenges, standardized sets of valid, reliable, and evidence-based quality measures have been implemented by The Joint Commission for use within the ORYX initiative.
Hospital Based Inpatient Psychiatric Services (HBIPS) Core Measure Set
Driven by an overwhelming request from the field, The Joint Commission was approached in late 2003 by the National Association of Psychiatric Health Systems (NAPHS), the National Association of State Mental Health Program Directors (NASMHPD) and the NASMHPD Research Institute, Inc. (NRI) to work together to identify and implement a set of core performance measures for hospital based inpatient psychiatric services. Project activities were launched in March 2004. At this time, a diverse panel of stakeholders convened to discuss and recommend an overarching initial framework for the identification of HBIPS core performance measures. The Technical Advisory Panel (TAP) was established in March 2005 consisting of many prominent experts in the field.
Page 20

JOINT COMMISSION
The first meeting of the TAP was held May 2005 and a framework and priorities for performance measures was established for an initial set of core measures. The framework consisted of seven domains:
Assessment Treatment Planning and Implementation Hope and Empowerment Patient Driven Care Patient Safety Continuity and Transition of Care Outcomes
The current HIBIPS standards reflected in this report are designed to reflect these core domains in the delivery of psychiatric care.
Page 21
JOINT COMMISSION
Admissions Screening (HBIPS 1)For Violence Risk, Substance Use, Psychological Trauma History, and Patient Strengths
Description: Patients admitted to a hospital based, inpatient psychiatric setting who are screened within the first three days of admission for all of the following: risk of violence to self or others, substance use, psychological trauma history and patient strengths.
Rationale: Substantial evidence exists that there is a high prevalence of co-occurring substance use disorders as well as history of trauma among persons admitted to acute psychiatric settings. Professional literature suggests that these factors are under-identified yet integral to current psychiatric status and should be assessed in order to develop appropriate treatment (Ziedonis, 2004; NASMHPD, 2005). Similarly, persons admitted to inpatient settings require a careful assessment of risk for violence and the use of seclusion and restraint. Careful assessment of risk is critical to safety and treatment. Effective, individualized treatment relies on assessments that explicitly recognize patients’ strengths. These strengths may be characteristics of the individuals themselves, supports provided by families and others, or contributions made by the individuals’ community or cultural environment (Rapp, 1998). In the same way, inpatient environments require assessment for factors that lead to conflict or less than optimal outcomes.
Page 22
JOINT COMMISSION
Physical Restraint (HBIPS 2)Hours of Use
Description: The total number of hours that all patients admitted to a hospital-based, inpatient psychiatric setting were maintained in physical restraint.
Rationale: Mental health providers that value and respect an individual’s autonomy, independence and safety seek to avoid the use of dangerous or restrictive interventions at all times (Donat, 2003). The use of seclusion and restraint is limited to situations deemed to meet the threshold of imminent danger and when restraint and seclusion are used; such use is rigorously monitored and analyzed to prevent future use. Providers also seek to prevent violence or aggression from occurring in their treatment environments by focusing their attention on prevention activities that have a growing evidence base (Donat, 2003).
Page 23

JOINT COMMISSION
Seclusion (HBIPS 3) Hours of Use
Description: The total number of hours that all patients admitted to a hospital based inpatient psychiatric setting were held in seclusion.
Rationale: Mental health providers that value and respect an individual’s autonomy, independence and safety seek to avoid the use of dangerous or restrictive interventions at all times (Donat, 2003). The use of seclusion and restraint is limited to situations deemed to meet the threshold of imminent danger and when restraint or seclusion are used; such use is rigorously monitored and analyzed to prevent future use. Providers also seek to prevent violence or aggression from occurring in their treatment environments by focusing their attention on prevention activities that have a growing evidence base (Donat, 2003).
Page 24

JOINT COMMISSION
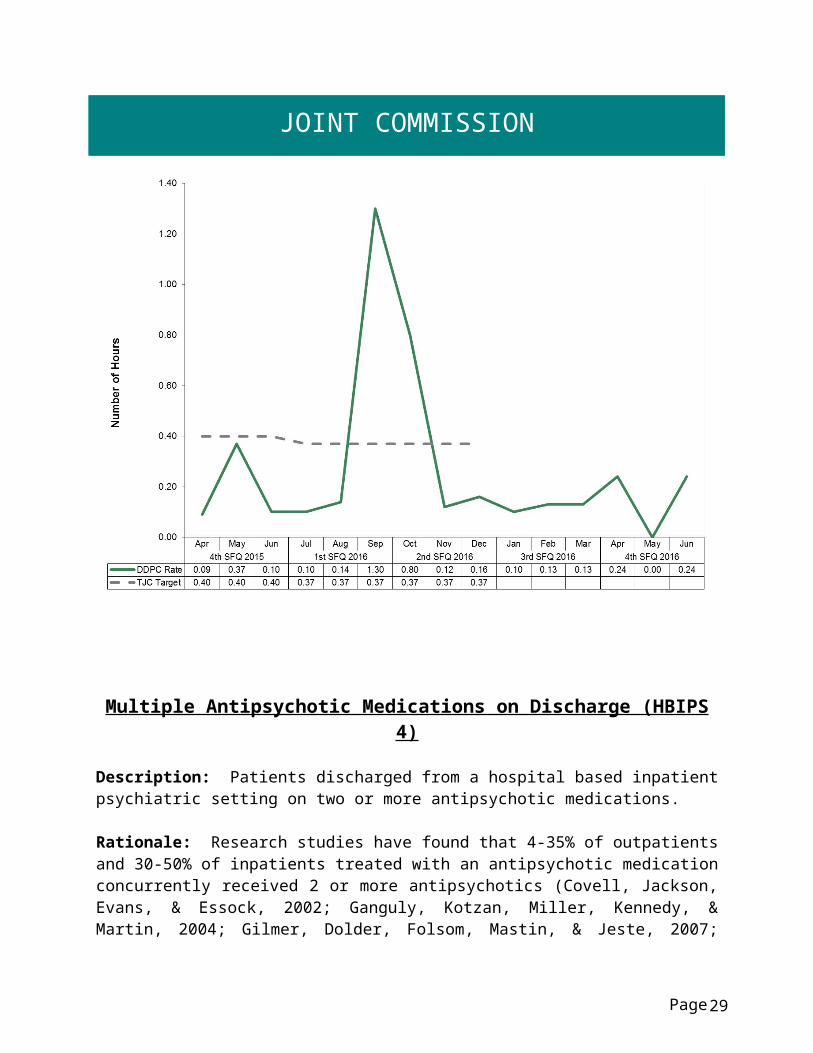
Multiple Antipsychotic Medications on Discharge (HBIPS 4)
Description: Patients discharged from a hospital based inpatient psychiatric setting on two or more antipsychotic medications.
Rationale: Research studies have found that 4-35% of outpatients and 30-50% of inpatients treated with an antipsychotic medication concurrently received 2 or more antipsychotics (Covell, Jackson, Evans, & Essock, 2002; Ganguly, Kotzan, Miller, Kennedy, & Martin, 2004; Gilmer, Dolder, Folsom, Mastin, & Jeste, 2007; Kreyenbuhl, Valenstein, McCarthy, Ganocyz, & Blow, 2006; Stahl & Grady, 2004). One study reported 4.6% of patients concurrently received 3 or more antipsychotics (Jaffe & Levine, 2003). These findings are seen across diverse sectors: state mental health authorities, the Veterans Health System and Medicaid-financed care. Antipsychotic polypharmacy can lead to greater side effects, often without improving clinical outcomes (Ananth, Parameswaran, & Gunatilake, 2004; Stahl & Grady, 2004). As a result, a range of stakeholders have called for efforts to reduce unnecessary use of multiple antipsychotics (Centorrino, Gören, Hennen, Salvatore, Kelleher, & Baldessarini, 2004; Gilmer, Dolder, Folsom, Mastin, & Jeste, 2007; National Association of State Mental Health Program Directors, 2001; University HealthSystem Consortium, 2006). Practice guidelines recommend the use of a second antipsychotic only after multiple trials of a single antipsychotic have proven inadequate (American Psychiatric Association [APA] Practice Guidelines, 2004). Randomized controlled trials (RCTs) provide some evidence to support augmentation with a second antipsychotic in treatment resistant patients. Most of these studies were limited to augmentation of clozapine with another second-generation antipsychotic (Tranulis, Skalli, Lalonde, & Nicole, 2008). Among patients without a documented history of previous treatment failures of antipsychotic monotherapy, multiple RCTs and other controlled trials failed to show a benefit of antipsychotic polypharmacy over monotherapy (Ananth, Parameswaran, & Gunatilake, 2004; Centorrino, Gören, Hennen, Salvatore, Kelleher, & Baldessarini, 2004; Potkin, Thyrum, Alva, Bera, Yeh, & Arvanitis, 2002; Shim et al., 2007; Stahl,& Grady, 2004). Clinical circumstances, such as shorter inpatient stays, may require hospitals to discharge a patient on multiple antipsychotics with an aftercare plan to transition to monotherapy. In such cases, effective communication between the inpatient and aftercare clinician is an essential element of care.
Page 25

JOINT COMMISSION
Multiple Antipsychotic Medications on Discharge (HBIPS 4)
Page 26

JOINT COMMISSION
Multiple Antipsychotic Medications at Discharge with Justification (HBIPS 5)
Description: Patients discharged from a hospital based inpatient psychiatric setting on two or more antipsychotic medications with appropriate justification.
Rationale: Research studies have found that 4-35% of outpatients and 30-50% of inpatients treated with an antipsychotic medication concurrently received 2 or more antipsychotics (Covell, Jackson, Evans, & Essock, 2002; Ganguly, Kotzan, Miller, Kennedy, & Martin, 2004; Gilmer, Dolder, Folsom, Mastin, & Jeste, 2007; Kreyenbuhl, Valenstein, McCarthy, Ganocyz, & Blow, 2006; Stahl & Grady, 2004). One study reported 4.6% of patients concurrently received 3 or more antipsychotics (Jaffe & Levine, 2003). These findings are seen across diverse sectors: state mental health authorities, the Veterans Health System and Medicaid-financed care. Antipsychotic polypharmacy can lead to greater side effects, often without improving clinical outcomes (Ananth, Parameswaran, & Gunatilake, 2004; Stahl & Grady, 2004). As a result, a range of stakeholders have called for efforts to reduce unnecessary use of multiple antipsychotics (Centorrino, Gören, Hennen, Salvatore, Kelleher, & Baldessarini, 2004; Gilmer, Dolder, Folsom, Mastin, & Jeste, 2007; National Association of State Mental Health Program Directors, 2001; University HealthSystem Consortium, 2006).
Practice guidelines recommend the use of a second antipsychotic only after multiple trials of a single antipsychotic have proven inadequate (American Psychiatric Association [APA] Practice Guidelines, 2004). Randomized controlled trials (RCTs) provide some evidence to support augmentation with a second antipsychotic in treatment resistant patients. Most of these studies were limited to augmentation of clozapine with another second-generation antipsychotic (Tranulis, Skalli, Lalonde, & Nicole, 2008). Among patients without a documented history of previous treatment failures of antipsychotic monotherapy, multiple RCTs and other controlled trials failed to show a benefit of antipsychotic polypharmacy over monotherapy (Ananth, Parameswaran, & Gunatilake, 2004; Centorrino, Gören, Hennen, Salvatore, Kelleher, & Baldessarini, 2004; Potkin, Thyrum, Alva, Bera, Yeh, & Arvanitis, 2002; Shim et al., 2007; Stahl,& Grady, 2004). Clinical circumstances, such as shorter inpatient stays, may require hospitals to discharge a patient on multiple antipsychotics with an aftercare plan to transition to monotherapy. In such cases, effective communication between the inpatient and aftercare clinician is an essential element of care.
Page 27

JOINT COMMISSION
Multiple Antipsychotic Medications at Discharge with Justification (HBIPS 5)
Page 28
JOINT COMMISSION
Post Discharge Continuing Care Plan (HBIPS 6)
Description: Patients discharged from a hospital based inpatient psychiatric setting with a continuing care plan created.
Rationale: Patients may not be able to fully report to their next level of care health-care provider their course of hospitalization or discharge treatment recommendations. The aftercare instructions given the patient may not be available to the next level of care provider at the patient’s initial intake or follow-up appointment. In order to provide optimum care, next level of care providers need to know details of precipitating events immediately preceding hospital admission, the patient’s treatment course during hospitalization, discharge medications and next level of care recommendations (American Association of Community Psychiatrists [AACP], (2001).
Note: The Joint Commission discontinued this measure effective 12/31/2015.
Page 29

JOINT COMMISSION
Post Discharge Continuing Care Plan Transmitted (HBIPS 7)To Next Level of Care Provider on Discharge
Description: Patients discharged from a hospital based inpatient psychiatric setting with a continuing care plan provided to the next level of care clinician or entity.
Rationale: Patients may not be able to fully report to their next level of care health-care provider their course of hospitalization or discharge treatment recommendations. The aftercare instructions given the patient may not be available to the next level of care provider at the patient’s initial intake or follow-up appointment. In order to provide optimum care, next level of care providers need to know details of precipitating events immediately preceding hospital admission, the patient’s treatment course during hospitalization, discharge medications and next level of care recommendations (American Association of Community Psychiatrists [AACP], 2001).
Note: The Joint Commission discontinued this measure effective 12/31/2015.
Page 30

JOINT COMMISSION
Contracts Management
TJC LD.04.03.09 The same level of care should be delivered to patients regardless of whether services are provided directly by the hospital or through contractual agreement. Leaders provide oversight to make sure that care, treatment, and services provided directly are safe and effective. Likewise, leaders must also oversee contracted services to make sure that they are provided safely and effectively.
4Q2016 ResultsContractor Program Administrator Summary of PerformanceABM Mechanical Herbert Gibson
Director of FacilitiesAll indicators exceeded standards.
Affiliated Laboratory Janet BabcockDirector of Nursing
All indicators exceeded standards.
AMES Maine Herbert GibsonDirector of Facilities
All indicators met or exceeded standards.
Casella Waste Systems Herbert GibsonDirector of Facilities
All indicators met or exceeded standards.
CES, Inc. Herbert GibsonDirector of Facilities
All indicators met or exceeded standards.
Comprehensive Pharmacy Services
Sharon SpragueSuperintendent
All indicators met or exceeded standards.
Harriman Associates Herb GibsonDirector of Facilities
All indicators exceeded standards.
The Healing Staff Dr. Michelle GardnerClinical Director
Contract not utilized during timeframe.
Ilina Engineering Herbert GibsonDirector of Facilities
All indicators met standards.
Jackson & Coker Dr. Michelle GardnerClinical Director
Contract not utilized during timeframe.
Liberty Healthcare Physicians and/orMid-Levels On Call
Dr. Michelle GardnerClinical Director
All indicators met standards.
Liberty Healthcare Psychiatric Nurse Practitioner
Dr. Michelle GardnerClinical Director
All indicators met standards.
Locum Tenens Psychiatry Dr. Michelle GardnerClinical Director
Contract not utilized during timeframe.
Page 31

JOINT COMMISSION
4Q2016 Results, continued.Contractor Program Administrator Summary of PerformanceMD-IT Transcription Michelle Welch
Medical Records Administrator
All indicators met standards.
Northeast Cardiology Associates (NECA)
Dr. Michelle GardnerClinical Director
All indicators met standards.
Norris, Inc. Herbert GibsonDirector of Facilities
All indicators met standards.
Otis Elevator Herbert GibsonDirector of Facilities
All indicators met standards.
Penobscot CommunityHealth Care
Dr. Michelle GardnerClinical Director
Indicator met standard.
Project Staffing Carol DavisBusiness Manager
All indicators met or exceeded standards.
Securitas Herbert GibsonDirector of Facilities
All indicators met standards.
UniFirst Herbert GibsonDirector of Facilities
All indicators met standards.
Vista Staffing Dr. Michelle GardnerClinical Director
Contract not utilized during timeframe.
WBRC Architects Engineers Herbert GibsonDirector of Facilities
All Indicators met standards.
Worldwide Travel Staffing Janet BabcockDirector of Nursing
All indicators met standards.
Page 32
JOINT COMMISSION
Medication ManagementMedication Errors and Adverse Reactions
TJC PI.01.01.01 EP14: The hospital collects data on the following: Significant medication errors. (See also LD.04.04.01, EP 2; MM.08.01.01, EP 1)
TJC PI.01.01.01 EP15: The hospital collects data on the following: Significant adverse drug reactions. (See also LD.04.04.01, EP 2; MM.08.01.01, EP 1)
Number of medication error events that occurred for every 100 episodes of care (duplicated patient count). For example, a rate of 1.6 means that 2 medication error events occurred for each 125 episodes of care.
Page 33

JOINT COMMISSION
Medication errors are classified according to four major areas related to the area of service delivery. The error must have resulted in some form of variance in the desired treatment or outcome of care. A variance in treatment may involve one incident but multiple medications; each medication variance is counted separately irrespective of whether it involves one error event or many. Medication error classifications include:
Prescribing : An error of prescribing occurs when there is an incorrect selection of drug, drug dose, dosage form, quantity, route, concentration, rate of administration, or instructions for use of a drug product ordered or authorized by physician or other legitimate prescriber. Errors may occur due to improper evaluation of indications, contraindications, known allergies, existing drug therapy and other factors. Illegible prescriptions or medication orders that lead to patient level errors are also defined as errors of prescribing in identifying and ordering the appropriate medication to be used in the care of the patient.
Dispensing: An error of dispensing occurs when the incorrect drug, drug dose or concentration, dosage form, or quantity is formulated and delivered for use to the point of intended use.
Administration : An error of administration occurs when there is an incorrect selection and administration of drug, drug dose, dosage form, quantity, route, concentration, rate of administration, or instructions for use of a drug product ordered or authorized by physician or other legitimate prescriber.
Complex : An error which resulted from two or more distinct errors of different types is classified as a complex error.
Page 34

JOINT COMMISSION
Medication Dispensing Process Michael Migliore, RPh
Measure UnitBaseline 4Q2015 Goal 1Q2016
2Q2016 3Q2016 4Q2016
Controlled Substance Loss Data:Daily Pyxis-CII Safe Compare Report.
All 0.175%
0%Target:Actual:
0%0%
0%0%
0%0%
0%0%
Monthly CII Safe Vendor Receipt Report.
Rx0
0Target:Actual:
00
00
00
00
Monthly Pyxis Unresolved Controlled Drug Discrepancies.
All5.7/
month
0Target:Actual:
00
00
00
0 01
Medication Management Monitoring:Measures of drug reactions, adverse drug events and other management data.
Rx1.25 Actual: 0 0 0 2
Resource Documentation Reports of Clinical Interventions.
Rx60 Actual: 68 103 5862 8312
1. DDPC has not had any unresolved controlled substance discrepancies that have been due to any other cause than miscounts. All controlled substances have been accounted for. To see this quarter’s discrepancies refer to the discrepancy report later in pharmacy’s section.
2. The interim Staff Pharmacist was replaced by a PharmD in mid-January 2016. Since coming to DDPC, the new PharmD has collaborated with the rest of the pharmacy team and some other disciplines to enhance current monitoring programs and initiate several others, as well enhance the data collection process. These changes account for the drastic increase in clinical interventions.
Page 35

JOINT COMMISSION
Consumer Surveys
TJC PI.01.01.01 EP16: The hospital collects data on the following: Patient perception of the safety and quality of care, treatment, and services.
In order to gain a perspective on the quality of care provided to our patients from the patient’s perspective, Dorothea Dix Psychiatric Center conducts two patient surveys; the Care Transition Measures Survey and the Inpatient Customer Survey.
Care Transition Measures Survey
The Care Transition Measures Survey (CTM-3) is a three question survey that is designed to ascertain the degree of patient understanding of and satisfaction with the discharge planning and preparation process. Dorothea Dix conducts a telephone poll of discharged patients approximate one to two weeks after discharge. This provides an opportunity to make a connection with the patients as they transition into the community setting and, on occasion, has provided the discharged patient with a support mechanism or safety net on those few occasions when they are having difficulties with the discharge transition and are potentially de-stabilizing.
The Care Transition Measure Survey questions are as follows:1. The hospital staff took my preference and those of my family or caregiver into account
in deciding what my health care needs would be when I left the hospital.2. When I left the hospital, I had a good understanding of the things I was responsible for
in managing my health.3. When I left the hospital, I clearly understood the purpose for taking each of my
medications.
All questions are answered on a four part Likert scale; 1) strongly disagree, 2) disagree, 3) agree, and 4) strongly agree. Patients that answer “I don’t’ know” or “I don’t remember” are designated with a “99” score and are considered neutral responses and are not included in the results calculations.
CTM-3 Survey Response Rate:
April May June 4Q2016Number of Patients Discharged 14 9 11 34Number of Survey Responses 2 3 4 9Survey Response Rate 14% 33% 36% 26%
Page 36

JOINT COMMISSION
CTM-3 Percent of Positive (agree or strongly agree):
April May June 4Q2016The hospital staff took my preference and those of my family or caregiver into account in deciding what my health care needs would be when I left the hospital.
100%2/2
33%1/3
100%3/4
67%6/9
When I left the hospital, I had a good understanding of the things I was responsible for in managing my health.
100%2/2
100%3/3
100%3/4
89%8/9
When I left the hospital, I clearly understood the purpose for taking each of my medications.
100%2/2
67%2/3
75%3/4
78%7/9
Page 37

JOINT COMMISSION
Inpatient Consumer Survey
The Inpatient Customer Survey (ICS) is a standardized national survey of customer satisfaction. The National Association of State Mental Health Program Directors Research Institute (NRI) collects data from state psychiatric hospitals throughout the country in an effort to compare the results of patient satisfaction in six areas or domains of focus. These domains include Outcomes, Dignity, Rights, Participation, Environment, and Empowerment.
NRI Inpatient Consumer Survey (ICS) Response Rate:
April May June 4Q2016Number of patients discharged 14 9 11 34Number of survey responses 4 3 6 13Survey response rate 29% 33% 55% 38%
Surveys are distributed to all patients prior to discharge and when returned are tabulated in a database created for the purpose of collecting and uploading the data elements to NRI. On a monthly basis, the data is uploaded to NRI and aggregated with the results of the Riverview Psychiatric Center and other state psychiatric hospitals throughout the country. Reports on the percent of positive responses are returned along with aggregated comparative data from participating hospitals.
Data on the return rate of the survey administered to Dorothea Dix patients and the results of the comparative analysis follows. When the results are blank for a month on the following graphs, it means that no surveys were completed during that month.
Page 38

JOINT COMMISSION
Outcome Domain
1. I am better able to deal with crisis.2. My symptoms are not bothering me as much.3. I do better in social situations.4. I deal more effectively with daily problems.
Page 39

JOINT COMMISSION
Dignity Domain
1. I was treated with dignity and respect.2. Staff here believed that I could grow, change and recover.3. I felt comfortable asking questions about my treatment and medications.4. I was encouraged to use self-help/support groups.
Page 40

JOINT COMMISSION
Rights Domain
1. I felt free to complain without fear of retaliation.2. I felt safe to refuse medication or treatment during my hospital stay.3. My complaints and grievances were addressed.
Page 41

JOINT COMMISSION
Participation Domain
1. I participated in planning my discharge.2. Both I and my doctor, or therapist from the community, were actively involved in my
hospital treatment plan.3. I had an opportunity to talk with my doctor or therapist from the community prior to
discharge.
Page 42

JOINT COMMISSION
Environment Domain
1. The surroundings and atmosphere at the hospital helped me get better.2. I felt I had enough privacy in the hospital.3. I felt safe while I was in the hospital.4. The hospital environment was clean and comfortable.
Page 43

JOINT COMMISSION
Empowerment Domain
1. I had a choice of treatment options.2. My contact with my doctor was helpful.3. My contact with nurses and therapists was helpful.
Page 44

JOINT COMMISSION
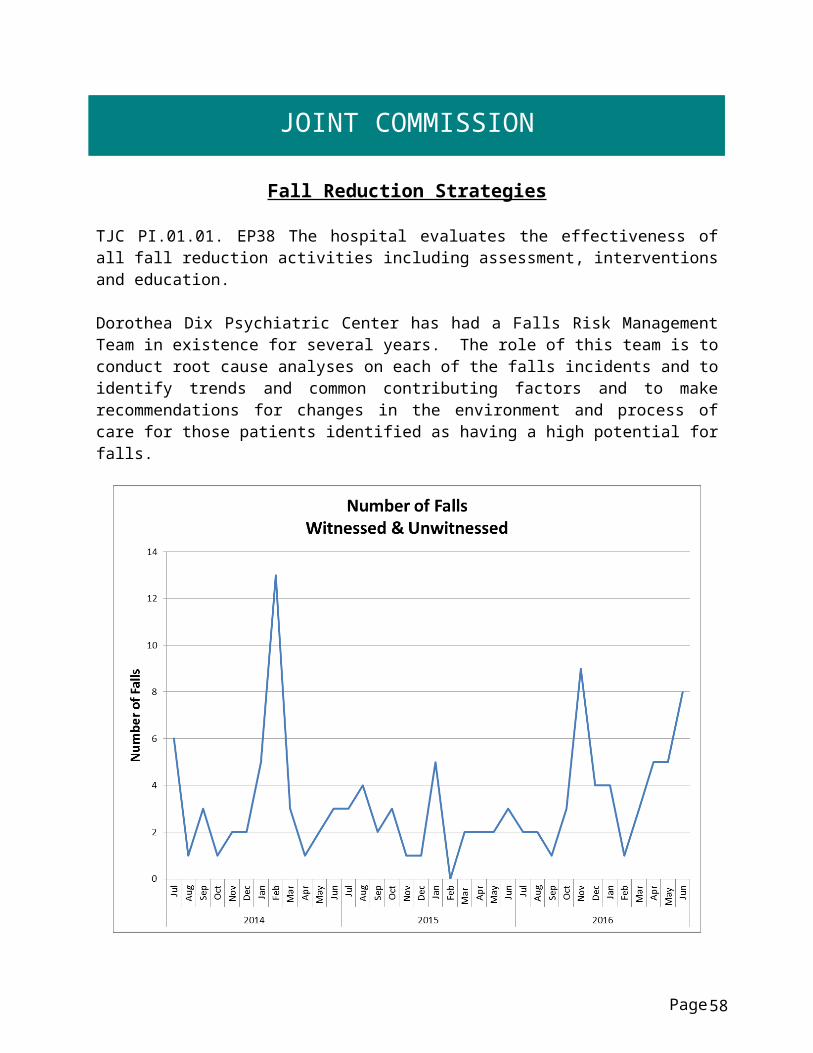
Fall Reduction Strategies
TJC PI.01.01. EP38 The hospital evaluates the effectiveness of all fall reduction activities including assessment, interventions and education.
Dorothea Dix Psychiatric Center has had a Falls Risk Management Team in existence for several years. The role of this team is to conduct root cause analyses on each of the falls incidents and to identify trends and common contributing factors and to make recommendations for changes in the environment and process of care for those patients identified as having a high potential for falls.
Page 45

JOINT COMMISSION
Fall Reduction Nursing Interventions Janet Babcock, RN
I. Measure Name: Patient Falls - Establishing a Culture of SafetyMeasure Description: Up to 50% of hospitalized patients are at risk for falls, and almost half of those who fall suffer an injury (American Nurse Today, Special Supplement to American Nurse Today - Best Practices for Falls Reduction: A Practical Guide. Multiple authors, March 2011, 6. No 2). The objective of Nursing’s Fall Performance Improvement measure is to ensure compliance with Nursing Procedure F-10 with the overall objective of ensuring that information is gathered about each patient for problem identification in order to ensure health and safety needs are met.Type of Measure: Performance Improvement
All patient falls in
3Q2016
Falls risk assessment completed
Falls Progress Note 565
completed and in patient’s medical
record
Falls risk score of 6 or higher: problem 6.1
initiated(164 A & B)
Falls riskscore
documented on kardex and in front of chart
18(All not met definition)
Yes: 15No: 3
Yes: 17No: 1
Yes: 15No: 3
Yes: 13No: 5
Overall Compliance 83% 94% 83% 72% 83%
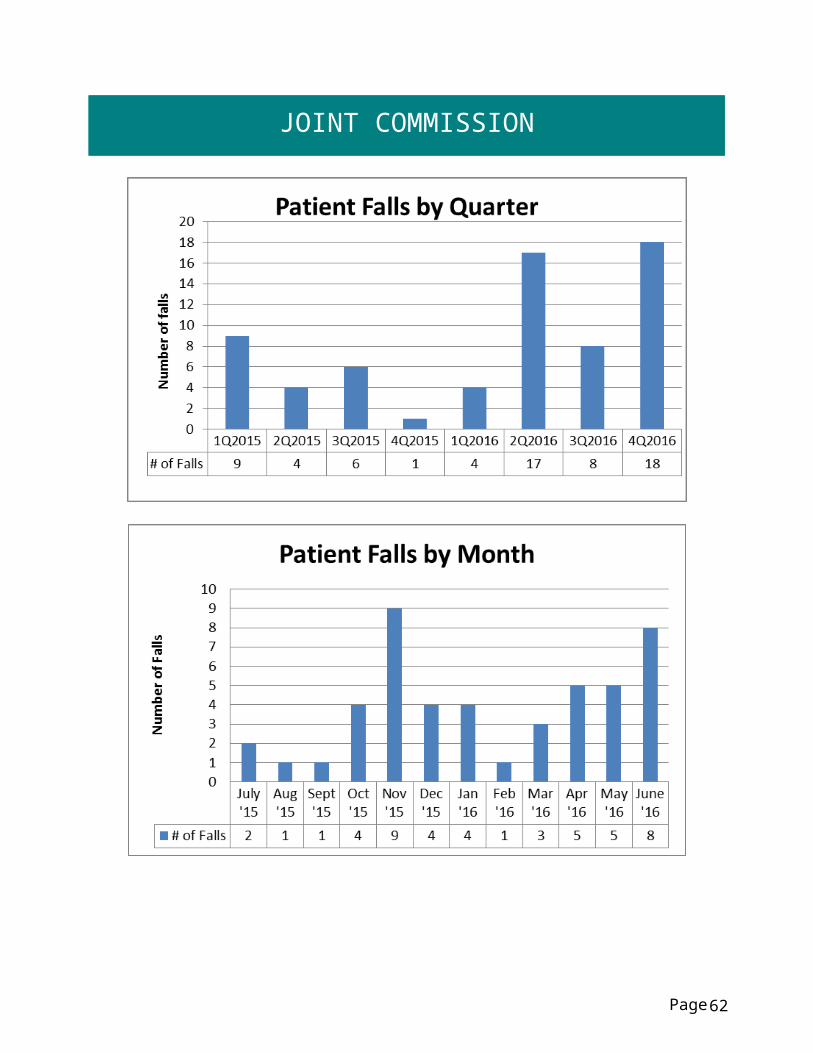
Data Analysis: There were 18 falls in the 4th quarter with all meeting the definition. April had 5 falls with a compliance rate of 95%, May had 5 falls with a compliance rate of 60%, and June had 8 falls with a compliance rate of 91%. Overall compliance for the 4thquarter is 83%. This is an increase of 18% over 3rd quarter. Although the number of falls increased, compliance with procedure also increased.
Action Plan: Auditing Nurse Supervisor provides education to staff during auditing process. Nursing administration will continue to follow up and audit all falls.
Page 46

JOINT COMMISSION
Page 47

JOINT COMMISSION
Page 48

JOINT COMMISSION
Pain Assessment
Elements of Performance for Joint Commission Standard PC.01.02.07
1. The hospital conducts a comprehensive pain assessment that is consistent with its scope of care, treatment, and services and the patient’s condition. (See also PC.01.02.01, EP 2; RI.01.01.01, EP 8)2. The hospital uses methods to assess pain that are consistent with the patient’s age, condition, and ability to understand.3. The hospital reassesses and responds to the patient’s pain, based on its reassessment criteria.4. The hospital either treats the patient’s pain or refers the patient for treatment. Source: The Joint Commission: The Source. The fifth “vital sign” complying with pain management standard PC. 01.02.07. November 2011, Vol 9. Issue 11.
Pain Re-Assessment Audit Form Janet Babcock, RN
Pain Assessment (Patient Recovery)Pain is common. About 9 in 10 Americans regularly suffer from pain, and pain is the most common reason individuals seek health care. Each year, an estimated 25 million Americans experience acute pain due to injury or surgery and another 50 million suffer chronic pain (Berry. P., Chapman. C., Covington. E., Dahl. J., Katz. J., Miaskowski. C., Mc Lean. M., 2001. Pain: Current understanding of assessment, Management, and treatment).
Pain is often undertreated, with recent studies, reports, and a position statement suggesting that many types of pain (e.g., postoperative pain, cancer pain, chronic non-cancer pain) and patient populations (e.g., elderly patients, children, minorities, substance abusers) are undertreated. Data from a 1999 survey suggest that only 1 in 4 individuals with pain receive appropriate therapy (Berry. P., Chapman. C., Covington. E., Dahl. J., Katz. J., Miaskowski. C., Mc Lean. M., 2001. Pain: Current understanding of assessment, Management, and treatment).
Untreated pain impairs an individual’s ability to carry out their activities of daily living diminishing their quality of life; it can cause anxiety, fear, anger, or depression. Nursing acknowledges the impact of untreated pain on patient recovery and for this reason the objective of Nursing’s Pain PI is to ensure patients are being assessed for pain and re-assessed if required.
Page 49

JOINT COMMISSION
I. Measure Name: Pain Reassessment Audit - Patient RecoveryMeasure Description: Untreated pain impairs an individual’s ability to carry out their activities of daily living diminishing his or her quality of life; it can cause anxiety, fear, anger, or depression. Nursing acknowledges the impact of untreated pain on patient recovery and for this reason the objective of Nursing’s Pain PI is to ensure patients are being assessed for pain and re-assessed if required. Type of Measure: Performance Improvement
Results
Target Data elementsBaselineJan/Feb
2013
1Q2016
2Q201
6
3Q201
6
4Q 2016 YTD
100% Compliance
Number of audits performed 89 93 121 107 97 427
Number of patients with pain reported on Form 838
29 46 65 56 60 224
Number of reassessments completed
11 33 45 46 46 165
Number of reassessments reported within clinically appropriate timeframe(1-2 hours after oral medication and within 1 hour of intramuscular injection)
11 33 45 46 46 165
Compliance with reassessment 38% 72% 69% 82% 77% 74%
Compliance with reassessment timeframe
38% 72% 69% 82% 77% 74%
Data Analysis: All MARs are reviewed for the month for pain reported and corresponding reassessment; the information is located on form #838 ‘Pain Flow Sheet’. The information is documented on the ‘Pain Assessment and Re-assessment Audit Form’ for monthly, quarterly, and yearly calculation. Audits were initiated in January 2013. January and February 2013 comprise the baseline data of 38%. 4th Quarter shows a 5% decrease from 3rd with 77% but
Page 50

JOINT COMMISSION
continues the upward trending from the 38% of baseline. FY2016 sees a total average for both elements of 75%.
Action Plan: Nursing remains below the goal of 100% compliance. Nursing Administration continues to address this issue and will reinforce with the Clinical Nurse Managers to ensure that Pain Re-Assessments are being completed for each documented report of pain and within the clinically appropriate timeframe. Clinical Nurse Managers will address staff members that are not completing these assessments.
Page 51

JOINT COMMISSION
II. Measure Name: Pain Audit Shift Assessment - Patient RecoveryMeasure Description: Untreated pain impairs an individual’s ability to carry out their activities of daily living diminishing his or her quality of life; it can cause anxiety, fear, anger, or depression. Nursing acknowledges the impact of untreated pain on patient recovery and for this reason the objective of Nursing’s Pain PI is to ensure patients are being assessed for pain and re-assessed if required. Type of Measure: Performance Improvement
Results
Target Data elementsBaselineJan/Feb
2013
1Q201
6
2Q201
6
3Q201
6
4Q 201
6YTD
100% Compliance
Number of audits completed 36 93 103 99 90 385
Number of audits having 2 shift assessments completed that assesses for the presence and intensity of pain within 24 hours
12 46 48 61 65 220
Overall Compliance 33% 49% 47% 62% 72% 57%
Data Analysis: All Medication Administration Records (MARs) for each unit will be audited for a 24 hour period. Form #841 ‘Daily Shift Assessment for the Presence of Pain’ is used at least once every 12 hours to assess each patient for the presence and intensity of pain. The form is audited to ensure there are 2 pain assessments completed each 24 hour period. Audits were initiated in January 2013. January and February 2013 comprise the baseline data of 33%. 4th
Quarter shows a 10% increase from 3rd Quarter and a significant 39% increase from baseline. FY2016 shows an average of 57% for the four quarters.
The increases are most likely attributed to the addition of a checkbox on each patient’s MAR for nursing reminder to complete the pain assessment documentation. This was instituted January 1st 2016 by a joint decision of Nursing Administration and Pharmacy to increase compliance with documentation requirements.
Page 52

JOINT COMMISSION
Action Plan: Nursing remains below the goal of 100% compliance but sees a marked increase the last two quarters. Nursing Administration continues to address this issue and will reinforce with the Clinical Nurse Managers to ensure that pain is being assessed at least every 12 hours for every patient. Clinical Nurse Managers will address staff members that are not completing these assessments.
Page 53

STRATEGIC PERFORMANCE EXCELLENCE
Process Improvement PlansPriority Focus Areas for Strategic Performance Excellence
In an effort to ensure that quality management methods used within the Maine Psychiatric Hospitals System are consistent with modern approaches of systems engineering, culture transformation, and process focused improvement strategies and in response to the evolution of Joint Commission methods to a more modern systems-based approach instead of compliance-based approach
Building a framework for patient recovery by ensuring fiscal accountability and a culture of organizational safety through the promotion of…
The conviction that staff members are concerned with doing the right thing in support of patient rights and recovery;
A philosophy that promotes an understanding that errors most often occur as a result of deficiencies in system design or deployment;
Systems and processes that strive to evaluate and mitigate risks and identify the root cause of operational deficits or deficiencies without erroneously assigning blame to system stakeholders;
The practice of engaging staff members and patients in the planning and implementing of organizational policy and protocol as a critical step in the development of a system that fulfills ethical and regulatory requirements while maintaining a practicable workflow;
A cycle of improvement that aligns organizational performance objectives with key success factors determined by stakeholder defined strategic imperatives;
Enhanced communications and collaborative relationships within and between cross-functional work teams to support organizational change and effective process improvement;
Page 54

STRATEGIC PERFORMANCE EXCELLENCE
Transitions of care practices where knowledge is freely shared to improve the safety of patients before, during, and after care;
A just culture that supports the emotional and physical needs of staff members, patients, and family members that are impacted by serious, acute, and cumulative events.
Strategic Performance Excellence Model Reporting Process
Department of Health and Human Services Goals
Protect and enhance the health and well-being of Maine people.Promote independence and self-sufficiency.
Protect and care for those who are unable to care for themselves.Provide effective stewardship for the resources entrusted to the Department.
Dorothea Dix and Riverview Psychiatric CentersPriority Focus Areas
Ensure and Promote Fiscal Accountability by…Identifying and employing efficiency in operations and clinical practice.
Promoting vigilance and accountability in fiscal decision-making.
Promote a Safety Culture by…Improving communication.
Improving staffing capacity and capability.Evaluating and mitigating errors and risk factors.
Promoting critical thinking.Supporting the engagement and empowerment of staff members.
Enhance Patient Recovery by…Develop active treatment programs and options for patients.
Supporting patients in their discovery of personal coping and improvement activities.
Page 55

STRATEGIC PERFORMANCE EXCELLENCE
Each department determines unique opportunities and methods to address the hospital goals.
The Quarterly Report consists of the following:
Page
DEFINE
Opportunities for Improvement (OFIs)
MEASURE
IMPROVE
Current Work Flow Process
Identify RootCauses ofPerformance Gaps
ANALYZE
CONTROL
Current Performance Gaps
Work Process Plans and Procedures
Implement the Planned Changes
Establish Incremental Goals & Measures
Validate Improvements Achieved
Develop Systems to Sustain Improvements
Current Performance
Opportunities for Improvement (OFI’s)
Performance Objectives
56

STRATEGIC PERFORMANCE EXCELLENCE
Dietary Bobbie Lindsey
I. Measure Name: ServSafe TrainingMeasure Description: ServSafe is a food and beverage safety training and certificate program administered by the National Restaurant Association Type of Measure: Quality Assurance
Results
TargetBaseline 1Q2016 2Q2016 3Q2016 4Q2016 YTD
100% 100% 100% 100% 100% 100%
Actual 70%1Q2016
70%31/44
71%30/42
76%32/42
86%86/100
79%179/228
Data Analysis: The data indicates that although we fell short of our goal of 100% certification by 14%, we saw in increase of 10% over the previous quarter.
Action Plan: Set up a class to complete all certifications for both those who are not certified and for those who have certificates that are going to expire soon. I would like to include other staff members in the hospital that handle food for patients.
Comments: A ServSafe class was held May 11, 2016. All uncertified dietary staff members attended and were certified. Our rate for May was 100%.
Page 57
STRATEGIC PERFORMANCE EXCELLENCE
Health Information Management Michelle Welch, RHIT
Regulatory and Compliance Standards in DocumentationEnsuring Fiscal Responsibility in Documentation and Billing Practices
Indicator and Rationale for Selection 1Q2016 2Q2016 3Q2016 4Q2016 YTDIdentification Data 100%
35/35100%34/34
100%33/33
100%34/34
100%136/136
Medical History, including chief complaint; HPI; past, social & family hx., ROS, and physical exam w/in 24 hrs., conclusion and plan.
100%35/35
100%34/34
100%33/33
100%34/34
100%136/136
Summary of patient’s psychosocial needs as appropriate to the patients *
86%30/35
85%29/34
97%32/33
97%33/34
91%124/136
Psychiatric Evaluation in patient’s record w/in 24 hrs. of admission
100%35/35
97%33/34
100%33/33
97%33/34
99%134/136
Physician (TO/VO w/in 72 hrs.)86%
30/3579%
27/34
63%20/3212>721 N/A
74%25/349>72
76%102/135
Evidence of appropriate informed consent
100%30/30
5 declined
100%34/34
93%25/27
4 declined2 missing
96%26/277 N/A
1 missing
97%115/118
Clinical observations including the results of therapy.
100%35/35
100%34/34
100%33/33
100%34/34
100%136/136
Nursing discharge Progress Note with time of discharge departure
100%35/35
100%32/32
100%33/33
100%34/34
100%134/134
Consultation reports, when applicable93%
14/1593%
13/14
92%11/1220 N/A
1 missing
100%10/1024 N/A
94%48/51
Final Diagnosis(es) DSM-Principal DiagnosisMeasure discontinued 10/1/2015
100%35/35 N/A N/A N/A 100%
35/35
Page 58

STRATEGIC PERFORMANCE EXCELLENCE
Indicator and Rationale for Selection 1Q2016 2Q2016 3Q2016 4Q2016 YTDResults of autopsy, when performed N/A N/A N/A N/A N/AAdvance Directive Status on admission and SW follow up after 97%
34/35100%34/34
94%31/33
2 missing
97%33/34
97%132/136
Notice of Privacy 94%33/35
94%32/34
88%29/33
100%34/34
94%128/136
Chart Completion w/in 30 days of discharge date/discharge summary completed within 30 days
94%33/35
97%33/34
100%33/33
88%30/34
95%129/136
Discharge Packet sent to follow up provider within 5 days of discharge. 94%
33/3597%
33/34
100%32/321 AMA
100%34/34
98%132/135
*The parameters for this measure will be changed to meet applicable goals as defined by Director of Social Work. The current measure is more stringent than regulatory standards dictate.
Page 59

STRATEGIC PERFORMANCE EXCELLENCE
Human Resources Tamra Hanson
I. Measure Name: Employee work-related injuries (treatment related) and incidents (no treatment).Measure Description: Staff safety is central to DDPC. While staff safety events may not be completely eliminated, events can be reduced by reviewing trends related to injuries.
Type of Measure: Performance Improvement
Results
Target
Baseline 1Q2016 2Q2016 3Q2016 4Q2016 YTD
Established 1Q2016
TBD TBD TBD TBD TBD
Actual # of Staff Injuries
10 7 10 12 40
Actual # of Staff
Incidents14 17 28 6 65
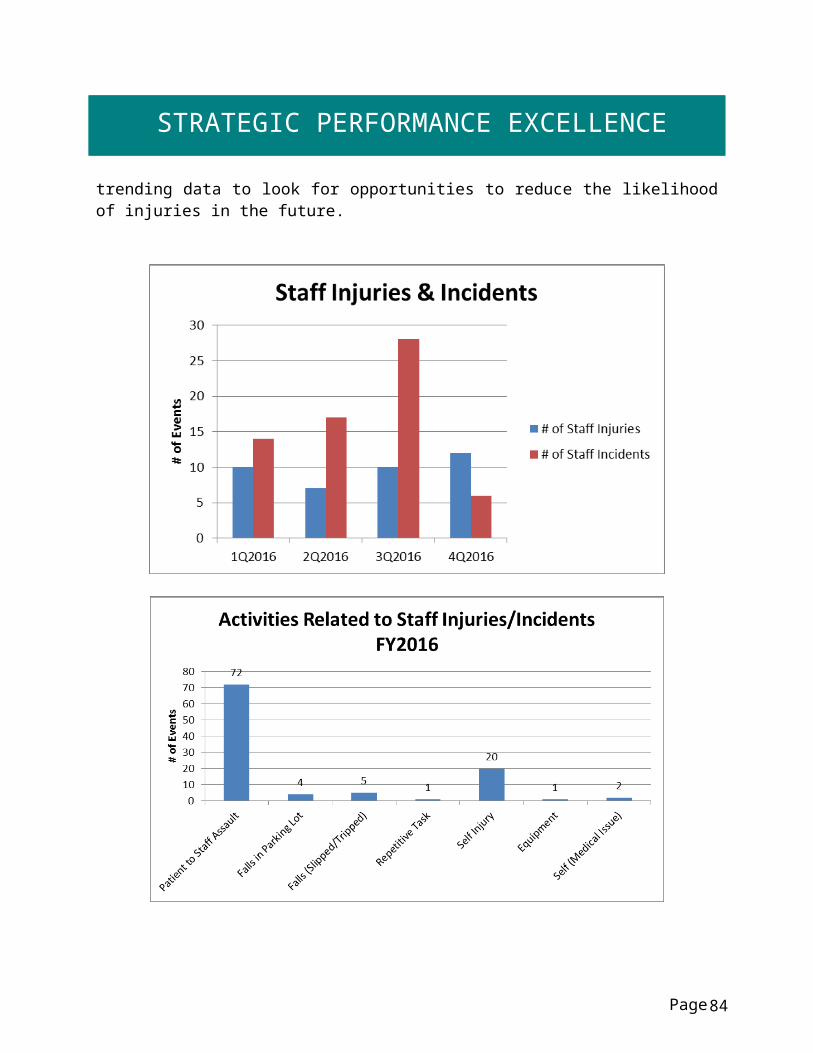
Data Analysis: In the 4th quarter, DDPC had 12 staff injuries and 6 staff incidents; 15 were patient related, 1 fall/trip, 1 self-injury, and 1 medical related. Total for FY2016 was 105, 40 injuries and 65 incidents
Action Plan: A baseline has been established. We will start reporting at IPEQ to inform leadership of staff safety events and trending data to look for opportunities to reduce the likelihood of injuries in the future.
Page 60

STRATEGIC PERFORMANCE EXCELLENCE
Page 61
STRATEGIC PERFORMANCE EXCELLENCE
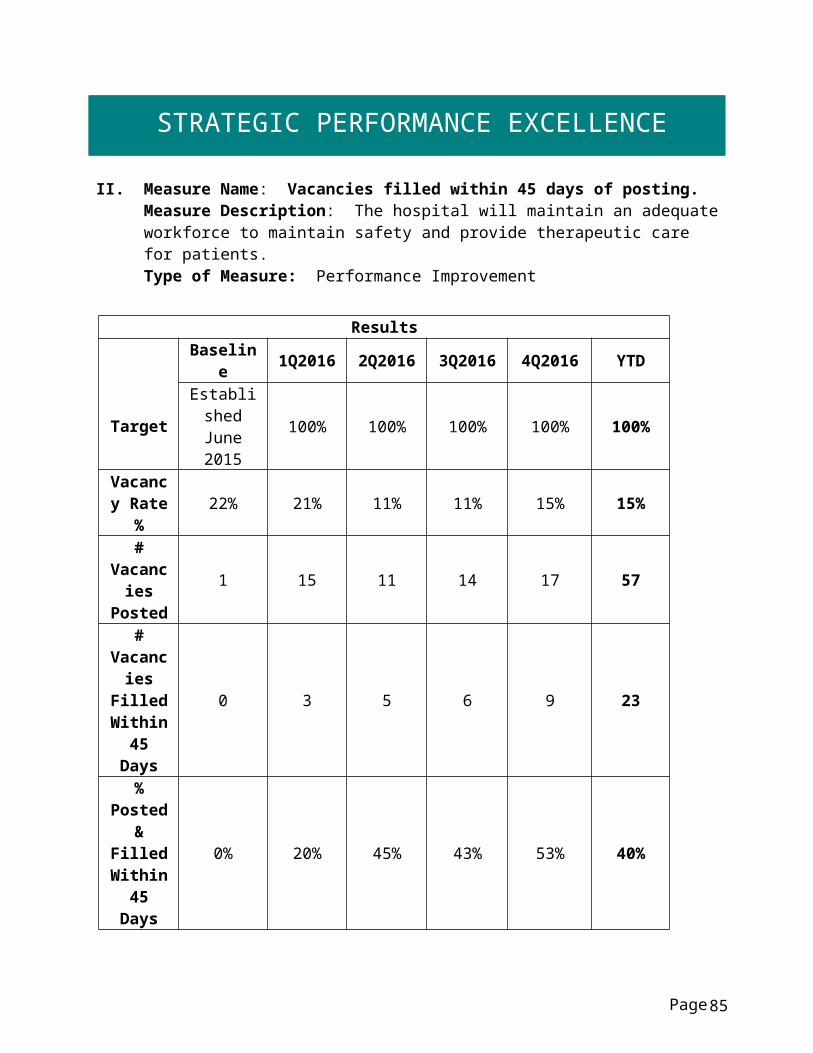
II. Measure Name: Vacancies filled within 45 days of posting.Measure Description: The hospital will maintain an adequate workforce to maintain safety and provide therapeutic care for patients. Type of Measure: Performance Improvement
Results
Target
Baseline 1Q2016 2Q2016 3Q2016 4Q2016 YTDEstablished June 2015 100% 100% 100% 100% 100%
Vacancy Rate % 22% 21% 11% 11% 15% 15%
# Vacancies
Posted1 15 11 14 17 57
# Vacancies
Filled Within 45
Days
0 3 5 6 9 23
% Posted & Filled
Within 45 Days
0% 20% 45% 43% 53% 40%
Data Analysis: Increase percentage rate of filled quarterly posted vacancies within 45 days of posting.
Action Plan: This is new data collection in an effort to reduce extended time periods of vacant positions
Note: One vacancy is in process of being reclassified but would be included in the vacancy rate
percentage. New Employee Orientation will be held twice per month instead of once per month
starting in February 2016, in order that new employees do not have to wait an extended period of time for an orientation date and so that they can start work more quickly.
Page 62

STRATEGIC PERFORMANCE EXCELLENCE
Page 63
STRATEGIC PERFORMANCE EXCELLENCE
III. Measure Name: Performance Evaluations completed by due date.Measure Description: DDPC evaluates staff based on performance expectations that reflect their job responsibilities. This evaluation is documented in the HR Personnel File by is due date. Type of Measure: Performance Improvement
Results
Target
Baseline 1Q2016 2Q2016 3Q2016 4Q2016 YTDEstablished June 2015 100% 100% 100% 100% 100%
# Due 14 41 42 33 59 175
# Completed
on Time3 11 12 21 22 66
% Completed
on Time21% 27% 29% 64% 37% 38%
Data Analysis: In the 4th quarter we had 37% of performance evaluations submitted by the due date. This is a 27% decrease from 3rd quarter. We are below the target of 100%.
Action Plan: This is new data collection. We will start reporting at IPEC so that managers are aware of the data. This will hopefully continue increasing our compliance rates.
Page 64

STRATEGIC PERFORMANCE EXCELLENCE
Page 65

STRATEGIC PERFORMANCE EXCELLENCE
Infection Control Heather Brock, RN
I. Measure Name: Hospital Acquired InfectionsMeasure Description: Surveillance data will continue to be gathered on the following hospital acquired infections: UTI, URI, LRI, and Skin. Data will be reviewed monthly and reported quarterly.Type of Measure: Quality Assurance
ResultsUnit Baseline 1Q2016 2Q2016 3Q2016 4Q2016 YTD
Target: 0 HAI
# of HAI per quarter
FY 20120 HAI 0 HAI 0 HAI 1HAI 0HAI 1 HAI
Data Analysis: There were no hospital acquired infections for 4th quarter, and 1 hospital acquired infection for FY2016.
FY
2014-2016 Hospital Acquired Infections
Type of Infectio
n
1Q201
4
1Q 201
5
1Q201
6
2Q201
4
2Q 201
5
2Q201
6
3Q201
4
3Q 201
5
3Q201
6
4Q201
4
4Q 201
5
4Q201
6UTI 0 0 0 0 0 0 0 0 0 0 0 0URI 0 0 0 0 0 0 0 0 0 0 0 0LRI 0 0 0 0 0 0 0 0 0 0 0 0Skin 0 0 0 0 0 0 0 0 1 0 0 0Totals 0 0 0 0 0 0 0 0 1 0 0 0Infection Rate 0 0 0 0 0 0 0 0 0.28 0 0 0
Page
H. A. Infections FY 2014 FY 2015 FY 20161st Quarter H.A.I. Rate 0 0 02nd Quarter H.A.I. Rate 0 0 03rd Quarter H.A.I. Rate 0 0 14th Quarter H.A.I. Rate 0 0 0Average H.A. Infection Rate 0 0 0.25
66

STRATEGIC PERFORMANCE EXCELLENCE
Infection Rate per 1000 patient days: Total number of infections per unit x 1000 = % Total number of inpatient days
1st Quarter 2014 = 3712 1st Quarter 2015 = 3256 1st Quarter 2016 = 33612nd Quarter 2014 = 3659 2nd Quarter 2015 = 3550 2nd Quarter 2016 = 3508
3rd Quarter 2014 = 3557 3rd Quarter 2015 = 3453 3rd Quarter 2016 = 35874th Quarter 2014 = 3397 4th Quarter 2015 = 3422 4th Quarter 2016 =3584
II. Measure Name: Patient & Family Education on Hand Hygiene/Cough EtiquetteMeasure Description: Prior to discharge, a questionnaire will be distributed to each patient that includes the following questions:
D1: I received information on how to stay healthy by washing my hands
D2: I received information on how to cover my cough or sneeze to prevent the spread of illness
Type of Measure: Performance Improvement
ResultsUnit Baseline 1Q2016 2Q2016 3Q2016 4Q2016 YTD
Target:D1 80%
Quarterly response rate
“agree/strongly agree” for D1 &
D2 is set at 80%
2012: D1 response rate: 80%
82% 89% 100% 92% 91%
Target:D2 80%
2012: D2 response rate: 80%
82% 89% 100% 83% 89%
Data Analysis: 4th quarter response rate for question D1 was 92%, a decrease of 8% from the previous quarter. 4th quarter response rate for question D2 was 83%, a decrease of 17% from the previous quarter.
Action Plan: Will consider increasing goal as the goal of 80% compliance rate for BY2016 has been met.
Page 67

STRATEGIC PERFORMANCE EXCELLENCE
Page 68

STRATEGIC PERFORMANCE EXCELLENCE
III. Measure Name: Patient Hand HygieneMeasure Description: Patient hand hygiene is being monitored during at least four meal times per unit per month, with a minimum of 10 “direct patient observations” per unit. This is currently the “gold star” and the most reliable method for assessing adherence rates.Type of Measure: Performance Improvement
ResultsUnit Baseline
4Q2014 1Q2016 2Q2016 3Q2016 4Q2016 YTD
Target: sustained level of compliance that approaches 90%
Patient hand hygiene
compliance during 4 meal times per unit
per month
Knox:35% 79% 86% 84% N/A N/A
Hamlin:44% 79% 70% 69% N/A N/A
Chamberlain: 36% 51% 44% 53% N/A N/A
Data Analysis: As of May 2016, DDPC will return to monitoring healthcare workers’ hand hygiene compliance in order to be aligned with the current CDC hand hygiene guidelines.
Page 69

STRATEGIC PERFORMANCE EXCELLENCE
Action Plan: Initiate healthcare workers’ hand hygiene observations both before and after patient contact, during medication administration, and at any other opportunity on the unit.
IV. Measure Name: Influenza ImmunizationsMeasure Description: The standard goal is to have a sustained level of compliance that approaches and achieves the 90% compliance rate established in the National Flu Initiative for 2020. Employee flu vaccination compliance is measured annually.Type of Measure: Performance Improvement
ResultsUnit Baseline FY 2016 FY 2017 FY 2018 FY 2019 FY 2020
Target: 90%
Percent of employees
who receive the flu
vaccination
FY 201581%
69%
Data Analysis: Employee flu vaccination compliance rate for FY2016 was 69%. This is a decrease from 81% for FY2015.
Action Plan: Continue to educate staff and promote influenza vaccinations.
Comments: Last year’s flu vaccine was not a good match so staff had less confidence in it this year.
Page 70

STRATEGIC PERFORMANCE EXCELLENCE
Medical Staff Dr. Michelle Gardner
I. Measure Name: Restraint DocumentationMeasure Description: Proper documentation is the only way to demonstrate and provide a record that the clinical criteria and assessments for seclusion/restraint have been met. Documentation is critical for patient care/safety, as it validates the care that was provided.Type of Measure: Performance Improvement
Target 1Q 2Q 3Q 4Q
2016 2016 2016 2016
Total Restraints 12 39 28 39 35 141Is order complete? N/A N/A 99% 94% 85% 93%On order, is the intervention stated in behavioral terms?
100% 81% 98% 85% 91% 89%
100%Does the time of the orders match interventions and times on Nursing forms?
N/A N/A 95% 91% 98% 95%
Is Medical Staff Seclusion and Restraint Progress Note complete (both sides)?
100% 78% 98% 85% 75% 84%
Is the time of the 1 hour face to face within an hour of the event?
100% 96% 91% 88% 100% 94%
If PA, did PA consult with attending? 100% 96% 79% 70% 100% 86%Are the details of the event similar on all forms?
100% 100% 99% 92% 97% 97%
Did the medical provider participate in the Seclusion and Restraint treatment plan review?
N/A N/A 75% 69% 99% 81%
Overall Compliance 100% 90% 92% 84% 93% 90%
Results
Restraints YTD 2016
Baseline (March 2015)
Page 71

STRATEGIC PERFORMANCE EXCELLENCE
Goal 100% Compliance with Medical Staff Documentation
A new audit tool was implemented in October 2015. Audit questions: Is the order completed? Did the medical provider participate in S&R treatment plan review? Does the time on the orders match interventions and times on the nursing forms? These were not questions on the audit tool prior to 2Q2016.
Page 72

STRATEGIC PERFORMANCE EXCELLENCE
Data Analysis: There were 35 restraints in the 4th quarter. All data elements for the 4 th
quarter have increased except or two elements: Is the order complete? and, Is the medical staff’s S&R progress note complete. Overall, the compliance rate increased from 84% in the 3rd quarter to 93% in the 4th.
Action Plan: The plan moving forward is to continue to monitor compliance with the above data elements and to discuss and address non-compliance with the medical staff.
II. Measure Name: Seclusion DocumentationMeasure Description: Proper documentation is the only way to demonstrate and provide a record that the clinical criteria and assessments for seclusion/restraint have been met. Documentation is critical for patient care/safety, as it validates the care that was provided.Type of Measure: Performance Improvement
Page 73

STRATEGIC PERFORMANCE EXCELLENCE
Target 1Q 2Q 3Q 4Q
2016 2016 2016 2016
Total Seclusions 7 20 9 13 13 55Is order complete? N/A N/A 92% 100% 100% 97%On order, is the intervention stated in behavioral terms?
92% 81% 89% 83% 100% 88%
100%Does the time of the orders match interventions and times on Nursing forms?
N/A N/A 95% 74% 100% 90%
Is Medical Staff Seclusion and Restraint Progress Note complete (both sides)?
100% 81% 95% 79% 69% 81%
Is the time of the 1 hour face to face within an hour of the event?
100% 100% 100% 83% 100% 96%
If PA, did PA consult with attending? 92% 100% 100% 83% 100% 96%Are the details of the event similar on all forms?
100% 100% 100% 83% 100% 96%
Did the medical provider participate in the Seclusion and Restraint treatment plan review?
N/A N/A 59% 52% 100% 70%
Overall Compliance 96% 92% 91% 80% 96% 90%
Results
Seclusions YTD 2016
Baseline (March 2015)
Page 74

STRATEGIC PERFORMANCE EXCELLENCE
Goal: 100% Compliance with Medical Staff Documentation
A new audit tool was implemented in October 2015. Audit questions: Is the order completed? Did the medical provider participate in S&R treatment plan review? Does the time on the orders match interventions and times on the nursing forms? These were not questions on the audit tool prior to 2Q2016.
Data Analysis: There were 13 seclusions in the 4th quarter. All data elements for the 4th quarter increased except for one element: “Is the medical staff’s S&R progress note complete?” Overall, the compliance rate increased from 80% in the 3rd quarter to 96% in the 4th.
Page 75

STRATEGIC PERFORMANCE EXCELLENCE
Action Plan: The plan moving forward is to continue to monitor compliance with the above data elements and to discuss and address non-compliance with the medical staff. III. Measure Name: All elements of a medication order are complete.
Measure Description: To promote safe medication ordering by defining the required elements of a complete medication order.Type of Measure: Performance Improvement
Data Elements Baseline July 2015
1Q2016 2Q2016 3Q2016 4Q2016 Total Compliance
# of Medication orders reviewed 73 274 243 166 245 928Medication order sheet has patient name, DOB and hospital number ID (2 patient identifiers)?
100% 100% 100% 100% 100% 100%
Date and time of the order 100% 99% 100% 99% 99% 99%Medication name 100% 100% 100% 100% 99% 100%Medication dose 99% 99% 100% 100% 96% 99%Route of administration 94% 92% 98% 95% 94% 95%Frequency of administration and/or dosing interval
98% 98% 95% 99% 92% 96%
Indication for use 80% 88% 98% 94% 90% 93%Authorized prescribers signature and credentials
96% 98% 89% 99% 97% 96%
Telephone orders completed, signed, dated and timed w/in 72 hr.
90% 93% 96% 100% 97% 97%
Overall Compliance 95% 96% 97% 98% 96% 97%
Page 76

STRATEGIC PERFORMANCE EXCELLENCE
Data Analysis: All data elements were found to be below the established goals of 100% for the 4th quarter, except for the 2 patient identifier elements that continues to have 100% compliance. The data elements remain above the threshold of 90% compliance. Action Plan: Since data results remain above the threshold, the plan is to continue to discuss Performance Improvement audit results in medical staff meetings and discuss possible action steps that can be taken to achieve 100% overall compliance.
Page 77

STRATEGIC PERFORMANCE EXCELLENCE
Nursing Janet Babcock, RN
I. Measure Name: Restraint Audits – Patient SafetyMeasure Description: Proper documentation is the only way to demonstrate and provide a record that the clinical criteria and assessments for seclusion/restraint have been met. Documentation is critical for patient care/safety, as it validates the care that was provided. The audits were initiated January of 2015. Type of Measure: Performance Improvement
Results
Target Data Elements Baseline
1Q2016
2Q2016
3Q2016
4Q2016 YTD
100%Compliance
1. # of Events 11 39 28 39 35 1414. Each order obtained within 15 minutes of the intervention?
100% 89% 99% 81% 83% 88%
5. Is Form 408 Nursing Seclusion/Restraint Progress Note complete?
50% 83% 99% 92% 95% 92%
9. On Form 408 Nursing Seclusion/Restraint Progress Note, Form 470 Nursing Assessment Protocol for Seclusion and Restraint, and Physician Orders do times match for interventions initiated and time of events?
100% 96% 95% 91% 97% 95%
10. Are details of event similar on all forms without discrepancies 408, 409, and Order sheets?
100% 97% 99% 92% 97% 96%
11. Is Form 470 Nursing Assessment Protocol for Seclusion and Restraint completed?
95% 98% 95% 100% 96% 97%
15. Were debriefings DB1 & DB2 completed at appropriate times?
100% 73% 93% 70% 99% 84%
Page 78

STRATEGIC PERFORMANCE EXCELLENCE
16. Is patient debriefing in the chart? 100% 81% 90% 93% 89% 88%
Target Data Elements Baseline
1Q2016
2Q2016
3Q2016
4Q2016 YTD
100%Compliance
Was legal guardian or agent made aware of time of debriefing?
N/A N/A 87% N/A
Did legal guardian or agent attend debriefing? N/A N/A 0% N/A
19. Was Form 470 TX Focused Treatment Plan Review completed within 24 hours?
5% 31% 80% 93% 88% 73%
Overall Compliance 88% 87% 83% 92% 93% 89%
Data Analysis: Baseline data compiled August 2015 with updates to Seclusion and Restraint procedure, forms, and audit tool since that time. Fourth quarter comparison to third quarter shows five elements with increased percentages, and three elements with decreased percentages leading to an overall compliance rate of 93% compared to that of 92% for the third quarter, an increase of 1% and an increase of 5% from baseline. There were 35 total restraint events this quarter with totals of: April #9 - Knox 2, Hamlin 4, Chamberlain 3; May #8 - Knox 0, Hamlin 6, Chamberlain 2; June #18 - Knox 3, Hamlin 2, Chamberlain 13. Numerous restraint events can be contributed to same-patient manual holds over the course of the quarter. Unit totals for 4th Quarter overall compliance are: Knox - 91% with 5 events, Hamlin - 95% with 12 events, Chamberlain - 91% with 18 events. FY2016 column has been included for informational purposes only and represents the summation percentages of all four quarters.
Elements 11-14 do not apply to restraint and can be found calculated in seclusion documentation. Nursing documentation will be extracted and separated from Medical Staff documentation except for one data element, #9 “Are details of event similar on all forms without discrepancies, #408, #409 and Order sheets,” as this reflects equivalent documentation responsibilities.
**“Was legal guardian or agent made aware of time of debriefing?” and “Did legal guardian or agent attend debriefing?” have been removed from aggregate data and are reported via numbers only taking place in February reporting. See below.
Page 79

STRATEGIC PERFORMANCE EXCELLENCE
Page 80

STRATEGIC PERFORMANCE EXCELLENCE
Action Plan: Nursing staff remains below goal and will continue to audit the documentation of patient restraints on a monthly basis and re-evaluate quarterly and yearly. Nursing will compare data gathered from Meditech reporting to ensure all coercive events are captured. There is a possibility that prior to beginning this cross-check in December 2015, events were not captured for data collection.
Page 81

STRATEGIC PERFORMANCE EXCELLENCE
II. Measure Name: Seclusion DocumentationMeasure Description: Proper documentation is the only way to demonstrate and provide a record that the clinical criteria and assessments for seclusion/restraint have been met. Documentation is critical for patient care/safety, as it validates the care that was provided.Type of Measure: Performance Improvement
Results
Target Data Elements Baseline
1Q2016
2Q2016
3Q2016
4Q2016 YTD
100% Compliance
# of Events 7 14 9 13 13 491. Each order obtained within 15 minutes of the intervention?
100% 100% 100% 85% 91% 94%
4. Is form #408 Nursing Seclusion/Restraint Progress Note complete?
50% 64% 94% 100% 82% 85%
5. On Form #408 Nursing Seclusion/Restraint Progress Note, Form #470 Nursing Assessment Protocol for Seclusion and Restraint, and Physician Orders do times match for interventions initiated and time of events?
100% 81% 95% 74% 100% 88%
9. Are details of event similar on all forms without discrepancies #408, #409, and Order sheets?
100% 89% 100% 83% 100% 93%
10. Is Form # 470 Nursing Assessment Protocol for Seclusion and Restraint completed?
100% 92% 100% 100% 88% 95%
11. On Form # 407RN 2 Hour Seclusion and Restraint Breaks 2 hour breaks are completed at appropriate intervals and
50% 25% 92% 100% 84% 75%
Page 82

STRATEGIC PERFORMANCE EXCELLENCE
signed by RN?Results
Target Data Elements Baseline
1Q2016
2Q2016
3Q2016
4Q2016 YTD
100% Compliance
12. On Form #407RN 2 Hour Seclusion and Restraint Breaks is time ended for S/R completed and signed by RN
50% 25% 84% 61% 59% 58%
13. On Form #407 Seclusion & Restraint Monitoring and Assessment 15 minute checks are completed at appropriate intervals, with Pt’s behavior documented in behavioral terms as it pertains to release criteria, times, dated, and initialed by staff?
92% 96% 100% 100% 94% 98%
14. On Form #407 Seclusion & Restraint Monitoring and Assessment did each staff member that initialed 15 minute checks complete last page of form with signature and title?
100% 50% 86% 42% 61% 60%
15. Were debriefings DB1 & DB2 completed at appropriate times?
100% 89% 100% 65% 100% 89%
16. Is patient debriefing in the chart? 100% 95% 100
% 65% 75% 84%
Was legal guardian or agent made aware of time of debriefing?
N/A N/A 75%
Did legal guardian or agent attend debriefing? N/A N/A 0%
19. Was Form # 470 TX Focused Treatment Plan Review completed within 24
17% 39% 94% 75% 86% 74%
Page 83
STRATEGIC PERFORMANCE EXCELLENCE
hours?Overall Compliance 80% 70% 87% 80% 85% 83%
Data Analysis: Baseline data compiled August 2015 with updates to Seclusion and Restraint procedure, forms, and audit tool since that time. Fourth quarter comparison to third quarter shows 7 elements increased, and 5 elements decreased for an overall compliance of 85%, a 5% increase from previous quarter and baseline. There were13 total seclusion events this quarter with totals of: April 8 seclusion events, May 0 seclusion events, and June 5 seclusion events. Knox unit had 2 events with overall compliance of 87% for April, with a 4th quarter total of 87%. Knox unit had no further seclusion events in 4th quarter. Hamlin unit had 4 events in April with 97% overall compliance, 1 seclusion event in June with overall compliance of 73%, and a 4 th
quarter overall compliance of 85%. Chamberlain unit had 2 events in April with 95% overall compliance, 4 events in June with 76% overall compliance, and a 4 th quarter overall compliance of 86%. FY 2016 column has been included for informational purposes only and represents the summation percentages of all four quarters.
**“Was legal guardian or agent made aware of time of debriefing?” and “Did legal guardian or agent attend debriefing?” have been removed from aggregate data and are reported via numbers only-beginning February reporting-see last page.
Page 84
STRATEGIC PERFORMANCE EXCELLENCE
Action Plan: Nursing staff remains below goal and will continue to audit the documentation of patient seclusions on a monthly basis and re-evaluate quarterly and yearly. Nursing documentation will be extracted and separated from Medical Staff documentation except for data element #9, “Are details of event similar on all forms without discrepancies, #408, #409 and Order sheets?” as this reflects equivalent documentation responsibilities. Nursing will compare data gathered from Meditech reporting to ensure all coercive events are captured. There is a possibility that prior to beginning this cross-check in December that events were not captured for data collection.
Page 85

STRATEGIC PERFORMANCE EXCELLENCE
4Q2016 - Combined Coercive Event Legal Guardian Debriefing Notification:
Legal guardian questions are separated from aggregate data at this time; it is of great importance that legal guardians be made aware of coercive events and the subsequent debriefing with the patient to encourage participation and possible avenues to avoid future coercive events.
Rather than reporting percentages, actual numbers are reflected in the results. These are a combination of both restraint and seclusion events.
Data elements
# of Coercive Events
Baseline-Not measured at
time of Baseline data
collection
Knox
7
Hamlin
17
Chamberlain
24
17. Was legal guardian or agent made aware of time of debriefing? N/A
Yes: 6No: 1N/A: 0
Yes: 10No: 2N/A: 5
Yes: 12No: 7N/A: 5
18. Did legal guardian or agent attend debriefing? N/A 0/7
attended0/10
attended0/12
attended
Description of Information: In the 4th quarter of 2016, there were 28 guardian notifications completed post-coercive event to inform of approaching patient debriefing. There were 10 instances in which guardians ought to have been notified and were not, and 10 occurrences in which legal guardian notification was not applicable to the situation; these patients would have no legal guardian other than themselves. Out of the 28 completed guardian notifications, no guardians attended patient debriefings. This may possibly be attributed to time constraints, as the debriefing will take place no later than 16 hours following the event, or a number of factors that may affect patient/guardian relationships.
Action Plan: Nursing has separated this information from the rest of seclusion and restraint reporting data to observe for trends for corrective action. It is the Nurse Supervisor’s responsibility to notify the guardian and debrief with the patient. Nursing administration will address guardian notification and implications for lack of notification with nurse supervisors.
Page 86

STRATEGIC PERFORMANCE EXCELLENCE
Outpatient Services Robyn Fransen, LSW-C
I. Measure Name: Timeliness of Institutional Reports and Annual Reports. Measure Description: All annual reports are due yearly by December 31st as required by Maine Statute Title 15. Institutional reports are due within 10 days after receiving notice of a filed petition. A tardy filing of an institutional report would delay a forensic patient’s evaluation and ability for increased privileges, modified release, and ultimately release and discharge from the custody of the Commissioner. Type of Measure: Performance Improvement
Results
Target Data Elements
Baseline 3Q & 4Q
20151Q201
62Q201
63Q201
64Q201
6 YTD
100% Compliance
# of reports 3 1 6 0 1 8Institutional Report submitted within 10 days of notice of hearing being received by DDPC?
5 100% 0% 0% 0% 25%
Annual Report submitted by December 31, 2015
N/A N/A 80% N/A N/A 80%
Overall Compliance 0% 100% 67% 100% 0% 67%
Page 87

STRATEGIC PERFORMANCE EXCELLENCE
Data Analysis: The data element “Institutional Report Submitted within 10 days of notice of hearing being received by DDPC was at 0% for 4th quarter with one notice of hearing received. The data element “Annual Report Submitted by December 31, is not applicable at this time. The overall compliance decreased from 100% to 0% for 4th quarter FY2016.
Action Plan: Continue to track and monitor the completion and submission of the Institutional and Annual Reporting using a Forensic Timeline Report which will assist in keeping staff notified of upcoming dates. It has been determined that the notice of hearing was not being distributed to all members of the forensic team and will need to be distributed in a more timely fashion so that IR’s can be completed on time.
II. Measure Name: Timeliness of Medical Record Documentation for Outpatient Services.Measure Description: All progress notes are promptly filed and readily available in the patient’s medical record. This information is necessary to monitor the patient’s condition and this and other necessary information must be in the patient’s medical record. In order for necessary information to be used it must be promptly filed and available in the medical record so that health care staff involved in the patient’s care can access/retrieve this information in order to monitor the patient’s condition and provide appropriate treatment and patient services.Type of Measure: Performance Improvement
Page 88

STRATEGIC PERFORMANCE EXCELLENCE
Results
Target Data elements BaselineJune 2015
1Q2016
2Q2016
3Q 2016
4Q2016 YTD
90%
# of Notes 38 225 210 162 181 778Psychiatric notes entered within 72 hours? 43% 86% 77% 84% 86% 83%
Nursing notes entered within 72 hours? 88% 100% 97% 100% 96% 98%
Social Work notes entered within 72 hours? 85% 59% 98% 94% 100% 88%
Psychology notes entered within 72 hours? 67% 52% 94% 75% 91% 78%
Overall Compliance 76% 73% 94% 92% 96% 89%
Data Analysis: Data elements “Psychiatric Notes Entered with 72 hours,” “Social Work notes entered within 72 hours,” and “Psychology notes entered within 72 hours” all increased in compliance from 3rd quarter to 4th quarter. “Nursing Notes Entered within 72 hours” decreased in compliance, although there was only one note that was not in the record within the 72 hour timeframe. Overall compliance increased from 92% to 96% and is above the goal of 90%. The only discipline that continues to fall under the 90% compliance rate is psychiatry.
Page 89

STRATEGIC PERFORMANCE EXCELLENCE
Action Plan: Continue to audit notes on a monthly basis, remind staff of the policy for completing notes, and holding monthly meetings during which documentation will be an ongoing discussion. Psychiatry will be notified that their compliance rate continues to be under the 90% goal.
III. Measure Name: Timeliness of Initial and Annual Assessment Documentation for Outpatient ServicesMeasure Description: All initial and annual assessments (psychiatric, nursing, social work) are completed and filed in the patient’s medical record and in the electronic medical record within 30 days of the patient’s admission and annual date. This information is necessary to monitor the patient’s condition and, this and other necessary information, must be in the patient’s medical record. In order for necessary information to be used, it must be promptly filed and available in the medical record so that health care staff involved in the patient’s care can access/retrieve this information in order to monitor the patient’s condition and provide appropriate treatment and patient services.
Results
Target Data elementsBaseline1Q - 2QFY2016
3Q2016 4Q2016
100% compliance
# of Assessments 7 0 1Psychiatric assessment
complete and entered within 30 days?
43% 0 100%
Nursing assessment complete and entered within 30 days? 86% 0 100%
Social Work assessment complete and entered within
30 days?86% 0 100%
Overall Compliance 71% N/A 100%
Page 90

STRATEGIC PERFORMANCE EXCELLENCE
Data Analysis: There was one patient opened during 4Q2016 and all assessments were completed on time.
Action Plan: Will continue to audit all assessments on a monthly basis, flagging any upcoming or currently due assessments, and setting weekly reminders on outlook to begin one month before annual date to remind staff of the upcoming due date.
Page 91

STRATEGIC PERFORMANCE EXCELLENCE
Pharmacy Services Michael Migliore, RPh
I. Measure Name: Medication Management MonitoringMeasure Description: Documentation of Clinical InterventionsType of Measure: Performance Improvement
UnitBaseline 4Q2015 1Q2016 2Q2016 3Q2016 4Q2016 YTD
Actual Rx 52 68 103 587 831 1589
Data Analysis: The number of interventions for DDPC continued to increase in the fourth quarter. This is due, in large part, to the new monitoring programs initiated in January by the new staff pharmacist. The pharmacy department is now participating in monitoring all of the patients’ renal function, electrolyte levels, and metabolic parameters to find areas for medication use optimization. The data collection and recording system continues to be enhanced, accounting for a further increase in the number of interventions.
Action Plan: Continue current monitoring programs and adding others in DDPC’s continuing effort to strive for excellence in patient care.
Page 92
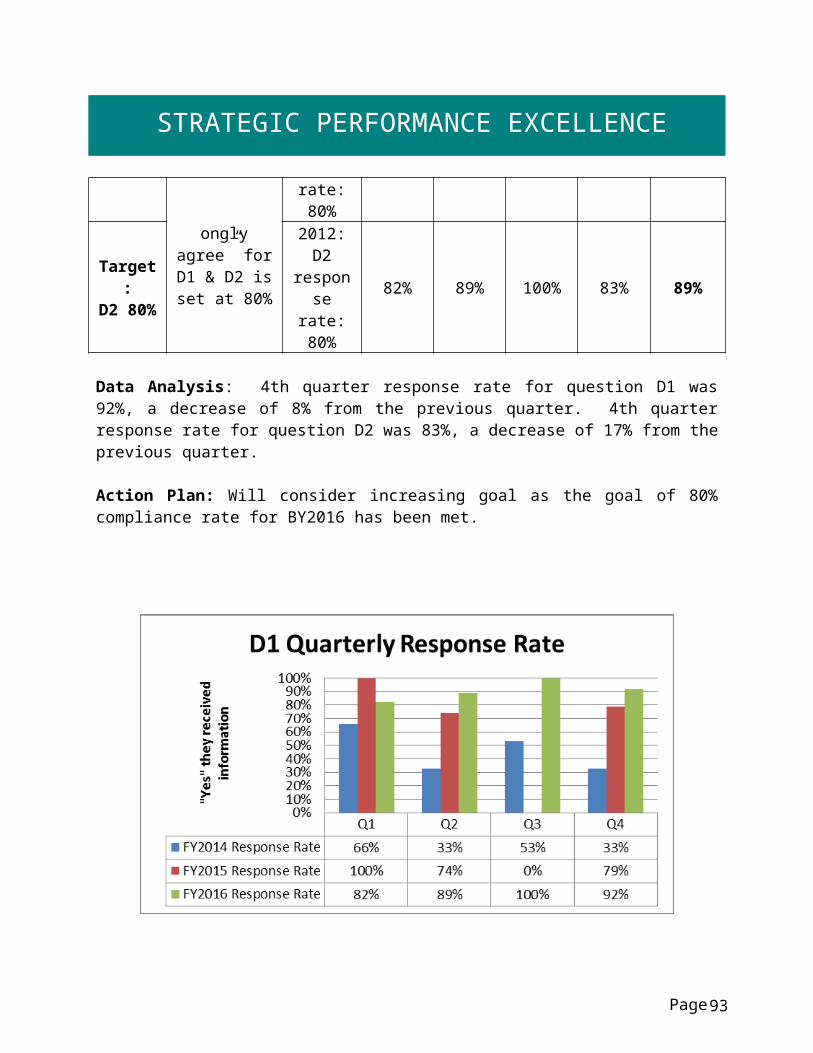
STRATEGIC PERFORMANCE EXCELLENCE
Comments: As the fourth quarter was also staffed by the new staff pharmacist, documentation of clinical interventions should remain consistent.
II. Measure Name: Medication Management MonitoringMeasure Description: The Psychiatric Emergency OrderType of Measure: Performance Improvement
Process Element No Yes 1Q2016
2Q2016
3Q2016
4Q2016
Reason for non-compliance
Target Pharmacy received PE orders
1 100% 100% 100% 100%Actual - 6 1 0Target Did RPh need to
resolve PE orders1 0 0 0 0
Actual - 0 0 0Target Were PE meds
Clearly identified when clarified
1 100% 100% 100% 100%Actual - N/A N/A N/A
Target Was any PE written for up to 72 hours, stopped by writing
“Discontinue Emergency Meds”?
100% 100% 100% 100%Actual
- Yes No No
Target Was a one-time PE intervention
specified as an Emergency Med?
1 100% 100% 100% 100%Actual
- No No No
Target Did any Emergency Med not end in 72
hours?
1 0 0 0 0Actual - No No No
Target Was PE co-signed by psychiatrist if ordered by a PA?
1 100% 100% 100% 100%Actual - No N/A N/A
Data Analysis: This performance improvement project got a late start in the first quarter, explaining the lack of data for that time period. To pharmacy’s knowledge, zero psychiatric emergencies were declared during the fourth quarter.
Action Plan: Continue to collect information on psychiatric emergencies. Improvements will be discussed at Pharmacy & Therapeutics Committee meetings as necessary.
Page 93

STRATEGIC PERFORMANCE EXCELLENCE
III. Measure Name: Medication Management MonitoringMeasure Description: Was Variance Reported within 15 Minutes?Measure Type: Performance Improvement
UnitsBaseline4Q2015 1Q2016 2Q2016 3Q2016 4Q2016 YTD
Target All 16 90% 90% 90% 90% 90%Actual 63% 63% 36% 55% 56%
Yes 12 12 12 5 6 35No 4 7 7 9 5 28
Data Analysis: Of the 4Q2016 variances, 6 of the 11 variances that were reported were declared to the prescriber within 15 minutes. This time standard is set by the hospital. It is important to note that some variances are due to procedural deviations and are not things that directly impact patient care.
Action Plan: There is an on-going effort to get everybody to report variances to the prescribers within 15 minutes for prompt notification in an effort to provide optimal patient care. The number of variances the pharmacy is writing is increasing in order to ensure and educate personnel about operating procedures.
Comments: While the statistics for reporting variances within the 15-minute time frame set by the hospital are not favorable for this quarter, it is important to note that not all variances occurred with direct contact with patients, and some were due in part to procedural deviations.
IV. Measure Name: Medication Management MonitoringMeasure Description: Shift the Variance occurred onMeasure Type: Performance Improvement
UnitsBaseline 4Q2015 1Q2016 2Q2016 3Q2016 4Q2016 YTD
Target All 17 0 0 0 0 0Actual 19 18 14 11 62
7am-3pm 9 13 10 9 5 373-11pm 3 4 7 4 5 20
11pm-7am 5 2 1 1 2 6
Page 94

STRATEGIC PERFORMANCE EXCELLENCE
Data Analysis: As expected, most variances occur during the day shift as this is when most medications are passed and when patients are typically the most active.Action Plan: The number of variances is holding steady and even slightly decreased during the fourth quarter. We will continue working to decrease the number of variances and increase communication between the pharmacy and the units to assist in resolving any areas of uncertainty that can lead to variances.
Comments: The staff continues to work to avoid variances whenever possible and continues to report them promptly whenever necessary.
V. Measure Name: Medication Management MonitoringMeasure Description: Cause of VarianceMeasure Type: Performance Improvement
UnitsBaseline 4Q2015 1Q2016 2Q2016 3Q2016 4Q2016 YTD
Target All 0 0 0 0 0Actual 19 18 14 11 62
Two forms of patient ID
not used1 1
Inaccurate check of
MAR2 2
Not Yellowed on
MAR(1) 0
MD order issues 2 2
MAR Print out wrong (1) 0
Not faxed (2) 1 2 3New orderoverlooked (1) 1 3 4
Med Overlooked (8) 9 2 1 8 20
Distraction 4 3 3 2 12Dispensing
Error 1 1
Page 95

STRATEGIC PERFORMANCE EXCELLENCE
Procedure not followed 1 7 2 2 12
Transcription (5) 4 9 9 22Data Analysis: For the fourth quarter the most common contributing factor to medication variances was that the order, or a change to an order, was overlooked. For the year to date, the most common contributing factors are “med overlooked,” “distraction,” “procedure not followed,” and “transcription errors.” The fourth quarter did see a marked improvement in the number of transcription errors.
Action Plan: Pharmacy will continue to monitor the daily Pyxis activities to ensure proper handling of medications. An interdisciplinary team reviews the variances on both a monthly and as-needed basis so that any concerns can be quickly addressed and remedied.
Comments: The variances and the related procedures for reporting and documenting them are continuously reviewed and discussed. DDPC will continue with its efforts to minimize variances and to educate staff as to how processes may be improved for optimal patient care.
VI. Measure Name: Medication Management MonitoringMeasure Description: Type of VarianceType of Measure: Performance Improvement
UnitsBaseline 4Q2015 1Q2016 2Q2016 3Q2016 4Q2016 YTD
Target All 0 0 0 0 0 0Wrong Dose 5 2 11 1 14Extra Dose 3 1 4Wrong Time 2 2Wrong Drug 3 3Wrong Form 1 1 1Frequency 2 0Omission 7 7 7 10 7 31Wrong patient 1 1 1 2Schedule 1 2 2Expired Drug 1 1 2Procedure not followed 3 1 1 5
Dispensing 2 8 2 10Totals 17 19 18 14 11 62
Page 96

STRATEGIC PERFORMANCE EXCELLENCE
Methodology: The staff member that discovers the variances writes the report. The report is then circulated to Risk Management, Pharmacy, nursing unit supervisors, and other parties as necessary. It is important to note that a single variance may encompass more than one type of error (for example, the wrong form of a drug may be given at the wrong time of day). For the purposes of the quarterly reports and for discussion at Pharmacy & Therapeutics committee meetings, the staff pharmacist compiles the variances and reports on them to the rest of the committee for discussion.
Data Analysis, Action Plan, and Comments: DDPC does a very good job of reporting variances and errors in a timely fashion so that they can be addressed promptly. Some of the variances have occurred due to a lack of communication, and increasing that communication is a main focus of the pharmacy staff. DDPC will continue in its efforts to decrease the number of variances and provide re-education to the personnel involved as they arise.
VII. Measure Name: Medication Management – Controlled Substance Loss DataMeasure Description: Monthly Pyxis Controlled Drug DiscrepanciesType of Measure: Quality Assurance
UnitBaseline 4Q2015 1Q2016 2Q2016 3Q2016 4Q2016 YTD
AverageTarget
Rx 5.7/month
0 0 0 0 0# of
Discrepancies
13.7/month 11.3/month 5.6/month 4.6/month 8.8/month
# of CS Lost 0 0 0 0 0
Data Analysis: There were, on average, 4-5 controlled substance discrepancies per month for the fourth quarter. This metric does not indicate the number of controlled substances lost; instead it illustrates the number of discrepancies that occur, which typically result from miscounts. No controlled substances were unaccounted for or lost during the fourth quarter.
Action Plan: Pharmacy will continue to increase visibility and availability to the units to provide education regarding how CS discrepancies occur and how they can be avoided.
Comments: We will continue to strive for a 0% loss of controlled substances.
Page 97

STRATEGIC PERFORMANCE EXCELLENCE
VIII. Measure Name: Safety in Culture and Actions: Fiscal AccountabilityMeasure Description: Tracking of Dispensed Discharged PrescriptionsType of Measure: Quality Assurance
UnitBaseline FY 2015 1Q2016 2Q2016 3Q2016 4Q2016 YTD
TargetAll $1992 for
48 meds
0 0 0 0 0
Actual $713.07/20 meds
$6.51/4 meds
$240.86/28 meds
$185.33/ 49 meds
$1145.77/101 meds
Data Analysis: The dispensed outpatient prescriptions have occurred this quarter when the patients are being discharged or sent to a correctional facility. In May, the majority of medications dispensed to patients were to provide treatment continuity as they were transferred to a correctional facility. However, through this process it was learned that if the medications are not on the jail’s formulary or if they are taken on an as-needed basis they are simply kept in storage and destroyed upon the return of the patient. For this reason $93.75 of the medications for the month were destroyed when the patients returned to DDPC. For the month of June, two patients were discharged with a supply of medications. The first received a 3-day supply of two different prescriptions for medications that would be administered by the correctional facility, and the second received a three day supply of medications because insurance coverage lapsed immediately prior to discharge, unbeknownst to DDPC. Medications were supplied for a 72-hour period until his until his coverage could be reinstated.
Action Plan: Great strides have been made in reducing the cost of discharge medications. This task primarily falls to the pharmacy technician who functions closely with other departments, and at times other facilities, to ensure patients are receiving the benefits they are eligible for to obtain prescriptions outside of the hospital. DDPC is continuing to strive to only send discharge prescriptions with patients if they are truly necessary and will be utilized, and the current focus is to reduce the number of medications that are not going to be used at the correctional facilities. Comments: Great success has been reported in the last two quarters with the initiative to reduce the number of discharge prescriptions sent with patients that are returning to the criminal justice system. The pharmacy staff will continue to do everything possible to support this worthwhile endeavor.
Page 98

STRATEGIC PERFORMANCE EXCELLENCE
IX. Measure Name: Safety in Culture and Actions – Veriform Medication Room AuditsMeasure Description: Monthly Comprehensive Audits of 45 CriteriaType of Measure: Quality Assurance
UnitBaseline FY 2015 1Q2016 2Q2016 3Q2016 4Q2016 YTD
TargetAll 93%
100% 100% 100% 100% 100%
Actual 85% 53% 100% 100% 85%
Methodology: The pharmacy performs comprehensive inspections of the medication rooms, central supply area, and the medical clinic on a monthly basis. These audits over 44 different criteria to ensure the medication rooms are kept in optimal condition for patient care. Patients’ medication profiles are also reconciled against the contents of their bulk-item bins to ensure they have enough of the medications they need and that discontinued orders have been removed.
Data Analysis: The focus of the new pharmacy staff has been increased involvement with the medication room audit process, which has proven to be essential in rectifying the deficiency noted in the second quarter.
Action Plan: All inspections are now due by the third week of the month to ensure timely completion. Whenever possible the findings of the inspections are immediately communicated to the area supervisor(s) to provide immediate recognition of any present deficiencies. There has been 100% completion of all inspections since the revised process has been in place.
Comments: The corrective plan will remain in place indefinitely to ensure 100% of all inspections are completed on time.
X. Measure Name: Medication Management – Non Controlled Pyxis DiscrepanciesMeasure Description: Monthly Monitoring and Pyxis Non-Controlled Discrepancies
Type of Measure: Quality Assurance
UnitBaseline 4Q2015 1Q2016 2Q2016 3Q2016 4Q2016 YTD
AverageTarget
All 35.3/month2.67%
0 0 0 0 0
Actual 40/month1.53%
53.3/month1.40%
49.3/month1.41%
43/month1.31%
35.7/month1.41%
Page 99

STRATEGIC PERFORMANCE EXCELLENCE
Data Analysis: The average percent of non-controlled substance discrepancies has been below baseline for all three quarters of this fiscal year. These discrepancies do not necessarily reflect medications lost; instead, they typically arise from miscounts or typing errors.
Action Plan: The current system of reviewing and rectifying Pyxis discrepancies has been working well and will continue to be utilized.
Comments: The decreasing number of discrepancies reflects a well-functioning system. The pharmacy team will continue to work to maintain an efficient medication delivery system.
Page 100

STRATEGIC PERFORMANCE EXCELLENCE
Social Services Tammy Cooper, LCSW
I. Measure Name: 30 Day Readmissions Modified Root Cause AnalysesMeasure Description: Once the hospital has identified potentially preventable readmissions, it is expected to conduct an in-depth review of the discharge planning process for a sample of such readmission (at least 10% of potentially preventable readmissions, or 15 cases/quarter, whichever is larger is suggested but not required), in order to determine whether there was an appropriate discharge planning evaluation, discharge plan, and implementation of the discharge plan.Type of Measure: Quality Assurance
Having identified factors that contribute to preventable readmissions, hospitals are expected to revise their discharge planning and related processes to address these factors.
Data Analysis: There were two readmissions within 30 days of discharge in the 4th quarter. There were no readmissions in April, two readmissions in May, and no readmissions in June of this quarter. Of the two readmissions in May, both of the 45 day Modified Root Cause analysis were due within the 4th quarter with 100% compliance.
Page
Results
Target Data elements Baseline(March 2015)
1Q2016
2Q2016
3Q2016
4Q2016
# of re-admissions within 30 days of discharge
N/A N/A N/A 3 2
# of Progressive Treatment Plan (PTP) Readmissions within 30 days.
N/A N/A N/A 1 1
# of 45 Day Root Cause Analyses due within the quarter
N/A N/A N/A 0 2
100% % of compliance with completion of a 45 day modified root cause analysis for all 30 day readmissions
TBD N/A N/A N/A 100%
101

STRATEGIC PERFORMANCE EXCELLENCE
II. Measure Name: Grievance Compliance and Documentation.Measure Description: Addressing grievances in a timely manner allows potential rights violations to be resolved quickly therefore allowing patients and staff to continue to focus on treatment. A Nurse Supervisor must speak with the patient within four hours of notification of the grievance. Social Services must deliver a response to the patient within five days, with five days more if the grievant is notified, and with agreement of the Patient Advocate. Measure Type: Performance Improvement
Results
Target Data elementsBaseline
3-4 QFY 2015
1Q2016
2Q2016
3Q2016
4Q2016 YTD
100%
# of Events 47 12 9 19 6 46Unit Staff compliant with addressing grievance? 66% 100% 89% 100% 89%
Unit Staff completed form correctly (boxes checked, dated/timed, all signatures completed, Nurse Supervisor notified)?
66% 77% 58% 50% 63%
*Nursing Supervisor compliant with addressing grievance within 4 hours?
83% 100% 79% 83% 86%
Nurse Supervisor completed form correctly (boxes checked, dated/timed, all signatures completed, forwarded to Social Worker)?
25% 89% 63% 67% 61%
*Social Worker compliant with addressing grievance within 5 days or within 5 more days if extension is requested?
100% 100% 100% 100% 100%
*Overall Compliance of Nursing Supervisor and Social Worker addressing grievance
64% 92% 100% 90% 92% 94%
Page 102

STRATEGIC PERFORMANCE EXCELLENCE
Element 1: Unit Staff compliant with addressing grievance Element 2: Unit Staff completed form correctly and notified Nurse Supervisor Element 3: Nurse Supervisor addressed grievance within 4 hours Element 4: Nurse Supervisor completed form correctly and forwarded to Social Worker Element 5: Social Worker addressed grievance within 5 days or more than 5 days if
extension is requested Element 6: Overall Compliance of Nursing Supervisor and Social Worker Addressing
Grievance
Data Analysis: The data element of “Overall Compliance of Nursing Supervisor and Social Worker addressing grievance” has increased in compliance from 89% to 92% from 3 rd quarter to 4th quarter. The data element “Nurse Supervisor compliant with addressing grievance within 4 hours” increased from 79% to 83%. Data is also tracked for unit staff addressing grievances and that increased from 89% to 100%, but forms completed correctly by unit staff decreased from 58% to 50%.
Action Plan: There are non-compliance concerns with addressing and completing grievance forms across unit staff and nurse supervisors. This may be a result of the number of grievances submitted increasing significantly or other staffing factors. A new grievance policy is being developed with separate forms for complaints and grievances which will address some of the challenges of filling out the forms correctly.
Page 103

STRATEGIC PERFORMANCE EXCELLENCE
Staff Education and Development Jenny Bamford-Perkins, MSN, RN
I. Measure Name: MANDT TrainingMeasure Description: Both direct and non-direct care employees of Dorothea Dix Psychiatric Center (DDPC) are trained annually and at new employee orientation in the use of MANDT techniques in accordance with staff education policies. The MANDT system stresses the use of verbal and other non-physical de-escalation techniques. (Wale, Belkin, & Moon, 2011). The purpose of this indicator is to track the compliance of all DDPC staff members in their completion of MANDT certification and re-certification courses. The Staff Education Department (SED) will conduct quarterly audits of employee MANDT certification status using the education database. Type of Measure: Performance Improvement
ResultsUnit Baseline 1Q2016 2Q2016 3Q2016 4Q2016 YTD
Target Number of employees 91%
4Q2015
100% 100% 100% 100% 100%
Actual100%
212/213100%
224/224100%
236/236100%
230/231100%
902/904
Data Analysis: Overall analysis of the data reveals 100% MANDT compliance rate when direct care and non-direct care are combined. It is the goal of SED for 90% MANDT training amongst both direct and non-direct care staff.
Action Plan: Staff education will complete monthly audits Staff education will send monthly reports to department heads and Superintendent of
employees out of compliance.
Page 104

STRATEGIC PERFORMANCE EXCELLENCE
Compliance of 90% for 4 consecutive months has been achieved. The staff education department will no longer be reporting this measure; however, the department will continue to monitor to ensure compliance issues do not come forth in the future. Should issues with MANDT training be revealed, the staff education department will discuss the need to implement PI.
II. Measure Name: CPR TrainingMeasure Description: All employees of Dorothea Dix Psychiatric Center (DDPC) are trained every two years and at new employee orientation to be CPR certified in accordance with staff education policy. The use of CPR in cardiac emergencies has been shown to positively impact patient survival rates (Sasson, Rogers, Dahl, & Kellermann, 2010). DDPC employees need to be trained in CPR so that they may be able to effectively respond to life-threatening cardiac events. The purpose of this indicator is to track the status of all DDPC employees in CPR certification compliance to ensure that DDPC patients can receive quality care from fully-trained professionals.Measure Type: Performance Improvement
ResultsUnit Baseline 1Q2016 2Q2016 3Q2016 4Q2016 YTD
Target Number of Employees 99%
FY 2015
100% 100% 100% 100% 100%
Actual100%
224/225100%
215/216100%
236/236100%
230/231100%
905/908
Data Analysis: Overall analysis of the data reveals 99% CPR compliance rate when direct care and non-direct care are combined. Direct care staff continues to remain at 100% compliance. This reflects one non-direct care staff member from facilities who was unable to attend the December 2015 class due to staff member forgetting. It is the goal of SED for 90% CPR training amongst both direct and non-direct care staff
Page 105

STRATEGIC PERFORMANCE EXCELLENCE
Action Plan: Staff education will complete monthly audits Staff education will send monthly reports to department heads and Superintendent of
employees out of compliance. Staff education will increase the number of instructors in the hospital to make classes
more available. At this time, there are three instructors.
Compliance of 90% for 4 consecutive months has been achieved. The staff education department will no longer be reporting this measure; however, the department will continue to monitor to ensure compliance issues do not come forth in the future. Should issues with CPR training be revealed, the staff education department will discuss the need to implement PI.
III. Measure Name: First Aid TrainingMeasure Description: All employees of Dorothea Dix Psychiatric Center (DDPC) are trained every two years and at new employee orientation to be First Aid certified in accordance with regulatory requirements. The American Heart Association defines first aid as, “the immediate care that you give someone with an illness or injury before someone with more advanced training arrives and takes over, which can mean the difference between life and death.” (2011, p. 3). The purpose of this indicator is to track the status of all DDPC employees in First Aid certification compliance to ensure that DDPC patients can receive quality care from fully-trained professionals.Type of Measure: Performance Improvement
Results
Page 106

STRATEGIC PERFORMANCE EXCELLENCE
Unit Baseline 1Q2016 2Q2016 3Q2016 4Q2016 YTD
Target Number of Employees
20%4Q2015
0% 30% 60% 90% 90%
Actual29%
64/22132%
71/22346%
109/23652%
119/22940%
363/909
Data Analysis: Overall analysis of the data reveals 40% First Aid compliance rate amongst both direct care staff and non-direct care staff. Goal for Q1 is 0% as this is a new requirement for 2015. Baseline was 20% (4Q2015). Year-end compliance for FY2016 was 40%. It is evident that our quarterly incremental increases for FY2016 were not achievable. For FY2017, our goal will be reset to quarterly incremental increases of 5% of the previous month. The standard goal is to have a sustained level of compliance that approaches 90%.
Action Plan: Staff education will complete monthly audits Staff education will send monthly reports to department heads and Superintendent of
employees out of compliance. Staff education will collaborate with department heads to increase the number of staff
that are First Aid certified by 10% per month. Staff education will increase the number of instructors in the hospital to make classes
more available. At this time, there are three instructors. Set new goals for FY2017.
Page 107

STRATEGIC PERFORMANCE EXCELLENCE
IV. Measure Name: New Employee OrientationMeasure Description: New employees will complete new employee orientation within 60 days of hire in accordance with staff education policy. Process includes new employee audits to ensure they have met all requirements.Type of Measure: Quality Assurance
ResultsUnit Baseline 1Q2016 2Q2016 3Q2016 4Q2016 YTD
TargetNumber of Employees
100%4Q2015
100% 100% 100% 100% 100%
Actual 100%13/13
100%24/24
100%15/15
100%13/13
100%65/65
Data Analysis: Overall analysis of the data reveals 100% New Employee Orientation compliance rate amongst both direct care staff and non-direct care staff. It is the goal of SED for 100% of staff to be compliant. Staff education will continue to strive for this goal.
Action Plan: Staff education will complete monthly audits Staff education will send monthly reports to department heads and Superintendent of
employees out of compliance. Staff education will begin spot checks on NEO.
Page 108

STRATEGIC PERFORMANCE EXCELLENCE
Compliance of 90% for 4 consecutive months has been achieved. The staff education department will no longer be reporting this measure; however, the department will continue to monitor to ensure compliance issues do not come forth in the future. Should issues with New Employee training be revealed, the staff education department will discuss the need to implement PI.
V. Measure Name: Impaired Licensed PractitionerMeasure Description: All employees will complete this initial requirement and new employees will complete during orientation. Staff are provided with DDPC policy MS-13 and sign memo regarding this policy and Joint Commission Medical Staff Standard MS.11.01.01. This is documented as course ID: ILP in the employee’s SED database. Process includes an audit of Impaired Licensed Practitioner from the SED database to ensure employees have met this requirement.Type of Measure: Quality Assurance
ResultsUnit Baseline 1Q2016 2Q2016 3Q2016 4Q2016 YTD
Target Number of employees
97%4Q2015
100% 100% 100% 100% 100%
Actual97%
217/224100%
223/223100%
236/236100%
236/23699%
912/919
Data Analysis: Overall analysis of the data reveals 100% compliance rate. This requirement has been included in new employee orientation. It is the goal of SED for 90% compliance. Staff education will continue to strive for this goal.
Page 109

STRATEGIC PERFORMANCE EXCELLENCE
Action Plan: Staff education will complete monthly audits Staff education will send monthly reports to department heads and Superintendent of
employees out of compliance. Staff education will begin spot checks on ILP.
Compliance of 90% for 4 consecutive months has been achieved. The staff education department will no longer be reporting this measure; however, the department will continue to monitor to ensure compliance issues do not come forth in the future. Should issues with Impaired Licensed Practitioner Compliance be revealed, the staff education department will discuss the need to implement PI.
VI. Measure Name: Pain Learning PacketMeasure Description: All RN’s and medical providers will complete this annual requirement and new employees who are RN’s and/or medical providers will complete this during orientation. Staff are provided with this earning packet from the SED department and required to review the material and complete a quiz with an 80% pass rate. This is documented as course ID: PAIN in the employee’s SED database. Process includes an audit of PAIN from the SED database to ensure employees have met this requirement.Type of Measure: Quality Assurance
ResultsUnit Baseline 1Q2016 2Q2016 3Q2016 4Q2016 YTD
Page 110

STRATEGIC PERFORMANCE EXCELLENCE
Target Number of Employees
94%4Q2015
100% 100% 100% 100% 100%
Actual99%
78/7997%
72/74100%83/83
100%85/85
99%318/321
Data Analysis: Overall analysis of the data reveals 100% compliance rate amongst RN’s and medical provider staff. It is the goal of SED for 90% of staff to be compliant. Staff education will continue to strive for this goal.
Action Plan: Staff education will complete monthly audits Staff education will send monthly reports to department heads and Superintendent of
employees out of compliance. Staff education will begin spot checks on Pain.
Compliance of 90% for 4 consecutive months has been achieved. The staff education department will no longer be reporting this measure; however, the department will continue to monitor to ensure compliance issues do not come forth in the future. Should issues with Pain Learning Packet Compliance be revealed, the staff education department will discuss the need to implement PI.
Page 111

STRATEGIC PERFORMANCE EXCELLENCE
Page 112
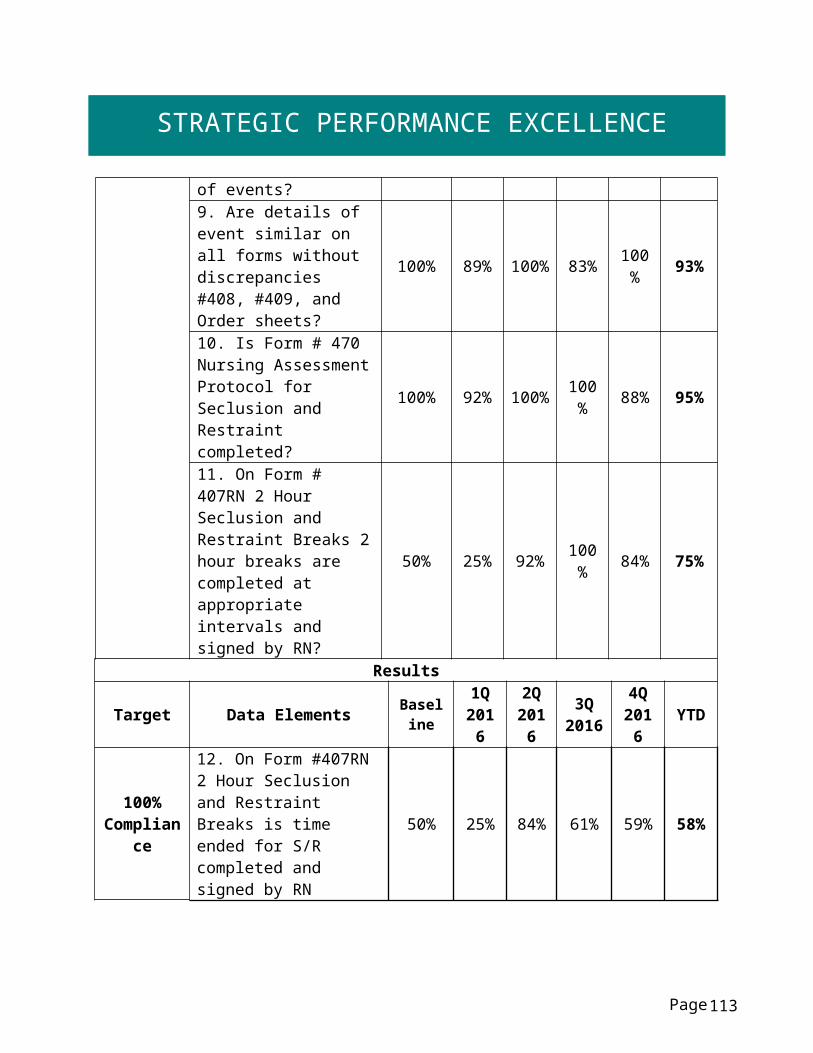
STRATEGIC PERFORMANCE EXCELLENCE
Therapeutic Services Lisa J. Hall, OTR/L
I. Measure Name: Direct Patient ContactMeasure Description: Improving health outcomes/patient care. In order to receive effective treatment that will allow patients to return to a satisfying and meaningful life in their chosen community; staff must provide engagement, assessment and treatment that is targeted to meet their individual needs. The first step of this performance improvement is increasing weekly direct contact with patients. Each discipline will reach and maintain a 50% direct care productivity standard. (Measure Effective March 2015)Type of Measure: Performance Improvement
Department Overall By Month:
Page
Baseline3/28/15 Jan 2016 Feb 2016 Mar 2016 Apr 2016 May 2016 Jun 2016
44% 46% 47% 47% 46% 49% 47%
113

STRATEGIC PERFORMANCE EXCELLENCE
A. Measure Name: Direct Patient Contact - Occupational Therapy
ResultsUnit Baseline 1Q2016 2Q2016 3Q2016 4Q2016 YTD
TargetPercent of time spent in direct
patient contact.
36% March2015
50% 50% 50% 50% 50%
Actual 46% 44% 49% 48% 47%
Current quarter provider range: 43%-50%
B. Measure Name: Direct Patient Contact - Therapeutic Recreation
ResultsUnit Baseline 1Q2016 2Q2016 3Q2016 4Q2016 YTD
TargetPercent of time spent in direct
patient contact.
53%March 2015
50% 50% 50% 50% 50%
Actual 52% 47% 56% 55% 53%
RT Range: 40%-64% Hab. Aide Range: 51%-57%
Page 114

STRATEGIC PERFORMANCE EXCELLENCE
C. Measure Name: Direct Patient Contact - Clinical Services
ResultsUnit Baseline 1Q2016 2Q2016 3Q2016 4Q2016 YTD
Target Percent of time spent
in direct patient contact.
35%March 2015
50% 50% 50% 50% 50%
Actual 33% 30% 37% 39% 35%
Provider range: 25%-48%
Page 115
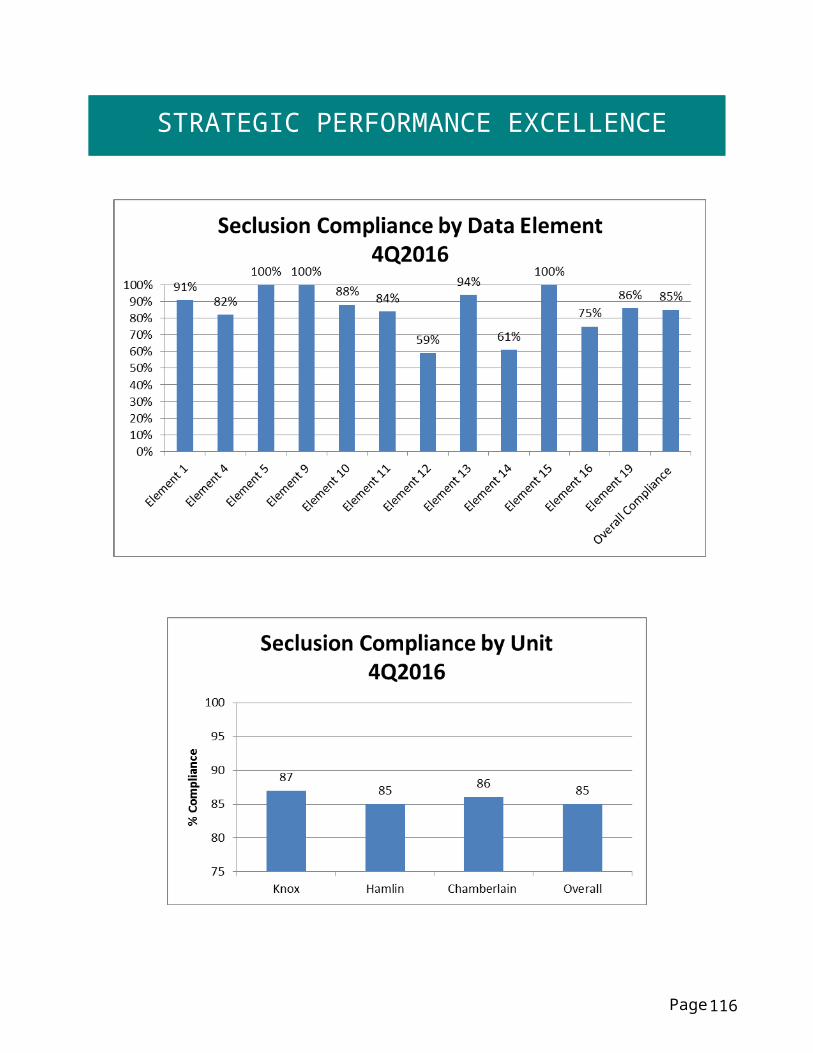
STRATEGIC PERFORMANCE EXCELLENCE
D. Measure Name: Direct Patient Contact- Ancillary Services (Dietician, Chaplain, Peer
Support, Treatment Habilitation Aide)
ResultsUnit Baseline 1Q2016 2Q2016 3Q2016 4Q2016 YTD
Target Percent of time spent
in direct patient contact.
31%March 2015
50% 50% 50% 50% 50%
Actual 28% 42% 46% 49% 41%
Provider range: 34%-59%
Page 116

STRATEGIC PERFORMANCE EXCELLENCE
Data Analysis: With the exception of Clinical Services, all disciplines are within two percentage points of reaching the targeted goal. All departments have improved from baseline despite adding non-direct care responsibilities throughout the year. Six out of twenty-two staff members were below 45 percent for the quarter. Action Plan: Requesting a weekly time study for providers achieving less than 45 percent direct patient contact for the quarter and discussing barriers and ways to re-prioritize time.
Page 117

STRATEGIC PERFORMANCE EXCELLENCE
II. Measure Name: Timely Assessment / Improving Health OutcomesMeasure Description: In order to receive effective treatment that will allow patients to return to a satisfying and meaningful life in their chosen community; staff must provide engagement, assessment and treatment that is targeted to meet their individual needs. The formal beginning to a treatment relationship begins with an assessment of strengths and needs to guide the treatment plan. At each treatment plan meeting staff is expected to come prepared to share their area of expertise and propose what treatment offerings they will make available to the patient. To best guide treatment, discipline specific assessments must be complete and available in the patient record. (Measure Effective February 2016)Type of Measure: Performance Improvement
Page 118

STRATEGIC PERFORMANCE EXCELLENCE
A. Therapeutic Recreation Evaluations completed by initial RTPGoal: All patients will have a therapeutic recreation evaluation in the record prior to the first treatment plan meeting.
Numerator: Recreation evaluations in the record by initial RTPDenominator: All initial RTP meetings held
Results
Unit Baseline 1Q2016 2Q2016 3Q2016 4Q2016 YTD
TargetPercent of
Initial Therapeutic Recreation
evaluations in the record prior to the initial RTP.
2Q201649%
N/A Baseline 90% 90% 90%
Actual N/A 49% 89% 92% 77%
B. Occupational Therapy Evaluations completed by initial RTPGoal: All patients will have an occupational therapy evaluation in the record prior to the first treatment plan meeting. (Measure Effective February 2016) Numerator: OT evaluations in the record by initial RTP Denominator: All initial RTP meetings held
ResultsUnit Baseline 1Q2016 2Q2016 3Q2016 4Q2016 YTD
TargetPercent of Initial OT
evaluations in the record prior to the initial RTP.
2Q201649%
N/A Baseline 90% 90% 90%
Actual N/A 49% 61% 95% 68%
Measures A and B have remained above 90% for three consecutive months and will now become Quality Assurance Measures.
Page 119

STRATEGIC PERFORMANCE EXCELLENCE
C. Substance Abuse AssessmentGoal: All patients will have a substance abuse assessment in the record within 7 calendar days of the referral. (Measure effective May 2016)
Numerator: Substance abuse assessments in record within 7 days of referralDenominator: All substance abuse assessment referrals received
Results
Unit Baseline 1Q2016 2Q2016 3Q2016 4Q2016 YTD
TargetPercent of Initial Substance Abuse assessments in
the record within 7 days of
referral
May-June201650%
N/A N/A N/A N/A N/A
Actual N/A N/A N/A N/A N/A
D. Occupational Therapy – Issue Specific EvaluationGoal: All patients will have an OT – Issue Specific Evaluation (example: physical rehabilitation, sensory or living skills, etc.) in the record within 10 calendar days of the referral. (Measure Effective May 2016) Numerator: OT - Issue Specific Evaluation in the record within 10 days of referral Denominator: All OT - Issue Specific Evaluation referrals received
ResultsUnit Baseline 1Q2016 2Q2016 3Q2016 4Q2016 YTD
TargetPercent of Initial
OT – Issue Specific
evaluations in the record
within 10 days of referral
May-June201683%
N/A N/A N/A N/A N/A
Actual N/A N/A N/A N/A N/A
E. Psychology Goal: All patients will have a psychology assessment in the record within 30 calendar days of the referral. (Measure Effective May 2016) Numerator: Psychology assessments in the record within 30 days of referral Denominator: All psychology assessment referrals received
Page 120

STRATEGIC PERFORMANCE EXCELLENCE
ResultsUnit Baseline 1Q2016 2Q2016 3Q2016 4Q2016 YTD
TargetPercent of Initial
Psychology assessments in
the record within 30 days of
referral
May-June201683%
N/A N/A N/A N/A N/A
Actual N/A N/A N/A N/A N/A
F. Vocational AssessmentGoal: All patients will have a vocational assessment in the record within 7 calendar days of the referral. (Measure effective May 2016)
Numerator: Vocational assessments in the record within 7 days of referralDenominator: All vocational assessment referrals received
Results
Unit Baseline 1Q2016 2Q2016 3Q2016 4Q2016 YTD
TargetPercent of Initial
Vocational assessments in
the record within 7 days of
referral
May-June2016100%
N/A N/A N/A N/A N/A
Actual N/A N/A N/A N/A N/A
G. Competency Restoration Evaluations completed by initial RTPGoal: All patients will have a competency restoration evaluation in the record prior to the first treatment plan meeting. (Measure effective May 2016)
Numerator: Competency restoration evaluations in the record by initial RTPDenominator: All Initial RTP meetings held
Results
Unit Baseline 1Q2016 2Q2016 3Q2016 4Q2016 YTD
TargetPercent of
Competency Restoration
May-June2016100%
N/A N/A N/A N/A N/A
Page 121

STRATEGIC PERFORMANCE EXCELLENCE
evaluations in the record prior to the initial RPT
Actual N/A N/A N/A N/A N/A
Data Analysis: OT/RT initial evaluation timeliness continues to improve, now meeting the target. Baseline data for other evaluations varies and is inconsistent due to the low number of referrals in the baseline sample.
Action Plan: Address provider performance issues individually Continue monitoring and clarifying the expectation and priority to focus on timely
evaluations.
Page 122