declarationebe.uonbi.ac.ke/sites/default/files/cae/engineering/ebe... · web viewcontains soap...
TRANSCRIPT

UNIVERSITY OF NAIROBI
SCHOOL OF ENGINEERING
DEPARTMENT OF BIOSYSTEMS ENGINEERING
ENGINEERING DESIGN PROJECT
DESIGN OF A GREYWATER TREATMENT AND RECYCLING
SYSTEM FOR THE COLLEGE OF AGRICULTURE AND
VETERINARY SCIENCES, UNIVERSITY OF NAIROBI.
NAME OF STUDENT: BUNDI RICHARD ONDICHO
REG NO: F21/1993/2013
SUPERVISOR : MR. GIBSON MUTULI
SUBMITTED TO : MR. ALBERT INIMA
Report submitted in partial fulfillment of the requirements for the degree of Bachelor of Science in Biosystems Engineering
JUNE 2018
i | P a g e

DECLARATIONThis project is my work and has not been presented for any degree in any other university.
_____________________ ________________________SIGNATURE DATE
BUNDI RICHARD ONDICHOSTUDENT
This project has been submitted for the examination with my approval.
________________________ ___________________________SIGNATURE DATE
MR. GIBSON MUTULISUPERVISOR
ii | P a g e

ABSTRACTThe College of Agriculture and Veterinary Science, University of Nairobi, is home to 2, 783
students as of the current statistics. The campus is located off Kapenguria Road, 15 kms to the
Northwest of Nairobi. Within the hostel residences, most, if not all of the waste water generated
from various uses within is simply directed away into the sewerage system. With water costs
rising by the day due its scarcity along with the dynamics of demand and supply, there is a
clarion call to find ways of utilizing the water resources present.
This project proposes a grey water treatment system that will provide treated and recycled water
fit for reuse in generation of Blackwater through flushing of toilets and cleaning of the hostels,
and after further treatment, could be clean enough for irrigation purposes and washing of
laundry. The grey water recycling system components are designed and they consist of:
Diversion system, piping system, filtration system, storage system and the pumping system.
They various systems were tested on the EPANET software and it proved successful.
The study begins with the introduction, objectives set to be met, and the literature review
together with the theoretical frame work highlighted. The methodology, data collected, results
and analysis are discussed within. Finally, the conclusions recommendation and design drawings
are provided.
The findings of the project are compiled in this report.
iii | P a g e

ACKNOWLEDGEMENTSThis project completion would have been impossible without the assistance of a number of
persons to whom I would like to express my sincere gratitude.
First and foremost, I would like to thank God through whom all things worked together from the
first day till the date of completion. Through my church, Mamlaka Hill Chapel, I found the
strength to overcome disappointments and hardships, and for that, I say thank you.
Secondly, I am indebted to my supervisor, Mr. Gibson Mutuli, who believed in me, and through
minimum supervision and his availability for consult and guidance, suggestions, comments and
encouragement throughout the period and completion of this study, whether solicited or
unsolicited, made this a worthwhile learning experience.
Thirdly, I would also like to express my gratitude to my classmates, special mention to Paul
Vitalis, Mary Wacera and Elizabeth Wanjiru, who were always around to support and encourage
whether in speech or conduct.
Finally, and not least, I would like to thank my family who has been supportive in this regard as I
come to the conclusion of five years of extended hard work. Thank you all for your prayers.
iv | P a g e

Table of ContentsDECLARATION.............................................................................................................................................. ii
ABSTRACT................................................................................................................................................... iii
ACKNOWLEDGEMENTS............................................................................................................................... iv
LIST OF FIGURES.......................................................................................................................................... ix
LIST OF TABLES.............................................................................................................................................x
LIST OF EQUATIONS....................................................................................................................................xi
1.0 INTRODUCTION.....................................................................................................................................1
1.1 Background Information....................................................................................................................1
1.2 Problem Statement............................................................................................................................2
1.3 Hypothesis.........................................................................................................................................3
1.4 Site Analysis and Inventory................................................................................................................3
1.5 Objectives..........................................................................................................................................3
1.6 Statement of Scope...........................................................................................................................4
2.0 LITERATURE REVIEW..............................................................................................................................5
2.1 Grey Water........................................................................................................................................5
2.2 Potential of Grey water Reuse...........................................................................................................6
2.3 Benefits of Grey Water Treatment....................................................................................................7
2.4 Quantification of grey water..............................................................................................................9
2.4.1 Direct Method.............................................................................................................................9
2.4.2 Indirect Method........................................................................................................................10
2.5 Greywater Treatment......................................................................................................................10
2.5.1 Primary treatment....................................................................................................................11
2.5.2 Secondary treatment................................................................................................................12
2.5.3 Tertiary treatment....................................................................................................................12
2.6 Components of a Greywater Treatment System.............................................................................13
2.6.1 Diversion System......................................................................................................................13
2.6.2 Piping System............................................................................................................................13
2.6.3 Filtration Unit............................................................................................................................13
2.6.4 Delivery and Storage System....................................................................................................14
2.6.5 Pumping Unit............................................................................................................................14
3.0 THEORETICAL FRAMEWORK................................................................................................................15
v | P a g e

3.1 Grey water.......................................................................................................................................15
3.1.1 Biochemical Oxygen Demand (BOD).........................................................................................16
3.1.2 Site selection.............................................................................................................................17
3.1.3 Head Loss..................................................................................................................................17
3.1.4 The Pump characteristics...................................................................................................19
3.1.6 Sizing of conveyance pipes.......................................................................................................20
3.1.7 Design of storage tank..............................................................................................................21
3.1.8 Tank Loadings..........................................................................................................................23
4.0 GENERATION OF CONCEPT DESIGN.....................................................................................................25
5.0 METHODOLOGY...................................................................................................................................26
5.1 Study area........................................................................................................................................26
5.1.1 Location....................................................................................................................................26
5.1.2 Land Cover................................................................................................................................27
5.1.3 Topography...............................................................................................................................27
5.1.4 Water supply system................................................................................................................27
5.2. Data Collection...............................................................................................................................27
5.2.1. Water Consumption Data........................................................................................................27
5.3. Design.............................................................................................................................................27
5.3.1. Design of the diversion system................................................................................................27
5.3.2. Filtration and Treatment System.............................................................................................28
5.3.3. Delivery and Storage System...................................................................................................28
5.3.4. Overall Design Layout..............................................................................................................28
6.0 RESULTS AND ANALYSIS.......................................................................................................................29
6.1. Water Consumption Data...............................................................................................................29
6.1.1 Consumption in Mandela Hostel..............................................................................................29
6.1.2 Consumption in Wakulima Hostel.............................................................................................30
6.1.3 Consumption in Tana C Hostel..................................................................................................32
6.2. Diversion System............................................................................................................................33
6.2.1. Piping.......................................................................................................................................33
6.2.2. Junction Chamber....................................................................................................................33
6.3. Filtration and Treatment System....................................................................................................34
6.3.1. Screen......................................................................................................................................34
6.3.2. Equalization or Settling Tank....................................................................................................34
vi | P a g e

6.3.3 Filtration Unit............................................................................................................................36
6.3.4 Disinfection...............................................................................................................................37
6.4. Collection / Storage Tank................................................................................................................38
6.4.1. Material...................................................................................................................................38
6.4.2. Shape and Position..................................................................................................................38
6.4.3. Dimensions of the storage tank...............................................................................................39
6.5. Pumping and Piping System............................................................................................................40
6.5.1. Pipes........................................................................................................................................40
6.5.2. Pumps......................................................................................................................................40
...............................................................................................................................................................42
6.6 Cost Benefit Analysis........................................................................................................................42
6.7 Schematic design of a Grey water recycling system........................................................................44
6.8. Water Quality Monitoring..............................................................................................................45
6.8.1. Odor Control............................................................................................................................45
6.9. Maintenance of Greywater Treatment System..............................................................................46
7.0 CONCLUSION.......................................................................................................................................47
8.0 RECOMMENDATION............................................................................................................................48
9.0 REFERENCES........................................................................................................................................49
10.0 APPENDICES.......................................................................................................................................51
vii | P a g e
LIST OF FIGURESFigure 1: General Greywater Treatment scheme.......................................................................................................12Figure 2: Aerial map photography of University of Nairobi, College of Agriculture and Veterinary Sciences.............26Figure 3: Equalization Chamber.................................................................................................................................35Figure 4: Filtration unit..............................................................................................................................................37Figure 5: Storage Tank...............................................................................................................................................40Figure 6: Pump...........................................................................................................................................................42Figure 7: Final schematic diagram.............................................................................................................................44
viii | P a g e

LIST OF TABLESTable 1: Common methods of treatment in greywater systems (adapted from Center for the Study of the Built Environment, 2003; Morel & Diener, 2006; Ridderstolpe, 2004; WHO, 2006; Ottosson, 2003)..................................10Table 2: Characteristics for kitchen, bathroom and laundry greywater (adapted from Morel & Diener, 2006; Murphy, 2006; Casanova et al., 2001a).....................................................................................................................15Table 3: Average volume of water consumed in a day in Mandela Hostel.................................................................29Table 4: Average volume of water consumed in a day in Wakulima Hostel...............................................................30Table 5: Average volume of water consumed in a day in Tana C Hostel....................................................................32Table 6: Design criteria for an equalization chamber.................................................................................................35Table 7: Pumping Characteristics...............................................................................................................................41
ix | P a g e

LIST OF EQUATIONSEquation 1: BOD Calculation......................................................................................................................................16Equation 2: Darcy equation 1.....................................................................................................................................17Equation 3: Darcy Equation 2.....................................................................................................................................18Equation 4: Hazen Williams Equation 1.....................................................................................................................18Equation 5: Hazen Williams Equation 2.....................................................................................................................18Equation 6: Manning's Formula 1..............................................................................................................................19Equation 7: Manning's Formula 2..............................................................................................................................19Equation 8: Bernoulli's Energy Equation.....................................................................................................................20Equation 9: Calculation of Head.................................................................................................................................20Equation 10: Pipe size calculation..............................................................................................................................20Equation 11: Maximum Base Pressure.......................................................................................................................21Equation 12: Minimum Base Pressure........................................................................................................................21Equation 13: Total Horizontal pressure......................................................................................................................22Equation 14: Factor of Safety.....................................................................................................................................22
x | P a g e
1.0 INTRODUCTION
1.1 Background Information
Water, as has been defined by many a range of humanity, is life. All other definitions pale in
comparison to this, for indeed without water, life as we know it would struggle to survive, albeit,
barely. It is a priceless natural resource with its existence difficult to ignore as it covers 71% of
the earth’s surface. Its influence goes as far as to influence everybody’s health, education, life
expectancy, well-being and social development.
As fresh water supplies decline and become more expensive in many areas of the country,
inclusive of major town centers such as Nairobi, using water once and then ‘throwing it away’ is
becoming too costly and less feasible, both financially and practically. Consequent to rapid
growth in population and increasing water demand, stress on water resources in Kenya is
increasing and per capita water availability is reducing day by day. Hence, the growing needs to
substitute precious drinking water in applications which do not require drinking water quality.
Disposal of water after use has led to various hazardous consequences due to mishandling of
sewage water formed and sometimes released into the environment without proper treatment
probably due to an overload in wastewater treatment facilities, or lack thereof. This has caused
an issue with public health and sanitation with an increase in spread of water borne diseases,
with some succumbing to the illnesses thus propagated.
Greywater is generally defined as all wastewater generated from household activities except that
produced from the toilet and the kitchen sink. Wastewater from the toilet, contaminated with
fecal matter and urine is called Blackwater.
1 | P a g e
Greywater often contains valuable nutrients for gardening and irrigation and as a consequence
there is no need to buy expensive mineral fertilizer. Another important fact is that people feel
more responsible of their treatment system when it is decentralized and may pay more attention
to the issue of greywater management.
The idea of removing the less-concentrated greywater from the home’s waste stream is attractive
to engineers and homeowners alike as a way to reduce waste load and prolong the life of the
system, all whilst increasing the efficiency of water use and expanding the usefulness of
alternative sources of water previously considered unusable.
This project will focus on greywater treatment within a University campus setting and its use as
an alternative water supply for restricted irrigation at a nearby farm, as well as other relevant
uses.
1.2 Problem StatementThe University of Nairobi Upper Kabete campus currently relies on clean pumped water, same
as is supplied for domestic and commercial use within the University campus area. Wastewater
produced from these activities is quickly disposed of in the sewerage system which would have
been rendered better economic use had it been channeled for various other auxiliary purposes.
The piping system has not been altered in the recent past. Therefore, there is much stress on
water supply to adequately and constantly meet the daily needs of both the inhabitants, and crops
being grown for consumption and study.
Moreover, the current distance of supplying water for irrigation to Upper Kabete farm is around
2km from the source with an elevation difference of more than 70m, with the current cost of
operating the existing irrigation system being approximately Sh. 200,000 per month for power
2 | P a g e
consumption alone excluding labor and routine maintenance and repair of the pipeline. All these,
and more, have contributed to the low productivity of the farm.
Hence, there is need to find alternative sources of water to be used for the various domestic and
commercial purposes within the campus inclusive of restricted irrigation which will help reduce
the strain on water supply as well as the total overhead cost of supply that would in the end
enhance efficiency of water use.
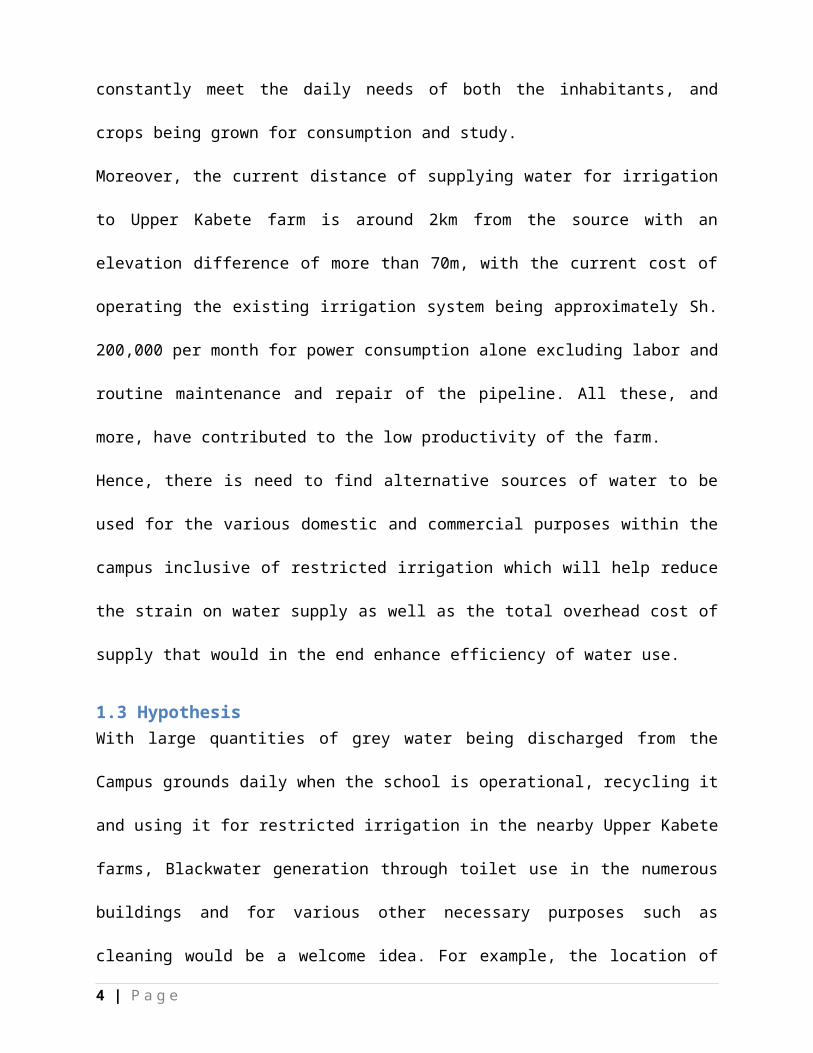
1.3 HypothesisWith large quantities of grey water being discharged from the Campus grounds daily when the
school is operational, recycling it and using it for restricted irrigation in the nearby Upper Kabete
farms, Blackwater generation through toilet use in the numerous buildings and for various other
necessary purposes such as cleaning would be a welcome idea. For example, the location of the
farm is at a lower elevation vis-a-vis the nearing building, Mandela Hostel, hence allows
gravitational flow of the grey water from the nearby hostel.
If adopted, the system will provide an alternative and modernized way of utilizing water and will
go a long way in minimizing rates.
1.4 Site Analysis and InventoryThe case study for this project is based on the College of Agriculture and Veterinary Sciences of
the University of Nairobi. It is situated in Upper Kabete, Uthiru, off Waiyaki way into
Ndumboini area, generally off Kapenguria Road, 14 kms to the Northwest of Nairobi.
1.5 ObjectivesThe Overall Objective is to design a multipurpose grey water recycling system for the College of
Agriculture and Veterinary Sciences, University of Nairobi for both irrigation and residential
use.
The following are the specific objectives:
3 | P a g e
To identify pertinent design parameters for the design of the grey water recycling system.
To determine the quality and quantity of grey water.
To design the various system components for the grey water recycling system.
To determine the Bill of Quantities of the project.
1.6 Statement of Scope.This project involves the design of a grey water recycling system for the College of Agriculture
and Veterinary University of Nairobi for residential and miscellaneous use.
4 | P a g e
2.0 LITERATURE REVIEW
2.1 Grey Water Grey water arises from domestic washing operations. Sources include waste from hand basins,
kitchen sinks and washing machines, but specifically exclude black water from toilets, bidets and
urinals (Jefferson et al., 2001).
However, wastewater from kitchen sinks and dish washing is sometimes excluded from
greywater sources due to the potential of introducing microbial contaminants and/ or oils and
greases that would negatively impact the receiving environment (TOWTRC, 2003). But in most
sources kitchen wastewater is also contained in greywater.
Several issues emerge with grey water. Case in point, first, is reuse with or without simple
treatment (Al-Jayyousi, 2002). Second is recycling for indoor use, such as flushing toilets,
washing clothes, and bathing (Bingley, 1996), and for outdoor use, such as irrigating domestic
gardens, lawns on college campuses, athletic fields, cemeteries, parks and golf courses; washing
vehicles and windows; extinguishing fires; feeding boilers; developing and preserving wetlands;
and recharging groundwater. Third, standards are mainly related to health and social aspects in
order to improve the control of the recycling process (Cui & Ren, 2005) Fourth is the obtaining
of affordable treatment technologies to cope with the quantity and quality variation of grey water
sources (Eriksson et al., 2002), and the recycling requirements. A wide range of treatment
technologies have been applied and examined for grey water and considering one or more of the
grey water issues, producing effluents with different qualities. In this review, therefore, we
examine various grey water treatment technologies with the aim of coming up with an efficient,
simple, and affordable treatment system with safe effluent for use. A treatment system is
considered efficient if it produces the required effluent quality, simple in operation with a
minimum maintenance, and affordable due to its low energy consumption and low operational
5 | P a g e

and maintenance costs. Safe effluent refers to a situation where the possibility of pathogens
regrowth is minimal. The issues considered in the selection of grey water treatment systems are
grey water characteristics, used standards, technology performance, and costs.
2.2 Potential of Grey water ReuseWhereby large amounts of greywater are generated, reuse is more viable and economical as
compared to disposing of it while consuming more of clean water.
However it should be noted that Greywater is different from fresh water and requires different
guidelines for it to be reused. A few of the guidelines include:
Restriction of storage of greywater to not more than 24 hours. Once stored beyond
this timeline, the nutrients within it will start to break down, resulting in pathogenic
organisms and bad odor.
Minimizing of contact with greywater. Potentially greywater could contain a pathogen
if organisms from Blackwater seeped into the water. Hence, ones system should be
designed for the water to soak into the ground and not be available for people or animals
to drink.
Prevention pooling or runoff of the greywater produced. Knowledge of the
percolation or infiltration rate of the greywater into the soil will help with proper design.
Pooling greywater can provide mosquito breeding grounds, as well as a place for human
contact with greywater.
Simplification of the system employed in transmission of the greywater in a manner
that would reduce frequency of maintenance.
Installation of a multi-way valve for easy switching between the greywater system and
the sewer/septic system delivering Blackwater from the toiletry system.
6 | P a g e
Reuse of the greywater will serve the purpose of reducing the amount of freshwater utilized for
various functions whilst minimizing the amount of sewage generation. The quantity and quality
of greywater will in part determine how it can be reused.
Greywater can be recycled for reuse in the following ways:
Irrigation
Construction processes
Toilet flushing
Gardening
Car washing
Washing clothes
Floor cleaning
2.3 Benefits of Grey Water Treatment Recycling grey water not only reduces the consumption of water, it also reduces the volume of
water discharged into the sewerage system hence the amount of pollutants flowing into water
systems and rivers as less greywater would need commercial treatment. The overall effect on the
common consumer with water meters would be saving of money on both their water supply and
wastewater bills.
Ecological benefits of grey water recycling are also part of the positive consequences that
emanate and could be summarized as follows (Egyptian- German Private Sector Development
Programme, August, 2011):
Lowering use of fresh water Grey water can substitute fresh water in numerous instances, saving money and increasing the
effective water supply in regions where irrigation is needed. Residential water use is almost
7 | P a g e

evenly split between indoor and outdoor demands. All except toilet water could be recycled
outdoors, achieving the same result with significantly less water diverted from nature.
Less strain on septic tank or treatment plant Grey water use greatly extends the useful life and capacity of septic systems for municipal
treatment system by decreasing the wastewater flow which in turn means higher treatment
effectiveness and lower treatment cost.
Less energy and chemical use Less energy and chemicals are used due to the reduced amount of both freshwater and
wastewater that needs pumping and treatment. For those providing their own water or electricity,
the advantage of a reduced burden on the infrastructure is felt directly. Also, treating your
wastewater in the soil under your own fruit trees definitely encourages you to dump fewer toxic
chemicals down the drain.
Highly effective purification Grey water is purified to a spectacularly high degree in the upper, most biologically active region
of the soil. This protects the quality of natural surface and ground waters.
Groundwater recharge Grey water application in excess of plant needs recharges groundwater.
Plant growth Grey water enables a landscape to flourish where water may not otherwise be available to
support much plant growth.
Reclamation of otherwise wasted nutrients Loss of nutrients through wastewater disposal in rivers or oceans is a subtle, but highly
significant form of erosion. Reclaiming nutrients in grey water helps to maintain the fertility of
the land.
8 | P a g e
2.4 Quantification of grey waterIn the design of greywater collection, treatment and reuse system, determination of greywater
generation and flow rate is the first requirement. Reliable data on existing and projected flow rate
must be available for the cost-effective greywater treatment system design.
The following methods are proposed for quantification of greywater:
2.4.1 Direct Method
I. Water Meter
At the outlet of the drain connecting bathrooms, kitchen and cloth washing place (laundry), a
meter is provided. Nevertheless, if not possible, the meter can be placed at the inlet of the
greywater collection tank which can be connected to the bathroom, kitchen and laundry.
Small plumbing modification in the piping system will allow collection of greywater which can
be easily measured. This system can be fitted in residential schools where variation in greywater
quantity is not expected.
II. Bucket Method
Greywater is collected in a bucket of known volume at the outlet of the bathroom, laundry or
kitchen. It is cheap and suitable where greywater quantity remains almost constant for a
substantial period of time. However, the method is manual and precautions are required to
prevent any human contact with greywater. The method is described below:
Identify outlet
Keep a 20 liter bucket at outlet of bathroom and laundry
Start stop watch and measure time for filling of 20 liter bucket
Measure during 24 hour cycle
Measure once per month
Measure only during February, March and April
9 | P a g e
Find out average value of greywater per day
2.4.2 Indirect MethodGreywater quantity is about 50-60% of total water consumption. The quantity of water consumed
can also be used to quantify greywater. Indirect method also includes correlation between a
variable and greywater generation. A correlation is developed between number of students in the
hostel and greywater generation based on the data collected.
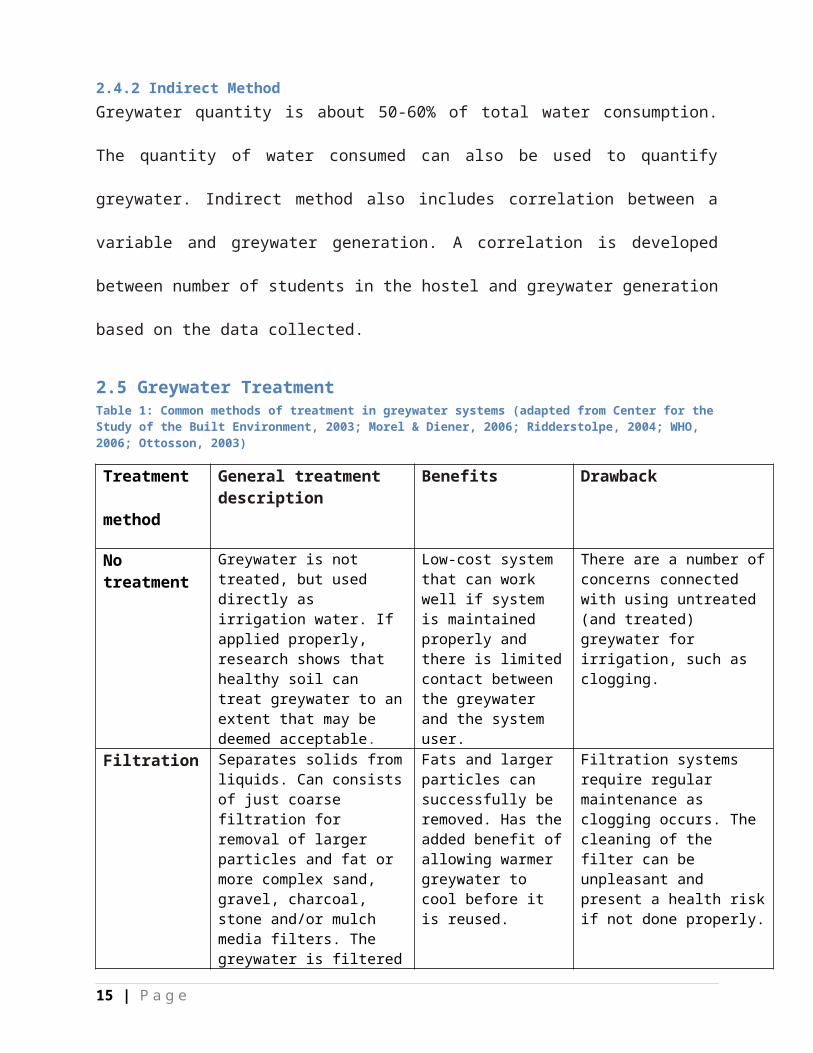
2.5 Greywater TreatmentTable 1: Common methods of treatment in greywater systems (adapted from Center for the Study of the Built Environment, 2003; Morel & Diener, 2006; Ridderstolpe, 2004; WHO, 2006; Ottosson, 2003)
Treatment
method
General treatment description
Benefits Drawback
No treatment Greywater is not treated, but used directly as irrigation water. If applied properly, research shows that healthy soil can treat greywater to an extent that may be deemed acceptable.
Low-cost system that can work well if system is maintained properly and there is limited contact between the greywater and the system user.
There are a number of concerns connected with using untreated (and treated) greywater for irrigation, such as clogging.
Filtration Separates solids from liquids. Can consists of just coarse filtration for removal of larger particles and fat or more complex sand, gravel, charcoal, stone and/or mulch media filters. The greywater is filtered through the chosen media, which removes particles from the wastewater.
Fats and larger particles can successfully be removed. Has the added benefit of allowing warmer greywater to cool before it is reused.
Filtration systems require regular maintenance as clogging occurs. The cleaning of the filter can be unpleasant and present a health risk if not done properly.
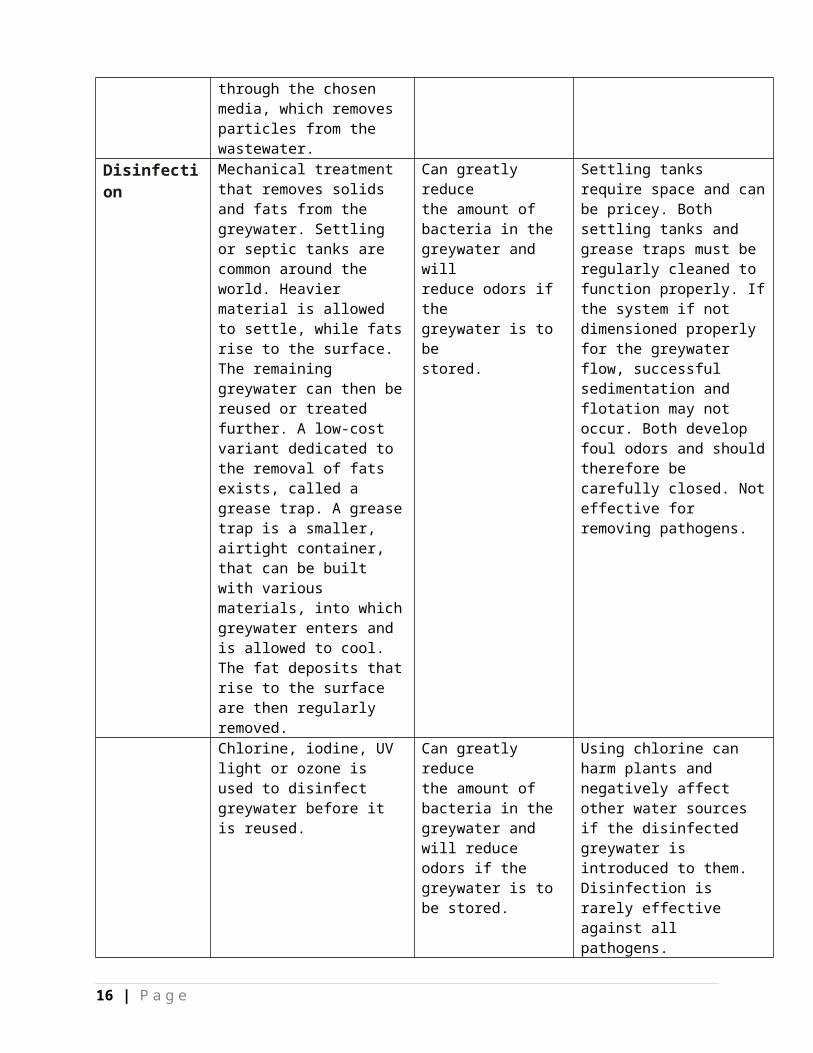
Disinfection Mechanical treatment that removes solids and fats from the greywater. Settling or septic tanks are common around the world. Heavier material is allowed to settle, while fats rise to the surface. The remaining greywater can then be reused or treated further. A low-cost variant dedicated to the removal of fats exists, called a grease trap. A grease trap is a smaller, airtight container, that can be built with various materials, into which greywater enters and
Can greatly reducethe amount ofbacteria in thegreywater and willreduce odors if thegreywater is to bestored.
Settling tanks require space and can be pricey. Both settling tanks and grease traps must be regularly cleaned to function properly. If the system if not dimensioned properly for the greywater flow, successful sedimentation and flotation may not occur. Both develop foul odors and should therefore be carefully closed. Not effective for removing pathogens.
10 | P a g e
is allowed to cool. The fat deposits that rise to the surface are then regularly removed.Chlorine, iodine, UV light or ozone is used to disinfect greywater before it is reused.
Can greatly reducethe amount ofbacteria in the greywater and will reduce odors if the greywater is to be stored.
Using chlorine can harm plants and negatively affect other water sources if the disinfected greywater is introduced to them. Disinfection is rarely effective against all pathogens.
A number of technologies have been applied for greywater treatment worldwide varying in both
complexity and performance (al., 2004) as shown in the table above.
Greywater is treated before reuse to make it safer for the environment and for the users in the
household that is consuming food irrigated with greywater. Depending on the characteristics of
the greywater, the treatment can specifically target the removal of pathogens, organic pollutants
and/or trace metals. Treatment can generally be divided into three categories: Primary,
Secondary and Tertiary treatment.
Primary treatment is used to remove larger particle and fats from the greywater, which helps to
reduce clogging in a system. Secondary treatment is used to remove pathogens, dissolved
organic matter and other pollutants in greywater. The level of treatment necessary depends on
the type of system, the environment around the system and the characteristics of the greywater,
as well the risk for human exposure (Asano & Smith, 1985).
2.5.1 Primary treatmentIn primary treatment system, a sedimentation tank is used to coarsely screen out oils/greases and
solids prior to reuse. This system is recognized as an economically attractive option for
greywater reuse because it requires minimal maintenance, and chemicals.
Mostly involves screening and equalization
11 | P a g e

2.5.2 Secondary treatmentIn secondary treatment system, Chemical and Biological treatment process are used to remove
most of the organic matter. This reduces health risk at end use with human contact and provides
additional safety for reuse. This system is generally more expensive, due to the initial
establishment costs associated with the further treatment needs and the periodic maintenance
costs.
Mostly involves Gravel filtration, Sand filtration and chlorination.
2.5.3 Tertiary treatmentTertiary treatment processes further improves the quality of greywater or polish it for reuse
applications. Fixed film biological rotating drums, membrane bioreactors, biologically aerated
filters, activated sludge and membrane treatment systems are all included in this category.
Whilst utilized on larger scales for more general effluent applications, the other tertiary treatment
technologies mentioned lack sufficient studies into greywater applications and current literature
indicates that costs are high (Al-Jayyousi, 2003).
A potential treatment scheme is as shown below:
12 | P a g e
Raw Greywater
Treated grey water
Secondary treatment
Gravel filter Sand filter
Tertiary treatment
Broken brick Charcoal Chlorination
Primary treatment:
Equalization tank
Figure 1: General Greywater Treatment scheme

2.6 Components of a Greywater Treatment System
2.6.1 Diversion SystemA diversion system is used to convey the grey water away from the sewers. A fully engineered
system will incorporate a sump tank and surge tanks. A simple plumbing device diverts
greywater in the wastewater drainage line to a junction chamber for recycling.
These systems do not store or treat greywater and as such are best to reuse greywater for sub-
surface applications.
2.6.2 Piping SystemCombined wastewater is usually conveyed in 7.5 to 10 cm of pipes in residential areas. Since
grey water carries some solids, most of the solids tend to scrap the bottom of the pipe in bigger
pipe sizes, while small diameter pipes tend to get clogged. Therefore, medium pipe sizes are
preferred to either large or small diameter sizes.
2.6.3 Filtration UnitThe type of filter required for a greywater system depends largely upon the amount of greywater
to be filtered, the type of contaminants present and end use. A drain filter is an easy and
inexpensive way to filter lint and hair out of bath or laundry water. A simple cloth bag tied over
the end of a bathroom pipe may be sufficient for irrigating outdoors or similar applications.
Filtration is one of the most important operations in the greywater purification process (Wright,
1986).
Though screening and sedimentation process remove a large proportion of suspended matter,
they do not effectively remove fine flock particles, color, dissolved minerals and
microorganisms. In filtration, water is passed through a filter medium in order to remove the
particulate matter not previously removed by sedimentation. During filtration, the turbidity and
colloidal matter of non-settleable type protozoan cysts and helminth eggs are also removed. It is
13 | P a g e

to be mentioned that protozoa are stopped in the gravels, the bacteria by the medium gravel and
the viruses by the sand. (Wright, 1986).
2.6.4 Delivery and Storage SystemGrey water may be stored in tanks of different materials e.g. concrete tanks, steel tanks, fiber
glass tanks, plastic tanks or site built tanks. After storage, the water is delivered to various units
like cistern tanks and irrigation outlets. The storage tank is should be a concrete tank given that
treatment is done. Chlorine is added to the recycled water to treat it and remove bad odor and
hence the tank needs to be strong enough to with stand constant movement and wear and tear.
2.6.5 Pumping UnitEfficient centrifugal pumps are ideal where water requirements are substantial and only single-
phase power, and sufficient power available. These are normally low cost balanced and with
rigged construction. It has no centrifugal switch, require less operational and maintenance cost
with no air lock.
14 | P a g e
3.0 THEORETICAL FRAMEWORK
3.1 Grey waterCommon sources of greywater include water from the kitchen, bathroom and laundry systems.
Water from these sources normally does not transport pathogenic organisms that could cause
diseases or harm to those with whom come into contact with it. Their characteristics are as
displayed in the table below.
Table 2: Characteristics for kitchen, bathroom and laundry greywater (adapted from Morel & Diener, 2006; Murphy, 2006; Casanova et al., 2001a)
Greywater Source Common Characteristic
Kitchen Contains high amounts of fats, foods, and detergents,
resulting in high concentrations of suspended solids and
nutrients. Kitchen greywater often contains elevated
concentrations of fecal coliform and Escherichia coli,
possibly due to bacteria introduced from raw meats
and/or the availability of high concentrations of organic
matter, which promotes microorganism growth.
Dishwashing water often contains high concentrations of
salts, suspended solids and organic matter. Often
categorized as being the greywater of poorest quality.
Laundry Contains soap products and bleach, as well as other
byproducts from washing clothes, such as oils and
fibers. Can contain feces if cloth diapers or feces soiled
clothes are washed. Can contain varying amounts of
sodium, boron and other chemicals depending on the
soaps used.
Bathroom Contains soap products, as well as byproducts from
showering and washing bodies, such as hair and fats.
Can contain varying amounts of feces. Often considered
to have the highest quality.
Nevertheless, this water needs to undergo recycling and treatment to remove the solid matter,
soap remains and also to kill any bacteria present in the water. For this to be achieved, the BOD5
15 | P a g e
of the water needs to be empirically calculated to determine the content of oxygen present in the
water and its expected effect to the grey water.
The following are some of the theoretical frameworks that require critical analysis for the
success of this project:
3.1.1 Biochemical Oxygen Demand (BOD)This is a chemical procedure for determining the amount of dissolved oxygen needed by
aerobic biological organisms in a body of water to break down organic material present in a
given water sample at certain temperature over a specific time period. It is not a precise
quantitative test, although it is widely used as an indication of the organic quality of water. It is
most commonly expressed in milligrams of oxygen consumed per liter of sample during 5 days
(BOD5) of incubation at 20°C and is often used as a robust surrogate of the degree of organic
pollution of water.
The greater the BOD, the more rapidly oxygen is depleted in the stream. This means less oxygen
is available to higher forms of aquatic life. The consequences of high BOD are the same as those
for low dissolved oxygen: aquatic organisms become stressed, suffocate, and die.
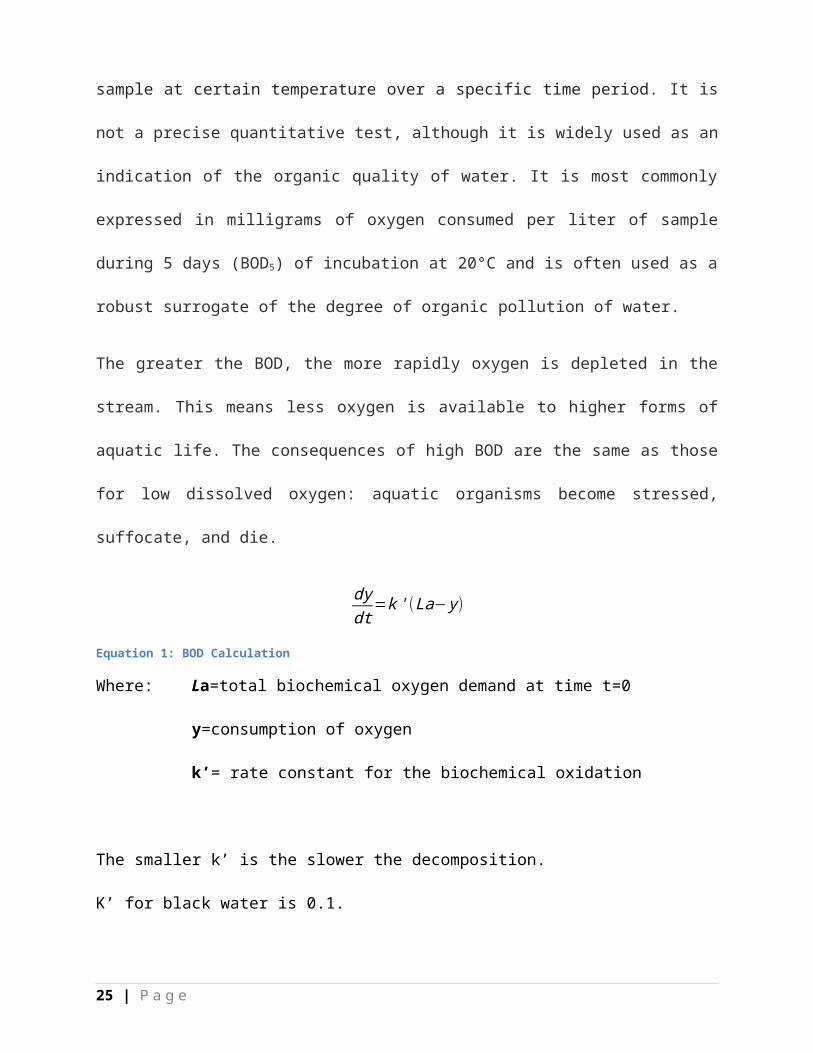
dydt
=k ' (La− y )
Equation 1: BOD Calculation
Where: La=total biochemical oxygen demand at time t=0
y=consumption of oxygen
k’= rate constant for the biochemical oxidation
The smaller k’ is the slower the decomposition.
K’ for black water is 0.1.
16 | P a g e
3.1.2 Site selectionWhilst assessing sites viable for the construction of a greywater recycling and treatment system,
the following are important to consider:
Approximate size of 15 - 20 m land within the campus for reuse system.
Topography and natural slope: The topography of the sites and contours can be
established using standard surveying procedures. The slope of the site is an important
factor in controlling surface ponding, runoff and erosion. A minimum of 2% slope of area
is recommended.
Soil type: Soil type and properties are key factors in the design and operation of
greywater reuse systems. The main characteristics necessary for the evaluation of the soil
for the purpose of greywater reuse are soil structure, soil texture, infiltration rate through
top soil, corrosiveness, submergence, and percolation rate in the sub-strata.
3.1.3 Head LossWhen fluid flows inside a pipeline, friction occurs between the moving fluid and the stationary
pipe wall. This friction converts some of the fluid’s hydraulic energy to thermal energy. This
thermal energy cannot be converted back to hydraulic energy, so the fluid experiences a drop in
pressure. This conversion and loss of energy is known as head loss. The head loss in a pipeline
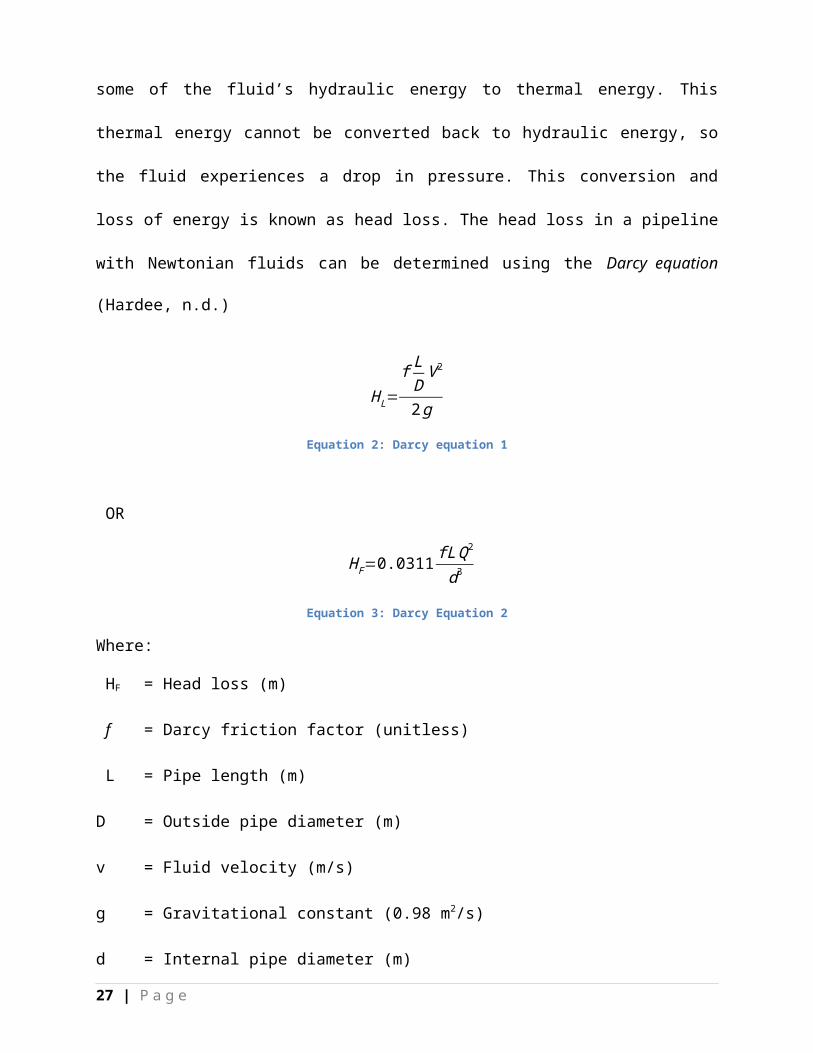
with Newtonian fluids can be determined using the Darcy equation (Hardee, n.d.)
H L=f L
DV 2
2g
Equation 2: Darcy equation 1
OR
17 | P a g e
H F=0.0311 fLQ2
d3
Equation 3: Darcy Equation 2
Where:
HF = Head loss (m)
f = Darcy friction factor (unitless)
L = Pipe length (m)
D = Outside pipe diameter (m)
v = Fluid velocity (m/s)
g = Gravitational constant (0.98 m2/s)
d = Internal pipe diameter (m)
Q = Volumetric flow rate (m3/s)
It can also be determined through the Hazen Williams Equation.
H f =6.78 Ld1.165 ¿
Equation 4: Hazen Williams Equation 1
OR
V=0.355Cd0.63¿
Equation 5: Hazen Williams Equation 2
Where:
Hf = Head loss through friction
L = Length of pipe
d = Internal pipe diameter
V = Average velocity18 | P a g e
Cd= Coefficient value based on type and diameter of pipe.
However, where a pipeline has many fittings, the Manning’s formula is most appropriate.
H f =n2 LV 2
(0.397)2 d4 /3
Equation 6: Manning's Formula 1
OR
V=0.397n
d23 ¿
Equation 7: Manning's Formula 2
Where:
n= Manning’s coefficient
3.1.4 The Pump characteristicsThe three principle performance parameters relating to pump selection are as follows:
1) Flow / capacity
2) Total Head
3) Suction Lift;
Capacity: The required capacity was determined by relating capacity to the total daily
demand. Daily demand was estimated and the hourly requirement computed by dividing
the daily demand by the number of hours the pump is required to work.
Total Head: This comprises of static head, dynamic head (friction loss) and pressure
head.
Total head = Static Head + Dynamic Head + Pressure head
Suction Lift: Centrifugal pumps have the capability of creating a vacuum in a suction
pipe which enables them to suck water from below their setting level. The maximum
19 | P a g e

practical suction lift depends on altitude, temperature, the intake arrangements and the
pump design is determined by the formula shown below:
3.1.6 Sizing of conveyance pipes
Flow of water in pipes conforms to continuity and obeys Bernoulli’s Energy Equation:
Q=V 1V 1=V 2 V 2=Constant
Equation 8: Bernoulli's Energy Equation
And
z1+p1
γ+
v12
2 q=z2+
p2
γ+
v22
2 g+H F
Equation 9: Calculation of Head
The size of the required pipe can be calculated using the following formula:
Q= π4
D2 ×V
Equation 10: Pipe size calculation
Where:
Q= Flow (m3/s)
D= Pipe size (m)
V= Velocity (m/s), usually assumed to be 0.8m/s
While V is assumed and Q is known, it is easy to calculate the diameter/ size of the required
pipe.
20 | P a g e
3.1.7 Design of storage tank
Different elements are considered in the design of the storage tank:
The shear forces and moments caused by the horizontal earth pressure, on the
wall.
The net moment due to the earth pressure on the top and bottom faces of the
inner footings in the top.
The moment due to earth pressure causes the tension in the bottom face of the
outer footing.
The following cases will be considered for reinforcement:
1. When only water pressure acts
2. When the tank is empty.
3. Maximum and minimum pressure at the base will be given by:
Qmax=WB {1+ 6 e
B }Equation 11: Maximum Base Pressure
Qmin=WB {1−6e
B }Equation 12: Minimum Base Pressure
Where:
Q=pressure either maximum or minimum
W= total weight
B= breadth
e=eccentricity
Total horizontal pressure exerted by water will be given by:
21 | P a g e

P=WH2
2
Equation 13: Total Horizontal pressure
Where:
P = Total horizontal pressure
W= Total weight
H= Effective height
Maximum available friction= µw
Where:
µ = Frictional coefficient
w= Total weight
Factor of safety=¿ μwQmax
Equation 14: Factor of Safety
Where:
µw =Maximum available friction
Qmax= Maximum pressure at the base
Bending moments:
i.) Short span: M sx=B sx ×w × lx2
Where:
Msx= Moment in the shorter span
Bsx= Coefficient in the shorter span
w = Ultimate design load
22 | P a g e

lx= Length of shorter span
ii.) Long span : M sy=Bsy ×w × lx2
Where:
Msy= Moment in the long span
Bsy= Coefficient in the long span
w = Ultimate design load
lx= Length of shorter span
Areas of reinforcement, As
A s=M
0.87 F y × z
Where:
M= Moment
Fy=The respective stress (steel)
3.1.8 Tank Loadings
Are of two types;
Internal loading caused by Hydrostatic and active pressures
External loading-Hydrostatic pressures, Active soil pressures and reaction of
the ground
In order to meet the regulations as provided in the British Standard Codes of practices,
BS 5337:
Minimum thickness of the wall, t = 100 mm
T = 2.5% depth of the tank +25 mm23 | P a g e

Check limits for crack width for the water retaining structure, Cr = 0.15
The allowable stress in the steel reinforcement was reduced such that:
Force N=ABstB × fBsB
Where:
fBsB=100N /mm2
24 | P a g e

4.0 GENERATION OF CONCEPT DESIGN
I. To identify pertinent design parameters for the design of the grey water recycling
system.
II. To determine the quality and quantity of grey water.
This is achieved through determination of the average water consumed per week by
inquiry, observation and estimation
III. To design the various system components for the grey water recycling system.
The following systems for the grey water recycling unit will be designed:
Diversion System
Filtration and treatment system
Delivery and Storage system
The design layout from CAD drawings
IV. To determine the Bill of Quantities of the project.
25 | P a g e

5.0 METHODOLOGY
5.1 Study area
5.1.1 LocationThe College of Agriculture and Veterinary Sciences, Upper Kabete Campus is located at
longitude 1°15’08.60” S and latitude 36°43’51.28” E and at an elevation of 6158 ft.
The proposed site for the grey water recycling unit will be at an elevation of 6120 ft. to allow for
flow of water by gravity during treatment.
26 | P a g e
Figure 2: Aerial map photography of University of Nairobi, College of Agriculture and Veterinary Sciences.
5.1.2 Land CoverThe campus is generally covered by grass vegetation, densely populated with trees and
availability of large tracts of farms for both agricultural education purposes and food production.
There are also various footpaths and road ways. Moreover, there is a golf course, VetLab,
situated within the campus area.
5.1.3 TopographyThe area is a relatively steady slope from south west to north east. The area is hilly with various
flat stretches of land.
5.1.4 Water supply systemThe current water supply system to the hostels is from the Nairobi Water and Sewerage
Company and supplemented by various boreholes sunk within the campus. The inconsistency of
the supply of Water from the mains has been an inconvenience in pumping the water to the
overhead tanks prompting numerous ground water tanks to be erected to store the water.
5.2. Data Collection
5.2.1. Water Consumption DataThe water consumption data was collected using the observation/data sheet as seen in the
appendix. The average amount of water consumed in the hostels was computed from
approximation, inquiry and estimation of the daily average volume of water in the roof tanks.
Other sources of information regarding data were sourced from the internet and books.
5.3. Design
5.3.1. Design of the diversion systemThe diversion systems generally divert the greywater from the laundry, bath, shower, and sink
sources to a site or sites of immediate reuse. These sites of immediate reuse are more often than
not the garden or landscaping incorporated in the built environment.
For maximum efficiency, the different components of the diversion system will be assessed and
the suitable material for each part will be determined.27 | P a g e
5.3.2. Filtration and Treatment SystemThe most appropriate treatment method which will produce more pure water is selected and
incorporated within this system. A simple charcoal-sand filter is designed with the sizes of the
filters and arrangement of the sand and charcoal being crucial to the efficiency of the filter.
The location and slope of this system is crucial in facilitating the removal of waste at a relatively
low cost.
5.3.3. Delivery and Storage SystemThe delivery system will majorly comprise of a pump which will assist in increasing the head to
the overhead tank to allow for water to flow by gravity and different pipe sizes for distributing
the recycled water to various locations.
A suitable tank will also be determined with the capacity and material being crucial to its
longevity. The size of the tank will be determined from the average volume of grey water
collected daily.
5.3.4. Overall Design LayoutA schematic layout of the complete design which will incorporate each of the above components
will be illustrated via CAD drawings.
28 | P a g e
6.0 RESULTS AND ANALYSIS
6.1. Water Consumption DataThe tables below present data obtained and extrapolated from Mandela, Wakulima and Tana C
Hostels in a span of 7 days in order to get the average volume of water consumed in a day.
6.1.1 Consumption in Mandela Hostel
Table 3: Average volume of water consumed in a day in Mandela Hostel
Area/ Day 1(l/d) 2(l/d) 3(l/d) 4(l/d) 5(l/d) 6(l/d) 7(l/d) Average Percentage
Bathroom 3200 3400 3500 3500 3100 4000 4500 3600 44.83
Sinks 1200 1000 1500 1300 1200 1600 2000 1400 24.14
Toilet 1100 1100 1000 1200 1500 1200 1300 1200 20.69
Leakages 200 200 200 200 200 200 200 200 1.72
Hostel Cleaning services
1000 1000 1000 1000 1000 1000 1000 1000 8.62
TOTAL 6700 6700 7200 7200 7000 8000 9000 7400 100
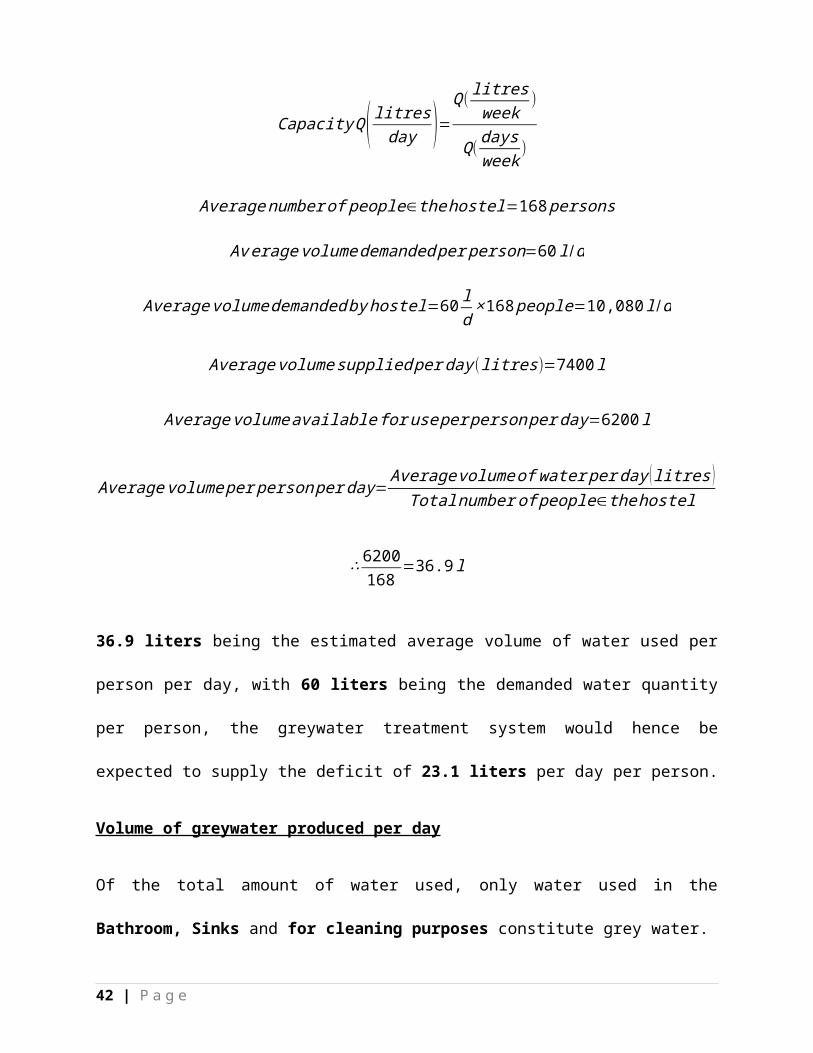
The amount of water consumed per day is calculated using the following equation:
Capacity Q( litresday )=
Q( litresweek
)
Q( daysweek
)
Averagenumber of people∈the hostel=168 persons
Average volume demanded per person=60 l /d
Average volumedemanded by hostel=60 ld
×168 people=10,080 l /d
Average volumesupplied per day( litres)=7400 l
29 | P a g e
Average volumeavailable for use per person per day=6200 l
Average volume per person per day= Average volume of water per day ( litres )Totalnumber of people∈the hostel
∴ 6200168
=36.9 l
36.9 liters being the estimated average volume of water used per person per day, with 60 liters
being the demanded water quantity per person, the greywater treatment system would hence be
expected to supply the deficit of 23.1 liters per day per person.
Volume of greywater produced per day
Of the total amount of water used, only water used in the Bathroom, Sinks and for cleaning
purposes constitute grey water.
∴ Average Bathroomwater+ Average sink water+ AverageCleaning purposes water=3600+1400+1000=6000 litres
Percentageof grey water produced=60007400
×100 %=81 %
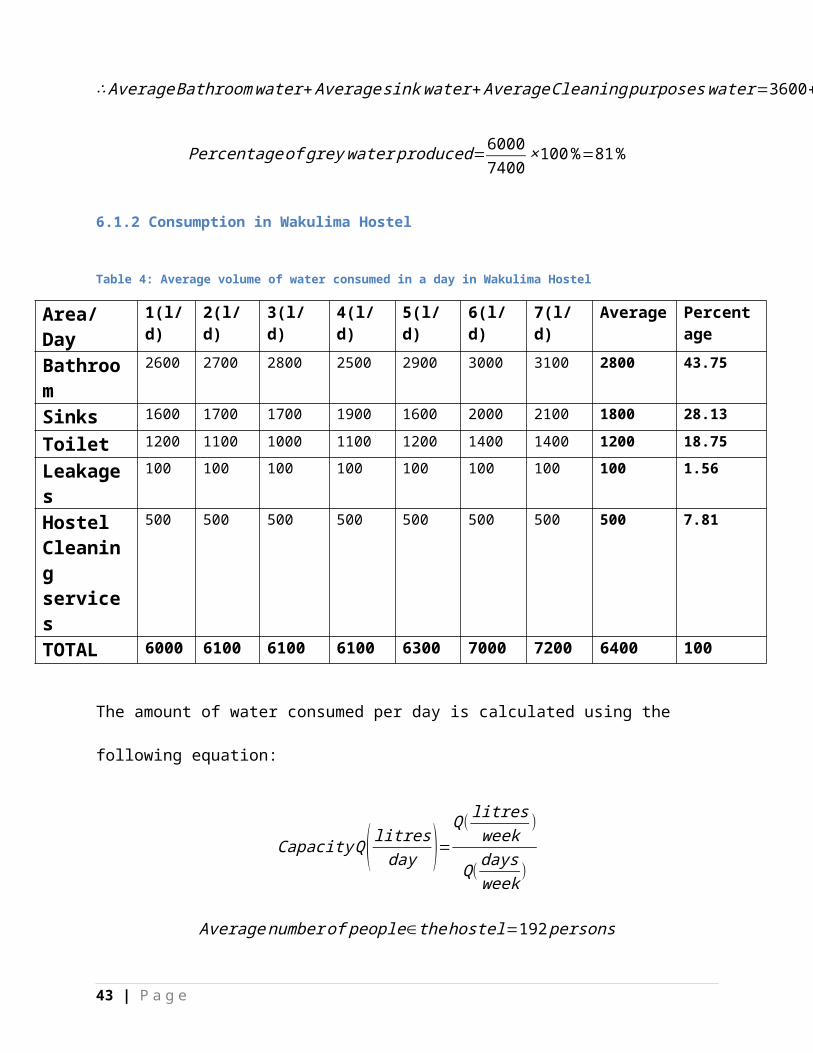
6.1.2 Consumption in Wakulima Hostel
Table 4: Average volume of water consumed in a day in Wakulima Hostel
Area/ Day 1(l/d) 2(l/d) 3(l/d) 4(l/d) 5(l/d) 6(l/d) 7(l/d) Average Percentage
Bathroom 2600 2700 2800 2500 2900 3000 3100 2800 43.75
Sinks 1600 1700 1700 1900 1600 2000 2100 1800 28.13
Toilet 1200 1100 1000 1100 1200 1400 1400 1200 18.75
Leakages 100 100 100 100 100 100 100 100 1.56
Hostel Cleaning services
500 500 500 500 500 500 500 500 7.81
TOTAL 6000 6100 6100 6100 6300 7000 7200 6400 100
30 | P a g e

The amount of water consumed per day is calculated using the following equation:
Capacity Q( litresday )=
Q( litresweek
)
Q( daysweek
)
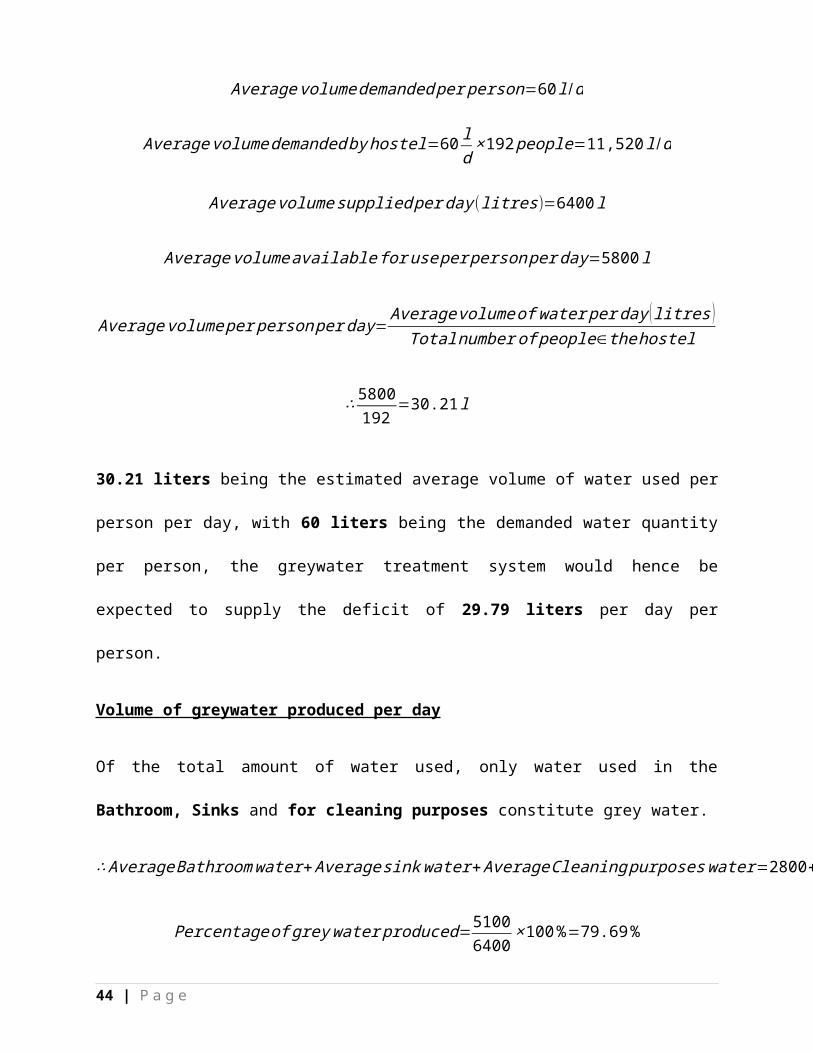
Averagenumber of people∈the hostel=192 persons
Average volume demanded per person=60 l /d
Average volumedemanded by hostel=60 ld
×192 people=11,520 l /d
Average volumesupplied per day( litres)=6400 l
Average volumeavailable for use per person per day=5800 l
Average volume per person per day= Average volume of water per day (litres )Totalnumber of people∈the hostel
∴ 5800192
=30.21l
30.21 liters being the estimated average volume of water used per person per day, with 60 liters
being the demanded water quantity per person, the greywater treatment system would hence be
expected to supply the deficit of 29.79 liters per day per person.
Volume of greywater produced per day
Of the total amount of water used, only water used in the Bathroom, Sinks and for cleaning
purposes constitute grey water.
∴ Average Bathroomwater+ Average sink water+ AverageCleaning purposes water=2800+1800+500=5100 litres
31 | P a g e

Percentage of grey water produced=51006400
×100%=79.69 %
6.1.3 Consumption in Tana C Hostel
Table 5: Average volume of water consumed in a day in Tana C Hostel
Area/ Day 1(l/d) 2(l/d) 3(l/d) 4(l/d) 5(l/d) 6(l/d) 7(l/d) Average Percentage
Bathroom 1700 1800 1700 1800 2000 2100 2200 1900 37.26
Sinks 1200 1200 1400 1600 1600 1700 1800 1500 29.41
Toilet 1000 900 1200 1100 1100 1100 1300 1100 21.57
Leakages 100 100 100 100 100 100 100 100 1.96
Cleaning services
500 500 500 500 500 500 500 500 9.80
TOTAL 4500 4500 4900 5100 5300 5500 5900 5100 100
The amount of water consumed per day is calculated using the following equation:
Capacity Q( litresday )=
Q( litresweek
)
Q( daysweek
)
Averagenumber of people∈the hostel=150 persons
Average volume demanded per person=60 l /d
Average volumedemanded by hostel=60 ld
×150 people=9,000 l /d
Average volumesupplied per day( litres)=5100 l
Average volumeavailable for use per person per day=4500 l
Average volume per person per day= Average volume of water per day (litres )Totalnumber of people∈the hostel
∴ 4500150
=30 l
32 | P a g e
30 liters being the estimated average volume of water used per person per day, with 60 liters
being the demanded water quantity per person, the greywater treatment system would hence be
expected to supply the deficit of 30 liters per day per person.
Volume of greywater produced per day
Of the total amount of water used, only water used in the Bathroom, Sinks and for cleaning
purposes constitute grey water.
∴ Average Bathroomwater+ Average sink water+ AverageCleaning purposes water=1900+1500+500=3900 litres
Percentage of grey water produced=39005100
×100 %=76.47 %
6.2. Diversion System
6.2.1. PipingCurrently, the piping system in the sample hostels conveyed waste water from both the toilets
and bathrooms towards the respective septic tank. The piping conveying the greywater should be
diverted away from the piping system carrying the black water away into a separate septic
disposal system.
6.2.2. Junction ChamberGrey water which originally headed towards the septic tank is diverted to a junction chamber
which facilitates draining out greywater from different sources. The dimension of junction
chamber is determined based on providing sufficient storage to handle peak hourly volume. The
standard dimension of the junction chamber is kept at about 0.3 m x 0.3 m x 0.5 m i.e. a capacity
of for a hostel having greywater generation of 2000-3000 l/day. Froth removal generated from
bathroom and washing may prove necessary.
33 | P a g e
6.3. Filtration and Treatment System
6.3.1. ScreenScreen can be a mesh with less than 10 mm size to remove coarse particles. The screens can be
placed at the inlet to the piping system of sources such as bathroom, sinks etc. to remove large
particles and prevent an overload of particles at the outlet. The screens can be cleaned manually
and solids disposed of along with solid waste.
6.3.2. Equalization or Settling TankEqualization or settling tank is required to collect grey water for continuous flow to the filters for
treatment and facilitates in settling of course particles. It also allows for balance flow by taking
into account maximum flow of greywater generated during morning hours due to bathroom use.
Adequate aeration and mixing must be provided to prevent odors and solids deposition in
equalization tank and this is achieved by providing baffles.
Removal efficiency of suspended solids in sedimentation tanks depends on surface area and
depth of tank. Surface loading rate is the basic guidance parameter for determining size of tank.
The design criteria for equalization or settling tank presented in table below.
6.3.2.1 Design criteria for an equalization chamber
For Mandela hostel:
Loading=6000litres /day24 hrs/day
=250 litres/day
To provide efficient equalization, a 4-6 hour retention time is accurate, with the retention time
based on the mean daily inflow rate. It would be seen that as tank retention time reduces below 4
hours the effluent flow rate and load patterns increasingly assume the character of the
corresponding influent patterns; and as the tank retention time increases above 6 hours, the
34 | P a g e

improvement in equalization efficiency is so marginal that it is unlikely that the slight
improvement will merit any increase in the capital cost.
Table 6: Design criteria for an equalization chamber
PARAMETER RANGE
Retention time (Hours) 4 - 6
Surface loading (l/h/m2) 200-400
Depth of tank (m) 1.0 - 1.2
Length of width ratio 4:1 to 5:1
6.3.3 Filtration Unit
PARAMETER RANGE
Number of compartments 4 - 6
35 | P a g e
Figure 3: Equalization Chamber

Media and size (mm)
Coarse sand
Coarse sand
Fine sand
Hydraulic loading (m3/m2-hr) 0.1 – 0.2
Depth of media (m) 0.5
Figure 4: Filtration unit
36 | P a g e

6.3.4 DisinfectionThe best method of disinfecting the water is through chlorination. Chlorination of the recycled
water becomes necessary since it has a number of benefits
• Kills pathogens in the water
• Removes odor of the recycled water
• It vaporizes in the water after disinfection
• Is readily available
• Cheaper compared to other forms of disinfection
Chlorine is available in liquid form or in tablet form and it can be added to the collection tank
and provided with adequate aeration for maximum efficiency and to reduce toxicity.
6.4. Collection / Storage TankA collection or storage tank is required to have the appropriate capacity to handle the average
daily generation of treated greywater. In case the greywater generation is large with a capacity of
more than 4000 liter/day, collection tank may have capacity to handle half of the quantity of
greywater generated per day.
6.4.1. MaterialThe storage tank is constructed from concrete material because of the following properties:
It durable and lasts longer than other materials
It is a reliable material
It has a high compressive strength
It is cheaper than most materials
It is isotropic and hence suitable for water retaining structures
Is non-corrosive with chlorine
37 | P a g e
6.4.2. Shape and PositionA rectangular tank is suitable for use as a storage tank. The best position for this tank should be
underground and at a distance from the septic tank. It should also be higher than the septic tank
as a measure of control. The various pipes conveying the water along the system should be
buried a distance of 1m below the ground to avoid damage or hinder movements of other users.
The major parts of the tank that will need to be designed include:
Base of the tank or bottom slab
Tank walls
Top slab or cover of the tank
6.4.3. Dimensions of the storage tankLength :Widthratio=4 :1
Depth of tank=1 m
Volume of grey water produced=6000 litres per day
Volume=l× w × d
Volume=4 w2 d
6m3=4w2×1
∴w=√ 64=√1.5=1.225
∴L=4 × 1.225=4.9m
∴The storage tank dimensions are :
4.9 m by1.225 m by1 m
38 | P a g e

6.5. Pumping and Piping System
6.5.1. PipesThe Various pipes that link the different components are installed in the system and should
comprise of the following:
6.5.2. PumpsAn electric diesel-engine pump is a preferred choice since the hostels have ample electric power.
Efficient centrifugal pumps are ideal where water requirements are substantial and only single-
phase power, and sufficient power available.
39 | P a g e
Figure 5: Storage Tank

These are normally low cost balanced and with rigged construction. They have simplicity in
installation and operation whilst also requiring less operational and maintenance cost with
neither air lock nor leakage problems. The pump should have a minimal yield (Q) of 1000
liters/hour and should be a high/ low head discharge pump.
The power required, P, for driving a pumping unit can be calculated using the formula below:
P= Q × H102 × Ep
(KW ); P=17.64 qhEp
Where:
Q= discharge rate l/s
H= Pumping head in metres (static head + losses)
Ep=Pumping efficiency (will have a value between 0 and 1)
Table 7: Pumping Characteristics
Property ValuesLift 25m
Flow rate 6.0 m3/h
Voltage 240 V
40 | P a g e

Figure 6: Pump
41 | P a g e

6.6 Cost Benefit AnalysisThe grey water recycling system will also save the overall cost of piped water by reducing the
intake. Calculating the total cost of water saved at current rates is:
Cost of tap water: 1 litre = Kshs 0. 2
If an approximate of 6000 litres of water in Mandela hostel could be recycled per day:
6000 liters per d ay × Ksh .0.2=Ksh. 1200 per day
In a Month:
Ksh .1200 ×30 days=Ksh . 36,000 per month
In a year:
Ksh .36,000 ×12 months=Ksh . 432,000 per year
42 | P a g e
6.7 Schematic design of a Grey water recycling system
43 | P a g e
Figure 7: Final schematic diagram

6.8. Water Quality MonitoringVarious precautionary measures should be taken to ensure that the fresh and grey
water does not mix. These include
No cross connection of the grey water piping system with the fresh water piping system
Use of different color pipe network
Prevention of mosquito breeding in the system
6.8.1. Odor ControlGood design and maintenance practices will reduce odor problems in greywater treatment system
without the use of chemical addition or air treatment. The charcoal and chlorine also assists in
removing the odor from the water. The following measures are recommended to minimize odor
problem:
i.) A minimum slope of 2-3 % should be provided so as to ensure sufficient flow through
system when in operation
ii.) Baffles should be provided at the entrance of sedimentation tank and in collection
tank for aeration.
iii.) The closed conduit system should be avoided. If a closed conduit system is
unavoidable, length should be minimal with adequate velocity to scour the pipe.
iv.) Deposited solids should periodically be removed from equalization tank
v.) Natural/ artificial coagulants should be added to sedimentation tank to aid in the
coagulation process.
vi.) Addition of chemicals such as calcium nitrate, hydrogen peroxide, potassium
permanganate, hypochlorite and chlorine added to the system to oxidize the sulphate
bearing ingredients of greywater. This is only necessary if the system cannot be
designed in such a way to prevent formation of anaerobic conditions
44 | P a g e
vii.) Filters should be washed with clean water and filter media should be periodically
replaced.
viii.) Chlorination of final effluent also helps in minimizing odor
ix.) Collection sump can be covered and vent pipe can be provided to let out the odorous
compound
6.9. Maintenance of Greywater Treatment SystemThe success of a greywater reuse system will depend on maintaining the system. Frequent
maintenance of all components seems the key factor in achieving appropriate system operation.
Any defect must be rectified as soon as it becomes apparent. Greywater systems require regular
maintenance e.g. weekly cleaning or replacing filters, periodic desludging, and manually
diverting greywater back to sewer and flushing of drainage lines.
The following procedures may be required to be undertaken once the system starts up:
Inspection & maintenance of the parts and components (e.g. filters, membranes, and
biological & disinfection systems), pumps and pump controls, control units, backwash,
etc. shall be in accordance with the design & manufacturer’s operation and maintenance
recommendations.
Sedimentation tanks require desludging every month
Caution signs should be maintained in good order
Protection from any contact with greywater to ensure that exposed body areas that come
into contact with greywater are immediately washed; direct contact with the mouth or
face should be avoided.
Reuse of greywater only for toilet flushing and facilities-cleaning purposes, and to
completely avoid use for anal cleaning after toiler use or hand washing.
45 | P a g e
7.0 CONCLUSIONThe average grey water produced within the three sample hostels comprised of about 78% of the
total amount of water used and therefore the grey water recycling saves up to an equivalent
percentage off the mains supply which is a capacity of about 6000 liters per day or 6m3.
The recycled water is of good quality and can therefore be used primarily for flushing toilets and
cleaning of the pavements. Secondary uses may include irrigation purposes on the agricultural
farms, and grass watering around the campus area to improve beautification.
This system will also be able to save on the cost of water supplied by the Nairobi water and
sewerage company. An estimate of about Kshs 432,000 will be saved on a yearly basis.
Given that this system will have an economic life similar to that of the individual hostels, it
translates that with proper maintenance, the system will be able to serve the students and
improve the sanitation of the hostel.
46 | P a g e
8.0 RECOMMENDATIONMuch more effort and thought should be put into increasing efficient usage of water resources
that the College of Agriculture and Veterinary Science has at its disposal. Though rarely lacking
in water supply, it could be put into much more economical and substantial use to reduce
overhead costs and improve environmental conditions within and without the campus.
This project should be implemented to improve the sanitation levels of the hostels and reduce the
long term costs in water supply.
In case of a system with anaerobic, iodine tablets can be used for disinfection instead of chlorine.
47 | P a g e

9.0 REFERENCESAl- Jayyousi, Odeh.2002. Focused Environmental Assessment of Grey water Reuse in Jordan.
Civil Engineering Department Applied Science University, College of Engineering. Amman,
Jordan: Environmental Engineering Policy (2002) 3, 2002.pp.67-73, study.
Asano, T., Smith, R.G. and Tchobanoglous, G., 1985. Municipal wastewater: Treatment and
reclaimed water characteristics. Irrigation with Reclaimed Municipal Wastewater-A Guidance
Manual, GS Pettygrove and T. Asano. Pettygrove and T. Asano, eds. Chelsea, Mich.: Lewis
Publishers.
Jefferson, B., Laine, A., Parsons, S., Stephenson, T. and Judd, S. (2001). Advanced biological
unit processes for domestic water recycling. Water Sci. Technol. 43 (10), 211-218.
Little, V. 2000: Residential grey water reuse: The Good, The Bad, The healthy.
Tucson, AZ: The Water Conservation Alliance of southern Arizona (Water CASA),
2009.
Cui, F. and Ren, G. (2005). Pilot study of process of bathing wastewater treatment for reuse.
IWA conference 2005, Xi’an, 18-20 May 2005, Future of Urban Wastewater system-
Decentralization and Reuse.
Christova-Boal, D., Eden, R. and McFarlane, S. (1995). An investigation into grey water reuse
for urban residential properties. Desalination. 106 (1-3), 391-397.
48 | P a g e

Gibbons, Diana (1986) The Economic Value of Water. Washington, DC, USA: Resources for the
future.
Shatanawi, Mohammad and Odeh Al-Jayyousi (1995) Evaluating market-oriented water policies
in Jordan: a comparative study. Water International, 20 (2), 88-97.
Jacobi, Petra, Amend, Jorg, and Kiango, Suzan (1999) “Urban agriculture in Dar es Salaam:
providing an Indispensable part of the diet.” In Growing Cities, Growing Food: urban agriculture
on the policy agenda, a reader on urban agriculture, edited by Nico Bakker, et al. Feldafing:
DSE, 268.
Khouri, Nadim, John M Kalbermatten and Carl R Bartone (1994) Reuse of Wastewater in
Agriculture: A Guide for Planners. UNDP-World Bank Sanitation Program.
Lindstrom, Carl (2000) “Greywater pollution: Short description of how pollution is measured.
<http://www.greywater.com/pollution.htm>.
Parker, J., and Frost, S. (2000). Environmental health aspects of coastal bathing water standards
in the UK. Environmental Management and Health, 11, 447–454.
http://www.mcbup.com/research registers/emh.asp(accessedJanuary19,2009).
Pidou, M., Memon, F., Stephenson, T., Jefferson, B., and Jeffrey, P. (2007). Grey water
recycling: Treatment options and applications. Proceedings of the Institution of Civil Engineers
Engineering Sustainability, 160, 119–131.
49 | P a g e

Ramon, G., Green, M., Semiat, R., and Dosortez, C. (2004). Low strength grey water
characterization and treatment by direct membrane filtration. Desalination, 170, 241–250.
50 | P a g e

10.0 APPENDICES
OBSERVATION / DATA SHEETTO DETERMINE THE QUANTITY OF WATER CONSUMED IN THE HOSTEL
HOSTEL NAME: _____________________________________________
NUMBER OF OCCUPANTS: _____________________________________________
Main Source of Water: _____________________________________________
Other Sources: _____________________________________________
_____________________________________________
Are conditions of the drainage system good? (Y/N) ___________________________________
If no, what method of waste disposal is used?
______________________________________________________________________________
______________________________________________________________________________
______________________________________________________________________________
_________________________________________________________
How many bathrooms are present?
______________________________________________________________________________
___________________
How many toilets are present?
___________________
______________________________________________________________________________
How many wash sinks are present?
51 | P a g e

______________________________________________________________________________
___________________
Approximately how much water is used?
______________________________________________________________________________
___________________
What is the capacity of the storage tank (if available)?
______________________________________________________________________________
___________________
How long does it take to empty?
______________________________________________________________________________
___________________
Are there any leakages?
______________________________________________________________________________
___________________
Approximate how many times the toilets are flushed per day
______________________________________________________________________________
___________________
Any other uses of water in the hostel?
______________________________________________________________________________
___________________
Approximate how much water is used for these uses?
______________________________________________________________________________
___________________
52 | P a g e