산업폐수중 toc 적정처리기술 평가 연구 -...
TRANSCRIPT
발 간 등 록 번 호
11-1480523-002647-01 NIER-RP2015-377
산업폐수중 TOC 적정처리기술 평가 연구
물환경연구부 물환경공학연구과
김재훈, 임종권, 김종민, 허인애, 박창희, 유순주, 이수경, 이영선, 최익원
a Study on practicable treatment of TOC in
industrial wastewater
Jaehoon Kim, Jongkwon Im, Jongmin Kim, In-Ae Huh, Chang hee
Park, Soonju Yu, Sukyung Lee, Youngsun Lee, Ikwon Choi
Water Environment Engineering Research Division
Water Environment Research Department
2015
목 차❚
i
목 차
목차 ···························································································································· ⅰ
표목차························································································································ ⅱ
그림목차···················································································································· ⅲ
Abstract ······················································································································ ⅳ
Ⅰ. 서 론 ····················································································································· 1
Ⅱ. 연구내용 및 방법 ······························································································· 2
1. 문헌연구 ··············································································································· 2
가. 외국의 기준적용 사례 ················································································· 2
(1) 유럽연합(EU) ···························································································· 2
(2) 미국 ············································································································ 2
(3) 독일 ············································································································ 4
(4) 스웨덴 ········································································································ 5
(5) 스위스 ········································································································ 6
2. TOC 특성 ···········································································································7
(1) 유기물 산화력 ·························································································· 7
(2) 제거효율 ···································································································· 8
3. 현장조사 방법 ··································································································· 9
가. 조사대상 업종 및 사업장 선정 ·································································9
나. 현장조사 내용 ···························································································11
(1) 설문조사 ···································································································· 12
(2) 수질분석 ···································································································· 12
Ⅲ. 연구결과 및 고찰····························································································· 14
1. TOC 제거효율 조사 ·························································································14

목 차❚
i
가. 업종간 TOC제거효율 비교 ······································································· 14
나. 항목간 제거효율 비교 ··············································································· 15
2. 폐수처리비용 조사 및 산정 ········································································· 16
3. TOC 적정처리기술 ························································································· 20
Ⅳ. 결 론 ················································································································· 28
참고문헌 ···················································································································· 30

목 차❚
ii
표 목 차
<Table 1> Urban wastewater directive(91/271/EEC) ······································ 2
<Table 2> Effluent limitations of secondary sedimentation of US.EPA ···· 3
<Table 3> Effluent limitations guideline of petroleum refining industry of
US.EPA ····································································································· 4
<Table 4> TOC/CODCr ratio of industry in Germany ······························· 5
<Table 5> Effluent limitation of swage water treatment plant in Sweden 6
<Table 6> TOC Effluent limitation of paper, paperboard and pulps industry
in Swiss ······································································································ 7
<Table 7> Oxidation ratio and concentration of organic compounds ····· 8
<Table 8> TOC removal efficiency of industrial wastewater in EU ········ 9
<Table 9> Investigated status each on category of wastewater discharge
facility ····································································································· 10
<Table 10> Parameters of investigation for wastewater treatment facility ···
················································································································· 12
<Table 11> analysis method of parameters ····················································· 13
<Table 12> Comparison of removal efficiency of water pollutants in
wastewater from industry ································································· 14
<Table 13> Comparison of treatment and operation cost for wastewater
treatment facility on each industry ················································ 18
<Table 14> Comparison of water pollutants removal efficiency on each
industry and treatment process ······················································· 21

목 차❚
iii
그 림 목 차
<Figure 1> Schematic diagram of TOC analysis method ·························· 13
<Figure 2> Comparison of removal efficiency of water pollutants in
wastewater from industry ································································· 16
<Figure 3> Comparison of generation amount of wastewater, sludge and
treatment costs ····················································································· 17
<Figure 4> Diagram of wastewater treatment processes of butchery, meat
processing and storage facility ························································ 26
<Figure 5> Diagram of wastewater treatment processes of primary steel
manufacturing ······················································································· 27
<Figure 6> Diagram of wastewater treatment processes for pulp, paper and
paper board manufacturing ······························································ 27
Abstract❚
iv
Abstract
Total organic carbon(TOC) will be newly added as effluent limitation to
assessment the organic pollution in industrial wastewater in Korea. This
study was conducted to estimate the practicable treatment for TOC removal
in industrial wastewater and estimate the wastewater treatment process of 16
industrial categories and 48 industries.
As a results, TOC removal efficiency has a more then 90% in pulp, paper
and paperboard manufacturing facility, textiles, dying, finishing and
processing facility, synthesis rubber and plastic materials manufacturing
facility, chemicals manufacturing facility, alcoholic beverages manufacturing
facility, butchery, meat processing and storage facility. Overall, the TOC
removal tendency was similar to the current organic parameters such as
BOD, COD. Currently, the wastewater treatment process in industry is
optimized to remove BOD, COD and other organics. But when organic
materials are removed, simultaneously, TOC was removed above a certain
level.
Therefore, except for special situation, like as high concentration of organic
wastewater be discharged, large investment would not be required to
remove TOC in wastewater. But because each situation will be different,
suggest that should be review and determine the appropriate TOC treatment
process and conditions on each facility.
Ⅰ. 서 론❚
1
Ⅰ. 서 론
우리나라에서 산업폐수를 비롯하여 하천, 호소수 등 수환경중 유기물질의 오
염도를 측정하는 지표로 지금까지 BOD5와 CODMn, CODCr가 활용되어 왔다.
10여년 전부터 이들 기존 지표들이 가지고 있는 상대적으로 낮은 유기물질 산
화율, 기기분석 적용의 어려움, 수은과 같은 2차 오염물질 발생 등의 단점들이
지적되었고, 이의 대안으로 총유기탄소(TOC)를 새로운 측정지표로 활용하고자
하는 논의가 이루어져 왔다. 그 결과, 지난 2013년 말에 수질환경기준으로 TOC
가 처음 도입되었고, 그와 함께 산업폐수의 배출허용기준에 TOC를 적용하기
위해 산업폐수 중으로 TOC 배출실태 조사와 적정처리를 위한 기술적 타당성
등에 대한 검토가 진행되고 있다.
기존 수행된 업종별 TOC 배출실태 조사1,2에 따르면, TOC와 기존 항목들과
의 산화율을 비교한 결과 CODCr은 TOC 대비 106.6%로 어느 정도 유사성을 가
지고 있으나, CODMn은 53.1%, BOD5는 21.3% 로 TOC에 비해 상당히 낮은 수
준이었다. 또한 TOC와 기존항목간 상관관계를 분석한 결과, 각 업종별 배출수
를 기준으로 하면 CODCr은 0.8046, CODMn은 0.6930, BOD5는 0.5695로 조사되
었다.
이처럼 산업폐수 중에 산화가 어려운 유기물질 등이 포함되어 있는 경우, 측
정방법에 따라 유기물질의 산화력 차이가 발생하고, 이로 인해 실제 측정값에
도 상당한 영향을 줄 수 있다는 점이 확인되었다. 유럽, 미국, 일본 등 주요 선
진외국의 경우, 시료의 특성상 CODCr측정이 어려운 경우(염소이온이
1,000mg/L 이상 등, 미국), CODCr/TOC 농도가 일정 비율을 초과하지 않는 경
우(4배이하, 독일) 등 각각의 폐수특성과 분석여건 등을 감안하여 TOC를 적용
할 수 있도록 하고 있다,
본 연구에서는, 향후 예상되는 산업폐수 TOC 배출허용기준 도입에 대비하기
위해, 기존의 조사결과를 바탕으로 통합환경관리 대상 업종을 기준으로 폐수배
출시설을 선정하고, 현재 운영하고 있는 폐수처리기술 수준과 그에 따른 처리
수질 및 폐수처리비용 등을 조사하였다.

Ⅱ. 연구내용 및 방법❚
2
Ⅱ. 연구내용 및 방법
1. 문헌 연구
가. 외국의 기준 적용 사례
(1) 유럽연합(EU)
폐수 중의 유기물질 규제와 관련한 규정은 도시하폐수처리지침(91/271/EEC)
이 있으며, 동 규정 내에서 Table 1과 같이“BOD와 상관관계가 성립하는 경우에
이를 TOC로 대체하여 사용할 수 있다”라 하고 있다.
Parameters
ConcentrationMinimum
percentage of reduction1)
Reference methods of measurement
BOD52) 25 mg/L O2
70~90
403)
Homogenized, unfiltered, undecanted
sample. Determination of dissolved
oxygen before and after five day
incubation at 20°C±1°C, in complete
darkness. addition of a nitrification
CODCr 125 mg/L O2 75Homogenized, unfiltered, undecanted
sample potassium dichromate
주) : 1) Reduction in relation to the load of the influent 2) The parameter can be replaced by another parameter : total organic carbon(TOC) or total oxygen demand(TOD) if a relationship can be established between BOD5 and the substitute parameter. 3) This requirement is optional
<Table 1> Urban wastewater directive(91/271/EEC)
(2) 미국
수질오염물질을 수질유해물질(priority pollutants), 일반오염물질(BOD, SS,
pH, fecal coliform, oil and grease), 비일반오염물질(위의 두 그룹에 속하지 않
는 물질)로 분류되어 있는데, 그 가운데 TOC 항목은 포함되어 있지 않다. 다만

Ⅱ. 연구내용 및 방법❚
3
산업과 폐수배출, 해당지역(주)의 특성에 따라 일부 적용하고 있다. 특히 공공하
수처리장 2차침전지 방류수 기준의 경우 40 CFR §133.104(b) 조항에 따라
BOD/TOC 상관관계가 나타나면 BOD 대신 TOC를 대체 사용가능하도록 규정
하고 있다.
Parameters average for 30 days average for 7days
BOD5 30 mg/L (25 mg/L CBOD5) 45 mg/L(40 mg/L CBOD5)
Removal 85% BOD5 (or CBOD5) and TSS -
note : 40 CFR 133.102 40 CFR 133.104(b) : if a relationship can be established between BOD5 and TOC, The BOD5 can be replaced by TOC
<Table 2> Effluent limitations of secondary sedimentation of US.EPA
석유정제산업(part 419, Petroleum refining)의 경우, 염화이온이 1,000mg/L
이상인 경우에는 CODCr 대신에 TOC로 대체 가능하고 BOD5에 대해서는 상관
관계가 성립되거나 자료가 없는 경우에는 TOC/BOD5 비율을 2.2로 한다는 예외
조항이 포함되어 있어 TOC 적용을 가능하게 하고 있다. 그 외에서도 통조림 제
조업, 유기화학물질 제조업, 펄프 및 종이 제조업, 석유정제업, 유제품 제조업의
경우 TOC를 배출허용기준 항목으로 대체 사용할 수 있도록 되어있다.

Ⅱ. 연구내용 및 방법❚
4
Parameters BOD5 CODCr1
BPTdaily maximum 22.7 117.0
average for 30 days 12.0 60.3
BATdaily maximum - 117.0
average for 30 days - 60.3
BCTdaily maximum 22.7 -
average for 30 days 12.0 -
PSESdaily maximum - -
average for 30 days - -
NSPSdaily maximum 11.8 61.0
average for 30 days 6.3 32.0
PSNSdaily maximum - -
average for 30 days - -
1) If permittee can be proved the chlorine ion be more then 1,000 ppm in sample, The CODCr can be replaced by TOC.
<Table 3> Effluent limitations guideline of petroleum refining industry of US.EPA
(3) 독일
TOC 배출허용기준은 Waste Water Ordinance(AbwV, 2004년 개정)의 제4조
분석 및 측정과정(Analysis and Measurement Procedures)조항과 제6조
(Compliance with the Requirements)에서 정하고 있다. 이에 따르면, 유기물 기
준은 BOD5, CODCr, 53개 업종별로 기준을 달리 적용하고 있고, TOC를 적용할
경우 CODCr기준과 비교하여 “총유기탄소(TOC)의 4배가 폐수배출허가에 지정
된 CODCr를 초과하지 않으면 기준을 달성한 것으로 간주된다”라고 규정하고 있
다. 전체 53개 업종 중에서 폐기물 소각에서 폐가스의 세척시설 등 3개 업종은
Table 4과 같이 CODCr/TOC 비율을 3배로 하는 등 달리하고 있다.

Ⅱ. 연구내용 및 방법❚
5
Industry 비고
23. Facilities for
Biological Treatment
of Waste
Total carbon 10 mg/L
33. Scrubbing of waste
gases from waste
incineration
In derogation of Article 6(3), the chemical oxygen demand
(COD) level shall also be deemed to have been met
provided the triple amount of total organically bonded
carbon(TOC), specified in milligrams per liter, does not
exceed this level. (The requirements for the chemical
oxygen demand shall apply after deduction of the initial
COD contamination introduced with the process water)
47. Scrubbing of flue
gases from firing
systems
In derogation of Article 6 (3), the chemical oxygen
demand (COD) level shall also be deemed to have been
met if the triple amount of total organically bonded
carbon (TOC), specified in milligrams per liter, does not
exceed this level. (The requirements for the chemical
oxygen demand shall apply after deduction of the initial
COD contamination introduced with the process water)
<Table 4> TOC/CODCr ratio of industry in Germany
(4) 스웨덴
가정하수와 산업폐수를 하수처리장으로 같이 유입시켜 처리를 하고 있는데
이때 생활하수는 전처리 없이 직접 유입되고, 산업폐수의 경우는 허용범위 이내
의 폐수만 유입하도록 하고 있다. 스웨덴의 하수관련 법령은 SNFS(Statens
naturvårdsverks författnings swamping) 1994:7(1998:7, 2004:7, 2006:13 등으로
개정)이며 EU지침과 동일하게 BOD, CODCr을 기준값으로 제시하고 있다. 이때
BOD5가 아닌 BOD7을 사용하고 있고, 이들 간의 관계는 BOD7=1.2 BOD5이다.
현재 스웨덴에서 하수처리장 관리기준은 대부분 TOC로 전환하고 있는 중이다.
가장 큰 이유는 CODCr 분석시 수은 및 크롬과 같은 중금속 물질에 의한 2차 오
염문제이며 이들 물질들에 대해 스웨덴 화학물질청(Kemikalieinspektionen,
www.kemi.se)에서 사용제한을 하고 있기 때문으로 조사되었다. 또한 분석에 소
요되는 인건비, 효율성 등을 고려하여 자동화가 가능한 기기분석 중심으로 변경
되고 있다.

Ⅱ. 연구내용 및 방법❚
6
ParametersMaximum concentration
(average for year)
BOD7 15 mg O2/L
CODCr 70 mg O2/L
- if a relationship can be established between CODCr and TOC, The CODCr can be
replaced by TOC for monitoring
<Table 5> Effluent limitation of swage water treatment plant in Sweden
(5) 스위스
연방 물보호법(Water Protection Law, Gewässerschutzgesetz, GSchG, 814.20,
1991)과 물보호법 시행령(Water Protection Ordinance, Gewässerschut
zverordnung, GSchV, 814.201, 1998)에서 배출허용기준을 규정하고 있다. 특히
부록 3.2(Discharge of industrial waste water into bodies of water or into
public sewer systems)에서 업종별로 규제항목을 달리 정하고 있다. 그 중에서
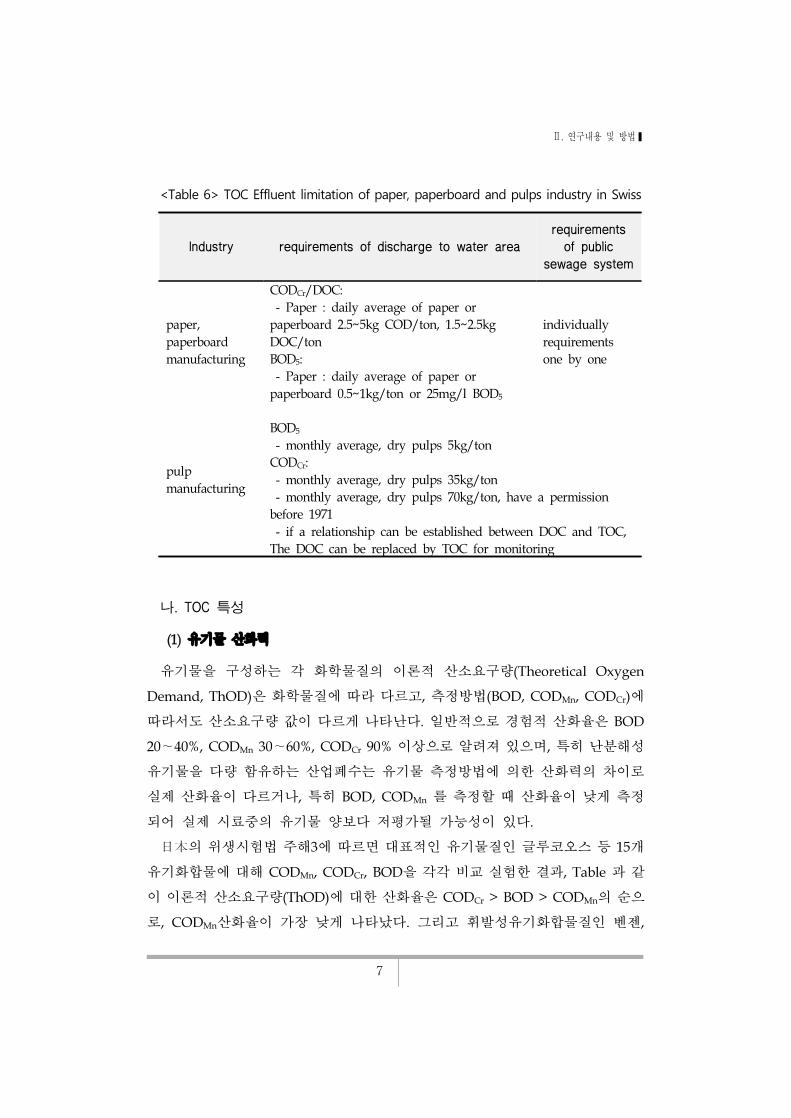
Table 6 과 같이 제지 및 판지, 펄프제조업의 경우 CODCr와 DOC를 동시에 측정
할 수가 있으며, 만일 DOC와 TOC의 상관성이 있을 경우 TOC로 측정할 수 있
도록 하고 있다.
Ⅱ. 연구내용 및 방법❚
7
Industry requirements of discharge to water arearequirements of public
sewage system
paper,
paperboard
manufacturing
CODCr/DOC:
- Paper : daily average of paper or
paperboard 2.5~5kg COD/ton, 1.5~2.5kg
DOC/ton
BOD5:
- Paper : daily average of paper or
paperboard 0.5~1kg/ton or 25mg/l BOD5
individually
requirements
one by one
pulp
manufacturing
BOD5
- monthly average, dry pulps 5kg/ton
CODCr:
- monthly average, dry pulps 35kg/ton
- monthly average, dry pulps 70kg/ton, have a permission
before 1971
- if a relationship can be established between DOC and TOC,
The DOC can be replaced by TOC for monitoring
<Table 6> TOC Effluent limitation of paper, paperboard and pulps industry in Swiss
나. TOC 특성
(1) 유기물 산화력
유기물을 구성하는 각 화학물질의 이론적 산소요구량(Theoretical Oxygen
Demand, ThOD)은 화학물질에 따라 다르고, 측정방법(BOD, CODMn, CODCr)에
따라서도 산소요구량 값이 다르게 나타난다. 일반적으로 경험적 산화율은 BOD
20∼40%, CODMn 30∼60%, CODCr 90% 이상으로 알려져 있으며, 특히 난분해성
유기물을 다량 함유하는 산업폐수는 유기물 측정방법에 의한 산화력의 차이로
실제 산화율이 다르거나, 특히 BOD, CODMn 를 측정할 때 산화율이 낮게 측정
되어 실제 시료중의 유기물 양보다 저평가될 가능성이 있다.
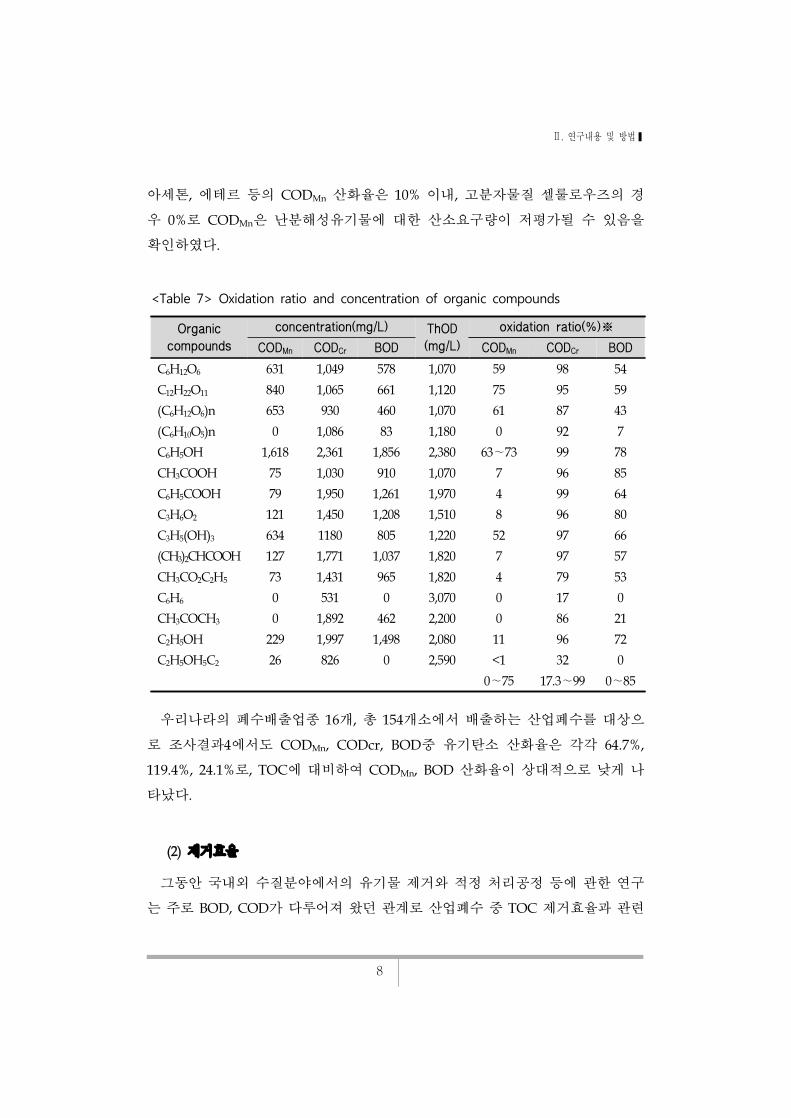
日本의 위생시험법 주해3에 따르면 대표적인 유기물질인 글루코오스 등 15개
유기화합물에 대해 CODMn, CODCr, BOD을 각각 비교 실험한 결과, Table 과 같
이 이론적 산소요구량(ThOD)에 대한 산화율은 CODCr > BOD > CODMn의 순으
로, CODMn산화율이 가장 낮게 나타났다. 그리고 휘발성유기화합물질인 벤젠,
Ⅱ. 연구내용 및 방법❚
8
아세톤, 에테르 등의 CODMn 산화율은 10% 이내, 고분자물질 셀룰로우즈의 경
우 0%로 CODMn은 난분해성유기물에 대한 산소요구량이 저평가될 수 있음을
확인하였다.
Organic compounds
concentration(mg/L) ThOD(mg/L)
oxidation ratio(%)※
CODMn CODCr BOD CODMn CODCr BOD
C6H12O6 631 1,049 578 1,070 59 98 54
C12H22O11 840 1,065 661 1,120 75 95 59
(C6H12O6)n 653 930 460 1,070 61 87 43
(C6H10O5)n 0 1,086 83 1,180 0 92 7
C6H5OH 1,618 2,361 1,856 2,380 63∼73 99 78
CH3COOH 75 1,030 910 1,070 7 96 85
C6H5COOH 79 1,950 1,261 1,970 4 99 64
C3H6O2 121 1,450 1,208 1,510 8 96 80
C3H5(OH)3 634 1180 805 1,220 52 97 66
(CH3)2CHCOOH 127 1,771 1,037 1,820 7 97 57
CH3CO2C2H5 73 1,431 965 1,820 4 79 53
C6H6 0 531 0 3,070 0 17 0
CH3COCH3 0 1,892 462 2,200 0 86 21
C2H5OH 229 1,997 1,498 2,080 11 96 72
C2H5OH5C2 26 826 0 2,590 <1 32 0
0∼75 17.3∼99 0∼85
<Table 7> Oxidation ratio and concentration of organic compounds
우리나라의 폐수배출업종 16개, 총 154개소에서 배출하는 산업폐수를 대상으
로 조사결과4에서도 CODMn, CODcr, BOD중 유기탄소 산화율은 각각 64.7%,
119.4%, 24.1%로, TOC에 대비하여 CODMn, BOD 산화율이 상대적으로 낮게 나
타났다.
(2) 제거효율
그동안 국내외 수질분야에서의 유기물 제거와 적정 처리공정 등에 관한 연구
는 주로 BOD, COD가 다루어져 왔던 관계로 산업폐수 중 TOC 제거효율과 관련
Ⅱ. 연구내용 및 방법❚
9
한 연구사례는 많지 않다. 국내의 경우, 염색폐수 중 TOC제거를 위해 철염과 전
기분해공정을 적용한 사례5와 정수공정에서 입상활성탄을 이용한 사례6 등이
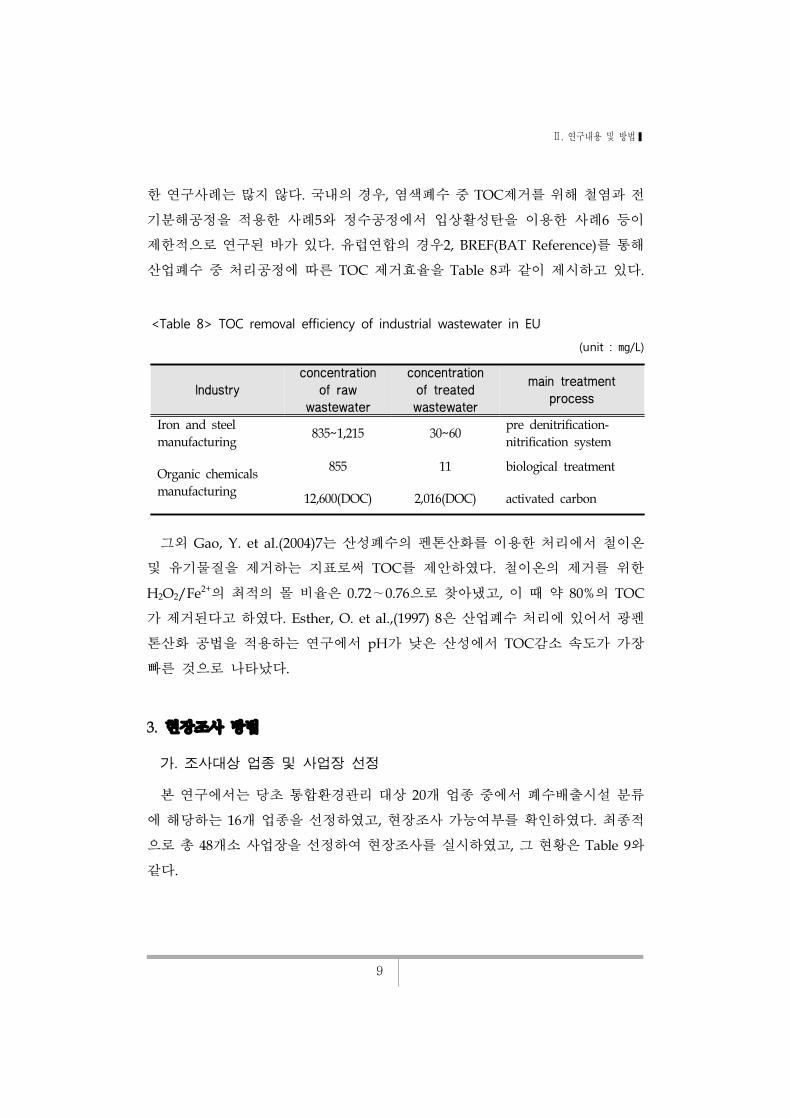
제한적으로 연구된 바가 있다. 유럽연합의 경우2, BREF(BAT Reference)를 통해
산업폐수 중 처리공정에 따른 TOC 제거효율을 Table 8과 같이 제시하고 있다.
Industryconcentration
of raw wastewater
concentration of treated wastewater
main treatment process
Iron and steel
manufacturing835~1,215 30~60
pre denitrification-
nitrification system
Organic chemicals
manufacturing
855 11 biological treatment
12,600(DOC) 2,016(DOC) activated carbon
<Table 8> TOC removal efficiency of industrial wastewater in EU
(unit : ㎎/L)
그외 Gao, Y. et al.(2004)7는 산성폐수의 펜톤산화를 이용한 처리에서 철이온
및 유기물질을 제거하는 지표로써 TOC를 제안하였다. 철이온의 제거를 위한
H2O2/Fe2+의 최적의 몰 비율은 0.72∼0.76으로 찾아냈고, 이 때 약 80%의 TOC
가 제거된다고 하였다. Esther, O. et al.,(1997) 8은 산업폐수 처리에 있어서 광펜
톤산화 공법을 적용하는 연구에서 pH가 낮은 산성에서 TOC감소 속도가 가장
빠른 것으로 나타났다.
3. 현장조사 방법
가. 조사대상 업종 및 사업장 선정
본 연구에서는 당초 통합환경관리 대상 20개 업종 중에서 폐수배출시설 분류
에 해당하는 16개 업종을 선정하였고, 현장조사 가능여부를 확인하였다. 최종적
으로 총 48개소 사업장을 선정하여 현장조사를 실시하였고, 그 현황은 Table 9와
같다.

Ⅱ. 연구내용 및 방법❚
10
Category of industrial for integrated management
Category of industrial wastewater discharge
facility
Invested number on each scale
of wastewater discharge facility
1 2
1. Electronic generation facility70. Thermal power generation
plant2 1
2. Primary nonferrous
manufacturing facility
58. Copper rolling, extrusion and
draft products manufacturing
facility
1
59. Aluminum rolling, extrusion
and draft products manufacturing
facility
2
3. Semiconductor manufacturing
facility
4. electronic components
manufacturing facility
67. Semiconductor and electronics
components manufacturing
facility
4
5. Basic chemicals manufacturing
facility
30. the others basic chemicals
manufacturing facility1 1
31. Basic nonorganic chemicals
manufacturing facility1
27. Petrochemical basic
compounds manufacturing
facility
2 1
6. Primary steel manufacturing
facility
55. Primary steel manufacturing
facility3
7. Fertilizer and nitrogen
chemicals manufacturing facility
34. Fertilizer and nitrogen
chemicals manufacturing facility1
8. Textiles, dying, finishing and
processing facility
18. Textiles, dying and processing
facility1 2
9. Pulp, paper and paperboard
manufacturing facility
10. the others paper, paperboards
manufacturing facility
23. Pulp, paper and paperboard
manufacturing facility3
<Table 9> Investigated status each on category of wastewater discharge facility

Ⅱ. 연구내용 및 방법❚
11
나. 현장조사 내용
조사대상 업종별 사업장의 현장을 방문하여 폐수배출 및 처리시설 운영과 관
련한 설문조사와 폐수배출시설 허가서, 처리시설 운영 및 자가측정분석 등 관련
자료를 수집하고, 수질분석을 위해 기본적으로 처리전 폐수 원수와 최종 처리수
시료를 채취하였다. 그 외 필요한 경우, 주요 폐수 배출원으로 판단되는 공정폐
수를 추가로 채취하였다.
Category of industrial for integrated management
Category of industrial wastewater discharge
facility
Invested number on each scale
of wastewater discharge facility
1 2
11. Chemicals manufacturing
facility
37. Medical materials and
medicine manufacturing facility2 1
43. Magnetic and optical
medium, photographic chemicals
and sensitive materials
manufacturing facility
1
48. the others chemical materials
manufacturing facility2
12. Plastic products
manufacturing facility
50. Rubber and plastic products
manufacturing facility3
13. Petroleum refining products
manufacturing facility
26. Petroleum refining products
manufacturing facility3
14. Alcoholic beverages
manufacturing facility
15. Nonalcoholic beverages and
ice manufacturing facility2
14. Alcoholic beverages
manufacturing facility1 1
15. Butchery, meat processing
and storage facility
4. Butchery, meat, marin products
processing and storage facility1 2
16. Synthesis rubber and plastic
materials manufacturing facility
36. Synthesis rubber and plastic
materials manufacturing facility3 1

Ⅱ. 연구내용 및 방법❚
12
(1) 설문조사
조사대상 사업장에 대한 설문조사 주요 항목은 Table 10과 같다. 설문조사 항
목은 크게 조사 사업장의 회사명, 해당업종, 규모 등의 일반현황 부분, 폐수처리
시설의 종류와 공정도, 폐수처리능력, 처리량 및 제거효율 등의 폐수처리시설 현
황과 처리수질 부분, 그리고 해당 폐수처리시설의 설치와 운영 및 관리 등에 소
요되는 비용 부분으로 구분할 수 있다. 설문조사는 조사서를 사전에 배포하고,
보다 자세한 사항은 현장방문시 현장 담당자와의 면담을 통해 작성하였다.
parameters contents
status
name, category, scale, wastewater treatment process, address,
charge, telephone number, operation year, operation time per a
day and a year and others
wastewater
treatment
facility
drawing of process, operation year, output point, discharge area,
treatment process, operation hour per a day, treatment methods,
operation hour a day, amount of sludge, main treatment process,
pollutants, use of chemicals, amount of wastewater of inlet and
outlet and others
cost of investment- direct expense : equipment, install, piping, building, grounding
and others
- indirect expense : engineering, construction, and others
cost of operation
and management
operation, personnel expenses, maintenance and repair, license,
usage of chemicals, usage of energy(electric, gas, oil) , treatment of
sludge, analysis of pollutants
operation
conditioncapacity, method of operation, cost and others
water quality
datas- analysis record (BOD, COD, SS, TN, TP) for last 6 months
- effluent limitation
<Table 10> Parameters of investigation for wastewater treatment facility
(2) 수질분석
수질분석은 TOC(DOC)를 중심으로 BOD, CODCr, CODMn, TSS를 병행하였다.
Ⅱ. 연구내용 및 방법❚
13
기본적으로 Table 11과 같이 수질오염공정시험기준을 따랐다.
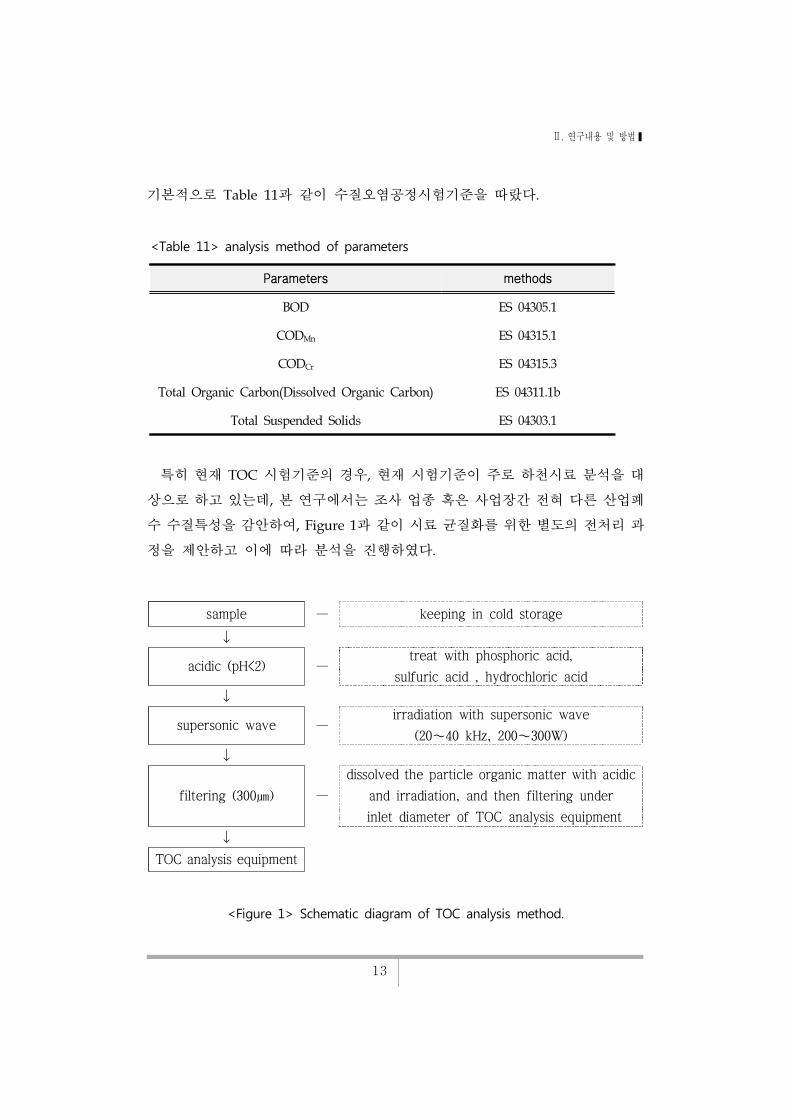
특히 현재 TOC 시험기준의 경우, 현재 시험기준이 주로 하천시료 분석을 대
상으로 하고 있는데, 본 연구에서는 조사 업종 혹은 사업장간 전혀 다른 산업폐
수 수질특성을 감안하여, Figure 1과 같이 시료 균질화를 위한 별도의 전처리 과
정을 제안하고 이에 따라 분석을 진행하였다.
sample — keeping in cold storage
↓
acidic (pH<2) — treat with phosphoric acid,
sulfuric acid , hydrochloric acid
↓
supersonic wave — irradiation with supersonic wave
(20∼40 kHz, 200∼300W)
↓
filtering (300㎛) —dissolved the particle organic matter with acidic
and irradiation, and then filtering under
inlet diameter of TOC analysis equipment
↓
TOC analysis equipment
<Figure 1> Schematic diagram of TOC analysis method.
Parameters methods
BOD ES 04305.1
CODMn ES 04315.1
CODCr ES 04315.3
Total Organic Carbon(Dissolved Organic Carbon) ES 04311.1b
Total Suspended Solids ES 04303.1
<Table 11> analysis method of parameters

Ⅲ. 연구결과 및 고찰❚
14
Ⅲ. 연구결과 및 고찰
1. TOC 제거효율 조사
가. 업종간 TOC제거효율 비교
조사 대상 업종별로 제거효율 조사결과를 Table 12에 정리하였고, 10. 펄프, 종
이 및 판지 제조업, 9. 섬유제품, 염색, 정리 및 마무리 가공업, 19. 합성고무 플라
스틱물질 제조업, 14. 기타 화학제품 제조업, 17. 알콜음료 제조업, 18. 도축, 육류
가공 및 저장처리업의 평균적인 TOC 제거효율이 90%이상이었다. 특히 전기업
(화력발전시설)은 50.5%, 1차비철금속제조업은 60.3%로 타업종에 비해 TOC제
거효율이 낮았는데, 이는 원폐수 중 TOC를 비롯한 유기성오염물질 농도가 낮기
때문에 제거효율이 높게 나올 수 없기 때문이다. 조사자료 중 (-)와 같이 비정상
적인 제거효율을 나타낸 8. 비료 및 질소화합물 제조업은 제거효율 평가에서 제
외하였다.
Category of industrial for integrated management
parameter
TOC DOC CODCr CODMn BOD5 TSS
1. Electronic generation
facility
average 50.5 45.3 48.0 82.2 60.0 95.0
MAX 93.4 87.2 89.3 96.5 97.6 100.0
MIN 23.8 16.3 20.4 57.3 32.5 85.7
2. Primary nonferrous
manufacturing facility
average 60.3 37.7 69.4 67.1 43.6 84.9
MAX 97.1 85.6 99.0 99.0 99.6 99.4
MIN 14.0 12.5 21.8 17.3 11.4 59.9
3. Semiconductor
manufacturing facility
4.electronic components
manufacturing facility
average 79.9 79.7 86.1 76.6 78.5 87.1
MAX 98.7 98.7 99.3 99.0 96.8 98.1
MIN 63.4 58.8 70.9 54.6 47.5 69.9
5.Basic chemicals
manufacturing facility
average 80.6 81.4 82.2 78.7 89.6 71.4
MAX 99.7 99.7 99.8 99.8 100.0 85.2
MIN 4.3 0.5 10.0 2.6 46.5 46.2
<Table 12> Comparison of removal efficiency of water pollutants in wastewater
from industry
(unit : %)

Ⅲ. 연구결과 및 고찰❚
15
나. 항목간 제거효율 비교
TOC와 기존의 CODMn, BOD5 항목간 TOC 제거율을 비교해 본 결과, Figure
2와 같이 일부 업종(화력발전시설, 1차비철금속제조업)을 제외하고, 나머지 업종
에서 항목간 제거율에 큰 차이 없이 유사한 경향을 나타내고 있다. 현재 이들
업종들이 폐수 중 TOC를 제거하기 위한 목적으로 처리공정을 설치, 운영하고
있지 않고 있음을 감안한다면, 정상적으로 폐수처리시설을 운영하고 있고, 특별
Category of industrial for integrated management
parameter
TOC DOC CODCr CODMn BOD5 TSS
6. Primary steel manufacturing facility
average 72.7 55.2 74.8 71.2 74.8 97.8MAX 98.1 98.3 98.4 96.1 99.5 99.5MIN 42.7 33.0 47.9 41.9 43.3 96.1
7. Fertilizer and nitrogen chemicals manufacturing facility
average 93.7 92.8 95.7 93.8 98.9 86.3MAX 97.2 97.9 96.6 95.0 99.5 93.6MIN 89.8 87.6 94.4 91.4 98.0 72.0
9. Pulp, paper and paperboard manufacturing facility
10. the others paper, paperboards manufacturing facility
average 90.6 89.5 94.8 92.9 99.0 96.5
MAX 97.7 95.3 98.3 97.9 99.6 100.0
MIN 86.8 85.7 90.7 89.6 98.3 91.5
11. Chemicals manufacturing facility
average 95.4 84.5 95.6 96.2 98.2 79.2MAX 98.7 98.9 99.1 98.9 99.5 99.9MIN 89.1 38.0 88.7 92.0 95.2 2.3
12. Plastic products manufacturing facility
average 71.6 62.5 81.3 72.9 73.3 78.4MAX 94.1 95.9 95.3 95.7 96.2 80.8MIN 41.0 29.2 63.6 46.1 33.2 76.1
13. Petroleum refining products manufacturing facility
average 85.8 82.8 94.4 90.7 94.1 86.3MAX 90.2 91.8 96.7 95.4 98.0 99.0MIN 83.2 77.9 92.4 87.2 90.0 66.7
14. Alcoholic beverages manufacturing facility
average 97.7 97.6 98.6 99.3 99.9 98.8MAX 99.4 99.5 99.7 99.7 100.0 99.8MIN 94.2 94.3 96.2 98.8 99.8 97.2
15. Butchery, meat products processing and storage facility
average 98.1 96.7 98.6 98.0 99.2 99.5MAX 98.8 98.3 99.3 99.1 99.9 99.6MIN 97.1 93.7 98.0 97.1 98.4 99.4
16. Synthesis rubber and plastic materials manufacturing facility
average 94.8 94.4 96.8 97.6 99.3 96.4MAX 99.4 99.4 99.5 99.5 99.9 99.8MIN 90.6 92.0 93.3 96.1 98.0 90.9

Ⅲ. 연구결과 및 고찰❚
16
한 경우가 아니라면 TOC를 제거하기 위한 대규모의 시설투자는 필요하지 않을
것으로 추정된다.
<Figure 2> Comparison of removal efficiency of water pollutants in wastewater from industry.
2. 폐수처리비용 조사 및 산정
설문조사 결과를 바탕으로 각 업종별로 TOC 처리비용을 산정하였다. 조사 대
상 16개 업종 중 비교적 설문조사 자료가 충분히 수집된 4.반도체 제조업, 5.기초
화학물질 제조업, 7.제1차 철강산업, 10.펄프종이 및 판지 제조업, 16.석유정제품
제조업, 18.도축, 육류가공 및 저장 처리업 등 6개 업종에 대해 폐수처리비용을
산정하였다.
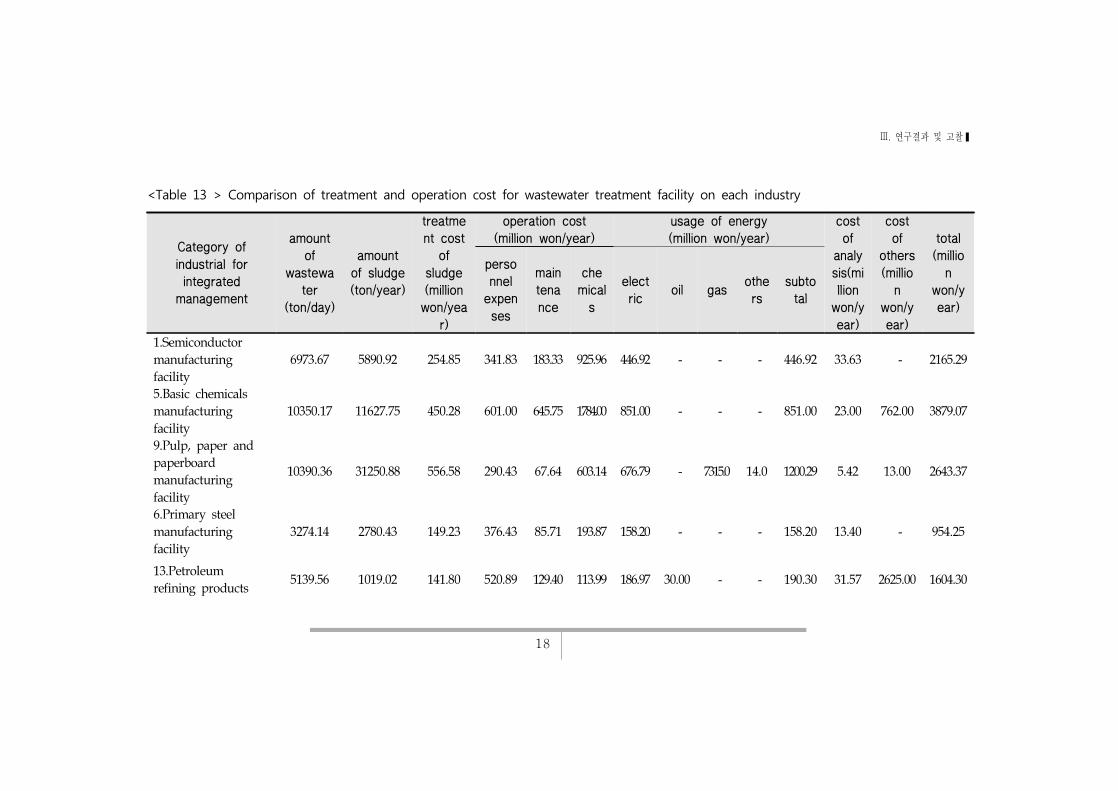
Table 13과 같이 6개 업종의 비용산정 결과에 따르면 폐수발생량이 가장 많은
업종은 4.반도체 제조업(6973.67톤/일), 5.기초화학물질 제조업(10350.17톤/일),
10.펄프종이 및 판지 제조업(10390.36톤/일) 이었다.
그에 따른 처리비용은 평균 1915백만원/년이었고, 5.기초화학물질 제조업

Ⅲ. 연구결과 및 고찰❚
17
3,879 백만원/년, 10.펄프종이 및 판지 제조업 2,643 백만원/년, 4.반도체 제조업
2,165 백만원/년 순으로 높게 조사되었다. 상대적으로 타업종에 비해 10.펄프종
이 및 판지 제조업의 슬러지 발생량 (31,250톤/년)이 많았으며, 그에 따른 슬러
지 처리비용도 556백만원/년으로 제일 많았다. 폐수처리시설 운전에 필요한 에
너지는 대부분 전기를 사용하는 것으로 나타났다. 5.기초화학물질 제조업은 폐
수처리시설 운전비가 타업종에 비해 높았다.
이와 같이, 폐수처리비용은 폐수량 외에 시설을 운전하기 위한 소비되는 전기,
가스 등 에너지사용량, 슬러지 발생에 따른 처리비용 등이 직간접으로 작용하며,
이는 업종별로 발생하는 폐수와 처리시설의 특성에 따라 좌우되는 것으로 여겨
진다.
<Figure 3> Comparison of generation amount of wastewater, sludge and treatment costs.
Ⅲ. 연구결과 및 고찰❚
18
Category of industrial for integrated
management
amount of
wastewater
(ton/day)
amount of sludge(ton/year)
treatment cost
of sludge(million won/yea
r)
operation cost(million won/year)
usage of energy(million won/year)
cost of
analysis(million won/year)
cost of
others(million
won/year)
total(million
won/year)
personnel expenses
maintenance
chemicals
electric
oil gasothers
subtotal
1.Semiconductor
manufacturing
facility
6973.67 5890.92 254.85 341.83 183.33 925.96 446.92 - - - 446.92 33.63 - 2165.29
5.Basic chemicals
manufacturing
facility
10350.17 11627.75 450.28 601.00 645.75 1784.00 851.00 - - - 851.00 23.00 762.00 3879.07
9.Pulp, paper and
paperboard
manufacturing
facility
10390.36 31250.88 556.58 290.43 67.64 603.14 676.79 - 7315.0 14.0 1200.29 5.42 13.00 2643.37
6.Primary steel
manufacturing
facility
3274.14 2780.43 149.23 376.43 85.71 193.87 158.20 - - - 158.20 13.40 - 954.25
13.Petroleum
refining products5139.56 1019.02 141.80 520.89 129.40 113.99 186.97 30.00 - - 190.30 31.57 2625.00 1604.30
<Table 13 > Comparison of treatment and operation cost for wastewater treatment facility on each industry

Ⅲ. 연구결과 및 고찰❚
19
manufacturing
facility
15. Butchery, meat
Products processing
and storage facility
293.25 1642.13 72.39 51.77 12.38 57.31 124.03 - - - 124.03 2.59 - 244.17
average 6,070.19 9,035.19 270.86 363.73 187.37 613.04 407.32 5.00 1,219.17 2.33 495.12 18.27 566.67 1,915.08
Ⅲ. 연구결과 및 고찰❚
20
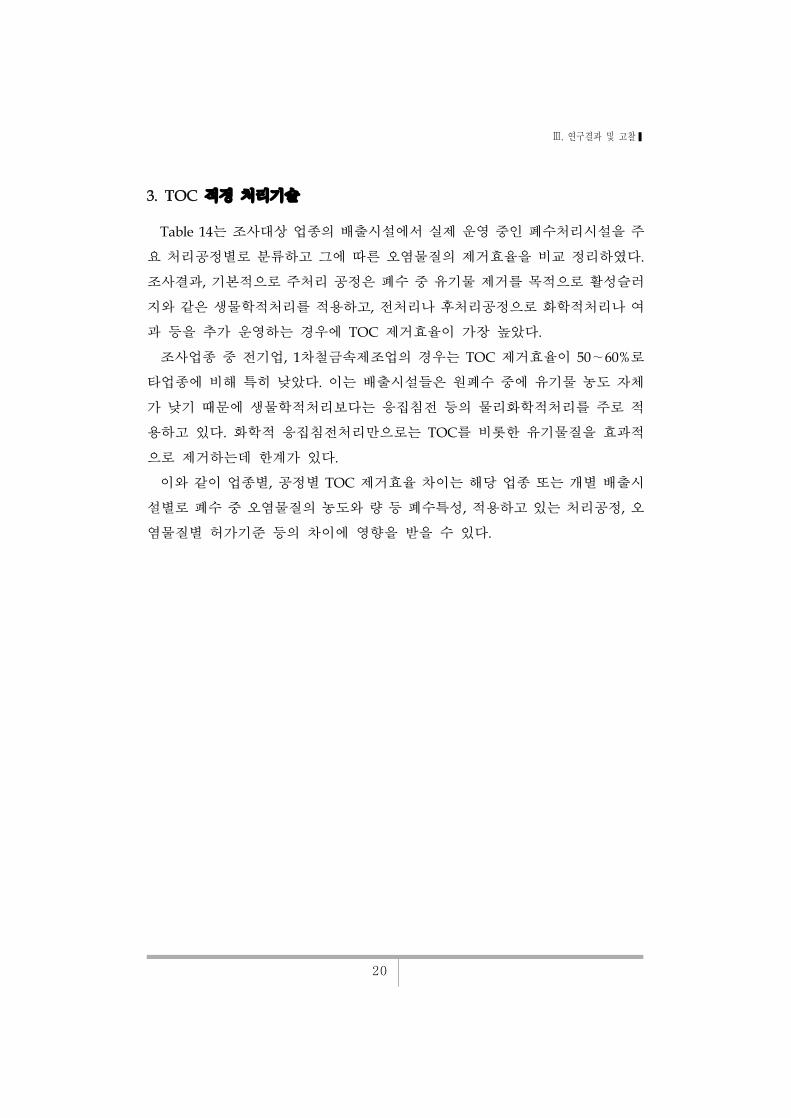
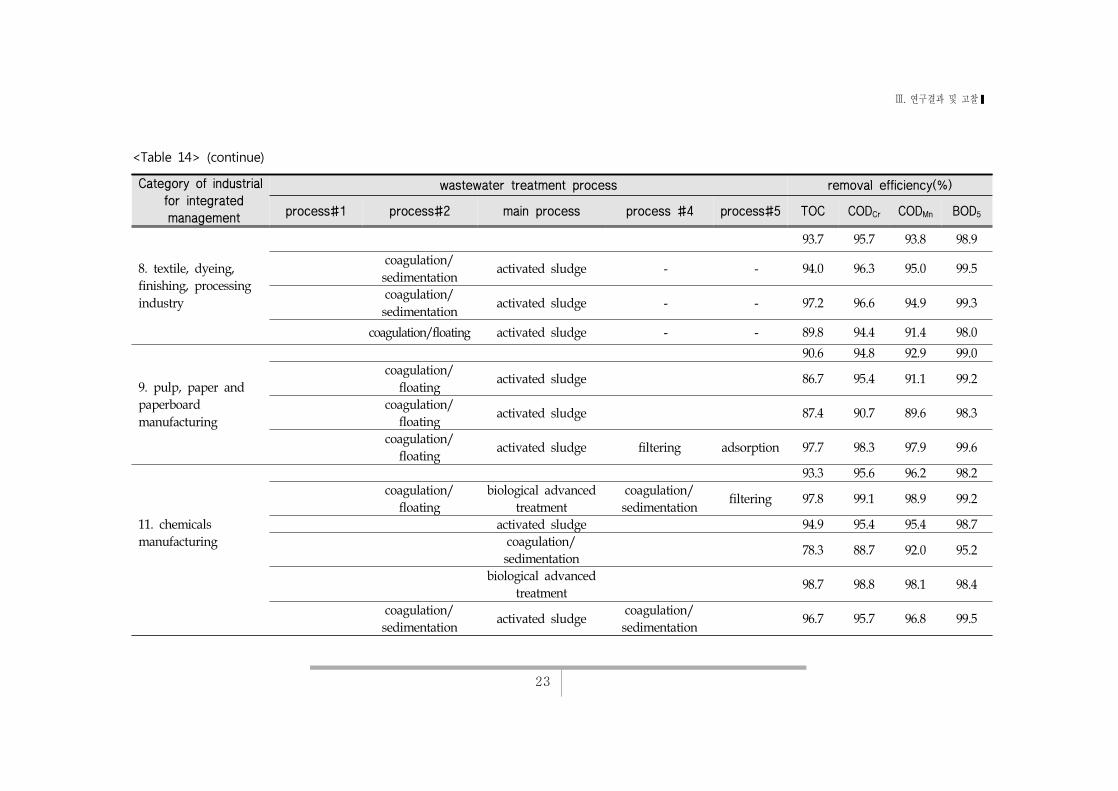
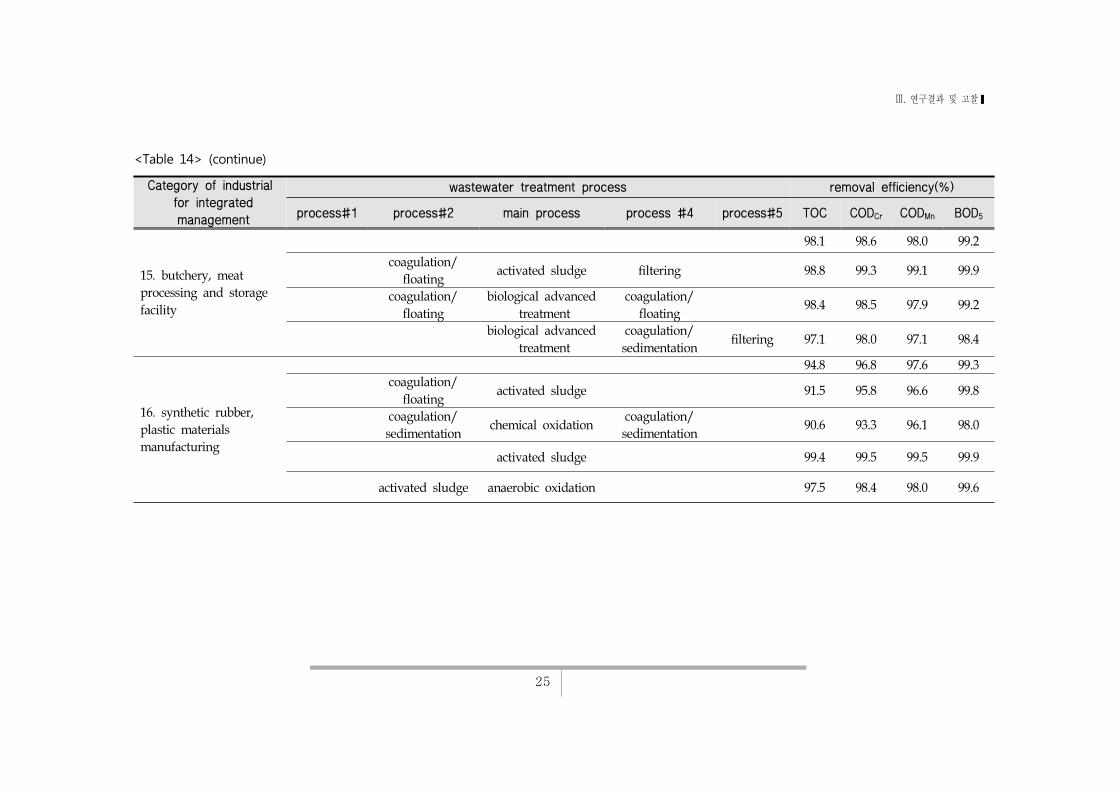
3. TOC 적정 처리기술
Table 14는 조사대상 업종의 배출시설에서 실제 운영 중인 폐수처리시설을 주
요 처리공정별로 분류하고 그에 따른 오염물질의 제거효율을 비교 정리하였다.
조사결과, 기본적으로 주처리 공정은 폐수 중 유기물 제거를 목적으로 활성슬러
지와 같은 생물학적처리를 적용하고, 전처리나 후처리공정으로 화학적처리나 여
과 등을 추가 운영하는 경우에 TOC 제거효율이 가장 높았다.
조사업종 중 전기업, 1차철금속제조업의 경우는 TOC 제거효율이 50∼60%로
타업종에 비해 특히 낮았다. 이는 배출시설들은 원폐수 중에 유기물 농도 자체
가 낮기 때문에 생물학적처리보다는 응집침전 등의 물리화학적처리를 주로 적
용하고 있다. 화학적 응집침전처리만으로는 TOC를 비롯한 유기물질을 효과적
으로 제거하는데 한계가 있다.
이와 같이 업종별, 공정별 TOC 제거효율 차이는 해당 업종 또는 개별 배출시
설별로 폐수 중 오염물질의 농도와 량 등 폐수특성, 적용하고 있는 처리공정, 오
염물질별 허가기준 등의 차이에 영향을 받을 수 있다.

Ⅲ. 연구결과 및 고찰❚
21
Category of industrial for integrated management
wastewater treatment process removal efficiency(%)
process#1 process#2 main process process #4 process#5 TOC CODCr CODMn BOD5
1. electric power
plant
50.2 48.0 82.1 60.0
coagulation/
sedimentationfiltering 93.4 89.3 92.8 97.6
coagulation/
sedimentationfiltering 34.2 34.3 57.0 32.5
coagulation/
sedimentationfiltering 23.1 20.4 96.5 50.0
2. primary
nonmetal
manufacturing
60.3 69.4 67.1 43.6
coagulation/
sedimentationactivated sludge 97.1 99.0 99.0 99.6
coagulation/
sedimentation
coagulation/
floating69.7 87.5 84.9 11.4
coagulation/
sedimentation- 14.1 21.8 17.3 20.0
3. semiconductor
manufacturing
61.9 59.6 44.8 41.1
coagulation/
sedimentationfiltering 7.6 -20.0 -50.7 -71.3
coagulation/
sedimentation63.6 70.9 54.6 47.5
coagulation/
sedimentationfiltering ozon 77.5 88.1 76.3 91.3
coagulation/
sedimentation
coagulation/
sedimentationactivated sludge filtering 98.7 99.3 99.0 96.8
<Table 14> Comparison of water pollutants removal efficiency on each industry and treatment process

Ⅲ. 연구결과 및 고찰❚
22
Category of industrial for integrated management
wastewater treatment process removal efficiency(%)
process#1 process#2 main process process #4 process#5 TOC CODCr CODMn BOD5
5. basic chemicals
manufacturing
80.6 82.2 78.7 89.6
coagulation/floating activated sludge - - 96.9 92.7 93.3 98.3
coagulation/floating activated sludge coagulation/floating filtering 99.7 99.8 99.8 100.0
-coagulation/
sedimentation- - 4.3 10.0 2.6 46.5
- activated sludge - - 97.1 98.1 97.8 99.9
- chemical oxidation - - 86.4 93.1 80.0 93.0
penton oxidation coagulation/floating activated sludgecoagulation/
sedimentationfiltering 99.1 99.2 98.6 99.7
6. primary steel
manufacturing
72.4 79.0 76.4 74.8
chemical oxidationcoagulation/
sedimentationfiltering 76.8 91.0 91.2 43.3
coagulation/
sedimentationactivated sludge
coagulation/
sedimentationfiltering 98.1 98.4 96.1 99.5
-coagulation/
sedimentation- - 42.4 47.7 41.9 81.6
7. fertilizer, nitrogen
chemicals
manufacturing -29.7 36.8 -21.8 7.7
-coagulation/
sedimentation- - -29.7 36.8 -21.8 7.7
<Table 14> (continue)
Ⅲ. 연구결과 및 고찰❚
23
Category of industrial for integrated management
wastewater treatment process removal efficiency(%)
process#1 process#2 main process process #4 process#5 TOC CODCr CODMn BOD5
8. textile, dyeing,
finishing, processing
industry
93.7 95.7 93.8 98.9
coagulation/
sedimentationactivated sludge - - 94.0 96.3 95.0 99.5
coagulation/
sedimentationactivated sludge - - 97.2 96.6 94.9 99.3
coagulation/floating activated sludge - - 89.8 94.4 91.4 98.0
9. pulp, paper and
paperboard
manufacturing
90.6 94.8 92.9 99.0
coagulation/
floatingactivated sludge 86.7 95.4 91.1 99.2
coagulation/
floatingactivated sludge 87.4 90.7 89.6 98.3
coagulation/
floatingactivated sludge filtering adsorption 97.7 98.3 97.9 99.6
11. chemicals
manufacturing
93.3 95.6 96.2 98.2
coagulation/
floating
biological advanced
treatment
coagulation/
sedimentationfiltering 97.8 99.1 98.9 99.2
activated sludge 94.9 95.4 95.4 98.7
coagulation/
sedimentation78.3 88.7 92.0 95.2
biological advanced
treatment98.7 98.8 98.1 98.4
coagulation/
sedimentationactivated sludge
coagulation/
sedimentation96.7 95.7 96.8 99.5
<Table 14> (continue)

Ⅲ. 연구결과 및 고찰❚
24
Category of industrial for integrated management
wastewater treatment process removal efficiency(%)
process#1 process#2 main process process #4 process#5 TOC CODCr CODMn BOD5
12. plastic products
manufacturing
71.6 85.1 72.9 73.3
coagulation/
floating
coagulation/
sedimentation41.0 63.6 46.2 33.2
coagulation/
sedimentationfiltering 79.7 96.3 76.9 90.6
coagulation/
sedimentationactivated sludge
coagulation/
sedimentationfiltering 94.1 95.3 95.7 96.2
13 petroleum
refining products
manufacturing
88.5 94.4 90.7 94.1
coagulation/
floatingactivated sludge 84.0 94.1 87.2 90.0
coagulation/
floatingactivated sludge 83.3 92.4 89.5 94.2
coagulation/
sedimentation
coagulation/
floating
biological advanced
treatmentfiltering 98.0 96.7 95.4 98.0
14. alcohol beverage
manufacturing
97.7 98.6 99.3 99.9
activated sludgecoagulation/
sedimentationfiltering 94.2 96.2 98.8 99.8
biological advanced
treatment
coagulation/
floatingactivated sludge
coagulation/
sedimentation99.4 99.7 99.7 100.0
activated sludge 98.2 99.1 99.5 99.8
activated sludge 98.9 99.3 99.3 100.0
<Table 14> (continue)
Ⅲ. 연구결과 및 고찰❚
25
Category of industrial for integrated management
wastewater treatment process removal efficiency(%)
process#1 process#2 main process process #4 process#5 TOC CODCr CODMn BOD5
15. butchery, meat
processing and storage
facility
98.1 98.6 98.0 99.2
coagulation/
floatingactivated sludge filtering 98.8 99.3 99.1 99.9
coagulation/
floating
biological advanced
treatment
coagulation/
floating98.4 98.5 97.9 99.2
biological advanced
treatment
coagulation/
sedimentationfiltering 97.1 98.0 97.1 98.4
16. synthetic rubber,
plastic materials
manufacturing
94.8 96.8 97.6 99.3
coagulation/
floatingactivated sludge 91.5 95.8 96.6 99.8
coagulation/
sedimentationchemical oxidation
coagulation/
sedimentation90.6 93.3 96.1 98.0
activated sludge 99.4 99.5 99.5 99.9
activated sludge anaerobic oxidation 97.5 98.4 98.0 99.6
<Table 14> (continue)

Ⅲ. 연구결과 및 고찰❚
26
Figure 4는 도축, 육류가공 및 저장처리업에서 운영하고 있는 폐수처리공정
사례를, Figure 5는 제1차 철강제조업의 폐수처리공정 사례를, Figure 6는 펄프,
종이 및 종이제품제조업의 폐수처리공정 사례를 각각 도식화한 것이다. 도축, 육
류가공 및 저장처리업의 경우 생물학적 처리를 주처리 공정으로 하고, 이의 전
후로 부상, 화학적 응집침전처리와 여과공정을 추가하고 있다. 제1차 철강제조
업 역시 생물학적처리를 중심으로 1, 2차 화학적 응집침전처리와 여과공정을 추
가하고 있다. 펄프, 종이 및 종이제품제조업은 중화, 생물학적처리, 화학적 응집
침전공정을 운영하고 있다.
<Figure 4> Diagram of wastewater treatment processes of butchery, meat
processing and storage facility.

Ⅲ. 연구결과 및 고찰❚
27
<Figure 5> Diagram of wastewater treatment processes of primary steel manufacturing.
<Figure 6> Diagram of wastewater treatment processes for pulp, paper and paper board
manufacturing.
Ⅳ. 결 론❚
28
Ⅳ. 결 론
본 연구는 향후 예상되는 산업폐수 중 TOC배출허용기준 도입과 관련하여,
현재 우리나라의 산업폐수 중 TOC 처리수준을 파악하고, 이를 통해 합리적 규
제수준을 결정하기 위한 정책에 활용하고자 하였다. 그 연구 결과는 다음과 같
다.
TOC 제거효율은 펄프, 종이 및 판지 제조업, 섬유제품, 염색, 정리 및 마무리
가공업, 합성고무 플라스틱물질 제조업, 기타 화학제품 제조업, 알콜음료 제조
업, 도축, 육류가공 및 저장처리업에서 평균 90%이상이었다. 전체적으로 TOC
제거효율은 BOD, COD 등 기존 유기물 항목과 유사한 경향인 것으로 조사되었
다.
폐수처리비용을 평가한 결과, 10.펄프종이 및 판지 제조업의 슬러지 발생량
(31,250톤/년)이 많았으며, 그에 따른 슬러지 처리비용도 556백만원/년으로 제
일 높았다. 폐수처리시설 운전에 필요한 에너지는 대부분 전기를 사용하는 것
으로 조사되었다. 처리비용은 기초화학물질 제조업(3,879백만원/년), 펄프종이
및 판지제조업(2,643백만원/년) 순으로 높았는데, 펄프종이 및 판지 제조업의
경우 슬러지발생량 및 에너지 사용량(가스), 기초화학물질 제조업의 경우는 시
설운전 비용이 타업종에 비해 높았기 때문이다.
TOC 처리효율은 활성슬러지와 같은 생물학적처리를 적용하는 경우에 90%
이상으로 가장 높았다. 반면 유기물 농도가 낮은 폐수에 응집침전 등 물리화학
적 처리를 단독 적용하는 경우는 제거효율이 높지 않았다. 산업폐수중 TOC를
제거하기 위한 가장 적절한 폐수처리공정은 기본적으로 생물학적처리를 주처
리 공정으로 하고, 여기에 화학응집, 여과 등 다양한 공정을 전처리나 후처리
공정으로 추가 운영하는 것이 전체적으로 TOC 제거효율을 높일 수 있는 효과
적인 방안으로 평가되었다.
조사결과, 현재 산업현장에서는 규제물질인 BOD, COD 등을 제거하기 위한
조건에 최적화되어 있고, TOC 제거를 위한 별도의 처리시설을 설치·운영하지
는 않고 있다. 다만, BOD 등 유기물질들이 제거되면서 동시에 TOC도 일정수

Ⅳ. 결 론❚
29
준 이상의 제거효율을 나타내고 있었다.
고농도 유기물질을 다량 배출하는 배출시설이거나 업종별로 특이한 상황을
제외하고, TOC 제거를 위해 대규모 처리시설을 추가 설치하는 것 보다는 운전
조건 개선 등을 통해 TOC를 일정수준 이상 제거할 수 있을 것으로 여겨진다.
다만, 이를 위해서는 각각의 배출시설별로 폐수배출 특성, 처리시설의 관리수준
과 상황이 다른 만큼, 각 시설별로 적절한 TOC처리 기술과 조건에 대한 검토
는 반드시 필요할 것이다.
참 고 문 헌❚
30
참 고 문 헌
1. 국립환경과학원, 통합환경관리제도 적용을 위한 TOC기준(안) 설정 연구,
2015
2. 환경부, 산업폐수 TOC 배출허용기준 설정 방안 연구, 2014
3. 일본약학회편, 위생시험법주해, 1980
4. 최익원, 김재훈, 임종권, 박태진, 김세영, 손대희, 허인애, 류덕희, 유순주, 난
분해성 유기물 관리를 위한 산업폐수 TOC 기준 적용 방안 연구, 한국물환
경학회, 2015, 31, 1, 29-34
5. 윤용수, 정일현, 염색폐수의 전해처리에 의한 탈색 및 COD, TOC 제거특성,
한국환경분석학회지, 1998, 1, 2, 133-140
6. 백영애, 조유현, 홍병의, 김광호, 최영준, 입상활성탄의 표면특성과 TOC 제
거와의 상관성 연구, 상하수도학회지, 2008, 22, 3, 323-328,
7. Gao, Y., Min, Y., Jianying, H., Yu, Z., Fenton's process for simultaneous
removal of TOC and Fe from acidic waste liqure, 2003
8. Esther, O., Omar, L., Mathias, H., Thomas, M., Andre, B., Industrial
waste water treatment : large scale development of a light-enhanced
Fenton reaction, 1997