· title: growth rate of indian spices industries: past trend and future prospects author:...
TRANSCRIPT
Sarangi & Singh, Apeejay - Journal of Management Sciences and Technology 2(1), Oct- 2014(ISSN -2347-5005)
29
Growth Rate of Indian Spices Exports:Past Trend and Future Prospects
Pradeepta K. Sarangi Shreya SinghAsst. Professor HR Executive
Apeejay Institute of Technology- Greater Noida Overdrive Electronics Pvt. Ltd., [email protected]
Abstract: Spices have been in demand for ever and also have been a source of foreign currencies for
exporters. India has grabbed this opportunity and has emerged as one of the major exporters of spices
products. This study analyzes the export trend for the past years and makes an attempt to projects the
values for future years for Indian spices industry. Graphical analysis with linear trend line has been
used to predict the future prospects, growth prediction and export of Indian spices products.
Keywords: Indian Spices Export, Past trend, Future prospects, Graphical Analysis
I INTRODUCTION
India is one of the key exporters of spices products. The US is the major importer followed by China and
other countries. During the year 2012-13, exports to the US was of US$ 351.6 million followed by to China
of US$ 335.39 million[1]. The export of the basic agricultural commodities by developing countries can be
relied upon to earn valuable foreign exchange due to the ever demand of spices. Indian brands have yet to
find markets beyond middle-class and ethnic populations. Indian spices exports have gained value
realisation despite very small growth in volumes[2]. However, Marketing problems are more frequently
faced by growers and exporters mainly due to failure in establishing market linkages rather than lack of
market opportunities [3].
II NEED OF THE STUDY
Knowing the future demand helps any industry/sector to make better planning and infrastructure
management. Spices industry is one of the such areas where advance planning plays a major and effective
role. Graphical method is one of the oldest, popular and easy to use method for getting future trends for
time series data. Sarangi et al. [4] have used this method to predict the future trend for Indian automobile
industry..
III OBJECTIVE
The main objective of this study is to analyzes the export trend for the past years and to find out the
forecasted values for the export of Indian spices products. This study uses secondary (historical) data
collected from the website of Spices Board of India (export quantity data) for the period 2005-06 to
2012-13 available online at “http://www.indianspices.com”. Though, India exports more that fifteen

Sarangi & Singh, Apeejay - Journal of Management Sciences and Technology 2(1), Oct- 2014(ISSN -2347-5005)
30
categories of spices products, here in this study only six categories have been discussed to keep the study
simple.
IV IMPLEMENTATION DETAILS, RESULTS AND DISCUSSION
The collected data have been preprocessed and grouped. Graphical method has been used to study the
time series data and to find the forecasted values. For each of the products, a graph has been plotted in
Microsoft Excel using the historical time series data for the year 2005-06 to 2012-13. A trend line is drawn
and then it is extrapolated to find the forecasted values for the period 2013-14 and 2014-15. Six spices
products such as Pepper, Cardamom (small), Cardamom (large), Chilli, Ginger and Turmeric have been
taken into consideration in this study.
A. Analysis of PepperThe historical data of export quantity of pepper from the period 2005-06 to 2012-13 is given in figure-1
below. A graph is plotted in Microsoft Excel using the historical time series data and extrapolated with the
linear trend line. Finally the forecasted values for the period 2013-14 and 2014-15 have been calculated.
Years Export Quantity(Tonnes)2005-06 17,3632006-07 28,7262007-08 35,0002008-09 25,2502009-10 19,7502010-11 18,8502011-12 26,7002012-13 16,000
Fig. 1 Historical Data and the Graphical Representation with Trend line: Pepper
In the figure above, the curved line represents the graph and the straight line moving downward representsthe trend line. Similar approach has been used to draw the graph and trend line for all other productsdiscussed in this study.
TABLE 1FORECASTED VALUES: PEPPER
Sl.No. Years Forecasted Values
9 2013-14 19,000
10 2014-15 18,000
Sarangi & Singh, Apeejay - Journal of Management Sciences and Technology 2(1), Oct- 2014(ISSN -2347-5005)
31
The graph indicates that, the export of pepper initially increases till the year 2007-08 and then follows a
sharp decline till 2010-11. After 20110-11, the export increases and again decreases in 2012-13. However,
the analysis shows an increase in export of pepper for the year 2013-14 and a decrease in quantity for the
year 2014-15. The fore casted values for the period 2013-14 2014-15 is given in table below.
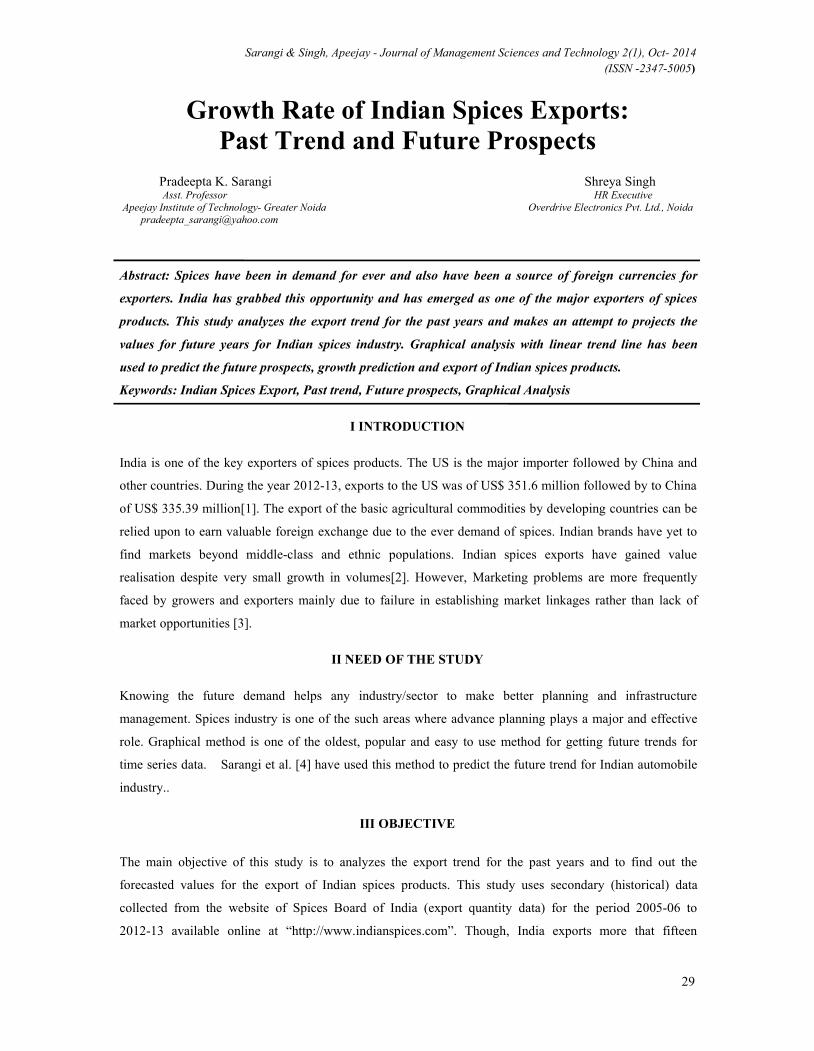
B. Analysis of Cardamom (small)
The historical data and the graphical representation with trend line from the period 2005-06 to 2011-13 isgiven in figure-2 below.
Years Export Quantity(Tonnes)2005-06 8632006-07 6552007-08 5002008-09 7502009-10 19752010-11 11752011-12 46502012-13 2250
Fig.2 Historical Data and the Graphical Representation with Trend line: Cardamom(small)
In the graph above, the curved line indicates the actual values (2005-06 to 2012-13) and the straight lineindicates the trend line. In X-axis the values represent year and in Y-axis the values represent exportquantity. The forecasted values for the period 2013-14 2014-15 are given in Table-2 below
TABLE 2FORECASTED VALUE: CARDAMOM(SMALL)
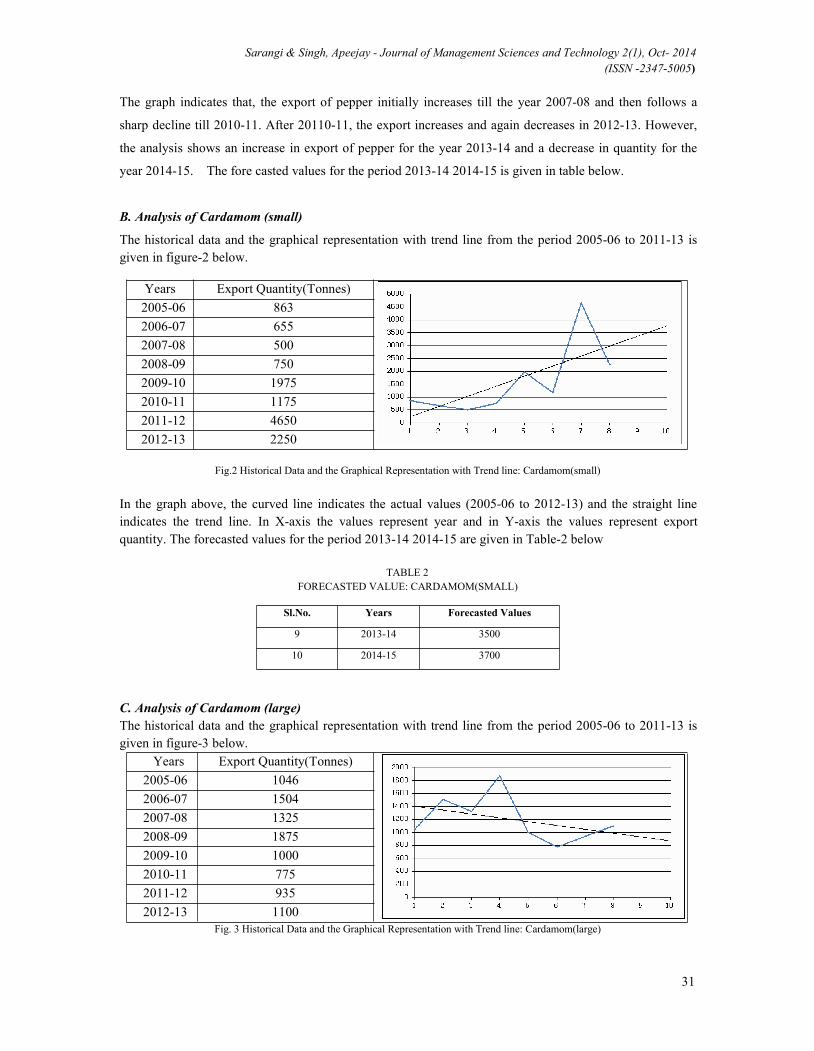
C. Analysis of Cardamom (large)The historical data and the graphical representation with trend line from the period 2005-06 to 2011-13 isgiven in figure-3 below.
Years Export Quantity(Tonnes)2005-06 10462006-07 15042007-08 13252008-09 18752009-10 10002010-11 7752011-12 9352012-13 1100
Fig. 3 Historical Data and the Graphical Representation with Trend line: Cardamom(large)
Sl.No. Years Forecasted Values
9 2013-14 3500
10 2014-15 3700

Sarangi & Singh, Apeejay - Journal of Management Sciences and Technology 2(1), Oct- 2014(ISSN -2347-5005)
32
The export quantity graph for the product Cardamom(large) follows a zig-zag path showing an
inconsistency in export quantity. The similar pattern is also observed in case of future trend. The forecasted
values for the period 2013-14 2014-15 is given in table 3 below.
TABLE 3FORECASTED VALUE: CARDAMOM(LARGE)
D. Analysis of ChilliThe historical data and the graphical representation with trend line from the period 2005-06 to 2011-13 isgiven in figure-4 below.
Years Export Quantity(Tonnes)2005-06 1131742006-07 1490222007-08 2090002008-09 1880002009-10 204002010-11 240,0002011-12 241,0002012-13 281,000
Fig. 4 Historical Data and the Graphical Representation with Trend line: Chilli
In the graph above, the curved line indicates the actual values (2005-06 to 2012-13) and the straight line
indicates the trend line. In X-axis the values represent year and in Y-axis the values represent export
quantity. The graph indicates that during the year 2009-10 the export of Chilli has drastically decreased to a
lowest value of 20400 in the series. However, in the immediate next year the export has again increased
unexpectedly. The upward movement of the trend line signifies an in increase in the export quantity for
the year 2013-14 & 2014-15. The forecasted values for these period are given in table 4 below
TABLE 4FORECASTED VALUE: CHILLI
Sl.No. Years Forecasted Values
9 2013-14 925
10 2014-15 850
Sl.No. Years Forecasted Values
9 2013-14 260,000
10 2014-15 285,000

Sarangi & Singh, Apeejay - Journal of Management Sciences and Technology 2(1), Oct- 2014(ISSN -2347-5005)
33
E. Analysis of GingerThe historical data and the graphical representation with trend line from the period 2005-06 to 2011-13 isgiven in figure-5 below.
Years Export Quantity(Tonnes)2005-06 94112006-07 75352007-08 67002008-09 50002009-10 55002010-11 157502011-12 215502012-13 19850
Fig. 5 Historical Data and the Graphical Representation with Trend line: Ginger
The graph indicates that, till the year 2008-09 the export of Ginger was decreasing year by year and after
2009-10, it suddenly gets accelerated and reaches the highest ever. However, towards the year 2011-12 it
starts declining. The analysis shows an increase in quantity for the year 2013-14 and then a decline for the
year 2014-15. The forecasted values for the period 2013-14 2014-15 is given in table 5 below.
TABLE 5FORECASTED VALUE : GINGER
F. Analysis of TurmericThe historical data and the graphical representation with trend line from the period 2005-06 to 2011-13 isgiven in figure-6 below.
Years Export Quantity(Tonnes)2005-06 46,4052006-07 517122007-08 492502008-09 52,5002009-10 507502010-11 492502011-12 795002012-13 80,050
Fig.6 Historical Data and the Graphical Representation with Trend line: Turmeric
SI.No. Year Forecasted Values
9 2013-14 200500
10 2014-15 220500

Sarangi & Singh, Apeejay - Journal of Management Sciences and Technology 2(1), Oct- 2014(ISSN -2347-5005)
34
The graph indicates a flat movement of the export of turmeric till the year 2010-11. After 2010-11, the
export increases sharply indicating an upward trend for the year 2013-14 and 2014-15. The forecasted
values for the period 2013-14 2014-15 is given in the table below 6.
TABLE 6FORECASTED VALUE: TURMERIC
V CONCLUSION
This study has made an attempt to study and analyze the past trend of products of Indian spices industry.
The Graphical method has been used to find the future prospects. Analysis of past trend implies the the
spices industry has passed through an inconsistency growth. Though, growth has been obtained still the
uncertainty can not be neglected. The forecasted values calculate by Graphical method indicate a growth for
the industry in the coming years. Finally, this study is purely the results of authors experiment. It does not
comment or complement any other reports published by any authority,organization or researchers.
REFERENCES
[1] http://www.ibef.org/exports/spice-industry-indias.aspx
[2] Punnathara, C. J., “Spices exports surge by 47%”,http://www.thehindubusinessline.com/industry-and-economy/agri-biz/spices-exports-surge-by-47/article3154956.ece.
[3] Rohatash, K. B., B. K. Sikka, A. Singh, M. L. Sharma, N. K. Singh, “Challenges and Constraints of Marketing and Export ofIndian Spices in India”, International Conference on Technology and Business Management, March 28-30, 2011.
[4] Sarangi, P. K., S. Bano and M. Pant, "Future Trend in Indian Automobile Industry: A Statistical Approach", Apeejay-Journal ofManagement Sciences and Technology, Vol. 2 (1), Feb -2014.
Sl.No. Years Forecasted Values
9 2013-14 76000
10 2014-15 84000