contentsresearch.sabr.org/journals/files/sabr-baseball_research...the league'sstars. because...
TRANSCRIPT

CONTENTS
'~~""__ ."..II ••LlI Team Ever? David Surdam 80The Best
John McGraw Comes to New York by Clifford Blau ~3
56-Game Hitting Streaks Revisited by Michael Freiman 11
Lou vs. Babe in'Real Life and in Pride ofthe Yankeesby Frank Ardolino 16
The Evolution ofWorld Series Scheduling by Charlie Bevis 21
Batting Average by Count and Pitch 1YPeby J. Eric Bickel & Dean Stotz 29
Harry Wright by Christopher Devine 35
International League RBI Leaders by David F. Chrisman 39
Identifying Dick Higham by Harold Higham 45
Best ofTimes, Worst ofTimes by Scott Nelson 51
Baseball's Most Unbreakable Records by Joe Dittmar 54
/Ri]] Ooak's Three "No-Hitters" by Stephen Boren , , , , , ,62
TIle Kiltg is Dead by Victor Debs 64
Home Runs: More Influential Than Everby Jean-Pierre Caillault , 72
The Most Exciting World Series Gamesby Peter Reidhead & Ron Visco 76
Kamenshek, the All-American by John Holway 83
Most Dominant Triple Crown Winner by Vince Gennaro '.86
Preventing Base Hits by Dick Cramer , , , , , , , , 88
Not Quite Marching Through Georgia by Roger Godin 93
Forbes Field, Hitter's Nightmare? by Ron SeIter 95
RBI, Opportunities, and Power Hitting by Cyril Morong 98
Babe Ruth Dethroned? by Gabe Costa 102
Wanted: One First-Class Shortstop by Robert Schaefer 107
.; Does Experiellce Help ill tIle Post-Season?by Tom Hanrahan ' 111
jThe Riot at the First World Series by Louis P. Masur 114
Why Isn't Gil Hodges In the Hall ofFame?by John Saccoman It ••••••••••••••••••••••••118
From a Researcher's Notebook by AI Kermisch ' 123

EDITOR'S NOTE
I believe that this thirty-first issue of the Baseball ResearchJournal has something for everyone: controversy, nostalgia, originality, mystery-even a riot.
Starting back to front, the last article in this BRJ-as it has beenin the journal for two decades-is Al Kermisch's Notes From aResearcher, certainly one of the most popular and widely read features. This is Al's last column. He wrote it just weeks before hepassed away, and I am proud to include it here. His writing and hispresence will be missed.
No one can read Joe Dittmar's engaging piece on unbreakablerecords without trying to come up with one missed by the RecordsCommittee. A most unique research mystery is solved by HaroldHigham, who identifies his 19th century ancestor through variousphoto techniques, including those used by the FDI. Early star DickHigham is mostly misidelltified ill 19t11 century team photos.
Dick Cramer's statistical argument that fielders are more important than pitchers is sure to raise hackles. Eric Bickel and DeanStotz wade in with more original data on batting average by pitchcount, a fascinating topic for every baseball fan and researcher. CyMorong tells us that you can't knock in runs unless there are runners on ba..'ie-a.nd then who the best RBI are..
original work on early International League RBI leaders.John Holway gets in touch with his feminine side, and argues
that the best fielding first baseman ever wore skirts. While DavidSl..lrdam reminds us that the 1966 Yankees weren't really that bad,despite their last-place finish.
Young Chris Devine, a winner ofthe Jack Kavanagh award, offersa solid article on Harry Wright, which should reassure all ofus thatthe future ofbaseball research is in good hands. Also, a number offine articles on aspects of the World Series, including one on the"riot" at the 1903 games, are included. I was particularly taken withCharlie Bevis's timely piece on World Series scheduling.
There are other fine COlltributioI1S by some of SABR's most creative thinkers and veteran writers. I trust you will enjoy this issueoftheBRJ.
Jim .Charlton

CLIFFORD BLAU
John McGraw Comes to New YorkThe 1902 New York Giants
John McGraw was one of the most successfulbaseball managers ever, leading the New YorkGiants to 10 pennants in his 30 years with the
club. His arrival in mid-1902 marked the turningpoint in the fortunes of the Giants, a team which hadbeen struggling for years. However, despite an influxof new players whom McGraw brought with him toNew 'York, the Giants barely showed any improvement for the balance of the 1902 season, losing over60 percent of their decisions in that period. This article will review the Giants' 1902 season and attempt toshow why McGraw was unable to make an immediateimprovement in the team.
1902 was a seaSOll ofturrTIoil not just for tIle Giarlts,but for all oforganized baseball. TIle NatioIlal Leaguewas at war not only with the American League, butwith itself. In its December 1901 meeting, four ownerssupported a plan proposed by John Brush to convertthe National League into a trust which would beowned by all eight owners. This trust would own all
OWllers supported the candidacy leaguepresident Albert Goodwill Spalding. Spalding had ledthe league in its successful battles with the PlayersLeague in 1890 and the American Association in 1891,a.rId these four owners felt he was the perfect choice todefend the league against the upstart AmericanLeague. The two sides couldn't reach an agreement,and the trust group, including Giants owner AndrewFreedman, left the meeting. The other four owners,claiming a quorum was still present, elected Spaldingpresident. A lawsuit was filed by the trust group, andthe matter wasn't resolved until the beginning ofApril1902. The season schedule was adopted on AprilS,just 12 days before openiJ.?g day.
The American League, under its strong president,Ban Johnson, had moved into several large Easterncities in 1901 and declared itself a major league on a
CLIFFORD BLAU is a 20-year veteran ofSABR. When he'snot researching baseball, he wishes that he were.
3
par with the NL. While its playing talent was probablynot equal to the NL's that year, it did succeed inattracting such top stars as Nap Lajoie and Cy Young.Following the 1901 season, the AL took advantage ofthe chaotic situation in the NL to step up its playerraids. Many of the NL's top players, such as ElmerFlick, Jimmy Sheckard, Jesse Burkett, AI Orth, andEd Delahanty signed with the American League.Meanwhile, the Giants seemed to be making littleeffort to resign their players or obtain new talent. Bythe end of 1901, regulars Kip Selbach, Jack Warner,Charley Hickman, and pitcher Luther Taylor, who hadled the league's pitchers in Ka.nles started, llad signedwith American League teams. Most damaging, futureHall ofFame shortstop George Davis, the Giants manager in 1901, signed with the Chicago WhiteStockings. Later, third basenlan SallllllY Strangjumped ship as well. The decline of the Giants sincethey were purchased by the petulant, domineeringAndrew Freedman in 1894 seemed to be complete.
had finished last or llext to last the past three seasons.Freedman likely expected the trust scheme to beadopted, and that the Giants would get first pick ofthe league's stars. Because of the stalemate over thatissue, they llad to rebuild the club the old-fashionedway. With no National Agreement between the majorand minor leagues, there was no draft to provide acheap souce of new talent.
Late in December, the Giants started puttingtogether a team for 1902 by signing minor leaguepitchers Roy Evans and John Burke as well as catcherManley Thurston. They also purchased second baseman/manager George Smith from the Eastern Leaguechampion Rochester team. An offer was made to JesseBurkett, who had just jumped to the AL, but heturned it down. The Giants also tried to woo managerNed Hanlon away from their crosstown rivals, theBrooklyn Superbas, but that was also unsuccessful.Toward the end of January, Freedman chose HoraceFogel to manage the team.
Fogel's managerial experience consisted of one sea-
THE BASEBALL RESEARCH JOURNAL
son at the helm of Indianapolis of the NationalLeague. Otherwise, he made his living as a sportswriter and editor, mainly in Philadelphia. Fogel promised to sign some stars, but all he found were collegeplayers, American League rejects, and "Roaring" BillKennedy, a one-time star pitcher who had been cutloose by the Superbas. As February neared its end,however, the Giants seized an opportunity whenChicago released first baseman Jack Doyle. Fogelquickly signed Doyle and appointed· him team captain, giving him responsibility for the team duringgames. Doyle had been a member of the championBaltimore Orioles in 1896 and had spent three seasons with the Giants before 1901. He was a good hitter and aggressive baserunner. However, he tended tomake enemies wherever he went, as he was demanding and lacking in diplomacy.
The Giants didn't go south for spring training,which was not unusual at the time. Fourteen playersreported to the Polo Grounds on March 24 to beginworkil1g out ullder tIle directioll of Jack Doyle. Morearrived the next few days. As practice began, the teamlined up this way: Captain Doyle at first, Smith at second, Walter Anderson at short, Billy Lauder at third,and Frank Bowerll1an behilld tIle plate, backed up byGeorge Yeager. Veteran George Van Haltren would bethe center fielder, with several players competing forthe other two outfield spots, including Jim Jackson,
the Giants managing to win them all. Five othergames were cancelled due to the weather. When thathappened, the Giants could work out with weights orexercise machines in the Polo Grounds clubhouse.
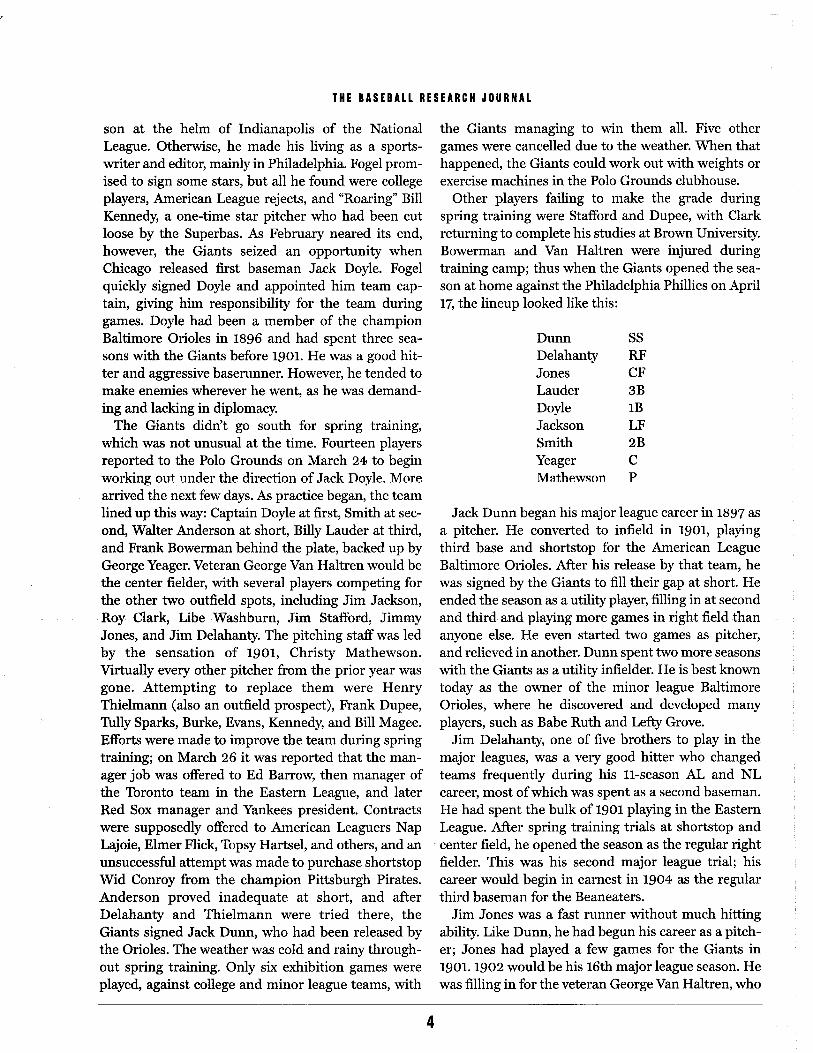
Other players failing to make the grade duringspring training were Stafford and Dupee, with Clarkreturning to complete his studies at Brown University.Bowerman and Van Haltren were injured duringtraining camp; thus when the Giants opened the season at home against the Philadelphia Phillies on April17, the lineup looked like this:
Dunn SSDelahanty RFJones CFLauder 3BDoyle IBJackson LFSmith 2BYeager CM"athewson P
Jack Dunn began his major league career in 1897 asa pitcher. He converted to infield in 1901, playingthird base and shortstop for the American LeagueBaltimore Orioles. After his release by that team, hewas signed by the Giants to fill their gap at short. Heended the season as a utility player, filling in at second
Jones, and Jim Delahanty. The pitching staff was ledby the sensation of 1901, Christy Mathewson.Virtually every other pitcher from the prior year wasgone. Attempting to replace them were HenryThielmann (also an outfield prospect), Frank Dupee,Tully Sparks, Burke,Evans, Kennedy, and Bill Magee.Efforts were made to improve the team during springtraining; on March 26 it was reported that the manager job was offered to Ed Barrow, then manager ofthe Toronto team in the .Eastern League, and laterRed Sox manager and Yankees president. Contractswere supposedly offered to American Leaguers NapLajoie, Elmer Flick, Topsy Hartsel, and others, and anunsuccessful attempt was made to purchase shortstopWid Conroy from the champion Pittsburgh Pirates.Anderson proved inadequate at short, and afterDelahanty and Thielmann were tried there, theGiants signed Jack Dunn, who had been released bythe Orioles. The weather was cold and rainy throughout spring training. Only six exhibition games wereplayed, against college and minor league teams, with
anyone else. He even started two games as pitcher,and relieved in another. Dunn spent two more seasonswith the Giants as a utility infielder. He is best knowntoday as the owner of the minor league BaltimoreOrioles, where he discovered arId developed IIIarlYplayers, such as Babe Ruth and Lefty Grove.
Jim Delahanty, one of five brothers to play in themajor leagues, was a very good hitter who changedteams frequently during his II-season AL and NLcareer, most ofwhich was spent as a second baseman.He had spent the bulk of 1901 playing in the EasternLeague. After spring training trials at shortstop and
-center field, he opened the season as the regular rightfielder. This was his second major league trial; hiscareer would begin in earnest in 1904 as the regularthird baseman for the Beaneaters.
Jim Jones was a fast runner without much hittingability. Like Dunn, he had begun his career as a pitcher; Jones had played a few games for the Giants in1901. 1902 would be his 16th major league season. Hewas filling in for the veteran George Van Haltren, who
4

THE BASEBALL RESEARCH JOURNAL
was expected to be the Giants regular center fielder in1902, as he had been since 1894. Van Haltren wasnursing a cold and an injured finger. At 36, he was oneof the oldest players in the league, and was frequentlyreferred to in print as "Rip" Van Haltren.
Billy Lauder was a good-field, no-hit third baseman.According to Ned Hanlon, Lauder was as good a thirdbaseman as had ever played the game. Unfortunatelyhe had been out ofprofessional baseball for two years,and was never able to regain his hitting eye.
Jim Jackson was a speedster who spent his rookieseason in 1901 with the Baltimore Orioles. He had a.291 on-base average and a .330 slugging average inthat year. Joining the Giants in 1902, where he had todeal with the foul strike rule, his hitting took a predictable fall. In addition, his fielding average fell froma league-leading .971 in 1901 to .897 in 1902.
George "Heinie" Smith was a slick-fielding, weakhitting second baseman. Smith played for Rochesterin the International League in 1901. At 30 years old,this was Smith's first year as a regular in the majorsafter four previous trials. He would soon be regardedas tIle best defensive second baseman on the Giantssince John M. Ward in 1893-94, but his big leaguecareer would end the following year with Detroit.Smith and Lauder were. the only Giants to play over109 games in· 1902.
George Yeager was a veteran of five big league sea-sons as a. catcher.. 1902 would be his last
Bowerman.After a band concert which concluded with "The
Star-Spangled Banner:' and the first ball was thrownOllt by a former fire commissioner, the Giants got theirseason off to a rousing start with a 7-0 victory. Overthe next few days they would lose more than they wonbefore rattling off a seven-game winning streak toclose their home stand. As they headed for Chicago,the Giants had a 10-5 record. Their winning streakended abruptly as Chicago swept the three-gameseries. However, the first two games were later disallowed by the league as Fogel had discovered beforegame three that the pitching rubber at West SideGrounds was two feet too close to home. (Thosegames were later replayed, with the Giants winningboth.) Not including the two protested games, theGiants won four of the first six games on the trip. OnMay 16 in Cincinnati, as the new Palace of the Fanswas dedicated, George Yeager pinch-hit a two-run single in the ninth to cap a five-run rally and give New
5
Third baseman Billy Lauder (top)and John McGraw (bottom).

THE BASEBALL RESEARCH JOURNAL
GIANTS 1902 TRANSACTIONS
4/25 Released Magee4/28 Signed Joe Bean4/29 Released Jim Delahanty5/5 Purchased Joe Bean from
Rochester5/8 Luther Taylor rejoined team
(had signed over winter butjumped to AL)
5/14 Steve Brodie released5/20 Released Henry Thielman
and Thurston5/24 Signed Tom Campbell5/29 Acquired Hess, Hartley5/30 Signed Libe Washburn6/1 Signed McDonald6/3 Signed O'Hagen6/4 McDonald retired, Jackson
released6/5 Hartley retired6/7 Signed Steve Brodie, Nichols,
Hendricks6/14 Signed Blewett6/17 Released Steve Brodie6/18 Signed Steve Brodie6/19 John Hendricks given notice
,.....C: .,··01 ... "",... "",,,,,,,...,,,,,,
6/20 Jack Doyle released (6/19"?)6/26 Joe Bean given notice of
release (6/25?)7/1 Signed Heinie Wagner7/8 Roy Clark given notice of
release, signed John McGraw7/15 Released Blewett and Clark7/17 Released O'Hagen, Burke,
Yeager, Sparks, Evans,Wagner; signed Bresnahan,Cronin, McGann, McGinnity
7/21 Signed George Browne, R.Miller
7/25 Released Libe Wasllburn8/1 Signed Joe Wall8/6 Jim Jones suspended for bal
ance of season9/1 Borrowed Jack Robinson
from Bridgeport
York a 14-7 mark. They looked like a pennant contender. However, the good times were over, as theteam would lose 43 ofits next 51 decisions. A few daysafter the Giants' come-from-behind victory, Fogel wasquoted in a Cincinnati newspaper making disparaging remarks about golden boy Christy Mathewson. Hemade a quick retraction, but his days at the helm ofthe Giants were numbered.
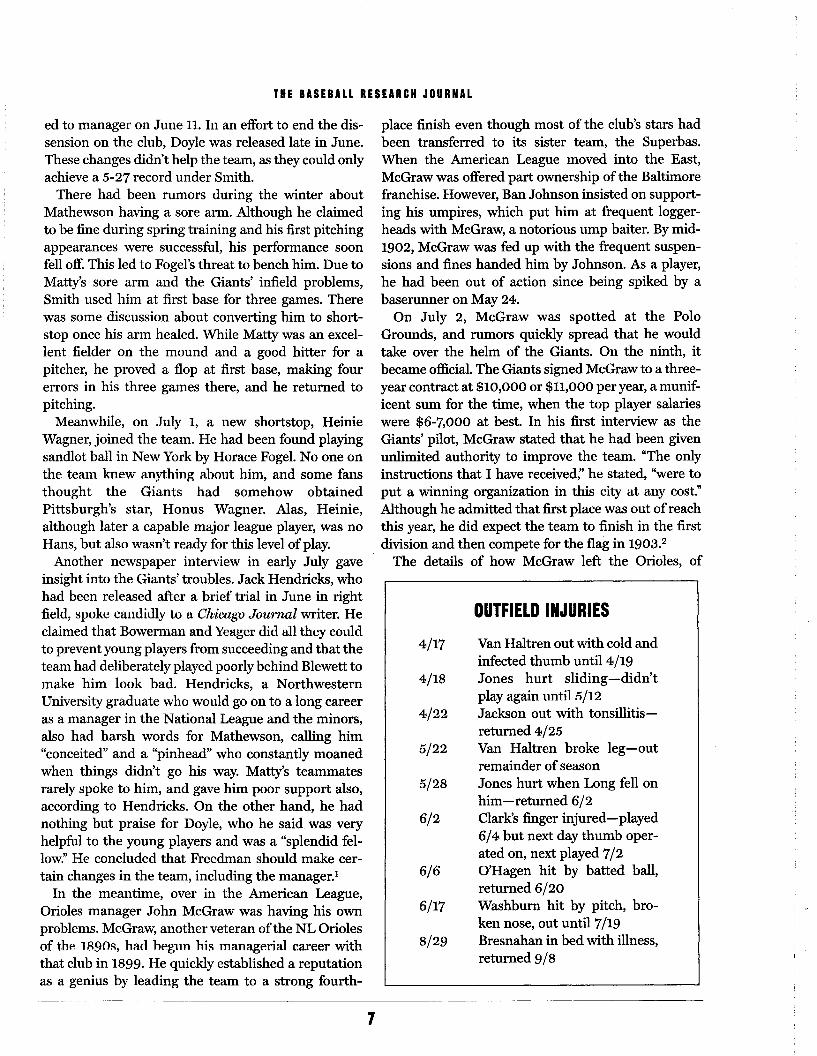
Personnel changes were coming fast and furious(see sidebar). Taylor jumped back to the Giants. BillMagee was released after lasting only two innings inhis first start. Delahanty was dropped after sevengames. Steve Brodie, a veteran center fielder and former Orioles teammate of Doyle, was signed, released,signed again, released again, and finally signed for athird time the next day after an injury to the Giants'latest outfielder. Indeed, injuries and illnesses wouldplague the team all season, especially amongst theoutfielders. Brodie, despite his multiple comings andgoings, was the only person to play more than 67games in the outfield for New York. The most severeiIljury occurred on May 22, when Van lIaltren brokehis leg sliding in Pittsburgh. He would llliss theremainder of the season, and his major league careerwould end the following year. A shortstop, Joe Bean,who had played with Smith at Rochester in 1901, wassigned. Unfortunately, Rochester had an option on hisservices for 1902, and they got a court injunctiona2:,:un:st the Giants. This matter was resolved in a few
Thielman, who was used in the outfield for a trio ofgames as well as on the mound, was dropped in midMay, as was catcher Thurston, who never got into aga.me. Ol.ltfielders came an.d went after two or threegames. Pitcher Bob Blewett from GeorgetownUniversity was given a chance, but he lived up to hisname, going 0-2 in five games. Libe Washburn, starpitcher at Brown University, was used in the outfieldfor a few games but never got a chance on the mound.Roy Clark had rejoined the team, but, like Mathewsonand Sparks, didn't play on Sundays. (This was a problem only when the team was playing in three westerncities, since Sunday ball was illegal in the four easterncities and Pittsburgh.)
After losing 14 of their last 15 games in May, andrumors of dissension spread, changes were made. OnJune 2 Jack Doyle was stripped of his captaincy, withGeorge Smith taking over that role. The next day,Fogel left the team due to his father's death, and henever returned to the helm, with Smith being promot-
6
THE BASEBALL RESEARCH JOURNAL
ed to maIlager 011 JUlIe 11. III an effort to el1d the dissension on the club, Doyle was released late in June.These changes didn't help the team, as they could onlyachieve a 5-27 record under Smith.
There had been rumors during the winter aboutMathewson having a sore arm. Although he claimedto be fine during spring training and his first pitchingappearances were successful, his performance soonfell off. This led to Fogel's threat to bench him. Due toMatty's sore arm and the Giants' infield problems,Smith used him at first base for three games. Therewas some discussion about converting him to shortstop once his arm healed. While Matty was an excellent fielder on the mound and a good hitter for apitcher, he proved a flop at first base, making fourerrors in his three games there, and he returned topitching.
Meanwhile, on July 1, a new shortstop, HeinieWagner, joined the team. He had been found playingsandlot ball in New York by Horace Fogel. No one onthe team, k.new anyth.ing about him, and some fansthought the Giants had somehow obtainedPittsburgh's star, Honus Wagner. Alas, fleinie,although later a capable major league player, was noHans, but also wasn't ready for this level of play.
Another newspaper interview in early July gaveinsight into the Giants' troubles. Jack Hendricks, whohad been released after a brief trial in June in right
place finish even though most of the club's stars hadbeen transferred to its sister team, the Superbas.When the American League moved into the East,McGraw was offered part ownership of the Baltimorefranchise. However, Ban Johnson insisted on supporting his umpires, which put him at frequent loggerheads with McGraw, a notorious ump baiter. By mid1902, McGraw was fed up with the frequent suspensions and fines handed him by Johnson. As a player,he had been out of action since being spiked by abaserunner on May 24.
On July 2, McGraw was spotted at the PoloGrounds, and rumors quickly spread that he wouldtake over the helm of the Giants. On the ninth, itbecame official. The Giants signed McGraw to a threeyear contract at $10,000 or $11,000 per year, a munificent sum for the time, when the top player salarieswere $6-7,000 at best. In his first interview as theGiants' pilot, McGraw stated that he had been givenunlimited authority to improve the team. "The onlyinstructions that I have received;' he stated, "were toput a winning organization in this city at any cost.n
Although he admitted that first place was out ofreachthis year, he did expect the team to finish in the firstdivision and then compete for the flag in 1903.2
The details of how McGraw left the Orioles, of
clainled tllat Bowerl11al1 al1d Yeager did all tllCy COllldto prevent young players from succeeding and that theteam had deliberately played poorly behind Blewett tomake him look bad. Hendricks, a NorthwesternUniversity graduate 'who would go on to a long careeras a manager in the National League and the minors,also had harsh words for Mathewson, calling him"conceited" and a "pinhead" .who constantly moanedwhen things didn't go his way. Matty's teammatesrarely spoke to him, and gave him poor support also,according to Hendricks. On the other hand, he hadnothing but praise for Doyle, who he said. was veryhelpful to the young players and was a "splendid fellow:' He concluded that Freedman should make certain changes in the team, including the manager. l
In the meantime, over in the American League,Orioles manager John McGraw was having his ownproblems. McGraw, another veteran ofthe NL Oriolesof the 1890s, hail hegnn his managerial career withthat club in 1899. He quickly established a reputationas a genius by leading the team to a strong fourth-
7
4/17
4/18
4/22
5/22
5/28
6/2
6/6
6/17
8/29
Van Haltren out with cold andinfected thumb until 4/19Jones hurt sliding-didn'tplay again until 5/12Jackson out with tonsillitisreturned 4/25Van Haltren broke leg-outremainder of seasonJones hurt when Long fell onhim- returned 6/2Clark's finger injured-played6/4 but next day thumb operated on, next played 7/2O'Hagen hit by batted ball,returned 6/20Washburn hit by pitch, broken nose, out until 7/19Bresnahan in bed with illness,returned 9/8

THE BASEBALL RESEARCH JOURNAL
which he was part owner, and how he planned tostrengthen the Giants, soon became public. He hadarranged for a majority ofthe Orioles' stock to be soldto Andrew Freedman, who released McGraw andmany of the team's stars, including future Hall ofFamers Joe McGinnity and Roger Bresnahan, as wellas first baseman Dan McGann and pitcher JackCronin. This quartet joined McGraw and the Giantsfor his first game as manager on July 19. At the sametime, Joe Kelley, who had also played on the Orioles ofthe 1890s, signed with John T. Brush to beCincinnati's playing manager; joining him was centerfielder Cy Seymour. In the ten days between McGrawbeing announced as new manager and his first gamehe was supposedly trying to sign new players, but wasin fact being treated for appendicitis, which wouldplague him for the rest of the season.3
McGraw released seven players upon joining theGiants: Yeager, O'Hagen, Blewett, Wagner, Burke,Sparks, and Evans. Roy Clark received his ten-daynotice of release two days before McGraw's signing. Inaddition t.o the fOllr Baltimore players, the Giantssoon added left fielder George Browne, who had beenreleased by the Phillies, and pitcher Roscoe Miller,who jumped from the Detroit Tigers. Libe Washburnwas released on July 25, and Jimmy Jones was suspended and then released after assaulting umpire BobEmslie on August 6. Bresnahan split time between
wereplayers the Giants had previouslybecame·the new shortstop.
While the Giants lost their first game underMcGra",~, the teanl reportedly sllowed Inore "life" tha.ntlley llad ill surlle time. After two days oft' and an exhibition game versus the Orange (N.J.) Athletic Club,they took three out offive games against the Superbas.However, despite strong performances from some ofthe newcomers, the team kept on struggling, and finished the season in last place.
Injuries continued to plague the Giants, and one ledto a challenge to McGraw's authority. FrankBowerman's foot was hurt by a foul ball on August 2.The next day the team played an exhibition game inBayonne, New Jersey, and Bowerman didn't suit up.In fact, due to injuries on the Bayonne club, RogerBresnahan caught all nine innings for both teams.Since Bowerman hadn't asked permission to sit out,McGraw fined him fifty dollars. Bowerman arguedthat the fine wasn't fair, and he refused to suit up
8
agail1 Ul1til it was rescillded. He threatened to jump tothe American League but gave in and was back in uniform on August 7. In his first game behind the plateafter the incident, however, he committed three errorsand five passed balls. While it is not known ifhis poorfielding was deliberate, it so disgusted Mathewsonthat in the ninth inning, after the final two passedballs, Christy began lobbing the ball over the plate,and a three to two deficit quickly became an eight totwo loss. Despite all this, and later rumors of signingwith the St. Louis Browns, Bowerman remained withthe team through the 1907 season.
John T. Brush sold most of his stock in the Reds inAugust, and a few days later was made managingdirector of the Giants. He worked with McGraw intrying to obtain new players. Late in the season, withMcGraw aiding in the negotiations, he boughtFreedman's stock and became president of the Boardof Directors. A new era in Giants baseball had begun.
Why didn't McGraw turn around the Giants' fortunes in 1902 despite the in.flllx of new talent? Thereason seems to be lacl{. of·interest. Apparel1tly, 11edecided soon after arriving in New York that theGiants wouldn't be able to reach the first division andturned his attention to obtainin.g players for 1903. Inthis he was successful; he signed several AmericanLeaguers and the team rallied to second place thatyear. However, this meant that McGraw was away
gaIIles clue to scoutillg trips alld 11is appeIldicitis. Theteam's record in these games was 8-12, little differentfrom their overall mark after McGraw became manager. As further evidence that McGraw wasn't hisllsllal fig11ti11g self, lle wasn~t ejected from a singlegame by the umpires with the Giants in 1902. He hadpromised to contain his temper after coming to NewYork, and did so. A year later, he was quoted, "Baseballis only fun for me when I'm out front and winning. Idon't give a bag of peanuts for the rest of the game:'
The Giants continued to be disrupted by injuries aswell as rainouts; seven games were postponedbetween September 9 and October 1. Also, McGrawbegan the transition from player-manager to benchmanager; 1902 was his last season as a regular player,and he played his last game of the· season onSeptember 11. This probably took some getting usedto for McGraw.
He made one serious personnel misjudgment,releasing Tully Sparks and signing Roscoe Miller.Miller went just 1-8 with a 4.58 ERA. The following

THE BASEBALL RESEARCH JOURNAL
season he won two and lost five with a 4.13 ERA.Meanwhile, Sparks was in the midst of a 12-yearmajor league career which saw him credited with 121pitching wins and an ERA of 2.79.
The result of the above was that the Giants' recordunder McGraw was just 25-38-2, although 41 of thegames were played at home. But they gained only ahalf-game on seventh place. By contrast, theCincinnati Reds after hiring Joe Kelley as managerwere 36-26, climbing from seventh to fourth.
NOTES1 Chicago Journal as reprinted in the Sporting Life,July 12, 1902.
2 New York Herald, July 10, 1902.3 Details of the story vary. Some sources claim
McGraw had reached an agreement with Freedmanby mid-June. Mrs. McGraw-in her biography ofherhusband-claimed that the jump to New York waspart of a plan between McGraw, Freedman, Brush,and Ban Johnson to put an AL team in New York,but she offers no evidence to support this notion.
4 Stolen base statistics are based on data processed forRetrosheet, although more proofreading will berequired before the files are released on theRetrosheet Web site. Only 129 games of 139 playedare included, some of them incomplete.
York Teleg"rarrt and the Sporting Life. Other newspapers consulted were the New York Times, New YorkHerald, New York Evening World, New York Press, andThe Sporting News. In addition, the following booksand other records were used:
Alexander, Charles. John McGraw. New York:Viking Press, 1988.
Carter, Craig, ed. The Sporting News CompleteBaseball Record Book. St. Louis, Missouri: TheSporting News Publishing Company, 1994.
Durso, Joe. The Days ofMr. McGraw. EngelwoodCliffs, NJ: Prentice Hall, 1969.
McGraw, Blanche with Arthur Mann. The RealMcGraw. New Yorl<: David McKay, 1953.
Nathan, David, ed. Baseball Quotations. New York:Ballantine Books, 1993.
Thorn, John and Pete Palmer, eds. Total Baseball,Third Ed. New York: Penguin Books, 1993.
1902 Official National League Statistics.Information Concepts Inc. records of1902 season.
9
THE 1902 STYLE OF PLAY
There was some excitement on the field that yearalso. The Giants took part in three triple playsduring the season, two of them on defense. OnJune 6, the Pirates made one against the Giantswhich began with a hotly disputed catch by second baseman Claude Ritchey. June 26 saw theGiants make a sharp 6-4-3-2 triple play againstthe Phillies in a losing cause. With the. basesloaded and no outs, Bean started a routine double play on a ground ball-but when the runnerfrom second tried to score, first basemanO'Hagen snapped the ball to Yeager, who taggedthe runner out. That game also featured thePhillies' use of a courtesy runner, a not unusualpractice at the time. When their catcher was hitin the head with a pitch, a pinch-runner wasused for him, but the catcher went back behindthe ll]ate ill tIle llext illllillg. TIle fillal triple playcame in the first inning of the July 15 galIlee Tllisone was started by Mathewson when he caught abunt pop. Another fielding feat of note was performed by Jones on June 30, in another .loss,when he became the second major leaguer tothrow out three runners at the plate in a game.
The was innow. were more
shallow due to the dead ball, yet baserunnersheedlessly tried for extra bases. Sometimes itworked out; on August 9, in the second game ofa doubleheader, Dan McGann scored from second on a bunt, and four <.lays laler McGrawscored from second on a groundout to the shortstop. Roger Bresnahan repeated McGann's featon September 10, and on August 19, GingerBeaumont of the Pirates scored the winning runfrom first base on a single. However, ·more oftenthis recklessness resulted in lost baserunners.On August 1, the Giants had three runnersthrown out at home in just two innings. In thesame game that Bresnahan scored from secondon a bunt, the Giants had six runners thrown outstealing or trying for an extra base; they lost thegame by one run. On October 2, the Beaneatersand Giants combined to lose 12 baserunners viaunforced outs; a 13th escaped only due to a

THE BASEBALL RESEARCH JOURNAL
throwing error after he was picked off first. Thecapper, however, had to be the Pirates' baserunningadventures ofJuly 12. Beaumont made the final outof the third going from second to third on agrounder. Hans Wagner led off the fourth with atriple but was out at home on Kitty Bransfield'sgrounder to first. Bransfield was then thrown outstealing. Claude Ritchey walked, but was thenpicked off by Mathewson for the third out. Just toshow that they hadn't learned anything, JimmyBurke led offthe fifth with a double, but was nailedtrying to stretch it into a triple, the fifth consecutivebaserunning error. Luckily the Bucs had a surplusof runners that game; they won 4-0.
Base stealing was a similarly high-risk gambit in1902. The overall success rate was about 55 percent.4 Attempts to steal home were fairly common;double steals with runners on first and third andtwo outs were a popular strategy. The available statistics for the Giants games show 40 attempts tosteal home. Ofthese, 11 were completely successful,four lllore resulted in a run as well as an out at secOlld (ill those days, ifone runner was thrown out ona double steal, the other runner got credit for astolen base), and twice errors resulted in a runscored. The other 23 ended in an out at home. Boththe Giants and their opponents had about the samesuccess rate on steals. The Giants stole 152 bases
ers defended against the steal as follows:
SB AGAINST CS AGAINST SB%Bowerman 76 81 48.4Bresnahall 10 11 47.6Yeager 40 27 59.7Others 7 5 58.3Total 133 124 51.8
There was plenty ofexcitement at the Polo Groundson September 6. On a day when the Giants gave agold watch to the groundskeeper Murphy, a firebroke out in the grandstand. Mathewson andMcGann helped to put it out. Meanwhile, beingshorthanded behind the plate, the Giants tried outJack Robinson, on loan from Bridgeport of theConnecticut State League, where he was a part-timecatcher. Five wild pitches/passed balls and four
10
stolen bases allowed later, he was replaced afterseven innings. New York fell to Pittsburgh, 9-3.
Until 1910, a ball thrown into the stands was stillin play. The Giants took advantage of this rule onSeptember 29, when Frank Bowerman circled thebases after hitting a routine grounder to Superbas'shortstop Bill Dahlen, who overthrew first.
Bunting was much more common in 1902 than itis now. On September 1, in the second game of adoubleheader, St. Louis took advantage ofthe weakGiants defense. Five of the first six batters in thesecond inning bunted, leading to three runs.
In later years, McGraw would disparage theMathewson-at-first-base experiment, but in factMatty played several games in the outfield afterMcGraw took over the club, as did other pitchers;McGinnity even spent a game as the second baseman. This was a common practice due to the smallrosters at the time; clubs usually carried no morethan 16 players. A table showing outfielder gamesby position follows.
LF CF RFDunn* 1 3 40Brodie 0 109 0
Jones 50 3 14Browne 50 0 3Bresnahan 0 0 27
Van Haltren 3 13 8Clark 2 9 9O'Hagen 0 3 5Hendricks 0 0 7Delahanty 0 0 7Cronin 0 0 7Lauder 2 0 2Wall 0 0 3Washburn 0 2 1McDonald 0 0 2Mathewson 1 0 3McGinnity* 0 0 4Thielman 1 2 0Burke 0 0 2
Callahan 0 0 1
Hartley 1 0 0
*Dunn and McGinnity each played one more game thanshown in the official statistics.

MICHAEL FREIMAN
56-Game Hitting Streaks Revisited
In an article in the 1994 Baseball Research Journal,Charles Blahous explained a system to determinethe probability of various players in various sea-
sons putting together a 56-game hitting streak. I willdescribe some improvements to Mr. Blahous'smethod, which I believe result in probabilities that aremore accurate and, in almost all cases, lower than theprobabilities he found. Also, I will answer what isprobably the most interesting question: What is theprobability that there would be some player, at somepoint in the history of major league baseball, whowould have a 56-game hitting streak?
Mr. Blahous began by determining the probabilityof a given player-for example, Lave Cl'oss-gettillg ahit in a givell gaille. His llletllod was reasollable, but Imodified it so that, I hope, it will more accuratelyreflect the player's chances. During each game, Crosshad a limited number of plate appearances in whichto attempt to get a hit. For each plate appearance, thelikelihood that Cross got a hit is just the ratio of hishits to his plate appearances for the season. The prob-
many games are necessary to make the average 4.50.In this case, we assume Cross had four plate appearances in 50 games, and five in the other 50. So to figure out the probability of Cross's having a hit in anyone game in 1901, we consider each game to have a 50percent chance ofbeing a four-plate appearance gameand a 50 percent chance of being a five-plate appearance game. Then the probability of Cross's getting ahit in a game in 1901 is just the average of his probability of getting a hit in a four-plate appearance gameand his probability of getting a hit in a five-plateappearance game. (In most cases, this does not workout as nicely as in the case of Cross. If a player had4.77 IJlate appearances per game, we would have totake a weighted average of his probability of a hit infour-plate appearance games and in five-plate appearance games, with the five-plate appearance gameshaving 77% of the weight.)
Having figured out a player's probability ofgetting ahit in a given game, Mr. Blahous then determines theprobability of the player's having a 56-game hitting
one minus his probability of getting a hit in a givenopportunity, to the power ofhis number ofopportunities per game; the probability of getting a hit in thegame is one minus the probability of not getting a "hit.
Now we have to determine the nlImber of plateappearances that Cross received in a given game. In1901 for example, Cross had 450 plate appearances in100 games played, which works out to 4.50 plateappearances per game. This presents something of aproblem, as clearly Cross did not have any games during the 1901 season (or any season) in which he hadexactly 4.50 plate appearances. We solve this problemby assuming that Cross had at least four plate appearances in each game, adding a fifth one in however
MICHAEL FREIMAN is an undergraduate math major at theUniversity ofPennsylvania. He has been an enthusiastic baseball fan since 1993, when he discovered JohnKruk, Mitch Williams and Total Baseball.
11
ability of a hit in a given game, taken to the 56thpower. He then finds the probability ofthe player's nothaving a 56-game hitting streak in each of the overlapping 56-game spans making up his season (a player who plays 155 games in a season may be eonsideredto have 100 56-game spans: games 1 through 56, 2through 57, etc., up to 100 through 155). Mr. Blahousmultiplies these probabilities together to find theprobability ofthe player's not having a 56-game streakduring the entire season, and subtracts this probability from 1 to find the likelihood that the player wouldhave a 56-game· hitting streak at some point duringthe season.
In this last multiplication lies a subtle but majorflaw in Mr. Blahous's method. It is true that we cansometimes find the probability of multiple events alloccurring (in this case a player failing to have a 56game hitting streak in various 56-game spans) bymultiplying together their probabilities, but thismethod works only when the events whose probabili-

THE BASEBALL RESEARCH JOURNAL
ties are being multiplied are unrelated to each other,or, in mathematical terms, when the events are independent. It should be clear that since many of the 56game spans Blahous examines overlap (for example,games 1through 56 overlap with games 2 through 57),the probabilities of the player's not having a 56-gamehitting streak in these spans are not independent.
To take a more concrete example, suppose there is aplayer who plays a three-game season and has a 50%chance of getting a hit in any given game. There areeight equally likely possibilities of which games thisplayer can get a hit in (for example, he could get a hitin all three games, no games, just the first game, justthe second and third games, etc.). Of these, only threepossibilities (hits in the first two games only, the lasttwo games only, or all three games) result in his having a two-game hitting streak. Clearly then, the probability of the player having a two-game hitting streakis 3/8, or 37112%. Yet using Mr. Blahous's method, theprobability is found to be 7/16, or 43%%. The difference between 3/8 and 7/16 may not seem like much,but over the course ofa full season, the correct probabilities and those arrived at by Mr. Blahous can differby a factor of 8 or more.
The method used to correct this problem is somewllat more complicated than Mr. Blahous's method,but it does not use any mathematics beyond basicalgebra. First let us define p as the probability that aplayer (let's use Joe DiMaggio this time) gets a hit in
DiMaggio's having a 56-game hitting streak in anyparticular 56-game span. Then q equals p to the 56thpower. Let us denote by D(n) the probability thatDiMaggio has a 56-game hitting streak at some pointduring tIle first 1~ games of the season. ClearlyD(0)=D(I)=D(2)= . . .=D(55)=0, because it is impossible for DiMaggio to have a 56-game hitting streakbefore he has played 56 games. Also, D(56)=q, sincein order to have a 56-game hitting streak in the first56 games, DiMaggio must get a hit in every game.
Now consider the first n games of the season, wheren is a number greater than 56. In order for DiMaggioto have a 56-game hitting streak in the first n games,he must either have a 56-game hitting streak in thefirst n -1 games or have his first 56-game hittingstreak in the last 56 games. (Here I am consideringstreaks ot: say, 57 games as two overlapping 56-gamestreaks.) The probability of a 56-game hitting streakin the first n-l games is D(n-l). In order to have hisfirst 56-game hitting streak in the last 56 games,
12
DiMaggio must not have a 56-game hitting streak inthe first n-57 games (the probability of which is1-D(n-57)), then not get a hit in game number n-56(the probability ofwhich is 1- p), and then get a hit ineach of games n-55 through n (the probability ofwhich is q). Hence the probability that DiMaggio hasa 56-game hitting streak in the first n games is
D(n) = D(n-l) + (I-D(n-57)) (l-p)q
Ifwe want to find the probability ofDiMaggio's having a 56-game hitting streak during the whole season,we first find D(I), then D(2), and continue until wefind DCg), where g is the total number of gamesDiMaggio plays during the entire season. This formula can be implemented without too much trouble onany spreadsheet. (For a given number of games, thisformula also reduces to a polynomial in the variablep,which is easier to use than the recursive formula.)
Okay, now for the good stuff. Table 1 lists the 45players who have had the best chance to have a 56game hittin.g streak in a givell seaSOll. (TIle columnslist tIle player's name, year, batting average, hits perplate appearance, probability of getting a hit in anygiven game, and probability of having a 56-game hitting streak at some point during the season.)
Of these players, a majority played during the nineteenth century, and no player made the list in a seasonafter 1930. DiMaggio did not come close to on
streak in 1941 was only .01% (1 in 9,545). In fact, 1941was only DiMaggio's fourth most likely season to puttogether such a streak, behind 1936, 1939 and 1937.Note that even Duffy, the leader, would haye to playfor 21 seasons a.t his 1894 level to have even a 50...50chance of a 56-game hitting streak.
It is often stated that DiMaggio's 56-game hittingstreak is a record that will last forever. However, suchstatements are rarely accompanied by an explanationof any way the game has changed since 1941 thatwould preclude the possibility of such a streak. It istrue that a 56-game streak is unlikely now, but thisanalysis shows that it was unlikely in 1941 also(indeed, if such a streak were to have happened at all,it "should" have been before 1941, when the players onthe list below were playing). In fact, there have beenseveral instances in the 1990s alone in which a playerhas had a significantly better probability of havingsuch a streak than DiMaggio had in 1941, includingsuch less-than-Iegendary players as Lance Johnson in

Table 1. BEST CHANCES FOR A56-GAME HIT STREAK IN ASINGLE SEASON
PLAYER YEAR AVG H'PA HIT PROB STREAK PROBHugh Duffy 1894 .440 .385 90.8% 3.28% (1 in 31)Ross Barnes 1876 .429 .404 93.0% 2.93% (1 in 34)Willie Keeler 1897 .424 .387 90.2% 2.50% (1 in 40)Tip O'Neill 1887 .435 .393 89.7% 1.84% (1 in 54)Jesse Burkett 1896 .410 .371 89.4% 1.69% (1 in 59)Nap Lajoie 1901 .426 .399 89.2% 1.53% (1 in 65)Fred Dunlap 1884 .412 .387 89.9% 1.42% (1 in 71)Sam Thompson 1895 .392 .366 88.8% 1.06% (1 in 94)George Sisler 1922 .420 .376 88.3% 1.04% (1 in 96)Sam Thompson 1894 .407 .366 89.2% 0.96% (1 in 104)TyCobb 1911 .420 .379 87.8% 0.84% (1 in 119)Ed Delahanty 1894 .407 .355 88.3% 0.74% (1 in 134)Jesse Burkett 1895 .409 .352 87.8% 0.71% (1 in 142)George Sisler 1920 .407 .371 87.2% 0.65% (1 in 154)Lave Cross 1894 .386 .354 87.8% 0.59% (1 in 170)Sam Thompson 1893 .370 .338 87.4% 0.54% (1 in 185)AI Simmons 1925 .387 .364 86.9% 0.52% (1 in 194)Tuck Turner 1894 .416 .379 88.8% 0.47% (1 in 211)Bill Terry 1930 .401 .358 86.7% 0.47% (1 in 211)Willie Keeler 1894 .371 .330 87.10/0 0.47% (1 ill 215)Willie Keeler 1898 .385 .358 87.1% 0.46% (1 in 216)Lefty O'Doul 1929 .398 .347 86.6% 0.44% (1 in 227)Billy Hamilton 1894 .404 .321 87.0% 0.43% (1 in 231)Ed Delahanty 1899 .410 .369 86.6% 0.41% (1 in 243)Willie Keeler 1896 .386 .349 86.9% 0.39% (1 in 255)Ed Delahanty 1893 .368 .336 86.7% 0.37% (1 in 268)Pete Browning 1887 .402 .361 86.6% 0.37% (1 in 273)
Ed Delahanty 1895 .404 .336 86.9% 0.35% (1 in 286)TyCobb 1912 .409 .371 86.4% 0.34% (1 in 291)Paul Hines 1879 .357 .350 87.8% 0.31% (1 in 318)Chuck Klein 1930 .386 .348 85.7% 0.27% (1 in 364)Joe Jackson 1911 .408 .363 85e7% 0.25% (1 in 395)Willie Keeler 1895 .377 .334 86.0% 0.25% (1 in 397)Steve Brodie 1894 .366 .334 86.1% 0.25% (1 in 398)Harry Heilmann 1921 .394 .353 85.6% 0.24% (1 in 420)Rogers Hornsby 1924 .424 .355 85.6% 0.22% (1 in 451)Hughie Jennings 1896 .401 .347 85.8% 0.22% (1 in 457)Billy Hamilton 1895 .389 .320 85.9% 0.22% (1 in 464)Ed Delahanty 1896 .397 .345 85.8% 0.20% (1 in 498)Jesse Burkett 1901 .376 .336 85.4% 0.19% (1 in 517)Babe Herman 1930 .393 .345 85.2% 0.19% (1 in 517)Sam Thompson 1887 .372 .346 85.6% 0.19% (1 in 528)Heinie Manush 1928 .378 .346 85.0% 0.18% (1 in 567)Dan Brouthers 1883 .374 .361 86.3% 0.18% (1 in 569)
"Hit Prob" is the probablity of a batter getting a hit in a given game."Streak Prob" is the probability of a 56-game hitting streak during a season.
13
THE BASEBALL RESEARCH JOURNAL
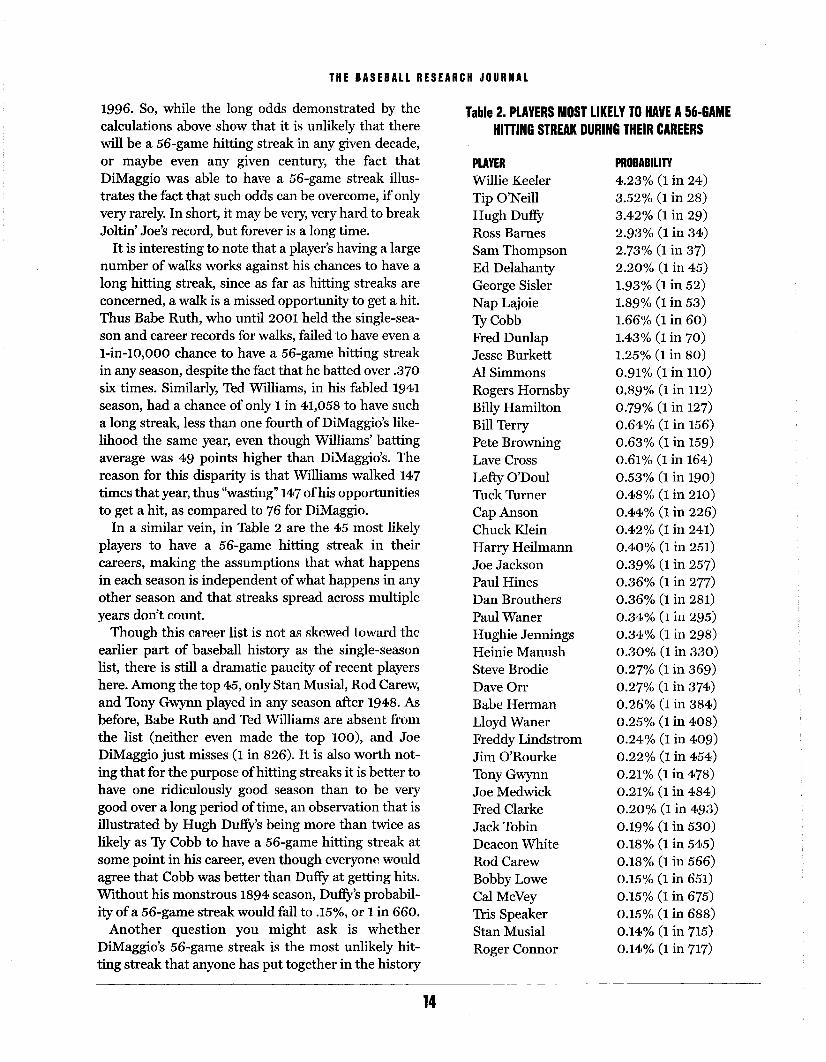
Table 2. PLAYERS MOST LIKELY TO HAVE A56-GAMEHITTING STREAK DURING THEIR CAREERS
0.34% (1 ill 298)0.30% (1 in 330)0.27% (1 in 369)0.27% (1 in 374)0.260/0 (1 in 384)0.25% (1 in 408)0.24% (1 in 409)0.22% (1 in 454)0.21% (1 in 478)0.21% (1 in 484)0.20% (1 in 493)0.19% (1 in 530)0.18% (1 in 545)0.18% (1 in .566)0.15% (1 in 651)0.15% (1 in 675)0.15% (1 in 688)0.14% (1 in 715)0.14% (1 in 717)
PROBABILITY4.23% (1 in 24)3.52% (1 in 28)3.42% (1 in 29)2.93% (1 in 34)2.73% (1 in 37)2.20% (1 in 45)1.93% (1 in 52)1.89% (1 in 53)1.66% (1 in 60)1.43% (1 in 70)1.25% (1 in 80)0.91% (1 in 110)0.89% (1 in 112)0.79% (1 in 127)0.64% (1 in 156)0.63% (1 in 159)0.61% (1 in 164)0.53% (1 in 190)0.48% (1 ill 210)0.44% (1 ill 226)0.42% (1 in 241)0.40% (1 in 251)0.39% (1 in 257)0.36% (1 in 277)0.36% (1 in 281)
PLAYERWillie KeelerTip O'NeillHugh DuffyRoss BarnesSam ThompsonEd DelahantyGeorge SislerNap LajoieTyCobbFred DunlapJesse BurkettAI SimmonsRogers HornsbyBilly HamiltonBill TerryPete BrowningLave CrossLefty O'DoulTuck TurllerCap AnsonChuck KleinHarry HeilmannJoe JacksonPaul HinesDan Brouthers
Hugllie Jell11illgsHeinie ManushSteve BrodieDave OrrBabe HermanLloyd WanerFreddy LindstromJim O'RourkeTony GwynnJoe MedwickFred ClarkeJack TobinDeacon WhiteRod CarewBobby LoweCal McVeyTris SpeakerStan MusialRoger Connor
careerearlier part of baseball history as the single-seasonlist, there is still a dramatic paucity of recent playershere. Among the top 45, only Stan Musial, Rod Carew,and Tony Gwynn played in any season after 1948. Asbefore, Babe Ruth and Ted Williams are absellt frol11the list (neither even made the top 100), and JoeDiMaggio just misses (1 in 826). It is also worth noting that for the purpose ofhitting streaks it is better tohave one ridiculously good season than to be verygood over a long period oftime, an observation that isillustrated by Hugh Duffy's being more than twice aslikely as 1Y Cobb to have a 56-game hitting streak atsome point in his career, even though everyone WOllldagree that Cobb was better than Duffy at getting hits.Without his monstrous 1894 season, Duffy's probability ofa 56-game streak would fall to .15%, or 1 in 660.
Another question you might ask is whetherDiMaggio's 56-game streak is the most unlikely hitting streak that anyone has put together in the history
1996. So, while the long odds demonstrated by thecalculations above show that it is unlikely that therewill be a 56-game hitting streak in any given decade,or maybe even any given century, the fact thatDiMaggio was able to have a 56-game streak illustrates the fact that such odds can be overcome, if onlyvery rarely. In short, it may be very, very hard to breakJoltin' Joe's record, but forever is a long time.
It is interesting to note that a player's having a largenumber of walks works against his chances to have along hitting streak, since as far as hitting streaks areconcerned, a walk is a missed opportunity to get a hit.Thus Babe Ruth, who until 2001 held the single-season and career records for walks, failed to have even aI-in-IO,OOO chance to have a 56-game hitting streakin any season, despite the fact that he batted over .370six times. Similarly, Ted Williams, in his fabled 1941season, had a chance of only 1 in 41,058 to have sucha long streak, less than one fourth of DiMaggio's likelihood the same year, even though Williams' battingaverage was 49 points higher than DiMaggio's. Thereason for this disparity is that Williams walked 147times that year, thus "wasting" 147 ofllis opportunitiesto get a hit, as cOl11pared to 76 for DiMaggio.
In a similar vein, in Table 2 are the 45 most likelyplayers to have a 56-game hitting streak in theircareers, making the assumptions that what happensin each season is independent ofwhat happens in anyother season and that streaks spread across multiple
don't
14
THE BASEBALL RESEARCH JOURNAL
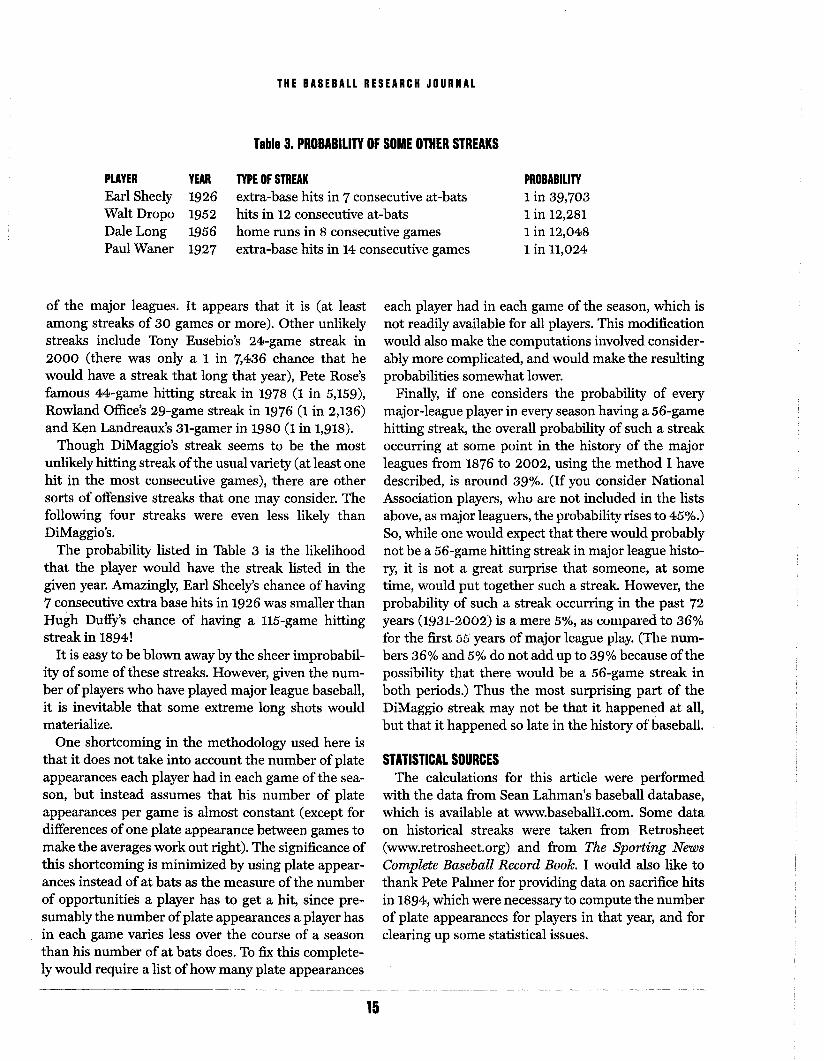
Table 3. PROBABILITY OF SOME OTHER STREAKS
PLAYER YEAREarl Sheely 1926Walt Dropo 1952Dale Long 1956Paul Waner 1927
TYPE OF STREAKextra-base hits in 7 consecutive at-batshits in 12 consecutive at-batshome runs in 8 consecutive gamesextra-base hits in 14 consecutive games
PROBABILITY1 in 39,7031 in 12,2811 in 12,0481 in 11,024
of the major leagues. It appears that it is (at leastamong streaks of 30 games or more). Other unlikelystreaks include Tony Eusebio's 24-game streak in2000 (there was only a 1 in 7,436 chance that hewould have a streak that long that year), Pete Rose'sfamous 44-game hitting streak in 1978 (1 in 5,159),Rowland Office's 29-game streak in 1976 (1 in 2,136)and Ken Landreaux's 31-gamer in 1980 (1 in 1,918).
Though DiMaggio's streak seems to be the mostunlikely hitting streak ofthe usual variety (at least onehit in the most consecutive gallles), tllere are othersorts of offensive streaks that one may consider. Thefollowing four streaks were even less likely thanDiMaggio's.
The probability listed in Table 3 is the likelihoodthat the· player would have the streak listed in thegiven year. Amazingly, Earl Sheely's chance of having7 consecutive extra base hits in 1926 was smaller than
streak in 1894!It is easy to be blown away by the sheer improbabil
ity of some of these streaks. However, given the number of players who have played major league baseball,it ·is inevitable that some extreme long shots wouldmaterialize.
One shortcoming in the methodology used here isthat it does not take into account the number of plateappearances each player had in each game of the season, but instead assumes that his number of plateappearances per game is almost constant (except fordifferences ofone plate appearance between games tomake the averages work out right). The significance ofthis shortcoming is minimized by using plate appearances instead of at bats as the measure of the numberof opportunities a player has to get a hit, since presumably the number ofplate appearances a player hasin each game varies less over the course of a seasonthan his number of at bats does. To fix this completely would require a list ofhow many plate appearances
15
each player had in each game of the season, which isnot readily available for all players. This modificationwould also make the computations involved considerably more complicated, and would make the resultingprobabilitiessomewhatloweL
Finally, if one considers the probability of everymajor-league player in every season having a 56-gamehitting streak, the overall probability of such a streakoccurring at some point in the history of the majorleagues from 1876 to 2002, using the method I havedescribed, is arollnd 39%. (If you consider NationalAssociation players, who are Ilot illcluded in the listsabove, as major leaguers, the probability rises to 45%.)So, while one would expect that there would probablynot be a 56-game hitting streak in major league history, it is not a great surprise that someone, at sometime, would put together such a streak. However, theprobability of such a streak occurring in the 72
for tIle first 55 years of major league play. (TIle 11Ul11bers 36% and 5% do not add up to 39% because ofthepossibility that there would be a 56-game streak inboth periods.) Thus the most surprising part of theDiMaggio streak may not be that it happened at all,but that it happened so late in the history ofbaseball.
STATISTICAL SOURCESThe calculations for this article were performed
with the data from Sean Lahman's baseball database,which is available at www.baseball1.com. Some dataon historical streaks were taken from Retrosheet(www.retrosheet.org) and from The Sporting NewsComplete Baseball RecoTcl Book. I would also like tothank Pete Palmer for providing data on sacrifice hitsin 1894, which were necessary to compute the numberof plate appearances for players in that year, and forclearing up some statistical·issues.

FRANK ARDOLINO
Lou vs. Babe in Life and in "Pride of the Yankees"
Babe Ruth and Lou Gehrig formed the mostfeared batting twosome in the history of baseball. Batting third and fourth, they served as the
heart of the great Yankee teams that won three WorldSeries between 1927 and 1933. Despite their heroics,Ruth and Gehrig played a different type of baseball,led decidedly different lives, and had different personalities. In this essay I would like to explore how thesedifferences were expressed and perceived during theiractual careers and in the cinematic biography of LouGehrig, Pride ofthe· Yankees.
The friction between Ruth and Gehrig in their baseball careers developed primarily from their differentpersonalities, their divergent public images, and fromthe influellce ·of other people on their relationship.Given all of these factors, tileir feud seems inevitableand regrettable. By contrast, in Pride of the Yankeesthe two stars are· not separated by a feud but only bytheir personalities and the images that result fromthem.
There are two related facts about Lou Gehrig's
Ruth; Lou's homers did not soar in the same majesticway as the Babe's, and he did not swagger and seekpublicity. As Lou remarked about himself: "I'm not aheadline guy . . . I'm just a guy who's in there everyday. The fellow that follows Babe in the batting order.When Babe's turn at bat is over, . . . the fans are stilltalking about him when I come up. If I stood on myhead at the plate, nobody'd pay any attention:'
While Ruth hit monumental homers, indulged all ofhis· appetites, earned fines, and caused his physicalcollapse, Gehrig was the "Iron Man;' a monument toclean living and steadiness, who stated in 1939 that"I've been in the business seventeen years and I don'tthink there were a Ilalf dozen nights ... that I didn'taverage ten hours sleep every night." Fittingly, his lastmanager, Joe McCarthy, eulogized Gehrig as a "perfect gentleman:'
An integral part of tIle relationship between Ruthand Gehrig was the feud which resulted in their notspeaking for years. There have been a number ofspeculations about the reasons for their hostility, but the
tIle even greater and more flamboyant Babe Ruth, al1dhe achieved immortality for his consecutive gameskein and his tragic physical deterioration and deathfrom amyotrophic lateral sclerosis, the crippling dis~ase which is now identified by his name.
As a player, Gehrig was ~own for the regularity ofhis prodigious productivity. He hit 493 home runs,compiled a lifetime BA of .340, averaged 146 RBI and138 runs scored for 13 consecutive seasons, was MVPin 1927 and 1936, won the Triple Crown in 1934, andbatted .361 for seven World Series. Despite theseamazing accomplishments, Gehrig's career performance and personality were eclipsed by the mighty
FRANK ARDOLINO is a professor of English at theUniversity ofHawaii. He has recentlyfinished an article entitled "Playing in the Bush League: 'The Rookie'and the BaseballPresidency,"which will beforthcomingin Nine.
16
outspoken and domineering woman, did not likeClaire, Babe's showgirl second wife. Mom Gehrig usedto allow Dorothy, Babe's adopted daughter from hisfirst marriage, to visit her. On one occasion she notedtIlat Claire dressed DorotllY like a. nine-year-oldtomboy, while slle always dressed her own daughter,Julia, in the finest attire. Later, Gehrig's mother toldanother Yankees wife about Claire's favoring Juliaover Dorothy, and this got back to Claire, who relayedit to Babe, who told Lou to tell his mother to "mindher own goddamned business!" As Robinson pointsout, Lou was so attached to his mother that Ruth'soutburst ended their friendship: "The relationshipbetween Babe and Lou, teetering for years over tileirbasic differences in temperament-Lou's frugality,introversion, and need for privacy versus the Babe'sprodigality, extroversion, and constant need foracclaim-chilled permanently:'
Lou's consecutive game streak of 2,130 games (broken by Ripken in 1996) became the stuff of legend for

THE BASEBALL RESEARCH JOURNAL
his physical stamina and endurance. From its beginning on June 2, 1925, to its conclusion on May 2, 1939,Lou suffered severe lumbago, broke everyone of hisfingers, and had 17 assorted fractures of his handswhich healed by themselves. As a result ofhis injuries,Lou remarked: "I don't think anybody else will try itagain, they won't be that crazy. I am interested in it,the fans seem to be ... enough to make me believe Iought to go as far as I can with it:'
But Ruth, as a result of his break with Gehrig, gavea more scathing assessment of the renowned streak in1937, two years after his retirement: "This Iron Manstuff is just baloney ... I think he's making one of theworst mistakes a ball player can make. The guy oughtto learn to sit on the bench and rest. They're not goingto payoff on how many games he's played in a row."
Lou responded without attacking Babe personally,but he was hurt by the belittling ofhis record: "I'm notstupid enough to play if my value to the club is endangered. I honestly believe that I've never been tired onthe field:' Lou persevered until he could no longer playand was forced to relinquish his place in the lineup toBabe Dahlgren.
Ironically, it was with his premature retireillel1t allddeath. that Gehrig received his most enduring glory.Tristram Coffin has depicted Gehrig as the tragic warrior-hero cut down in his prime who achieves a sentimentalized heroic mythos. When he appeared inuniform for Lou Gehrig Appreciation Day on July 4,
writer serving as master ofceremonies, presented Louwith gifts from the Yankees, falls, alld tIle New YorkGiants. On the trophy given to him by his teammatesthere was inscribed a poem by sportswriter JohnKieran. The poem depicted Lou as a warrior whoalways came through in the game, and, more important, was facing the most serious human test withgraceful heroism. At this point in the ceremony, Louwas unable to convey his thanks, so he told Mercer tospeak for him.
Then the fans began to chant, "We want Gehrig, wewant Gehrig;' and Lou dabbed his eyes with his hankie, blew his nose, and moved unsteadily to the mike.McCarthy had warned Babe Dahlgren to be ready tocatch Lou if he began to falter. But Lou clearly delivered his famous farewell speech, which has beenunsarcastically referred to as baseball's equivalent tothe Gettysburg Address. He began with the seeminglyimprobable statement that he considered himself "theluckiest man on the face ofthe earth:' To prove this, helisted all the people and blessings he had to be thankful for, including the fans, Ruppert, Barrow, Huggins,McCartl1y, llis teammates, his parents, and~ finally, hisbeloved wife, "who has been a tower of strength andshown more courage than you dreamed existed ... SoI close in saying that I might have had a bad break,but I have an awful lot to live for:'
At the conclusion of the speech, the crowd let out atremendous roar, and Babe Ruth, the feud now for-
Babe Ruth to gain his own measure ofacceptance andadultation. As Jack Sher has stated: "Lou had the oneelusive thing he had always wanted most-the wholehearted love ofbaseball fans and people everywhere intIle world:' In his typically overheated fashion, PatllGallico captured the sentiment and poignancy ofLou's farewell when 62,000 fans assembled to paytribute to the dying athlete: "On July 4, 1939, theretook place the most tragic and touching scenes everenacted on a baseball diamond-the funeral servicesfor Henry Louis Gehrig. Lou Gehrig attended them inperson:'
Members of the famed 1927 Yankee team-Lazzeri,Meusel, Combs, Pennock, Koenig, Bengougll, Dugal1,Hoyt, and Pipgras-joined with the current Yankeeteam and Mayor Fiorello LaGuardia, PostmasterGeneral James Farley, and Lou's parents to celebratehis retirement. Manager Joe McCarthy began by paying tribute to. Lou for his brilliant play, endurance,and team spirit. Then Sid Mercer, a veteran sports-
17
Lou's neck~ creatirlg all ill1age whicll beca,111e tIle picture of the year. However,Bill Dickey, the famedYankee catcher, claimed that this hug was one-sidedon the Babe's part because Lou "never forgave him:'NevertheIess~ in his autobiograplly, Rut.h descrilJedthe eftect ofhis response to Lou's speech in a difterentmanner. He said he would never forget that daybecause "Lou spoke as I never thought I'd hear a manspeak in a ball park. Every word he said plainly camefrom his heart, and [in] the ... crowd ... there wasn'ta dry eye anywhere.... [W]hen .he said 'I considermyself the luckiest man in the world; I couldn't standit any longer. I went over to him and put my armaround him, and though I tried to cheer him up~ Icould not keep from crying."
Lou Gehrig died two years later at the age of 39 onJune 2, 1941.
One year after his death, Pride of the Yankees, thestory of Gehrig's life, was made, starring Gary Cooperas Lou, Teresa Wright as Eleanor, and Walter Brennan

THE BASEBALL RESEARCH JOURNAL
Babe Ruth with Gary Cooper, who portrayed Gehrigin Pride of the Yankees. (top). Cooper was nominated
for ,BestActor, one offive Oscar nominations the moviegarnered. At bottom, The Babe is pictured giving a
batting tip to a young Lou Gehrig.
as the sportswriter Sam Blake. The script was, takenfrom a story by Paul Gallico, and the editor was DanielMandell, who received an Academy Award for hiswork. Although this film became the most successfulsports movie up to 1942, it almost was never made.When the producer Sam Goldwyn first heard its plot,he thought it would be box office poison. But then hesaw a news clip ofLou's farewell speech and cried profusely before agreeing to make the movie. ForGoldwyn, who had immigrated to the United States atthe age of13, alone and penniless, Pride ofthe Yankeespresented a "poignant fable of perseverance andhumility, qualities that ... [he] ... admired andbelieved were firmly rooted in the America he loved:'As the shy hero, Gary Cooper, who had just won theAcademy Award for his role as another unassumingnational hero in Sergeant York (1941), effectively provided the image of the dignified, deferential, andenduring Gehrig.
Pride ofthe Yankees concerns Gehrig's rise to baseball prominence, his love for Eleanor, his relationshipto his 1.l11111igrallt parents, his illness and deatll, Rlldhis relationship with Babe Ruth. It is this last aspectthat I will concentrate on, showing how the film presents the rivalry between the two great Yankees in theform oftlleir different personalities, as depicted by theantithetical acting styles of Cooper and Babe Ruth,who plays himself as a loud, bumptious, well-liked,fun-loving, ebullient, and phenomenon. In his scelles
our vision, forcing us to concentrate on him. AsRobinson states, although Ruth looked like a "truantfrom an 'Our Gang Comedy' ... the Babe gave themovie hearty validity:' Erickson praises the role as hisbest, made even 1110re illgratialirlg by his "full-facedsmile;' an insight which I will emphasize in my analysis of the film.
Pride of the Yankees begins with an epigraph byDamon Runyon which equates Lou's heroism with thesimple doggedness and bravery exhibited byAmerican soldiers in battle. Befitting its wartimerelease in 1942, the movie is dedicated to showing thatGehrig's quiet, soldierly personality, herculean workethic, and heroic acceptance of death are more commendable than Ruth's oversized mythos. In order tocreate this image, it was necessary to depict Ruth asan 'inflated ego who is more interested in promotinghimself and satisfying his appetites. Ruth emerges asa media-savvy superstar, while Lou exemplifies moretraditional and reputable qualities.
18

THE BASEBALL RESEARCH JOURNAL
The relationship between Ruth and Gehrig asfuture superstar teammates is ironically introduced atthe outset when young Lou tries to bribe his way intoa sandlot game by offering the captain a Babe Ruthcard. The urchin sneers at the "rookie" card, but letsLou in the game anyway. Lou smashes a long drivethrough a window and is dragged home by a cop to hisparents, who disapprove ofhis ball playing. This sceneshows the difference in the ages ofGehrig, who is onlya boy, and Ruth, who is already in the big leagues.Also, although Lou initially attempts to use Ruth'sstature as a big leaguer to gain entrance into thegame, he subsequently hits a homer and earns his waythrough his own proficiency.
When Lou attends Columbia University, he breaksanother window with a tremendous blast which landsin the office ofthe football coach, who is talking to thereporter/scout Sam Blake. Blake is a cross betweenPaul Krichell, famed Yankee scout, and Fred Lieb,reporter and friend of Gehrig. Blake writes that Loushould be considered the "Babe Ruth of Columbia;'alld lle convinces 1,011 to sign with the Yankees and giveup his parentally imposed engineering aspirations.
Before his first game with the Yankees, Lou entersthe empty locker room alone; sheepishly and admiringly he looks at the great names on the locker tags.When most of his teammates enter together shortlythereafter, Lou attempts to say hello by lifting his armin greeting, but they do not pay attention to him as he
the TIlen Babe bursts in".L.L'J.L.L.LIJ'.L.LJL~011 a tugsmate, and pulls off the hat of another. The room isimmediately galvanized by Ruth's magnetic presence,and one ofhis teammates asks him ifthe homer he hityesterday was 38 or 39. The Babe roars, "I don't know.I'll llit 'elll, Rlld you count 'em:' Lou sits on his stoollacing his spikes and smiling from ear to ear like a kidin a candy store.
Gehrig's childlike behavior continues when he stepson the field and is awed by cavernous Yankee Stadium.The Babe is playing pepper, and the ball gets by himand rolls to Lou, who picks it up and then freezes ashe looks at Ruth. Ruth coaxes him twice to "give methe ball, son;' as if talking to a child. Later, when Louis told to bat for Pipp, he runs out of the dugout andslips on the bats, earning the nickname "Tanglefoot:'When Lou falls down, Babe is right there, loomingbehind him in the dugout and laughing at this awkward rookie.
After the game, the Yankees go to a crowded restau-
19
rant. The Babe marches up to where the meat is beingprepared on a. spit and orders steak, smothered inpork chops and mushrooms. His face is as big andmeaty as the food he orders. By contrast, Lou arrivesquietly with Sam and allows the writer to suggest fishfor dinner. This scene demonstrates their respectiveappetites: Ruth rushes to the food and demands a gargantuan order, while Lou is almost ascetic, acceptingthe waiter's biblical order of fish. The Babe's moonface looms like a planet dominating the events revolving around him, but Lou is sheepish and retiring,unable and unwilling to make the demands and exertthe control that Ruth does.
When the Yankees travel by train, Ruth quicklybecomes the center of attraction again. MillerHuggins asks if the Babe made the train, and then wesee him striding down the aisle wearing a new strawhat. He muscles his way into· the card·game, warningeveryone that this is his fifth straw hat and if anyoneruins it he will smash his teeth. Nevertheless, histeammates quickly pass the hat around after Baberemoves it. Everyone takes a chomp out of the brim,and when it gets to Lou, the ringlealler tells lliul if lIewalrts to be Olle of the guys he will take a bite. Loutakes two for good measure, but as .he does so theother culprits scatter and Ruth catches him at it.
In this episode the Babe emerges as the clownprince who, like Falstaff, is not only humorous himselfbut excites humor in others. The other players love torib him because he is a They include Lou in
gamehy the looming Babe, who grabs him. thejoke on Ruth involves biting chunks out of his hat, aparody of his own appetites. Hank Hammond (DanDuryea), a sneering, cynical reporter,. ends thescqucnce by moclring LOll~S naivete a.nd dullness, butSam defends Lou's character. He argues that Gehrig'ssteadiness is exciting; Lou creates no scandal, does hisjob and nothing else. He creates "fun" by playing well,and the fans like him for his dedication.
This running argument between the reportersserves, as Edelman has remarked, as the movie's substitute for the real-life feud between the two players.Hammond continually mocks Gehrig as "too good tobe true;' while Blake defends Gehrig's steadiness.They serve as the journalistic chorus who cue theaudience to see Gehrig as more honest and commendable than Ruth. The rivalry reaches a climax in thehospital scene with the sick boy, who parallels JohnnySylvester, the injured boy whom the Babe comforted

THE BASEBALL RESEARCH JOURNAL
by giving him a ball and hitting a homer. The scene isconstructed on the opposition between Ruth's andGehrig's styles. Hank has arranged for the Babe toappear in a charitable guise with the reporters andphotographers ready to report on his kindness. Thesignal is given, and on cue Ruth goes into action,checking to see if the cameras are rolling. Bill Dickey,playing himself: and Gehrig bow their heads uneasilyas they recognize Ruth's display ofmeretricious showmanship. By contrast, Lou waits until everyone isgone to approach the boy, who cajoles him into promising two homers. The only other person witnessingthis scene is Sam, who had hidden behind the doorafter everyone left. During the game, the Babe hits hishomer, and Lou fulfills his promise to knock twohome runs, but he makes much less ofa fuss about hisfeat than Ruth does.
When the Yanks win the World Series, they erupt inbedlam on the train. The Babe runs wild, rippingclothes and hats; at one point his big moonface burstsinto a close-up as he rushes to the front ofthe club carto order six hot dogs. This scene provides anotherexample of his pushing aggressively all<l appetitivelyforward to declare llis meaty presence. By contrast,Lou's celebration is more subdued and of shorterduration, as he runs off in the middle of the festivitiesto propose to Eleanor.
On the day that Lou retires, Babe, dressed in civvies,steps forward to embrace Lou before his speech,which reverses of events on the
famous speech, we see Babe's huge moon face in theleft-hand corner framed by the various microphones.But as Lou continues, Babe's face, the looming planetthat has overshadowed Lou's career and personalitythroughout the movie, disappears, finally eclipsed byLou's heroism concerning his crippling disease. At theconclusion ofhis speech, he begins to walk offthe diamond, and Babe, reduced to being a fan, applauds ashe passes by. We follow Lou's march toward his interment in the dugout, the shadowy place ofdeath. As herecedes, Lou gets smaller and smaller; his body disappears, but his mythos as the warrior cut· down in hisprime begins.
20
BIBLIOGRAPHYBurns, Ken and Geoffrey Ward. Baseball: An
Illustrated History. New York: Alfred Knopf, 1994.Coffin, Tristram. The Old Ball Game: Baseball in
Folklore and Fiction. New York: Herder and Herder,1971.
Dahlgren, Babe. "Gehrig's Last Day;' Yesterday inSport. Charles Osborne, ed. New York: Time-LifeBooks, 1968.
Dawson, James P. "2130:' in The Fireside Book qfBaseball. Charles Einstein, ed. New York: Simon andSchuster, 1956.
Edelman, Rob. Great Baseball Films: From RightOff the Bat to a League of Their Own. New York:Citadel Press, 1994.
Erickson, Hal. Baseball in the Movies AComprehensive Reference, 1915-1991. Jefferson, NorthCarolina: McFarland and Company, 1992.
Fimrite, Ron. '~ Insightful Look at an Icon." SportsIllustrated, October 8,1990, unpaged.
Gallico, Paul. "Lou Gehrig-An American Hero;'Sports in Literat1.lre. Chicago: National Textbook Co.,1991.
Katz, Ephraim. The Film Encyclopedia. New York:Harper Collins, 1994.
Kieran, John. "To Lou Gehrig," Sprints alzdDistances: Sports in Poetry and Poetry in Sport.Lillian Morrison, ed. New York: Thomas Y. Crowell,1965.
Box. Jerome Holtzman, ed. New York: Holt, Rinehartand Winston, 1973.--. Baseball As I Have Known It. New York:
Grosset and Dunlap, 1977.Robinson, Ray. Iron Ifol·se: Lo'u Gell1'ig' ilt His Time.
New York: W.W. Norton, 1990.Ruth, Babe, as told to Bob Considine. The Babe
Ruth Story. New York: Penguin, 1948.Sher, Jack. "Lou Gehrig: The Man and the Legend;'
Sport Magazine's A ll-Time All Stars. Tom Murray, ed.New York: New American Library, 1977.
Sobol, Ken. Babe Ruth and the American Dream.New York: Ballantine Books, 1974.
SIIlart, Steve. "Lou Gehrig on the Air;' The NationalPastime 17 (1977).
Tullius, John, ed. I'd Rather Be a Yankee. New York:Jove Books, 1986.

CHARLIE BEVIS
The Evolution of World Series Scheduling
In the early years ofWorld Series play, game schedIules were not nearly a~ standardized as today's for-
mat. Back then, a coirt toss decided the site of theopening game as/.well as a\possible seventh game. Theorder of games hosted bYleach league's pennant winner varied each year. Anq as late as 1956, the gameswere often played on cortsecutive days without anyrespite for travel or rest.
The four primary elements of today's World Seriesscheduling format have been in place since 1960 following a six-decade evolution. These four primary elements are:
• Seven-ganle series, willIler lleedillg fOllr victories• 2-3-2 format of alternating game sets between
cities• Site of the first game alternates between leagues
each year• Travel days after the second and fifth games
Since the first three elements were established with-
interesting facets surrounding their developmenthave been masked by history. The fourth element,travel days, took more years to evolve from their intermittent use into a fixed arrangement.
SEVEN-GAME SERIES Of the four l11ajor elell1ellts, the 4of-7 game format was settled upon first, in 1905.Except for three years from 1919 to 1921 when a 5-of9 game series was conducted, this scheduling formathas endured unchanged to today.
Because the first modern World Series in 1903 wasprivately arranged, the Boston and Pittsburgh owners
CHARLIE BEVIS writes baseball historyfrom his home inChelmiford, Massachusetts. He is the author of the1998 biography Mickey Cochrane: The Life of aBaseball Hall of Fame Catcher, and the 2003 bookSunday Baseball: The Major Leagues' Struggle to PlayBaseball on the Lord's Day, 1876-1934.
21
opted for a lengthy 5-of-9 game format to generate themost gate receipts possible. After the NewYork Giantsrefused to play Boston in a post-season series betweenpennant winners in 1904, New York owner JohnBrush proposed in early 1905 a set of official rules forfuture World Series play to be conducted under thesupervision of the National Commission.
The "Brush Rules;' adopted by both leagues in midFebruary 1905, stipulated that "seven games shallconstitute a complete series" and "the clubs shall continue to play each day according to the authorizedschedule until one of them has won four games:'!
Exactly what inspired Brush to include a 4-of-7game format is unclear. Brush seemed to merelyadopt a post-season format he was familiar witlI, tllatofthe Temple Cup series conducted from 1894 to 1897between the first- and second-place finishers in theNational League.
The 4-of-7 game format was followed for 14 yearsuntil 1919, when the National Commission decided tolengthen the World Series to a 5-of-9 game format,
to the World Series. August Herrmann, chairman ofthe commission and president of the Cincinnati Reds(bound for the National League pennant that year)stated, "The recommendation had been made for noother reason tllal1 to bel1ef1t the public by permittinga larger 11umber of persons to see at least one of thegames:'2
Another reason advanced for the change in seriesformat was that the National Commission had cutback the regular season in 1919 from 154 games to 140games. "Now Herrmann is sorry and, with theapproval and support of [Ban] Johnson, he plans tomake up the loss by stretching the world series over alonger period;' the New York Times commented in aneditorial.3
The owners approved the longer World Seriesschedule on September 11. The 5-of-9 game formatseemed doomed from the beginning, though, as thecllallge COil1cided with the Black Sox scandal in thatyear's World Series between the Reds and the Chicago
THE BASEBALL RESEARCH JOURNAL
White Sox. Judge Landis, installed as the first baseballcommissioner following the Black Sox scandal, thenassumed control ofthe World Series. Immediatelyfollowing the last game of the 1921 World Series, Landisissued a statement that he would move to reinstatethe 4-of-7 game format for the World Series.
"This will be done in the belief that it is very generally accepted that the ideal world championship isdecided by the winning offour games, as was the ruleprior to 1919:' Landis articulated. '~ five-game series,the championship to be awarded the club winningthree victories, is too short for a fair test. On the otherhand, the present lengthy series overtaxes thepatience of the public:'4
Landis also mentioned a concern with public reaction to the "financial returns" generated by the 1921World Series, which generated record gate receipts ..and higher player and owner shares than any previousWorld Series.. With the longer 5-of-9 game series creating such a financial bonanza, Landis may well havethought this situation could engender another scandallike the 1919 one. 111 allY event, why retain a seriesstructure associated with a scandal when another better alternative (the 4-of-7 format) was readilyavailable?
The reversion to the 4-of-7 game format wasapproved in December 1921. Beginning with the 1922WorldSeries,'the 4-of-7 game format has lasted eightdecades to the present day.
site for the seventh game was swiftly disgarded after anegative reaction to the concept. In practice, a cointoss between owners ofthe contesting teams was usedto determine the site of the seventh game.6
While the Brush Rules stipulated that the sites ofthe first three games were to be determined "by lot:'the National Commission had discretion regardingthe next three games as long as the six games wereequally divided between the two cities. By 1909, theNational Commission was using the following twogeneral principles to create the format of each year'sWorld Series schedule:
• When the contesting clubs were located in thesame city or within close proximity by train, thegames would alternate between the two cities.
• Otherwise, the first four games were played insets of two in each city, then alternated betweencities for the next two games.
These gel1eral priIlciples are not readily discerlliblefrom simply lookillg at actual World Series play,because tie games and special situations surroundingrainouts often altered the original schedule. Of thefirst 14 World Series played under the 4-of-7 game format, only seven were completed as originally scheduled. Research into the actual initial World Seriesschedules, as summarized in the accompanying table,
2-3·2 alE FORMAT While the Brush Rules establishedthe seven-game series convention, there was littlespecificity for precisely how the seven games shouldbe arranged until the now-standard 2-3-2 format wasadopted for the 1925 World Series.
The Brush Rules provided for a very general formula: "Three games shall be scheduled in each of thecities of the contesting clubs. The Commission shalldetermine by lot where the first three games shall beplayed." Therefore, in the early World Series schedules, only the first six games were affixed sites aheadof time. The site of the seventh and deciding game, ifone.was necessary, was not predetermined.5
If a seventh game was necessary, the Brush Rulesfurnished the principle that "the Commission shalldetermine the city in which the game is to be played:'Brush may have worded this clause intentionally toprovide for a neutral site for the seventh game, usingthe term "the city" rather than the phrase "which· ofthe two cities:' In any event, the possibility ofa neutral
22
scheduling in the early years of the event.After the resumption of the 4-of-7 game format in
1922 following the ill-fated 5-of-9 game experimentfrom 1919 to 1921, these principles were againemployed for the 1922 and 1923 World Seriesw Withthe Giants and Yankees engaged in an intra-city seriesin both years, the home team for each game alternated between the two teams (the teams alternated last atbats for the games in 1922, all ofwhich were played atthe Polo Grounds; in 1923, the games alternatedbetween the Polo Grounds and newly built YankeeStadium).
When the Washington Senators won the AmericanLeague pennant in 1924·to meet the New York Giantsin the World Series, Landis deviated from the accepted general principles of World Series scheduling.Landis adopted a new 2-3-1 format instead ofthe 2-21-1 format that had previously been used when teamswere not located proximate to each other. Landisacted on his own, according to The Sporting News

THE BASEBALL RESEARCH JOURNAL
account of the meeting, as Landis "delegated himselfas the advisory council of the major leagues, invitingneither President Heydler of the National League norPresident Johnson of the American League:'7
In the 16 4-of-7 game series before 1924, a seventhgame had only been required twice-in 1909 and1912. All other World Series ended in less than themaximum number of games. Traditionally, the cointoss to determine the site of the seventh gameoccurred before the sixth game of the 4-of-7 gameseries.
In 1909 American League president Johnson wonthe coin flip between league presidents on October 13and chose Detroit to be the site of the seventh game.In 1912 following the completion of the fifth non-tiegame, the coin toss was conducted between opposingteam managers, John McGraw and Jake Stahl; thetoss was won by Red Sox manager Stahl.8
This pattern was broken in the 1924 World Series,when McGraw wanted the coin toss before the fifthgame in New York. Since the Giants and Senators hadsplit the first four games, the Giants already knewthey needed to go to Washington for a sixth game;McGraw wanted to know if the team might need toplay the last two games on the road at Washington.McGraw lost the coin toss, and the Giants packed fortwo games in Washington. Although the Giants wonthe fifth game in New York, they lost both games inWashington.9
tilat tile sevelltll gaille Sllouldbe fixed 011 tIle illitialWorld Series schedule (at the same site as the sixthgame) rather than be both unplanned and determinedby a coin toss. That December, Brooklyn presidentC}larlie Ebbets proposed tIle followillg cllallge to tIleWorld Series rules:
For 1925, game 1, 2, 6, and 7shall be played inthe city ofthe pennant-winning club oftheNational League and games 3, 4, 5 in the city ofthe pennant-winning club ofthe AmericanLeague, then reverse annually thereafter. lo
In a memo with the proposal, Ebbets argued thatthe change would: (1) make an even break of all thedetails every two years, (2) better suit the convenienceof patrons, (3) eliminate adverse criticism which frequently results from the toss of a coin, and (4).allowthe clubs to print and sell tickets for the seventh gamein advance.
23
After both leagues approved the change in WorldSeries format, the 1925 World Series established the2-3-2 format that has survived intact to the presentday. That is, except for special·circumstances duringWorld War II, which emulated a radical change in format used during World War I.
In 1918 due to the wartime travel restrictions ofWorld War I that had truncated the regular season atLabor Day, the National Commission arranged theWorld Series to require minimal travel. The commission schedu~ed the first three dates in Chicago and thefinal four dates in Boston. In these exigent circumstances, the Brush Rules were disregarded. It was alsothe first time that a seventh game had been prescheduled before the World Series commenced.11
There was also special scheduling for the WorldSeries in 1943 and 1945, when the 3-4 format used in1918 was employed to/respond to wartime travelrestrictions.I2
The special· 3-4 scheduling would have applied in1944 as well had either Detroit or New York won thetight .American League pennant race to supply theWorld Series competition for tIle St. Louis Cardillals(who won the National League peIlIlallt by 14 gailles).Since the St. Louis Browns copped the AmericanLeague pennant that year, and all games were playedat the same site, Sportsman's Park, the home team foreach game alternated between the Browns andCardinals.13
FIRST GAME SITE ALTERNATION A coin toss for the site of theseventh game was not the only time this selectionmechanism was employed. Before 1925, a coin tosswas also used to determine the site ofthe first game oftIle World Series each year. For the 1925 World Series,Landis established the alternating pattern of the firstgame in the National League city one year and at theAmerican League city the next year.
Until 1910 the National Commission determinedthe site of the first game either "by lot:' as the BrushRules called for, or used its discretion to pick the site.
For example in 1908, the National League pennantwas still in doubt at the end of the regular season dueto the confusion over "Merkle's boner" ill a New YorkGiants victory over Chicago on September 23, whichwas to be replayed after the season. The .NationalCommission determined, "If the New Yorks win, .thefirst game will be played with Detroit here onSaturday, and ifChicago wins they will play in Detroiton Saturday and in Chicago on Sunday:'14

THE BASEBALL RESEARCH JOURNAL
From 1910 on, a coin toss was usually conductedbetween the owners of the two pennant-winningteams after each had clinched first place in its league.The coin toss was conducted with minimal fanfare.
"The question in what city will the first ·game beplayed will b~ decided as usual by the toss of a coin bythe two club presidents;' the Boston Herald outlinedthe process before the 1912 World Series. A meetingwas held on September 25 at the home of New Yorkowner John Brush, where the three members of theNational Commission and the owners of the BostonRed Sox and New York Giants met for the coin toss.'~dvantage of opening on home grounds was lost toBoston when at the toss of a coin by Mr. Johnson,President Brush of New York called 'tails' andPresident McAleer of Boston chose 'heads.' The coinfell 'tails; "the Boston Herald reported.I5
In 1915 the process was similar but in more fashionable surroundings. "When Joseph J. Lannin, owner ofthe Boston American League team, called 'tails' as ashiny, new quarter went spinning through the air atthe Waldorf-Astoria todt1~, he lust every chance atstarting the world series in Boston;' the Boston Heraldreported. "William Baker, owner of the PhiladelphiaNational League club, maintained an absolute silenceand when the quarter landed 011 tIle lleavy Persian rugit was 'heads up.' "16
During the period 1910-1924, when the coin tossbetween pennant winners was the convention, the
often than the American League did, as nine of the 15World Series during that period began in the NationalLeague city. Actually, the National League won onlyeight coin tosses during those 15 years.
There were just 14 coin tosses during the 15-yearpcriod 1910-1924, because tllere was 11U CUill toss in1916. Also, following the 1920 coin toss, the winnerhad to forsake first-game honors.
When Brooklyn won the NL pennant in 1916, theBoston Red Sox were automatically awarded the firstgame site since Ebbets Field wasn't ready to host theWorld Series. Brooklyn had clinched the pennant latein the season, so the club needed several days to erectincreased seating for the World Series.I7
In 1920 although Brooklyn lost the coin toss toCleveland, the World Series opened in Brooklyn afterpreparations to enlarge League Park would not becompleted in time for the first game of the WorldSeries. Cleveland owner Jim Dunn had requested thatthe World Series start two days later when construc-
24
tion was done. The Commission denied the requestand reversed the order of the original schedule.IS
When Landis moved to establish a fixed system forthe site of a possible seventh game beginning with the1925 World Series, he also established the principle ofalternating home field advantage between the leagueseach year. The Landis rule had the National Leaguewith home field in the odd years and the AmericanLeague in the even years. This system worked well forten years, until the National League pennant race in1935 created complications.
In 1935 three teams went down to the wire in theNational League. The New York Giants seemed tohave the pennant wrapped up by the Fourth of Julyholiday, but St. Louis and Chicago didn't give· up.Chicago won 21 straight games in September to overtake both the Cardinals and the Giants, clinching thepennant only two days before the season's end.
The Chicago winning streak began on September 4near the start of a long home stand at Wrigley Fieldand continued for three weeks. On September 14, theCubs moved into first place and l1ever rclcl1quislled it.The winning streak cll1minated on Septel11ber 27 in adoubleheader victory by Chicago over St. Louis toclinch the pennant.
On September 17, two weeks before the end of theseason, Landis had. announced a deviation from the1925 rule for the site of the first game of the WorldSeries.
winning the National League championship, butbecause of a large convention in St. Louis and thecomplicated championship race in the senior majorleague, it was decided to stage the opening in theAIllericall League city,," the New York Times reported.I9
Detroit, the American League champion, was giventhe home field advantage for the 1935 World Series,even though it was the National League's turn. Thisturn of events created a new rule, the AmericanLeague in the odd years and the National League inthe even years.
This system worked quite well for the next 60 years,until the 1994 World Series was cancelled during ayear when the National League would have had thehome field advantage. In 1995, the rule reverted to theoriginal Landis rule, the National League in·odd yearsand the American League in even years.

THEB ASEBALL RES EAR CH J0URN AL
TRAVEL DAYS AFTER SECOND AND FIFTH GAMES The off day following the second and fifth games was established by1960 to remOve the uncertainty of the World Seriestime span. Two reasons for this change were televisionscheduling and eliminating the possibility of giving apitching advantage to one of the World Series teams.
Before 1957, World Series games were normallyscheduled on consecutive days, so that the sevengame series would be played in seven days. Therewere two elements that could affect this schedulingpattern to create an off day:
Where professional baseball was not legallypermitted on Sunday.
When a lengthy train trip was necessary totravel between cities.
Sunday scheduling was a persistent concern in theearly years of the World Series, as there was a Sundayopen date in the World Series in 1909 and every yearfrom 1911 to 1918. Before World War I, only teamslocated west of the Allegheny MountaillS could legallyplay on Sunday. In 1918 Washington, D.C., was thefirst eastern city in the major leagues to obtain legalpermission for Sunday baseball, followed by New Yorkin 1919, Massachusetts in 1929, and Pennsylvania in1934.
While Sundays were a challenge in the early years of
World War I the World Series was generally playedbetween cities located either both in the West or bothin the East. The first designated travel day included onthe World Series calendar was in 1910, when thePhiladelphia Athletics played the Chicago Cubs.
After the first two games in Philadelphia onMonday and Tuesday, a "train trip from Philadelphiato Chicago" was planned for Wednesday to play thenext two games in Chicago on Thursday and Friday.No travel days were planned after that, however.'Mer a fast run in a special train from Chicago toPhiladelphia;' the teams were to play the fifth game onSaturday in Philadelphia; then "another hurried runin a special train will be made from Philadelphia toChicago" to play the sixth game on Sunday inChicago.20
As. it turned out, the harried travel schedule plannedafter the fourth game didn't occur, because the fourthgame on Friday, October 21, was rained out.Postponed games were normally simply moved ahead,but for the 1910 World Series ~here was a special rule
for postponements: "except that in any event thegame scheduled for Sunday October 23 is to be playedin Chicago:' The Sunday game in Chicago was important because it also had an impact on player compensation. "If none of the first games' receipts equalsthose ofthe Sunday game in Chicago, the players' proportionate share shall be made on the basis of theSunday game in Chicago."21
The fourth game of the 1910 World Series wasplayed in Chicago on Saturday, October 22. Due to theSunday exception that year, the fifth game scheduledfor Philadelphia was instead played in Chicago onSunday, October 23, where the .N.s won the WorldSeries with a 7-2 win over the Cubs. Philadelphiacould then take a lazy train trip back east.
Travel days were used on an intermittent basis inthe World Series before World War II when an Easternteam played a Western team, such as the 1931 WorldSeries when the Philadelphia Athletics played the St.Louis Cardinals.
After World War II, from 1947 to 1956, no traveldays were included in the Worlcl Series sclleclule, sothe World Series in each of those years was played onconsecutive days. Even when Cleveland played bothBoston in 1948 and New York in 1954, there were notravel dates on the World Series calendar. The teamstraveled by train overnight between the cities in 1948to reach their destinations in· the morning hours of
the game 1954Series. As late as 1957, the New York Yankees took thetrain to Milwaukee after the second game in NewYork, arriving there by nooh on the off day; the Braves11ad flOWll back to Milwaukee,22
The 1956 World Series was the last one played OIl
consecutive days without a break. For the next threeyears, franchise relocations to western cities impactedWorld Series scheduling. In 1957 and 1958 theMilwaukee Braves, five years removed from Boston,played the New York Yankees and created the longeststretch of travel between World Series cities at thetime. Then in 1959, the Los Angeles Dodgers, only twoyears removed from Brooklyn, won the NationalLeague pennant, requiring a lengthy trip fromChicago, the site of the American League champion.
The last World Series schedule to occur with thepotential to go either way~with travel days or playedon consecutive days-was in 1957. "If it is to be anEast-West series-the Yankees versus the Braves, forexample-days off for travel will be scheduled follow-
25

THE BASEBALL RESEARCH JOURNAL
Pittsburgh. "Open dates have been arranged betweengames 2 and 3 and between games 5 and 6," the 1960announcement read. Travel dates had officially beentransformed into open dates.25
Standard .open dates after the second and fifthgames had two benefits. Television benefited greatlywith an automatic open date on Friday after the firstgame on Wednesday and the second game onThursday, since the World Series was now guaranteedto be played on both Saturday and Sunday. With thethird and fourth games played on the weekend, a largeaudience was sure to tune in to increase ratings. This,in turn, increased the amount ofmoney the networkswere willing to pay major league baseball to televisethe World Series.
World Series rather than decided by a toss inWorld Series, as had been the previous scheduling convention.
The
ing the second and fifth contests," the New lOrk Timesreported. "Ifit is to be East-East or West-West, actionwill be continuous, no off days, unless forced by badweather."23
By early September 1958, both the New YorkYankees and the Milwaukee Braves had their respective league pennants well in hand. Davel days wereplanned for the World Series even though, when theschedule was announced on September 9, Pittsburghstill had a possibility to win the NL pennant.24
The 1960 World Series was the first to have traveldates without the need for them. Plane travel was thenthe rule ra,thAr tha.n train travel, so'CommissionerFord Frick decided to automatically include traveldays in the 1960 World Series when New York met
26

THE BASEBALL RESEARCH JOURNAL
Alltomatic travel days also eliminated the need touse ace pitchers with minimal rest between starts, inan attempt to have them start three games withinseven days, an inequity produced when travel dayswere not included in the World Series schedule. If theWorld Series combatants were located distant fromeach other to necessitate travel days in the train-transportation era, such as New York and Milwaukee in1957, then a team could expect an ace pitcher to startthree World Series games with decent rest if the serieswent to its seven-game limit. Lou Burdette startedand won three games for the Braves in the 1957 WorldSeries. Travel days arguably greatly assisted the Bravesin winning the 1957 World Series. Either WarrenSpahn or Burdette could have pitched three games,and the Braves didn't need to go beyond Bob Buhl.
Alternatively, ifthe World Series teams were locatedclose to each other to enable the series to be contestedon consecutive days, such as New York and Brooklynin 1956, then an ace pitcher would have to pitch ontwo days rest between starts, in order to have threeturns on the mound in a seven-game series.Otllerwise, witll tIle stalldard tllree-day rest, all acepitcher could get in only two possible games as astarter. When the two-day rest strategy was used,·thepitcher typically wasn't successful. There are numerous examples, including Johnny Sain in 1948, DonNewcombe in 1949, and Bob Lemon in 1954. In 1952,U,.r"".17'h:rMl'C1 Rookie of the Year reliever Joe Black
games seventhe first, fourth, and seventh games. Black won justthe opening game, though, while taking the loss in theother two games. Pitching depth thus had a more significant impact on winning the World Series when notravel dates were included than when the schedule didinclude travel dates.
We'don't know how a travel day policy would havebeen implemented in the jet-transportation era.Except for a New York-Los Angeles or similar EastCoast-West Coast matchup, where travel days wouldbe desirable, it is arguable that all other matchupswould not have necessitated travel dates due to theease of plane transportation between cities. In thiscontext, where most World Series would have beenplayed on consecutive days, we may not have witnessed several fabled pitching feats in the 1960s without the automatic open dates in the World Seriesschedule. Sandy Koufax came back on two days restafter the fifth game to win the 1965 World Series forthe Dodgers, while Mickey Lolich did similarly for the
27
Tigers in the 1968 World Seriesto win his third gamethat year. In 1967, Bob Gibson also won three games,all complete (all previous three-game winners in aseven-game series were achieved in World Series having travel dates).
Lolich's third win in 1968 marked the end of theWorld· Series as exclusive post-season play. With theplayoff era ushered in for 1969, the World Seriesschedule was now intertwined with that ofthe LeagueChampionship Series.
NOTESINew York Times, February 18, 1905; The SportingNews, February 25, 1905; Dean Sullivan, EarlyInnings: A Documentary History ofBaseball, 1825
1908. Lincoln: Univ. of Nebraska Press, 1995: 275276.
2New York Times, September 3, 1919.3New York Times, September 8,1919.4New York Times, October 14, 1921.5Early Innings: 276.6Ibid.7The Sporting News, September 25, 1924.8New York Times, October 14, 1909 and October 15,1912.
9New York Times, October 9, 1924.IONew York Times, December 11, 1924.IINe'l€' York 1918.
13New York Times, August 29, 1944.14New York Times, October 8, 1908.15Boston Herald, September 25 and 26, 1912.16Boston Herald, October 3, 1915.17New Yorlc Times, October 4, 1916.18New York Times, September 28 and 29,1920.19New York Times, September 18, 1935.2°New York Times, October 4, 1910.21Ibid.22New York Times, October 1, 1954, and October 4,
1957.23New York Times, September 10, 1957.24New York Times, September 8, 1958, and the
Milwaukee Journal, September 9, 1958.25New York Times, September 14, 1960.

Table 1. ORIIi~IALSCHEDULES OF THE WORLD SERIES, 1905·1925
YEAR SUN MON TUES WED THURS FRI SAT SUN ION TUES WED THURS FRI SAT SUN MON1905 ** I-A 2-N 3...A 4-N 5iJA 6-N1906 ** I-N 2-A 3-N 4iA 5-N 6-A1907 ** I-N 2-N 3-A 4iJA 5-A 6-N1908 * * I-A 2-N 3-N 4-A 5-A 6-N1909 * * I-N 2-N S 3-A 4-A 5-N 6-A1910 * * I-A 2-A T 3-N 4-N 5-A 6-N1911 * * I-N S 2-A 3-N 4-A 5-N 6-A1912 ** I-N 2-A 3-N 4iA 5-N S 6-A1913 ** I-N 2-A 3-N 44A 5-N S 6-A1914 * * I..JA 2-A S 3-N 4-N 5-A 6-N1915 ** I-IN 2-N S 3-A 4-A 5-N 6-A1916 * * I-A S 2·-A 3-N 4-N 5-A 6-N1917 ** I-A 2-A T 3-N 4-N T 5-A T S 6-N1918 ** I-N 2-N 3..JN T S 4-A 5-A 6-A 7-AN
CD
1919 * * I-N 2-N 4-A 5-A 6-N 7-N 8-A1920 ** I-N 2-N 3-N 4-A 5-A 6-A 7-A T 8-N1921 ** I-N 2-A 4-A 5-N 6-A 7-N 8-A
1922 ** I-N 2-A 4-A 5-N 6-A1923 ** I-A 2-N 4-N 5-A 6-N1924 * * I-A 2-A 3-N 4-N 5-N 6-A1925 ** I-N 2-N 4-A 5-A 6-N 7-N
Numbers the order ofgames in each year's World Se~es
Letters league had home field (A=American, N=National)** indicates that leagues ended the regular season on the same day
* indicates that one league ended the regular season on that day

J. ERIC BICKEL & DEAN STOTZ
Batting Average by Count and Pitch TypeFact and Fallacy
Many baseball coaches, sportswriters, and television announcers have commented on thefact that batting averages are low with two
strikes or high with less than two strikes. For example,Thomas Boswell, in an article he wrote criticizing TedWilliams' theory that you should take the first pitch,noted that "an analysis of nearly 100 of the top hittersin baseball suggests that the best [hitters] bat about70 points higher and slug 130 points higher" on 0-0.1
From this Boswell claims that batters "should beswinging at alot more first pitches:' that Ted Williamswas a "dumbo:' and that "most hitters are idiots:'Boswell defends his attack on Ted Williams by writing~~Sorry, big guy... you 11lade tIle call, so you've got totake tIle fall:'
Thomas Boswell is not alone. During both the 2000and 2001 World Series, Tim McCarver, broadcastingfor Fox Sports, used a graphic showing Major Leaguehitters bat over 100 points lower with two strikes. Mr.McCarver was surprised by the poor performance of
without exception, hold hitters to a lower battingaverage when the ball-strike count favors the pitcher.Batting averages tend to be about 140 points lowerwhen the ball is put in play on a pitcher's count, ascompared to a hitter's count:'3
We recently tested whether these same trends holdin college baseball by calculating the batting average(AVG) and slugging percentage (SLG) by count forStanford Baseball (both Stanford and opponents batting) from 1998 through 2001.4 These results areillustrated in Figure 1.
As you can see, both SLG and AVG are much lowerwith two strikes. For example, with less than twostrikes, AVG al1d SLG are around .353 aild .563,respectively. Witll two strikes, AVG and SLG drop to.183 and .276, respectively. In other words, batters hit170 points lower and slugged 287 points lower withtwo strikes than they did with less than two strikes.The overall AVG and SLG for our data set was .273and .429, respectively. Therefore, batters hit 83 points
Andrew 1brrez, in his book OffBase: New insightsinto an Old Game,2 notes that the "average major leaguer hit .187 with two strikes, which is more reminiscent of the average pitcher:' Torrez goes on to arguethat taking 1-1 makes sense for a "free-swinger"because if he would have swung at a pitch out of thezone, the count would have gone 1-2, "where he'salmost certain to be out:' Torrez suggests that thissubtle insight separates good managers frommediocre ones.
Finally, USA Today noted, '~l pitchers, virtually
ERIC BICKEL earned his doctorate in decision analysisfrom Stanford University, where he met Dean Stotz.Eric's primary interest is improving decision makingin complex, uncertain environments. DEAN STOTZ is theassociate head baseball coach at Stanford University,where he has beenfor 26 years. Eric and DeanfoundedCompetitiveEdge DecisionSystems, whichprovides electronic pitch/hit charting and data mining softwar"e toamateur and professional baseball and softball teams.
29
amazing! Or, is it?
THE FALLACYWhat is going on? Could it be that batters simply ''loseit" with two strikes, as Boswell, McCarver, a.nd Torrezconclude? Alternatively, could something else causebatting and slugging averages to be 170 and 287points lower with two strikes?
The answer to this dilemma lies in the definition ofbatting average and the fact that it was not created tobe used within a plate appearance. Batting average isthe number of hits divided by the number of at-bats.There are four ways to have an at-bat with less thantwo strikes: Ilit, error, fielder's clloice, or batted out(the ball has to be put in play). However, there arefiveways to have an at-bat with two strikes: hit, error,fielder's choice, batted out, and strikeout (the ball iseither put in play or the batter strikes out). Given thatit is impossible to strike out with less than two strikes,many more at-bats occur with two strikes. In fact,based on Stanford's database, 47% of all ABs occur

THE BASEBALL RESEARCH JOURNAL
Figure 1. BAnlNG AND SLUGGING AVERAGE BY COUNT
o.600 -+m_<w,,,""m»m=,".~,.,*,,.;IIIf,_=,,.,,,,",,»>,w,»>,,=,,.,.,,»»,,,.,=,.,m,m'«"'Y'_"""')"""""_",»m'·k».,mm,==__"w'W"',"_,,,,m,m"»>>>w"",.>>=.,.,~"',.>>=,mm>>>>>>>>,,,,m==w>>>,«w.,w.,_m_M=""w=m»m"",,,.,.,,,,,=m»»w,,,ww.,.,.,.»w,w,»»»»»>!",'"................,. ..
o.500 -+="•••"wm_"_"wm»=w,=»"".=w.x,=»>_».,_.=w""«_,=»>>>_,,,,,"W'~._V»""W",,,,,,=.,.,,,,w,.mww,ww,,,w,wmmmww,,,wmm,,w=,.,,,,,,,W"",'W'¥,' ,,,,,,==w=_,,w,,w,,,,«,w,,,,,,w"»>'''m=,m_='''''w,w,w=,,,"'''''W''''mw*«,,~
0.400 ......'.m..mm»,m='»'=_'"w=-.'.~w'm=-=.'»=-."_»m"'." __=-"Av,_'.W'»»»»».·».""m»»>.""»».»m»__"W",·,=-=-mmmm-m_=»,,,mWWAW._"w_·»==w=w,_.»_,~»."w,·,.mm=-A·_wm,==-.W·=m"w_»,,·,_«-=,»·»w,»>>>..mm,">>>,_=>>>>.>>>>>m4
• "'. '9 *. W W ~ m. No M .,. "'. ~ ~ ~ ",e"" _ "• ~~ ~... ~ ~ w8 * .....o.300 """""·"'»wm"mmY»m»»"',",m.m»,_=w,_",,,w=,,,»,.,wm,,,w.,»,,,,,"».w_."""""~W==M""'·WN~»>"~""_~",,=,""m'W'»'Wn,,,,"W'·="·"'''''",-_""-=,;ov,,,.,,,,,»,,»»»k·"'"''''·'.''WWMmN'VMwn>m,*,'»»»mw_»_,w",w»..,_,,,m>,,,»»»»»m»,!
. \ ..:, .~ .. -.... '"
o.200 -t»=.",,,,=_~,,,»>w,_,»>w,_»,,,.w,,w,,_.=_,",,,===,w»,,.,_.w_,,,»,»»==,w'_'~'»>>>>>>>>>m>>_~'=""""""=>"_W~W>>">>>>>>>W=_>>='m"'_'_>>',~,ww,,,w='_'t,,,=,»>>>m"N_ww~,w.m,,w=_v==w::>,,,,,~"q"w=·,=,,q'·"'»»1... * * w8"' ~8"
0-0 1-0 2-0 3-0 0-1 1-1 2-1 3-1 0-2 1-2 2-2 3-2
Count
Figure 2. DEMONSTRATION OF BAnlNG AVERAGE BY COUNT FALLACY
I· ··· AV~~.~ SLG
Strikes 308Fouls 35Balls 405Hits 79Errors 8Batted Outs 165
Total 1000
Less l'han 1wo Strikes
ABs = Hits(79) + Errors(8) + Batted Outs(165) = 252BA = Hits(79) + ABs(252) = .313
Two Strikes
ABs = Hits(79) + Errors(8) + Batted Outs(165) + Strikes(308) = 560BA = Hits(79) + ABs(560) = .141
30

THE BASEBALL RESEARCH JOURNAL
with two strikes. The remainder are more or less evenly split between the 0 and 1 strike counts. Dividing bythe larger number of at-bats that occur with twostrikes will produce lower AVG and SLG-even for theexact same batting performance. Let's look at anexample (based on Stanford data) consisting of1,000pitches. Assume the 1,000 pitches break out as shownin Figure 2.
As shown above, if these 1,000 pitches were thrownwith less than two strikes, they would have produced252 at-bats and a batting average of .313 (79/252).Conversely, if these pitches were thrown with twostrikes they would have produced 560 at-bats becausethe 308 strikes result in strikeouts! The corresponding batting average is only .141-a difference of 172points. A SLG example would produce similar results.In the interest of space, we will focus on AVG for theremainder of this paper. However, all our argumentsapply with equal force to SLG.5
In both cases, batters got 79 hits out ofl,OOO pitches or, more precisely, 79 hits out of 595 strikes (.132).Although batters are performing just as well with twostrikes, tlleir batting average is much lower.Therefore, it is a fallacy to conclude that'batters perform poorly with two strikes simply because their batting average is low.
AVG in total is comprised oftwo-strike and non-twostrike counts. Therefore, it is not at all surprising thatAVGs a·re much with 0 or 1 strikes (e..g.., 0-0)
areas Boswell did, that batters "should be swinging at alot more first pitches:'
THE REALITYGiven that batting average by count is misleading,how should we measure batters' performance bycount? How does the chance of getting a hit vary bycount? By pitch type?
PERFORMANCE BY COUNT To answer this question, welooked at every pitch thrown for a strike and measured how well batters handled those pitches.6 Forexample, based on Stanford's database of over 76,000pitches and 20,500 plate appearances, representingfour seasons (1998-2001), batters took 49% of all 0-0pitches thrown for a strike. They swung and missed11%, fouled off 17%, put 15% in play for an out, and8% in play for a hit. Figure 3 displays the number ofhits per strike (HPS™) for every count.7
As you can see, the chance of getting a hit with two
31
strikes is at least as high as every other count, exceptfor 0-2. In fact, HPS for the two-strike counts is .123,while it is only .099 for the non-two strike counts.8
That is a difference of .024. Batters are more likely toget a hit (offa pitch thrownfor strike) with two strikesthan other counts. 'This is exactly the opposite relationship as suggested by AVG by count.
Given that batting average by count does not measure the chance the batter will get a hit, what does ittell us? Batting average by count with less than twostrikes is simply the fraction of balls put in play thatwent for hits. Given enough data, we could think ofthis as the chance of getting a hit given the ball is putin play. Conversely, batting average with two strikes isthe probability ofa hit given the batter puts the ball inplay or strikes out. Clearly, this will be lower than thechance of a hit if the ball is put in play, since no battergets a hit when they strike out. Notice from Figure 1that batting average with less than two strikes (or theprobability of a hit if the ball is put in play) changesslightly by count for the non-two strike counts. Let'scall this the batters' III Play AVG™ or IPATM forshort.9 We can calculate this statistic for two strikes bythrowing out all the strikeouts and just looking at hitsdivided by balls put in play. We do this in Figure 4.
Batters have a .353 chance getting a hit if they putthe ball in play with less than two strikes and a .326chance if they put it in play with two strikes.10 Thisdifference of .027 is a real effect. Batters are less like-
strikes. However, it is hardly the dramatic effect suggested by AVG.11
We should also highlight a point that should beclear by now. Batting average tha.t is calculated basedon whether the batter is ahead, behind, or even in thecount will also be misleading. For example, the batteris behind in the count on 0-1, 0-2, and 1-2. Therefore,his batting average when behind will be low because itwill be dominated by 0-2 and 1-2. To see this we referback to Figure 1. Based on our Stanford data set, batters hit .313 when ahead (1-0, 2-0, 3-0, 2-1, 3-1, 3-2)in the count, .285 when even (0-0, 1-1, 2-2), and .218when behind (0-1, 0-2, 1-2). Is this surprising? Wehope not, since this is just another form of the battingaverage by count fallacy. Figure 5 presents batters'AVG and IPA when they are ahead, behind, and evenin count.
As you can see, hitting performance is not as poorwhen behind in the count as AVG suggests.
How about the chance of getting a hit if batters are
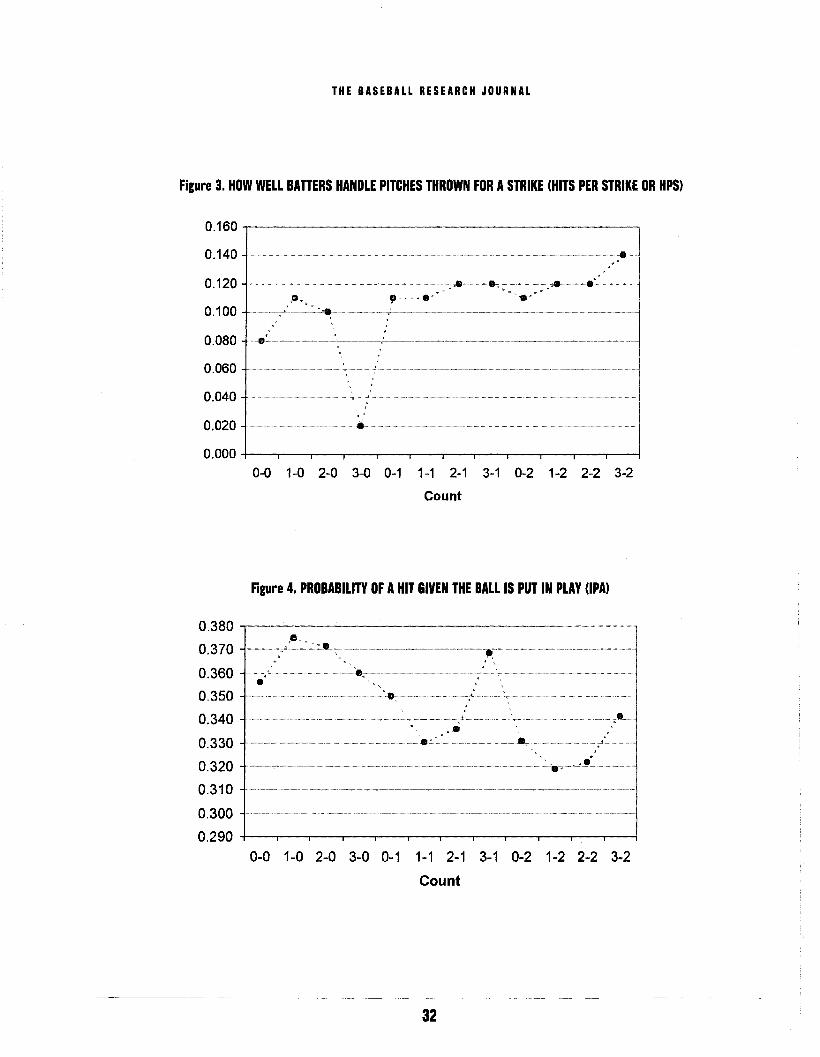
THE BASEBALL RESEARCH JOURNAL
Figure 3. HOW WELL BAnERS HANDLE PITCHES THROWN FOR ASTRIKE (HITS PER STRIKE OR HPS)
----
I I J I I
- -"-' -",
",'"
,"""w ...I
J I I I
0.160
0.140
0.120
0.100
0.080 ---0.060
0.040
0.020
0.0000-0 1-0 2-0 3-0 0-1 1-1 2-1 3-1 0-2 1-2 2-2 3-2
Count
Figure 4. PROBABILITY OF AHIT GIVEN THE BALL IS PUT IN PLAY (lPA)
32
0-0 1-0 2-0 3-0 0-1 1-1 2-1 3-1 0-2 1-2 2-2 3-2
Count
,8w "O.370 -t~"W"»"w".",","~~">w~"~,~;::.,;::;,w.",w",,,m»,.»m,,m"»»~_~""'W~~",'WN""'»W'"_»'».mm"w"«mm".'''''·~''»»',m»m,,~.,m" ••»»~m_~~_"='_"""«W«""_»_"»»~'''W"~",»»,".,_»,_"»»,m,"w~~~,_»,~_w,"·'~m'h,._,"m'_'»~,»'#m,_,»,,,_w","m,_ ...,,mm~_#'''»"1
o.360 -t'",.,.,...w"..':C.'::•.".o«w,«""_...,.«...._ ..«.".,."'='.m...«.w.,.m'_«.....,...,««.,.«..."«'«0W_«W.0«.,_«.x«,<<<,_....<<.~.,0<<<<,<<.,»"'«O«_~W=«_W0".«0""«"" •.m._'""'«_Q"...__'«wT«·'«..«w~_««w.,·,««"«""~«,,.«,,«..«.«w~w_«,,»»'·'·m"~'·"_«·m·'w""'·,«<«•.,.,.,«.,,«w<...,,_.~
0.350 -t".,"»","m,w"''''''''''W'''_,"",.,""m.»>>>>o«".,«mxwm_>>w>>>>".".",wmm",o«_w"""'''''»>>>>>>>>>>>>''''''1.'=>>>''''_><'-_,,,,,,m,_,,,,,_>>>>>>>>>>>>>,,»»»>"__~>>>>>>'0>>,wm>>>>".,"".>>>>,'!."m>>"w,w">>",=">>m",,.,,m,,>>>>,»»»mm»»»Mx»»''',,,,,,,,,»,,,,,,,,,,m·»»>>>>>>>,,>>>·>,,,·,",·>>>>,wmmm'I
0.340 -t»"0,.~m",.,««««<_m,w»>.,w,",~XW"«"'"""««;«"'~'»>"'«"'X'W'·"W"'~«·'«"«<<<'<<<<_0m»>'<<<"<W»"_""'mw,,<<w_,,<_._'~_»'_'~'W~w_mMX<b«"<<<<<"~'»"'_W""._W<~'M?m~mm~.<<,<<~_,_~<<..,,<<<..<<«W=»"ff~»«w~m~,""«~~x,,x:«.:llbw~"«««i
o.330 -t»,w.»>~.w,.X»"X_'W'W»«W«0»>'W~..,w""".mw,,",~,,,~.w«»~~«,,_"»»»"W'_~W~N««<,«_"w~»,,,w,,»,«~,,w, ..w,,.w_",,,»~~»"""~,_m~,m~~~wxw".»w_ww»x •.w 'W""W=»>"O«MW"",";_,~,»x,«<,«.,«w,_~,w»m_Y.'W~~W_«<<<<N»w"",~»_.<<<<<'1"<<<<<"<<<W»"<<~"_y»»x~1
0.320 .......-'"'''wmm''.»'''w»<»»_»»~»»''"''<,,_«••x''W~<»"M''~m.,_~~''««w'm_'»»M»,,_»x_xm_»m" __""o«,mm»"~,""_~_'»_X~_~WN«W_==m_0»»X»W,w»~#__.,<ox".=»m<m»x,',~m~mmo«"_,.~~_~';;""<~;;wx~,,,,m~~,_w"~~".'''»WM~m-'i
o.31 0 -+«"0'~"«''''W'''''W''«~'»»'''''«'''''''««'''««''''·'''''''''"'"«'"'«<'">"«'''W<<<W0»>>>'''<<>M<<''M<<'''''M<<<<<w"<<.<<=,w<<w<<m~W<<<'·''M,<<mo<<__.~,,W«<O'O«'««<O·O«"""="'=.""0"'W'''''«<O'''>·'''''0»»w_««mO«''=''''«<<<<<<<<'m,,_'w="."."_Y«"""«<.w"."m"«<<<w.."w.,,..<<""......<<<<."<<"'''<<~,.{
0.300 +,,,.,.,,,,,,,,_".m»,,,.»>,"m«»»>>>>>>«,,m,,,,m"""""'0''''''_'''W''>>'>>>>>''''''»"»W"0"'·»>«W»»·,_»«m,»",w,»,,,,,,w»m~"="' 0»»,"'''_''''»''W''m»»"~"'WM,m»»"_»"0»»"»~'''·~~«"w,_m~''»''',»,"»m",_,»,."m»m"'"0»'..»»>=..."»_",,,,»>>>>>>>,,,,...,,,,,{
0.290 -t----r--~---r"---r----r---r-----,---,..----,r___--r--T----;

THE BASEBALL RESEARCH JOURNAL
Figure 5. AVG AND IPA WHEN THE BAnER IS AHEAD, BEHIND, OR EVEN IN THE COUNT
0.400 ""T""","""",M~__~"""""""'_-~"""""",,,-__~__~""""""l!
o.350 .....".,,,,'.''''.0'.'.·''',,,,,,.,.·,,,,.,,''',,,''',,,,.,,''.''''.·0•.'
0.300 -t""""""''''''''0''''.t-:-::-:
o.250 -t«"""~«."«',w~·f:··.·-:
0.200 .",,······""',,·"'..,..,"'''7·········
o.150 ""'t"~.0.'xwm",·",f···
0.1 00 "'«""''''''~'''««'''''1' .: :.. :..
0.050
0.000 -f--...............-
IOAVGI.IPA
Ahead Behind Even
Figure 6. AVG AND IPA BY PITCH TYPE
o.350 """",..,..,"''',."".,''''''~"'"''«''''"w"w''«'..m'w..'«,
0.300 -fw,»»,mm"""'''M=~
0.250 ""I ",..w.«Nmn·I·:·:·:·:·:,:.:·::
0.200 «""""···",,··w"".."""... :.:-:-:.-:.:
0.150 -f""""'''''"'"".w,·",,··,I·:·-::·:·:·:·
0.100 -1''''·",.'''=,'',·'''''1::·::::::·.·.·.:·::
0.050 -I..om"" ...,,'......«mw,l:·.·.-:·:·:·:·:·:·:.
0.000 -+---a.-....M~
10 AVG.I.IPA
FB BK
33
CH
THE BASEBALL RESEARCH JOURNAL
thrown a strike when they are ahead, behind, or evenin the count? Batters' HPS was .113, .114, and .094.Batters are just as likely to get a hit off a pitch thrownfor a strike when they are ahead in the count as whenthey are behind! AVG by count has misled us, again..
PERFORMANCE BY PITCH TYPE Breaking down batting average by pitch type is also misleading because fewerfastballs and more off-speed pitches are thrown withtwo strikes. Therefore, batters will have a higher batting average offfastballs than.off-speed pitches-evenif they are just as likely to get a hit off of either pitchtype. For example, based on our Stanford data set,pitchers throw 66% fastballs with less than twostrikes and 56% fastballs with two strikes. In Figure 6we present batters' AVG and IPA by pitch type.
Notice the large decrease in AVG for BK, as we suspected. The difference between IPAs is much lower.There is a slight decrease for BK, which we wouldexpect-batters should be less likely to get a hit off aBK put in play than a FB. However, the large difference in AVa between pitch types is primarily relatedto the problem oflooking at batting average by COUllt.
In addition, batters' HPS for FB, BK, and CHs were.110, .087, and· .106, respectively. In other words, batters were just as likely to get a hit off a CH thrown fora strike as a FB. The chance of getting a hit off a BKthrown for a strike is a bit lower.
by count are highly misleading, because they implythat batters perform poorly with two strikes or incredibly well with less than two strikes. The low (high)AVG and SLG numbers with two strikes (less thantwo strikes) are simply defects of these statistics. Thisproblem even affects AVG and SLG by pitch type.Unfortunately, these defects are not widely appreciated and many within baseball have been misled.Thomas Boswell has even gone so far as to call thegame's greatest hitter a "dumbo" based on this misunderstanding. We are afraid there is only one dumbohere and it is not Ted Williams.
The defects ofAVG and SLG by count are correctedby looking at batters' HPS and IPA statistics. HPSdemonstrates that batters are more likely to get a hitoff a strike with two strikes than other counts. IPAhighlights that batters are less likely to get a hit iftheyput the ball in play with two strikes or off a BK.However, this effect is much smaller than what isimplied by batting average.
34
NOTESIThomas Boswell, '~d the First Shall Be Best-Thenumbers prove Ted Williams Wrong: You ShouldSwing at the First Pitch;' Inside Sports, 15, August1993:, 58-65.
2Andrew Torrez, OffBase: New Insights into an OldGame. Emoryville, CA: Woodford Publishing, 1999.
3Matt aIkin, "Keep Running Until They Tag You;'USA Today.com, March 28, 2001.
4We do not claim that AVG and SLG are the best wayto measure hitting performance.
50ne real effect that shows up in SLG by count is thefact that batters average more bases per hit withfewer strikes and more balls-to see this simplydivide SLG by AVG, which yields bases per hit(BPH™). BPH is a trademark of Competitive EdgeDecision Systems.
6We performed this analysis using Competitive EdgeDecision Systems' ChartMine™software system andtheir HandleIT™ statistic. Stanford has usedChartMine since 1998. Seewww.edgedec.com formore detail.
7HPS is a trademark of Competitive Edge DecisionSystems.
8Weighted average based on the number of strikesthrown on each count.
9In Play AVG and IPA are trademarks of CompetitiveEdge Decision Systems.
ill play on each count.IlThanks to an anonymous referee of this paper, we
understand that this trend holds in MLB as well.

CHRISTOPHER DEVINE
Harry WrightThe Most Important Baseball Figure of the 19th Century?
asbest respected and most popular ofthe exponents andrepresentatives of professional baseball, of which hewas virtually the founder:'3 Wright's former employer,Col. John I. Rog@rs, who he was often at odds vvith,wellt so far as to llote, "It lIas truly beell said, tllat soidentified was he with the progress and popularity ofthe game that its history is his biography:'4
Though the complimentary attitudes of these menmay have been heightened in the wake of Wright'sdeath, it was not uncommon to find similar ones during his baseball days. "Harry Wright is undoubtedlythe best known baseball man in the country,"Sdeclared one paper in 1886.
So how did Wright achieve this status? "UncleHarry;' as he was often called, was both a visionaryand a pioneer. He created or helped implementnumerous changes now integrally linked with thebaseball fabric, including the· doubleheader, platooning of fielders, batting practice, farm system, pitchingrotation, sacrificing of outs for runs, positioning of
Stockings, he served as captain, center fielder, generalmanager, traveling secretary, and public relationsdepartment-simultaneously.
Harry Wright, if bested by those men in their areasof expertise, was not truly eclipsed. And as 'an allaround pioneer, he may have no match.
Though Harry Wright is not a household nametoday, he was a living legend for several decades in the19th-century. Newspapers frequently referred to himas either "The Father of Baseball" or "The Father ofProfessional Baseball:' "You make me feel awful oldwhen you say I am looked upon as the 'father of thegallle,'" lIe wrote to Natio11al League PresidelltWilliam Hulbert. "You must look farther and I am certain you will fare better. There is a gentleman in NewYork, Henry Chadwick Esq. who is richly deserving ofthe title 'father ofthe game; for 'the pen is mighty' andhe has invariably used it for the best interests of thegame, as we all know:'2
Wright's ready deference to Chadwick on the matter
CHRISTOPHER DEVINE is a college student and a Yankeesfan. He is a winner ofSABR's Jack Kavanagh award.
In 1999 the Society for American Baseball Researchcompleted a poll that ranked Harry Wright as thethird largest contributor to 19th-century baseball.
Though hindsight is often said to be 20/20, that isquestionable in this case. In fact, the 19th-centuryperception of that question was quite different. In aNovember 1893 edition of The Sporting News, Wrightwas noted as the most remarkable figure in baseball.His only competition, according to the paper, was neither Henry Chadwick nor Albert Spalding-namedfirst and second in the SABR poll-but longtime player and manager Adrian "Cap" Anson. It is likely that20th-century achievements and events 11ave cllal1gedopinions over time. Chadwick, recognized asAmerica's original sportswriter, worked in a profession that has gained quite a bit of status in the past100 years. Sports writing has since been applaudedfor its use in popularizing baseball across the countrywith an in-depth coverage of the game, a style originated by Chadwick. This, coupled with his effect ontIle alld in him
as a gallle.Wright failed in brief attempts at sports writing"Composition is out ofmy line;'! he explained-he wasas knowledgeable ot: and as instrumental in thechanging ofthe rulcbool{ as Chadwick. Contemporarysources rank them as equals in tllis regard.
In Spalding's case, much of the reverence for himmay have corne as a result of his 1911 bookAmerica'sNational Game, regarded as the first history on baseball. This, of course, is a 20th-century achievement,not a contribution to 19th-century baseball. He wasalso a phenomenal player and powerful but ruthlessmagnate who established the successful Spaldingsporting goods company. Wright tried his han,d at thesame venture but failed. However, he himself was anacclaimed ballplayer and a powerful executive ofsortsin his own right. While with the Cincinnati Red
35

THE BASEBALL RESEARCH JOURNAL
fielders according to hitters' tendencies, fielders backing up one another, throwing ahead ofrunners, relieving ofthe pitcher in order to upset the batter's timing,first patented scorecard, and the modern baseball uniform including short knickers and stockings. Due tosome of these creations and his way of managing,Wright is often credited as "the originator of teamwork:'
Additionally, he was instrumental in the implementation of: spring training, bunting, the hit and run,hand signals for both batters and runners, long-termcontracts, and endorsements, when he lent his nameto a turnstile manufacturer in the 1880s.
Ofcourse, each ofthese carries a story that could beexpounded upon further. For example, Wright's development of the idea of a farm system was done quiteunintentionally. During his tenure as manager of theProvidence Grays, in 1883, for the first time in baseball, Wright put together a second nine for the clubwith the intention of developing major league talent.The second nine, the Providence Reserves, would playon the Providence grounds when their parent teamwas away.. Skeptics argued that this system WOllld saturate the already lean Providence fan base and negatively impact economic concerns. But ultimatelyWright was lauded for his brainchild and recognizedas "the father of the 'reserve club' system:,6 Thoughthe idea of a farm system was not truly implementedIlntil K'r~ll n £II n
asrecord.
Despite his heralded successes, Wright suffered hisfailures as well, most notably the "flat bat:' Wrightdeveloped the idea of a new flattened club in 1880 asa way oflessellillg tIle frequellcy of foul balls arId danger to catchers while enhancing scientific battingacross the league. Wright's timing was bad, though,for there was a widespread call for offense at the time.As a result, the National League owners initiallyopposed the idea, but in 1885 they admitted its usage,as an optional alternative to round bats. To his dismay,reaction to the innovation was unilaterally unenthusiastic; even George Wright, Harry's Hall of Famebrother, condemned its chances ofsuccess. As he predicted, the idea fizzled and died out quickly.
Perhaps Wright's most intriguing, enduring, andconfusing innovation was spring training. Did heinvent it? That is difficult to say. Wright did not originate the idea oftraveling below the Mason-Dixon lineas spring approached, but he seems to be the first to
36
regard it with the modern perspective. Teams such asthe Chicago White Stockings, New York Mutuals, andeven Wright's Cincinnati Red Stockings frequentedthe South for springtime baseball in the late 1860s to1870s. But their intention was different. Though theteams were there to get out the winter rust, the trueobjective of their venture South was for the money,which they could not get playing ball up in theNorthern climate at that point. However, Wright sawa different benefit to the "Southern trip;' as springtraining was referred to in those days. "I'll tell you,there's nothing like it;' he said in 1890. "Besides getting in good training, the men all learn each other'splay-get into each other, as it were. In this way theydon't lose the first six weeks of the regular season, asin the case with the teams which began the circuitwith 'raw' men. I'm satisfied that by another year allthe League clubs will playa six or eight weeks' Floridain February and March:'7
In fact, other nines had begun to follow hisPhiladelphia club's lead by 1890, including Chicago,New York, Brooklyn, and Philadelphia of the PlayersLeague. Wright's Philadelphians first made the trek toCharleston, South Carolina, in 1886. (The Clevelandand Detroit nines opted for Savannah, Georgia, whilePittsburgh practiced in Nashville, Tennessee.) Wrightwas tempted to venture farther to Florida the nextspring, but settled for Savannah. He was hesitant to
competition in these trips was mostly againstlocal nines that often included professional talentsuch as Mike "King" Kelly, who could use the trips asmuch for profit as training. Practice was daily andgal11es were played a l11illilllUlll offive tillles per week..Players were under no obligation-but a great deal ofpressure-to attend. Wright would solicit each playerto come along, and each had the option of respondingwith a letter indicating his willingness to go. In 1887,four Philadelphia players resisted the trip as a reaction to salary disputes. Wright tried to convince hisclub's pitcher/second baseman Charley Ferguson tocome South, but Ferguson held firm and the clubtrained without their star player.
While there, each player was constantly occupied.At 6:00 he awakened to a saltwater bath and a vigorous rub with coarse towels. A halfhour later, the teamtook a brisk three-mile walk along the beach until7:00. As the sun rose, a large, full breakfast wasserved. Afterward, they headed to a large hall forindoor practice that Wright had procured. The players

THE BASEBALL RESEARCH JOURNAL
exercised by working with "Indian clubs" and dumbbells, as well as their defense on grounders and linedrives. After eating lunch, the men took a walk from3:00 to 4:00. Once supper was eaten, the players satin their quarters playing checkers and "swapping lies"before bedtime at 10:00.
After an unsuccessful spring in Cape May, NewJersey, Wright accepted Florida as an accessible site in1889 due to a better financial enticement. "In formeryears it was rather expensive [to train in Florida], butnow the twelve-club Southern League will offer goodguarantees to the League team, and I think the tripwill be taken by most of the league teams:'B QuicklyFlorida, Jacksonville specifically, became recognizedas the "headquarters for winter baseball:' Wright, withhis shrewd business sense, readily embraced the city."I want the people [of Jacksonville] to understandthat the Philadelphians are here to identify themselves with Jacksonville. They mean to uphold thereputation and honor of the city as far as base ball isconcerned. For the present, therefore, my team ispractically a Jacksonville club:'9
The Southern trip qtlickly began drawing attention.As Philadelphia sailed out of a New York port towardJacksonville in 1889, a cheering assemblage, includingBrooklyn club president Byrne, New York managerJim Mutrie, star pitcher Tim Keefe, and HenryChadwick, stood on the docks. Two years earlier, thePhiladelphia Record had employed Wright to cover
of the baseball operation. As a manager he was heralded as the ''best captain that ever took a base ballorganization in hand:'ll As an athlete, he "gave a superior performance in any kind of physical activity;'12according to Harry Wright, Jr., his third son. Thisincluded cricket-his first love-baseball, skating,track, hunting, and fishing. In 1872, Wright and hisbrother George were described as "the best exponentsof batting as a science in the country. These playersknow when to strike, how to strike, and where to putthe ball:'13
Wright's rapid development as a baseball player wasquite remarkable. He began as a professional cricketerwith the St. George's Dragonslayers of Hoboken, NewJersey, in 1850 at the age of 15. His father, Sam Sr.,was already a member and one of the best cricketersin the country. Harry discovered baseball in 1858 andquickly honed his skill as a member of the New YorkKnickerbockers, a club that participated in the firstrecorded baseball game 12 years earlier. Just 12 daysafter his debut with the Knicks, Wright headed a NewYork nine in the famed Fashion Course Matches. TheMatches were a three-game series stretched over thesummer of 1858 between picked nines of New Yorkand Brooklyn,·perhaps best thought of as a vintageAll-Star Game. At the time the series was revered forits conversion of many spectators to die-hard baseballfans, but today it is more significant for the unprecedented act of charging an admission fee. The money
day. Wright could not hide his doubt that peoplewould be interested in a game that essentially meant"nothing;' but nevertheless predicted that "the scoreof each fine winning practice game will be greedilyscallned l)y the ent.husiasts here."10
Hoping to capitalize on the success of these exhibitions, the Philadelphia management-which hadbeen reluctant to permit Wright to take the Southerntrip-set up a visit to Los Angeles in November 1887.Wright opposed the idea from the onset. The playerswould be drained, he argued, and unfit to play well in1888. Additionally, he feared-correctly-that playerswould enjoy the California atmosphere so much thatthey would settle there and leave Philadelphia behind.The upshot of the trips was a disaster. The playerswere drained, some did desert, their lackluster playwas criticized heavily in the press, and CharleyFerguson left with a lame arm.
Wright's instinct for success was evidently keen. Heexcelled in a wide range .of areas, from all spectrums
37
taboo at the time-but instead for groundskeeping.When money first did-at least openly-reach thehands of a player but a few years later, the recipientwas Harry Wright:- when he earned $29.65 for a benefit game to honor hiR family.
Wright's name is perhaps the one most deservedlylinked to professionalism. He was, after all, the manager and figurehead of the first openly all-professional baseball club, the 1869 Cincinnati Red Stockings.Though Wright and the Cincinnatis were initially condemned in the newspapers for their transition, by theend of their year-and-a-half-Iong undefeated streak,professional nines had sprung up allover the country.In that span of time, the Red Stockings traveled fromcoast to coast, first led by Wright to face all of themain competition in the Northeast before taking therevolutionary step ofventuring out to California for aWestern tour.
Historians note that Wright's leadership of the professional movement lent a good name to its cause that,

THE BASEBALL RESEARCH JOURNAL
if lacking, might have jeopardized or delayed its existence. A sense of distrust had overtaken the perception ofmoney and baseball working alongside, in lightof frequent scandals and player corruption. Wright'sscrupulous character and reputation helped spur professionalism as an acceptable element ofbaseball. Forthe first time it was disassociated from hoodlums andcrooks, and instead represented by a man as respected as any amateur involved with the game. Wright wasfar from the archetypal money-hungry professional.He had no tolerance for gambling; in fact, Wright'sidea of a bet was to "name as a 'wager' the pride andsuperiority in the manly exhibition of our NationalGame:'14 In 1882, he upped the ante to a leather medalfrom Mutrie, hardly incriminating evidence.
Wright was a man of temperate. habits who did notswear, smoke, or drink. In fact, he went so far as tostation a police officer in the ballpark while withPhiladelphia to put a stop to smoking and insults.Nevertheless, peers admired him for his manner ofacting morally without condescension~
Wright was also renowned for his honesty, which hecarried onto tIle ball field even when detrimental tohis team's cause. In an 1868 game between Cincinnatiand the Unions of Morrisania, the umpire made anerroneous decision to favor the hometown RedStockings. Wright knew the call was an effort toappease the crowd, and so he stepped onto the fieldand overruled the umpire, in what proved to be a
Years later, with Philadelphia, outfielder EdAJ.ldrews took a 2o-foot shortcut inside third base enroute·to a run. To most onlookers, getting this by theumpire-there was only one on the field. in thosedays-was a sign of cleverness. Wright did not havethat reaction. When Andrews returned to the bench,his manager was pale. "Ed;' he said, staring intentlyinto Andrews' ~yes, "don't ever let me see you do thatagain. I don't want any games won that way:'15
Trust for Wright was so strong that he occasionallyumpired National League games-while managingother league teams. As The Sporting News put it,"There was no figure in base ball more creditable tothe game than dear old Harry:'16
In 1896, the Reach Guide wrote, "Every magnate inthe country is indebted to [Harry Wright] for theestablishment of baseball as a business, and everypatron for fulfilling him with a systematic recreation.Every player is indebted to him for inaugurating anoccupation in which he gains a livelihood, and the
38
country at large for adding one more industry . . . tofurnish employment:'17
Wright's contributions to 19th-century baseballincluded both specific and generalbreakthroughs thathave been vital to the development of b~seball and toits establishment as the national pastime. Hisachievements as a player, manager, and visionary canstill be seen in the game today. Was Harry Wright themost important baseball figure of the 19th century?'~ opinion settles nothing unless the truth of theassertion is either self-evident or demonstrated;' heonce said.
"Have I put this so you can understand me? and ifso, how does it strike yoU?"18
NOTESIThe Chadwick ~crapbooks2December 29, 1874, letter to William Hulbert3The Chadwick Diaries4Ibid.5The Cha.d1€,ick ~ScrapbQQks
6Tl'te SPO'tti'l~g L'ije, Decel11ber 12, 18837The Chadwick Scrapbooks8The Sporting News, January 13, 18939The Chadwick ScrapbooksIOVOight, p. 194
lIThe Chadwick Scrapbooks12The Sportin,gHeritage, March/A,pril198713The Ch,adr.€,ick Scrapbooks
15Ryczek, p. 17816The Sporting News, October 12, 189517The Chadwick Scrapbooks18March 26, 1875, letter to the New York Clipper
BIBLIOGRAPHYRyczek, William J. When Johnny Came Sliding
Home. Jefferson, NC: McFarland, 1998.Voight, David Quentin. American Baseball.· From
Gentleman~ Sport to the Commissioner~ System.Norman, OK: Univ. of Oklahoma Press, 1966.
The Chadwick DiariesThe Chadwick ScrapbooksThe Harry Wright CorrespondenceThe Sporting HeritageThe Sporting LifeThe Sporting News
DAVID F. CHRISMAN
Early RBI Leaders in the International League
It is obvious that the game ofbaseball has changeddrastically over the years. With the value of RBIcompilations accepted now as a matter of course
the serious historian must take note of their prominence in league history-and by extension, baseballitself: As far as the International League is concerned,the 1920s mark the heyday of RBI totals-individually and team-wise.
The 1930s was another strong decade for scoringand RBI, but by the 1940s and 1950s, 100-RBI accumulations began to dwindle. After 1960 Runs BattedIn totals in excess of100 have been rare.
RtlnS Batted In as a baseball statistic is a relativelyrecel1t pl1enol11el1011. Reported as early as 1880 by theChicago Tribune, it was not kept as an official statisticby the major leagues until 1920, and the InternationalLeague the year after. Most newspaper box scores didnot note the statistic until 1930.
This study explores the early RBI totals in theInternational League from 1884 through 1921. Usingold newspapers and sports publications, I tabulated
task is not as cut and dried as it seems. MarshallWright, in his brilliant The International LeagueYear-by-Year Statistics, 1884-1953, notes that even theda.te the Interna.tional l~ea.gue began (a.s well as itscontinuity) is open to question. The earlier league (theInterstate Association) disbanded in 1883 andreopened its doors in 1884 using the name EasternLeague. Most observers accept that campaign as thebeginning of the circuit now known as theInternational League. However, there is a dilemmaconcerning the 1885 season and how it affects theleague's continuity. As Wright points out, there weretwo antecedents of the International League in 1885;the New York State League and the Eastern League.
DAVID F. CHRISMAN is a retired English educator whotaught at the secondary and college level. He is currently a freelance writer with a particular interest in theminor leagues prior to 1960.
In a shortened season, the Syracuse Stars won theNew York State title, and Mike Scanlon's WashingtonNationals were the Eastern League Champions. Thequestion is: which ofthe two is the legitimate forerunner of the International League?
In 1935 the ·International League itself (underFrank Shaughnessy's guidance) accepted Syracuse'swin in the New York State League as the rightful second year in the circuit's history. However, some historians question this, and are more apt to accept theEastern League as a valid predecessor. Regardless, theconfusion leaves the door ajar for debate. I will acceptShaughnessy's view of the dilemma for the sake ofclarity. Wright's treatise also insists that there is a similar perplexity regarding the 1886 season. There isanother dichotomy: Utica won the New York· StateLeague pennant (the third year of the InternationalLeague) and Newark's Little Giants ran away and hidin the Eastern League. Again, for the sake of clarity, Iwill accept Utica as the third-year champs.
Let us assume that the International ......""'1"""""""""'"
title with a mark of .380, while Wilmington's Tom"Oyster" Burns led the league in home runs (11) andRBI (94). Coogan was a close second with 92. In theabbreviated 1885 campaign, SyraC1..1Se'S Mike Griffinwon the RBI crown with a mere 70. 111 1886~
Rochester's Doc Kennedy drove in the most runsagain, with 94. Buffalo's Mike Lehane edged his teammate Frank Grant, the Bisons' early black star, for the1887 RBI title-the first time we had yearly totals inexcess of100.
Jake Drauby, a teammate of Jimmy Collins· inBuffalo in 1894, was a long-time International Leagueslugger in the 1890s. Toronto's Buck Freeman had atwo-year reign as a slugger before returning to theNational League in 1898. In 1901 he jumped from theBoston National League team to the new BostonAmericans. In 1903 he became the first player to leadboth leagues in home runs when he hit 13 for theAmericans. In addition, he led the AL in RBI totals in1902 and 1903.
39

THE BASEBALL RESEARCH JOURNAL
Another early International l,league slugger of notewas Abel Lezotte ofWilkes-Barre and Syracuse. Threetimes his RBI counted exceeded 100. Worcester'sKitty Bransfield had a dream season in 1900, givingevery promise of major league stardom.
However, it was not to be. In 1901 he joined thePittsburgh Pirates, one of the greatest teams of thatperiod. Bransfield became a "good'field, no hit" worker among his more illustrious teammates. However,
his rookie year provided his best offensive numbers ofhis career, as he hit .295 with 91 RBI and 92 runsscored. After hitting .223 in 1904, he was swappedwith two· other to the Phillies for first baseman DelHoward. The Pirates would continue to have problems at first base for the next 15 years, blaming it onthe "Bransfield Curse."
The yearly totals of RBI in the early years in the circuit are shown on the following lists.
INTERNATIONAL LEAGUE RBI LEADERS, 1884-1921
1884 1888 1893Tom Burns, Wilmington 94 Ollie Beard, Syracuse 116 Frank Bonner, Wilkes-Barre 116J. W. Coogan, Newark 92 Mike Lehane, Buffalo III Joe Knight, Binghamton 114Jacob Goodman, Lancaster 87 Henry Simon, Rochester 104 Daniel Stearns, Buffalo 106John Shetzline, Trenton 86 John Rainey, Hamilton 102 Jake Drauby, Buffalo 106Charles Bastian, Wilmington 82 Charles Marr, Syracuse 101 Joe Visner, Albany 100,'
Patsy Donova.n, t,ondon 98 Ted Schemer, Troy 981885 Rasty Wright, SyraCtlSe 94 John Shearon, Erie 97Mike Griffin, Syracuse 70 Joe Knight, Hamilton 92 Bill Bottenus, Springfield 96Charles Osterhout, Syracuse 66 Jim Daly, Buffalo 94Doc Kennedy, Rochester 64 1889 Peter Gilbert, Springfield 88Charles Withney, Rochester 62 Bill Hoover, Toronto 104 Bill Wolt: Buffalo 87Joe McGuckin, Binghamton 61 Joe Knight, Hamilton 102 Fred Scheibeck, Erie 86
90Doc Kennedy, Rochester 94 1894JoeVisener, Rochester 92 1890 Jimmy Collins, Buffalo 126Jon Morrison, Toronto 90 Don Casey, Hamilton 55 Jake Drauby, Buffalo 123Henry Simon, SyraCtlSe 88 Charles Campau, Detroit 53 Phil Nadeau, Springfield 114Sandy Griffil1, Utica 85 Buck West, Sagillaw 03 John Sheat'"o11, Erie 111
Bill Schindle, Utica 84 Pat Friel, London 51 Ed Breckinbridge, Troy 106Mike Griffin, Utica 81 Jim Connor, London 50 Harry Lyons, Providence 104
Bill Clymer, Buffalo 1021887 1891 Charles Bassett, Prove 101Mike Lehane, Buffalo 118 Ted Scheffler, Buffalo 102 Ted Scheffler, Troy 98Frank Grant, Buffalo 114 Doc Kennedy, Rochester 94 Fred Betts, Wilkes-Barre 96Jim Knowles, Rochester III Harry Lyons, Buffalo 90 Jim Rogers, Providence 94Harry Jacoby, Syracuse 108 Joe Hornung, Buffalo 88 Bill Johnson, Scranton 92Mike Slattery, Toronto 104 Joe Mack, Buffalo 87 Dan Minnehan, Syracuse 88Henry Simon, Syracuse 104 Henry Lynch, Springfield 87Rasty Wright, Hamilton 102 1892 Jim Field, Erie 86Ollie Beard, Syracuse 101 Joe Knight, Binghamton 100 Bill Bottenus, Springfield 85Ned Crane, Toronto 98 Sam Wise, Rochester 94Tom O'Brien, Jersey City 96 Ted Scheffler, Troy 85Gus Alberts, Toronto 94
40

THE BA SEBALL RES EAR CH J0URN AL
1895 1898 1903John Shearon, Buffalo 118 Buck Freeman, Toronto 131 Moose McCormick, Jersey City116Abel Lezotte, Wilkes-Barre 114 Reddy Grey, Toronto 102 Tom Jones,Baltimore 103Judson Smith, Toronto 112 Jim Casey, Toronto 98 John Hayden, Baltimore 94Jim Daly, Rochester 108 Bill Massey, Ottawa 96 Matty McIntyre, Buffalo 90Harry Lyons, Rochester 104 John Barry, Montreal 92 Pat Crisham, Rochester 86Joe Knight, Providence 102 John O'Brien, Syracuse 88 Mike Doolin, Jersey City 84Dan Minnehan, Syracuse 101 Frank Bonner, Ottawa 87Henry Simon, Syracuse 98 Ed Canivan, Providence 86 1904Bill Lush, Rochester 96 Myron Grimshaw, Buffalo 110Sam Wise, Buffalo 94 1899 Tim Jordan, Baltimore 94Buck Freeman, Toronto 92 Charles Kuhn, Worcester 94 Ernie Courtney, Buffalo 91Howard Earl, Wilkes-Barre 90 John Walters, Providence 94 Bill Clancy, Montreal 88Bill Clymer, Buffalo 88 Harry Davids, Providence 93 Herm McFarland, BaIt. 87Jim Field, Buffalo 87 Bill Schindle, Hartford 92Ed Lytle, Wilkes-Barre 86 Tom Campbell, Springfield, 91 1905
Judson Smith, Toronto 90 Frank LaPorte, Buffalo 110
1896 Reddy Grey, Toronto 88 Jake Gettman, Buffalo 82
Jake Drauby, Providence 120 Jim Hannivan, Toronto 86 Tim Jordan, Baltimore 80
Abel Lezotte, Wilkes-Barre 120Charles Dooley, Rochester 111 1900 1906Cllick Stalll, Buffalo 109 Kitty Bransfield, Worcester 131 Jack Thoney, 'lbronto 106
Ted Scheffler, Springfield 106 John Cassidy, Providence 119 Jim Murray, Buffalo 103
Fred Betts, Wilkes-Barre 104 Pat Dolan, Springfield 111 Bill Clancy, Rochester 96
Joe Knight, Providence 100 Harry Davis, Providence 106 John Kelly, Baltimore 94
Ollie Beard, Rochester 98 Frank Bonner, Rochester 96 Jake Gettman, Buffalo 88
Frank Bonner, Wilkes-Barre 97 Harry O'Hagan, Rochester 96 George Smith, Buffalo 86
Jim Daly, Rochester 94 Ed Householder, Rochester 94
Jim Canavan, Providence 92 Mal Kittredge, Worcester 86 1907
Harry Lyons, Providence 88 1901 Jim Flanagan, Rochester 96
Peter Gilbert, Springfield 87 Frank Bonner, Toronto 116 Walt Clement, Jersey City 94Ed Gremminger, ,Rochester 110 George McConnell, Buffalo 92
1897 Jim Bannon, Toronto 102 Ambrose McConnell, Prove 88
Dan Brouthers, Sprngfld. 132 Bill l,ush, Rochester 99 Phil Poland, Providence 86Buck Freeman, Toronto 120 George Barclay, Rochester 94 Jack Thoney, Toronto 83
Dan McGann, Toronto 111 George Smith, Rochester 92
Larry Gilboy, Buffalo 108 Joe Delahanty, Montreal 92
Abel Lezotte, Syracuse 102 Homer Smoot, Worcester 91
Tom Bannon, Syracuse 101 Reddy Grey, Rochester 89
Dan Green, Springfield 97 Harry O'Hagan, Rochester 88
Curtis Weigand, Providence 96Frank Bonner, Scranton 94 1902Judson Smith, Syracuse 90 Jocko Halligan, Jersey City 116
Charles Dooley, Montreal 88 Myron Grimshaw, Buffalo 104
Reddy Grey, Buffalo 86 Dave Brain, Buffalo 102Bill Massey, Toronto 93Jake Gettman, Buffalo 92Bill Clancy, Worcester 88Joe Delahanty, Worcester 86
41

THE BASEBALL RESEARCH JOURNAL
1908 1912 1915Bill Abstein, Providence 106 Tim Jordan, Toronto 130 Clarence Kraft, Harrisburg 118Harry Arndt, Providence 101 Jim Murray, Buffalo 121 George Whiteman, Mon. 114Jim Jones, Montreal 98 AI Shaw, Toronto 114 John Flynn, Montreal 101Ed DeGroH: Jersey City 94 Cozy Dolan, Rochester 108 Charlie Jamieson, Buffalo 98Steve Evans, Montreal 94 Ed Murphy, Baltimore 104 Bob Clemens, Rochester 96Bud Sharpe, Newark 88 Harry Swacina, Newark 102 Hal Ireland, Montreal 84Harry Hoffman, Providence 86 Art Bues, Buffalo 101 Chick Shorten, Providence 84
Ernie Johnson, Rochester 101 John Bates, Richmond 831909 Butch Schmidt, Baltimore 98 Les Channell, Buffalo 82Jake Gettman, Newark 104 Art McCabe, Buffalo 96John Kelly, Newark 101 Jack Lelivelt, Rochester 94 1916George Simmons, Rochester 100 Bill Collins, Newark 88 Will Bankston, Richmond 104Ben Houser, Toronto 98 Mickey Corcoran, Baltimore 87 George Twombley, BaIt. 104Jack White, Buffalo 93 Joe Breen, Jersey City 86 Henry Damrau, Montreal 96Harry Hoffman, Providence 91 Frank Truesdale, Buffalo 85 Guy Tutweiler, Providence 96Myron Grimshaw, Toronto 88 Bill Bradley, Toronto 84 Walt Rehg, Providence 92Dan Moeller, Jersey City 86 Swede Carlstrom, Buffalo 91
1913 Les Channell, Buffalo 881910 George Simmons, Rchstr. 110 Bill Wagner, Montreal 87Otto Deininger, Jersey City 103 Ray Demmitt, Montreal 104 Tim Hendryx, Richmond 87AI Shaw, Toronto 100 AI Shaw, Jersey City 98 George Jacksoll, Buffalo 86Butch Goode, Baltimore 98 Charles Hanford, Bufralo 98 Merwyn Jacobson, Roch. 84Wilfred Osborn, Rochester 94 Jim Murray, Buffalo 96 Joe Slattery, Montreal 83Dan Moeller, Rochester 92 Ed Zimmerman, Newark 94 Dawson Graham, Toronto 82John Kelly, Newark 91 Otto Deininger, Jersey City 91Ernie Johnson, Jersey City 88 Ed Lennox, Montreal 88 1917
Harry Swacina, Newark 86 Napoleon Lajoie, Toronto 1341911 Hal Paddock, Rochester 84 Turner
IIIClayton Perry, Providence 122 1914 Merwyn Jacobson, Toronto 104AI Shaw, Toronto III Wally Pipp, Rochester 120 Henry Damrau, Montreal 104Charles Hanford, Montreal 104 Tim Jordan, Toronto 114 Art Bues, Baltimore 102BlItch Schmidt, Baltimore 103 George Whiteman, Mon.. 111 Ed Zimmerman, Montreal 100JOllll I(elly, .Newark 102 AIf Platte, Providence 110 Will Bankston, Richmond 92Chick Gandil, Montreal 101 Joe Schultz, Rochester 104 Merlin Kopp, Buffalo 91Otto Deininger, Jersey City. 100 Ed Onslow, Providence 104 Ross Youngs, Rochester 88Mickey Corcoran, BaIt. 99 John Flynn, Montreal 102 Frank Fuller, Newark 84Ed Miller, Montreal 96 Guy Tutweiler, Providence 100 Hank Eibel, Richmond 84Ray Demmitt, Montreal 94 Ed Zimmerman, Newark 98Bill Bradley, Toronto 91 Bob Fisher, Toronto 96 1918Herb Moran, Rochester 88 Cuke Barrows, Baltimore 94 Howard McLarry, Bing. 82
Curt Elston, Providence 87 Leo Callahan, Newark 93 Earl Smith, Rochester 78Clarence Kraft, Newark 91 Bill Estes, Rochester 73Frank Gilhooley, Buffalo 89Bill O'Hara, Toronto 88Dave Shean, Providence 86
42

THE BASEBALL RESEARCH JOURNAL
1919Merwyn Jacobson, BaIt.George Kelly, RochesterFritz Maisel, BaltimoreGeorge Whiteman, TorontoJoe Boley, BaltimoreHoward McLarry, Bing.Frank O'Rourke, Bing.John Honig, Baltimore.Ed Barney, BuffaloJack Bentley, BaltimoreEd Miller, NewarkFrank Wiglesworth, J. C.Ed Onslow, TorontoOtis Lawry, Balti~ore
1920130 Jack Bentley, Baltimore123 Frank Brower, Reading118 Bill Holden, Baltimore116 Jimmy Walsh, Akron108 Merwyn Jacobson, BaIt.104 Mike Konnick, Reading102 Fritz Maisel, Baltimore98 Benny Kau£t: Toronto94 Ji~ Thorpe, Akron94 Pete Shields, Akron88 Otis Lawry, Baltimore86 Frank O'Rourke, Toronto84 Joe Burns, Reading82 Henry Long, Rochester
Tom DeNoville, Jersey CityBill Zitman, Jersey City
1921161 Jack Bentley, Baltimore 152148 Fred Merkle, Rochester 143134 Fred Thomas, Reading 138133 Homer Summa, Rochester 134126 Jewel Ens, Syracuse 122124 Ed Goebel, Reading 119114 Bob Fothergill, Rochester 117III Jimmy Walsh, Newark 111
106 Merwyn Jacobson, BaIt. 106101 Fritz Maisel, Baltimore 10698 Norm McMillan, Rochester 10497 Joe Boley, Baltimore 10296 Ed Onslow, Toronto 10294 John Schulte, Syracuse 10193 Beauty McGowan, Newark 9692 Bob Witterstaetter, Syracuse 94
Frank Gilhooley, Buffalo 92Ed Barney, Buffalo 88Max Bishop, Baltimore 86
Hall ofFamers Dan Brouthers (left) and Nap Lajoie (right). 4fter their ML careers were over,each player led the International League in RBI, Brouthers in 1897, and Lajoie, as a player-manager,
in 1917. Brouthers reappeared briefly with the New York Giants in 1904, thus becoming thefirstfour-decade player in the major leagues.
43

THE BASEBALL RESEARCH JOURNAL
From 1884 through 1959, Baltimore (72) andBuffalo (70) have had the greatest number of playerswho have reached or surpassed 100 RBI in one season. Rochester has 48 (and still counting), Torontobowed out with 45, and Montreal had 38. Providencewas a leader in the early years. Since 1960 Rochesterhas had a mere six players who have reached the 100RBI total in one season. Richmond and Columbushave had five and Tidewater (Norfolk) four. In 1970Rochester's Roger Freed had 130 RBI-the top totalsince 1960. Recently, in the merger of the leftoverAmerican Association teams with the InternationalLeague, RBI totals have made a comeback. Prior to1960 only six players had won the InternationalLeague RBI title with less than 100 RBI, and on twoof these occasion~ (1890 and 1918), the season hadbeen shortened. In 1943 Baltimore's George Stallercould muster only 98 in that war-torn year, strugglingwith one of the deadest balls known to man.Subsequent to 1960 the RBI leader has had less than100 on twenty occasions.
Who knows what the future holds for minor leagtlebaseball? Over tIle willter IIlonths of 1997-1998, theAmerican Association passed out of existence. Itsmember cities were dispersed between theInternational League and the Pacific Coast League.Those ofus who love minor league baseball mourn thedeath of the Association. Both the Pacific CoastLeague and the International are cumber-
seem in regard to tradition-which been thebedrock of baseball's popularity for most of the preceding century. This account has introduced the fan toearly RBI tabulations in a vibrant minor league. It isalso an attempt to remind the public tha.t one ofbaseball's real strengths is its ability to harken back to abygone era.
44
NOTESIThe International League Year-by-Year Statistics,1884-1953, Marshall D. Wright, pg. 3.2Ibid, pg. 10.3Ibid, pg.13.4Ibid, pg. 14
BIBLIOGRAPHYReach, A.J., Company, Reach Official Baseball
Guide, Philadelphia, PA: 1884-1935.SpaldingAthletic Library, American Sports
Publishing Company. New York, NY: 1885-1938.Spink, Charles C. and Sons, Sporting News
Baseball Guide, St. Louis, MO: 1942-2001.Wright, Marshall D., The International League,
Year-by-Year Statistics, 1884-1953, Jefferson, NC:McFarland, 1998.

HAROLD V, HIGHAM
Identifying 19th-Century Player Dick Higham...Perhaps!
Because it seemed b.oth helpful and important toattempt to round out Richard "Dick" Higham'sstory (see TNP 2000 and TNP 2001) with pho-
tographs. I researched libraries, archives, newspapers,and magazines, etc. Identifying 19th-century baseballplayers in 19th-century photographs can be trying.Finding such pictures and attempting to determinewhether you have actually succeeded in identifyingthe players depicted in them can be both exasperatingand elating. However, the exercise below may, hopefully, offer some encouragement to those who wouldundertake a similar task.
Since I do not have a family photograph of DickIIigham for a direct comparison, it became necessaryto weigh the credibility of wllat was fOUlld. III addition, just viewing and compariIlg Olle picture toanother is not sufficient. For each photo, I had to consider the source, condition when found, available historical background, and possible comparisons of theteam and/or other individual players depicted, ofeach. When making comparison of Higham
techniques sugg to law enforcement agencies.1
While these re for the most part forensic considerations, it w s also most helpful to engage in discussions wit fellow researchers. I located photographs offour teajris on which he was a member, takell durillghis plaYing career, 1870 through 1880, at the time hewas a member ofeach. Two ofthem name him, one ofthem does not identify anyone depicted, and the lastone, I believe, misidentifies him as another player.The photographs are of the 1872 Lord Baltimores,2
the 1877 Syracuse Stars,3 the 1876 Hartford DarkBlues,4 and the 1870 New York Mutuals.5 It appearseach was taken inside a photographer's studio. Theresults can be described as being aIlywllere .frolll"murky" to "rather clear" to "I know it's him, for sure:'
HARRY HIGHAM is a Great Grandson ofDick Higham andhas been a SABR member since· 1997. He studies 19thcentury Base Ball and umpires vintage baseball games.
45
1872 LORD BALTIMORESThis is the earliest photograph which identifies a pictured player as Dick Higham. He would have been 21years of age when it was taken. SABR member JamesBready, who has published it more than once, has toldme that he acquired the photograph from theBaltimore Public Library, but when he did, someonehad already placed the names of the players on itsface.
In this photograph it appears the light source usedwas stationed on the extreme right. Drawing an imaginary vertical line down the middle ofthe photograph,note the dark shadows, in particular, on the right corner of the backllrop and 011 tIle faces of the five players on the right. Those on the left have softer shadowsand some have less defined features. The figures ofHigham and Hall have the least clarity, with flatterfaces and seell1illgly bulging eyes.
For the purpose of making comparisons with thefollowing photographs, assuming the figure identifiedis Dick Higham, our benchmark is a "narrow" face,
others' attributes, Tom York and Bobby Matthews canbe said to have "narrow" faces with "medium" lips but"out" ears. William Craver can be described as havinga "narrow" face, "medium" lips and "medium" ears.
Close-ups of the Higham face alld of the figurealone llave beell used by SABR to accompany two previOllSly publislled articles6 concerning Dick Higham.However, as I recollect the men on my father's side ofthe family all having black or dark hair, I would haveto question whether it is him. Of course, the photograph may have been taken by an inept photographerwith poor equipment and/or due to harsh handling ofthe photograph itself: over time, his hair may havebecome lightened. Finally, some one may have simplymade a mistake when affixing the players' names.
1876 HARTFORD DARK BLUESNo player in this photograph was identified anywhereon it. It was necessary to compare this photographwith a photograph of the 1875 Hartford Dark Blues,7

THE BASEBA RESEARCH RNA
1872 LORD BALTIMORESBack row: Lipman Pike,
Cherokee Fisher, Tom Carey.Middle row: George W. Hall,
John J. Radcliff, Dick Higham,Tom York, Bobby Mathews.
Front row: William H. Craver,Everett Mills
NATIONAL BASEBALL HALL OF FAME LIBRARY, COOPERSTOWN, NY.
1876 HARTFORD DARK BLUESBack row: Tommy Bond,
Candy Cummings. Middle row:Tom Carey, Everett Mills, Bob
Ferguson, Bill Harbridge,Tommy York. Front row: Dick
Higham, Jack Burdock, Jack'Remsen, Doug Allison
46

47
1877 SYRACUSE STARSBack row: M.R. Mansell, BillCarpenter, Pete Hotaling.Middle row: Henry McConnell,AI McKennon, Speed Clinton,Buzz7 Higham, Pep Hall. Frontrow: Will Geer, Jack Farrell
1870 NEW YORK MUTUALSBack row: Nelson, 3B; Martin,RF; Swandell, 2B; Eggler, CF.Front row: E. Mills, IB;Hatfield SS; C. Mills, C;Wolters, P; Patterson, LF.
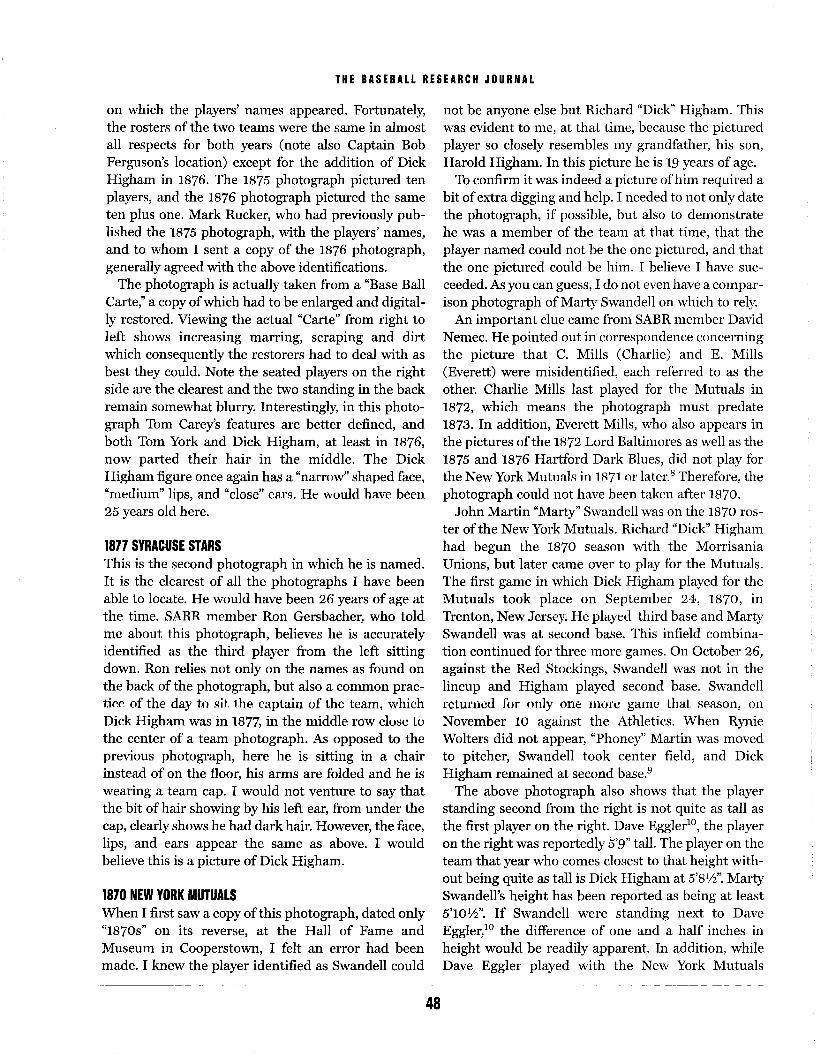
THE BASEBALL RESEARCH JOURNAL
on which the players' names appeared. Fortunately,the rosters of the two teams were the same in almostall respects for both years (note also Captain BobFerguson's location) except for the addition of DickHigham in 1876. The 1875 photograph pictured tenplayers, and the 1876 photograph pictured the sameten plus one. Mark Rucker, who had previously published the 1875 photograph, with the players' names,and to whom I sent a copy of the 1876 photograph,generally agreed with the above identifications.
The photograph is actually taken from a "Base BallCarte;' a copy ofwhich had to be enlarged and digitally restored. Viewing the actual "Carte" from right toleft shows increasing marring, scraping and dirtwhich consequently the restorers had to deal with asbest they could.· Note the seated players on the rightside are the clearest and the two standing in the backremain somewhat blurry. Interestingly, in this photograph Tom Carey's features· are better defined, andboth Tom York and Dick Higham, at least in 1876,now parted their hair in the middle. The DickHigham figure once again has a "narrow" shaped face,"llledium"lips, and "close" ears. He would have beell25 years old here.
1877 SYRACUSE STARSThis is the second photograph in which he is named.It is the clearest of all the photographs I have beenable to locate. He would have been 26 years of age atthe time. SABR m,ember Ron lie:rsoaCller,
identified as the third player from the left sittingdown. Ron relies not only on the names as found onthe back of the photograph, but also a common practice of the day to sit the captain of the team, whichDick Higham was in 1877, in the· middle row close tothe center of a team photograph. As opposed to theprevious photograph, here he is sitting in a chairinstead of on the floor, his arms are folded and he iswearing a team cap. I would not venture to say thatthe bit of hair showing by his left ear, from under thecap, clearly shows he had dark hair. However, the face,lips, and· ears appear the same as above. I wouldbelieve this is a picture of Dick Higham.
1870 NEW YORK MUTUALSWhen I first saw a copy ofthis photograph, dated only"1870s" on its reverse, at the Hall of Fame andMuseum in Cooperstown, I felt an error had beenmade. I knew the player identified as Swandell could
48
not be anyone else but Richard "Dick" Higham. Thiswas evident to 111e, at tllat time, because the picturedplayer so closely resembles my grandfather, his son,Harold Higham. In this picture he is 19 years of age.
To confirm it was indeed a picture ofhim required abit ofextra diggirlg and help. I needed to not only datethe photograph, if possible, but also to demonstratehe was a member of the team at that time, that theplayer named could not be the one pictured, and thatthe one pictured could be him. I believe I have succeeded. As you can guess, I do not even have a comparison photograph of Marty Swandell on which to rely.
An important clue came from SABR member DavidNemec. He pointed out in correspondence concerningthe picture that C. Mills (Charlie) and E. Mills(Everett) were misidentified, each referred to as theother. Charlie Mills last played for the Mutuals in1872, which means the photograph must predate1873. In addition, Everett Mills, who also appears inthe pictures ofthe 1872 Lord Baltimores as well as the1875 and 1876 Hartford Dark Blues, did not play forthe New York Mutuals in 1871 or later~8 Therefore, tIlephotograph could not have been takell after 1870.
John Martin "Marty" Swandell was on the 1870 roster of the New York Mutuals. Richard "Dick" Highamhad begun the 1870 season with the MorrisaniaUnions, but later came over to play for the Mutuals.The first game in which Dick Higham played for theMutuals took place on September 24, 1870, in
~Wan(lell was at second base. This infield combination continued for three more games. On October 26,against the Red Stockings, Swandell was not in thelineup and Higham played second base. SwandellrctUl'lled for only 011e 1110re gaille that sea-SOIl, OIl
November 10 against the Athletics. When RynieWolters did not appear, "Phoney" Martin was movedto pitcher, Swandell took center field, and DickHigham remained at second base.9
The above photograph also shows that the playerstanding second from the right is not quite as tall asthe first player on the right. Dave Eggler10
, the playeron the· right was reportedly 5'9" tall. The player on theteam that year who comes closest to that height without being quite as tall is Dick Higham at 5'8112". MartySwandell's height has been reported as being at least5'101;2". If Swandell were standing next to DaveEggler,IO the difference of one and a half inches inheight would be readily apparent. In addition, whileDave Eggler played with the New York Mutuals

THE BASEBALL RESEARCH JOURNAL
through 1873, Marty Swandell did not play for theNew York Mutuals after 1870.11 Therefore, it appearsthe picture was probably taken no earlier than July 31,1870 and no later than the end of that season. Duringthis time frame Dick Higham had joined the team andMarty Swandell never played for tllelll again.
Last, below is an exhibit of a photographic comparison of a close-up and enlargement of the face of theplayer standing second from the right in the Mutuals'photograph and that of my grandfather HaroldHigham, taken at about age 42. I suggest this comparison seals it.
DOUBLE PHOTOGRAPHWhen I brought the photograph of the Mutuals andone of my grandfather to a photographer's shop forthe comparison work to be performed, the technicianupon viewing the side-by-side comparison photograph as it came out of the machine remarked: "Thedifference between the two pictures is that in the firstone he's not smiling and in the second one he is." To~Thich I repliecl: "The real difference is the gentlemanon the right is the son of the gentleman on the left.~~
Hopefully, with this article and the two previouslypublished in The National Pastime taken as a whole,the reader has the fullest biography of Richard "Dick"Higham, one of major league baseball's earliest greatplayers and umpires, as can be presently assembled.
History, as it always does, discloses more and more
tion the available record as it is uncovered. So iswith our national pastime, its participants, observersand fans alike.
NOTESIMellonalcl, Hngh C., TheClassijicationojPolicePhotograph,s. l"os Angeles: De Voss & Co., 1941: 18, 23, 39,59. The primary classification is height, which in thisanalysis will play a part, but because of the poses insome of the photographs will not be totally helpful.The secondary classification of face, here narrowshape, medium lips, and close ears, described in themain piece, will be most helpful. As no side view ispresented, the profile and nose classifications are notavailable. Likewise for obvious reasons, color of eyescan not be utilized. Throughout, the reader shouldkeep in mind, "the final classification of the hair, thebuild, and the complexion or color . . . while important, will be considered as having less importance....The reason for this lesser degree of importance lies in
49

THE BASEBALL RESEARCH JOURNAL
the fact that these three characteristics are likely tochange radically over a comparatively short period oftime:'
2Bready, James H., Baseball in Baltimore. JohnsHopkins Univ. Press, 1998, Baltimore: 19. A drawingof the team members as it appeared in the New YorkClipper that year appears on page 16.
3This photograph is from the collection of theBaseball Hall of Fame and Museum at Cooperstown,New York.
4t'his photograph is from the Archives of theConnecticut State Library in Hartford, Connecticut,and Baseball Hall of Fame and Museum atCooperstown, New York.
5This photograph is from the Spalding Collection ofthe New York Public Library. A comparison of thisphotograph with the one which appears inAmerica'sNational Game, (Spalding, Albert G. Univ. ofNebraska Press, Lincoln, 1992), p. 164, show the latter to have been sharpened in player and uniformdefinition. This was a common practice for advertising and distribution purposes. The copy shown inthis piece would be the original as it was taken. Thereader will also note the lack ofthe appearance ofthelegs of the four players standing in the rear, which isdue to the fact that the team was posed behind afront drop through which they poked their heads and.hands and on which their uniforms as well as theirbats and hats were drawn. For similar example, see a
19th...Ce17i:1J,1Y MajorLeague Baseball, Nemec, David. New York, Donald I.Fine Books, 1997.
6Baseball's First Stars, Frederick Ivor-Campbell,Robert L. Tieman, Mark Rucker, eds.. Soeiety forArnerican Baseball Research, 1996, p. 77; and TheNational Pastime, Society for American BaseballResearch, 2000, p. 23.
7Rucker, Mark, Base Ball Cartes, TranscendentalGraphics 1988, p. 58.
8Total Baseball, Seventh Edition, John Thorn, PetePalmer, Michael Gershman, eds. New York: TotalSports Publishing, 2001. 1020.
9New York Tim,e.s, October 26, 1870. New YorkClipper, November 5, 1870. An item published in TheFireside Book of Baseball, Charles Einstein, ed.Simon and Schuster, New York, 1956, pp. 46-47 purports to be Henry Chadwick reporting on a gamebetween the Red Stockings and the Mutuals held onOctober 26, 1869, in which Higham replaced
50
Swandell. If this were true, it would appear theHighamjSwandel1 substitution took place twice intwo different years. The item is taken from ChadwickScrapbooks, Vol. 1-6, Spalding Collection, New YorkPublic Library. Reading that entry on microfilmreveals that it can not be identified by newspaper ordate of publication on its face. Rather, it appears theeditor of the scrapbooks, perhaps Henry Chadwickhimself: placed the notation "69" on the artifact inpen and ink, and it was taken as the year of publication. the New York Times does not report any baseball game in 1869 as having been played anytimefrom October 24 through the end of the month. Anactual reading of the 1870 New York Clipper edition,dated November 5, contains Chadwick's Wednesday,October 26,1870, report of the game.
lOFor comparison purposes, see a later picture ofDaveEggler, p. 168 ofAmerica's National Game.
11Total Baseball, p. 1,216.

SCOTT NELSON
Best of Times, Worst of TimesSuperlative &Dismal Ten-Year Team Performances
NOt many fans are still around who rememberwhen the Chicago Cubs compiled the best tenyear record in major league baseball history
over the past century. That's because it happened from1903 through 1912. The Windy City Cubs-yes, thoseCubs who haven't made it to the World Series since1945-won 980 games way back then in a ten-yearperiod. Five times in that stretch the Cubbies won 100games or more, and that was when teams played just154 contests a season. In fact, they had just a 138game schedule in 1903.
The highlight of the run, of course, came in 1906,when the Cubs won 116 games, the all-time MLBrecord tied in 2001 by the Seattle Mariners. It all happened not when the Cubs played 11oIl1e gaInes atWrigley Field, but WestSide Grounds, their diamonduntil 1916. That's when they moved to Cubs Park,which had its name changed to Wrigley Field in 1926.
The Cubs are among nine clubs-six in the NationalLeague and three in the American-that posted atleast one .600 record in a ten-year period since 1900.The 980-533 win-loss mark (an average of 98 wins a
The next best compilation was .642 by the NewYork Yankees of 1934-43. That was with two morewins but 14 more defeats than the Cubs. Only theCubs, Yankees, New York Gia.nts, ann PittsburghPirates have ever had 400 more wins than losses in aten-year stretch.
Thirty-five teams-19 in the AL and 16 in the NLplayed at least ten years in the majors in the past century and are listed here with their best and poorestten-year records through 2002.
To the City of Brotherly Love, Philadelphia, goes thedubious honor of having put up with the poorest ten-
seon NELSON, like the Minnesota Twins, survived thecontraction threat and continues to write. He recentlycompleted a sports history and record book for theMankato, MN high school, where he taught English andJournalismfor twenty-six years before retirement.
year records in both the American and Nationalleagues since 1900. They would be the AL Athletics of1915-24 (.354) and the NL Phillies of 1936-45 (.335),the only team to ever win or lose more than 1,000games-1,016 to be exact-in a ten-year period. Seventimes in the period the Phils lost 100 or more, including five years in a row.
Only five teams in history have failed to win at leasthalf their games in some ten-year period, and just oneis still around-the San Diego Padres. The old BostonBraves, St. Louis Browns, Washington Senators II,and Kansas City Athletics never had a ten-year stretchabove .500.
All but two clubs-yes, even the Yankees-have suffered through below-average stretches. Before theybegan what developed into a dynasty, those Yankeesplayedjust .450 ball, 52 games below .500, from 1908through 1917. But that was BR-Before Ruth.Milwaukee's Braves and the Los Angeles Dodgers arethe only clubs without a losing ten-year record ever.
The Braves spent thirteen summers on LakeMichigan (1953-65), always had at least six more wins
ten consecutive years. In contrast, and at about thesame time, were the Kansas City Athletics-formerlyof Philadelphia and in Oakland since 1968-who inthirteen years (1955-67) were always at least six winsshort of a .500 finish,
While many ofthe ''bests'' and "worsts" were recorded early on, the Atlanta Braves, Houston Astros,Seattle Mariners, and Texas Rangers each posted theirbest decade in history most recently.
Though the Yankees had their best ten-year recordfrom 1934 to 1943, it was from 1935 through 1944that they dominated their league like no other team inhistory, finishing 141 games ahead ofthe second-placeDetroit Tigers and 416 in front of the last-placePhiladelphia Athletics in the American League.
The biggest winning margin in the National Leagueover a ten-year stretch came in 1912-21 when the NewYork Giants "edged" the Chicago Cubs by 113.5 games.But earlier (1903-12) the Cubs finished 449.5 games
51
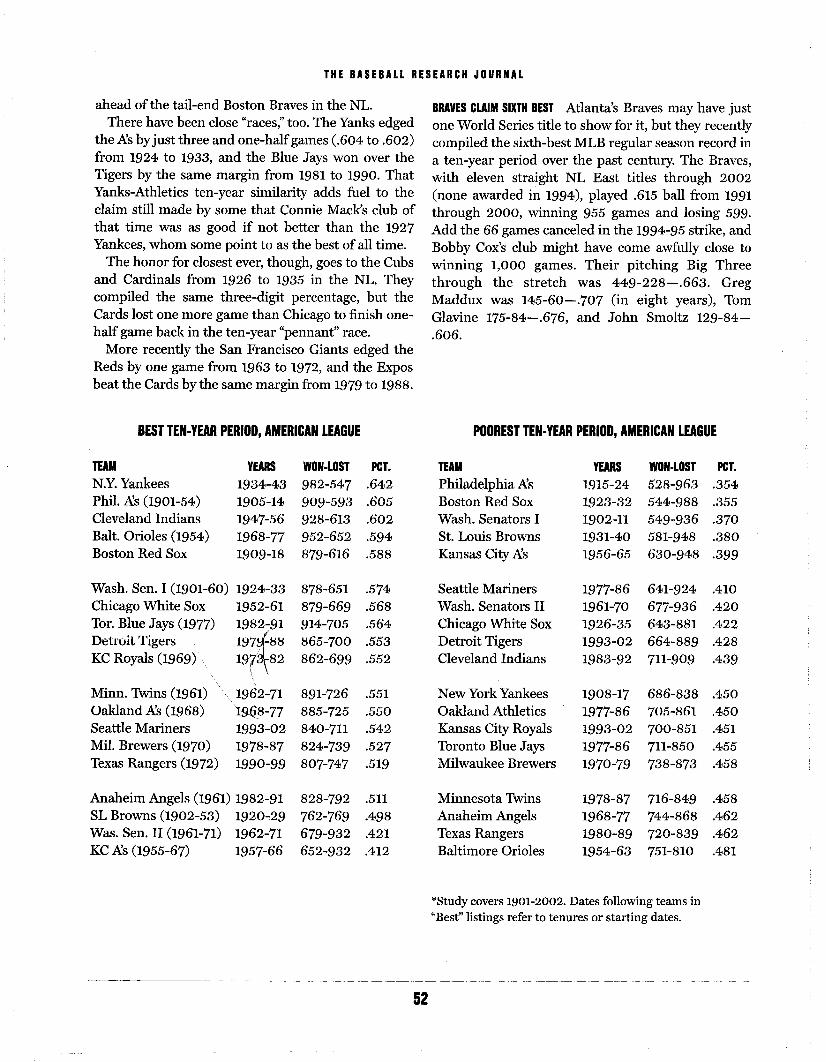
THE BASEBALL RESEARCH JOURNAL
ahead of the tail-end Boston Braves in the NL.There have been close "races;' too. The Yanks edged
the Xs byjust three and one-halfgames (.604 to .602)from 1924 to 1933, and the Blue Jays won over theTigers by the same margin from 1981 to 1990. ThatYanks-Athletics ten-year similarity adds fuel to theclaim still made by some that Connie Mack's club ofthat time was as good if not better than the 1927Yankees, whom some point to as the best of all time.
The honor for closest ever, though, goes to the Cubsand Cardinals from 1926 to 1935 in the NL. Theycompiled the same three-digit percentage, but theCards lost one more game than Chicago to finish onehalf game back in the ten-year "pennant" race.
More recently the San Francisco Giants edged theReds by one game from 1963 to 1972, and the Exposbeat the Cards by the same margin from 1979 to 1988.
BRAVES CLAIM SIXTH BEST Atlanta's Braves may have justone World Series title to show for it, but tlley recentlycompiled the sixth-best MLB regular season record ina ten-year period over the past century. The Braves,with eleven straight NL East titles through 2002(none awarded in 1994), played .615 ball from 1991through 2000, winning 955 games and losing 599.Add the 66 games canceled in the 1994-95 strike, andBobby Cox's club might have come awfully close towinning 1,000 games. Their pitching Big Threethrough the stretch was 449-228-.663. GregMaddux was 145-60-.707 (in eight years), TomGlavine 175-84-.676, and John Smoltz 129-84.606.
BEST TEN-YEAR PERIOD, AMERICAN LEAGUE POOREST TEN-YEAR PERIOD, AMERICAN LEAGUE
TEAM YEARS WON-LOST PCT.Philadelphia Xs 1915-24 528-96.3 .354Boston R.ed Sox 1923-32 544-988 .355Wash. Senators I 1902-11 549-936 .370St. Louis Browns 1931-40 581-948 .380Kansas City Xs 1956-65 630-948 .399
Seattle Mariners 1977-86 641-924 .410Wash. Senators II 1961-70 677-936 .420
Detroit Tigers 1993-02 664-889 .428Cleveland Indians 1983-92 711-909 .439
New York Yankees 1908-17 686-838 .450Oaklalld Athletics 1977-86 7()5-861 .450Kansas City Royals 1993-02 700-851 .451Toronto Blue Jays 1977-86 711-850 .455Milwaukee Brewers 1970-79 738-873 .458
Minnesota Twins 1978-87 716-849 .458Anaheim Angels 1968-77 744-868 .462Texas Rangers 1980-89 720-839 .462Baltimore Orioles 1954-63 751-810 .481
YEARS WON-LOST PCT.1934-43 982-.547 .6421905-14 909-593 .6051947-56 928-613 .6021968-77 952-652 .5941909-18 879-616 .588
891-726 .551885-725 .550
1993-02 840-711 .5421978-87 824-739 .5271990-99 807-747 .519
TEAMN.Y. YankeesPhil. };s (1901-54)Clevelalld IrldiansBaIt. Orioles (1954)Boston Red Sox
Wash. Sen. I (1901-60) 1924-33 878-651 .574Chicago White Sox 1952-61 879-669 .568
Minn. '!Wins (1961)Oakland N.s (1968)Seattle MarinersMil. Brewers (1970)Texas Rangers (1972)
Anaheim Angels (1961) 1982-91 828-792 .511SL Browns (1902-53) 1920~29 762-769 .498Was. Sen. II (1961-71) 1962-71 679-932 .421KC Xs (1955-67) 1957-66 652-932 .412
*Study covers 1901-2002. Dates following teams in"Best" listings refer to tenures or starting dates.
52

THE BASEBALL RESEARCH JOURNAL
BEST TEN-YEAR PERIOD, NATIONAL LEAGUE POOREST TEN-YEAR PERIOD, NATIONAL LEAGUE
TEAM YEARS WON-LOST PCT. TEAM YEARS WON-LOST PCT.Chicago Cubs 1903-12 980-533 .648 Philadelphia Phillies 1936-45 511-1,016 .335N.Y. Giants (1901-57) 1904-13 973-555 .637 Boston Braves 1903-12 528-980 .350Pittsburgh Pirates 1901-10 945-545 .634 St. Louis Cardinals 1902-11 577-913 .387St. Louis Cardinals 1940-49 960-580 .623 Brooklyn Dodgers 1904-13 594-924 .391Atlanta Braves (1966) 1991-00 955-599 .615 Pittsburgh Pirates 1946-55 605-934 .393
Bkln. Dodgers COl-57) 1946-55 948-595 .614 San Diego Padres 1969-78 651-959 .404Cincinnati Reds 1972-81 927-629 .596 New York Mets 1962-71 660-957 .408Mil. Braves (1953-65) 1953-62 888-662 .573 Cincinnati Reds 1928-37 629-903 .411L.A. Dodgers (1958) 1972-81 889-672 .570 Chicago Cubs 1953-62 652-895 .421S.F. Giants (1958) 1962-71 914-708 .564 Montreal Expos 1969-78 705-907 .437
Philadelphia Phill~es 1975-84 872-693 .557 Houston Astros 1962-71 713-905 .441New York Mets (1962) 1982-91 876-741 .542 Atlanta Braves 1981-90 696-862 .447Houston Astros (1962) 1993-02 841-714 .541 San Francisco Giants 1976-85 734-834 .468Montreal Expos (1969) 1979-88 825-736 .529 New York Giants 1940-49 724-808 .473S.D. Pa~res (1969) 1982-91 807-812 .498 Los Angeles Dodgers 1981-90 819-746 .523Boston Braves COl-52) 1943-52 756-778 .493 Milwatlkee Braves 1956-65 880-694 .559
SOURCESBig League Baseball Electronic Encyclopedia,
Franklin Electronic Publishers.All-Time Baseball Sourcebook. Stats Inc.
Sporting News Complete Baseball Record Book.
It's aDirty Job, but••• From The Sporting News ofJanuary 14, 1893: "The plan ofhaving the duties ofmanager and captain separated and performed by two men, has so manifestly many advantages over theother one, that it is in vogue in a majority of professional clubs. In the National League and AmericanAssociation, for example, only five clubs employed player....managers, namely, Chicago, Baltimore,Cincinnati, Brooklyn, and Cleveland, and in the cases of several of these clubs some official of the clubaccompanies the team on its trip away from home to look after the finances. A captain's efficiency is seriously impaired ifhe is obliged to keep one eye on his men and the other eye on the ticket office, and at thesame time play his own position satisfactorily. The policy of having one man especially engaged to lookafter the business affairs ofthe team leaves the captain free to devote all his attention and energies to handling the men on the field, appears to be the wisest; at least it is so regarded by base ball professionals."
- ROBERT H. SCHAEFER
53

JOE DITTMAR
Baseball's Most Unbreakable RecordsPolled from SABR's Records Committee
More than any other sport, baseball as we knowit today is infatuated with numbers. Everymovement, whether from defensive positions,
the pitcher's mound, or the batter's box, is examined,analyzed, and quantified. As a result, we are treated to"quality starts;' ''holds;' and batting averages with twostrike counts or on .artificial turf in night games.Statistics not even dreamed of 50 years ago may nowbe woven into player contracts or even influence managerial decisions. 'Computers allow us to analyze notonly current performances by way of intricate mathematical formulas, but also to resurrect and comparethose of more than a century earlier. Spawned by thisfascination with records, thos~ hest-worst, longestshortest, most-least measurements now engorge amultitude of books and test the wits of ardent fans.
The national pastime is unique in that its dailymeanderings have been recorded with surprising consistency since 1871, when the first professional leaguewas born. The 19th century brought formation andself-realization for the professionals, and as such pre-
rampant rule changes make comparison with20th century performances a conundrum. Can wefairly compare strikeouts by pitchers throwing underhanded or from a distance of 50 feet with those oftoday's IlUl'lel's? During 1880, Pl'ovidellce's GeurgeBradley issued only six free passes in 196 inningspitched. At the time, however, eight balls wererequired for a walk.
Performance expectation was also shockingly different in baseball's adolescence. Substitutions were rare,pitchers were expected to complete games regardlessofthe number of innings, and players often competeddespite injuries. Such was the case in 1877, when
JOE DInIAR, a SABR member since 1988, has authorednumerous books and articles but most enjoys sharinghis love ofbaseball history through presentations atthe'Baseball Hall ofFame, SABR gatherings, schools,libraries, and ,retirement homes.
54
Louisville's Jim Devlin pitched every inning (559) ofevery one of his team's games.
In addition, equipment and playing arenas makecomparison difficult. Is it reasonable to compare thespongy, blackened baseballs being hit to bare-handedfielders with the projectiles currently being served tothe plate? Ballparks with distant outfield limits wereonce commonplace, as were fans lining playingperimeters. And what may now be bemoaned as faninterference was often accepted as simply anotherdimension of the early game.
These variables should be considered while makingany pronouncement of the most or least of any aspectof tIle gaille. Nevertheless, it is cxa,ctly because oftllese significallt differellces tllat we marvel at statistics of bygolle eras. .A11dwlleIl many of those recordsetting statistics are taken out ofcontext and placed intoday's atmosphere, they do indeed appear unfathomable and unbreakable.
For all of the reasons mentioned above, most of therecords considered in this treatment were of a 20th-
staffs were hurling overhand and from a distance of60'6". A few exceptions were tolerated, such as the factthat the venerable Cy Young won 72 ofhis games andtossed more than a thousand innings at a distance lesstha,n the Ctlrrent one.. But for the most part, bellcllmarks established prior to 1893 are beyond the scopeof this analysis.
Just what records, then, are unbreakable? The listsaccumulated from members of the SABR RecordsCommittee range from the familiar to the esoteric,from Joe DiMaggio's 56-game hitting streak to ConnieMack's seven consecutive eighth-place finishes. Mostremarkable was the 'sheer number of records considered by lllelll1)ers to be uIlbreakable. Initial pollingrevealed several dozen marks, but as more lists rolledin, new depths in obscurity were probed, resulting inmore than a hundred benchmarks that may be considered safe from the ravages offuture challenges. Forthe sake of space, and sanity of the tabulator, anattempt was made to limit the listing to generally

THE BASEBALL RESEARCH JOURNAL
CHANGES IN SCORING/PLAYING RULES Rule changes madethroughout the century provide safe harbor for manypreviously established "records." For example, pinchhitters can no longer be credited with two pinch hitsin the same inning as they once were. There are manyofthese instances in the books, but a rule instituted inthe 1950s precluded a player from pinch-hitting forhimself ifhe stepped to the plate a second time in thesame inning. A second at-bat by the same pinch hitternow is considered as that player batting for himself,not for another player.
Another rule change, one of defensive indifference,will likely keep safe the mark shared by the Senatorsof 1915 and the Phillies of 1919. Each club stole eightbases in one inning, the Nationals doing it in the firstinning against sore-armed Cleveland catcher SteveO'Neill, and the Phillies notching eight in the ninthinning of a lost game. The rule was changed in 1920.
CHANGES IN LEAGUE STRUCTURE/RULES Early in the 20th century most clubs employed very few players. The entireroster of the 1904 Boston American League club contailled the nalnes ofonly 18 players, five oftIlel11 pitcllers. The five mOlIndsmen remain the minimum mark.
TIGHTENED CROWD CONTROL On July 12, 1931, the Cubsinvaded St. Louis, and Cardinal fans turned out inrecord numbers. So many attended, in fact, that theyspilled from the stands onto the field, reducing the
BALLPARK CONFIGURATIONS When the Pittsburgh Piratesset their 20th-century team record of 129 triples in1912, they played halftheir games in cavernous ForbesField. There the distant outfield limits measured LF
RF and were well suited for Clr4~1111Le:
onseason was Owen "Chief" Wilson with 36. His singleseason record, however, may more suitably belong inthe category of '~ignmentof the Stars;' since his secOl'ld best campaign nettcdjust.14 three-baggers.
FieldillF; records, too, were influenced by ballparkdimensions. Chuck Klein's 44 outfield assists in 1930were not only the result of his fine arm but also thetowering wall in right field just 280' from home plate.Even right-center was a scant 300' from the batters,affording ample opportunities for playing caroms andnipping frisky baserunners.
Finally, the advent of lights in stadiums locked forever the ma.rk of 10 tied games by the Detroit Tigersin 1904.
• Performance expectations• Scoring/playing rules• League structure/rules• Ballpark configurations• Tightened crowd control• Equipment• Game strategy• Outside influences• Outright superb performance• Alignment of the stars
accepted and understood categories.Following are lists of standards that members con
sidered unbreakable, divided into ten very generalcategories. While most records result from a combination of circumstances, these were the major factors:
DIFFERENT PERFORMANCE EXPECTATIONS This was the largestcategory of untouchable records submitted by committee members. Most were established in an era sodifferent from today, they strain the limits of credulity. We can only shake our heads and marvel at thelitany of Illlillbers left by Cy YOllng-gallles started,games won and lost, complete games, innings pitched,and batters faced. Less well known but equally staggering are the marks ofJack Taylor, who labored 1,727consecutive innings, including 187 complete games,without being relieved; of Joe McGinnity, who tossedfive complete doubleheaders in his career; or ofpitch-
Cadore and Joe who each went thea
clubs, 1901 NL and 1904 AL, went the entire seasonwhile employing just five moundsmen. Today'shurlers, asked to throw hard for as long as they can,and who anticipate reliefwhen their fastballs lose fiveIl1iles per hour off the radar gun, simply are notexpected to approach the stamina limits oftheir predecessors. The availability of relievers and concern forinjury, as well as career length, earning potential, andlong-term contracts all limit the efforts of the modern-day hurler.
While most benchmarks relative to performance'expectations concern pitching accomplishments, notall of them are positive. During the first severaldecades of the century, even when pitchers wereunderperforming, they were expected to remain in thefray and "take their medicine:' Thu:s Dolly Gray borethe ignominy.of issuing a record seven' consecutivewalks, and Eddie Rommel was once shelled for 29 hitsin a single game.
55

THE BASEBALL RESEARCH JOURNAL
Heinie Meine, a.k.a. ~~The Count ofLuxemburg,"absorbed 10 consecutive hits.
playing dimensions to schoolboy proportions. Policewere woeullly Otltlllatclled as fans collected souvenirson routine fly balls hit to the outfield. This necessitated a hastily made rule ofthe day considering as a double any ball hit into the crowd. Although a doubleheader \\Tas played, the second game alone produced23 doubles, another n1ark tllat likely will stand thetest of time.
CHANGES IN EQUIPMENT No doubt the size and shape ofmodern baseball gloves has altered fielding averages.But perhaps the most pronounced impact on recordshas been dealt by the constitution of the ball. Thedead ball era was so called because of the softness ofthe ball, which in turn influenced strategy. Runs werescored one at a time, and horne runs were uncommon.The dead ball put the advantage into the hands of themen who stood on the mound. Sacrifices also heldgreat importance, ERAs collapsed, and shutouts weremore common than in today's game. During this eraGrover Alexander garnered 16 shutouts in a single
56
Johnny Burnett had an opportunityfor his 10thhit ofthe game butflied out in the 17th inning.
sea,~on, and Ray Chaplllall collected 67 sacrifices, bQtll,marks tllat still sl.alHl.
CHANGES IN GAME STRATEGY Changes in the liveliness ofthe ball also fostered corresponding alterations instrat~gy. John Mc.Graw's gritty management style inthe dead ball era fostered an abundance of stolenbases. The Giants of 1911 still retain the modern single-season team stolen-base record of 347, the sameyear the Yankees stole 15 in one game. Ten years later,with the advent of the live ball and the spectacularimpact of the home run, the Giants, still underMcGraw, stole only 137 bases. Strategy was moreblunt that year as Ruth amassed an astonishing 457total bases, still the all-time benchmark.
Today's infatuation with power hitters and the homerun has encouraged more players to swing for thefences. Recently we've seen one of the game's mostglamorous records, Roger Maris's 61 home runs,buried beneath a barrage of long ball clouting. Butthis environment has also enabled quality pitchers to

THE BAS EBALL RESE ARC H J0URN AL
On his record-setting day, Dolly Graytossed a one-hitter but lost 6-4.
ta:keadvantageofthe·free swinging,andthuswemar....vel at the inconceivable 5,714 lifetime strikeouts byNolan Ryan. This unbreakable record appeared onmost lists submitted by Record Committee members.
OUTSIDE INFLUENCES TIle strellgth of the !11ayers unionwill undoubtedly keep safe many records of the past.Coupled with owner's financial considerations, it isdoubtful we will ever again witness the 44 doubleheaders played by the White Sox in 1943; the nineconsecutive doubleheaders played by the BostonBraves in 1928; or the tripleheader (three completegames) played in one day on three occasions.
Before radio and television imposed their demandson game times, play was generally more brisk.Astonishing in today's context is the safe record ofthenine-inning game played in only 51 minutes betweenthe Phillies and Giants in 1919.
57
Eddie Rommel relieved in the second inning andbecame the winning pitcher in the 17th.
OOTRIGHY·SUPERBPERFORMANCESbe attributed to a single reason, but some are theresult of a singular performance by an exceptionalplayer. Although a little luck can't be ruled out, andthe lack of dominant relievers helped, Joe DiMaggio's56-game hitting streal{. made the "tlnbreal{.able" list ofmost Records Committee members. In the same category would be Ruth's lifetime slugging average. Theseaccomplishments are so far beyond the runner-up asto render them in the unbreakable category.
Also included in superb performances would be the.440 batting average by Hugh Duffy, Hornsby's .402five-consecutive-year average, or the consecutive nohitters by Johnny Vander Meer. Today's pitchers rarelytoss three consecutive complete games, let alone threeconsecutive no-hitters needed to shatter this mark.
Lesser-known marks such as Joe Sewell's 115 consecutive games without striking out or his mere fourstrikeouts in 155 games in 1929 should also weatherthe test.oftime.
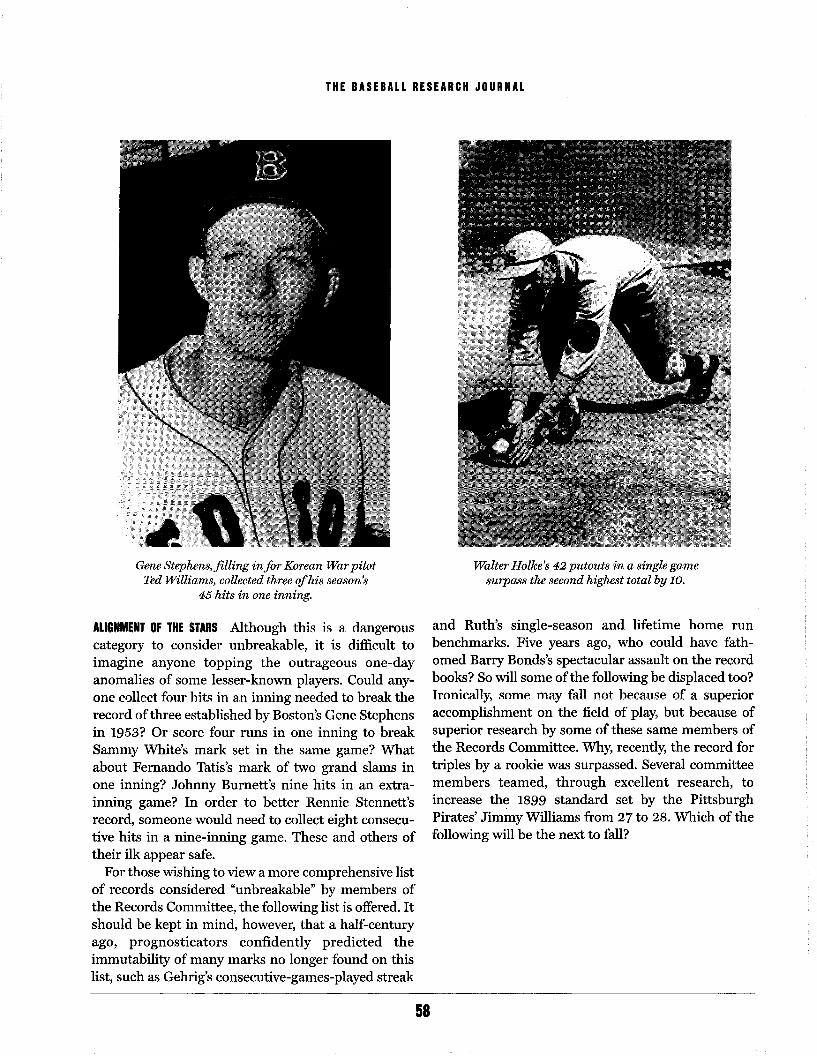
THE BASEBALL RESEARCH JOURNAL
Gene Stephens,filling infor Korean War pilotTed Williams, collected three ofhis season's
45 hits in one inning.
"'III"'IIIHIIII1I OF THE STARS a r1~'I1.O'Q'I"'n.. ,,,,,
category to consider unbreakable, it is difficult toimagine anyone topping the outrageous one-dayanomalies of some lesser-known players. Could anyone collect four hits in an inning needed to break therecord ofthree established by Boston's G'cnc Stcphcllsin 1953? Or score four runs in one inning to breakSammy White's mark set in the same game? Whatabout Fernando Tatis's mark of two grand slams inone inning? Johnny Burnett's nine hits in an extrainning game? In order to better Rennie Stennett'srecord, someone would need to collect eight consecutive hits in a nine-inning game. These and others oftheir ilk appear safe.
For those wishing to view a more comprehensive listof records considered "unbreakable" by members ofthe Records Committee, the following list is offered. Itshould be kept in mind, however, that a half-centuryago, prognosticators confidently predicted theimmutability of many marks no longer found on thislist, such as Gehrig's consecutive-garnes-played streak
Walter Holke's 42 putouts in a single gamesurpass the second highest total by 10.
benchmarks. Five years ago, who could have fathomed Barry Bonds's spectacular assault on the recordbooks? So will some ofthe following be displaced too?Ironically, some may fall not because of a s1.1perioraccomplishment on the field of play, but because ofsuperior research by some of these same members ofthe Records Committee. Why, recently, the record fortriples by a rookie was surpassed. Several committeemembers teamed, through excellent research, toincrease th~ 1899 standard set by the PittsburghPirates' Jimmy Williams from 27 to 28. Which of thefollowing will be the next to fall?
58

BASEBALL RECORDS LEAST LIKELY TO BE BROKEN
.301 Lowest batting average for league leader (C.Yastrzemski 1968).
.343 Highest team batting average single season(Philadelphia 1894).
.366 Highest career batting average (T. Cobb).
.402 Highest batting average during a five-seasonperiod (R. Hornsby 1921-25).
.408 Highest single-season average for non-leader(J. Jackson 1911).
.440 Highest single-season batting average (H.Duffy 1894).
.690 Highest career slugging average (B. Ruth).
1 Most doubleheader shutouts CR. Reulbacll1908); Fewest hits by both clubs in nine-.inning game (Dodgers-Cubs 1965); Fewestleft on base by both Clllbs in nine-inninggame (Dodgers-Cubs 1965); Fewest walks byboth clubs in doubleheader (several); Fewesthits by one team in an extra-inning game
2 Most pinch hits in one inning by one player(many); Most consecutive no-hitters (J.Vander Meer 1938); Most teams played forin a sirlgle day (M. Flack & C.· I-I~~thcoate1922; J. Youngblood 1982); Most grandslams in one inning (F. Tatis 1999); Fewesthits by one club in a doubleheader(Cleveland 1992).
3 Most games played in one day (3 occasions);Most hits in one inning (G. Stephens 1953);Most rUIlS scored in one inning (S. White1953); Most times faced pitcher as batsmanin one inning (many); Fewest hits allowed inthree consecutive complete games (J. VanderMeer 1938).
59
4 Most saves in one World Series (J.Wetteland 1996); Fewest strikeouts in a season while appearing in 150 games (J. Sewell1925 & 1929).
5 Most complete doubleheaders pitched (J.McGinnity); Fewest pitchers used in a season (1904 Bos AL. 1901 Bos NL).
6 Most HRs allowed while emerging victorious (L. Benton 1930 & H. Thurston 1932).
7 Most consecutive walks allowed (D. Gray1909); Most no-hitters, career (N. Ryan).
8 Most stolen bases by one club in one inning(Was 1915. Phi NL 1919); Most walksallowed by one pitcher in an inning (D. Gray1909); Most bases on balls received in adoubleheader (M. Bishop 1930 &1934).
9 Most consecutive years pitched 300 or moreinnings (W. Johnson); Most consecutivedoubleheaders in a season (Bos NL 1928);Most consecutive years leading in battingaverage (T. Cobb); Most hits in an extra-
batted in accounting for all team's runs· (M.Greenwell 1996); Most consecutive hits bypinch-hitter (D. Philley 1958); Most HRs hitby a pitcher, single season (W. Ferrell 1931);Most triples by one club in a game(Baltimore 1894).
10 Most consecutive hits allowed in a game (B.Reidy 1901 & H. Meine 1930).
11 Most walks to one club in one inning(Yankees 1949).
12 Most years leadillg ill battillg average (T.Cobb); Most years leading league in HRs (B.Ruth).
15 Most years played all club's games (C.Ripken).

THE BASEBALL RESEARCH JOURNAL
Most 1-0 games won lifetime (W. Johnson);Most HRs hit by a pitcher, lifetime (W.Ferrell).
Most consecutive complete games pitched ina season (J. W. Taylor 1904).
Most pitching victories in a single season (J.Chesbro 1904).
Most putouts in one game by one player (W.Holke 1920).
Most doubleheaders in season (ChiSox1943); Most assists by an outfielder in a single season (C. Klein).
Most complete games in a season (J.Chesbro 1904).
Most steals ofhome, career (T. Cobb); Most11it bypitcll ill a siIIgle seaSOII (R. HUlrt1971).
Most hits by both clubs in a nine-inninggaille (Pllils-Cubs 1922).
Most consecutive games batted safely (J.DiMaggio 1941).
Fewest pitches to complete a nine-inninggame (R. Barrett).
26 Most innings pitched in a game (L. Cadore& J. Oeschger 1920).
27 Most years pitched (N. Ryan).
29 Most hits allowed in extra-inning game (E.Rommel 1932).
30 Most walks by both clubs nine-inning game(Tigers-Xs 1916).
32 Most doubles in doubleheader by both clubs(Cards-Cubs 1931).
36 Most triples, single season (0. Wilson 1912);Most hits allowed in nine-inning game (J.Wadsworth 1894).
60
67 Most sacrifices in a single season (R.Ch,apman 1917).
110 Most career shutouts (W. Johnson).
115 Most consecutive games without striking out(J. Sewell 1929).
124 Most career wins in relief (H. Wilhelm).
191 Most RBI in a single season (H. Wilson).
196 Most runs scored in single season (B.Hamilton 1894).
206 Most hit batsmen in a career (W. Johnson).

THE BASEBALL RESEARCH JOURNAL
208 Most innings pitched in relief in one season(M. Marshall 1974).
312 Most triples in a career (S. Crawford).
313 Most games lost in career (C. Youngincludes 1890-92).
350 Most grounded into double plays in career(C. Ripken).
818 Most starts in career (C. Young).
1,001 Most consecutive innings pitched withoutallowing a HR (E. Killian 1903-07).
1,727 Most consecutive innings pitched withoutrelief (J.W. Taylor, 1901-06).
2,297 Most RBI in a career (H. Aaron).
2,632 Most consecutive games played (C. Ripken).425 Most team errors in single season (Detroit
1901). 2,795 Most walks allowed in career (N. Ryan).
450 Most assists by an outfielder, career (T. 3,215 Most singles in a career (P. Rose).Speaker).
3,347 Most consecutive at-bats without hitting a457 Most total bases in a single season (B. Ruth). HR (T.Thevenow 1926-38).
464 Most innings pitched on one season (E. 4,256 Most hits in career (P. Rose).Walsh 1908).
511 Most games won in career (C. Youngincludes 1890-92).
511 Most sacrifices in a career (E. Collins).
751 Most complete games in a career (C.Young-includes 1890-92).
792 Most doubles in a career (T. Speaker).
802 Most games pitched for one club in career(W. Johnson).
61
5,714 Most strikeouts in a career eN. Ryan).
6,856 Most total bases in career (H. Aaron).
7,377 Most innings pitched in a career (C. Youngincludes 1890-92).
14,053 Most at-bats, lifetime (P. Rose).
15,890 Most plate appearances, lifetime (P. Rose).

STEPHEN BOREN
Bill Doak's Three "No-Hitters"
There have been only a handful of major leaguepitchers who threw three no-hitters: LarryCorcoran, Cy Young, Bob Feller, Sandy Koufax,
and Nolan Ryan. Similarly, only Johnny Vander Meer,Allie Reynolds, Virgil Trucks, Jim Maloney, and NolanRyan threw two nine-inning no-hitters in a single Season. Bill Doak almost joined these two elite circles.Unfortunately, his fielding stupidity cost him threeno-hitters and caused him to become a forgotten player. Ironically, he revolutionized baseball fielding withhis development of the modern fielding glove.
William Leopold Doak was born January 28,1891,in Pittsburgh, Pennsylvania. He was one of the lastlegal spitball·throwers. His professional career beganwith Wlleelingof tIle Central League (Class B) in1910, where he led the league in losses and runs andremained with them in 1911. In 1912 he pitched withAkron of the Central League, Columbus of theAmerican Association and then broke in with theCincinnati Redlegs on September 1, 1912, as a 21-yearold. pitcher. Unfortunately, after pitching just two
1913 and returned to the majors with the St. LouisCardinals. In 1914 he was a 20-game winner,1 led theNational League in ERA, and pitched seven shutouts.He won 20 games again in 1920. In 1921 he led theleague in ERA 3,nd won-loss percentage. His overallrecord was a respectable 170-157 with a 2.98 ERA.Considering he was pitching for bad to mediocreCardinal teams, this record is quite remarkable. Ofnote, he pitched 32 shutouts for the Cardinals from1913 through 1923. Dizzy Dean pitched but 26, andonly 23 were with the Cardinals.
Bill's first "no-hitter" occurred August 10, 1920,against the Philadelphia Phillies in Baker Bowl. The
STEPHEN D. BOREN MD, MBA is a long-time contributor toSABR publications and is a practicingphysician. He isthe only person ever to be published in the Wall StreetJournal, The New England Journal of Medicine, andBaseball Digest in a single year.
62
Phillies were far removed from their 1915 pennant,and would finish in the cellar again that season.
Winning 3-0 going into the bottom of the seventh,Doak walked Bevo LeBourveau. Catcher VerneClemons threw out Johnny Rawlings, as the runneradvanced to second. Then Cy Williams hit a grounderbetween Rogers Hornsby at second base and JackFournier at first base. Fournier dove for the ball butmissed it. Fortunately, Hornsby was able to field it.Unfortunately, Doak had remained on the pitcher'smound and failed to cover the bag. Thus, Hornsbyhad no one to throw to at first base. Williams got acheap hit, and LeBourveau advanced to third, wherehe subsequelltly scored Oil Irisll Meusel's sacrifice fly.There were to be no more hits off Doak. His failure tocover first base cost him the no-hitter, as well asanother shutout.
Bill was a slow learner. On May 11, 1922, atSportsman's Park, Bill Doak faced Shufflin' PhilDouglas and the New York Giants. The Giants wouldgo on to win the pennant by seven games and have a
batter was Dave Bancroft, who would bat .321 thatyear. He bunted down the first-base line. Neither JackFournier nor Bill Doak was there to field the ball.Thus, Ba.n~roft had a leadoff single, which WOllld bethe only hit for the Giants. Thanks to a pair of runs inthe eighth inning, the Cardinals won 2-0. Douglaswould go 11-4 with a 2.63 ERA that year, but was permanently banned from baseball that August afteroffering to throw games.
Apparently, Bill Doak had not learned his lessonfrom two years before. Had he fielded the bunt, hewould have had a no-hitter. Instead, he had his secondone-hitter.
On July 13, 1922, at Sportsman's Park, Doak had athird chance for a no-hitter. He was facing thePhiladelphia Phillies again. Although they would finish seventh for a change, they had a team batting average of .282 that year, and led the majors with 116home runs. John Singleton pitched a great game forthe Phillies. He walked two men and gave up only six

THE BASEBALL RESEARCH JOURNAL
hits. The two pitchers matched shutout ball for 4 112innings. Tllell ill tIle bottom of the fifth, a double byJack Fournier, a wild pitch, and a bloop single gavethe Cardinals a run.
Bill Doak carried the 1-0 lead into the seventh without giving up a hit. Then Curt Walker, a .337 hitterthat year, led offwith a routine grounder between firstand second base. Doak apparently thought thatRogers Hornsby at second would field it. However,Jack Fournier, the first baseman, grabbed it.Unfortunately, .Bill Doak again was standing on themound, watching the play. Like Hornsby in 1920,Fournier had no one to throw the ball to. That wouldbe the only hit for the Phillies.
Singleton ended up losing the game 1-0. He wouldgo 1-10 with a 5.90 ERA that year, which was his onlymajor league season. His one victory was a shutout.
Thus, for the third time in three years, Bill Doak losta no-hitter because he failed to field his position.Twice were because he failed to cover first base ongrounders to infielders. The third time he lost the nohitter because he failed to field a btlnt.
Doak never threw another one-llitter agaiIl. OnJune 13, 1924, he was traded to the Brooklyn Dodgersfor pitcher Leo Dickerman (19-24, 3.95 ERA overthree seasons2
) and was 11-5 for the Dodgers that year.He retired to Florida to enter the real estate businessfor two years..He spurned a lucrative offer to return tobaseball ($15,000) and stayed out of the majors until
lIe was released. He wellt 1-2 t'or the 1929 Cardinals.Doak's role in the development ofthe modern base
ball glove has been long neglected by baseball historians. In 1919 he visited the Rawlings Sporting GoodsCompany ill St. Louis and explained his idea for anovel type of baseball glove. In 1920 Rawlings produced the first "Bill Doak model" glove. This had amulti-thong web laced between the first finger andthumb, which created for the first time a nautralpocket. No longer was a glove a mere protective devicefor a player, but now was a true fielding aid. The glovewas so popular that Rawlings produced it until 1953.
Despite the use of his special glove, Doak was not agood fielder. The highest he ranked in NationalLeague pitchers' f,ielding perc~ntage was J4th, andaveraged about 31st. His lifetime fielding average wasa mediocre .960.
63
NOTESIThe Baseball Encyclopedia lists Doak as winning 20in 1914; Total Baseball and The Sports Encyclopedia:Baseball by Neft & Cohen list him with 19 wins.
2Total Baseball lists Dickerman at 19-27, 4.00 ERA.
Bill Doak ranks second to Bob Gibson on theCardinals' all-time list ofshutouts pitched.

VICTOR DEBS, JR.
The King Is Dead
''It is no bad thing to be a king."-Homer
On a cool October afternoon in Boston in 1914,the Red Sox hosted the Yankees at three-yearold Fenway Park. On the mound for the Sox was
rookie left hander George Herman Ruth, alreadyreferred to as "Babe" by teammates and press. Ruthwas pitching in his third major league game, havingsplit his first two decisions. Enjoying a 9-2 lead, batterBabe began the· home seventh with a double, thenscored following a sacrifice bunt and sac fly. Ruthhurled a complete-game, six-hit victory against thetearn with which he would gain renown the followingdecade.
For· botl1 clubs tIle ballgaIIle was unimportant, asMack's Xs had already won the 1914 flag. Modern historians find significance in it, though. Ruth's tally washis first of a still-standing American League record2,174 runs scored; the double his first major leaguehit. How appropriate that baseball's "Sultan of Swat"
superb, Cole's career sank as suddenly as the Titanic.He won only three in 1912, was a minor leaguer in1913, and a second-stringer with the Yankees when heopposed Ruth in the final week of the 1914 season.Cole's nickname seemed a misnomer by the spring of1915 as he prepared to fight for a starting position. Bythe end of the year, Cole was fighting for his life.
Barnstorming Vlith the Boston Bloomer Girls wasn'tan exhilarating experience for a young male ballplayer of the early 20th century, especially if it includedwearing a lady's Vlig and trousers, but it was a way ofearning money while playing ball. Having femaleteammates wasn't particularly distressing either.Smo]'Y Joe Wood and Rogers Hornsby endtlred thecarnival-like atmosphere and hilarity from spectatorsand used the Bloomer Girls as a stepping-stone to themajors. So, too, would Cole.
Leonard Leslie Cole was born on April 15, 1886, toparents Keury and Cora· in the small rural town ofToledo, located in central Iowa approximately 60miles northeast of Des Moines. After establishing a
the equally worthy sobriquet "King:'Leonard Cole had earned the regal title four years
earlier when he won 20 with the Cubs; it is a feat only18 other rookies achieved in the 20th century. Cole'sleague-best .833 winning percentage in 1910 ranksfourth among all NL hurlers with 20 or more Vlins,and is the best by any rookie. His 1.80 ERA makeshim one of nine NL rookies to finish the season Vlithan ERA under 2.00. He is one of only 50 NL pitchersto toss a shutout in his first major league start and oneof 14 senior-circuit hurlers. He is the only rookie tohurl an abbreviated no-hitter. King Cole competed inthe 1910 World Series, and the slender six-footerpitcl1ed well ill Cllicago's sole victory against the .N.s.
Following a sophomore season only slightly less
VICTOR DEBS, JR. is the author ofStill Standing After AllThese Years, Missed It By That Much, and other baseball books. He lives on Staten Island.
64
Toledo to join the Bloomers in 1907. In 1908 he playedfor semi-pro clubs in Ottumwa, Iowa and Tecumseh,Michigan. FolloViing an exhibition game against BayCity in 1909, the six-foot two-inch 180-pound firebaIler was signed by the manager of the local Class Dteam in the Southern Michigan League. He became astandout starter, finishing the season Vlith a 21-7record. Cole complemented his artistry on the moundVlith part-time work as a tonsorial artist, and proficiency in both professions soon earned him the nickname "Bay City Barber:'
While pitching in a late-season game in 1909, Colewas spotted by Chicago Cub scout George Huff. Huffhad played an important role in building the powerfulChicago team, one that won three straight pennantsand two world championships from 1906 to 1908.Huff recommended Cole to player-manager FrankChance, who signed Cole. He then tested him onOctober 6 with a starting assignment in the opener ofa season-ending twin bill against the Cardinals. Any

THE BASEBALL RESEARCH JOURNAL
misgIVIngs Chance might have harbored wereassuaged when the 23-year-old righthander hurled asix-hit shutout, becoming only the ninth NL pitcher inthe century to grab a whitewash in his major leaguedebut. The King fanned one and walked three anddisplayed a good sinker as infielders Johnny Evers andJoe Tinker combined for nine assists and one doubleplay. Cole was equally impressive with the lumber,stroking three hits, including a triple, in four at-bats.
Assured of a 'major league contract for 1910, Colemarried a resident of Bay City with the surnameSeder, and continued barbering during the winterwhile keeping in shape by running and exercising inpreparation for the upcoming season.
Fred Clarke's Pirates, led by Honus Wagner'sleague-leading .324 average and 100 RBIs, hadsnapped the Cubs' string of consecutive pennants in1909, prompting Chance to shore up his pitching staffby acquiring veterans Harry McIntire and Lew Richie.Otherwise, the club was about the same as it had beenfor the past four seasons, with the exception of Cole.
The Cubs were confident of regaining the pennantin 1910, an optimism not unfounded. By midseason,they held a seven-game lead over the Giants andPirates, with Cole the leading pitcher on the staffKing had won his first seven decisions, not taking hisfirst loss until June 15 in a Brooklyn marathon thatfeatured Dodger starter Cy Berger's matching Colepitch for pitch through 13 innings. After retiring the
two in the tenth, Cole faced a second-and-third situation with one out. Right-handed batter Bob Coulsondribbled a comebacker to Cole, who, after a momentaryjuggle, threw to the plate. Brooklyn manager BillDahlen was certain the game was over but umpire BillKlem called the runner out, prompting Dahlen'scharge to the plate and subsequent banishment to theclubhouse. Following his expulsion, a shower of projectiles emanated from the stands, mostly in the formof soda bottles; none found their intended target andballpark police quickly restored order. Given areprieve, Cole appeared to have escaped the jam whenHumpy McElveen, a .225 hitter, rolled a grass cutterto short, but Tinker dumped Humpy's ball at the feetof first baseman Chance, whose fumble led to thegame-winning tally.
Pitching at the Polo Grounds in his next start onSeptember 23, Cole hurled a shaky but scoreless firstframe, then was given a 2-0 lead in the second courtesy of Tinker's poke into the stands. The Giantssquared the game in the home half, then knocked Colefrom the box with a pair in the third. The Cubs ralliedto tie, taking the King off the hook, but lost when FredSnodgrass tagged a McIntyre fastball over the head of
.center fielder Hofman for an inside-the-park homer.The Cubs' 1910 lead remained seven following their
loss to the Giants on September 23. By October 1,Chicago could clinch the pennant with a victory. inCincinnati. With Cole on the mound, the Cubs
run at secol1d and dlill@d a. galnl~ ...~n{ling F,ingl~ .. Tnwhat was reported as unprecedented at WashingtonPark, fans rushed on the field and carried hero Bergerto the clubhouse.
The ..')])(Jl"till,g· Ne1.~NJcommente{l,"Cole of the Ctlbs iscertainly some pitcher. He is easily the sensation ofthe kid crop of the National League:' The rookie continued impressing. At the end of July, Chicago facedthe Cardinals in a doubleheader in St. Louis. Cole 'wasworking on a no-hit shutout in the nightcap whenUmpire Hank O'Day called play after seven inningsdue to darkness. The no-hitter was the only onethrown in the senior circuit in 1910.
Already referred to as "King" and "Hi;' Cole wentundefeated in August, won his first decision ofSeptember, and survived a sloppy outing againstCincinnati, in which he walked five, and anotheragainst Pittsburgh when he yielded a dozen hits andfour passes. His winning streak was snapped atBrooklyn's Washington Park on September 17. Tied at
R~dR got on~ llar;k in th@ llottonl of the innil1gJ butChicago tallied twice in the fifth and Cole coasted to a9-6 victory. Despite winning the battle for the flag, theCubs lost the war for the World Series. In the fifthinning, basenlnner Evers collided with Cirl(~Y l~ateher·
Tommy Clarke at home .and broke his ankle. TheCubs' spirited second baseman watched the Seriesfrom the stands. His replacement, HeinieZimmerman, would lead the league in batting twoyears later, but was still a green 23-year-old parttimer in 1910, and his play in the Series was mediocre..The Xs trounced the lackluster Cubs four games toone, outscoring the losers by a count of35~15.
For Chicago, old sol shined in the Series solely whenKing Cole took the mound in game four. Having wonhis final start ofthe season on October 9-a·completegame 4-3 decision in which he walked ten Cardinalbatters,hit a batter, and tossed a wild pitch-Cole'sarm was fully rested by the 22nd. Cole surrendered arun in the third, two in the fourth, but was otherwise
65

THE BASEBALL RESEARCH JOURNAL
effective in his eight innings' work. The Cubs trailed3-2 and were two outs from elimination when Challcedrove a triple over the head ofXs center fielder AmosStrunk, chasing home Frank "Wildfire" Schulte.Chance was stranded at third, but the Cubs won it forreliever Three Finger Brown in the tenth on a doubleand two-out single.
It had been a splendid season for Cole. The rookiewon 20·of24 decisions. Cole led all regular starters inwinning percentage (.833), ERA (1.80), opponents'batting average (.211), and average hits allowed(6.53/nine innings). He pitched four shutouts, a nohitter, and allowed five hits or less in 12 of his 29starts. Despite his club's loss in the Series, Colereturned triumphantly to his Bay City home, where acar manufacturer presented the local hero with anautomobile. The Wolverine workhorse had explodedout of the gate in 1910, and much was expected fromhim in 1911.
Cole did not disappoint, and was only slightly lesseffective in his second season. He accumulated 18 victories against seven defeats, with his .720 winningpercentage third best in the league. His ERA rose to3.13, his opponents' batting average to .236, but mostN.L. pitchers suffered as well as the league ERAjumped from 3.02 in 1910 to 3.39 in 1911, the leaguebatting average from .256 to .260. His combinedrecord for 1910-1911 of 38-11 gave him a winning percentage of .776, second only to Doc Crandall's .780 for
was superior to snell renowned willilersChristy Mathewson and Rube Marquard. TheSporting News labeled Cole "the pitching find of theNational L~ague:'
lIe was also SOllle'wllal of an uddball, tltlickly gail1ing a reputation as a jokester. Colells humorous per7sonality made him a natural on the vaudeville stage,and perhaps a longer life would have afforded Cole asmuch renown as ballplayer-comics Nick Altrock andGermany Schaefer. Cole's free-spirited manner would.arouse criticism by managers and sportswriters, whopointed to the King's predilection for trainingimproperly and breaking rules. In addition, Cole hadthe unusual and unfortunate habit of sleepwalking.Teammates would tease him after each somnambulistic episode, not all ofwhich were harmless. Duringthespring of1914, a nightly promenade on a Pullman leftCole with a severe cut on his .right .leg that requiredseveral stitches.
Whether due to a flippant attitude toward training~
66
off-the-field distractions, the beginnings ofa fatal disease, or silllply all overworked arm, Cole's careerbegan its nosedive in 1912. In the first two months heappeared in eight games for the Cubs and won once.His ERA of 10.89 contrasted sharply with his combined 2.45 for his first two seasons. In 19 inningspitched, Cole surrendered 36 hits and eight walks.Batters were feasting off his fastball at a .409 clip.Though he maintained his popularity with fans, teammates began resenting his antics and work ethic.Rumors ofdissension arose. By mid-May, Chance suggested to owner Charles Murphy that Cole be traded.
Murphy found a sucker in Pittsburgh's scrupulousowner Barney Dreyfuss. Cole was shipped to thePirates along with outfielder Solly Hofman for twoveterans: former 20-game winner Lefty Leifield andlongtime Buc Tommy Leach. Dreyfuss had beenimpressed with Hofman's versatility as a semi-proplayer in Belleville, Michigan, in 1903. He signed theinfielder to a Pirate contract but later released him.He was now happy to have Hofman back. As for Cole,Murphy a..c;sured Dreyfuss that his arm was sOllnd andthat a change of scenery was all the pitcher needed.
Ruing the swap a few months later, Dreyfussaccused Murphy of deceiving him regarding Cole'sarm. Revenge was realized a year later. Mllrphy's callous treatment of such popular players as Chance andEvers (Chance was fired as manager in 1912, andreplacement Evers was gone the next season), Tinker
the btlS11es), furtller alarll1ed fellow OW'llers alreadyfidgety over the threat of the newly establishedFederal League's pirating of disgruntled major leaguers. Regarding Murphy as somewhat of a renegadeal1yway, fellow NL magnates welcomed PresidentJohn Tener~s decision in the winter of 1913 to forceMurphy to sell his club.
Fred Clarke had patrolled the outfield for Dreyfussteams for 18 seasons, first as a member of theLouisville Colonels, then as a Buccaneer. As playermanager for Pittsburgh from 1900 to 1911, "Cap"Clarke guided the club to four pennants including aworld championship in 1909. His team finished thirdthe next two years and was already badly trailing thedefending champion Giants by June of 1912. Clarkeexpressed optimism that the trade for Cole would helpnarrow the gap.
But Cole continued struggling in Pittsburgh and byJuly was demoted to the role of mop-up reliever. Onthe 2nd, he entered a game with his former club com-

THE BASEBALL RESEARCH JOURNAL
fortably ahead and allowed seven hits, two walks, andfive runs in as many innings. Six days later, he pitchedthe final frame in a Philly rout of the Pirates. By thenCole had thrown in 13 games, allowing a generous 76hits and 19 walks. Not what was expected of a king.
Cole's scoreless inning against Philadelphia earnedhim a start the following week. He pitched effectivelyagainst the Dodgers and held a 4-2 lead after eightframes. But Cole allowed two runs to score in theninth and was removed for a pinch-hitter in the bottom· of the inning, as the Pirates won in the tenth.
If the outing encouraged Cole, his optimism wasshort-lived. In his next appearance on July 25, Kingrelieved in the ninth and surrendered three hits andthe go-ahead run to the Dodgers. He was not involvedin the decision, as the Pirates tied the game in the bottom of the inning and won in the tenth. Clarkeshowed reluctance in using Cole thereafter, and inearly August instructed his floundering fireI1J.an toremain in Pittsburgh while the team headed east onan extended road trip. Cole left town instead, andwhen Clarke was informed by scouts that Hi was having a lligll old tinle, the Pirate skilJlJer suspellded IlisAWOL hurler for an "indefinite" period. Cole reacteddefiantly, heading home to Bay City while declaring hewas through with major league baseball.
A week later, both Cole and Clarke relented. Kingjoined the team in New York, and on August 22 madehis first appearance in four weeks, pitching a perfect
in relief the Giants. The next hescore Olle
yielded a run on a walk, single, and double beforepitching a perfect ninth. On the 27th, Cole startedagainst the Braves in Pittsburgh and was rocked forfour runs and five hits in a third of an inning. IfClarke's decision to bring back Cole had been for thepurpose of shopping him around, his pitcher's flopsweren't helping. After Cole's early exit against theBraves, Clarke came to another decision. Cole sat onthe bench through September as the Bucs finishedstrongly, taking twelve straight and second place.
With no big league clubs interested in Cole, the~Jrates sold him to Columbus of the minor leagueAmerican Association. It was a fortuitous banishmentfor the King. After spending part of .the winter inChicago and opening a barber shop in the CornExchange Bank Building adjacent the Cubs' executivesuite, the rested righty reported to Columbus and hadthe best season of any pitcher in the AA that year. Heaccumulated a 23-11 record for his sixth-place club,
67
and proved his arm sound by leading the league ininnings pitched. Cole became one ofthe few hllrlers topitch a no-hitter in both the majors and minors whenhe defeated the league-leading Brewers 3-1 inMilwaukee, the unearned run a result of a walk, error,and sacrifice fly. By season's end, every major leagueclub was bidding for Cole's services, one offer being ashigh as $10,000.
One of the interested teams was the New YorkHighlanders, or Yankees as they were alternatelyreferred to, now managed by former Cub skipperChance. The Peerless One had accepted a mammothoffer of $40,000 in 1913 from owner Frank Farrell,who was desperately trying to boost the image of hisbottom-berth ball club in a town where that perennial pennant winner of the rival league, the Giants,shared the same Polo Grounds. During the 1913 season, Chance heard about Cole's resurgence and sent ascout for a look-see. Receiving a favorable report,Chance pressed Farrell to acquire his former ace.Farrell outbid other team offers and acquired Colefrom Columbus in September. With a week remainingill tIle big league season, Cole was instructed to jointhe club the following spring.
It was now a question ofwhether Cole would report.Rumors circulated that King still resented Chance'strading him to the Pirates in 1912, and he was quotedas saying he would never again play for his formerskipper. Cole later denied making the statement andmaintained he was committed to for the
was, ansoon change his mind.
Prior to the start of the 1914 season, the upstartFederal League was making moves to become a serious challenge to the majors by pirating former majorleague stars. Among the club owners luukiIlg to pilferwas Chicago Whales president Charles Weeghman.The restaurant entrepreneur especially savored theprospect oflanding an established and popular Cub asplayer-manager. With that in mind, he approachedcastoff Joe Tinker. Tinker had resented Evers'appointment as manager of the Cubs in 1913 anddemanded a trade. He got it, but liked even less playing in Cincinnati. When he was shipped to Brooklynat season's end, the idea of moving from one loser toanother did not appeal to Tinker either. What didappeal was Weeghman's suggestion that Chicago washis kind of town, especially when it included theopportunity to pique former employer Murphy andformer teammate Chance. Tinker jumped at the offer.

THE BASEBALL RESEARCH JOURNAL
Upon hearing the news of the Yankees' most recent,high-priced pitching purchase, Tinker visited Cole inDecember and presented him with a three-year contract to play for the Whales at a salary greater thanthat being offered by the Yankees. Cole thought aboutit, then signed. Immediately, Tinker made public theacquisition.
It was now the Yankees' turn. An infuriated Farrellasked for help from his close friend Art Irwin. Irwinand Farrell had been the shortstop-second basecombo on the Providence Grays of the NationalLeague and played in what is regarded by some as thefirst World Series, with Providence defeating theAmerican Association's New York Mets three gamesto nothing in 1884. Today, Irwin is credited with havingbeen the first to use a fielder's mitt and to participate in the first squeeze play. He was somewhat inventive off the field as well. After his presumed suicide in1921 (he boarded a steamer but was not among thepassengers that got off), it was discovered that goodold Arthur had been a bigamist.
Farrell sellt llis 56-year-u1<.l crulty to Chicago to talksome sense into Cole. Irwin appealed to Cole's sellse offair play. How cOllld he do this to his former manager? Hadn't he already agreed to report to the Yankeecamp in the spring? Then there was the tentativenature of the Federal League. It could never seriouslycompete with the majors. When the Feds folded, Colewould be out of a job. There was security playing at
met success. Cole returned toNew York and pledged his allegiance by signing aYankee contract. There followed bickering fromTinker and Weeghman, who insisted their contractwith the Michigan rigllt llal1der was IJinding.. Theissue lleverwelll to court. When the 'Tanks' springtraining camp opened in Savannah in early March,Cole and Chance were reunited.
Encouraging reports came from the South regarding Cole's comeback bid. A Sporting News article stated, "Chance seems very well impressed with the exChicago star, and rumor has it that he is so good hemay pitch the opening game ofthe season for the NewYorkers:' Cole did show flashes ofhis old form in 1914,but he proved unreliable both as starter and reliever.By the time Farrell.fired Chance in September in favorof Roger Peckinpaugh, Cole was a .500 pitcher withlittle speed on his fastball and erratic control. Hismain success had come against the· White Sox, butChicago broke the hex in their last confrontation on
68
September 18 by exploding for seven runs in the fifth.After surrenderillg Rutll'S first-ever double alld rUIl
scored on October 2, Cole's record for the year stood at11-9 with an ERA of 3.30. One local writer commented, "We trust that Bay City has not a surplus ofbarbersat tllis tillIe, for Cole is apt to Ilear the call of his oldtrade any day now:'
Still, Cole's season had not been a complete flop.After all, he finished two games above the break-evenpoint on a team with a 70-84 record. He was among agroup of American League All-Stars who played aseries of barnstorming exhibitions after the season,and it was reported that Cole "did fine work:' Thehurler had every reason to be optimistic, especiallyafter the announcement in January that he would beamong the group of pitchers invited to Savannah for1915 spring training. First, he would have to report toYank scout Joe Kelley for winter work in Hot Springs,Arkansas.
Before the winter ended, Farrell sold the Yanks tobeer baron Jacob Ruppert and army engineer T. L."Cap" Huston for $460,()()f) .. The new owners immediately pushed for changes. They pressed ConnieMack for the purchase of slugging star Home RunBaker, a deal not realized until the end of the season.They consulted with AL president Ban Johnson overthe site of a new park, and during the season inspected a particularly desirable location in the Bronx,although the need to build Yankee Stadium would not
Huppert and Huston liked Peckinpaugh, who at 23was the youngest manager in history, but preferredmore experience at the helm. Immediately followingthe acquisition, they relieved Peck of managerialduties whjle retaining him at SI101'tStOp. TIley 11iredformer NL hurler Wild Bill Donovan, who gladlyrelinquished his managing position with the minorleague Providence club, where he had instructedsouthpaw Babe Ruth on the finer points of pitchingbefore the youngster was recalled by the Red Sox inSeptember of 1914. Donovan brought with him fromProvidence trainer Jimmy Duggan.
By the first of March, most of the Yankee playershad assembled at Penn Station in New Yorl\. to accompany Donovan on the trip south. Cole and his fellowHot Springs hurlers joined the team in Savannah thefollowing week, and Duggan assessed his king asbeing 'Just as fit as possible at this stage of the training season." Yet while the team was playing its firstintra-squad game, Cole complained of having a sore

THE BASEBALL RESEARCH JOURNAL
arm and feeling fatigued and did not take the field. Heseemed fine the next day and nlade llis illitial appearance of the spring, allowing only one hit and no runsin three innings in the "Regulars'" defeat of the"Yannigans" in another intra-squad contest. Two dayslater, Cole gave up one run and five hits in five frames.
Cole's work impressed Donovan sufficiently toinclude him with five other pitchers on a first teamthat would travel to Daytona for a series withBrooklyn and likely continue north afterward. Twodays prior to departing for Florida, Cole pitchedagainst a local club from Savannah, allowing two hitsand no runs in a rain-soaked three innings.
Cole had been scheduled to start the first game ofthe Brooklyn series but instead watched from thebench as the two teams played to a 6-6 tie. He took themound the next day and was in control throughout hissix-inning stint, surrendering one run, five hits, andone walk. On April 2, he blanked the Cubs on one hitthrough four innings, while fanning four. The NewYork Times wrote the next day, "Donovan was muchelated over King (~ole's great pitching.. Cole is the bestconditioned of the New Yorl{ pitchers, and has toyedwith his opponents all Spring:'
The Yanks continued their march north with a stopin Richmond on April 7. They defeated the local competition by a score of 8-3, with Cole hurling the finalfour frames.
For the first time all spring, Cole did not look sharp
bush leaguers. The team arrived in Brooklyn on the9th to play a two-game set against the Dodgers, butCole sat out both games and began complaining aboutpains in his groin. He was taken to a New York hospital, and an examination revealed a tUll10r. The surgeons gave a grim prognosis following its removalThe 30-year-old's ball-playing days were over, theysaid, and his life expectancy measured in months.
Cole remained in the hospital for two weeks following the operation, then returned home to Bay City torecuperate. If the medical experts were counting himout, Cole wasn't listening. He worked hard to get backin shape, then surprised Donovan and his Yank teammates by showing up in Chicago at the end ofMay anddeclaring he'd be ready to contribute in a few weeks.On July 9 Cole rejoined the team, reporting himselffitto resume his starting role.
The right hander's opportunity came in the secondgame of a Sunday doubleheader in Detroit on July 13.It was a disaster. The Bengals clawed King for two
69
runs in the first, another three in the second, and thereelil1g righty was finished after an inning and twothirds, replaced by 24-year-old Bob Shawkey, whotamed the Tigers the rest of the way while the Yankscame back to win. Cole relieved the next day and intwo innings yielded three hits, two walks, and a hitbatsman, although sloppy fielding led to two of thethree runs.
The two shaky outings thwarted Cole's comeback.Donovan's Yanks had been surprising baseball followers by playing competitive ball. The rookie managerwas as sentimental as the next fellow and had beenpulling for the cancer-stricken ballplayer to comethrough, but the team came first. For the next fewweeks Donovan resisted any temptation to use Cole.
Another obstacle would delay Cole's return toaction. On July 24, the Yanks were scheduled to playthe White Sox at Comiskey Park in Chicago. At about7:40 that morning the steamer Eastland, docked at apier located on the Chicago River between LaSalleand Clark streets in the center of town, was preparingto take passengers on a 35-mile excursiorl across Lak~Michigan to Michigan·City, Indiana. Chicago Heraldreporter Harlan Babcock had planned on boardingthe Eastland but decided to take the next steamship,feeling Commander Henry Pederson was "takingawful chances in so overcrowding the boat:' A wisedecision. The ship began to list, then capsized. Manyamong the 2,500 passengers plunged into the harbor,
overturned vessel before falling in. Desperate rescueattempts were made. Life preservers were thrownfrom the dock and from a nearby steamer, whose crewmanned lifeboats and pulled frantic swimmersaboard. Their efforts kepllo a lllillilllUlll tIle l1ul11berof fatalities, at first reported to be 1,800; today, theestimate is 800.
Perhaps it is because the catastrophe took placewithin the confines ofa harbor where assistance couldimmediately be given, not in the dark dreary isolationof the Atlantic, or because most aboard were middleincome passengers rather than society's elite, orbecause the ship held no title of"unsinkable;' that theEastland disaster has not retained the same notorietyas has the· Titanic tragedy. Nor is it considered as historically significant as the sinking of the Lusitania,which less than three months earlier had been aninnocent wartime target of a torpedo. The Eastlandincident was nonetheless a calamity of immense proportions made more horrific by its occurring in broad

THE BASEBALL RESEARCH JOURNAL
daylight in front of hundreds of spectators.In April 1912, news in New York ofthe Titanic sinl{
ing had been so depressing that attendance for theGiants' home opener at the Polo Grounds was held to13,000. The Eastland tragedy was sufficiently shocking for normally frugal Chicago owner CharlesComiskey to immediately postpone the White SoxYankee game of the 24th and the doubleheader thenext day. Donovan may not have used Cole anyway,but the lost games prevented the possibility.
Cole's next chance came a week later as the Yankshosted the White Sox at the Polo Grounds. Pitchingeight innings, he yielded two runs, five hits, andwhiffed six batters before leaving for a piJ:~ch-hitter.
Trailing 2-0, the Yanks won with three in the ninth.On August 10, Cole started the second of a twin billand held a 2-1 edge over the Indians. He faltered inthe final frame as the Tribe tallied twice on a walk,~acrifice, double, and error, giving the King a complete-game, three-hit loss.
Three days later, Cole pitched what might have beenthe best game of his career. His opponent wasPhiladelpllin, nnd despite HOllIe Itun Bakel-'S abse11ce(lle was sitting out the season due to a contract dispute with Connie Mack), the Xs lineup remained formidable and included newly acquired Nap Lajoie.Nevertheless, Cole limited the opposition to two runsin nine innings and continued pitching as the gameremained tied at two in the twelfth. After holding theNs in the Cole was aidedman WOIl a RBIsingle. Cole's game stats read: 12 innings, two runs,.eight hits, five strikeouts, and two walks. A New YorkTimes arti~le noted Cole's brilliant effort. "It wouldn'tdo to forget Killg Cole. He pitched a heady game, andwas not in the least flustered because two Quaker rUllScame in the second inning, helped by a wild throw:'
The effort culminated a solid stretch where Colehad won one, lost one, with a no-decision in threeconsecutive starts, and had yielded seven runs, 16 hits,eight walks, and 14 strikeouts in 29 innings. It now
. appeared Donovan had another reliable starter. Colewas embraced by teammates, who were inspired byhis courage. The press, critical of his lifestyle in· pastyears, praised his newfound dedication. Wrote TheSporting News' Joe Vila in the August 19 issue, "SinceChance got him from Columbus a year ago last winter,the King has lived cleanly and also has been in high
. favor With the Yankee owners. Persons who circulateduntruthful stories about this goodhearted fellow did
him a rank injustice. and I take this means to set himright in the eyes of the public. Cole has COllle backwith a vengeance. He was passed up as a permanentinvalid and everybody felt sorry. But Cole refused toallow the doctors to count him out:'
The Cole comeback continued ill llis llext start inChicago on August 19. As investigations continuedinto the cause of the Eastland fiasco, fans filledComiskey Park and watched the King reign throughseven innings. Cole fanned five and limited the PaleHose to two singles while retaining a 2-1 lead goinginto the eighth, at which time he self-destructed.Three walks, three hits, and two runs later,. he wasrelieved by Shawkey, who yielded a bases-loaded single to Eddie Collins, bringing·home another pair. Aninning earlier, Cole appeared to be adding anothernotch to his comeback belt. But managers back thenweren't interested in seven-inning starters. WhatDonovan saw was a 5-2 flop for Cole, with game statsthat included five runs, six walks, and a wild pitch.
Still, King was given his regular turn on August 28in Detroit. The Tiger assault was thorough and quick.III tIle firsl illlliIlg, a single, 1Y Cobb hit, and SamCrawford RBI single brought home a run, and another came on a sure-triple-turned-sac-fly thanks to a circus catch by Skeeter Shelton, who was playing in oneof ten major league games in a fleeting career. In thesecond, Cole's first out came sandwiched betweenthree singles and a run. Cobb's hit tallied another, but
to runner Cobb at the plate. Though trailing4-0, Cole was within an out ofbeing out ofthe inning.Alas, George Burns burned Cole with a ribby single,sending the righty to the showers. Th~ game markedhis filIal appearallce as a slar"ler""
Two days later~ Cole pitched well in allowing onerun and four hits in six innings of relief. What did notsit well with Cole was Donovan's deciSIon to removehim from the rotation. When he failed to show up foran exhibition game in Providence,· the rebel Yankdrew a suspension. Yet lle was still aillollg the pitcherson the roster in the second week ofSeptember, and hissuspension was lifted by the 16th when he made hisnext reliefappearance. In a 2-2 tie with Chicago at thePolo Grounds, Cole pitched a perfect ninth, thenwatched the Yanks pin a loss on shine-ball artist EddieCicotte.
On September 20 at the Polo Grounds, Cole madehis tenth appearance of 1915. It would be the last ofhis career. Entering the eighth with the game tied at
70

THE BASEBALL RESEARCH JOURNAL
71
ACKNOWLEDGMENTSSpecial thanks to researchers at the National
Baseball Library for providing news clippings fromvarious newspapers and periodicals along with a copyof Cole's death certificate. Additional research wasgathered through use of the SABR Lending Library,which provided microfilm of The Sporting News andBaseball Magazine-1909 to 1916.
BIBLIOGRAPHYCreamer, Robert W. Babe-The Legend Comes to Life,reprint. New York: Simon & Schuster, 1992.Dewey, Donald, and Nicholas Acocella. TheBiographical History ofBaseball. New York: Carroll &
Grat: 1995.New York Times, 1909 to 1916, numerous articles.Reichler, Joseph L. The Great All-Time BaseballRecord Book, rev. and updated by Ken Samelson. NewYork: Macmillan, 1993.BaseballEncyclopedia, 9th edt New York: Macmillan,1993.Thorn, John, and Pete Palmer, eds. Total Baseball.New York: HarperCollins, 1993.
two, Cole held the White Sox to no runs and one hit intwo innings, and collected his 56th career win whenNew York scored a run in the ninth. For years Colehad struggled vainly to regain the success he hadknown as a rookie, making ironic his triumphantswan song.
In August, Vila had written about Cole, "In myopinion, his illness was exaggerated. He had a smallgrowth in his groin which the physicians said was atumor:'
By the end of October, the severity of Cole's ailmentwas obvious to the Yankee owners, who spurned thepitcher's request for a contract renewal. But Cole hadbeen counted out before. He returned to his wife inBay City with the intention of spending the winterrecuperating and exercising, then joining the Yankeesin Savannah in the spring.
When the hunting season opened in earlyNovember, Cole grabbed his rifle and headed north.Two days later, he aborted the trip and returned to hishome at 2001 Broadway complaining of pain andweakness. The cancer had reached its final stage. Forthe nex't seven weeks Cole's health deteriorated and hewas confined to his bed most of the time. By NewYear's, doctors were measuring Cole's life expectancyin days. At 7:30 on the morning of January 6, 1916,Cole succumbed. The death certificate reported theofficial cause as "scrofula lymphnaucous of the lung:'Cole's wife made arrangements for his body to betransported to Tama, Iowa, two miles south ofToledo,
T. S. Eliot wrote about the world ending not with abang but a whimper. In the world ofbaseball, it is notaltogether rare for a ballplayer to make noise early,only to peter out soon-afterward. Of the 68 Rookie ofthe Year winners selected from 1947, the award's inallgural year, through 1980, 35 went on to have whatcould be described as averag~J!!illQI __l~~~~~_~~r~_~r~~ ~ _Sixteen had careers which spanned fewer than tenseasons. Included among the phenom-to-flopballplayers were Joe Black, Bob Grim, Don Schwall,
- Mark Fidrych, Butch Metzger, and Joe Charboneau.Despite a career tragically cut short, Cole's .pitching
performance of 1910 ranks as one of the best of thecentury. His success was transitory, but Cole was kingfor a season. And after all, it is no bad thing to be aking, however brief the reign.
JEAN-PIERRE CAILLAULT
Home Runs: More Influential Than Ever
The baseball media have made a lot of noise thepast two seasons about how baseball's home runexplosion possibly reached its.zenith in the 2000
season, since the number of home runs per game inthe 2001 and 2002 seasons was lower than in 2000.Even the number of runs scored per game was lower,too. Batting averages, on-base percentages, and slugging percentages all declined; ERAs did, too. The new,larger strike zone had contributed to the leveling ofthe playing field between batters and pitchers. Or sothe story went.
But although all those things occurred, they didn'tconvey the larger truth-that the influence of homeruns continued to increase, as it has for most of thelast 100 years. A plot ofthe number of runs scored pergame in each league as a function ofyear is shown inFigure 1 (statistics from the Union Association-1884;the Players' League-1890; and the Federal League1914-15, are not included in any ofthe Figures used inthis article. None ofthose leagues existed long enoughto contribute in a meaningful way to the long-termtrend discussed). There has been quite a bit offluctu-
ball, with runs scored per game varying by roughly afactor oftwo from its liveliest years (the mid-1890s) toits deadest era only 15 years later (the late-1900s).And the variation has been anything but monotonous.
'Ithe first decade and a half (1876-1892) fl1.1ct1.Ultedwildly, with changes from year to year sometimes aslarge as 33%. For example, National League andAmerican Association teams were scoring more than12 and 13 runs per game, respectively, in the highscoring 1887 season, then declined to the 9 and 10 runper game range the following season, 1888. And then
JEAN-PIERRE CAILLAULT is a Professor ofAstronomy at theUniversity of Georgia. He has taught classes on thephysics and the history ofbaseball, published articles inBaseball Digest, and is the author oftheforthcoming ATale ofFour Cities: Nineteenth Century Baseball's MostExciting Season; 1889, in Contemporary Accounts.
72
they bounced back to around 12 runs per game in thevery next season, 1889!
After the American Association folded (followingthe 1891 season), the NL saw higher and higher scoring games for a couple of years, reaching the all-timepeak of nearly 15· runs per game in 1894. But thenscoring in the NL (and the American League, whichcame on board in 1901) tailed off nearly every yearthereafter until it reached its nadir of about 6.5 runsper game in 1908. Then a steady rise for four years,followed by a steady decline for four. That was followed by the clim.b back to about 10 runs per gamethat was reached in the early 1920s. The AL and theNL parted ways in the 1930s, with the AL teams scorillg allywllere frolll OIle to two runs per game morethan their NL counterparts during that period. Bothleagues declined during the WWII years, bouncedback in the 1950s, and declined again in the 1960s.
The 1970s and 1980s were pretty steady (with theAL and its DR always scoring more). Then anotherclimb began in the 1990s, in particular 1993. And, ascan clearly be seen in 1, there was indeed a
us..What they didn't emphasize, though, was that thescoring levels in those two seasons were still higherthan they'd been at almost any time during the entire40-year period between the early 1950s and the early19908. And because the number of runs scored pergame in the late 1990s and early 2000s is not atrecord high levels, many baseball people think there'sno cause for concern. In fact, many fans think highscoring is exactly what the game needs to keep it competitive with football and basketball. In terms ofhomeruns, the whole truth is even more elusive.
Figure 2 shows a plot of the number of home runsper game in each league as a function ofyear. The general pattern of increase is quite obvious just from aquick glance at the figure. There are the expectedpeaks and valleys thro:ughout baseball's rich history,but it is clear that, except for the 1987 season, therehave never been more home runs per game than in thelast few seasons. But the media pointed to those last

THE BASEBALL RESEARCH JOURNAL
Figure 1. RUNS/GAME THROUGHOUT PROFESSIONAL MAJOR LEAGUE HISTORY (1876·2002)
1996
1996
1986
1986
1976
1976
I
11
1 11 1
- - - - - - - - .. - - - - - - - -1- - - - - - --1 1
1 1I 1
I I
1 II II I
--------~ --------:- -------1 11 1
I' 11 11 11 I
I I1 I
1966
1966
1956
1956
1946
1946
1936
19361926
1926
1916
1916
1906
1906
1896
1896
1886
1886O-t+t_++li_++t++++++H-++I-H-+-+++H+H~H+++++f.+_++Ii_++H+++++H++-i+i_H+++++H+Hi_++H+++++H-++H+H+++++H++I_++H+++++H+H_H_H+1_+++++_l
1876
2 i"---" - -- -' .• - -- -- _ •. .L -- - •• - - - -1'- - •• •• .oJ ,__ •• __ L _ •• •• _1 •• __ .L _ •• _ -- _~... •• __ .oJ_, , L. _ -- - •• _ -"'--1--.' __ )- _ J~_~
1-----NL Runs/Game - - -- - - .AAlAL Runs/Game I
Figure 2. HRS/GAME THROUGHOUT PROFESSIONAL MAJOR LEAGUE HISTORY (1876·2002)
I--NL HRs/Game -:-..-- -AAIAL HRs/Game I
73
9.00
7.00
8.00
-,----
--,----
II I 1 I- - -.a;- -,- - - - - - - -r- - - - - - - -, - - --
I 1 11 1 II 1 II I I1 1 1
6.00 +-----r----+-----,:..---+-----T----+----i----+----i----,:-I---,:-1---1-1_--,
1876
1.5 -r-- - •. - -- -," - -- - ,- -., T -- - •• - -- -;- - •. - -- - •• oj--- '. - -, - -i- - •. --- - .• -;---- -.' - - .. -.~
14.00
13.00
12.00
11.00
10.00 --

THE BASEBALL RESEARCH JOURNAL
decade-2038 and 2028 would be the correspondingyears for the AL to reach these freak show situations.)
Table 1
YEAR NL RUNSIHR AL RUNS/HR1988 5.88 5.191989 5.64 5.651990 5.39 5.411991 5.58 5.221992 5.97 5.501993 5.22 5.171994 4.84 4.691995 4.87 4.731996 4.78 4.451997 4.82 4.501998 4.67 4.541999 4.48 4.442000 4.31 4.472001 4.12 4.402002 4.44 4.42
three pairs of' data points and claimed that the tidehad turned, that baseball has come to its senses and isreturning to an appropriate balance between itsoffenses and its defenses.
However, a closer look shows that the influence ofhome runs has continued to grow. Figure 3 is a plot ofthe number of runs per home run. After a brief loveaffair with the home run in the 1880s and 1890s, theleagues began the deadball era In that period therewere nearly 47 runs scored for every home run (1902NL), and still as many as 15-20 when Babe Ruth, in1919-1920, revolutionized the way the game was'played. Ever since, though, the influence ofhome runshas been in near steady ascension (with the usualexception of the WWII years).
The all-time lowest number of runs scored perhome run was recorded in 2001 in the NationalLeague-4.12. That number-one home run for everyfour runs scored-should be alarming to baseballpurists. In fact, ifwe extrapolate from the trend in theNL the last 15 years (by using a simple least-squareslinear regression program to find the best-fit straightline to the data in Table 1), tIlell we cODle up with thestartling conclusion that in the year 2028 the ratio ofruns scored to home runs will be 1.00. Every singlerun scored in the NL will be the result ofa home run!All other hits and walks will be meaningless!
Is this the path that baseball wants to travel? It'sanalogous to saying that every basket scored in theNBA will come from a dunk or that every point scored
YEAR198819891990
Table 2
NL HITS/HR12.7311.8811.12
AL HITSIHR10.5011.6911.08
I realize that these extrapolations are extremelyunlikely to happen. But the mere fact that the numbers point in this direction should be enough to causebaseball's bigwigs to rethink their love affair with thehomerun before it's too late, before baseball becomesall too predictable and a mere shell ofits former exciting and unpredictable self.
11.269.968.488.687.998.558.518.148.068.328.33
13.1010.449.599.499.199.399.058.257.857.808.77
19921993199419951996199719981999200020012002
Those plays, like home runs, are exciting, but onlybecause they don't happen too often.
Can the trend shown in Figure 3 be supported byany other numbers? Yes. The history of the ratio ofhits per home run is plotted in Figure 4. The plotlooks nearly identical to Figure 3, indicating a steadyincrease in the fraction ofhits that are home runs. Anextrapolation of the NL's previous 15 years' worth ofhit/HR ratios (see Table 2), similar to that describedabove for the ratio of runs/HR, leads to the fiightening conclusion that every hit in the NL will be a homerun by the year 2021! This hypothetical scenario is.even more alarming than the one stated in the preceding paragraph because there wouldn't even be singles,doubles, or triples to break the monotony. It would bethe equivalent of bringing the outfield fences in soclose that they'd be right behind the infield. (Thetrends in the American League are not as severe asthose in the NL, but they trail the NL only by about a
74

Figure 3. RUNSIHR THROUGHOUT PROFESSIONAL MAJOR LEAGUE HISTORY (1876·2002)
199619861976196619561946193619261916190618961866
90 ~-~-~""''''''''i''''''''''''''''''''''''"'''''''''''r''""'---"""""",--"",,~''''''''''''..,.,..----r'''''''''''''-''''''''fi-----i'''''''''-''-~-'''''''''''''''''i.............-"""I"i~, , ", ,i , , , , , , , , , , I
85 - - - - - - -:- - - - - - - - ~ - - - - - - - - ~ - - -. - - - -:- - - - - - - - f - - - - - - - -~ - - - - - - - -: - - - - - - - - ~ - - - - - - - -:- - - - - - - - ~ - - - - - - - - ~ - - - - - - - -:- - - --, , , , , , , , , , , I
80 - - - - - -:- - - - - - - - ~ - - - - - - - - ~ - - - - - - - ~- - - - - - - - ~ - - - - - - - - ~ - - - - - - - ~ - - - - - - - - ~ - - - - - - - -:- - - - - - - - ~ - - - - - - - - ~ - - - - - - - -:- - - - -, , , 1 , , , , , 1 , ,, 1 , , , , , , , , , 1
75 - - - - - - -:- - - - - - - - ~ - - - - - - - -~ - - - - - - - ~- - - - - - - - ~ - - - - - - - -~ - - - - - - - ~- - - - - - - - ~ - - - - - - - -:- - - - - - - - ~ - - - - - - - - ~ - - - - - - - -:- - - --, , , , , , , , , , 1 ,
70 - -'- - - - -:- - - - - - - -, - - - - - - - -,. - - - - - - - -:- - - - - - - - ~ - - - - - - - -:- - - - - - - - ~- - - - - - - -} - - - - - - - -:- - - - - - - -, - - - - - - - - j. - - - - - - - -:- -. --, , , 1 , , , , , , , ,
65 - - - - - - -:- - - - -. - -~ - - - - --- -~ - - - - - - - +-------f-------+-------~- -------~-------+-------~--------~--------:- ----, , , , , , , , , I , ,
60 - - - - - - -:- - - - - - - -,- - - - - - - -i- - - - - - - - -:- - - - - - - - ~ - - - - - - - -:- - - - - - - - ~- - - - - - - - ~ - - - - - - - -:- - - - - - - -1- - - - - - - - r--------:- -. --, , , , , , , , , , , ,55 - - - - - - -:- - - - - - - - ~ - - - - - - - -~ - - - - - -- ~- - - - - - - - i----- ---~ ------ -~-- ------: ----- ---:- -------~- -.. -----~ --- ---- -:- -.. --, , , , , , , , , , , ,50 - - - - - - - -:- - - - - - - - ~ - - - - - - - -l- - - - - - - - -: - - - - - - - - t - - - - - - - -:- - - - - - - - ~ - - - - - - - - i' - - - - - - - -:- - - - - - - - ~ - - - - - - - - i- - - - - - - - -:- - - - -
\: : : : : : : : : : : :45 - - - "I - - -,- - - - - - - - ., - - - - - - -,. - - - - - - - ..,- - - - - - - - " - - - - - - - -,. - - - - - - - ... - - - - - - - - r - - - - - - - -,- - - - - - - - ., - - - - - - - - r - - - - - - - -,- • - - -
\: : :,. : : : : : : : : :40 - .. - - - -'- - - - - - - - ~ - - - - - - ~ ~ - - - - - - -: - - - - - - - - f - - - - - - - -~ - - - - - - - -: - - - - - - - - ~ - - - - - - - -:- - - - - - - - ~ - - - - - - - - ~ - - - - - - - -:- - - - -
l : ':Jj,\: "i : : : : : : : ::: :::: \\~i\:~::::]: -:: __--, --~);ij::::::]:::::::I:::::::J::::::::I:::::::I:::::::J::::::::[:::::::I::::: \/\: : : \ : : : : :': : :
:: ::::: __::: IT :\:: - - ~:: __t:~::_--:-T_r::::: ~:::::::r:::::: ~::::: ::: ~:::::: ::~::::::: ~:::::::: ~::::::: r:::, " """"
15 --------:- ------i--------r--------:--- --j\-l--------:--------i--------r--------:--------i--~-----~--------:-----
10 - - - - - - - -:- - - - - -- - ~ - -- - - -- -~ - - - --- -+------f : '-- ----- -:-- ---- --:- ---- ---~- ----- --~ --------:- ----, , , , , , , " "
5 --------:--------~--------l_--------:--------t--------:--------~-~-5IIJ1iQ........~..~{W!II~..,.,..~........., , , , , , ,o -t------r-'---..,.'--....,.'--......,.......'--..,...'---,...'---.,.'----,..----r----r----r------r-......1876
I""""';"'"NL Runs/HR =- ===AA/ALRuns/HR ,
Figure 4. HITSIHR THROUGHOUT PROFESSIONAL MAJOR LEAGUE HISTORY (1876·2002)
1:;'0 I140 - .. - - " - - .,;- - - - - - '. - .;. .. - - - - - - ,.;- - .. - - - - - oi- - - •• - - -, -;- -- - - .• - - .;; - - -- - - '. -:- •• - - - - - --: - - •• - - - - - ;.- - - •• - - - -;- -- - - •• - - T' - - -- - - •• -;- ., - - -!
130 - to - - •• - - -!:- - -- - - .• -.;. - - - --- - .•:- - .,- - -- -.; '. - - •. - - --~- -- - - •. - -..;- - -- - - .• -;.. - -- -- - - .~- - -, - - -- -;'" - -., - - --:-- ,. - - •. - -.;.- - -- - - •• -:- -- --I
120 - of - - •• - - oi'_ - -- - - •• _'" - - - --- _ ••J __ ., .& '. __ •• ,- •• __ .1 •• _ .. _, •.1 _ _ .' L •• __ ., ' __ ,. __ •• -- "' - - •• -'- -- --!
1966 1,976 1986 199619561946193619261916190618961886
110 - -i- - •. - - oil_ - -- - - •• - "'- - - -- - - •• '- - -, - - -- - .&,. - - •• - - --'--- - - •• __ .1_ - -- -- •• _l.., -- --- - •.1- -.' - - -- - L •• - -., - - --'- - ,- - - •• - - "'- - --. - •• -'- - - --I,100 •• ~"'" "" ' +- .. - -1- - "'i-G.. - ---- - of- - - •• - - --I- - ----.' - of_ .• - - -- - -1-- - - •• ---.of __ ---- --" - .. - - - ,- - -,--- - .. - - -.~ - --- -- --,- _.. --!
90 ---\ ,1-';
80 1 \ /--- \ ~ \ ./.
70 \ \Jil':\\'-.-,.l" '-7\.L~\-T" 'T - -- - - ..... - -- - -., -., -- - -., -- -,I- - --, - - - '-.,- - - - - .• - - r- - - .• - - --,-- .• - - -- - T ,. - - -- - - "1-· ---I
60 i __~:_ ~-\\ _\I\r/" _'.J._T -'11M - - ., - - -;- - - '. - - " - ; - - - -- - - •• i- - - - - -- - -i •• - - - - - -- i- - •• - - -, - - -;- - - ,. - - •. - T- - - -- - - •• ;- - - - -I
50 ~ ,i,1 ~ _t __L__\•.t .;~1-l1 ., __:__ .. ..; .,;.. .. ..; ;. .. __:__ , .;. __ ., __ -- ..:-----1
40 - - - - - \l ,1 :~ _~L _:_ --w:/-_~"" _,_ .. _J .' __ .I , .... .. _.1 II. •• _' .' __ "' •• ~ !
w ---f~----t----r-~-:~:-'--------.I----·~·--- .. -~---- .. .1---- L., ~~ ,."' .,_~ ~20 ~ ~ ~ ~ ~~._l~lA~-~-~~ .. -----··~--------~-------~---··---:-,·-----~---110 -------J,--------l,-------J,--------l,--------L, _~_~ __j,~----~,~ . .- ,.I\. _J!J,~ ........., , , , , , , -, --- - --:.........-- ._," - ,~
o+-----,-'--....,..'----,'----,.-'--..,...'--...,...'---..,.'----,---r------r-'--...,-'_~-,-'------J1876
I---NL Hits/HR - ---- -AAIAL Hits/HR I
75

PETER REIDHEAD & RON VISCO
The Most Exciting World Series GamesAMathematical Approach
In baseball there are many kinds of excitement.Seeing great catches and timely hits by legendaryplayers, watching your favorite team crush the
opposition, having a record set-most fans would beexcited by such occurrences. However, we are interested here in the "edge-of-your-seat, who's going towin the big game" type of excitement.
The reader may reasonably argue that the importance ofa game inherently affects its excitement. Also,a fan of a particular team, say the Yankees, might finda Yankees game (especially a victory) more excitingthan a game between two other teams. While notdenying that viewpoint, this article describes thedevelopment of a quantitative model for measuringthe excitement of any baseball game using only mininlal il1forl11atioll, Ilot including the teams involved orwllell tIle gallle was played. That approach is thenapplied to World Series games, where the importanceof each game is consistently high.
ASSUMPTIONS The intent was to develop a ·model thatquantified the excitement level of baseball games
team scored euch inning over the duratioll of tIlegame. With this goal, four assumptions formed thebasis for the model:
• 'fhe most exciting games are tllose ill wilicil tIlescore is close for most of the game.
• Lead changes add to the excitement of a game.• Closeness in score and lead changes are more
important toward the end of the ball game.• It is not inherently significant how the individ
ual runs are scored during a game.
PETER REIDHEAD is a native ofCooperstown and currentlyworks in real estate investment in New York City. He isa graduate of Yale University. RON VISCO lives inCooperstown, New York, and is an educator at theNational Baseball Hall ofFame.
76
Overall, the first assumption is the most important.The closeness ofthe score enhances the importance ofall other factors. For example, a remarkable divingcatch will seem more exciting in a tie game than in a13-2 slaughter.
The second assumption expands on the first.Although excitement is tied to how close the score is,it increases when' one team overtakes the other teamfor the lead. Certainly it is exciting to see a team rallyfor 11 runs in an inning after being behind 6-0.However, the swing in the score is not optimal interms of sustained excitement; although the secondassumption of the model is upheld (i.e., the leadchanges hands), the first assumption is violated. Theganl.e is 110t COIlsidered very exciting up until this dramatic comeback because it was so lopsided, a.nd it wasalso not very exciting after the turnaround because ithad become lopsided in the opposite direction.Therefore, altllougll lead changes add to the excitement, it is .also important that the score is close bothbefore and after the lead change.
The third assumption leads to weighting the end of
Silllilar to the 11ypotlletical situation with the firstassumption, a fabulous catch or close play in the firstinning is not regarded as exciting as the same exactcatch toward the end ofa close game. This is not to saythat the first half of tIle Kaille is Ilot illlportant in thecalculations of the model. What makes a game themost exciting is a game that not only has a thrillingending, but.was also very close and tense throughoutthe duration of the entire game.
The final assumption of the model might be themost controversial. When fans are asked about themost exciting way for a run to be scored, many willanswer ''home run."·Yet it can be equally thrilling towatch the winning run score from first on a double, orscore on a sacrifice fly with a close play at the plate. Infact, some would argue that these methods of scoringare more exciting than a home run because the duration of the play is longer; perhaps the runner in thelatter case walked, stole second, and moved to third

THE BASEBALL RESEARCH JOURNAL
on a grounder to the right side. The tension is sustained, and the outcome during the play is largelyuncertain.
The model does not consider how runs score, onlywhen runs score. In addition, the model does notattempt to factor in an individual player's performance or records that are broken. Certainly, it can beexciting to witness those things, but the model quantifies the excitement level ofa game based solely on itsmerits as a game, not on the merits of individualachievements, such as no-hitters, multiple home runs,etc. Plays that result in outs rather than runs, such asrunners thrown out at home, are also beyond thescope of the model.
Based on these four assumptions, a mathematicalmodel was developed. It accepts as input a line score,and assigns a rating or score to that particular baseball game, which could then be ranked against anyother individual baseball game. Details on the construction and mathematical specifications of themodel are given in the appe\R~ixat the end.
RANKING OF WORLD SERIES GAMES The model was used torate all games in the history of the modern WorldSeries (Le., since 1903). However, in reporting theresults, each game is classified by its number in thegiven series (game 1, game 2, etc.). In that way, seventh games are not directly compared to secondgames, and so on. For those who would argue that sev-
first games, and hence more exciting, this approachkeeps game importance as comparable as possiblewithin a given category. The results are shown inTable 1. For each "game" category, the top ten rankedgames (and the number of innings) are presented.
The 1991 World Series between the Twins andBraves, which most contemporary observers agreewas one of the greatest ever, has four of its gamesranked among the top ten by category: games 3, 4, 6,and 7. The recent 2001 series, between theDiamondbacks and Yankees, has three ranked games;these include the incredible Yankee rallies in games 4and 5, and the Diamondback ninth-inning comebackin game 7. The famous Red Sox-Reds World Series of1975 also has three ranked games, including the terrific 7th game and the 6th game with the Fisk home runin the 12th inning.
Two older, but classic, World Series had the top twoseventh games. The 12-inning Senators victory overthe Giants in 1924 finished first; Walter Johnsonfinally won the championship after an heroic effort inrelief. The incredible 10-inning Red Sox victory (alsoover the Giants!) in 1912 came in second; Snodgrass'famous "muff" contributed to Christy Mathewson'sloss against Smoky Joe Wood in the finale. Each seriesalso had a second ranked game.
The recent five-game series between the Yankeesand Mets in 2000 had two ranked games, includingthe top-ranked game 1, an extra-inning thriller. Alsowith two ranked games was 1926, with the top-ratedgame 5 (a 3-2 ten-inning nail biter), as well as thefamous game 7, when Old Pete Alexander of theCardinals came offthe bench to fan the Yankees' TonyLazzeri with the bases loaded.
the model uses only information from line scores, theauthors believe that it did a credible job ofidentifyingthe most exciting World Series games. Undoubtedly,others will disagree. Arguments are welcome: it's oneof the pleasures of being a baseball fan!
Table 1. WORLD SERIES GAME RANKINGS
GAME 1 INN GAME 2 INN GAME 3 INN GAME 4 INN GAME 5 INN GAME 6 INN GAME 7 INN2000 12 1916 14 1914 12 1933 11 1926 10 1958 10 1924 121977 12 1950 10 1980 10 1939 10 1952 11 1956 10 1912 101907 12 1934 12 1911 11 2001 10 1936 10 1991 11 1991 101946 10 1944 11 1991 12 1910 10 1933 10 1992 11 1997 111958 10 1913 10 1973 11 1969 10 2001 12 1986 10 2001 91924 12 1990 10 1995 11 1978 10 1980 9 1919 10 1971 91954 10 1912 11 1992 9 1991 9 1942 9 1971 10 1962 91939 9 1922 10 1935 11 1972 9 1964 10 1945 12 1926 91949 9 1973 12 1950 9 1927 9 2000 9 1975 12 1975 91923 9 19-75 9 1961 9 1943 9 1972 9 1935 9 1972 9
77

APPENDIX: TECHNICAL SPECIFICATIONS
CONSTRUCTION AND VALIDATION With those four assumptions, the following framework was used in constructing the model:
Each of the first three assumptions has a curve representing the relationship of their values.
The calculations use 1.0 as the maximum value forany given increment.
The basic increment used in individual calculationsfor the first three assumptions is the "half inning" (ina standard game where the home team uses its last atbat, there are 18 half innings).
With this conceptual framework, a statistical modelwas constructed, using Microsoft Excel for the computer-based calculations. The model allowed linescores to be entered for any game (including extrainnings), and would generate a rating based on theassumptions and framework stated.
To refine and then validate the effectiveness of themodel, a multi-phase procedure was used. Initially,discussions were held with selected baseball "experts"regarding scoring sequences that maximize excitement in a game; for example, what's the most exciting1-0 nine-inning game? (Consensus: the run scores inthe bottom of the ninth.) Then line scores for hypothetical games-each of which ended in a 5-4 scorewere presented to staff members at the Hall of Fame;they were asked to rank the in order of excite-
to some """,r~rI,~"",......+,ro.......
model, especially the various weighting schemes.Ultimately, two sets of line scores for actual games
were presented to experts. One set represented a widerange of scoring outcoilles, and the otller set were allclose gaillesll il1cluding some with ~xtra innings. Bythe final phase, the ranking of games by the modelagreed with the average ranking by the experts.
EQUATIONS AND GRAPHS The first assumption is represented by Curve 1 on Graph 1.
The "Run Differential" (RD) on the x-axis is theabsolute difference between the home team's run totaland th.e visiting team's run total at the end ofeach halfinning. For example, if a game is tied 4-4, the RD is 0'and has a corresponding y-value ofl.0 (the maximumscore for that factor). A tie score is the most excitingscore possible in the model. The other extreme is agame where one team is annihilating the other. FortIle purposes of the model, the extremes only go up toa RD of 24. When one team is beating the other by 24
78
runs, the "RD Conversion" (RDC) is only .01. In otherwords, at such a lopsided score, the game is not exciting. With the two extremes of the model defined, thepoints in between were filled in. Going from -24 to 0,the curve rises gradually, with the RDC for a one-rungame very close to a tie ball game on the curve. Forevery half inning of a game, Curve 1 produces a number on the y-axis, which is used in a later calculation.
The Curve 2 represents the second assumption ofthe model. This curve is similar to Curve 1, butinvolves one more step in producing an actual number. The second assumption uses the absolute difference in score at the beginning and end of each halfinning to produce a conversion number, and measuresthe absolute vertical distance traveled on Curve 2between the beginning and end of each half inning.Similar to Curve 1, Curve 2 is shaped.to recognize thecorresponding excitement for a change. Suppose, forexample, the score at the beginning of the half inningis 4-2: the resulting; y-valtle is .78. If the offensiveteam then scores one run to make it 4-3, the secondresulting y-value is .87. The "Lead ChangeConversion" (LCC) is simply the difference betweenthese two numbers, or .09. It: however, the teambehind 4-2 had instead scored five runs and now hada lead of4-7, the Lce calculation would be the following: (1.0 - .78) + (1.0 - .72) = .50. Thus, Curve 2
a scorehalf inning goes from one side of the curve over thepeak and back down to the other side.
The observant reader may notice that the twoassumptions (alld tllUS tIle two curves) counterbalance eacll otller to a certain degree. In other worrls,when you maximize one factor, the other factor isminimized. For example, in order to maximize thefirst assumption, a scor~ wonlrl be tied a.t the beginning and end of a half inning, producing scores ofl.Ofor Curve 1, but a score of 0.0 for Curve 2 (since therewas no change in the score). But the Curve 2 is maximized when a half inning starts at -24 and ends at+24 for a score of .998, whereas Curve 1 producesscores of .01. Therefore, the intersection points of thetwo curves are of great importance. These occurapproximately at RDs of -2 and +2. The significanceof this is that the highest possible sums for the resultsfrom Curves 1 and 2 occur within the range -2 to +2.
Calculatiolls based on these two curves are thusused to generate the following expression:

THE BASEBALL RESEARCH JOURNAL
Graph 1. RD AND LEAD CONVERSIONS
1.2
~ 1.0t5fa 0.8 w
LL
§ 0.6···af!~ 0.4c<3 0.2
0.0
-24 -21 -18 -15 -12 -9 -6 -3 a 3 6 9 12 15 18 21 24
Run Differential (RD)
Graph 2. INNING FACTOR CONVERSION1.00.90.8
§ 0.7tie 0.6~ 0.5a 0.4 w
o 0.30.20.1 .0.0
o 3 6 9 12 15 18 21 24 27 30 33 36 39 42 45 48 51
Half Innings
(Curve 1 score) + (Curve 2 score)
At this point we turn our attention to the thirdassumption, whose values are plotted in Graph 2.
Similar to the first two curves, Curve 3 uses anasynlptote ofl..0 as its lnaxillluill value. TIle begillilillgof the game is weighted at approximately 0.2 andincreases gradually until it reaches 1.0 at the 18th halfinning. In other words, the end of a game is weightedapproximately five times as heavily as the beginning ofthe game. Although the shape and value of this curvemight seem arbitrary, it was based on the results ofthe validation process and other factors.
Note that the graph allows for extra-inning games.Although the weighting for the ninth inning is close tothe asymptote, the subsequent half innings areweighted at 0.1. Although an extra-inning game willalmost always score very well by virtue· of its inherent
79
closeness, the low weighting of 0.1 for the extra halfinnings makes it possible for very exciting nine-inninggames to compete against eA'tra-inning games. (Somereaders may disagree with the low weighting assignedto the extra innings, note that if the weighting for theextra illllillgS Ilad beell 0.0 illstead of 0.1 [i.e., tIlemodel only considered the first nine innings], 67 ofthe 70 games ranked in the final section of this articlewould have nonetheless still been ranked in the top 10of their game category.)
With the third curve, we can complete the equation:
[(Curve 1 score) + (Curve 2 score)] X (inning factor)= half inning score
Every half inning of the game receives a half-inningscore, and when the game is completed, the halfinning scores are aggregated for the final game score.
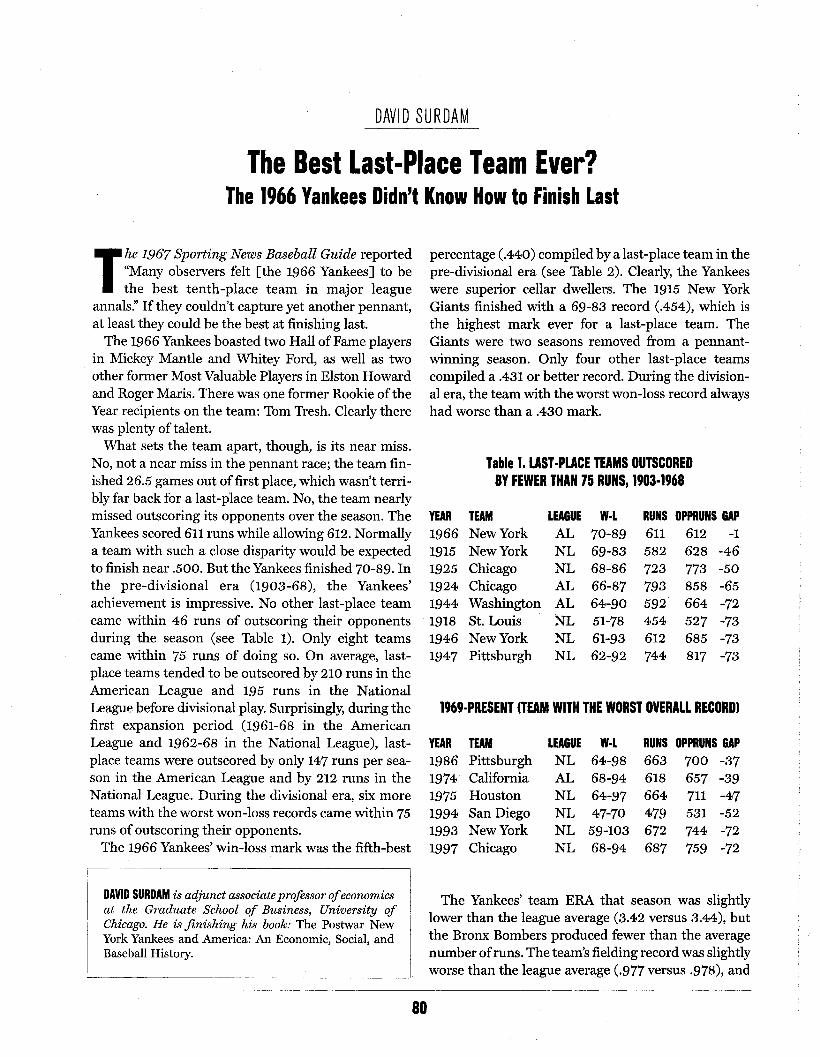
DAVID SURDAM
The Best Last·Place Team Ever?The 1966 Yankees Didn't Know How to Finish Last
The 1967 Sporting News Baseball Guide reported"Many observers felt [the 1966 Yankees] to bethe best tenth-place team in major league
annals:' If they couldn't capture yet another pennant,at least they could be the best at finishing last.
The 1966 Yankees boasted two Hall of Fame playersin Mickey Mantle and Whitey Ford, as well as twoother former Most Valuable Players in Elston Howardand Roger Maris. There was one former Rookie oftheYear recipients on the team: Tom Tresh. Clearly therewas plenty of talent.
What sets the team apart, though, is its near miss.No, not a near miss in the pennant race; the team finished 26.5 games out offirst place, which wasn't terribly far back for a last-place team. No, the team nearlymissed outscoring its opponents over the season. TheYankees scored 611 runs while allowing 612. Normallya team with such a close disparity would be expectedto finish near .500. But the Yankees finished 70-89. Inthe pre-divisional era (1903-68), the Yankees'achievement is impressive. No other last-place teamcame·within·46 runs of··outscoring their opponentsduring the ·season (see Table 1). Only eight teamscame within 75 runs of doing so. On average, lastplace teams tended to be outscored by 210 runs in theAmerican League and 195 runs in the NationalI ..eaglle before divisional play. Stlrprisingly, during thefirst expansion period (1961-68 ill tIle AInericanLeague and 1962-68 in the National League), lastplace teams were outscored by only 147 runs per season in the American League and by 212 runs in theNational Leagtle. Dllring tIle divisional era, six moreteams with the worst won-loss records came within 75runs of outscoring their 0ppollellts.
The 1966 Yankees' win-loss mark was the fifth-best
DAVID SURDAM is adjunct associate professor ofeconomicsat the Graduate School of Business, University ofChicago. He is finishing his book: The Postwar NewYork Yankees and America: An Economic, Social, andBaseball History.
80
percentage (.440) compiled by a last-place team in thepre-divisional era (see Table 2). Clearly, the Yankeeswere superior cellar dwellers. The 1915 New YorkGiants finished with a 69-83 record (.454), which isthe highest mark ever for a last-place team. TheGiants were two seasons removed from a pennantwinning season. Only four other last-place teamscompiled a .431 or better record. During the divisional era, the team with the worst won-loss record alwayshad worse than a .430 mark.
Table 1. LAST·PLACE TEAMS OUTSCOREDBY FEWER THAN 75 RUNS, 1903·1968
YEAR TEAM LEAGUE W-L RUNS OPPRUNS GAP1966 New York AL 70-89 611 612 -11915 New York NL 69-83 582 628 -461925 Chicago NL 68-86 723 773 -501924 Chicago AL 66-87 793 858 -651944 Washington AL 64-90 592 664 -721918 St.1946 New York NL 61-93 612 685 -731947 Pittsburgh NL 62-92 744 817 -73
1969·PRESENT (TEAM WITH THE WORST OVERALL RECORD)
YEAR TEAM LEAGUE W-L RUNS OPPRUNS GAP1986 Pittsburgh NL 64-98 663 700 -371974 California AL 68-94 618 657 -391975 Houston NL 64-97 664 711 -471994 San Diego NL 47-70 479 531 -521993 New York NL 59-103 672 744 -721997 Chicago NL 68-94 687 759 -72
The Yankees' team ERA that season was slightlylower than the league average (3.42 versus 3.44), butthe Bronx Bombers produced fewer than the averagenumber ofruns. The team's fielding record was slightlyworse than the league average (.977 versus .978), and
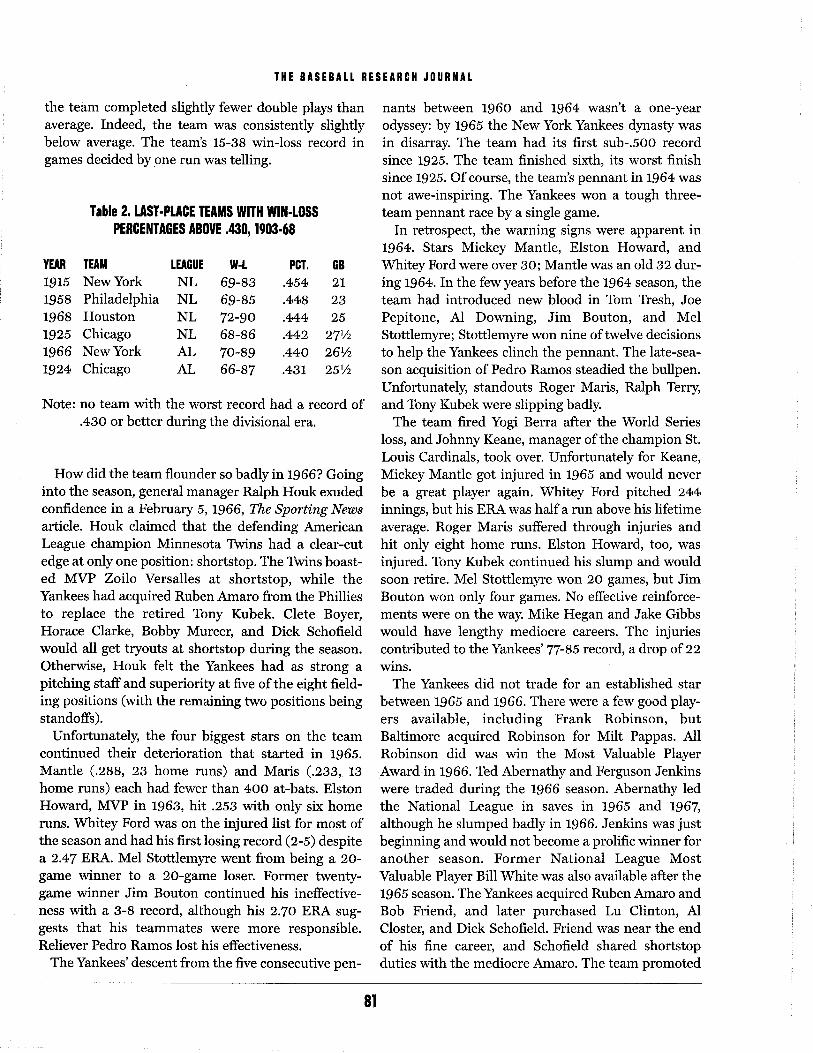
THE BAS EBALL RES EAR CH J0URN AL
Note: no team with the worst record had a record of.430 or better during the divisional era.
the team completed slightly fewer double plays thanaverage. Indeed, the team Was consistently slightlybelow average. The team's 15-38 win-loss record ingames decided by ,one run was telling.
How did the team flounder so badly in 1966? GoingilltO tIle seasoll, gelleralltlanager Ralph Houk exudedconfidence in a February 5, 1966, The Sporting Newsarticle. Houk claimed that the defending AmericanLeague champion Minnesota Twins had a clear-cutedge at only one position: shortstop. The Twins boasted MVP Zoilo Versalles at shortstop, while theYankees had acquired Ruben Amaro from the Phillies
Table 2. LAST·PLACE TEAMS WITH WIN·LOSSPERCENTAGES ABOVE .430, 1903·68
nants between 1960 and 1964 wasn't a one-yearodyssey: by 1965 the New York Yankees dynasty wasin disarray. The team had its first sub-.500 recordsince 1925. The team finished sixth, its worst finishsince 1925. Of course, the team's pennant in 1964 wasnot awe-inspiring. The Yankees won a tough threeteam pennant race by a single game.
In retrospect, the warning signs were apparent in1964. Stars Mickey Mantle, Elston Howard, andWhitey Ford were over 30; Mantle was an old 32 during 1964. In the few years before the 1964 season, theteam had introduced new blood in Tom Tresh, JoePepitone, Al Downing, Jim Bouton, and MelStottlemyre; Stottlemyre won nine of twelve decisionsto help the Yankees clinch the pennant. The late-season acquisition of Pedro Ramos steadied the.bullpen.Unfortunately, standouts Roger Maris, Ralph Terry,and Tony Kubek were slipping badly.
The team fired Yogi Berra after the World Seriesloss, and Johnny Keane, manager of the champion St.Louis Cardinals, took over. Unfortunately for Keane,Mickey Mantle got injtlred in 1965 and wotlld neverbe a great player again. Whitey Ford pitched 244innings, but his ERA was half a run above his lifetimeaverage. Roger Maris suffered through injuries andhit only eight home runs. Elston Howard, too, wasinjured. Tony Kubek continued his slump and wouldsoon retire. Mel Stottlemyre won 20 games, but JimBouton won only four games. No effective reinforce-
GS212325
271122611225V2
PCT..454.448.444.442.440.431
W-L69-8369-8572-9068-8670-8966-87
LEAGUENLNLNLNLALAL
TEAMNew YorkPhiladelphiaHoustonChicagoNew YorkChicago
YEAR191519581968192519661924
Horace Clarke, Bobby Murcer, and Dick Schofieldwould all get tryouts at shortstop during the season.Otherwise, Houk felt the Yankees had as strong apitching staff and superiority at five of the eight fieldirlg positiollS (Wit}l tIle reillail1il1g two positiol1S beil1gstandoffs).
Unfortunately, the four biggest stars on the teamcontinued their deterioration that started in 1965.Mantle (.288, 23 home runs) and Maris (.233, 13home runs) each had fewer than 400 at-bats. ElstonHoward, MVP in 1963, hit .253 with only six homeruns. Whitey Ford was on the injured list for most ofthe season and had his first losing record (2-5) despitea 2.47 ERA. Mel Stottlemyre went from being a 20game winner to a 20-game loser. Former twentygame winner Jim Bouton continued his ineffectiveness with a 3-8 record, although his 2.70 ERA suggests that his teammates were more responsible.Reliever Pedro Ramos lost his effectiveness.
The Yankees' descent from the five consecutive pen-
would have lengthy mediocre careers. The injuriescontributed to the Yankees' 77-85 record, a drop of 22wins.
The Yankees did not trade for an established starbetweel1 1965 al1d 1966. Tllere were a few good players available, including Frank Robinson, butBaltimore acquired Robinson· for Milt Pappas. AllRobinson did was win the .Most Valuable Player,Award in 1966. 'red Abernathy and Ferguson Jenkinswere traded during the 1966 season. Abernathy ledthe National League in saves in 1965 and 1967,although he slumped badly in 1966. Jenkins was justbeginning and would not become a prolific winner foranother season. Former National League MostValuable Player Bill White was also available after the1965 season. The Yankees acquired Ruben Amaro andBob Friend, and later purchased Lu Clinton, AICloster, and Dick Schofield. Friend was near the endof his fine career, and Schofield shared shortstopduties with the mediocre Amaro. The team promoted
81

THEB ASEBALL RESEARCH JOURNAL
HOME RUN Nt 600 (AB • CAREER AT BAT FOR Nt 600)
PLAYER TM . LG DATE PITCHER TM SITE AGE ON AB ABINRBabe Ruth NYA AL 8/21/1931 Geo. Blaeholder SLA SLA 36 1 6921 11.54Willie Mays SFN NL 9/22/1969 Mike Corkins SDN SDN 38 1 9514 15.86Hank Aaron ATL NL 4/27/1971 Gaylord Perry SFN ATL 37 1 10014 16.69Barry Bonds SFN NL 8/9/2002 Kip Wells PIT SFN 38 0 8211 13.69
- DAVID VINCENT
years since Mantle's debut.The 1966 Yankees' last-place finish was hotly dis
puted. The expansion Senators finished 25lh gamesback of the pennant-winning Minnesota Twins, whilethe Boston Red Sox finished 26 games back. Thus,there was a dogfight for last place. The Red Sox completed the "Impossible Dream" in 1967 by winning thepennant, while the Senators continued to wallow inthe second division with the Yankees.
Still, the 1966 Yankees make a strong case for beingthe best last-place team in history. Their win-lossmark and run differential were stellar for cellardwellers.
SOURCESThorn, Palmer, & Gershman. 2001. Total Baseball.7th Edition.
Horace Clarke, Fritz Peterson, Roy White, and BobbyMurcer. Peterson led the team in wins with 12, andClarke hit .266 as one of Kubek's replacements.
Although Bobby Murcer would become a solid outfielder, Horace Clarke was a mediocre player through~out his career. The Yankees would later introduceRookies of the Year Stan Bahnsen and ThurmanMunson, but the farm system was not as prolific asduring the 1950s. Indeed, observers attributed theminor league talent dearth to George Weiss's refusalto pay bonuses during the 1950s, and to the death ofkey scouts, including Paul Krichell. Although theYankees introduced several solid players during the1960s, there would be a long drought after MickeyMantle. Indeed, one could argue that the franchisehas failed to introduce a superstar of the Gehrig,DiMaggio, and Mantle caliber in the intervening 50
82
The 600 Club There are now four players with 600 career home runs as Barry Bonds joined the club inAugust. When Babe Ruth established the club in 1931, Rogers Hornsby was second on the all-time careerhome run list with 293 dingers. Ruth was the only member ofthe 300, 400, 500 and 600 home run clubsat the time. The Babe had three hits in that game but was ejected in the seventh inning for arguing a homerun calIon a ball hit over his head that hn'l'lnnL.:lrt
.................................. ,...•......a $10 for his run ball.
Willie Mays pinch hit his 600th homer in 1969 before a small crowd'in San Diego that gave the sluggera 5-minute standing ovation. Mays was joined 19 months later by Hank Aaron, thus forming the onlyactive 600-homer duo ever until Mays retired at the end ofthe 1973 season. Ironically, Mays won that 1971game with his fourth hit of the contest in the 10th inning.
Ruth was the youngest ofthe four sluggers to reach the mark and took many fewer at bats to 11it llis 600home runs. He is also the only American Leaguer on the list. All three of the NL blasts on this list involveth'e San Francisco Giants. '!\vo of the players were members of the Giants when they struck their historicblows and a Giants' hurler surrendered Aaron's clout.

JOHN B. HOLWAY
Kamenshek, the All-AmericanWas This Baseball's Greatest Fielding First Baseman?
The old Yankee. first baseman, Wally Pipp,watched the diminutive first baseman,Kamenshek, dance around the bag in the 1940s
and said he'd never seen a finer fielding first-sacker inhis life. And Pipp had seen Lou Gehrig, George Sisler,and Hal Chase.
A left-handed leadoff hitter, Kamenshek once stole109 bases in 107 games and led the league in battingtwice, 1946 and '47. But when a contract arrived fromthe minor league Fort Lauderdale club in 1947, "Iturned it down;' Kamenshek says. "One, I thought itwas a publicity stunt, and, two, I was only 5'6" andweighed 135. I thought, 'How am I going to competewith those big guys?'"
So Dottie passed up th~ chance to make llistory.Instead, she stayed with the Rockford PeacIles of tIleAll-American Girls Professional Baseball League, the"league of their own" later made famous by the hitmovie starring Geena Davis and Madonna.
"Our skills were as good as the men's;' Kamensheksays. "We just weren't strong enough to compete withthem. It's like Women in tournaments withmen, tee tee."
Many authorities consider her the greatest womanbaseball player ever. "Kammie had no weakness;' saysLavone "Pepper" Paire Davis, a colorful catcher of thelea~e. "She hit left-handed line drives and was acomplete ballplayer, tIle Pete Rose of our league."
Dottie spent two days on the film set helping thestarlets learn how to start a first-to-short-to-first double play. On a hit to their left, instead of throwingacross their bodies, she advised whirling completelyaround to make the left-handed throw.
The AAGPBL was the brainstorm of Chicago Cubsowner Phil Wrigley, who founded it in 1943, ready toput it into the major league stadiums ifWorld War IIforced men's baseball to close down.
JOHN B. HOLWAY is a leading historian of the Negroleagues, a frequent contributor to the BaseballResearch Journal, and the author ofBlackball Stars.
83
It didn't, but, the All-American League flourishedanyway in cities such as Rockford, Peoria, Racine,Fort Wayne, Grand Rapids, and later even Chicagoand Minneapolis. At the peak ofits popularity, the late1940s, the league boasted ten teams, its games werebroadcast from Chicago, and. they drew over one million fans.
Kamenshek, the league's all-time batting leader,won two batting titles, with averages of .316 and .306.She was also a danger on the bases.
"I had speed;' she says. "The manager made. meleadoff man. Your hitting tactics are a lot different; Iwas kind of a Rod Carew type:' She practiced by thehour bunting for hits.
III 1946 wIlell Dottie stole 109 l)asf~s,sh.f~ finis}le(lsecoIld-her rival, Sophie Kurys, stole 201. "I couldhave stolen more, but our manager wouldn't let ussteal unless it meant something in the game:'
And they did it wearing short skirts. (How manycould Rickey Henderson steal in short pants?)
"We got used to it;' Kamenshek shrugs. "In thewe're we'd rta"l7aln~T\ cc:tll11ses.
yOll got YOllr skin totlghened up, you were pretty luckymost ofyear:'
The uniforms were also cold. "In May up in theMidwest, it gets pretty cold at night;' Dottie says. "Wewere on the l~ak.es a lot of times, with nothing to protect your legs~" While fans bUlldled ill blallkets witllthermos jugs of coffee, the girls shivered. "Maybethat's why we ran so fast:'
At first they played a modified softball, with a shortpitching distance and base paths, underhand delivery,and a ball somewhere between a baseball and a softball in size.
Later, the diamond was enlarged almost to majorleague dimensions, the ball was reduced, overhandpitching was allowed, and batting averages climbed."In 1951 I hit .345 and finished second:' Her lifetimeaverage, .292, is the best in the league. But "I'm notone for statistics, really. I never paid any attention tothat. I didn't consider myself an individual player,team victories were more important to me:'

THE BASEBALL RESEARCH JOURNAL
She didn't even know her batting average until a fewyears ago, when league historian Sharon Roepke published them on a set ofbaseball cards. "I looked at mycard:' Dottie says. "I was probably on base 40 percentof the time, counting walks:'
Kurys and Kamenshek fought it out year after yearfor the honor of being the greatest girl in the league.Which was better? "That could be thrown up forgrabs:' Kammie smiles.
(Kurys starred in her own TV commercial forMaster Card in the 2001 World Series; she's the ladywho opens the door when a little boy rings to give hera picture of herself. See also SABR Baseball ResearchJournal, 1991).
The only time Dottie and Sophie played togetherwas on a Latin American goodwill tour after the '46season. They visited Panama, Costa Rica, Venezuela,and other countries.
"You sure could feel the unrest in Nicaragua:' Dottiesays, "you could tell it was a dictatorship:' They wereinvited to President Somoza's palace and danced untileveryone missed bed check. "You didn't leave whenSomoza didn't want you to leave~"
Thanks to their star first baseman, Rockfordreached the playoffs every year but the first two. In all,the Peaches won four championships in ten years,1943-52.
One of Dottie's greatest games was the seventhgame of the 1946 playoffs against Kurys's Racine
ter for ten innings. Racine's Joanne Winter was introuble constantly but didn't get scored on." Finallythe Rockford manager lifted Morris for a pinch-hitter.
"The game was filled with sensational plays:' Kurysremembers.. In the 15th inning Sophie got on, stolesecolld, alld started to steal third, when Betty lrezzahit a ball over the infield. "I kept going and hook-slidinto home. It was close, but I just made it, and we wonthe championship:'
The old-tillle base-stealillg cllaillp, Max Carey, whowas in the stands, called it the best-played baseballgame he'd ever seen.
Kamenshek was born just before Christmas 1925,outside Cincinnati, and at the age ofnine started playing baseball with the boys with a "wrapped-up, wornout ball:'
At age 14 or 15 Dottie competed in a track meetagainst Stella Walsh, the 1936 Olympic sprinter forthe u.S. "I came in last, but that's all right-I was goodenough to run against her:'
84

THE BASEBALL RESEARCH JOURNAL
At 17 she was playing industrial league softballwhen the All-American League was formed and shejoined 30 other Cincinnati girls for a tryout. She wasone of only two selected.
She practiced footwork in front of a long mirror inher bedroom, throwing a ball in the air and shiftingher feet.
After their workouts, the girls had to go to "charmschool;' walking up and down stairs with books ontheir heads. Most of them griped, but she didn't. "Werealized that Mr. Wrigley was trying to make it a veryhigh ladies' league. Back in those days no one wore alot of makeup; ifyou did, you were called a floozy:'
Every team had a chaperone, who doubled as acounselor, getting the younger girls over bouts ofhomesickness, etc. The chaperones were also trainers,bandaging up the wounded after each game.
Some of the players clowned on and off the field.Outfielder Faye Dancer of Fort Wayne was famous forclimbing fire escapes to sneak in after curfew.
But Kammie says she "didn't get into a lot ofescapades. I practiced a tremendous amount of time:'
At first the teams traveled by bllS or train~ each girlcarrying her own bats and gloves.
Could they sleep on the buses? "We tried. We'd getsome sleep and hope that we'd get into town earlyenough to take a nap." Ifthe rooms weren't ready, theysprawled on lobby sofas until time to go to the park.
During home stands the girls lived with local families, from one to four girls to a house.
too atten-dance grew as the team started winning. They playedin the high school football stadium which didn't havea fence. On an average night they drew 3-4,000 fans,with up to 10?000 for a big game. The local newspapers gave thelll excellellt coverage.
Dottie played for $50 a week the first year. In laterseasons she drew $125 a week, which was supposed tobe tops. '~ couple of years I held out for bonllses,which I wasn't supposed to do. We called it 'under thetable' money. I was trying to go to college and used itfor tuition:'
She enrolled at Marquette University in 1949 tobecome a physical therapist and reported to the teamafter the semester was over, arriving without anyspring training.
In 1951 Dottie left the game at the age of 25 to go toschool full-time. The next year TV and the lack ofgood young players finally killed the All-American.
Kamenshek spent 18 years working with crippled
85
children as Los Angeles County's chiefoftherapy services. Now retired in the California desert, she droveher van to Cooperstown in 1989 to see the Hall ofFame's new exhibit on women's baseball. "Yes;' shesays, "my picture's there:'
In 2000 Sports Illustrated named her one ofthe top100 woman athletes of the century.
A stroke in 2001 put a sudden stop to her visits toKurys. After an II-month recovery, she regained herspeech and was able to walk supported by a walker.
Until then Kamenshek liked to drive her van aroundthe country sightseeing. Whenever she got to Phoenix,she stopped to play a round.· of golf with her oldfriends, Kurys and pitcher Helen Nicol "Nicky" Fox,and talk about the old days.
Kammie remembers the final playoff game againstthe South Bend Blue Sox in 1949. With Rockfordleading 1-0, the Sox put a runner on third, the batterbunted, and "I came charging in and was able to tagthe runner out at home and throw the batter out atfirst. I had sense enough not to throw it to the catcherbut continued on in for the tag, which won us the pennant:'
Another year the Peaclles played SOpllY'S RacirleBelles for the title. Rockford went into game six trailing three games to two but won it to tie the series.
"That kind of broke their spirit, and we won theseventh game, like the Angels did against the Giants:'
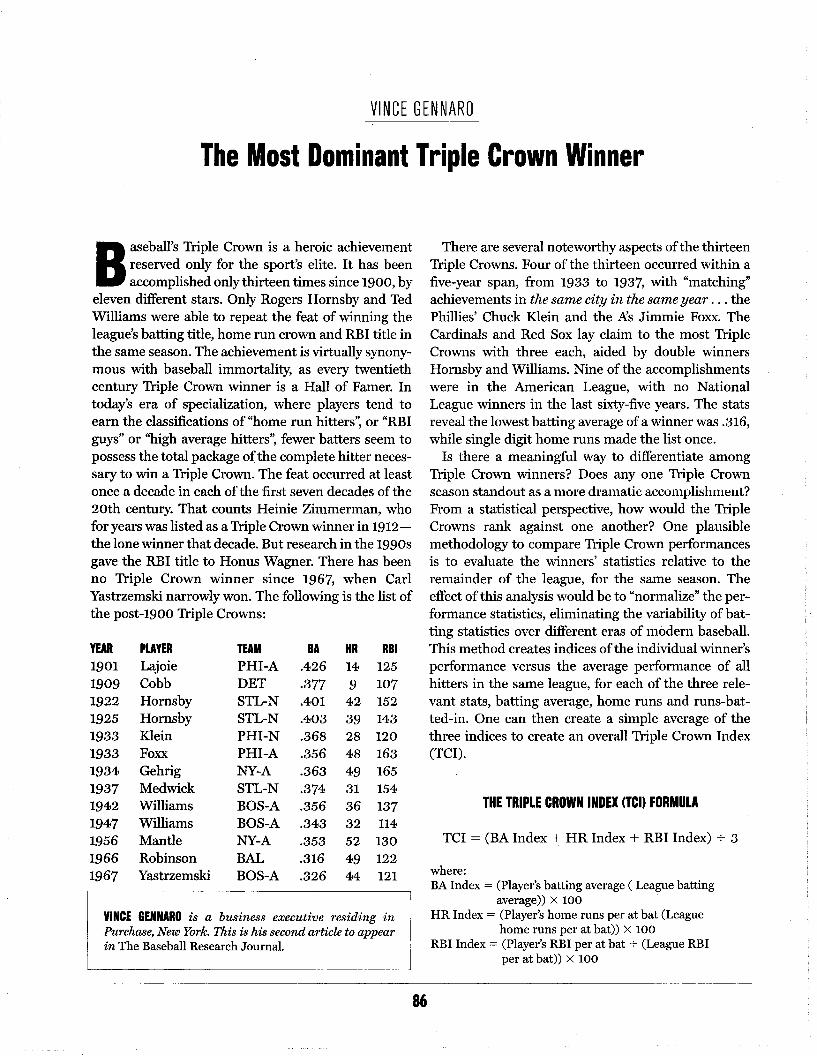
VINCE GENNARO
The Most Dominant Triple Crown Winner
Baseball's Triple Crown is a heroic achievementreserved only for the sport's elite. It has beenaccomplished only thirteen times since 1900, by
eleven different stars. Only Rogers Hornsby and TedWilliams were able to repeat the feat of winning theleague's batting title, home run crown and RBI title inthe same season. The achievement is virtually synonymous with baseball immortality, as every twentiethcentury Triple Crown winner is a Hall of Famer. Intoday's era of specialization, where players tend toearn the classifications of "home run hitters", or "RBIguys" or ''high average hitters", fewer batters seem topossess the total package ofthe complete hitter necessary to win a Triple Crown. The feat occurred at least011ce a decade ill·cacll of the first seven decades of the20th century. That counts Heinie Zimmerman, whofor years was listed as a Triple Crown winner in 1912the lone winner that decade. But research in the 1990sgave the RBI title to Honus Wagner. There has beenno Triple Crown winner since 1967, when CarlYastrzemski narrowly won. The following is the list ofthe pQst-l9QQ Triple Crowns:
YEAR PLAYER TEAM BA HR RBI1901 Lajoie PHI-A .426 14 1251909 Cobb DET .377 9 1071922 Hornsby STL-N .401 42 1521925 Hornsby STL-N .403 39 1431933 Klein PHI-N .368 28 1201933 Foxx PHI-A .356 48 1631934 Gehrig NY-A .363 49 1651937 Medwick STL-N .374 31 1541942 Williams BOS-A .356 36 1371947 Williams BOS-A .343 32 1141956 Mantle NY-A .353 52 1301966 Robinson BAL .316 49 1221967 Yastrzemski BOS-A .326 44 121
VINCE GENNARO is a business executi've residing inPurchase, New York. This is his second article to appearin The Baseball Research Journal.
86
There are several noteworthy aspects ofthe thirteenTriple Crowns. Four of the thirteen occurre<;l within afive-year span, from 1933 to 1937, with "matching"achievements in the same city in the same year . .. thePhillies' Chuck Klein and the iV..s Jimmie Foxx. TheCardinals and Red Sox lay claim to the most TripleCrowns with three each, aided by double winnersHornsby and Williams. Nine of the accomplishmentswere in the American League, with no NationalLeague winners in the last sixty-five years. The statsreveal the lowest batting average ofa winner was .316,while single digit home runs made the list once.
Is there a meaningful way to differentiate amongTriple Crown winners? Does anyone Triple CrownseaSOll stal1dout as a 1110re draillatic accoll1plislllllelll?From a statistical perspective, how would the TripleCrowns rank against one another? One plausiblemethodology to compare Triple Crown performancesis to evaluate the winners' statistics relative to theremainder of the league, for the same season. Theeffect of this analysis would be to "normalize" the per-
ting statistics over differellt eras of 1110derl1 baseball.This method creates indices ofthe individual winner'sperformance versus the average performance of allhitters in the same league, for each of the three relevant stats, batting average, home runs and runs-batted-in. One can then create a simple average of thethree indices to create an overall Triple Crown Index(TCI).
THE TRIPLE CROWN INDEX (TCI) FORMULA
TCI = (BA Index + HR Index + RBI Index) -;- 3
where:BA Index = (Player's batting average ( League batting
average)) X 100 'HR Index = (Player's home runs per at bat (League
home runs per at bat)) X 100RBI Index = (Player's RBI per at bat + (League RBI
per at bat)) X 100

THE BASEBALL RESEARCH JOURNAL
The TCIs could then be compared for each TripleCrown performance, effectively ranking the player'sperformance versus his peers. The results are:
By this methodology, 1Y Cobb's 1909 seasonemerges as the most dominant Triple Crown win. Hismost impressive statistic was his ."377 batting average,wining the title by 31 percentage points over the A:.sEddie Collins, in a year when the AL batted only .244,and only seven players batted over .300. Cobb's batting average index relative to the league was 155, ahigh for all Triple Crown winners. Also, Cobb's nine
Triple Crown season in the NL for the Phillies.Klein won the National League HR crown with a
modest 28 four-baggers. Third place in the TripleCrown derby was Ted Williams' first win in 1942,aided by his RBI dominance. Williams' 137 RBItopped DiMaggio's second best 114 in a year whenonly 5 players drove in 100 or more runs. It is alsonoteworthy that both of Hornsby's Triple Crownswere statistically comparable to one another, ranking4th and 5th all-time. Five Triple Crown winners alsowon the major league Triple Crown, meaning theirbatting average, HR and RBI totals were tops in bothleagues ... Cobb, Hornsby (1925), Gehrig, Williams(1942) and Mantle.
While there may not be a "weak" Triple Crown, statistically speaking, the least impressive Triple Crownaccomplishment was Frank Robinson's 1966 seasonwith the Orioles, his first in the American League. Infact, Robinson's .316 batting average was lower thanthat of five National Leaguers. Also of note is the fivelowest ranked Triple Crown victories include the mostrecent four, Williams' 1947, Mantle's 1956, Robinson's1966 and Yaz's 1967. At the top of the list in th~ "nearmiss" category is Babe Ruth's legendary 1921 seaS011.Ruth's .378 bating average trailed two Tigers~
Heilmann (.394) and Cobb (.389)-preventing himfrom winning the Triple Crown. However, hIS homerun dominance (59 vs. the "runnerup" at 24) and RBIdominance (171 vs. the "runner up" at 139), makes itone of the most dominant
actlle~V'es a Crown 21stcentury will certainly be heralded, regardless of hismargin of victory in anyone statistical category.Nonetheless, as we strive to gain perspective on historical accomplishments over more than a century'stim.e, it is interesting and useful to attempt to measure"degrees ofgreatness:'
HR RIINDEX INDEX Tel
IAINDEXPLAYERRANK YEAR
1 1909 Cobb 155 581 244 3272 1933 Foxx 130 590 233 3183 1942 Williams 139 543 246 3094 1925 Hornsby 138 523 233 2985 1922 Hornsby 137 548 207 2976 1934 Gehrig 130 529 221 2937 1901 Lajoie 154 428 218 2678 1933 Klein 138 428 204 2579 1956 Mantle 136 381 199 23910 1947 Williams 134 374 196 23511 1967 Yastrzemski 138 344 216 23312 1937 Medwick 138 336 215 23013 1966 Robinson 132 338 207 226
AVERAGE 138 457 218 271
hit in the entire AL in 1909. He also led the league intotal bases, hits, runs scored, slugging average andstolen bases.
Ironically, Cobb hit for a higher average in seven ofthe next 10 seac;;ons. In possibly his best season, 1911,Cobb batted .420 with 8 home runs and 144 RBI. Inthat glorious season, Cobb won the batting and RBItitles, but trailed Philadelphia's Frank Baker by threehome runs, and was denied a second Triple Crown.Ranking second to Cobb's 1909 win is the 1933 seasonof Jimmie Foxx. While Foxx was not as dominant inthe batting average category, winning the title by 20percentage points and a 130 index to the AL battingaverage, he dominated in the home run category. His48 HR's topped Babe Ruth's 34 and indexed at 590 tothe AL (on a per at bat basis), as only four AmericanLeaguers hit over 20 home runs. Further testimony toFoxx' homer. prowess in '33 occurred cross-town asChuck Klein was duplicating the feat with his own
87

DICK CRAMER
Preventing Base HitsEvidence that Fielders Are More Important Than Pitchers
Amost surprising discovery about baseball wasreported several years ago by Voros McCracken
·. on various Web sites. Despite their individualefforts, major league pitchers seem to have almostidentical abilities to prevent base hits. Of course, theydiffer greatly in how often they yield strikeouts, walks,and home runs. There are also large and consistentvariations in the "ground-balI-yielding" tendencies ofpitchers. But once a batted ball is put into play, nomatter whether in the air or on the. ground, the frequency ofbase hits resulting is essentially the same fora Jimmy Anderson as for a Randy Johnson.
This well-confirmed fact is all the more surprisingwhen it is remembered that a pitcher is supported byeight otllel" fieldel·s, wllose onlyjolls arc to COIIVC:U"t asmal1Y batted balls as possible into outs while minimizing advancement of any baserunners. Surely there aredifferences in fielding skill, even though it has provenvery difficult to measure these differences and toassess their values to their teams. For example, fromits very first recording date during 1981 spring train-
STATS has to andobservational data that would
allow them to "rate fielders:' But the Zone Ratingsthat have resulted are little more convincing thanRange Factors.
Could it be that the sm,a.ll differences that do exist in''batting average per batted ball ill play" (BABIP frol11now on, as suggested to me by Rob Neyer), amongpitchers and among teams, are more strongly affectedby the fielders' skills than by the pitchers' skill? Thisresearch report describes four studies to address thisquestion. In summary, three of the four resultsobtained agree in strongly suggesting, "Yes. Fielders
DICK CRAMER is best known as founder ofSTATS, Inc.,and creator ofmuch ofits software. He is a pastVP andboard member ofSABR. For the last twenty years hisday gig has been ChiefScientific Officer ofTripos, andcurrently on most Santa Fe Saturday afternoons he canbefound pla.ying Dixielandjazz at Evangelo's.
88
collectively seem to have a much greater effect onBABIP than do the pitchers", while the fourth result isnot inconsistent with this statement.
Many of the following studies share a methodological point ofview. Effects are real ifthey tend to correctly predictfuture effects. Effects that are not persistentare the results ofrandom chance, or luck - in this case,the at'em screamers or wind-blown bloopers, whichactually seldom even out in 162 games. To decidewhether or not an effect is predictive, we may askwhether an effect that shows up in a particular year,say, 1997, is observed again in the next year, 1998. Andwe look at all the examples we can find, for the smalleffects that haven't been established in 162 games maybe(~Olrle signifieant over a cleeacle ofmajor league play.In baseball analysis, this general "persistency"approach seems to have first been applied to "clutchhitting" in the early 1970s, when only two seasons ofrelevant data existed.
Of course, this point ofview is also that of most scientists and statisticians in addressing many practical
old one?" A widely used yardstick when statisticianscompare two sets of numbers (such as 1997 vs. 1998)is r, the Pearson correlation coefficient, which variesfrom 0.0 (no relationship between these sets) to 1.0(there is an exact relationship) and has a sign that willbe eitller positive (tIle 11ul11bers tel1d to vary ill tIlesame way) or negative (the relationship is consistentbut backward-for example, the relation between ERAand WHIP among pitchers) .. It is also useful to squarer (r X r or r2 ), because the resulting r2 expresses theproportion of the differences among one set of numbers that can be predicted by knowing the other set.
A second underlying point ofview here, conceptually the same as par runs in Total Baseball, is a focus onteam or player performance above or below the leagueaverage. As Pete Palmer was the first to stress, teamswin or lose games not, say, because their team battingaverage is .270, but because theirteam batting average is better or worse than the other teams' battingaverages. Here we will be considering only the num-
THE BASEBALL RESEARCH JOURNAL
ber of hits yielded, above or below the "expected" orleague average value. Expressed as a formula, for apitcher- or team-season, this value is calculated as:
Hits Prevented =
Lg.BABIP X (3 X IP - K + H - HR) + HR - H
where Lg.BABIP =(Lg.H- Lg.HR) (3 X Lg.IP - Lg.K + Lg.H - Lg.HR)
Hits Prevented will be positive whenever thedefense is more effective than average (whetherbecause ofsuperiority in fielding, in pitching, in homepark effect, or in luck) and will be negative for weakerthan average performance. The sum ofHits Preventedover all the pitchers or teams in a league will be zero.(This formula differs a bit from McCracken's, but notin any way that affects the conclusions.)
Finally, the scope ofthese studies was the 11 seasonsfrom 1991 to 2001, including the strike season of1994. These seasons provided 10 consecutive-seasoncomparisons.
To begill witll, lll~ lJ.uestiol1 of wlletller the pitchersthemselves have any effect on BABIP was reexamined.There were 945 instances in which an individualpitcher worked a total of 200· innings in consecutiveseasons, all for the same club (the 945 were identifiedby hand, almost certainly yielding an undercount, butan unbiased one). The r of Hits Prevented over these
.;:) ...a,"'~';:)"'~,",4CU~J significant effect on BABIP. However asa practical matter that effect is very small. Squaring ryields the predictability of Hits Prevented in year 2,given the result in year 1, as a value of .026 or 2.6%.
RESULT 1 Hils Prevented can be compared for consecutive team-seasons as well as for consecutive individual pitcher seasons. There are exactly 308 such comparisons for these sevell consecutive seasons. The rover these 308 paired team-seasons is .369, consider- .ably higher than pitcher-seasons, especially when r issquared to yield a 13.6% predictability. So the persistence of Hits Prevented from one season to the next isabout five.times greater for teams than for individualpitchers. I have shown directly that this increasedteam persistence is not caused by the individual pitchers. And turnover in pitching staffs is rather high anyway. It seems reasonable to attribute the much higherpersistence of team Hits P1"eVeTtted to a less variableinfluence on BABlp, the skill ofthefielders.
Park effects also play an important role. For example, removing the most extreme park effect, theRockies'eight comparisons, yields r = .323, or a10.5% predictability, for the remaining 299 cases.Also the consecutive team-season correlation for parkeffects has a relatively large r of .535 (307 cases,excluding the Astros move).
Then could the park effect account for all ofthe season-to-season persistence ofteam BABIP? TheSTATSMajor League Handbook has presented completehome/away team statistics for the last decade. Sothese calculations were repeated for 1992-2001 awaydata only, excluding 1995, which for various reasonswas not available. The r for the resulting 199 awayteam BABIP persistence was .300, a 9.0% predictability.
Summarizing, from the r 2 values for all these various correlations, there is an overall team BABIP season-to-season persistence of 13.6%. If the smaller setof away-game BABIP data, with the park-neutral persistence of9.0%, is considered sufficiently representative, then the average home park effect on BABIP persistency becomes 4.6% (the difference). 'rhe individual pitcher season-to-season persistence of BABIP is2.6%, .an overestimation of the "pure pitching" effectsince the much larger park and fielder effects thatmust affect individual pitcher BABIP persistencewere ignored. The only other persistent entity appearsto be the fielders, so they are left responsible for the
BABIP, the largest single factor.Perhaps the most important point to note about
BABIP is that 86.4% is not persistent at all. For themost part, differences among teams in their hits yielded, per ball in play, appear to be random variations,in~'lucky bounces" and "at'eln balls:; Pete Palrner reportsthat this conclusion is also expected· on the basis ofstatistical theory. League BABIP rates are currentlyabout 0.290 (in other words, the league-average batter currently hits about .290 when he puts the ball inplay, excluding home runs). However, the BABIP offan individual pitcher in a season will ralldoll1ly vary,just as the number of heads in 100 actual coin flipswill usually not be exactly 50. Pete Palmer has recently calculated that the actual historical variations inBABIP for individual pitchers behave indistinguishably from variations in coin flips· (for the same distributions of sample sizes). (However, just to avoid anypossible confusion, year-to-year persistence is relatively much greater in individual batting statistics, or
89

THE BAS EBALL RES EAR CH J0URN AL
in walks, strikeouts, and home runs off pitchers, or intraditional fielding statistics-and again in accordwith statistical theory, because for all these other statistics the variations among individual players' totalsare much larger than the theoretically expected random variations.)
Ifmost ofthe variations in BABIP among teams andespecially pitchers are actually random fluctuations,who if anyone should be held accountable? From thesimple accounting balance viewpoint of the classicalbox score, the traditional practice of charging the hitsto the pitchers and only the errors to the fielders willnot be easily improved. However, from the point ofview of the baseball analyst, who is mainly trying tobetter understand how individual players help teamswin and lose games, to say nothing ofthe point ofviewof all the spectators, it is difficult to believe that fielders differ only in their frequencies of errors, doubleplays, and passed balls. And fielders are indeed foundto have a greater effect than pitchers or parks on teamHits Prevented, here on the basis of year-to-year persistence arguments. The following is the same question, examined from a different perspective.
RESULT 2 There already exist direct if incomplete statistical measurements of fielding skill, errors, doubleplays per opportunity, and passed balls. We now havea candidate indicator for another aspect of fieldingskill, Hits Prevented. If in fact Hits Prevented also
Although the .273 between conventional fieldingand Hits Prevented is modest, it is the largest association in the table. Furthermore, note the insignificant(and negative!) correlation between Hits Preventedand pitching skill. If Hits Prevented instead reflectsmostly pitching skill, as all of us believed until veryrecently, this'is a very surprising result. Hits Preventedcorrelates with conventional fielding skills morestrongly than any other pairing ofthefour skills. Thesecond largest correlation is between offensive skilland hits prevented, which can easily be interpreted asa tendency for good hitters also to be good fielders,but is very hard to understand if hits prevented arethe pitchers' responsibility.
Park effects must also affect these measures ofteamskills-i.e., as an important cause ofthe weak negativerelation shown between batting and pitching skills.
RESULT 3 The approaches used to obtain Result 1 andResult 2 can be combined by forming the correlationmatrix for 308 consecutive team-season comparisonsamong the four team skills. (Results 2 and 3 are actually independent, despite any contrary impression, asthere is very little tendency for consecutive team-season differences to correlate with the values formingthose differences. The actual is range from .0006 to.070 for the four team skills.)
Here is the outcome:
in Hits Prevented should correlate with team superiority in errors, double plays, and passed balls. Andindeed there is such a positive correlation. For the 338team comparisons in this study, the r value betweenconventional and unconventional fielding skill is ..273(see tIle Appelldix'for 110W conventioIlal fielding skillwas summarized).
There are ofCOllrse two more important team skills,batting and pitching. Note that for this purpose teampitching skill is being calculated with all pitchersassigned the same league average BABIP (see theAppendix for this too). H.ere is a "correlation matrix"of r values showing how all these four skills are related to each other, for these 338 team comparisons.
.193-.008 -.038
The saIne teIldellcies exist as ill illdividual seasollskills, and to a somewhat greater extent. Consecutiveseason changes in team Hits Pre1.JenJed stronglyfollol£)changes in.conventionalfielding skill but are unrelated to changes in (BABIP constant) pitching skill.
RESULT 4 Ifdifferences in BABIP are determined moreby the fielders than by the pitchers, then pitchers whochange teams should have a relatively small season-'to-season persistence in their Hits Prevented (difference between actual hits allowed and those with constant BABIP). There were 348 pitchers in this 19902001 sample who over consecutive seasons appearedwitll lllore tIlall olle tealll. TIle 'I'value for seaSOll-toseason correlation in this group's Hits Prevented was
-.209.145
-.013
.326
.087
.149
Conventional fielding (CF)Hits Prevented (HP)Offensive (batting) (B)Pitching skill (P)
BHPCF
.273
.061
.112
Conventional fielding (CF)Hits Prevented (HP)Offellsive (battillg) (B)Pitching skill (P)
90

THE BASEBALL RESEARCH JOURNAL
.154. Although this value is less than the rvalue of .162for the 945 pitchers who worked for only one team,and thus the change is in the expected direction, thedecrease is too small to have statistical significance.
TEAM PERFORMANCES A less objective but much moreinteresting way to continue looking at this question isto consider individually some of the largest, less likelyto be chance, season-to-season changes in team HitsPrevented. Are changes in the fielders a reasonablecause? In the following discussion, the numbers shownare not Hits Prevented, but the extra (fewer) runs thatthese extra (fewer) hits are expected to create.
By far the best Hits Prevented team during theentire 1990-2001 era was the 2001 Mariners, at +128runs while the worst was the 2001 Indians, at -79(fielding skill prevailing when they met in the postseason!). The second and third best teams were thesurprising second-place 1998 Reds (+91) and 1991White Sox (+84), the fourth and fifth the 1990 and1997 Athletics (+77 and +70), and the sixth anotherrecord setter, the 1998 Yankees (+60). The second andthird worst tealllS, the 1993 and 1999 Rocl{ies ("'75and -72), were strongly influenced by an unfavorablepark effect. The fourth worst was the 2001 Rangers(-71) the fifth worst was the 1990 Braves (-62), andthe sixth the 1997 Rockies (-60).
The second largest change in Hits Prevented runswas a +87 run improvement by the 1991 Braves overthe team.improve the defense and "support the young pitching"is supported by changes at every field position exceptcatcher: Lemke over Treadway (2b); Belliard overBlauser (ss); Pendleton over Presley (3b); Otis Nixonover Dale Murphy (cf); .Justice over Lonnie Smith;Bream for Justice (lb). The pitching staffwRs mostlyunchanged.
An even bigger improvement is the last two years inSeattle, where a +67 runs from 1999 to 2000 (fifthlargest) was followed by the greatest year-to-yearimprovement in the 1990-2001 era, of +90 runs from2000 to 2001. The major 1999-2000 changes wereCameron for Griffey (cf), David Bell for Russ Davis(3b), and Olerud for Segui (lb). The 116 wins resultedafter McLemore was replaced by Boone (2b), Buhnerby Suzuki (rf), and A-Rod by Guillen (ss). Again, thepitchers were mostly the same, although some of thisimprovement is the park change.
Large negative changes seem as much the result ofinjuries as conscious decision making. For example,
91
the second worst change of -91 runs in Tampa Bay'ssecond year (1998 to 1999) saw many fewer gamesplayed by defensive stalwarts Cairo, Stocker, Boggs,and McCracken but only one intentional change, inleft field. A slightly larger decline (-92) occurred in theturmoil of the Brewers' last two AL seasons (1996 to1997), notable being departures by Jaha and Vaughnand arrivals by Gerald Williams and Burnitz.
In summary, several independent analyses of theavailable data converge in suggesting that the fieldershave much more influence on opponents' hits per batted ball in play (BABIP) than do the pitchers, in current major league play. BABIP season-to-season persistency is much greater for teams than for individualpitchers. And even more important, team hits allowedper batted ball correlate positively with other measures of fielding skill but negatively with other measures of pitching skill. Home park effects are also significant. While any other major influences on hits perbatted ball remain either unknown or, much morelikely, random and nonexistent, there seems quiteenough justification to assign the total ofteam BABIPvariation to teanl fieldillg ratller tIlall ilulivitlualpitching.
Of course, team fielding is the summation of theindividual fielding performances that we all mostwant 'to understand. So these findings about BABIPoffer hope for significantly better evaluations of individual fielders. Analysts of individual fielding per-
metic of the defense. There will be three putouts perinning, regardless ofhow many baserunners and runsoccur in between those putouts. So the better one'steammates field, the fewer one's own chances torecord those individual putouts and assists tllat wecall objectively COUlll allU cUlllpare. However, withBABIP obviously a measure of those baserunnersbetween the putouts, if BABIP differences may beattributed IIlOStly to fielders, then the arithilletic ofbaseball rules need no longer dominate our numericalcomparisons of individual fielders. Although the nextdetails will no doubt be debated thorollghly, theyseem clear in principle, and creative analyses likethose by Bill James in Win Shares and by groups likethe Baseball Prospectus have already made substantial progress in this direction.

THE BASEBALL RESEARCH JOURNAL
APPENDIX
Here is an example of the spreadsheet formula used in this work to calculate conventional fielding parruns, here for the 2000 Angels:
0.7 X (112 - AMS) + 1 X (ANS - 162.9 X ((AAS + ADS + AES) -7- 2192.4)) + 0.25 X (10.7 - AOS)
It is the sum of three terms, which from left to right account for errors, double plays, and passed balls.The spreadsheet cell references are to specific Angel team totals. The constants are either the league average for a team or the run value attributed to an error, DP, or PB.
Thus the average AL 2000 team made 112 errors, while the Angels made 134 (referenced by AMS).Those 134 - 112 = 22 extra errors are assumed to have cost the Angels about 15 runs on defense (0.7 X22). Passed balls are handled in exactly the same way. Expected double plays are weighted by the numberof opportunities, approximated by the number of Angel opponents reaching base by hit (AAS), walk(AD5), or HBP (AES). The league average for opponents reaching base in the 2000 AL is 2192.4, as shown.
Here is an example of the much more intricate pair of formulae used to convert Hits Prevented into parruns allowed, applicable either to Pedro Martinez or the Boston Red Sox.
Expected runs allowed =
11950 - 1.068601X(29710-(AA77+3XAB77)) X(30881.75-(AA77+AD77+AE77+(AG77+AH77)-7-4))
(82045 - (Z77X3 +AA77))
Par pitching runs = (119S0 -7- 20141) X Z77 X 1.0072 - "Expected runs allowed"
The first formula expresses two basic ideas:In the spirit of the "component EM' that Bill James has promulgated, expected runs allowed are calcu
lated using a runs-created-type formula for pitchers.Primarily to make the total of individual pitchers runs allowed very nearly equal to the team runs
the league after omitting the contributions of the player or the team. The RC by the player· or team thenbecomes the difference between the actual RC by the league and the RC calculated as just described (afterthe pitcher or team is omitted).
So the first formula expresses the difference between 11,950, the runs actually scored offAL pitchers in2000, and three multiplied terms divided by a fourth. As a detailed example, the second term is an approximation of total bases yielded (hits yielded + 3 X HR yielded), where hits yielded can be either actual orcalculated by the league average of BABIP. Its 29,710 value is the "total bases yielded" for the league (calculated using actual hits) and the "-(AA77+3XAB77)" then removes the pitcher or team "total bases yielded" from this league "total bases yielded".
The third term is an "on-base allowed;' expressing hits, walks, HBP, and (WPs and balks) in a similarway. The fourth divisor term is an "at-bat;' approximated as (3 X IP + hits).
The first constant term (1.068601) is the ratio of the actual league runs allowed to those that are calculated for the league, omitting team or player subtraction-in this instance 29710 X 30881.7S -7- 8204S.
The par pitching runs formula is much simpler, again the difference of two terms, with the first beingthe number of runs an average pitcher would yield in the same number of innings (Z77) in a neutral park(1.0072 being the 2000 Fenway correction) and the second the output of the first formula.
The par runs resulting from Hits Prevented (used to obtain Results 2 and 3) is the difference in runsallowed (or par runs allowed, same thing) calculated as above either (1) with actual hits allowed vs (2) withhits calculated at the league average BABIP rate.
92
ROGER GODIN
Not Quite Marching Through GeorgiaDon Larsen and the Atlanta Crackers
The cover ofTim Darnell's bO.ok Southern Yankeesdescribes the now virtually forgotten AtlantaCrackers as "one ofminor league baseball's most
successful and storied franchises:' Over a 65-yearperiod from 1895 through 1960, playing largely in theSouthern Association, the Crackers won 17 pennantsand six playoff titles.
The 1954 Crackers were particularly notable, finishing first at 94-60 and then eliminating Memphis andBirmingham in the playoffs. This allowed them toadvance to the Dixie Series against Houston, wherethey came back to win the last two games and theseries four games to three. Most of those who madethe season possible were gone the following year,iIll1lul1ing flttllre major leaguers Frallk Torre andChuck Tanner. Among those still around in 1955 wereolltfielder Bob Montag, who had hit .323 with 105RBI, catcher Jim Solt, and second baseman FrankDiPrima. The latter two had hit .321 and .316 respectively.
It was common in those halcyon days for major
north, playing exhibition games against minor andmajor league clubs. The New York Yankees, unlike theCrackers, were not defending champions when theybroke from their Florida camp at St. Petersburg onMarch 31. Their first stop on a Southern Associationtour was tIle llext night in Atlanta. Fornler YallkeeGeorge McQuinn had succeeded Whit Wyatt asAtlanta manager, and he sent ex-Brooklyn DodgerClyde King to the mound. Yankee nlallager CaseyStengel countered with Whitey Ford and his basiclineup of Rizzuto, Mantle, Berra, et. al.
The game was expected to be the first of a numberof easy tune-ups, but it would prove to be somethingquite different. In the top of the second Hank Bauer
ROGER GODIN lives in St. Paul, Minnesota, and is the teamcuratorfor the Minnesota Wild. He is the author ofThe1922 St. Louis Browns: The Best of the AmericanLeague's Worst.
93
walked, advanced on a wild pitch, and scored on GilMcDougald's single. The Crackers countered with a400-foot home run to the left-field scoreboard by Soltin their half of the inning. McQuinn brought in DickRoberson in the fifth, and he gave up the go-aheadrun on a walk to Andy Carey and Mickey Mantle'sdouble. The Yankees added a single run in the eighthon two walks and an error, and then got another in theninth offStu Alton when Hank Bauer walked with thebases loaded.
While the 4-1 lead was close by the standards ofsuch games, there appeared to be little concern thatWhitey Ford would not be the first Yankee pitcher togo nine innings that spring. Going into the bottom ofthe nirltll lIe llad scattered five llils arId struck outnine. With one out, DiPalma got an infield single, EarlHersh walked, and Solt got another infield single toload the bases. Jack Caro then followed with a hardsmash off Andy Carey's glove into left field, scoringDiPalma and Hersh. With Solt on third and Caro atsecond, Ford struck out pinch-hitter Bill Casey for the
bases. Stengel then ill right Don Larse11for his first appearance as a Yankee. He had beenacquired the previous November from Baltimorealong with Bob Turley and others.
Despite a 3-21 record in 1954, tIle Yallkee lllallagerwas 11igh on the Indiana native. He told the New YorkTimes' Louis Effrat: "Larsen knows how to pitch. I'vebeen watching him throw to hitters in practice.There's no reason why he Sllouldll't be a big winnerwith this club. He's big and strong and can fire theball. ... Larsen reported with a sore arm, but it seemsto be all right now. lWice I had him listed to work, buthe was rained out of his turn each time:'
Larsen would be throwing to right-hand hittingoutfielder Bob Thorpe, who had a brief 110-gamemajor league career with the Boston-MilwaukeeBraves over a three-year period, where he hit .2.51 withsix home runs. He took ·an instant liking to Larsen'sfirst pitch and drove it to right center for a two-rundouble as Solt and Caro scored for the 5-4 win.
THE BASEBALL RESEARCH JOURNAL
The 7,209 fans at Ponce de Leon Park were delighted, as was the Atlanta Constitution, which put thegame story on the first page with the headline:"Crackers Topple Yanks 5-4, on Thorpe's Blow:' TheYankees took out their frustrations on Birminghamand Memphis 11-1 and 13-1 respectively in their nexttwo games.
Whitey Ford was charged with the loss, but hewould go on to win 18 games and Larsen would chipin with nine as the Yankees won their 20th pennant,but lost the World Series to Brooklyn. Larsen's memorable moment would, of course, come on October 8,1956, with his 2-0 World Series perfect game triumphagainst the Dodgers.
Surprisingly enough, prior to the Crackers' memorable win, the Atlanta team had dropped two consecutive games to Fort McPherson, Georgia. This was ata time when Army teams were composed ofmajor and
minor league players serving their military obligation.Frank Bolling and Norm Siebern were both in the soldiers' lineup. The Crackers were slated to play theDetroit Tigers on Saturday night, but the game wasrained out, and a doubleheader rescheduled forSunday. Atlanta continued their major league domination by winning the nightcap, 8-0. Despite thesehigh points it would not be a good season for theCrackers. They finished seventh at 70-84, as ClydeKing took over from George McQuinn before the season was out.
REFERENCESDarnell, Tim. Southern Yankees: The Story of the
Atlanta Crackers, self-published, 1995.Atlanta Constitution, April 1, 2, 4, 1955.
New York Times, April 2, 1955.
Twin Bills fill the Bill Doubleheaders are an increasingly rare part of baseball. Major league baseball no longer has them as part of the regular season schedule, so it is left to rainouts to produce games
more teams located in southern climates have reduced the nnmher of rainouts..Perhaps the last place to find doubleheaders on a regular basis is the minor leagues-even ifthey are only
seven inning games. Perhaps no league has ever had as many doubleheaders as the 1947 Eastern League.Because of rotten weather in the spring that made a mess ofthe Eastern League schedule, all teams were
forced to play a.n UntISllally high n\Imber oftwinbills. For example, the lTtica BI\Ie Sox played 35 two"'gamesets. Yes, tllirty-five. all JUlIe 9, ULlca 111eL EIllllra 111 LIle IirsL of Iive sLraigIIL doublelleaders. Playillg LeI!games in seven days against three different opponents didn't adversely affect the Blue Sox as they won nineof the ten. In fact, playing 35 doubleheaders for the season actually helped Utica win the Eastern Leaguechampionship.
The Blue Sox were incredibly successful in these twinbills. They split 17 of them, and they swept bothgames 17 times. Only once did they lose both games. This extraordinary 51-19 record (.729 winning percentage) was a major part of the club's overall 90-48 record. It is unlikely that many teams have played asmany doubleheaders in a season-and even more improbable that they could beat the winning percentageof the 1947 Utica Blue Sox.
- seon FIESTHUMEL
94

RON SELlER
Forbes Field, Hitter's Nightmare?
Table 2. HOME RUN FACTORS-FORBES FIELD4
NL AVERAGE380382383374373375373
FORBES FIELD395395388390390390390
YEAR1910192019251930193519401946
Table 1. PARK SIZE 1910-46AVERAGE OUTFIELD DISTANCES (It)
TIME PERIOD FORBES FIELD1910-19611920-29 571930-39 621940-46 681909-46 (average) 62
Forbes Field and the entire National League is shownin the following table.
Factor adjusts for the home team'sers' proclivities for hitting and. giving up home runs.By definition, the league average Home Run Factor isequal to 100. The following table shows the HomeR\.ln Factors for Forbes Field:
The second item which leads to Forbes Field's reputation as a poor park for hitters was the undisputed evidence of relatively few home runs being hit at ForbesField. The concept of a park Home Run Factor hasbeen developed to measure the number ofhome. runsat a given park relative to the league average for that
Compared to the average NL park, Forbes Field wasabout 40% below average in home runs. By contrast,Forbes Field was always regarded as a good park fortriples. How much above the average NL park has notbeen known. Indirect evidence supporting the view of
RON SELTER is an economist who lives ill,' EI Segundao,CA. A member ofSABR since 1989, he ·has done researchon the minor leagues and on ballparks.
Forbes Field was one of the very first classic eraballparks (only Philadelphia's Shibe Park preceded it) to be built in America. It was the home of
the Pittsburgh Pirates for 62 seasons after it openedJune 30, 1909. Forbes Field has been regarded as aspacious park and a poor park for hitters. Only in the1947-53 seasons when the "Greenberg Gardens"reduced the left-field foul line distance by 30 feet, wasthe park considered friendly to hitters.
The conventional wisdom about Forbes Field isillustrated by the following quotations taken from various ballpark books:
"No no-hitter was ever pitched here. Given the factthat the Pirates, Grays, and Craws played here for 62years, tha.t is all illcredible statistic;' wrote PhilipLowry ill Gl'eell Cathedrals.1
"It was one of the most spacious parks in baseball,so much so that when slugger Hank Greenberg's contract was sold to Pittsburgh in 1947, he refused toreport unless the team moved the fences in;' and "...the park remained a nightmare for many hitters,nr''',,'1,ncr the
Ballparks: Then AndNow.2
"Strangely a no-hitter was never .'pitched in theentire history of Forbes Field;' Larry Ritter wrote inhis Lost Ballparks.3
Much of this conventional wisdom reflects twofacts: (1) Forbes Field was spacious·,'l~!Ore so than theaverage NL park in the time period·t909-46, and (2)during this period the park was not conducive to thehitting of home filns. How spacious Was Forbes Fieldrelative to the other NL parks? When it opened in·June 1909, only Redland Field in Cin~innatiwas larger. In the ensuing years, parks in other NL cities varied in size, but Forbes Field's overall size changed verylittle and was never less than 457, to center field. Acomparison of the average outfield distances for
95

THE BAS EBALL RES EAR CH J 0URN AL
Forbes Field. Babe Ruth hit hisfinal three home runs here on May 25, 1935.The last one, #714, cleared the rightfield wall, which had never been done before.
Forbes Field as a good triples park includes: (1) OwenWilson ofthe 1912 Pirates set the major league singleseason record for triples (36) while playing half hisgames in Forbes Field, and (2) in 18 seasons (1921-37)the Pirates led the NL in triples 14 times.
Except for the Home Run Factors, all of the aboveevidence consists of data that is either indirect ormerely suggestive. Recent research into NLHome/Road batting park has made available some
Forbes Field a poor park for hitters?
DEADBALL·ERA· For the last·three years of the deadballera (1917-19) Park Factors were computed for six batting categories based on the batting data for thePirates and their opponents in games at Forbes Fieldvs. uala fur Pirales gallIes ill all otller NL l>arks.5 Thereslllting Park Factors are as follows:
Table 3. FORBES FIELD PARK FACTORS 1917-19
Note that despite being dead last in home runs,Forbes Field was the second (behind Philadelphia'sBaker Bowl) best park for slugging. This result is dueto the marked superiority of Forbes Field for triples50% better than the average NL park. In general, inthe deadball era triples had a greater impact onoffense than home runs. For the three deadball seasons studied, the NL seasonal average was 67 triplesper team, nearly three times the average per team for
LIVELY BALL ERA For the nine-year time period 19281936 Park Factors were computed for six batting categories based on the batting data for the Pirates andtheir opponents in games at Forbes Field vs.' battingdata for the Pirates games in all other NL parks.5 Theresulting Park Factors are as follows:
Table 4. FORBES FIELD PARK FACTORS 1928-36
CATEGORYBatting AverageOn-Base Pet.Slugging Pet.2B3BHR
PARK FACTOR102100104
9515756
NL RANK342
4
1
8
CATEGORYBatting AverageOn-Base Pet.Slugging Pet.2B3BHR
PARK FACTOR104102101
9416162
NL RANK2
2
351
7
*All categories are rate data; (e.g., 2B are 2B per AB)
96
*All categories are rate data; (e.g., 2B are 2B per AB)
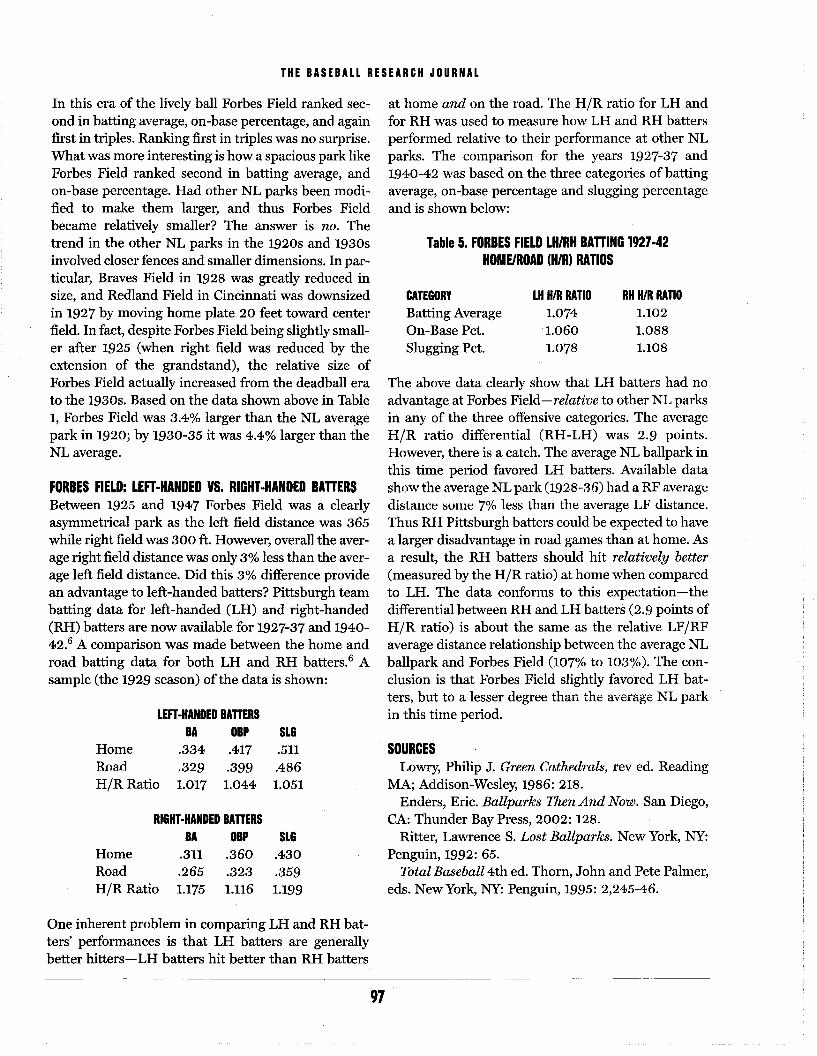
THE BASEBALL RESEARCH JOURNAL
Table 5. FORBES FIELD LH/RH BAnlNG 1927-42HOME/ROAD (H/R) RATIOS
at home and on the road. The H/R ratio for LH andfor RH was used to measure how LH and RH battersperformed relative to their performance at other NLparks. The comparison for the years 1927-37 and1940-42 was based on the three categories of battingaverage, on-base percentage and slugging percentageand is shown below:
RH H/R RATIO1.1021.0881.108
LH H/R RATIO1.074
'1.0601.078
CATEGORYBatting AverageOn-Base Pet.Slugging Pet.
The above data clearly show that LH batters had noadvantage at Forbes Field-relative to other NL parksin any of the three offensive categories. The averageH/R ratio differential (RH-LH) was 2.9 points.However, there is a catch. The average NL ballpark inthis time period favored LH batters. Available datashow tIle avel·age NL parlt (1928-36) llad a RF averag(~
distallce SOllIe 7% less tilall the average LF distance.Thus RH Pittsburgh batters could be expected to havea larger disadvantage in road games than at home. Asa result, the RH batters should hit relatively better(measured by the H/R ratio) at home when comparedto LH. The data conforms to this expectation-the,.h......f.,.,._"......+'n I between RH and LH batters ofH/R ratio) same as the relativeaverage distance relationship between the average NLballpark and Forbes Field (107% to 103%). The conelusion is that Forbes Field slightly favored LH batters, but to a lesser degree than the average NL parkin this time period.
SOURCESl~owry, Philip J. Green Cathedrals, rev ed. Reading
MA; Addison-Wesley, 1986: 218.Enders, Eric. Ballparks Then And Now. San Diego,
CA: Thunder Bay Press, 2002: 128.Ritter, Lawrence S. Lost Ballparks. New York, NY:
Penguin, 1992: 65.Total Baseball 4th ed. Thorn, John and Pete Palmer,
eds. New York, NY: Penguin, 1995: 2,245-46.
LEFT-HANDED BAnERSBA OBP SLG
Home .334 .417 .511, Road .329 .399 .486
H/R Ratio 1.017 1.044 1.051
RIGHT-HANDED BAnERSBA OBP SLG
Home .311 .360 .430Road .265 .323 .359H/R Ratio 1.175 1.116 1.199
In this .era of the lively ball Forbes Field ranked second in batting average, on-base percentage, and againfirst in triples. Ranking first in triples was no surprise.What was more interesting is how a spacious park likeForbes Field ranked second in batting average, andon-base percentage. Had other NL parks been modified to make them larger, and thus Forbes Fieldbecame relatively smaller? The answer is no. Thetrend in the other NL parks in the 1920s and 1930sinvolved closer fences and smaller dimensions. In particular, Braves Field in 1928 was greatly reduced insize, and Redland Field in Cincinnati was downsizedin 1927 by moving home plate 20 feet toward centerfield. In fact, despite Forbes Field being slightly smaller after 1925 (when right field was reduced by theextension of the grandstand), the relative size ofForbes Field actually increased from the deadball erato the 1930s. Based on the data shown above in Table1, Forbes Field was 3.4% larger than the NL averagepark in 1920; by 1930-35 it was 4.4% larger than theNL average.
FORBES FIELD: LEFT-HANDED VI. RIGHT-HANDED IAnERSBetween 1925 and 1947 Forbes Field was a clearlyasymmetrical park as the left field distance was 365while right field was 300 ft. However, overall the average right field distance was only 3% less than the average left field distance. Did this 3% difference providean advantage to left-handed batters? Pittsburgh team...... n ......' .......,rlO data for left-handed and rl!?:Jnt-JnaIlae~a
and 194042.6 A comparison was made between the home androad batting data for both LH and RH batters.6 Asample (the 1929 season) of the data is shown:
One inherent problem in comparing LH and RH batters' performances is that LH batters are generallybetter hitters-LH batters hit better than RH batters
97

CYRIL MORONG
RBI, Opportunities, and Power HittingOpportunities Significantly Affect RBI Totals
RBI have long been one of the staples ofmeasuring a hitter's contribution to his team's success.Sometimes a player is said to be "a good RBI
guy:' Newspapers and record books list the annualRBI leaders, scoreboards and broadcasters tell us howmany RBI a hitter has, almost as if getting them is aspecial skill, separate from power hitting or hitting foraverage. But RBI are also often criticized as beingmisleading since all hitters don't get the same numberofopportunities to drive in runs. One hitter might getmore RBI than another because he had more opportunities and not because he is somehow better at driving in runs. So the important question is: Exactly howmuch difference do RBI opportunities make?
Th,ey ma,ke a big differellce a,lld exactly how big callbe learlled froI11 statistical analysis. The followingequation, derived using the linear regression technique, explains a hitter's RBI per at-bat and the valueof opportunities:
EQUATION 1
RBljAB=.125XOPP+.194XAVG+.514XISO-.20
whereOPP = number of RBI opportunities per at-batAVG = batting averageISO ;;; isolated power
How does this work? Equation 1 predicts that JuanGonzalez WOllld get .206 RBI per at-bat becallse:.125X(1.67)+.194X(.297)+.514X(.271)-.20 = .206
Gonzalez actually had .205 RBI per at-bat. Theequation is also generally very accurate (I explain thestatistical results and the data below).
But first, what does the equation mean from a baseball perspective? With the coefficient on OPP being
CYRIL MORONG is a professor ofeconomics at San Antonio 'College in San Antonio, TX. He is originally fromChicago and is a life-long White Soxfan.
.125, two players who differ by, say, .15 OPP (90 RBIopportunities for a 600 at bat season), will end upwith an 11.28 difference in RBI over a 600 at-bat season (11.28 = .15X.125X600). This is significant inbaseball terms as well as statistically. Why look at a .15difference in OPP? This study includes all players (61)who had 6,000 or more plate appearances during the1987-2001 seasons and whose situational statisticswere listed on the CNN/SI Web site.1 Tino Martinezhad the highest OPP/AB at 1.69 for his career. Morethan halfofthe other players were at least .15 less thanthis, including other power hitters like Jose Canseco,Ken Griffey Jr., and Gary Sheffield. Barry Bonds waseven lower at 1.48. Martinez would get 15.79 (or.21X.125X600) more RBI than Bonds solely as aresult of having more opportunities.
For a single season, the differences in OPP can beeven greater. In 1995 for example, Paul O'Neill wasthe leader at 1.85 while Barry Bonds had 1.61.Everything else being equal, O'Neill would get about18 more RBI over a 600 at-bat season. So opportuni-ties in
Hitters vary quite a bit· in RBI opportunities. Forexample, the two lowest in OPP/AB were RickeyHenderson and Craig Biggio, at 1.36 and 1.39, respectively. The two highest were Juan Gonzalez and TinoMartinez at 1.67 and 1.69, respectively. Of COllfse,
Henderson and Biggio are both primarily leadoff menwhile Gonzalez (usually fourth) and Martinez (usually fifth or sixth) have been largely used in the middleof the lineup. But the difference between Rickey andTino (.33 OPP) would be 198 more RBI opportunitiesover the course of a 600 at-bat season. Just bout halfof that, say .15, would mean about 90 more.
An actual example supports the importance ofopportunities. Juan Gonzalez has a career average of.297 and an ISO of .271. Ken Griffey Jr. had .296 and.270, almost identical numbers. Yet Gonzalez had.205 RBI/AB or 123 RBI over a 600 at-bat season.Griffey had .187 RBIjAB or 112 over a 600 at-bat season. The difference results from Gonzalez having 1.67opportunities per at-bat while Griffey had 1.54.
98
THE BASEBALL RESEARCH JOURNAL
This says that the three variables are all significant atthe 1% level (or lower), meaning that there is less than
OPP = 7.25AVG = 3.35ISO = 22.25
Equation 1 if their true value were zero.Equation 1 also shows the bigger role played by
power hitting in driving in runs. Consider Players Aand B, who have the following statistics:
.482! (Again, assuming additional hits are singles.)But are all RBI opportunities of the same quality?
No, a runner on third is better than a runner on first.So a runner on third counted as a four-point opportunity, a runner on second as a three-point opportunity,a runner on first a two-point opportunity, and the batter as a one-point opportunity. So I ran another linearregression with points per at-bat replacing opportunities per at-bat.
The following equation shows the results:
RBI/AB=.069XPTS+.212XAVG+.479~ISO-.18
EQUATION 2
The r 2 is .969. The standard error is .00614 or just3.68 RBI for a 600 at-bat season. This result is evenbetter than the one summarized in Equation 1. Noticethat the value of ISO is still much greater than thevalue ofaverage, so power hitting is still the dominantforce. The three variables were all statistically significant at the 1% level. Equation 2 is very accurate, predicting to within six RBIs per 600 at-bats for 56 ofthe61 hitters. Also, a regression was run that includedopportunities from walks, as c0!1verted into points,with similar results.
What do these results mean in baseball terms? Withthe value ofPTS being .069, two players who differ by,say, .30 PTS, will end up with a 12.36 difference in
...............................................
aThis is significant in baseball terms as well as statistically. Why look at a .3 difference in PTS? JuanGonzalez had the highest, at 2.85. About halfthe players in the study were below 2.55. Barry Bonds, forexample, had 2.4. So with equal hitting performances,Juan Gonzalez would get 18.5 (or .45X.069X600)more RBI than Bonds solely as a result ofhaving moreopportunities and better quality opportunities.3
A hitter's RBI are determined by his ability to hit foraverage, hit for power and the quality and quantity ofhis opportunities. There probably is no special "RBIability:' The vast majority of hitters will get about thenumber of RBI predicted by their general hitting ability and opportunities. Any deviations are probablyjust random chance. That would be consistent withthe well-known research on clutch hitting.
NOTESISome outstanding hitters of recent times, MannyRamirez and Mike Piazza, for example, were not in
HR AVG SLG ISO16 .320 .493 .17332 .270 .477 .207
21 3140 820 4
HITS192162
PLAYER AIA 600B 600
As for the data, opportunities include one for everytime at bat and one for each runner on base during anat-bat. This means that OPP does not include opportunities from plate appearances when the batterwalked. (A regression was run that included theseopportunities, and the results were similar).2 Isolatedpower is a hitter's slugging percentage minus his batting average and is a better measure of power hittingsince it only includes bases on hits beyond singles.
As for the statistical results, the r 2 is .943, whichmeans that 94.3% of the difference in RBI per at-batacross players is explained by Equation 1. The standard error, which meas~res dispersion in the equation's predicted RBI/AB for each player, is .00839 orjust 5.03 RBI for a 600 at-bat season (600X.00839 =5.03). The numbers in front of the variable abbreviations are referred to as coefficient estimates. So, forexample, a .010 increase in batting average means a.00194 increase in RBI/AB (.194X.010 = .00194).That is 1.16 RBI for a 600 at-bat season. A .010increase in ISO would add 3.08 RBI for a 60·0 at-batseason. TheTValtleS, which indicate statistical significance, are:
~ho will drive in more runs? Using Equation 1 andassuming they each get 1.5 OPP, Player A will drive in83.2 runs while Player B will .drive in 87.66 runs.Player B's edge in home run power gives him the edgein RBI despite a much lower batting average and adeficit in doubles and triples. For Player A to get up to87.66 RBI, his average would have to jump to .358(assuming all additional hits are singles). If Player Ahad just 20 doubles and 4 triples, along with a .320average, he would drive in just 68.8 runs. To get up to87.66 RBI, he would then have to raise his average to
99

THE BASEBALL RESEARCH JOURNAL
the study since they had not achieved 6,000 plateappearances through the 2001 season. Both werehigh in opportunities per at-bat at 1.71 and 1.68,respectively. Ramirez had about .5 more RBI per 600at-bats than expected and Piazza had about .26 less.
2RBI from sacrifice flies are also not included. Neitherare opportunities that were available when the player hit a sacrifice fly. For the average player in thisstudy, sacrifice flies make up less than 1% ofhis plateappearances and no more than 1.5% for anyone player. So excluding sacrifice flies matters very little. RBIfrom bases-loaded walks were not included in theEquation 1 or Equation 2 results. They were includedin the unreported regressions that included opportunities from walks. In those regressions, all variableswere divided by plate appearances rather than atbats. HBPs were also included in those cases. Butagain, the results were similar with basically thesame meanings as the two regressions reported here.
3If I used walks, plate appearances, and the point system, the regression results show that opportunitiesalone would give Jua.n (i-onzalez 15 more RBI thanBarry Bonds over a 660 plate appearance season.That is less than 18.5, but still very high.
SOURCESVarious editions of the STATS, Inc. Player Profilesbooks and The GreatAmerican Baseball Stat Book.Brooks, Harold. "The Statistical Mirage of ClutchHitting;' Baseball Research Journal, 1989.Conlon, Tom. "Or Does Clutch Ability Exist? By TheNumbers, March 1990.Cramer, Richard D. "Do Clutch Hitters Exist?"Baseball Research Journal, 1977.Gillette, Gary. "Much Ado About Nothing,"Sabermetric Review, July 1986.Hanrahan, Tom. "What Makes a "Clutch" Situation?"By the Numbers, February 2001.Karcher, Keith. "The Power of Statistical Tests;' ByThe Numbers, June 1991.Mills, Eldon G. and Harlan D. Mills. Player WinAverages, New York: A.S. Barnes, 1977.Palmer, Pete. "Clutch Hitting One More Time;' By theNumbers, March 1990.Runquist, Willie. "Clutch Hitters and OtherMythological Animals;' Baseball by The Numbers,Jefferson, NC: McFarland, 1995.Wood, Rob. "Clutch Ability: Myth or Reality?" By theNumbers, December 1989.
APPENDIX: PREDICTED RBI VS. ACTUAL RBI
RBIOPP RBI PERPLAYER AVG ISO PERAB 600 AB* PREDICTED DIFFERENCEHarold Baines .291 .172 1.51 94.28 81.03 13.25
Wally Joyner .289 .149 1.50 84.48 72.81 11.67Ruben Sierra .270 ,184 1.50 89.29 Rl.::lR 7.90AIldres Galarraga .291 .219 1.52 102.89 96.01 6.88
Jose Canseco .268 .252 1.54 111.68 104.83 6.85
B.J. Surhoff .281 .135 1.52 75.98 69.14 6.84
Paul O'Neilll .288 .182 1.59 94.80 89.51 5.29Will Clark .304 .196 1.49 93.75 88.49 5.26
Tony Fernandez .286 .112 1.42 60.07 55.07 5.00
Mark Grace .307 .140 1.49 76.18 71.44 4.74Cal Ripken .271 .163 1.50 79.41 74.85 4.56
Robin Ventura .271 .176 1.60 90.57 86.17 4.39Tony Gwynn .342 .127 1.44 71.58 67.27 4.31
Tim Raines .288 .134 1.41 65.42 61.17 4.25
Mark McGwire .263 .327 1.48 127.26 123.40 3.85
Ken Caminiti .272 .175 1.55 85.88 82.43 3.44
Dante Bichette .299 .200 1.59 99.95 96.53 3.42
aobby Bonilla .280 .200 1.50 90.35 87.20 3.14
Gregg Jefferies .289 .132 1.45 66.30 64.04 2.27
100

THE BASEBALL RESEARCH JOURNAL
RIIOPP RIIPERPLAYER AVG ISO PER AI 600 AI* PREDICTED DIFFERENCEJay Buhner .254 .240 1.60 106.52 104.47 2.06Matt Williams .269 .222 1.56 99.05 97.21 1.85David Justice .280 .227 1.58 103.19 101.57 1.62Fred McGriff .287 .228 1.53 100.76 99.26 1.51Tino Martinez .274 .207 1.69 ·103.93 102.84 1.10Frank Thomas .319 .258 1.59 117.90 116.83 1.07ToddZeile .267 .162 1.57 80.47 79.76 .71Roberto Alomar .306 .149 1.45 71.11 70.87 .24Benito Santiago .260 .151 1.52 71.44 71.42 .02Greg Vaughn .245 .232 1.60 100.19 100.40 -.21Rafael Palmeiro .295 .225 1.51 96.95 97.35 -.40
Ron Gant .256 .212 1.48 86.37 86.79 -.42Mark McLemore .260 .080 1.55 51.36 51.94 -.58
Delino DeShields .270 .109 1.44 52.73 53.52 -.80Juan Gonzalez .297 .271 1.67 123.21 124.13 -.91Gary Sheffield .295 .226 1.53 98.15 99.10 -.95Edgar Martinez .319 .211 1.55 97.80 98.83 -1.04Jeff Bagwell .303 .251 1.61 113.06 114.13 -1.07John Olerud .300 .176 1.59 87.83 88.99 -1.16Travis Fryman .278 .171 1.63 86.69 87.87 -1.18Ken Griffey .296 .270 1.54 112.30 113.53 -1.23Dave Martinez .279 .114 1.46 55.81 57.67 -1.85Devon White .264 .156 1.43 64.56 66.73 -2.17
Jay Bell .267 .153 1.44 64.50 66.79 -2.30Rickey Henderson .274 .140 1.36 55.40 57.94 -2.54Wade Boggs .317 .117 1.41 56.42 59.33 -2.91Barry Larkin .300 .155 1.45 68.58 72.12 -3.54Ellis Burl(s .292 .220 1.53 93.29 97.07 -3.78Craig Biggio .291 .145 1.39 59.81 63.83 -4.02Marquis Grissom .270 .134 1.49 60.58 64.91 -4.33SammySosa .277 .265 1.58 108.32 113.28 -4.96Larry Walker .315 .257 1.55 107.72 113.14 -5.42Eric Karros .268 .194 1.66 89.70 96.17 -6.46Luis Gonzalez .286 .198 1.59 87.50 93.99 -6.49Barry Bonds .295 .299 1.48 111.72 118.24 -6.52Bernie Williams .305 .194 1.65 93.49 100.04 -6.55Ray Lankford .274 .209 1.54 86.15 92.86 -6.72Brady Anderson .257 .170 1.44 63.65 70.85 -7.20Chuck Knoblauch .293 .118 1.45 51.53 59.95 -8.42Kenny Lofton .302 .123 1.47 55.16 64.06 -8.90Steve Finley .275 .164 1.51 66.49 76.77 -11.27
* RBI from sacrifice flies and bases-loaded walks not included. Predicted number is based on equation (1).
101

GABE COSTA
Babe Ruth Dethroned?Whither the Sultan of Swat?
During the first two decades of the 20th century,"inside baseball" dominated the way the national pastime was played. Superstars like Detroit's
Ty Cobb and Pittsburgh's Honus Wagner, along withmanager John McGraw of the New York Giants, wereproponents of this style ofbaseball.
After Wagner and Cobb retired, many baseballexperts believed that one or the other ranked as thegreatest baseball player ever. This "consensus" lastedthrough the 1930s and beyond, even though the towering figure of Babe Ruth had played the game in anunparalleled way.
George Herman Ruth ... known as the Babe ... theBam .. the T(ing of Swillg tIle SultaIl of Swat.
But was 11e 1-eally tIle Sultan of Swat? Was he thebest or merely one of the best?
Babe Ruth died in 1948. Opinions vary as to wherehe ranked with respect to the great players ofall time.But there was no real methodology to measure theseuntil the field of sabermetrics was introduced. BillJames Tables 1 andRuns Created and Win Shares, and John Thorn andPete Palmer (See Table 3) with their Linear Weightsmethod, concluded that Babe Ruth was the greatestplayer ever.
Tllese arguments, and ma.ny others, were overwllelllliIlgly in favor of Ruth. So much so that it wasnoted if a study ever found that Babe Ruth did notrank as the greatest player ever, there was somethingwrong with the analysis.
The Babe eclipsed Cobb and Wagner; McGraw's"inside baseball" was forever eradicated. Since 1918Babe Ruth was doing the unthinkable: he was postingseasonal home run totals that were greater than totalsamassed by other teams. Year after year, Ruth slugged
FATHER GABRIEL B. COSTA is an associate professor teaching in the department ofmathematical sciences at theUnited States Military Academy at 1iJlest Point. He haspreviously been published in The Baseball ResearchJournal and Elysian Fields Quarterly.
so many home runs that in his career he "outhomered"rival clubs 90 times.
And that was not all. Besides the homers, there wereother unbelievable records: marks involving walks,runs scored, total bases, slugging percentage, andhome run percentage. No one was close. There weremany kings, ifyou will, but only one Sultan.
In addition to Ruth's slugging, he was a great pitcher for the Boston Red Sox. In 1916 he led theAmerican League with an earned run average of 1.75,had the lowest batting average allowed to opposingbatters with .201, and established the league recordfor shutouts by a left hander with nine (since tied). Hewon 20-plus games twice, tll1d l1ever suffered a losingseason, boasting winning percentages that neverdipped below .640. His lifetime ERA was 2.28.Including a 5-0 record with the Yankees, Ruth endedup with career totals of 94 wins and 46 losses.
The Bambino pitched 29~ consecutive scorelessinnings in World Series play, a record that would
pitching achievement than any ofhis slugging marks.His lifetime won-loss record was 3-0 in Series playwith an earned run average of 0.87.
His World Series batting performances speak forthemselves.
In 1919 when he set the major league record forhome runs with 29, he led all American League outfielders with a fielding percentage of .996. He alsospent enough time on the mound to hurl his teal11 tonine victories.
Ruth stole more than 100 bases in his career,including 10 swipes of home.
No one was close to him, as a hitter or as an allaround performer. It seemed that he should play in ahigher league.
Babe Ruth's career lasted for 22 years. When heretired in 1935, he owned scores of records and wasresponsible for many "mosts" and "firsts:' Some ofthese were:
102

THE BASEBALL RESEARCH JOURNAL
103
times by Chicago Cub outfielder Sammy Sosa.In 1998 Mark McGwire of the Cardinals hit 70
home runs, marking the first time that total had beenreached. Big Mac, recently retired, now holds the lifetime record for home run percentage.
In 2001. Giants outfielder Barry Bonds posted oneof the greatest seasons ever, setting major league seasonal records for home runs (73), walks (177), slugging percentage (.863), and home run percentage(15.3%). A year later, Bonds posted the highest onbase-pIus-slugging mark ever (1.381).
Also in 2001, much traveled outfielder RickeyHenderson broke Babe Ruth's career record for walks.
One by one, Ruth's records were falling. Was he stillthe Sultan of Swat?
The recent home run explosion has provided animpetus to reevaluate the once (still?) exalted positionof the Bambino.
As mentioned above, Ruth outhomered teams 90times, 14 in 1920 and 12 in 1927. It is unthinkable toenvision any recent slugger rivaling this kind of dominance. McGwire, Susa, ur BOIlds would 11ave to hit inthe neighborhood of 200 homers to surpass anotherteam's home run total.
Regarding the 50-plus home run barrier, it used tobe just that: a barrier, something rarely scaled beforethe 1990s. But by the end of the 2002 season, themark was equaled or surpassed 34 times, by more
The increased of such seasons, coupledwith the preponderance ofhome runs, however, seemsto suggest that a certain degree of difficulty withregard to hitting home runs has varied over the 82years ill question.
For example, in 1920 there were 630 lIOIlie fUllS llitin 84,176 at-bats (there were 16 major league teams inthat year). This gives an average home run ratio of0.0074 home runs per at-bat. In 2001, by way of-comparison, the 30 major league teams hit 5,461 homeruns in 166,255 at-bats, giving a home run ratio of0.03285. What does this mean?
Roughly speaking, this last statistic can be interpreted as meaning that the "average 2001 player" hitabout 3.285 home runs per 100 at-bats, which isabout 4.39 times greater than the 1920 figure. (SeeTable 1, which gives the major league home run ratiofor each 50-plus home run season).'
When we consider the individual home run ratio foreach 50-plus homer hitter (Table 2) and comparethese to the appropriate year, we get a relative home
He left behind quite a legacy of seemingly unbreakable records.
Then 1961 came along. Thirteen years after theBabe's death, Yankee right fielder Roger Maris hit 61home rtInS in an tInbelievable whirlwind season.Ruth's magic 60 had been toppled! His most famousseasonal record was now erased. The baseball worldwas stunned.
In the same year, Yankee ace Whitey Ford brokeRuth's most cherished record. The southpaw pitchedthe last parts of 32 consecutive· scoreless innings inWorld Series play. Ford added one more inning to his
• Most home runs in a season (60)• Most lifetime home runs (714)• Most lifetime runs batted in (2,211)• Most lifetime walks (2,062)• Most walks in a season (170)• Highest slugging percentage in a season (.847)• Highest lifetime home run percentage (8.5%)• Most 50-plus home run seasons (4)• First player to hit 30, 40, 50 home runs in a sea
son (1920)• First player to hit 60 home runs in a season (1927)• First player to hit a home run in Yankee Stadium
(1923)• First player to hit an All-Star Game home run
(1933)
the mammoth record of 714 lifetime home runsremained. It was doubtful that this monumental markwould ever be approached.
Ever so slowly, however, the figure of 714 was beingapproaclled. Outfielder Helll~ Aaron of the Braves, amodel ofconsistency, was nearing the ultimate record.In 1974 Bad Henry smashed number 715, and addedanother forty homers before ·he retired. Anotherassault on the Sultan of Swat.
Then came the 1990s when home run totals seemedto grow at an exponential rate. Detroit outfielder CecilFielder hit 51 home runs at the beginning of thedecade. He became the first player to break the 50plus barrier since 1977 when Cincinnati Red's outfielder George Foster blasted 52 homers.
Five years later in 1995, slugger Albert Belle hit 50home runs. This signaled the beginning of anonslaught of 50-plus home run seasons that has notstopped: from 1996 through 2002, no fewer than 17times has the half-century mark been surpassed. The60-plus barrier has been reached six times, three

THE BAS EBALL RES EAR CH J0URN AL
104
OPS = PRO = OBA + SLG
Babe Ruth, a~ 1.167, ranks first in lifetime OPS, wellahead of Barry Bonds' 1.023 and Mark McGwire's0.982. Ruth's 1920 standard of 1.379 was edged byBonds' 2002 mark of1.381, but Ruth has six ofthe tenbest seasons ever with respect to OPS, compared totwo held by Bonds. Boston Red Sox great TedWilliams considered this the superior measure.
Ruth is nUlllber Olle ill career TPQ witlI 1.0382,placing him well ahead ofboth McGwire's 0.9109 andBonds' 0.8670.
The most commonly used "new" statistic is, perhaps, that of on-base plus slugging (sometimes calledproduction). This is defined as the sum of on-baseaverage and slugging percentage:
Table 1. MAJOR LEAGUE HOME RUN RATIO
N950+HRYEAR N9 TEAMS IAnERS N9 ML HR N9 ML AI HR RATIO1920 16 1 630 84176 0.007481921 16 1 937 85205 0.01142
1927 16 1 922 84461 0.010921928 16 1 1093 84453 0.01294
1930 16 1 1565 86575 0.01808
1932 16 1 1385 87193 0.01558
1938 16 2 1475 85013 0.01735
1947 16 2 1565 84436 0.01854
1949 16 1 1704 84380 0.020191955 16 1 2224 83590 0.02661
1956 16 1 2294 83856 0.027361961 18 2 2730 97032 0.02814
1965 20 1 2688 109739 0.02450
1977 26 1 3644 143974 0.02531
1990 26 1 3317 142768 0.02323
1995 28 1 4081 138571 0.02945
1996 28 2 4962 156801 0.03165
1997 28 2 4640 155437 0.02985
1998 30 4 5061 167034 0.03030
1999 30 2 5528 167137 0.033072000 30 1 5693 167290 0.03403
2002 30 2 5059 165582 0.03055
TPQ= HR + RBI + TBAB
run ratio (Table 3). We see that Babe Rutll 11as tIlefour 11igllest allIounts, and that his ratios in 1920,1921, and 1927 dwarf the entire field. It is plausible toassert that not only were home runs "harder to hit" inRutll'S tillIe, but that no other slugger ill Ilistorywasclose to Ruth in this relative sense.
One of the more recent measures is isolated power,which is defined as slugging percentage minus battingaverage. Babe Ruth is the career leader with .348. Incomparison, Mark McGwire has an ISO of .325 whileBarry Bonds' ISO is .300.
Another statistic is called the total power quotient.It is defined as the sum ofhome runs plus runs battedin plus total bases, all divided by at-bats. That is,
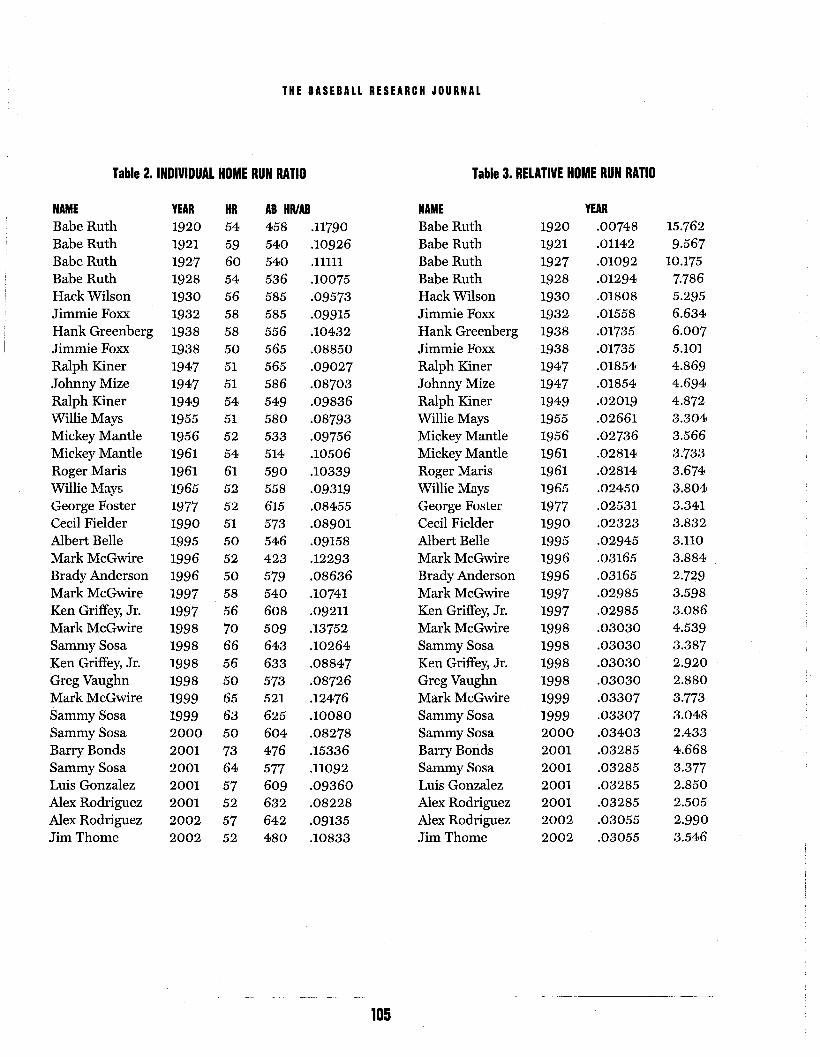
THE BASEBALL RESEARCH JOURNAL
Table 2. INDIVIDUAL HOME RUN RATIO Table 3. RELATIVE HOME RUN RATIO
NAME YEAR HR AI HRiAI NAME YEARBabe Ruth 1920 54 458 .11790 Babe Ruth 1920 ~00748 15.762Babe Ruth 1921 59 540 .10926 Babe Ruth 1921 .01142 9.567Babe Ruth 1927 60 540 .11111 Babe Ruth 1927 .01092 10.175Babe Ruth 1928 54 536 .10075 Babe Ruth 1928 .01294 7.786Hack Wilson 1930 56 585 .09573 Hack Wilson 1930 .01808 5.295
Jimmie Foxx 1932 58 585 .09915 Jimmie Foxx 1932 .01558 6.634
Hank Greenberg 1938 58 556 .10432 Hank Greenberg 1938 .01735 6.007Jimmie Foxx 1938 50 565 .08850 Jimmie Foxx 1938 .01735 5.101
Ralph Kiner 1947 51 565 .09027 Ralph Kiner 1947 .01854 4.869Johnny Mize 1947 51 586 .08703 Johnny Mize 1947 .01854 4.694
Ralph Kiner 1949 54 549 .09836 Ralph Kiner 1949 .02019 4.872Willie Mays 1955 51 580 .08793 Willie Mays 1955 .02661 3.304
Mickey Mantle 1956 52 533 .09756 Mickey Mantle 1956 .02736 3.566
Mickey Mantle 1961 54 514 .10506 Mickey Mantle 1961 .02814 3.733Roger Maris 1961 61 590 .10339 Roger Maris 1961 .02814 3.674Willie Mays 1965 52 558 .09319 Willie Mays 19n5 .02450 3,804George Foster 1977 52 615 .08455 ,George Foster 1977 .02531 3.341
Cecil Fielder 1990 51 573 .08901 Cecil Fielder 1990 .02323 3.832
Albert Belle 1995 50 546 .09158 Albert Belle 1995 .02945 3.110
Mark McGwire 1996 52 423 .12293 Mark McGwire 1996 .03165 3.884
Brady Anderson 1996 50 579 .08636 Brady Anderson 1996 .03165 2.729Mark McGwire 1997 58 540 .10741 Mark McGwire 1997 .02985 3.598
Ken Jr. .02985 3.086
Mark McGwire 1998 70 509 .13752 Mark McGwire 1998 .03030 4.539SammySosa 1998 66 643 .10264 SammySosa 1998 .03030 3.387Ken Griffey, Jr. 1998 56 633 .08847 Ken Griffey, Jr. 1998 .03030 2.920
Greg Vaughn 1998 50 573 .08726 Greg Vaughn 1998 .03030 2.880Mark Mc(~wire 1999 65 Fi21 .12476 Mark McGwire 1999 .03307 3.773SammySosa 1999 63 625 .10080 SammySosa 1999 .03307 3.04R
SammySosa 2000 50 604 .08278 SammySosa 2000 .03403 2.433
Barry Bonds 2001 73 476 .15336 Barry Bonds 2001 .03285 4.668
SammySosa 2001 64 577 .11092 SammySosa 2001 .03285 3.377Luis Gonzalez 2001 57 609 .09360 Luis Gonzalez 2001 .03285 2.850
Alex Rodriguez 2001 52 632 .08228 Alex Rodriguez 2001 .03285 2.505
Alex Rodriguez 2002 57 642 .09135 Alex Rodriguez 2002 '.03055 2.990Jim Thome 2002 52 480 .10833 Jim Thome 2002 .03055 3.546
105

THE BASEBALL RESEARCH JOURNAL
Williams called it "... the bottom line in hitting .. :'4When dominance is considered, Ruth is so far
ahead ofhis contemporaries that comparisons are virtually impossible to make. For example, with regard toslugging percentage, he won 13 titles in 14 years, anunparalleled feat, and he is the only player ever withtwo .800+ seasons.
Ruth more than holds his own when compared tothe new breed of super sluggers. For example, Babe'sseasonal records for runs scored (177), total bases(457) and extra-base hits (119) are astounding, especially when realizing that these marks were accomplished during 154-game seasons.
Despite the home run barrage of the past severalyears, consider the following:
• Babe Ruth has more American League home runcrowns than any player in history with 12 (including two ties).
• Babe Ruth has more major league home runcrowns than any player in history with 11 (including three ties).
• No one has more 50-plus llolller seasons than thefour that Ruth accomplished.
• No other player in any decade hit as many homeruns, 467, as Ruth hit in the 1920s.
• No other player has as many multiple home rungames as the 72 posted by the Babe.
• No other has as13 posted by Babe Ruth.
.. No other player has as many on-base plus slllgging(OPS) titles as the 13 recorded by the Bambino.
• No other player has as many runs scored titles asthe eigllt tIlat Rutli accUIIlplished.
• No oth.er player lIas as IIlany runs batted in crownsas the eight posted by the Babe.
• Ruth led the league in bases on balls 11 times,more than any player in history.
• No player in history has more extra base hits titlesthan the seven·recorded by Ruth.
• Ruth is the only player in the Hall ofFame to havepitched in at least ten different years with morewins than losses in each season.
Though some of his records have fallen, when considered as a conglomerate, his. overall rating mustremain number one.
In the final analysis, some may feel that his throneis a bit tarnished. Others may wonder if some of theglitter has faded from his crown. But no one-neither
Ted Williams nor Lou Gehrig from the past-notMark McGwire, Sammy Sosa, or Barry Bonds fromthe.present-can usurp Ruth's merited title. Like finewine, the Sultan of Swat improves with age.
BIBLIOGRAPHYJames, Bill. The Bill James Historical BaseballAbstract, rev. ed. New York: Villard Books, 1988.----. The New Bill James Historical BaseballAbstract, New York: Free Press, 2001.Thorn, John, and Pete Palmer, eds. The Hidden GameofBaseball, rev. ed. Garden City, NY: Doubleday, 1985.Williams, Ted, and Jim Prime. Ted Williams'Hit List,Indianapolis, IN: Masters Press, 1996.
ACKNOWLEDGMENTSThe author would like to thank Lyle Spatz of SABR
and John T. Saccoman of Seton Hall University fortheir invaluable suggestions and assistance.
106

ROBERT H. SCHAEFER
Wanted: One First Class Shortstop·
and captured four consecutive pennants. However,Harry's Boston empire crumbled when, in blatant violation of all existing rules, Chicago team presidentWilliam Hulbert lured the Boston's so-called "BigFour" to the Windy City for the 1876 season.
Hulbert, through the personal intervention andinfluence of AI Spalding, persuaded Ross Barnes, Cal .McVey, and Jim White to sign contracts with Chicagofor the 1876 season. Spalding also defected toChicago. In those days ofunrestrained free agency, theNational Association rules strictly prohibited one clubfrom engaging players from a second club while theywere still under contract to that club. The contracts ofthe Red Sox players didn't expire until November 1,and the Chicago Sigllillg took place on July 4, anunconscionable rule violation by Hulbert. The theft ofthe "Big Four" emasculated the Bostons and endedtheir National Association Championship WhipPennant monopoly.
In fact, this breach was so egregious, Hulbert con-he'd be from the National
Associatioll.own organization, the National League, leavillg tIleold Association a hollow shell. The Association neverwas officially declared ·defunct-it simply ceased toexist. Hard-hitting 'AdriaIl "Babe~' Al.'15()1'l joined tllt:~
Chicago nine from the Plliladelpllia ](5, makillgChicago the odds-on favorite to. capture the initialleague pennant.
As evidenced by voluminous correspondencebetween Wright and Hulbert in the years following1875, Wright harbored no detectable animositytoward Hulbert. Captain Harry must have been apractical man and reckoned there was no point inholding a grudge. Besides, there simply was no way hecould even the score against Hulbert. AlthoughWright was a brainy baseball man, he didn't wield theraw power that Hulbert had at his disposal. In an ageof unabashed "boosterism" Hulbert. declared, "I'drather be a lamp post in Chicago than a millionaire inany other city:' He had the best of all possible worlds,for he became a millionaire in Chicago.
BOB SCHAEFER is retired from the aerospace industry.This is a chapter in his forthcoming book, ForgottenFragments From Baseball's Past History.
The fall of 1878 found Harry Wright in a tightspot. The tale of how Harry's troubles cameabout is a long one, finding its roots way back in
1868. Wright had been managing and captaining theleading nines of professional baseball since that year.The next season the precedent-breaking all-professional Cincinnati Red Stockings established a newrecord for winning ball games. A major reason forCaptain Harry's success was his younger brother,George, arguably the leading player of the 1860s andearly 1870s. George Wright resigned from a strongclub in Washington, D.C., to join Harry in Cincinnatiin 1868 and was financially very well rewarded for it..WIlell tIle Cincinnati nine disbanded at tIle elld of the1870 season, Harry was given carte blanche to organize a professional club in Boston. The first playerHarry enrolled for this new nine was brother George.In recognition of his ball-playing genius, George wasagain the highest-paid member of the nine.
In a major coup, Harry signed the best three players
Fred Cone, infielder Ross Barnes, and pitcher AISpalding. Barnes was definitely the leading shortstopof the West. But when Barnes agreed to join theWrights in Boston, he also agreed to move to secondbase in deference to George. For the next five years(1871-1875) Wright and Barnes formed the nationalpastime's most famous double play combination.While with Boston, Barnes led the association's second basemen ill fieldillg tllree tillles, won two battingchampionships, and posted three .400+ batting averages. By 1875 his brilliance had eclipsed that ofGeorge Wright.
The Boston Red Stockings proved to be as mighty ajuggernaut as was the original' Red Stockings ofCincinnati. They dominated the National Association,the first organization of professional baseball teams,
107

THE BASEBALL RESEARCH JOURNAL
Chicago did win the League pennant in 1876, andRoss Barnes won its very first batting title with hisfourth .400+ season. However, the Chicago nine didn'tfare well in 1877, and tumbled to fifth place in a sixteam league. There were two reasons for their collapse. First of all, the best hitter in all of professionalbaseball, the one and only Barnes, was rendered totally ineffective by a crippling illness. In addition tomissing 66% ofthe games played, he plummeted frombeing the terror ofthe league to the ranks ofvery ordinary hitters.
Barnes contracted the ague, a Victorian-era namefor malaria, over the winter of 1876-1877. He was stillsuffering from its lingering effects when the seasonopened the first week of May. Barnes was unable toperform adequately on the diamond, and in mid Maythe Chicago Club furloughed him without pay. Barneswent home to Rockford, Illinois, about 90 milesnorthwest of Chicago, to rest and recuperate. OnThursday, May 31, the Rockford Weekly Gazettereported: "Ross C. Barnes, the famous base ballist, isto visit his relatives in this city."
He rejoined the Chicago· nine in late August andappeared in a total ofonly 22 games the entire season.Barnes's batting average fell to a mere .272-a stupendous drop from his lusty .429 the season before.
At the end of the 1877 season Barnes sued theChicago club for the wages they withheld while he wasrecovering at home. The court found in favor of the
as to nall'''IT£:l.....
the services specified in his contract. This legal actionrendered Barnes persona non grata in Chicago. Theclub did not engage him for the 1878 season, andBarnes had to scramble to find a new job COlllillg offahorrible sea.son.
Coincident to Barnes's fall from his place of preeminence, 1877 was the first year that the modern rulegoverning foul balls was placed in effect. HarryWright personally authored this rule with the deliberate intent of legislating the vexing fair-foul hit out ofexistence. As Barnes was the acknowledged master ofthe fair-foul, now banned by the new rule, severalmodern historians have concluded that tllere was acause-and-effect relationship between the eliminationofthe fair-foul hit and Barnes's poor performance thatyear. This conclusion conveniently ignores the factthat Barnes suffered a debilitating illness from whichhe never fully recovered. He was permanently handicapped by the lingering effects of the disease, and hisstar never again sparkled with its former luster.
Barnes signed with the Ontario Tecumseh of theInternational League for the 1878 season. His contract required him to play second base and captain thenine. Some observers of that day considered theInternational League to be the equal of the NationalLeague. However, the National League refused togrant parity to any other organization of professionalbaseball teams. They adamantly and blindly pursuedthis policy until brought to their knees by BanJohnson in 1901-1903. Barnes hit an anemic .235 thatyear, but reached his career high in fielding, .922.
The second reason for Chicago's fall in 1877 is thatAI Spalding, who had compiled a glittering pitchingrecord of 251-65 (a winning percentage of .794) overthe years 1871-1876 made a surprising adjustment tothe Chicago nine. During the winter of 1876-1877,Spalding, in his dual role of team captain and manager, persuaded St. Louis's leading pitcher, GeorgeWashington Bradley, (45-19, 1.23 ERA in 1876) toabandon the Mound City in favor of the Windy City.This move allowed Spalding to retire from the pitch~r's box a.nd play first bast~w On the face of it, cOlllingoff a seaSOll wllere he posted 47 victories, Spalding'sdecision is unfathomable. Apparently, Spaldingsensed that his days as a pitcher were over. In 1877, heappeared in just four games as a pitcher, with only onestart, and hurled a total of 11 innings. His record wasone win and no losses. It was also his last year as anactive as heae'V'ellOP].n~his expanding sporting goods business.
As Chicago's fortune declined, Harry Wright'sBoston nine regained the supremacy they had previously enjoyed and won the league pennant in 1877 and1878. Th~n fate once more dealt Ca.pta.in Harry anuIlkind blow, and put llilll ill tIle tigllt spot mentionedearlier. The city of Providence had organized a leagueentry for the 1878 season and finished in third place.The nine was captained by center fielder Tom York.The team Directors convinced George Wright that hewas just the man to captain· the nine in 1879. Georgewas always an outstanding player. He is credited withrevolutionizing the position of shortstop, and was aheavy hitter as well. But George, rightly or wrongly,was always in Harry's shadow in terms of being aleader. A measure of the esteem accorded Harry isthat in his own time he was given the accolade of"TheFather of Base Ball;' a title he modestly spurned.Perhaps the opportunity in Providence was oneGeorge had always sought but, as long as he was associated with Harry, could never attain. George agreed
108

THE BASEBALL RESEARCH JOURNAL
109
vengeance. Some baseball historians believe that thisincident motivated Hulbert to form the NationalLeague and sabotage the Association.
Force was considered one ofthe leading infielders ofhis time, equally at home at shortstop, third base, andsecond base. In the days of bare-handed fielders,Force was famous for his glove. Prior to 1877 he usedthe fair-foul hit on a regular basis. Although Forcedidn't gain fame and notoriety equal to Ross Barnes asa fair-foul hitter, his batting average was severelyaffected after that type of hit was banned. The horizontal curve came to the fore in the same years thatForce's average declined, and that apparently alsocontributed to the reduction in Force's hitting. Moreto the point, Force never was the outstanding, dominating hitter that Barnes was in his prime. Now, completely on his own initiative, Force wrote to Wrightasking to be considered for Boston's shortstop job in1879. Sadly, there is no record of Harry Wright'sresponse. It is easy to speculate that Wright refused tobe party to an. illegal contract and the ugly scandalthat WOllld ensue if he accepted Force's offer. TIle factis that Force remained with the B1..1ffalo nine for 1879.
To fill the void George's departure had created,Harry juggled his players around. For 1879 he movedhis 29-year-old third baseman, Ezra Sutton, to thevacant shortstop position, moved first baseman JohnMorrill to third, and used four different players tocover first. Sutton hit .248 (the overall league battingaverage wasof .864, playing 51 games at short and 33 at third base.Harry's Boston nine finished second in 1879.
Ross Barnes evidently got the kind of salary offer hewas looking for from his old teammate Cal McVey.McVey was tile Cincinnati captain in 1879, antI heorganized his nine with the 29-year-old Barnes atshortstop. Barnes hit .266 as the Cincinnati club finished sixth. Barnes's fielding average was a shabby.849, with 61 games at short and 16 at second base.McVey did not complete the 1879 season as theCincinnati captain.
The 30-year-old Davey Force remained with Buffalofor the 1879 season. Against Force's strong advice, theclub transferred from the International League to theNational League. They finished a dismal seventh inthe eight-team league. Force hit .209 and fielded .929,living up to his reputation of good glove, no stick. Heplayed all but one of his 79 games at shortstop.
At the age of 32, George Wright played all of his 85games as the Providence shortstop. He hit for a .276
to the terms offered by Providence, and suddenlyHarry's championship nine needed a first-class shortstop. George departed both Boston and Harry, ending11 consecutive years of playing under his brother'smanagement. This left Harry in a bind, because thenas now, first-class shortstops that can hit are notfound hanging around on every street corner desperately seeking employment. Harry's thoughts turned tohis old second baseman, Ross Barnes.
Barnes was staying at the Tecumseh Hotel onSeptember 26, in London, Ontario, when Wright's letter arrived inviting him to rejoin the Boston nine. Hethought over the letter, and carefully crafted aresponse to his old friend. The first thing he advisedWright was that he had made arrangements to followa "legitimate" business over the winter. Whether ornot Barnes would return to the diamond. dependedupon his success in his new field. He made it clear thatbaseball was a second priority to him. Barnes nextasked Wright how much money he was willing to payfor a good shortstop, emphasizing that money wasBarlles's sole objective. Barnes reql.lested that Wrightname his highest figure in his next letter. But acceptance of any offer was contingent upon the outcome ofBarnes's venture into the business world, and he specified that he would accept Wright's offer only in theevent of his failure in business. How much of thisposition was to increase his bargaining power and
,1\,,..., rrl-"+ is moot.
Barnes asked Wright to delay filling the 1..1 ......"', ... ,",U,",'-'LJ
position until the outcome of his business enterprisebecame clear.
In the meantime, shortstop par excellence DaveyForce heard that Harry Wright needed to fill George'sshoes at shortstop for 1879 and volunteered fur thejob. Force had never been a member ofone ofWright'snines, although they had been adversaries on the diamond for many years. Force's letter to Wright is datec.lOctober 6, 1878, and was written on the letterhead ofthe Haynes Hotel in Springfield, Massachusetts. Forceplayed for the International League Buffalo club, andtold Wright, confidentially, that he no longer wantedto play alongside McCasey. He offered his services toWright despite the fact, as he candidly stated, he hadalready signed with Buffalo. Force's jumping a contract was not without precedent. In 1875, he renegedon his contract with Chicago in favor of a more lucrative one with Philadelphia. When the NationalAssociation board of directors failed to enforceHulbert's contract with Force, Hulbert vowed

THE BASEBALL RESEARCH JOURNAL
average and posted a fielding average of .924. Oh, bythe way, George led the Providence nine to theNational League championship that year. It would bethe final full-season championship either of theWright brothers ever won.
Despite the myriad changes that have encompassedthe world of baseball since 1879, one thing hasremained constant: a first-class shortstop is very hardto find.
NOTESlRhodes, Greg, & John Erardi. The First Boys ofSummer. p. 133.2Ryczek, William. Blackguards and Red Stockings. p.26.
3Nemec, David. The Great Encyclopedia of 19th'Century Major League Baseball. pages 17, 30, 32, 45,46 &59.
4Spalding, Albert. America's National Game. p. 2035Harry Wright Correspondence, Volumes 1, 3 & 4(1870-1878).
6Pietrusza, David. Major Leagues. p. 23.7The Chicago Tribune, September 9, 1877, quoted theSyracuse Courier following an exhibition gameplayed between Chicago and Syracuse: "Barnes'whose incapacity to play with his nine until withinthe past week. has had more to do with the declineand fall of the Chicago this than is
•••..••.••.•••••••••••••••••••.••••.•••••••••.••••••••••• Je:erLePllllV lJ'-LIo-"'IJ''-'t.:,,-,,",",, q""...."Oq .....ort at but he pte-a pitiful there. It was an exhibition
of fallen greatness. A long and tedious siege againstdisease has reduced the man, whose every swing ofthe bat was once worth at least a base, to almost askeleton. He plays ~rithoutvim alld seelllS to do whatlittle he does out of sheer compulsion. Ball-tossingand willow wielding are lost arts to Ross Barnes:'
8The Chicago Tribune, April 8, 1877: "Barnes has beenfor some days ailing and under command of a physician, who has ordered him not to practice at present."
9The Chicago Tribune, May 19, 1877: "The wisestthing the Chicago Club of 1877 has done since itsassembling was yesterday, when they laid offand furloughed their ablest player-the one who has wonmore victories than any other man in the Championteam, and whose record for batting and run gettingfor the past four years has been better than any otherin the business. It has been evident ever since theteam assembled that 'Ross; as he is everywhereknown, was not in condition, and his painful efforts
to play when he could not play have tended not a little to the defeats which the team has sustained ....Yesterday it became evident to the management thatto play Barnes was to throwaway chances, and heaccordingly was allowed to go home to Rockforduntil he is once more himself, and when himselfhe isthe best man who ever stepped in the ball field."
lONew York Mercury, November 16, 1878: "The suit ofRoss Barnes against the Chicago Club for salaryclaimed to be due him on his contract for the seasonof 1877 was argued before Judge Loomis of theCounty Court, Chicago, on November 9. The judgereserved his decision until the 18th. It will beremembered that Barnes was engaged by the clubfor 1877 at a salary of $2,500, but in May when theseason began, he was compelled by illness to quitplaying for three months. When he returned heclaimed $1,000 salary due him for the time he wasabsent, which claim the directors refused to allow.He then brought suit for the amount and the evidence in the case was submitted to judge Loomis, asstated above. TIle case is Rnew one it'l tIle experiellceofball clubs and the outcome will be looked forwardto with interest by professionals generally:'
IlNew York Mercury, April 12, 1879: "In the ChicagoAppellate Court, Apr. 2, Judge Bailey announced thedecision of the court affirming the judgment in thecase of Barnes against the Chicago Baseball Club:'
Wright's latest effort to improve the game was anexperiment which was tried in the match betweenthe Bostons and Hartfords, at Boston, on Oct. 28, onwhich occasion was put into practical effect a rulethe object ofwhich is to do away with the class ofllitktlOWl1 as fair-fouls."
13Harry Wright Correspondence, Volumes 1, 3 & 4(1870-1878).
14Ibid.15The New York Clipper, December 12, 1874.
110

TOM HANRAHAN
Does Experience Help in the Post-Season?
Do baseball players fare better in the post-seasonwhen they have post-season experience behindthem? My research says the answer is a clear
no. Managers' efforts to build teams with players who"have been there before" appear to be fruitless ventures, sacrificing money and possibly quality for noapparent gain.
MEASURING'POST-SEASON EXPERIENCE Common baseball wisdom says that one factor in achieving post-season success is having post-season experience. The thinking isthat because the World Series is such a unique event,those players who have not been there before are morelikely to fall victim to nervousness, lack ofconfidence,or other conditions that would adversely affect theirplay. This sounds like a reasonable theory. The successof the Yankees in recent post-season play would beone piece ofpositive evidence, but then this last WorldSeries had young Lackeys and Rodriguezes allover it.
The big question is: How do we tell if the theory istrue? We could analyze by team or individual success.From a team we could the win
inoffs more recently than their opponents. A difficultywith this method would be controlling for the qualityof the team, particularly the different mix of playersfroll1 year to year. So I cl10se to focus on iIldividualperforlllallce. TIle obviotls decisioll 11ere is lookillg athitters or pitchers. Here I determined that usingpitchers would be a better choice, for many reasons:
1. Ease of choosing a measuring stick. For batters,we can use some standard measure such as OPS,but in a short series, clutch hitting can be more
TOM HANRAHAN age 42, lives in Lexington Park,Maryland. He is employed by the Department ofDefense, working to save airplanes from crashing andpilots from getting killed, wasting everyones hardearned tax dollars. Tom has a wife and three teenagechildren. With all due respect to Lou Gehrig, Tom considers himselfthe luckiest man on theface ofthe earth.
important than overall performance. So one couldeasily argue that runs and RBI, broken down intogame situations, are the best measure. For pitchers, ERA seems to be the obvious best measure,and it is easy to obtain.
2. Sample size. In a playoff series, starting pitchersoften face 70 batters or more. Hitters rarely getmore than 30 plate appearances in series ofsevenor fewer games.
3. Pressure. I decided to use pitchers who startedgames. A pitcher named by his manager to takethe mound is obviously the focal point on the fieldfor his team that day (exception: 2002 version ofBarry Bonds).
SELECTING THE DATA The post-season has changed overthe years: from a single World Series to two, and nowthree, sets of playoffs. Because of the .difficulty indefining "post-season pressure" or "experience" withmixed sets, I decided to use who started
............................................................................................................······················lBi ..cc6
games,start was prior to 1969, the year that divisions werecreated. This yielded 65+ years ofWorld Series play.
I created two sets of data for each pitcher. The datafroln "experiellced" 11urlers were tllose il1nings thrownby pitcllers wllo 11lade at lea.st one start in their firstWorld Series appearance. In other words, if a pitcherfirst appeared in a World Series as a reliever only, hewas ineligible; this was done so I did not have todecide whether a relief appearance counted as "experience:' Then I used his combined total of all otherWorld Series innings as "experienced" data, as long ashe made at least one more start in a succeeding WorldSeries. Pitchers who did not start any games in anysuccessive World Series were again not used.
I was surprised when collecting the data that thereare many discrepancies among sources for pitchers'ERAs in the early part of the century.. I. eventuallychose the baseballI.com database as my standard reference.
111

THE BASEBALL RESEARCH JOURNAL
How do these numbers sound?: 267 inning pitched, 22 wins, 13 losses, a 3.00 ERA. Not a bad year?Between 1903 and 1914, Christy Mathewson tossed at least 267 innings per year. He never wonfewer than 22 games.He never lost more than 13. His worst earned run average was an even 3.00. Sofor a 12-year stretch, ifyou combine
his very worst performance in every category-he was still very good.
THE RESULTS This method yielded 97 pitchers whoCOIIlbine{t for 3~710 innings pitcllcd ill World Series·play. Fifty-four pitchers (56%) had a lower ERA intheir initial Series appearance than in future games.Forty-two pitched better when they were experiencedin Series play. One had identical ERAs: DutchLeonard threw 9 innings ofone-run ball in both cases.Raw data totals:
ance. Pitcher A was better overall, or possibly pitchedin an era when it more difficult to scorc rUIIS. Clearly,it is possible that in the instance above, one couldinterpret the combined results to say that the pitcherswere better in their initial World Series appearances.
To combat this situation, I created matched sets ofdata for each pitcher, weighting the difference in ERAby how many innings each pitcher threw. I used the
Pitcher A was much worse in future games, B wasthe same, yet overall, there is no difference! This isbecause of the disparity in innings and in perform-
FIRST·WS FUTURE WSPITCHER IP ERA IP ERA ERA DIFFERENCEA 5 2.00 25 3.60 +1.60B 25 4.00 5 4.00 0.00A+B 30 3.67 30 3.67 O.OO(!)
Possibly a more accura.te w~y of determining the"experiel1ce effect" would be to create matched sets ofdata rath~r than combining all of the data into onepool. As an example, suppose the entire data set consisted of only two pitchers. Their mythical totals arelisted below:
innings as the weight for each pair. The data for thefirst three pitchers is alphabetically listed in Table 1.
Grover (Pete) Alexander's weighted IP are found by2 -7- (1/18 + 1/25) = 20.9. The ERA difference andweighted TP are multiplied for each pitcher to get therigllt-Illost column. Then, 83.7 divided by 39.8 yieldsa composite ERA difference of 2.11 for the first threepitchers.
Alexander is one of the more memorable WorldSeries performers. At age 28 he threw two fine gamesfor the 1915 NL champ Phillies against the Red Sox.He won game 1, but lost game 3 by a 2-1 score. Muchlater, in 1926, hurling for the Cardinals, he faced theYankees. Pete won games· 2 and 6 with fine efforts,and then came in relief the next day, striking outLazzeri with the bases full and recording a save.However, his post-season career finished in 1928,against the Yanks again, and this time the NewYorkers lit up Alex in game 2, chasing him in the third,and then hit him hard again in relief in game 4.
ERA DIFFERENCE+0.28
FUTURE WSIP ERA
2497 2.97
FIRSTWSIP ERA
1213 2.69
112

THE BAS EBALL RESE ARC H J0URN AL
Table 1. ERA DIFFERENCES BETWEEN EXPERIENCED AND INEXPERIENCED PITCHERS IN WORLD SERIES PLAY
PITCHERV AldridgeGAlexanderEAukerAbove 3 PitchersAll 97 Pitchers
FIRST WSIP ERA
18 4.4218 1.5311 5.5647 3.58
FUTURE WSIP ERA8 7.1525 5.026 3.0439 5.15
ERADIFFERENCE
+2.73+3.49-2.52+2.11+0.64
WEIGHTEDIP11.1
20.97.8
39.81374
ERA DIFFTIMES IP
3073
-2083.7875
Overall, his first World Series effort was far superiorto his combined later appearances.
The pitcher with the most weighted innings inWorld Series play is Christy Mathewson, who famously tossed 27 shutout innings in his initial 1905 appearance, and then threw 75 more innings with an ERA of1.44 later in his career.
'When combined using this method, there is a totalof 1,374 weighted innings. Pitchers as a whole had anERA that is a full 0.64 runs per game higher in their"experienced" Series play than in their first outings.That is almost a full year's worth ofinnings pitched foran entire team, and the experienced pitchers were .64runs per game worse.
significance, these results clearly show no apparentadvantage of post-season· experience in the first twothirds of the 20th century.
Further investigation could be performed toattempt to account for age differences, park effects, orotller factors, but I reaSOll tilat tIle cilallce of tlleseother influences is very unlikely to be large enough tosway the results of this study. Experienced pitchershave dOlle 110 better ill tIle pressure cooker of tIleSeries than first-timers. Tell that to your favoriteannouncer.
ACKNOWLEDGMENTSRob Wood was kind enough to review my data, correct lots of missing or bad information, and pointedout the data differences in various· sources.
113

LOUIS P, MASUR
The Riot at the First World Series
!I. . ~~p~:~nO~~:~~O~~t~~e~:~:::a~~;dt~h~:~~known ofall baseball pictures from the opening of
the twentieth century. The picture is especially relevant in 2003 because it was taken one hundred yearsago on October 3, 1903. The site is the HuntingtonAvenue Base Ball Grounds in Boston and the occasionis the third game of the World Series. This was theinaugural World Series, agreed upon only late in thesummer of the 1903 season. The agreement signaledpeace in baseball after two years of bitter fightingbetween the National League and upstart AmericanLeague. From the start, the fall contest captured theimagination of the fans, and thousands turned out towatch as the Pittshllrgh, Pirates and BostonAmericans faced off in a best-of-Iline series.
The picture was taken by a photographer for theBoston Globe and it appeared two days later, on~rtober5, in the newspaper. The caption read in parttihat the picture "was taken a few minutes before thegame began." It was commonplace for overflowcrowds to stand _""..............&,~ _",l"""L"lroI,..
games done so in Game 1 (wonby Pittsburgh) and Game 2 (won by Boston) of theseries. Balls hit into the ropes would go for groundrule triples. But on October 3, the fans burst throughthe restraints and swarmed the field. The story ofwhat took pla.ce:, captl1red in the famous photograph,suggests nothing less than what might be called "TheRiot at the First World Series:'
Excited by the two games played so far, and stimulated by the balmy weather, not to mention the extramoney in their pockets from a Friday payday, fansturned out by the thousands for the Saturday afternoon contest. By 11 o'clock, hundreds of people stoodoutside waiting for the gates to open. Hour after hour,
LOUIS P. MASUR teaches history at the City College ofNewYork and is the author of Autumn Glory: Baseball'sFirst World Series (Hill €5 Wang, 2003), from whichthis account is adapted.
packed streetcars unloaded fans at the park. The single, long lane that led to the ticket office was cloggedwith fans inching forward, eager to buy tickets for thethird game in Boston before the series shifted toPittsburgh for four games. The ticket sellers had notime to place the dollars and coins in the box, so theysimply threw the money to the floor. Later, once thegame started, there would be time to gather it.
At noon, the gates opened, and a "surging, struggling mass" rushed into the park. By 1:15, all the seatshad been sold and the area behind the outfield ropescontinued to swell with people who jostled for position. At 2:00, fans covered the outfield, occupied theterrace, climbed the fences, even found their way tothe roof. Ticl{et speculators made a fortune, offerillggeneral admission bleacher tickets for one to two dollars and reserved grandstand seats for as high as tendollars. Even the peanut vendors and scorecard boysmade out by selling buckets and boxes for people. tostand on for $1 a piece. The ticket office closed, andthe speculators ran out of seats. Yet people were still
Huntington Avenue grounds and clamored for admission. Once the game started, those in the bleacherscalled out to those in the street, reporting what washappening on the field.
The official attendance was put at 18~801, but thatfigure was low. Probably betweell twellty alld tweIltyfive thousand people jammed themselves into thepark. The situation seemed unstable. Anticipating alarger Saturday crowd, BOStOll'S busilless managerhad arranged for fifty policemen, up from the thirtyfive at the previous game. But as many as 150 officerswould have had trouble containing this gathering. Asthe crowd swelled, it vibrated back and forth in waves.Fans stood ten deep in the outfield. Suddenly, at a little after 2:00, a few men slid past the ropes in centerfield. Others started to press toward the field from thethird base bleachers. Within seconds, a stampedebegan. Thousands broke through the ropes and covered the entire field. They "tore across the diamond ...drove the two teams from their benches, swept rest-
114

THE BASEBALL RESEARCH JOURNAL
lessly around and around the entire lot, and theydetermined to get as close to the playas possible:' '~surging, struggling, frantic crowd," reported theBoston Post, "a sea of faces, a perspiring mass ofhumanity that fringed the fences, packed and jammedthe stands, encircled the diamond and fought bothpolice and players."
The scene was unfathomable. In their desire to getcloser to the action, the exuberant fans, described as"good natured;' threatened the game, the players, andtheir own physical welfare. The police, aided by several players, struggled to prevent the mob from invadingthe reserved grandstand section. Two women, caughtin the crush, were rescued by a Boston player and several policemen. The fans packed the field and thepolice began trying to move them from the infield.Time and again the police would charge, with theirclubs drawn, only to discover that the crowd wouldrush back to fill each area shortly after it was cleared.Boston's business manager raced into the dressingroom and returned with an armful of bats for thepolice, WllO used them against the shins and skulls ofunruly tans. l"he victims grabbed themselves as ifpoked with a "white, hot brand:' Some fans saw "starswhich no· astronomer has yet mapped:'
The police could not restore order and clear the diamond. The game would have to be postponed, orworse, forfeited to the Pirates. At 2:45, one hundredadditional officers rushed to the grounds, although
mounted unit thearrived. One policeman, who weighed nearly threehundred pounds, had a "unique method of pushingback the crowd:' He would "throw his arms in the airand then run like a mad bull into the midst of theencroachers. His efforts had great effect." A patrolrrlaIlbrought· out a long length of rubber hose and, withfour men on each side, the police used it as a batteringram to force the crowd back. With a concerted push,they cleared the diamond. Then they moved to theoutfield where "inch by inch the swaying mass fellback ... Forty feet was gained in 20 minutes:' At thesame time, "the members ofboth nines, anxious to gettogether in the decisive battle of the local series, wereusing their bats in much the same manner as thepolice did the hose:'
The best the police could do was to move the crowdabout 50 yards behind the diamond. Along the baselines on first and third, the crowd was packed to within fifteen feet of the playing field. Behind·the catcher,a space ofabout thirty feet was cleared, and men lined
up ten deep in front of the backstop. The players wereclosed off from their benches and sat on the grass tothe side of the catcher. The fans who crowded in frontofthe stands would be dangerously close to the action,but the patrolmen decided to leave them there "knowing that a few foul balls would clear this part of thefield better than the most strenuous suasion:'
The Pirates came out to warm-up. Second base wasmissing. Manager Fred Clarke threw his cap down asa substitute, much to the amusement of the crowd.Finally, a "230 pound policeman gained fame by rescuing [the bag which] had been stolen by a 57-poundnewsboy:' After a few hit balls, the fans again driftedonto the field. The bell rang for Boston's turn, and thePirates came off the field having handled fewer thantwenty chances. Screaming and waving his arms,Boston manager Jimmy Collins urged the crowd togive the home team more room. Alittle after 3:00,Collins, Clarke, and Umpire Connolly met to discussground rules. Connolly once remarked that "the constant woes of an umpire's life are the height of a pitch,rain, and darl{ness:' He neglected to mention the fans.The group decided tIlat balls 11it into tIle outfieldcrowd, which stood only about 150 feet beyond thebase paths, would count for doubles.
Remarkably, the game began only fifteen minuteslate, but the presence of the fans, so close to theaction, would have an effect. The Pirates scored a runin the second when, with two out, second baseman
crowd in centerfield, a groulld rule double. The ballfell only a few yards from the outfielders. The fansgroaned, perhaps in self-remorse, because outfieldersPatsy Dougherty or Chick Stahl would have caught theball easily llad tIle crowd rIot s}lrullkell the dimcn~,
sions of the field. Jimmy Sebring walked and EddiePhelps hit the ball into the left field crowd for another double, scoring Ritchey. Pitcher Deacon Phillippegrounded out, but his team now held a one-run lead.
In the top of the third, the Pirates struck again.Boston pitcher Tom Hughes started to come undone.Boston's number three hurler walked GingerBeaumont on four consecutive pitches to begin theinning. Clarke then doubled into the crowd in left.Tommy Leach quickly singled, scoring Beaumont"The formidable Honus Wagner was due up, with runners on first and third, and nobody out. The scorestood 2-0, and Collins had seen enough. He startedarguing with the umpire in a ploy to buy some timefor a relief pitcher to warm up. As the argument con-
115

THE BASEBALL RESEARCH JOURNAL
eluded, the crowd that was jammed against thegrandstand "trembled, then parted with a loudsound." Out walked a large 111all wiLlI tawny hair. Thefans recognized him at once. "In a second every one ofthat gang of 25,000 was swinging hats wildly andyelling 'Cy! Cy!' and it was he, Young was rushing tothe rescue."
Collins needed the extra time because, whileHughes was getting into trouble, Young was still instreet clothes, sitting in the club's office, helping tocount the day's take.
When play resumed, Wagner .stepped in. Young'sfirst effort was a wild pitch that put Leach on second,but did not roll far enough away to allow Clarke toscore from third. Wagner fell behind in the count withtwo strikes. Young then came with a hard curve ballthat failed to break early enough and drilled thesuperstar in his left shoulder. Wagner's face
"crinkle[d] like an old ash-dump boot," and hestormed around for a few moments.
"Hully gee;' yelled a young man, ~~hut Wagner mustbe hard as nails to take such a swat as that:' Anothercupped his hands together and screamed "Kill 'em Cy,that's the only way they can be done up today:' Theshortstop said his arm went to sleep. If so, remarkedone writer, "it was the only part of Hans that did anysleeping during the remainder of the game." Youngstood motionless. He retrieved the ball, rubbed it inhis glove, glared at first, and ''began swaying like aSioux squaw in a death· dance, for another delivery."
Bases loaded, no one out. Young induced the struggling Bransfield to foul out to first. Ritchey hit a hardshot to third, which Collins handled and threw to LouCriger to force Clarke at home. The bases were stillloaded, but now two were out. It looked as if Youngwould escape from the jam. Sebring had two strikes
116

THE BAS EBALL RES EAR CH J0URN AL
on him when he hit a swift, skipping shot to FredParent. The shortstop partially stopped the ball.Leach scored, but Wagner got caught rounding thirdand was tagged out by the catcher in a run down. ThePirates had jumped ahead 3-0.
After Pittsburgh went down in the top ofthe fourth,the police managed to move the outfield crowd backanother 30 feet. The Boston partisans couldn't helpbut think that had the police done so in Pittsburgh'ssecond or third time up, "a different tale would possibly be told." Boston scratched out a run, to make thescore 3-1, but Young and Phillippe settled into a pitchers' duel. Each team added a run in the eighth, but thegame by then had taken on an air of inevitability. Inthe ninth, after Pittsburgh went down in order, fewthought a rally against Phillippe, who had kept theball down "in the strike zone all afternoon, was possible. And it wasn't. Parent popped up to second. CandyLa Chance grounded to Wagner. Hobe Ferris struckout, but won a momentary reprieve when Phelpsdropped the ball. An instant later, with the throw tofirst, his at-bat, as well as the game, came to an end.
No Olle 11ad left tIle groulH}s befure tIle filIal out.Whereas prior to the game, some fans on the field hadtried to climb into the stands, now those in the standsemptied onto the field. For ten minutes, "it wasimpossible to see one bare inch of turf:' As the fansshuffled away from the grounds, "gloom and silence"marked their demeanor. They admitted that the
and conceded that "Boston's chances for the I"lh-::U"\"\1""\l_
onship look very dim indeed:'If the commotion prior to the game had turned the
contest into a battle of nerves, then Phillippe demonstrated tllatlle could 110t be sllakcll. Twicc, a hit wouldhave led to runs for Boston, and twice the DeaCOIl"showed his ability, once by a strike-out and the second time by compelling the batsman to hit a grounderto the infield:' He ·was pitcl1i11g fr0111 i11side "a greatring of humanity, 40 deep, sitting, standing or lyingaround the entire field within 200 feet of the bases,yet in nine full innings he allowed only two balls to behit into the crowd:' Hughes, by contrast, became rattled when he saw "those dumpy, illegal hits" fall notfurther than ten feet from his outfielders. The Piratesalso ''backed up their pitcher at every point, and timeand again cut off seeming base hits by apparentlyimpossible plays:' Wagner alone "was everywhere andanywhere [and] three of his stops were labeled surebase hits." Pittsburgh spent the afternoon "outbatting,
outfielding, and, yes, 'outnerving'" their opponents.Some would say "outlucking" them as well. "Luck is
Quite a Factor;' claimed a headline in the BostonGlobe. "Luck, that inscrutable dogma of the fatalists,was romping" with the Pirates all day long. The problem was the ground rule established prior to thegame. "Right here;' reporters noted, "was whereBoston lost the game before ever it was started." Offour Pirate base hits in the first three innings, doublesinto the crowd by Ritchey, Phelps, and Clarke wouldhave been easy outs. The two runs resulting fromthese hits was the margin of the loss. A third run aswell, scored in the eighth, came off of yet another"fungoe;' a lazy fly ball hit by Wagner just beyond theoutfielder. And LaChance's shot in the bottom of thesecond "would have been a clean home run" ratherthan a ground..;.rule double. "With a clear field;' wroteone writer, "the final score would have been three toone in favor ofBoston:' Difficult as it was to admit, thefans' behavior prior to the game had to be viewed as"the main cause of the local team's defeat:'
There were "plenty of excuses and ifs to offer" forthe results of the gallIC. If 011ly Young had started,many thought Boston would have won. If only theBoston bats had broken through inthe fourth and theeighth innings, they might have emerged victorious. IfYoung and Collins had not made those errors in theeighth, the Pirates would have had one less run. Ifonly the crowd had been a few feet further back. It
reasoned one writer. The famous '""''''"',''+£'1.'''.....I'lI'"''''''"'
day captures the uncertainty, but also the glory thatwas baseball at the first World Series.
117

JOHN T. SACCOMAN
Why Isn't Gil Hodges in the Hall of Fame?
Gil. Hodges has received more votes for the Hallof Fame than any other person not selected. Hecame as close as 44 votes shy of election, but
unfortunately, that came in his last year of eligibilityunder the BBWAA vote.
Gil Hodges' Hall ofFame fate resides in the hands ofthe newly constituted Veterans Committee. Muchtime and energy has been devoted to the Hall, andmany fans have opinions about unqualified playerswho have been inducted and vice versa. NotedSabermetrician Bill James wrote a book, The PoliticsofGlory, detailing the history of the HOF, and presenting some arguments about which players might ormight not merit selection. I will use his 15-point list ofargull1ellts as a guidelille for Gil Hodges' case. No oneargument makes an entire case, but it is interesting tosee how many can be used in Hodges' favor. The numbering is based on James' list:
3. Was he the best player in baseball at his position? Was he the bestplayer in the league at his position? This is probably the best
D~;errLan in the NL in the fifties (if we consider StanMusial an outfielder), and possibly the best in themajors. Hodges led all first basemen of the 1950s inthe following categories: HR (310),G (1,477), AB(5,313), R (890), H (1,491), RBI (1,001), TB (2,733)aIldXBH (585). He made the All-Star team eighttimes, every year from 1949 to 1955 and again in 1957,the most of any first baseman of the time (again, discounting Musial). Hodges won the first three GoldGloves at his position and was considered the finestdefensive first baseman ofthe era as well. In addition,he was second among all players in the 1950s in HRand RBI, third in TB and eighth in R (fourth in NL).
Hodges was voted by respected baseball statistics
JOHN SACCOMAN teaches in the Seton Hall UniversityDepartment of Mathematics and Computer Science.Born after Gil Hodges retired, he only recently learnedthat Hodges was his late grandfathersfavorite player.
organization STATS Inc. as the best defensive firstbaseman of the 1950s. The organization also retroactively selected All-Star teams for all years, bothleagues. Hodges was named the retroactive All-Starfirst baseman four times, tying him for 13th place innumber oftimes selected as a first baseman. Ahead ofHodges and in the Hall are Brouthers, Gehrig, Mize,Anson, Cepeda, Chance, Foxx, Sisler, and McCovey.The only players in the top twelve not in the Hall areKeith Hernandez and Ed Konetchy, while Hall ofFame first basemen such as Tony Perez, JimBottomley, and George "Highpockets" Kelly meritedfewer STATS, Inc. selections.
In the first edition of the Historical BaseballAbstract, James wrote, ~~The fifties were packed withfirst basemen who were outstanding for a few yearsbut none was consistently strong throughout thedecade:' He also states that Kluszewski, Hodges, andVic Wertz were the contenders for the best first baseman of the decade. Hodges outpaces them inBoswell's Total Average (a base-out percentage) and in
the player's career totals, and then his numbers on aper/154 game basis.
4. Did he have an impact on a number of pennant races? InHodges~ first ten years as a starting player, theDodgers finished as low as third only twice, finishingin first place or tied for first six times. Hodges createda significant percentage ofhis team's runs in the years1948-1959. ByBill James's BasicRuns Createdformula,he·created 12.3% of the Dodgers' runs over that time.Over a similar period in his Reds career, Hall ofFamerTony Perez created just under 12% of his team's runs.
Although this category seems to be more about contributions of players, Hodges also played a major rolein the 1969 pennant race as the manager of theMiracle Mets. The seven-year-old expansion team,which had finished in 9th place at 73-89 the previousyear, won 100 games despite having only two players(Cleon Jones and Tommie Agee) who had more than400 at-bats.
118
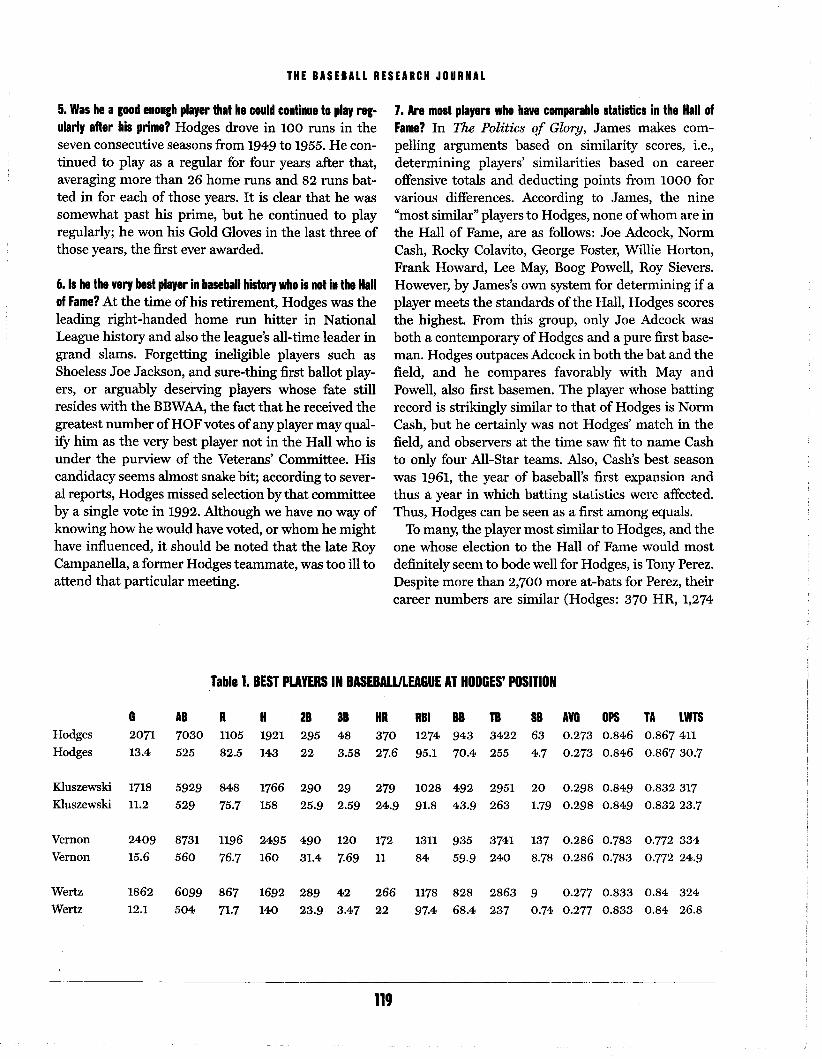
THE BASEBALL RESEARCH JOURNAL
5. Was he agood enough player that he could continue to play regularly after his prime? Hodges drove in 100 runs in theseven consecutive seasons from 1949 to 1955. He continued to play as a regular for four years after that,averaging more than 26 home runs and 82 runs batted in for each of those years. It is clear that he wassomewhat past his prime, but he continued to playregularly; he won his Gold Gloves in the last three ofthose years, the first ever awarded.
6. Is he the very best player in baseball history who is not in the Hallof Fame? At the time ofhis retirement, Hodges was theleading right-handed home run hitter in NationalLeague history and also the league's all-time leader ingrand slams. Forgetting ineligible players such asShoeless Joe Jackson, and sure-thing first ballot players, or arguably deserving players whose fate stillresides with the BBWAA, the fact that he received thegreatest number ofHOF votes ofany player may qualify him as the very best player not in the Hall who ·isunder the purview of the Veterans' Committee. Hiscandidacy seems almost snake bit; according to sever...al reports, Hodges missed selection by that committeeby a single·vote in 1992. Although we have no way ofknowing how he would have voted, or whom he mighthave influenced, it should be noted that the late RoyCampanella, a former Hodges teammate, was too ill toattend that particular meeting.
7. Are most players who have comparable statistics in the Hall ofFame? In The Politics of Glory, James makes compelling arguments based on similarity scores, i.e.,determining players' similarities based on careeroffensive totals and deducting points from 1000 forvarious differences. According to James, the nine"most similar" players to Hodges, none ofwhom are inthe Hall of Fame, are as follows: Joe Adcock, NormCash, Rocky Colavito, George Foster, Willie Horton,Frank Howard, Lee May, Boog Powell, Roy Sievers.However, by James's own system for determining if aplayer meets the standards of the Hall, Hodges scoresthe highest. From this group, only Joe Adcock wasboth a contemporary of Hodges and a pure first baseman. Hodges outpaces Adcock in both the bat and thefield, and he compares favorably with May andPowell, also first basemen. The player whose battingrecord is strikingly similar to that of Hodges is NormCash, but he certainly was not Hodges'match in thefield, and observers at the time saw fit to name Cashto only four All-Star teams. Also, Cash's best seasonwas 1961, the year of baseball's first expansion a.ndthus a year ill whicll battiIlg slalislics were affected.Thus, Hodges can be seen as a first among equals.
To many, the player most similar to Hodges, and theone whose election to the Hall of Fame would mostdefinitely seem to bode well for Hodges, is Tony Perez.Despite more than 2,700 more at-bats for Perez, theircareer numbers are similar (Hodges: 370 HR, 1,274
Table 1. BEST PLAYERS IN BASEBALULEAGUE AT HODGES' POSITION
a AB R H 28 38 HR RBI BI TB IB AVO DPS TA LWTSHodges 2071 7030 1105 1921 295 48 370 1274 943 3422 63 0.273 0.846 0.867 411
Hodges 13.4 525 82.5 143 22 3.58 27.6 95.1 70.4 255 4.7 0.273 0.846 0.867 30.7
Kluszewski 1718 5929 848 1766 290 29 279 1028 492 2951 20 0.298 0.849 0.832 317
Kluszewski 11.2 529 75.7 158 25.9 2.59 24.9 91.8 43.9 263 1.79 0.298 0.849 0.832 23.7
Vernon 2409 8731 1196 2495 490 120 172 1311 935 3741 137 0.286 0.783 0.772334
Vernon 15.6 560 76.7 160 31.4 7.69 11 84 59.9 240 8.78 0.286 0.783 0.772 24.9
Wertz 1862 6099 867 1692 289 42 266 1178 828 2863 9 0.277 0.833 0.84 324
Wertz 12.1 504 71.7 140 23.9 3.47 22 97.4 68.4 237 0.74 0.277 0.833 0.84 26.8
119

THE BASEBALL RESEARCH JOURNAL
RBI,.273 BA, .361 OB, .487 SLG, 8 All-Star selections;Perez: 379, 1652, .279, .344, .463,7). Also, they playedthe role of first baseman/RBI man deluxe on one ofthe best teams of their times. Each had two seasonsover .300 batting average, and seven 100+ RBI years,although Gil Hodges had six seasons of 30+ HR toPerez's two. These facts would seem to indicate thatwhile the careers were somewhat equal, Hodgesmaintained a higher peak.
During his peak years as measured by those with anoffensive HEQ (see point #8 below) greater than 300,Hodges' teams had a winning percentage of .591,while Perez's was .576.
However, in his most recent version of theHistorical BaseballAbstract, James ranks Tony Perezas the 13th best first baseman of all time, and Hodgesas the 30th. Is Perez really better than Hodges, and ifso, is he that much better?
As mentioned above, the raw numbers for these twoplayers are fairly similar. The only argument againstHodges might be that his career (1947-1962, with acup of coffee ill 1943) occurred during a time of relatively more offellse tllall tllat of Perez (1964"'1986).When viewed in context, Hodges slugged 23% betterthan his league over the course of his career, whilePerez slugged 24% better than his. If we adjust forthis, Hodges' Slugging Percentage .becomes only 1point lower than that of Perez, .457. In addition,
Hodges seems to have been a much more highlyregarded defensive player, as Perez never won a GoldGlove. Thus, it would seem that Hodges and Perez arefairly close, and in fact, Hodges is in fact the betterplayer when defense is taken into account.
8. Do the player's numbers meet the HOF standards? Jamesdeveloped several systems for enumerating the defacto HOF standards, and Hodges performs better insome than in others. Comparing him to his contemporaries, considering statistics of other first basemen inthe Hall, and ifhis work as the manager ofthe MiracleMets is also in the mix, Hodges meets or exceeds theHall of Fame standards.
In his 1981 book, Baseball's 100, Maury Allen givesHodges one of 10 honorable mentions, thus placinghim in his top 110 of all time. Interestingly, 17 ofthe110 (including Hodges and Shoeless Joe Jackson) arenot enshrined in the Hall.
Michael Hoban, in his book Baseball's CompletePlayers, develops a statistical system to rank playersbased on on-field performance over the ten best seaSOlIS of llis career. IIodges scores very well h.et'e also;Hoban asserts that a combined 830 peT (PlayerCareer Total) seems to be the "dividing line" for Hallof Fame induction, and Hodges' score is 902. Hall ofFame first basemen Frank Chance (572) andHighpockets Kelly (805) miss the cut, while Cepeda
Table 2. BEST PLAYERS IN BASEBALULEAGUE AT HODGES' POSITION
R HR RBI SLOB SEelV TA RANKINGGreenberg ,1051 331 1276 0.248223694 O.4667~2207 1.1.16605R91 HOFKillebrew 1283 573 1584 0.190974096 0.446176507 0.943903646 HOFMccovey 1229 521 1555 0.191812511 0.412223984 0.93384564 HOFMize 1118 359 1337 0.220752039 0.387086761 1.016471119 HOFHodges 1105 370 1274 0.174854144 0.356614509 0.866705813 J30Chance 795 20 597 0.149191226 0.321178121 0.880865225 HOFCepeda 1131 379 1365 0.172381866 0.29494134 0.840925395 HOFBottomley 1177 219 1422 0.183048274 0.28724401 0.864482358 HOFKluszewski 848 279 1028 0.175028603 0.286220273 0.83185203 J34Perez 1272 379 1652 0.158365036 0.283698098 0.781436276 HOFVernon 1196 172 1311 0.152044617 0.26549078 0.771808852 J23Terry 1120 154 1078 0.198297023 0.257000622 0.907910272 HOFKelly 819 148 1020 0.153458127 0.230936092 0.750177936 HOFSisler 1284 102 1175 0.17596109 0.23055522 0.864894592 HOF
120
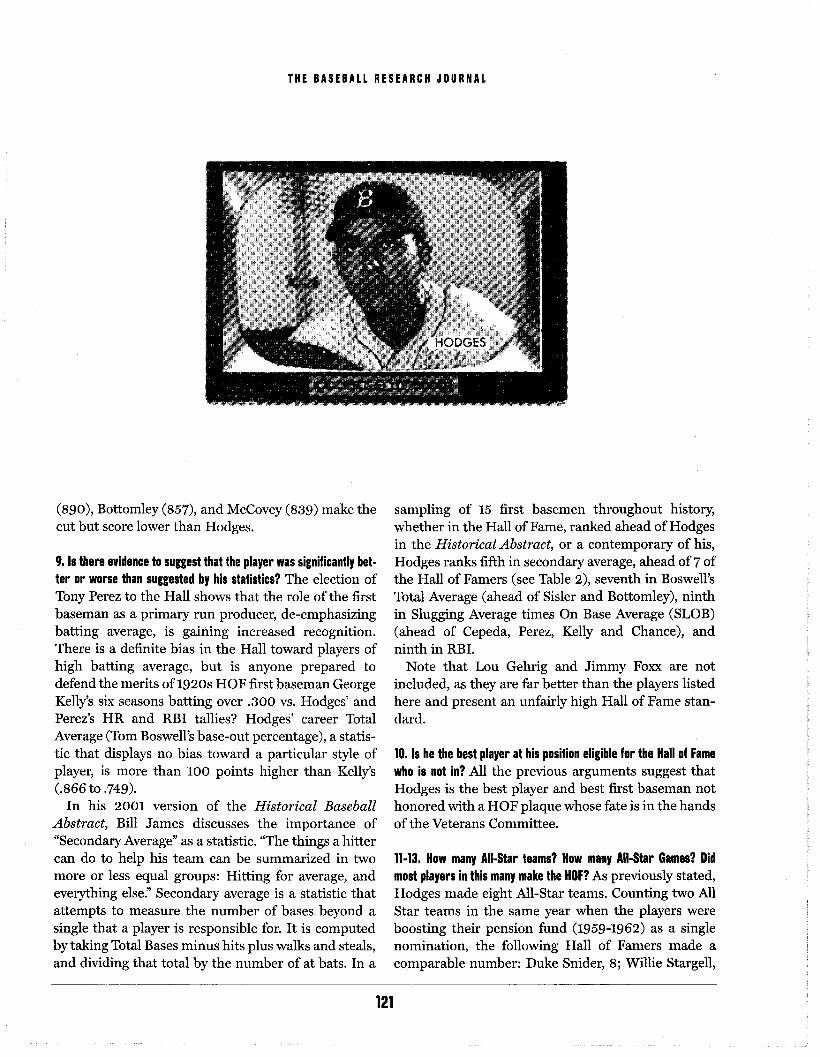
THE BASEBALL RESEARCH JOURNAL
(890), Bottomley (857), and McCovey (839) make thecut but score lower than Hodges.
9. Is there evidence to suggest that the player was significantly better or worse than suggested by his statistics? The election ofTony Perez to the Hall shows that the role of the first
,batting average, is gaining increased recognition.There is a definite bias in the Hall toward players ofhigh batting average, but is anyone prepared todefend the merits of1920s HOF first baseman GeorgeI(elly's six seasons batting over .300 vs. Hodges' andPerez's HR and RBI tallies? Hodges' career TotalAverage (Tom Boswell's base-out percentage), a statistic that displays no bias toward a particular style ofplayer, is IIIore tIlall 100 POilltS lligller than Kelly's(.866 to .749).
In his 2001 version ·of the Historical BaseballAbstract, Bill James discusses the importance of"Secondary Average" as a statistic. "The things a hittercan do to help his team can be summarized in twomore or less equal groups: Hitting for average, andeverything else:' Secondary average is a statistic thatattempts to measure ·the nu.mber of bases beyond asingle that a player is responsible for. It is computedby taking Total Bases minus hits plus walks and steals,and dividing that total by the number of at bats. In a
sampling of 15 first basemen throughout history,whether in the Hall of Fame, ranked ahead of Hodgesin the Historical Abstract, or a contemporary of his,Hodges ranks fifth in secondary average, ahead of7 ofthe Hall of Famers (see Table 2), seventh in Boswell'sTotal Average (ahead of Sisler and Bottomley), ninth
(ahead of Cepeda, Perez,ninth in RBI.
Note that Lou Gehrig and Jimmy Foxx are notincluded, as they are far better than the players listedhere and present an unfairly high Hall of Fame stan(lard.
10. Is he the best player at his position eligible for the Hall of Famewho is not in? All tIle previous arguments suggest thatHodges is the best player and best first baseman nothonored with a HOF plaque whose fate is in the handsof the Veterans Committee.
11-13. How many All-Star teams? How many All-Star Games? Didmost players in this many make the HOF? As previously stated,Hodges made eight All-Star teams. Counting two AllStar teams in the same year when the players wereboosting their pension fund (1959-1962) as a singlenomination, the following Hall of Famers made acO,mparable number: Duke Snider, 8; Willie Stargell,
121
THE BASEBALL RESEARCH JOURNAL
Tony Perez, Juan Marichal, Bill Mazeroski, 7; BillyWilliams, Ralph Kiner, 6; Phil Rizzuto, RichieAshburn,5.
Here are the members ofhis "similarity cluster" andtheir number ofAll-Star selections:
Joe Adcock (1), Norm Cash (4), Rocky Colavito (6),George Foster (5), Willie Horton (4), Frank Howard(4), Lee May (3), Boog Powell (4), Roy Sievers (4).Colavito and Hodges are the only ones to distinguishthemselves from the pack in this category.
14. What impact did the player have on baseball history? GilHodges was a key contributor to the second-best teamofthe 1950s and a beloved figure in his adopted homeofBrooklyn. He was the manager ofthe Miracle Mets,one of the most unlikely World Series Champions inbaseball history.
15. Did the player uphold the standards of sportsmanship and character that the HOF, in its written guidelines, instructs us to consider? This is another very strong point in Hodges' favor.The strong, silent type, he was described in PeteGolen'bock's BU11lS as "the Dodgers' Lou Gehrig ...strong but sphinx like, more of a presence than a personality . . . Everything Hodges did was professional... Offthe field he was a gentleman and a gentle man:'The same book quotes the Dodgers' public relationsman Irving Rudd as saying, "If I needed a player tovisit a blind kid in the stands, a kid in a wheelchair;'
ment changes brought about as a result of the player.Hall of Fame voters are asked to consider six crite
ria when evaluating a candidate's worthiness forenshrinement. In no particular order, they are record,ability, character, sportsmanship, integrity, and contribution to the game. We have addressed Hodges'record, ability, and contribution to the game. Hischaracter, sportsmanship, and integrity are more difficult to quantify. However, Hodges was never ejectedfrom a game, and by all accounts, he was highlyregarded. In the Historical Abstract, James quotesArnold Hano about Hodges, "He was a patient, devoted man with a fine heart:'
fans; epic Boys ofSummer, Roger Kahn entitledthe chapter about Hodges "the one who stayedbehind:' Unlike most players, Hodges actually wonthe hearts of fans· when he went into a slump thatbegan in tIle 1952 World Series alul continued into thenext season.
That Hodges has positives in 11 of the 15 argumentsthat James feels to be valid is a strong indication thathe merits inductioll ill the Baseball Hall of Fame. Inhis· time, he was the best at his position, offensivelyand defensively. Peripheral considerations that bolsterhis case include his character, his role in the BrooklynDodgers' only World Championship (drove in bothruns in the 2-0 clincher, fielded the throw from PeeWee Reese for the final· out), and his role as architectof the Miracle Mets.
The other categories offered by James include number of times leading the league in a major category(which Hodges never did), MVP awards (for which hereceived puzzlingly low support) and rules or equip-
122

AL KERMISCH
From aResearcher's Notebook
DAN SWEENEY WAS A SMALL MAJOR LEAGUE PLAYER Trying todetermine who was the smallest' player in majorleague history is a difficult task. In the old days statistics on the height of major league players were usually inaccurate. Of course, Eddie Gaedel, the 3 foot, 7inch midget who was used in one game in one of BillVeeck's weirdest promotions on August 19, 1951, mustbe excluded.
The smallest player in major league history mayhave been Dan Sweeney, who played 27 games withLouisville, National League, in 1895. At that time theLouisville papers listed him as being 4 feet 10 inchestall. When Sweeney played for San Francisco in theCalifornia league in 1890, the San FranciscoAlta stateu llial Sweelley was Oilly 4 feet, 8 illCllCS tall.Sweeney is listed as 5 feet, 5 inches tall in the TotalBaseball Encyclopedia.
PITCHER HAL CARLSON DIED IN CHICAGO HOTEL IN 1930 The shocking death of Cardinal pitcher Darryl Kile in a Chicagohotel on June 22 brought to mind another pitcher
Carlson, veteran hurler, suddenly in aNorthside hotel where he had an apartment. He aroseat 2:00 A.M. after a sleepless night. Dr. John Davis, theclub physician, was called when Carlson complainedof stomach pains. He had been suffering from stomach ulcers for two years. He died 35 minutes later asplans were being made to move him to a hospital.
Teammates Kiki Cuyler, Riggs Stephenson, and CliffHeatllcote were at Carlson's bedside. Mrs. Carlson wasat home in Rockford, Illinois, where Carlson wasborn. Besides the widow, a three-year-old child sur-
Since the inception ofthe Baseball Research Journal, AlKermisch's From a Researcher's Notebook has been itsmost well-respected and longest running feature.Kermisch, a SABR member since 1971, was an ardentbaseball researcher for over 60 years. Sadly, he passedon in November 2002. This, AI~ last article, was submitted by him shortly before he died. He will be missedby all ofus in SABR.
vived. The scheduled game with Cincinnati on May 29was postponed. Carlson had been in the majors since1917. As a rookie pitcher with Pittsburgh in 1917,Carlson pitched in 34 games and did not give up ahome run. In 1918 he gave up a homer, although hepitched in only three games before being drafted intothe u.S. Army.
BOSTON BEES HIT JACKPOT ON TWO LONGTIME MINOR LEAGUE PITCHERSIN 1937 When major league clubs bring up longtimeminor league players, the hope is that some of themwill be successful. But it is doubtful that any clubcould match the record of the Boston Bees in 1937.The Bees brought up two pitchers from the AmericanAssociation-Jim Turner and LOll Fett.e. Bot.h hadtoiled many years in the minors alld botll were listedas being 30 years old, but years later it was discoveredthat Turner was three years older.
Fette, at St. Paul, was the leading pitcher in theAmerican Association in 1936, with a record of 25 victories and only eight defeats. Turner won 18 games
and sur-prised the baseballfor a fifth-place Boston club that finished with arecord of 79 wins and 73 losses. Only Carl Hubbell,great southpaw of the pennant-winning New YorkGiants, won more with 22, In addition, Thrner hadlIle best ERA ill tIle National League, 2.38, and tiedwith Fette for most shutouts, each having five.
After his pitching days were over, Turner became asuccessful pitching coach for the Yankees, from 1949through 1959, when the Yanks, under Casey Stengel,won nine pennants and seven World Series.
TWO PLAYERS NAMED HOUSEHOLDER IN THE 1880s CAUSE CONFUSIONThere are two players with the name CharlesHouseholder in the baseball encyclopedias. Charles F.is listed as having been born in Harrisburg,Pennsylvania, in 1856. He played with Chicago andPittsburgh, Union Association, in 1884.
Charles W. is also shown as having been born inHarrisburg in 1856, and died there on October 26,
123

THE BASEBALL RESEARCH JOURNAL
1908. However, my research shows it was Charles F.who was born Harrisburg and died there onDecember 26, 1908. He played with Baltimore,American Association in 1882, and with Brooklyn inthe same league in 1884. He was one of Harrisburg'searly professional players. On October 11, 1884,Charles F. was seriously injured when he fell off a roofin Harrisburg. He eventually recovered and playedseveral more years in the minors. He died at his home,415 Pear Street on December 26, 1908. He was survived by his wife, five children, three brothers, and hisfather.
There was not much information on Charles W.except that he was from Philadelphia and notHarrisburg.
CAP ANSON WAIVED LAST TWO INNINGS OF GAME According tobaseball lore, there was a game in the 1890s in whichthe home team gave up its last two innings and let thevisiting club take its last two innings instead. Nodetails were given about the game. Ofcourse, baseballrules do not allow it, so it could have happened in anexllibitioll game. I found such an exhibition gallle tllatwas played in Chicago on Friday, April 13, 1894, withChicago playing Minneapolis of the Western Leagueat Chicago. The Chicago Tribune noted, '~son's
hard-working Colts played and won their fourth exhibition game yesterday, defeating Minneapolis in afairly well-played contest and established a queer
Iline." The Tribune its story thus:'~son waived the formality of playing the last twoinnings and gave the visitors their halves instead. Theyfailed to score and the game terminated with Chicagothree runs to the good:'
The weatller left 1Iluell to be desired and besides,Minneapolis had a train to catch. The line score:
MINNEAPOLIS 200 000 100 - 3 3 4
CHICAGO 000 202 2XX - 6 8 4
Fraser and Wilson; Donnelly, W Camp and
Kittridge. Time-1.55 Umpire-Jevne
Attendance-577
RED DOOIN, PHILLIES MANAGER, PUT AD IN PAPER FOR ACATCHER OnApril 2, 1912, manager Red Dooin of the Philadelphia,Phillies, who were in the midst of their annual preseason series with the crosstown Athletics, put the following ad in the Philadelphia Press:
"WANTED-A CATCHER. manager Dooin wouldlike one or two husky backstops report at thePhillies' clubhouse to assist in warming up thelarge squad ofpitchers. Dooin says it is a goodchancefor some youth to 'show the goods.'"
Dooin was impressed with Ed Irvin and wanted tosign him and farm him out. But Irvin was not interested in going to the minors.
Irvin turns up again on May 18. On that day theTigers had gone on strike when league president BanJohnson refused to reinstate Ty Cobb after he hadbeen suspended for going into the stands and hittingheckler Claude Lucker in a game at New York on May15. Lucker had heckled the Detroit star unmercifullyuntil Cobb lost his cool. IfDetroit failed to field a teamat Philadelphia on May 18, they were facing a $5,000fine. Manager Hugh Jennings was ordered by ownerFrank Navin to corral a team of amateurs and collegeplayers. Irvin was one of the players recruited. He didnot get into the game until the third inning, when hereplaced Bill Maharg at third base. It was MahargWllO gave a Plliladelpllia reporter the clue inSeptember 1920 that linked certain White Sox playerswith gamblers.
Getting back to Irvin, he was the star of the misfits.He registered two hits in three trips to the plate. Bothof his hits were triples, and he became the first playerin major league history to hit two triples in his first
with the Athletics winning by a score of 24-2.
MIKE MENOSKY, FORMER MAJOR LEAGUE PLAYER, CALLED UPON TOSETTLE COURT CASE Mike Menosky played in the majorsfor llille years witlI Pittsburgll, Federal Leag'ue, arIdWashington and Boston in the American League.Menosky, 57, a probation officer, helped decide a courtcase against a Detroit man. Because Menosky, an outfielder ill llis playing days, could not throw a rock 250feet, 21-year~0Id Robert Melson, of Detroit wasacquitted ofa charge ofmalicious destruction ofproperty. He was charged with throwing a rock through aDetroit terminal caboose window. The judge, o. z.Ide, who played first base for Kalamazoo College inhis youth, doubted whether Melson could throw arock that far. That's when the judge called on Menoskyfor help. Mike threw a baseball that·far but couldn'tthrow a rock that distance. The judge said that ifMikecouldn't do it, then the average man wouldn't have achance, and the case was dismissed.
124

Front coverp. 5 (top)p. 5 (lower)p. 18 (lower)p.43p. 47 (top)p. 56 (all)p. 57 (all)p. 58 (all)p.63p. 84
BRJ 31 PHOTO CREDITS
Ken Robbins.National Baseball Hall of Fame Library, Cooperstown, NY.Transcendental Graphics.National Baseball Hall of Fame Library, Cooperstown, NY.National Baseball Hall of FaIlle Library, Cooperstowll, NY.National Baseball Hall of Fame Library, Cooperstown, NY.National Baseball Hall of Fame Library, Cooperstown, NY.National Baseball Hall of Fame Library, Cooperstown, NY.National Baseball Hall of Fame Library, Cooperstown, NY.Transcendental Graphics.Northern Indiana Historical Society, Inc.
Natiollal Baseball Hall of Fal1.1e Library, Cooperstowll,Used by permission of The Topps Company, Inc.


seCIUY~ AMIRICAN.ASIUlL RISURCHSince August 1971, when sixteen "statistorians" gathered
in Cooperstown to form the Society for American BaseballResearch, SABR has been committed to helping peopleproduce and publish baseball research.
Today, SABR has nearly 7,000 members worldwide.They come from all walks of life-the one thing they allhave in common? A love for the game and its history.
Members receive the latest editions of SABR's researchannuals, The Baseball Research Journal and The NationalPastime. Also included is a subscription to The SABR
..L~..LLIL..L..L-".~Y. alld otller special publications.SABR membership is open to all those interested in
baseball research. Annual dues are $50 US, $60 Canadaand Mexico, and $65 overseas (US funds only). Studentand senior disc01.1nts are also available. For details aboutthe benefits of SABR membership, call (800) 969-SABRor visit www.sabr.org today!
SOCIETY FOR AMERICAN BASEBALL RESEARCH
812 HURON ROAD, CLEVELAND, OH 44115 (800)969-SABR
Pictured publications have been previously issued. For informationabout past SABR publications, call (800) 755-1105.

(1997 Special Publication, 64pp) $7.95
o BASEBALL FOR THE FUN OF ITA pictorial about the joy of baseball(1997, 92pp) $14.95
o COOPERSTOWN CORNERColumns from The Sporting News by LeeAllen (1990, 181pp) $10.00
o HOME RUNS IN THE OLD BALLPARKSListings of top 5 HR hitters in parks nolonger in use (1995) $9.95
THE NATIONAL PASTIME BIOGRAPHIES BY SABRTHE NATIONAL PASTIME features articles bymembers more general in nature, although 0 LEFTY GROVE: AMERICAN ORIGINALsome volumes are arranged in a theme, as Bio of HOF pitcher Lefty Grove writtennoted below. by Jim Kaplan (2000, 315pp) $12.95
0 #3, 19TH CENTURY PICTORIAL 0 UNCLE ROBBIE(Spring 1984, (88 pp) $7.00 Bio of HOF manager Wilbert Robinson
0 #4, (Spring 1985, 88 pp) $6.00 by Jack Kavanagh and Norman Macht
0 #5, (Winter 1985, 88 pp) $6.00(1999, 200pp) $12.95
0 #7, (Winter 1987, 88 pp) $6.00 0 ADDIE JOSS: KING OF THE PITCHERS
0 #10, (Fall 1990, 88 pp) $8.00 Bio of HOF pitcher Addie Joss by Scott
0 #11, (Fall 1991,88 pp) $7.95Longert (1998, 141pp) $14.95
0 #12, THE INTERNATIONAL PASTIME 0 RUN, RABBIT, RUN(Summer 1992, 96 pp) $7.95 Tales of Walter "Rabbit" Maranville
0 #13, (Summer 1993, 96 pp) $7.95 (1991, 96pp) $9.95
0 #14, (Summer 1994, 112 pp) $9.95
0 #15, (Spring 1995, 156 pp) $9.950 HOW TO DO BASEBALL RESEARCH
0 #16, (Spring 1996, 144 pp) $9.95 (2000, 163pp) $16.000 #17, (Spring 1997, 144 pp) $9.95
0 #19, (Summer 1999, 116 pp) $12.00 0 BASEBALL HISTORICAL REVIEW
0 #20, (Summer 2000, 132 pp) $12.00 Best of the 1972-74 BRJ (1981) $6.00
0 #21 (Summer 2001, 124 pp) $12.00
0 #22 (Fall 2002, 128 pp) $24.95THE NEGRO LEAGUES BOOK
0 Hardcover (1994, 382pp) $49.95
0 Ltd. Edition, leather-bound, slipcase,
SABR REVIEW OF BOOKS autographed (1994, 382pp) $149.95
0 $6.00MINOR LEAGUE HISTORY JOURNAL
VOLUME 1(1986) 0 VOLUME 2 (54pp) $6.000 VOLUME 2 (1987) $6.00
0 VOLUME 3 (72pp) $7.000 VOLUME 3 (1988) $7.000 VOLUME 4 (1989) $7.00SABR BOOKS ON
THE 19th CENTURY
o NINETEENTH CENTURY STARSBiographies of America's First Heroes,Non-Hall of Famers (1988, 144pp)$10.00
o BASEBALL'S FIRST STARSMore biographies, includes Hall ofFamers(1996, 183pp) $14.95
o BASE BALL: HOW TO BECOME A PLAYER1888 reprint by John MontgomeryWard (1993, 149 pp) $9.95
o 1985 (88pp) $6.00
o 1987 (88pp) $6.00
o 1988 (88pp) $7.00
o 1990 (88pp) $8.00
o 1991 (88pp) $8.00
o 1992 (88pp) $7.95
o 1993 (112pp) $9.95
o 1994 (112pp) $9.95
o 1995 (144pp) $9.95
o 1996 (154pp) $9.95
o 1997 (144pp) $9.95
o 1998 (116pp) $9.95
o 1999 (144pp) $12.00
o 2000 (144pp) $12.00
o 2001 (136pp) $12.00
THE BASEBALLRESEARCH JOURNAL
THE BASEBALL RESEARCH JOURNAL, the annualpublication of the society, features some ofthe best member research. Articles rangefrom statistical to biographical sketches, plusnearly every other topic in baseball.
NAME ------------------------
ADDRESS ------------------------:--
BOOK TOTAL
SHIPPING(Charges are $4.50 for thefirst book and 50 cents foreach additional book)
$---
$---
CITY, STATE, ZIP --------------------
DAYTIME PHONE _
NE RESIDENTS ADD SALES TAX
TOTAL
$---
$----
SEND YOUR ORDER TO: University of Nebraska Press, 233 North 8th Street, Lincoln, NE68588-0255 or call 1-800-755-1105 weekdays from 8:00am to 5:00pm CST. You mayalso place orders online at http://nebraskapress.unl.edu(5/2003)
MASTERCARD .. VISA ACCEPTED
CARD #
EXP.DATE