· spp part b: introduction kentucky part b state performance plan: 2005-2010 (omb no: 1820-0624 /...
TRANSCRIPT
SPP Part B: Introduction Kentucky
Part B State Performance Plan: 2005-2010 (OMB NO: 1820-0624 / Expiration Date: )
1
Kentucky Department of Education Division of Exceptional Children Services
January 30, 2007
Introduction to the 2007 Annual Performance Report and
The State Performance Plan
In 2004, Congress reauthorized the Individuals with Disabilities Education Act (IDEA). As part of the 2004 IDEA Reauthorization, Congress required that every State Educational Agency (SEA) submit a State Performance Plan (SPP) to the federal Office of Special Education Programs (OSEP). The SPP is a six-year performance plan, which evaluates a SEA’s efforts to implement IDEA requirements and describes how the SEA will improve its performance in twenty critical areas, known as indicators. Fourteen of the SPP indicators (Indicators One through Fourteen) are a combination of areas that gauge educational outcomes for students with disabilities, as well as school districts’ strict compliance with IDEA requirements. The last six SPP indicators (Indicators Fifteen through Twenty) judge the SEA’s exercise of general supervisory authority under IDEA. The Kentucky Department of Education (KDE) through the Division of Exceptional Children Services (DECS) submitted its first SPP to OSEP on December 2, 2005. The Office of Special Education and Rehabilitative Services (OSERS) approved the initial SPP on March 24, 2006. OSERS requested that DECS submit additional information on several indicators as part of the yearly update of the SPP, known as the Annual Performance Report (APR), due to OSEP by February 1, 2007. KDE opted instead to submit a “revised” SPP as allowed by OSEP. Included in this year’s revised SPP is the information requested by OSERS in March 2006. The 2007 SPP also contains information on the “new” SPP Indicators (Indicators Four B, Seven, Eight, Nine, Ten, Eleven, Thirteen, Fourteen and Eighteen) for which reports were not required in December 2005. The SPP for the “new indicators” is comprised of an Overview, Baseline Data and Discussion of the Data, Targets, and Activities with related Timelines and Resources. The revised 2007 SPP accompanies the 2007 APR as part of KDE’s annual submission to OSEP on our performance on the SPP indicators over the past year. Please note that when comparing the number of school districts in the 2005 SPP and the 2007 APR, the number will vary. In December 2005 (Federal Fiscal Year, or FFY, 2004), the year of the initial SPP, Kentucky had 176 school districts. For the current year (FFY 2006) Kentucky has 175 districts due to a merger between two districts. KDE projects there will be 174 districts for FFY 2007, again, the result of a merger between two districts. Data from the Kentucky Continuous Monitoring Process (KCMP) show an additional three districts to the number of school districts – Kentucky School for the Blind, Kentucky School for the Deaf and the Model Laboratory School located at Eastern Kentucky University. Thus, for FFY 2004 and 2005, for KCMP data, the total number of districts was 179. For FFY 2006, the number is 178. The 2007 APR contains the yearly updates on the performance of indicators addressed in the 2005 SPP – Indicators One, Two, Three, Four A, Five, Six, Twelve, Fifteen, Sixteen, Seventeen, Nineteen, and Twenty – as well as any needed revisions to the SPP Targets, Activities, Timelines and Resources for these indicators.
DECS began the process of writing this year’s APR and making revisions to the SPP in February 2006. The SPP/APR work group consisted of DECS staff, staff from KDE’s Division of Early Childhood Development, and the Special Education Cooperative Network (hereafter referred to as the Special
SPP Part B: Introduction Kentucky
Part B State Performance Plan: 2005-2010 (OMB NO: 1820-0624 / Expiration Date: )
2
Education Co-ops). The work group met a minimum of one time a month throughout the year, with the meetings being facilitated by Kentucky’s liaison from the Mid-South Regional Resource Center.
DECS also began monthly conference calls with its OSEP contact and its Mid-South liaison in summer 2006. The purposes of the calls were to discuss the status of the SPP and APR indicators and to obtain advice from OSEP in areas of uncertainty. DECS staff also participated on all monthly technical assistance calls with OSEP’s Director of Monitoring and State Improvement Planning Division. DECS obtained additional technical assistance from the National Center on Special Education Accountability Monitoring (NCSEAM) for the 2007 APR and SPP, which was a continuation of NCSEAM’s on-going work with Kentucky since 2005. DECS also consulted with the State Advisory Panel for Exceptional Children (SAPEC) several times during the process of developing the 2007 SPP/APR. DECS requested the SAPEC’s input on Targets and Activities for the “new “SPP indicators - once on October 19, 2006 and most recently on January 18, 2007. In addition to the required input from the SAPEC, DECS and the Division of Early Childhood Development consulted with other stakeholders and KDE divisions. Groups that provided input on the 2007 SPP/APR include the Special Education Co-op, the Statewide Collaboration Workgroup, the Kentucky Interagency Transition Council for Persons with Disabilities, , the Kentucky Postschool Outcomes Advisory Group, Preschool Coordinators, Directors of Special Education, Early Childhood Regional Training Center Directors, Early Childhood Faculty from Institutions of Higher Education, KDE’s Division of Curriculum and Instruction, and KDE’s Division of Assessment Implementation. KDE will post its revised 2007 SPP and APR on the KDE web site by the end of February 2007. A banner will announce the location of the documents on the web site. KDE’s Division of Communication will simultaneously issue a press release to Kentucky’s largest newspapers, announcing the posting of the documents. By the end of April 2007, KDE will report to the public on the performance of each school district in a similar manner, i.e., posting districts’ performance on the KDE web site and through a press release to the state’s largest newspapers. Since beginning the process in 2003, KDE has spent enormous amounts of time and resources in the development of its Annual Performance Reports and State Performance Plans. Fortunately, the efforts have proved to be enormously meaningful. The process of developing the SPP and APR - collecting and analyzing data, talking to stakeholders, setting meaningful targets, and developing and revising activities based on the data - has led KDE to center its efforts on critical areas in IDEA as reflected by the SPP Indicators. We believe that the result of this focus will be better outcomes for children with disabilities in the Commonwealth of Kentucky.

SPP Part B: Acronyms Kentucky
Part B State Performance Plan: 2005-2010 (OMB NO: 1820-0624 / Expiration Date: )
3
Acronyms for the Kentucky Department of Education State Performance Plan
and Annual Performance Report
Adequate Yearly Progress (AYP)
Admissions and Release Committee (ARC)
Annual Performance Report (APR)
Area Development Districts (ADD)
Autism (AUT)
Average Daily Attendance (ADA)
Biennial Performance Report (BPR).
Comprehensive Test of Basic Skills (CTBS)
Commonwealth Accountability Testing System (CATS)
Carolina Curriculum for Preschoolers with Special Needs (CCPSN)
Consortium for Appropriate Dispute Resolution (CADRE)
Continuous Improvement Monitoring Process (CIMP)
Corrective Action Plan (CAP)
Council for Exceptional Children (CEC)
Council for Children with Behavior Disorders (KyCCBD)
Developmental Delay (DD)
Director of Special Education (DoSE)
Disability Services Coordinators (DSCs)
District Early Intervention Council (DEIC)
Division of Exceptional Children Services (DECS)
Emotional Behavioral Disability (EBD)
Family Resource and Youth Service Centers (FRYSCs)
Federal Fiscal Year (FFY)
Free Appropriate Public Education (FAPE)
Functional Assessment on Behavioral and Social Supports (FABSS)
Functional Mental Disability (FMD)
General Supervision Enhancement Grant (GSEG)
Hawaii Early Learning Profile (HELP)
Health Access Nurturing Development Services (HANDS)
Helpful Entry Level Skills Checklist (HELS)
Highly Skilled Educators (HSE)
Human Development Institute at the University of Kentucky (HDI)
SPP Part B: Acronyms Kentucky
Part B State Performance Plan: 2005-2010 (OMB NO: 1820-0624 / Expiration Date: )
4
Individual Education Program (IEP)
Individuals with Disabilities Education Act (IDEA)
Institution of Higher Education (IHE)
Interagency Coordinating Council (ICC)
Interdisciplinary Early Childhood Education (IECE)
Kentuckiana Regional Planning and Development Agency (KRPDA) Kentucky Accessible Materials Consortium (KAMC)
Kentucky Accessible Materials Database (KAMD)
Kentucky Administrative Regulation (KAR)
Kentucky Assistive Technology Systems (KATS)
Kentucky Board of Education (KBE)
Kentucky Center for Instructional Discipline (KCID)
Kentucky Continuous Monitoring Process (KCMP)
Kentucky Core Content Test (KCCT)
Kentucky Department of Education (KDE)
Kentucky Early Childhood Data System (KEDS)
Kentucky Early Childhood Transition Project (KECTP)
Kentucky Education Reform Act (KERA)
Kentucky Educational Television (KET)
Kentucky In-School Transition Survey (KISTS)
Kentucky Instructional Discipline Schools (KIDS Project)
(University of) Kentucky Training Into Practice Project (K-TIPP)
Least Restrictive Environment (LRE)
Legislative Research Commission (LRC)
Limited English Proficiency (LEP)
Local Educational Agency (LEA)
Memorandum of Agreement (MOA)
Mental Disability (MD)
Mild Mental Disability (MMD)
Mid-South Regional Resource Center (MSRRC)
National Center for Culturally Responsive Educational Systems (NCCRESt)
National Center for Special Education Accountability Monitoring (NCSEAM)
National Center on Post-School Outcomes (NPSO),
National Instructional Materials Access Center (NIMAC)
National Secondary Transition Technical Assistance Center (NSTTAC)
No Child Left Behind (NCLB)
Occupational Therapy (OT)
SPP Part B: Acronyms Kentucky
Part B State Performance Plan: 2005-2010 (OMB NO: 1820-0624 / Expiration Date: )
5
Office of Legal and Legislative Services (OLLS)
Office of Special Education and Rehabilitative Services (OSERS)
Office of Special Education Programs (OSEP)
Office of Special Instructional Services (OSIS)
Other Health Impairment (OHI)
Parent Advocacy Coalition for Educational Rights (PACER)
Parent Resource Center (PRC)
Physical Therapy (PT)
Positive Behavior Supports (PBS)
Professional Development (PD)
Regional Training Centers (RTCs)
Request for Proposal (RFP)
School-wide Information System (SWIS)
Socio-Economic Status (SES)
Special Education Tracking System (SETS)
State Educational Agency (SEA)
State Improvement Grant (SIG)
State Improvement Grant, Nurturing All Learners (SIGNAL)
Specific Learning Disability (SLD)
Speech and Language (S/L)
State Advisory Panel for Exceptional Children (SAPEC)
State Education Agency (SEA)
State Performance Plan (SPP)
Student Information System (SIS)
Transdisciplinary Play Based Assessment (TPBA)
United Parents in Kentucky (UPINKY)
Universal Design for Learning (UDL)
Work Sampling System (WSS)
SPP Part B: Indicator 1 Kentucky
Part B State Performance Plan: 2005-2010 (OMB NO: 1820-0624 / Expiration Date: )
6
Part B State Performance Plan (SPP) for 2005-2010
Overview of the State Performance Plan Development: See Introduction.
Monitoring Priority: FAPE in the LRE
Indicator 1: Percent of youth with IEPs graduating from high school with a regular diploma compared to percent of all youth in the State graduating with a regular diploma.
(20 U.S.C. 1416 (a)(3)(A))
Measurement:
As directed by OSEP, Kentucky is reporting these data from two sources. We are using the OSEP formula to calculate the graduation rate for students with disabilities and the Kentucky Department of Education (KDE) formula that determines the graduation rate for all youth grades 9-12. We are using two data sources because KDE has been unable to disaggregate its graduation rate data for all youth. Since Kentucky has now assigned unique student identifiers, we have the capability to disaggregate the 2005-2006 dropout data. However, since the graduation rate formula is based on four (4) years of dropout data, Kentucky will continue to use two sources for Indicator 1 until four years of data are collected.
Below is Kentucky’s formula for calculating the graduation rate for all youth.
CompletersCY (standard diploma in 4 years + IEP specifying more than 4 yrs) -------------------------------------------------------------------------------------------------------------------------
CompletersCY (standard diplomas + certificates) + Grade 12 dropoutsCY + Grade 11 dropoutsCY-1 + Grade 10 dropoutsCY-2 + grade 9 dropoutsCY-3
CY=Current Year
As defined by Kentucky’s formula, the Graduation rate for all youth is the quotient of the number of current year grade 12 completers (standard diploma within 4 years plus students with disabilities whose IEPs stipulate they will need more than four (4) years to obtain a standard diploma) divided by the number of current year grade 12 completers (standard diplomas plus certificates of completion) plus the number of current year grade 12 dropouts plus the number of dropouts from the current 12th grade that dropped out as 11th graders plus number of dropouts from the current 12th grade class that dropped out as 10th graders plus number of dropouts from the current 12th grade class that dropped out as 9th graders. Here is the OSEP formula we used to determine the graduation rate for students with disabilities.
# graduates receiving regular diplomas # grads + # GEDs (and certificates) + # dropouts + # who maxed in age + # died
Overview of Issue/Description of System or Process:
The Kentucky Board of Education (KBE) has declared Refocusing Secondary Education a high priority for the state. In August 2004 KBE adopted a Conceptual Framework for Refocusing Secondary Education that articulates the agenda for secondary reform in Kentucky. KDE introduced this Framework to identify the why, what, and how of securing better outcomes for all Kentucky students. Since the Framework was adopted, there has been extensive discussion among students, practitioners, and stakeholders about how

SPP Part B: Indicator 1 Kentucky
Part B State Performance Plan: 2005-2010 (OMB NO: 1820-0624 / Expiration Date: )
7
to improve the middle and high school experience. Kentucky’s Prichard Committee and the Kentucky Business Forum are involved in these discussions. Components of the Framework include: • Zero Dropouts by supporting every student to persist to graduation with a plan for transitioning to the
next level of learning • A Learning Guarantee to ensure every student leaves high school prepared to participate in the next
level of learning without need for remediation • A Plan for Life that provides every student with the opportunity to perform at high levels in a chosen
field The Framework supports KDE and local school efforts to improve the educational experience for middle and high school students for a successful transition to postsecondary experiences. As Kentucky moves forward with the Refocusing Secondary Education initiative, KDE’s Division of Exceptional Children Services (DECS) will be involved in the planning and implementation of this initiative to ensure the needs of students with disabilities are considered and accommodated. KDE has also established a network between middle and high schools and the Secondary Alliance and has linked this network to a national network for middle and high school reform. We also participate in The Student Voice and the Kentucky Secondary Alliance. In November 2004 Kentucky sent representatives, including students, to the National Summit on Improving America’s High Schools sponsored by the United States Department of Education. Kentucky also sent representatives to the National Summit on Improving Results for Youth sponsored by the (OSEP) National Center on Secondary Education and Transition both in 2003 and 2005. Additionally, at the direction of KBE, KDE has clarified and refined the Core Content for Assessment and has developed a timeframe and implementation plan for the refocusing the work of secondary schools. As a result of these efforts, the work of the P-16 Council, and review of various national reports (e.g., American Diploma Project, National Governors Association), KBE is considering promulgating regulations to amend the current minimum requirements for high school graduation to strengthen the requirement for individual graduation planning for all students. Other actions under consideration of KBE include: • Finalizing recommendations for the promulgation of Administrative Regulations for changing
graduation requirements • Continuing implementation of secondary agenda in Kentucky Secondary Alliance school districts • Continuing the Student Voice project to involve students in the Refocusing Secondary work • Strengthening the individual graduation planning process by awarding a contract for web-enabled
plan and beginning promulgation of Administrative Regulations to introduce high levels of student and school accountability for individual graduation plans as a high school graduation requirement
Kentucky’s Current Diploma Program Kentucky schools must provide students with disabilities the opportunity and necessary instructional supports and accommodations to progress through a course of study leading to a diploma. Students with disabilities who earn the required high school credits through successful completion of content area and elective course work as described in the Program of Studies are awarded a diploma. The conditions that youth with IEPs must meet in order to graduate with a regular diploma are the same as the conditions of youth without disabilities. KDE identifies the minimum credits required for graduation (704 KAR 3:305) while the local district sets the local requirements in their district graduation policy. 704 KAR 3:305 that outlines Kentucky’s

SPP Part B: Indicator 1 Kentucky
Part B State Performance Plan: 2005-2010 (OMB NO: 1820-0624 / Expiration Date: )
8
minimum high school graduation requirements was finalized in 2006. This administrative regulation becomes effective with the graduating class of 2012. According to the Program of Studies for Kentucky Schools, students with disabilities may pursue a course of study leading to a diploma in one or a combination of the following ways: • Completion of at least 22 credits as described in the Program of Studies • Completion of 22 credits based on submission by a local board of education of an integrated,
interdisciplinary or higher level course for a required course if the alternative course provides rigorous content and addresses the same academic expectations
• Completion of at least 22 credits based on submission by a local board of education of a substitute functional, integrated, applied interdisciplinary or higher level course for a required course if the alternative course provides rigorous content and addresses the same academic expectations
Graduation credits are awarded as either Carnegie units (defined as at least 120 hours of instructional time in one subject) or performance-based credits defined at the local level. Districts and schools are accountable for ensuring each student’s education program includes the minimum content standards as specified in the Program of Studies and for providing the student with the opportunity to learn the standards and appropriate supports based on the individual learning needs of a student.
To reinforce Kentucky’s efforts to increase the graduation rate for students with disabilities, our State Improvement Grant, SIGNAL (State Improvement Grant, Nurturing All Learners) funds the Kentucky Transition Collaborative housed at the Human Development Institute at the University of Kentucky (HDI-UK). The Collaborative, involving twenty-one state agencies, is responsible for coordinating and implementing much of the secondary transition component of SIGNAL. Administered by KDE’s DECS, SIGNAL assists students with disabilities and their families in making a successful transition from school to adult life by helping students:
• Receive transition services • Participate in the transition planning process • Complete vocational education programs • Enter community colleges and universities • Attain paid employment upon exiting school • Maintain their employment status • Participate in and complete school-to-work programs
In addition to funding the Collaborative, SIGNAL includes four objectives related to transition.
SIGNAL Objective 1: To create state-level systems change through improved capacity of state-level transition personnel
We are addressing this objective by regionalizing transition knowledge, information, and support. Eleven regional interagency teams meet on a regular basis and communicate with the State Interagency Transition Council. Likewise, the State Interagency Council communicates with the regional teams as well as with the State Advisory Panel for Exceptional Children (SAPEC) and the Department of Vocational Rehabilitation’s Consumer Advisory Panel. Regional transition facilitators from the Kentucky Special Education Co-ops, referred to hereafter as Special Education Co-ops, lead the eleven regional interagency transition teams. This workgroup, known as the State Transition Core Team, keeps abreast of issues, concerns, and trends as identified by regional teams and provides support and guidance to KDE. (Refer to Attachment A: Kentucky Plan for Transition Interagency Infrastructure.)
SIGNAL Objective 2: To improve the capacity of staff at postsecondary settings to support students with disabilities
SPP Part B: Indicator 1 Kentucky
Part B State Performance Plan: 2005-2010 (OMB NO: 1820-0624 / Expiration Date: )
9
We are addressing this objective by increasing pre-service secondary transition training opportunities and implementing strategies to increase the number of students who transition from high school to post-secondary education. The Kentucky Community and Technical Colleges System (KCTCS) is collaborating with Kentucky’s Institutes of Higher Education to develop pre-service, secondary transition training modules for college faculty. On-going communication with IHE Disability Services Coordinators (DSCs) and development of the handbook, Access to Postsecondary Education, is further facilitating the transition of students to post-secondary settings. SIGNAL Objective 3: To increase the knowledge of education and related personnel, through the dissemination of transition resources We are addressing this objective by obtaining and disseminating information about existing post-school resources to students, parents, and teachers. Activities are designed to ensure people know about the post-school services for which they may be eligible and how to access those services. We will produce two videos, Your Child with Special Needs: Public School Resources, and Your Child with Special Needs: From High School to Community and disseminate them through Kentucky Educational Television (KET). SIGNAL Objective 4: To improve the skills and capacity of teachers through multiple professional development opportunities
In collaboration with the Special Education Co-ops, we are developing online training modules specific to teachers, administrators, students, and parents. The modules can be completed online or downloaded for onsite trainings. Online modules include quizzes and automatically build a “transition portfolio” for users as they complete training. Directors of Special Education can also use the modules for professional development. Modules are accessed through the HDI-UK Transition One-Stop web page.
Baseline Data for FFY 2004 (2004-2005):
As explained in the section, Measurement, at the beginning of this indicator, we are using two sources of data for this report. Kentucky’s graduation rate for students with disabilities is 61.0%. We used Section 618 Exiting data from 2004-2005 and the OSEP formula to calculate this rate.
2,992 graduates receiving regular diploma divided by (2,992 regular diploma graduates + 378 graduates receiving certificates + 1,464 special education students who dropped out + 27 special education students who aged out + 35 special education students who died) equals 2,992 students divided by 4,896 students
The 2004-2005 graduation rate for all youth in Kentucky is 82.84%. This rate was calculated using Kentucky’s formula for the graduation rate of all youth explained in the Measurement section at the beginning of this indicator.
36,872 completers receiving standard diploma in 4 years + 255 completers with IEP allowing more than 4 years divided by (36,872 completers receiving standard diploma in 4 years + 255 completers with IEP allowing more than 4 years + 695 completers requiring more than 4 years + 380 certificates + 1,607 grade 12 dropouts + 1,631 grade 11 dropouts + 1,750 grade 10 dropouts + 1,630 grade 9 dropouts) equals 37,127 students divided by 44,820 students
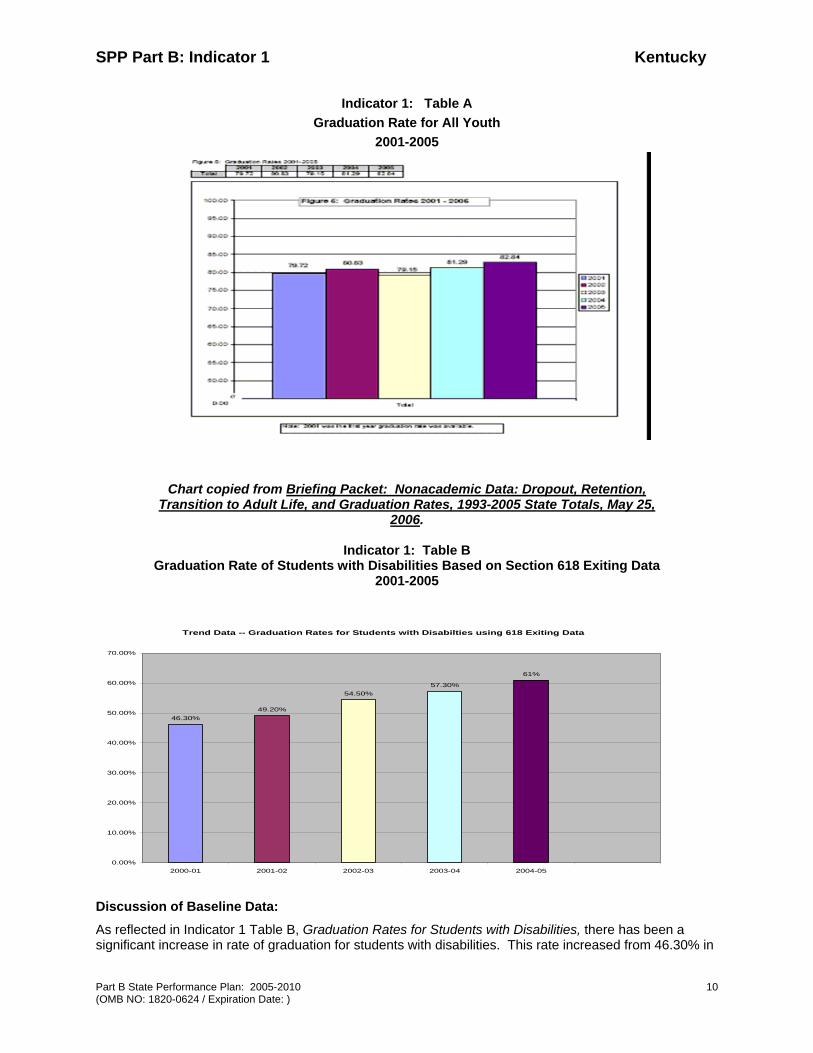
For the years 2001-2005, the following graphs show the state graduation rate for all youth (refer to Measurement section of this indicator), Indicator 1 Table A and the graduation rate of students with disabilities based on Section 618 exiting data, Indicator 1 Table B.
SPP Part B: Indicator 1 Kentucky
Part B State Performance Plan: 2005-2010 (OMB NO: 1820-0624 / Expiration Date: )
10
Indicator 1: Table A Graduation Rate for All Youth
2001-2005
Chart copied from Briefing Packet: Nonacademic Data: Dropout, Retention, Transition to Adult Life, and Graduation Rates, 1993-2005 State Totals, May 25,
2006.
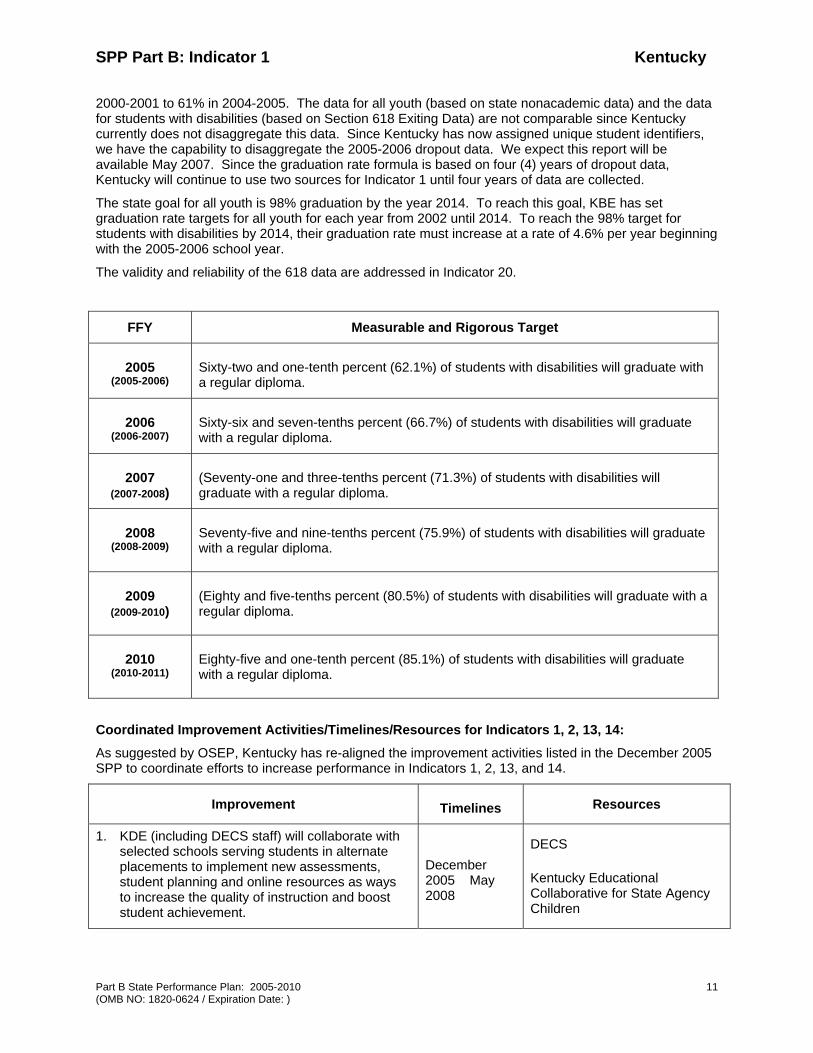
Indicator 1: Table B Graduation Rate of Students with Disabilities Based on Section 618 Exiting Data
2001-2005
Trend Data -- Graduation Rates for Students with Disabilties using 618 Exiting Data
46.30%49.20%
54.50%57.30%
61%
0.00%
10.00%
20.00%
30.00%
40.00%
50.00%
60.00%
70.00%
2000-01 2001-02 2002-03 2003-04 2004-05
Discussion of Baseline Data:
As reflected in Indicator 1 Table B, Graduation Rates for Students with Disabilities, there has been a significant increase in rate of graduation for students with disabilities. This rate increased from 46.30% in
SPP Part B: Indicator 1 Kentucky
Part B State Performance Plan: 2005-2010 (OMB NO: 1820-0624 / Expiration Date: )
11
2000-2001 to 61% in 2004-2005. The data for all youth (based on state nonacademic data) and the data for students with disabilities (based on Section 618 Exiting Data) are not comparable since Kentucky currently does not disaggregate this data. Since Kentucky has now assigned unique student identifiers, we have the capability to disaggregate the 2005-2006 dropout data. We expect this report will be available May 2007. Since the graduation rate formula is based on four (4) years of dropout data, Kentucky will continue to use two sources for Indicator 1 until four years of data are collected.
The state goal for all youth is 98% graduation by the year 2014. To reach this goal, KBE has set graduation rate targets for all youth for each year from 2002 until 2014. To reach the 98% target for students with disabilities by 2014, their graduation rate must increase at a rate of 4.6% per year beginning with the 2005-2006 school year.
The validity and reliability of the 618 data are addressed in Indicator 20.
FFY Measurable and Rigorous Target
2005 (2005-2006)
Sixty-two and one-tenth percent (62.1%) of students with disabilities will graduate with a regular diploma.
2006 (2006-2007)
Sixty-six and seven-tenths percent (66.7%) of students with disabilities will graduate with a regular diploma.
2007 (2007-2008)
(Seventy-one and three-tenths percent (71.3%) of students with disabilities will graduate with a regular diploma.
2008 (2008-2009)
Seventy-five and nine-tenths percent (75.9%) of students with disabilities will graduate with a regular diploma.
2009 (2009-2010)
(Eighty and five-tenths percent (80.5%) of students with disabilities will graduate with a regular diploma.
2010 (2010-2011)
Eighty-five and one-tenth percent (85.1%) of students with disabilities will graduate with a regular diploma.
Coordinated Improvement Activities/Timelines/Resources for Indicators 1, 2, 13, 14:
As suggested by OSEP, Kentucky has re-aligned the improvement activities listed in the December 2005 SPP to coordinate efforts to increase performance in Indicators 1, 2, 13, and 14.
Improvement Timelines Resources
1. KDE (including DECS staff) will collaborate with selected schools serving students in alternate placements to implement new assessments, student planning and online resources as ways to increase the quality of instruction and boost student achievement.
December 2005 May 2008
DECS
Kentucky Educational Collaborative for State Agency Children

SPP Part B: Indicator 1 Kentucky
Part B State Performance Plan: 2005-2010 (OMB NO: 1820-0624 / Expiration Date: )
12
Improvement Timelines Resources
2. DECS will schedule annual data analysis reviews of the KCMP.
February 2006 and annually
DECS
Mid-south Regional Resource Center
3. DECS will develop additional data collection tools to determine program effectiveness and facilitate targeted activities for improvement.
December 2005 - February 2008
DECS KCMP Monitoring Work Group NCSEAM Mid-South Regional Resource
Center
4. KDE will continue funding the position of State Transition Coordinator through DECS.
December 2005 and Ongoing
DECS
Special Education Co-ops
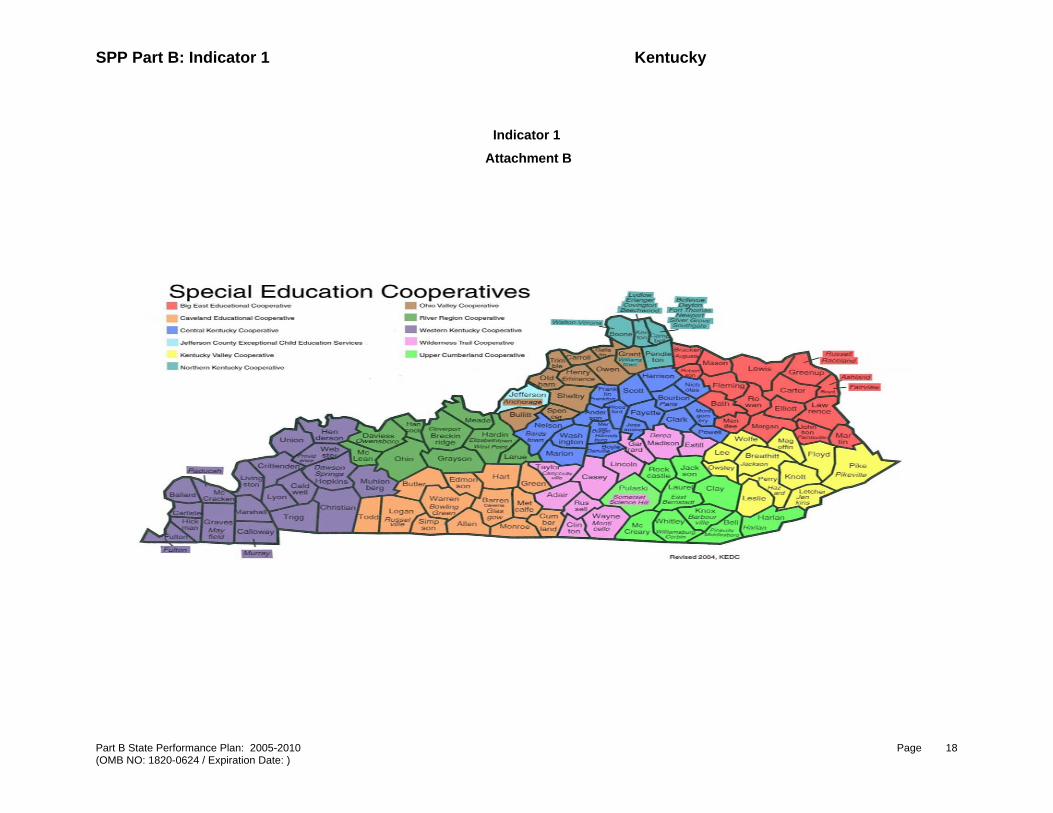
5. KDE will continue funding the position of Transition Consultant in each of the eleven Special Education Co-ops. State transition initiatives drive the work of the Transition consultants as liaisons between KDE and the local school districts, provide professional development, and provide technical assistance to their schools and districts, including Individual Graduation Planning, Interagency Agreements and facilitation of Regional Interagency Transition Teams, and IEP Transition requirements. (See map of Kentucky Special Education Co-operative Network at the end of this section as Indicator 1 Attachment B.)
December 2005 and Ongoing
DECS
Special Education Co-ops
6. Each KDE initiative that affects students with disabilities shall include a minimum of one DECS staff person to serve as members of the team to increase communication and collaboration both intra- and inter-departmentally within KDE.
December 2005 and Ongoing
DECS
Other divisions within KDE
7. DECS staff will serve on the committee in
development and implementation of the Individual Learning Plan for all students. Transition Consultants will align transition-requirements training with the Individual Learning Plan process.
2006 - 2010 DECS
Special Education Co-op Transition Consultants
8. DECS staff and Transition Consultants will disseminate information to special education personnel regarding interdisciplinary courses created through a collaborative effort led by the Division of Career and Technical Education.
2006 and ongoing
DECS
Special Education Co-op Transition Consultants

SPP Part B: Indicator 1 Kentucky
Part B State Performance Plan: 2005-2010 (OMB NO: 1820-0624 / Expiration Date: )
13
Improvement Timelines Resources
9. DECS and the Kentucky Transition Collaborative will continue: a. Providing training and technical assistance to
schools and adult services agencies b. Establishing and supporting regional
demonstration projects to improve transition services on a local level
c. Establishing and facilitating continuation of community, regional and state level interagency transition teams (See Infrastructure chart as Indicator 1 Attachment A).
d. Developing and maintaining a statewide transition database
e. Developing and disseminating information and materials on transition and transition planning
2006-2010 DECS Special Education Co-op Transition Consultants HDI-UK Mid-south Regional Resource Center
10. Special Education Co-op Transition Consultants will meet with the Kentucky Association on Higher Education and Disability regarding disability documentation needs of students entering postsecondary education institutions after graduation and to develop technical assistance documents and professional development for high schools and post-secondary institutions.
December 2005- 2009
DECS
Special Education Co-op Transition Consultants
Kentucky Association on Higher Education and Disability
Mid-south Regional Resource Center
11. DECS and interagency partners will continue work on development of the Transition One-Stop website for all transition points, birth through adult.
December 2005 and Ongoing
DECS Kentucky Early Childhood Project Kentucky Commission for Children with Special Health Care Needs Kentucky Transition Collaborative Special Education Co-op Transition Consultants Mid-south Regional Resource Center
12. DECS and Special Education Transition Consultants will establish a pilot project on student-led IEPs in each Special Education Co-op region.
December 2005 - June 2008
DECS Kentucky Transition Collaborative Special Education Co-op Transition Consultants HDI-UK

SPP Part B: Indicator 1 Kentucky
Part B State Performance Plan: 2005-2010 (OMB NO: 1820-0624 / Expiration Date: )
14
Improvement Timelines Resources
13. DECS will examine Kentucky’s transition-related activities and align them with the National Standards and Indicators for Secondary Education and Transition for program effectiveness. DECS will disseminate Standards to interagency partners, Co-op Transition consultants, Directors of Special Education, KDE staff, and IHEs.
December 2005 – June 2008
DECS National Center for Secondary Education and Transition National Standards and Indicators for Secondary Education and Transition Mid-south Regional Resource Center
14. DECS will continue its partnership with the National Center for Secondary Education and Transition, the National Secondary Transition Technical Assistance Center, the National Dropout Prevention Center, and the National Post-School Outcomes Center through: a. Conference calls b. Email communication c. National Conference attendance
December 2005 and Ongoing
DECS National Center for Secondary Education and Transition National Post-School Outcomes Center National Secondary Transition Technical Assistance Center National Dropout Prevention Center Mid-south Regional Resource Center
15. DECS staff will compare the data from the parent survey described under Indicator 8 (Parent Involvement) and the data from Indicator 14 (post-school outcome survey) to determine correlations between parent involvement and successful student outcomes in graduation. Based on data, DECS will develop interventions and strategies to increase high school graduation.
February 2008 - 2009
DECS Parental Survey Data Post-school Survey Data
16. Special Education Co-op Transition consultants in partnership with DECS develop parent training modules that will be used by the Parent Resource Centers, the Kentucky Special Parent Involvement Network (KYSPIN) or both.
December 2005 - February 2008
DECS Special Education Co-op Transition Consultants Parent Resource Centers KY-SPIN

SPP Part B: Indicator 1 Kentucky
Part B State Performance Plan: 2005-2010 (OMB NO: 1820-0624 / Expiration Date: )
15
Improvement Timelines Resources
17. DECS will continue e-mail distribution (Transition In-Box) of research-based and effective strategies for transition to districts.
Ongoing DECS Parent Advocacy Coalition for Education Rights National Center on Secondary Education and Transition National Collaborative on Workforce and Disability for Youth National Secondary Transition Technical Assistance Center National Dropout Prevention Center for Students with Disabilities National Post-school Outcomes Center
18. Special Education Co-ops will establish an electronic network for sharing and dissemination of research-based and effective practices as well as professional development strategies and activities across Kentucky’s Special Education Cooperative Network.
December 2005 -February 2007
DECS Special Education Co-ops
Kentucky Virtual High School (www.kvhs.org)
19. DECS will publicize the use of Kentucky Virtual High School (on-line courses for high school credit) by all students.
July 2007 – 2010
DECS Kentucky Virtual High School (www.kvhs.org)
20. DECS will contact KVHS regarding expanding course offerings in order to promote access and use by students with a career and technical focus.
July 2008- 2010
DECS
Kentucky Virtual High School (www.kvhs.org)
21. DECS will partner with Special Education Co-ops to form a collaborative relationship with the Commonwealth Center for Instructional Technology and Learning (CCITL) to disseminate evidence-based and effective strategies for instruction to districts.
December 2005 and ongoing
DECS Special Education Co-ops
Commonwealth Center for Instructional Technology and Learning (www.ccitl.uky.edu)
22. DECS will update the Kentucky Dropout Prevention Resource Guide (a web-based research guide).
July 2008 - 2010
DECS Kentucky Dropout Prevention Resource Guide (http://www.IHDI.uky.edu/dropout-prevention/)
23. DECS will disseminate research–based strategies through the National Dropout Prevention Center.
December 2005 - ongoing
DECS National Dropout Prevention Center Mid-south Regional Resource Center
SPP Part B: Indicator 1 Kentucky
Part B State Performance Plan: 2005-2010 (OMB NO: 1820-0624 / Expiration Date: )
16
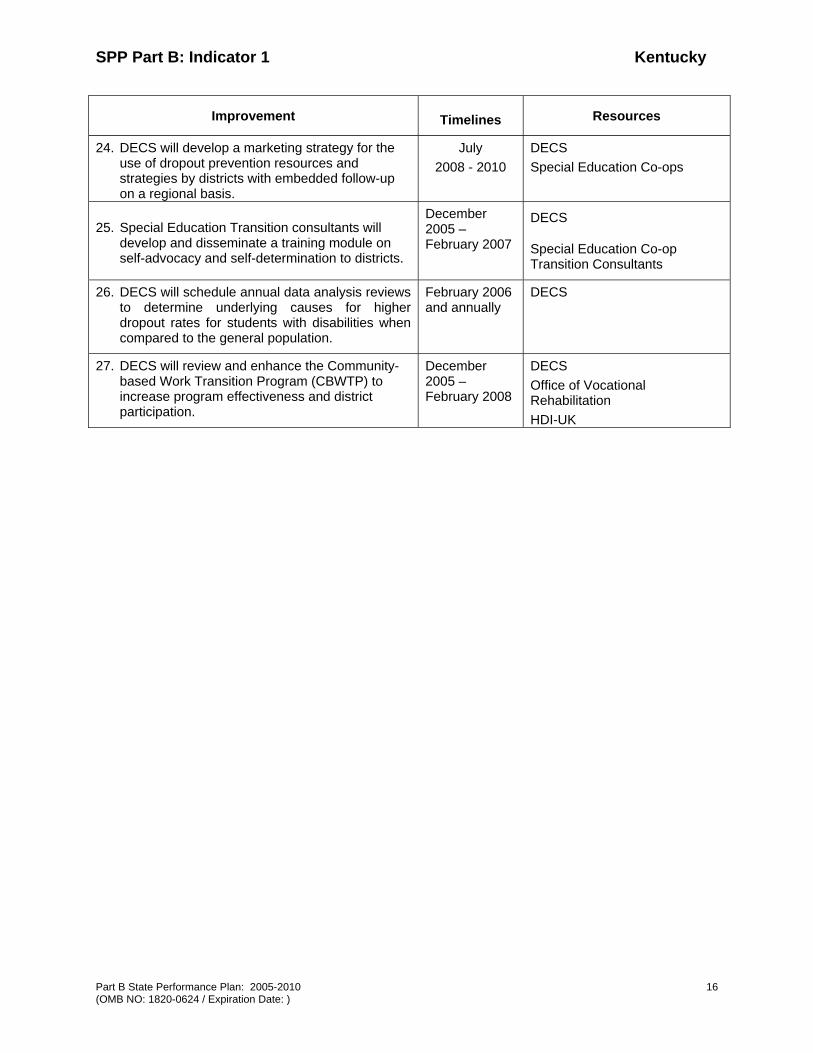
Improvement Timelines Resources
24. DECS will develop a marketing strategy for the use of dropout prevention resources and strategies by districts with embedded follow-up on a regional basis.
July 2008 - 2010
DECS Special Education Co-ops
25. Special Education Transition consultants will develop and disseminate a training module on self-advocacy and self-determination to districts.
December 2005 – February 2007
DECS
Special Education Co-op Transition Consultants
26. DECS will schedule annual data analysis reviews to determine underlying causes for higher dropout rates for students with disabilities when compared to the general population.
February 2006 and annually
DECS
27. DECS will review and enhance the Community-based Work Transition Program (CBWTP) to increase program effectiveness and district participation.
December 2005 – February 2008
DECS Office of Vocational Rehabilitation HDI-UK

SPP Part B: Indicator 1 Kentucky
Part B State Performance Plan: 2005-2010 Page (OMB NO: 1820-0624 / Expiration Date: )
17
Indicator 1
Attachment A
Kentucky Plan for Transition Interagency Infrastructure
Transition Summit Team Role: Developers and facilitators of
system
State Transition Core Team Role: Keep abreast of issues, concerns, and trends as identified by
Regional Teams; provide support/guidance to State Transition Coordinator and State Improvement Grant - Transition
State Interagency Transition Council Role: State-level stakeholders develop
policy decisions
11 Regional Interagency Transition Teams Based upon Special Education Cooperative Structure via Special Education Cooperative Network Transition Team
BEEC CESC OVEC ECS
CKSEC JCPS KVSEC NKCES RRC UCSEC WTSEC WKEC
SPP Part B: Indicator 1 Kentucky
Part B State Performance Plan: 2005-2010 Page (OMB NO: 1820-0624 / Expiration Date: )
18
Indicator 1
Attachment B

SPP Part B: Indicator 2 Kentucky
Part B State Performance Plan: 2005-2010 Page (OMB NO: 1820-0624 / Expiration Date: )
19
Part B State Performance Plan (SPP) for 2005-2010
Overview of the State Performance Plan Development: See Introduction.
Monitoring Priority: FAPE in the LRE
Indicator 2: Percent of youth with IEPs dropping out of high school compared to the percent of all youth in the State dropping out of high school.
(20 U.S.C. 1416 (a)(3)(A))
Measurement: Based on direction from OSEP, we revised the original December 2005 SPP to include two sources for all youth data and students with disabilities data. However, from the data for the 2005-06 school year we are unable to disaggregate the dropout rate for students with disabilities from the formula Kentucky uses to calculate the dropout rate for all youth. Although Kentucky’s formula is explained below, for this report we are using the following OSEP formula (event rate) to calculate the dropout rate for students with disabilities.
# 2004-2005 SpEd dropouts from grades 9-12 equals the dropout rate for students with disabilities divided by the total 2004-2005 SpEd enrollment in grades 9-12
Since Kentucky has now assigned unique student identifiers, we intend to disaggregate the dropout rate for students with disabilities based on the dropout rate data for all youth submitted for the 2005-06 school year. These data will be available May 2007. Following is the formula Kentucky uses to calculate the dropout rate for all youth.
# 2004-2005 all youth dropouts from grades 9-12 equals dropout rate for all youth divided by total 2004-2005 all youth enrollment in grades 9-12
Overview of Issue/Description of System or Process:
According to the Kentucky Department of Education’s (KDE) 2005-2006 Nonacademic Data Report Guidelines (2004-2005 School Year Data) September 2005, dropout data is reported for each grade, 9 through 12 by gender and race for students with and without disabilities. The Kentucky Board of Education had adopted the National Center for Educational Statistics definition of a dropout. According to this definition, a dropout is an individual who meets all four of the following conditions: 1. Was enrolled in school at some time during the previous year (2004-2005) 2. Was not enrolled at the beginning of the current school year (2005-2006) 3. Has not graduated from high school or completed a state or district approved educational program 4. Does not meet any of the following exclusionary conditions: (a) transferred to another public school
district, private school, or state or district approved education program; (b) temporarily absent due to suspension; or (c) died (or deceased)
KDE is committed to reducing the dropout rate for all youth, including those with disabilities. Schools are accountable for their dropout rates through Kentucky’s Commonwealth Accountability Testing System (CATS) explained in Indicator 3. The dropout rate is a component of the nonacademic data

SPP Part B: Indicator 2 Kentucky
Part B State Performance Plan: 2005-2010 Page (OMB NO: 1820-0624 / Expiration Date: )
20
used to determine a high school’s academic index. To support schools’ efforts to reduce their dropout rates, KDE revised its Secondary GED program system. The regulation governing the Secondary GED Program became final in February 2005.
We have also created a web-based Dropout Prevention Resource Guide that provides a comprehensive source of effective dropout prevention strategies for educators, parents, and others interested in helping youth in at risk situations stay in school. The website includes an index with research articles that present common scenarios and cites particular strategies and resources related to the scenarios. It also provides A Student Needs Form that is a checklist of indicators associated with students at risk of dropping out of school. Educators and parents can use this form to find strategies and resources targeted to a particular student's needs.
KBE is currently considering interventions to recommend to schools showing the least progress in raising performance and closing achievement gaps between the subpopulations, including students with disabilities and the general education population. Interventions focus on the major topics of: school culture, leadership, articulated curriculum, effective instruction, and data-driven decisions and progress monitoring. Interventions related to dropout prevention are:
• Including culture/climate assessments as part of the school and district audit process with a district and school follow-up plan for implementation and evaluation of impact on student learning
• Forming teacher assistance teams to assist students who are struggling academically, socially and/or emotionally
• Assigning students assigned an adult mentor • Revising School Report Cards to bring more prominence to the scores of subpopulations of students • Using a well defined continuous formative assessment process to evaluate and analyze student
performance so that teachers will know where the student is performing at the beginning of each year and can track the student and teacher progress throughout the school year
Baseline Data for FFY 2004 (2004-2005):
Based on dropout data from 2004-2005 and the OSEP formula, Kentucky’s dropout rate for students with disabilities is 5.48% (1,464 special education dropout students in grades 9-12 divided by 26,716 special education students enrolled in grades 9-12). Based on dropout data from 2004-2005, Kentucky’s dropout rate for all youth is 3.49% (6,522 students who dropped out in grades 9-12 divided by 186,625). As explained in the section, Measurement, at the beginning of this indicator, Kentucky is reporting both the dropout rate for students with disabilities based on OSEP’s formula and the state’s dropout rate for all youth grades 9-12 based on Kentucky’s formula. Disaggregated dropout data for the 2005-2006 data will be available May 2007. For the years 2001-2005, the following graphs show the state dropout rate calculated according to Kentucky’s formula explained in the Measurement section of this indicator.
SPP Part B: Indicator 2 Kentucky
Part B State Performance Plan: 2005-2010 (OMB NO: 1820-0624 / Expiration Date: )
21
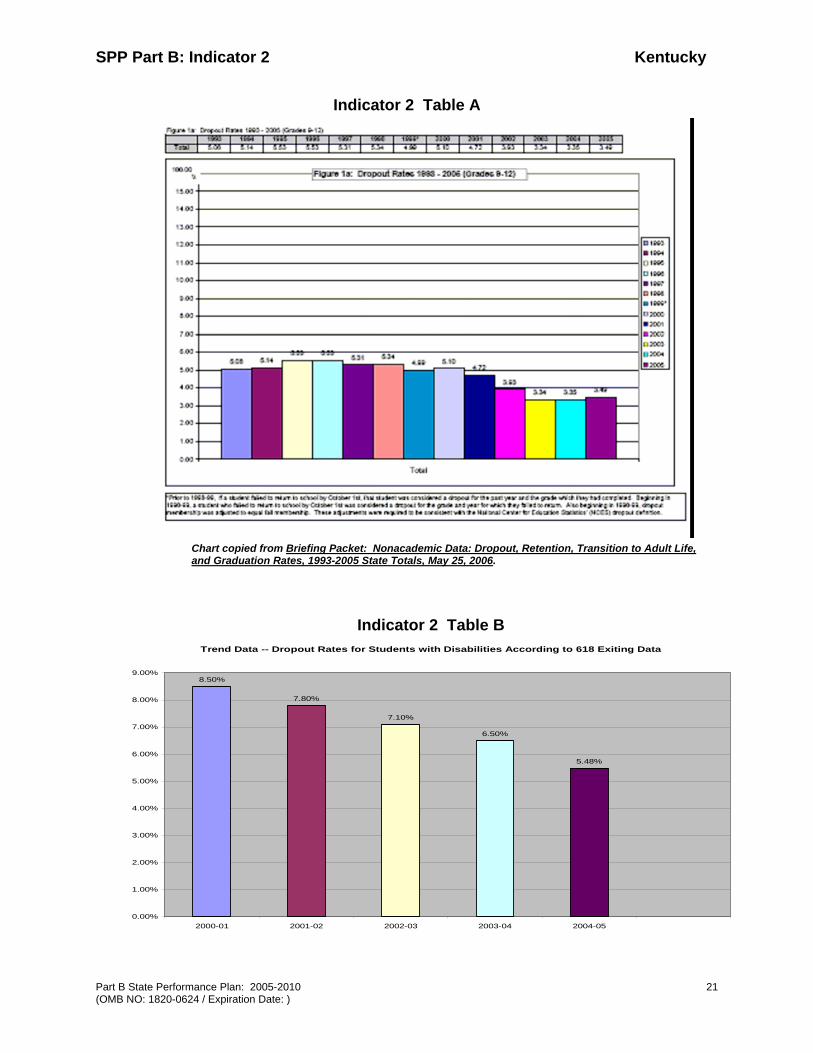
Indicator 2 Table A
Chart copied from Briefing Packet: Nonacademic Data: Dropout, Retention, Transition to Adult Life, and Graduation Rates, 1993-2005 State Totals, May 25, 2006.
Indicator 2 Table B Trend Data -- Dropout Rates for Students with Disabilities According to 618 Exiting Data
8.50%
7.80%
7.10%
6.50%
5.48%
0.00%
1.00%
2.00%
3.00%
4.00%
5.00%
6.00%
7.00%
8.00%
9.00%
2000-01 2001-02 2002-03 2003-04 2004-05
SPP Part B: Indicator 2 Kentucky
Part B State Performance Plan: 2005-2010 Page (OMB NO: 1820-0624 / Expiration Date: )
22
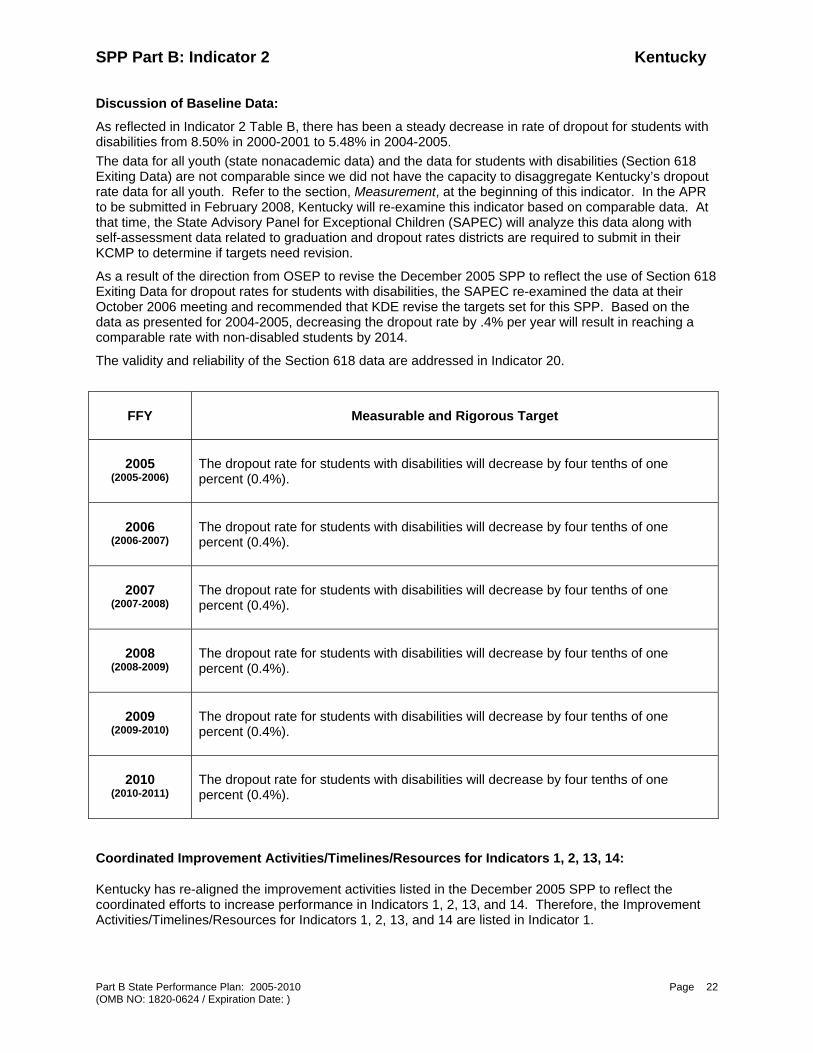
Discussion of Baseline Data:
As reflected in Indicator 2 Table B, there has been a steady decrease in rate of dropout for students with disabilities from 8.50% in 2000-2001 to 5.48% in 2004-2005. The data for all youth (state nonacademic data) and the data for students with disabilities (Section 618 Exiting Data) are not comparable since we did not have the capacity to disaggregate Kentucky’s dropout rate data for all youth. Refer to the section, Measurement, at the beginning of this indicator. In the APR to be submitted in February 2008, Kentucky will re-examine this indicator based on comparable data. At that time, the State Advisory Panel for Exceptional Children (SAPEC) will analyze this data along with self-assessment data related to graduation and dropout rates districts are required to submit in their KCMP to determine if targets need revision.
As a result of the direction from OSEP to revise the December 2005 SPP to reflect the use of Section 618 Exiting Data for dropout rates for students with disabilities, the SAPEC re-examined the data at their October 2006 meeting and recommended that KDE revise the targets set for this SPP. Based on the data as presented for 2004-2005, decreasing the dropout rate by .4% per year will result in reaching a comparable rate with non-disabled students by 2014.
The validity and reliability of the Section 618 data are addressed in Indicator 20.
FFY Measurable and Rigorous Target
2005 (2005-2006)
The dropout rate for students with disabilities will decrease by four tenths of one percent (0.4%).
2006 (2006-2007)
The dropout rate for students with disabilities will decrease by four tenths of one percent (0.4%).
2007 (2007-2008)
The dropout rate for students with disabilities will decrease by four tenths of one percent (0.4%).
2008 (2008-2009)
The dropout rate for students with disabilities will decrease by four tenths of one percent (0.4%).
2009 (2009-2010)
The dropout rate for students with disabilities will decrease by four tenths of one percent (0.4%).
2010 (2010-2011)
The dropout rate for students with disabilities will decrease by four tenths of one percent (0.4%).
Coordinated Improvement Activities/Timelines/Resources for Indicators 1, 2, 13, 14:
Kentucky has re-aligned the improvement activities listed in the December 2005 SPP to reflect the coordinated efforts to increase performance in Indicators 1, 2, 13, and 14. Therefore, the Improvement Activities/Timelines/Resources for Indicators 1, 2, 13, and 14 are listed in Indicator 1.
SPP Part B: Indicator 3 Kentucky
Part B State Performance Plan: 2005-2010 Page (OMB NO: 1820-0624 / Expiration Date: )
23
Part B State Performance Plan (SPP) for 2005-2010 Overview of the State Performance Plan Development:
Monitoring Priority: FAPE in the LRE
Indicator 3: Participation and performance of children with disabilities on statewide assessments:
A. Percent of districts that have a disability subgroup that meets the State’s minimum “n” size meeting the State’s AYP objectives for progress for disability subgroup.
B. Participation rate for children with IEPs in a regular assessment with no accommodations; regular assessment with accommodations; alternate assessment against grade level standards; alternate assessment against alternate achievement standards.
C. Proficiency rate for children with IEPs against grade level standards and alternate achievement standards.
(20 U.S.C. 1416 (a)(3)(A))
Measurement:
A. Percent = [(# of districts meeting the State’s AYP objectives for progress for the disability subgroup (children with IEPs)) divided by the (total # of districts that have a disability subgroup that meets the State’s minimum “n” size in the State)] times 100.
B. Participation rate =
a. # of children with IEPs in assessed grades; b. # of children with IEPs in regular assessment with no accommodations (percent = [(b)
divided by (a)] times 100); c. # of children with IEPs in regular assessment with accommodations (percent = [(c) divided
by (a)] times 100); d. # of children with IEPs in alternate assessment against grade level achievement standards
(percent = [(d) divided by (a)] times 100); and e. # of children with IEPs in alternate assessment against alternate achievement standards
(percent = [(e) divided by (a)] times 100).
Account for any children included in a but not included in b, c, d, or e above.
Overall Percent = [(b + c + d + e) divided by (a)].
C. Proficiency rate =
a. # of children with IEPs in assessed grades; b. # of children with IEPs in assessed grades who are proficient or above as measured by the
regular assessment with no accommodations (percent = [(b) divided by (a)] times 100); c. # of children with IEPs in assessed grades who are proficient or above as measured by the
regular assessment with accommodations (percent = [(c) divided by (a)] times 100); d. # of children with IEPs in assessed grades who are proficient or above as measured by the
alternate assessment against grade level achievement standards (percent = [(d) divided by (a)] times 100); and
e. # of children with IEPs in assessed grades who are proficient or above as measured against alternate achievement standards (percent = [(e) divided by (a)] times 100).
Account for any children included in a but not included in b, c, d, or e above. Overall Percent = [(b + c + d + e) divided by (a)].
SPP Part B: Indicator 3 Kentucky
Part B State Performance Plan: 2005-2010 Page (OMB NO: 1820-0624 / Expiration Date: )
24
Overview of Issue/Description of System or Process:
Since the Kentucky Education Reform Act (KERA) of 1990, the vision of the Kentucky Education System has been all children can learn at high levels. By regulation, all students in the Commonwealth have access to the Program of Studies and Core Content for Assessment that is used to develop the state assessment known as the Kentucky Core Content Test (KCCT). Consequently, Kentucky does not have alternate standards for assessments.
Students who cannot participate in the regular curriculum, even with accommodations, are required to submit an alternate portfolio that reflects their special curriculum. Most of these students have profound cognitive disabilities. With few exceptions, all students participate in the KCCT and are included in the Commonwealth Assessment Testing System (CATS). Only 1.37% of the entire student population is exempted from Kentucky’s assessment program each year.
Before the federal No Child Left Behind Act (NCLB), Kentucky administered the Kentucky Core Content Test (KCCT) in grades 4, 7, and 10 for reading and grades 5, 8, and 11 for mathematics. The Comprehensive Test of Basic Skills (CTBS) was given at grades 3 and 6. The CTBS, a Nationally Norm Referenced Test, was given as a means of comparing all of our 3rd and 6th grade students to the rest of the nation, but it was not disaggregated by novice, apprentice, proficient, or distinguished like the KCCT and Alternate Assessment. Since NCLB mandates students in grades 3 through 8 are tested annually in reading and mathematics, Kentucky began revising its assessment system to meet NCLB requirements and Office of Special Education Programs (OSEP) noncompliance issues regarding Kentucky’s alternative assessment system in 2005-2006.
Baseline Data for (2004-2005): A. Percent of Districts Meeting State Annual Yearly Progress (AYP) Objectives for Disability Subgroup
In Kentucky, 76 of 176 school districts (43.2%) met 100% of their No Child Left Behind AYP goals.
On the performance of students with disabilities by content area, 122 (69.32%) school districts met their AYP goals in reading and 112 (63.64%) school districts met their AYP goals in mathematics.
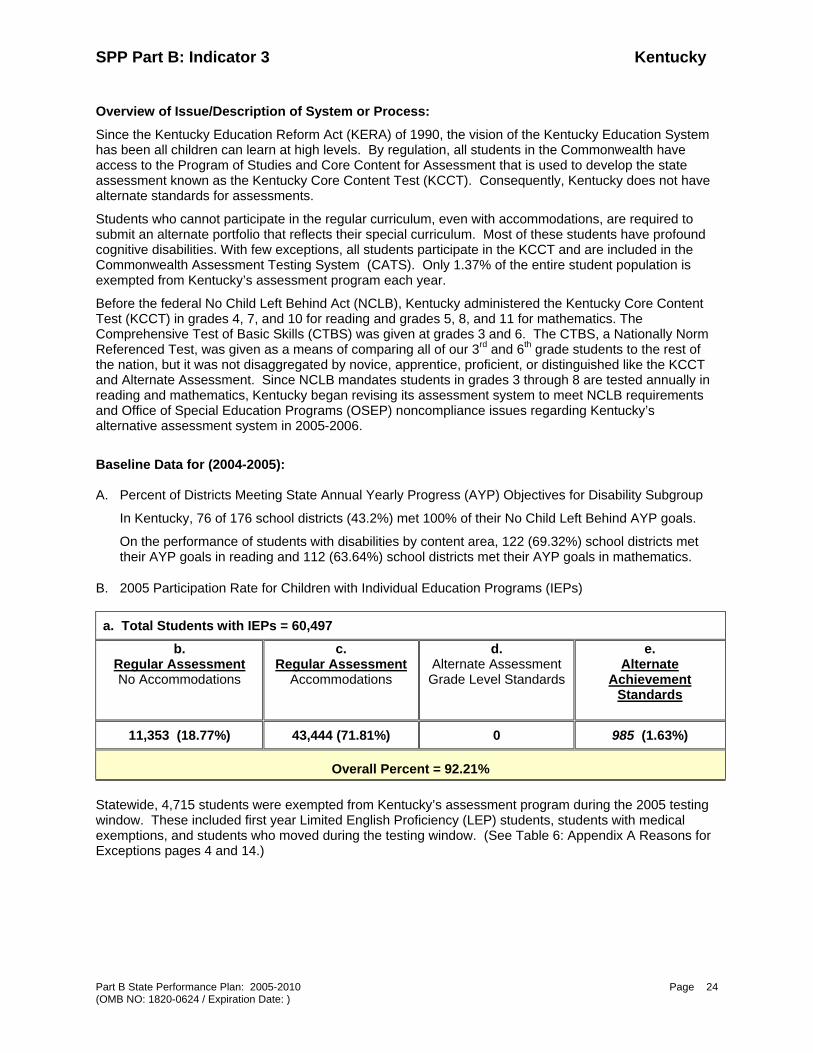
B. 2005 Participation Rate for Children with Individual Education Programs (IEPs)
a. Total Students with IEPs = 60,497 b.
Regular Assessment No Accommodations
c. Regular Assessment
Accommodations
d. Alternate Assessment
Grade Level Standards
e. Alternate
Achievement Standards
11,353 (18.77%) 43,444 (71.81%) 0 985 (1.63%)
Overall Percent = 92.21%
Statewide, 4,715 students were exempted from Kentucky’s assessment program during the 2005 testing window. These included first year Limited English Proficiency (LEP) students, students with medical exemptions, and students who moved during the testing window. (See Table 6: Appendix A Reasons for Exceptions pages 4 and 14.)

SPP Part B: Indicator 3 Kentucky
Part B State Performance Plan: 2005-2010 Page (OMB NO: 1820-0624 / Expiration Date: )
25
C. 2005 Proficiency Rate
Children with IEPS in assessed grades who are proficient or above as measured by the regular assessment and alternate achievement standards.
a. Total in Assessed Grades = No Accommodations: Reading 4,622 Math 4,111 Accommodations: Reading 12,943 Math 12,271 Alternate Assessment: Reading 450 Math 535
Totals for Reading and Math: 18, 015 16, 917
b. No Accommodations
c.
Accommodations
d. Alternate Assessment Grade Level Standards
e. Alternate Achievement
Standards
Totals Totals 0 Totals
Reading Math 1335 697
Reading Math 4227 2414
Shade gray
Reading Math 364 390
Percents Percents Shade gray Percents
Reading Math 28.88% 16.95%
Reading Math 32.66% 19.67%
Shade gray
Reading Math 80.88% 72.89%
Totals for Reading proficient or above: Totals for Math proficient or above:
No Accom.: Reading 1,335 Accom.: Reading 4,227 Alter. Asses.: Reading 364 5,926
No Accom.: Math 697 Accom.: Math 2,414 Alter. Asses. Math 390 3,501
Overall Percent Reading proficient or above = 32.89 %
Math proficient or above = 20.69 %
Discussion of 2004-2005 Baseline Data:
A. Districts Meeting AYP Objectives
In the 2005 State Performance Plan (SPP), we reported only the districts that met the NCLB requirements on an overall basis (across grades and content areas). We did not report the number of districts that met the state’s AYP goals by reading and math.
We have changed the 2006 SPP to include both the overall AYP data (across grades and content areas) as well as the districts that met the NCLB AYP goals for both reading and math.
B. Participation Rate
The baseline data for 3B was completed using Table 6 (Indicator 3 Appendix A), which is an OSEP required report on the participation and performance of students with disabilities on
SPP Part B: Indicator 3 Kentucky
Part B State Performance Plan: 2005-2010 (OMB NO: 1820-0624 / Expiration Date: )
26
assessments by content area and type of assessment. Kentucky is currently in the process of revising the general education Kentucky Core Content Test (KCCT) Assessment System to meet all NCLB testing requirements as well as to address the noncompliance issue with our Alternate Assessment. The revised Alternate Assessment that meets the NCLB requirement to test students on the alternate assessment as often as their non disabled peers will go into effect for the 2006-2007 school year. In addition, all students, including those with disabilities, who take the KCCT will also be tested in grades 3 through 8 for reading and math. All revisions to the Commonwealth Accountability System (CATS) will be in place by the 2007-2008 school year. Kentucky is currently at a 92.21% participation rate. DECS expects that rate of participation to rise as each of the revisions to the testing system go into effect. Further, in the March 24, 2006 letter to the Commissioner of the Kentucky Department of Education the Office of Special Education and Rehabilitative Services (OSEP) cited Kentucky as being in noncompliance regarding its alternate assessment system. The Division of Exceptional Children Services (DECS) was required to report on the status of the development and implementation of the alternate assessments for children with disabilities in grades 3, 6, and 9. In a letter to the director of OSEP dated September 1, 2006, DECS explained Kentucky’s alternate assessment system was being revised to test all students on the alternate assessment as often as their non-disabled peers. The alternate assessment has also been revised to include the following three major components:
1. Alternate Assessment Portfolio
2. Transition Attainment Record 3. Attainment Tasks
DECS is including the timeline and activities we have established to meet compliance (Indicator 3 Appendix B). OSEP and DECS continue to have ongoing conversations about the revisions being made to Kentucky’s Alternate Assessment.
C. Proficiency Rate
The Table 6 report required by OSEP does not distinguish proficiency rate by students who did not use accommodations (b) from those who used accommodations (c). To answer Indicator 3C parts b and c, DECs worked very closely with the Division of Assessment to get the data. As stated above, the 3rd- 8th grade reading and math KCCT and Alternate Assessment will go into effect for the 2006-2007 school year. This will allow DECS to report the proficiency rate for all students’ grades 3 through 8 on the KCCT and the alternate assessments in the 2007 APR, which is based on 2006-2007 school year data. However since the revised assessment system does not begin to test all students 3 through 8 until this school year (2006-2007), the data in this revised 2006 SPP and the 2006 APR is based on Kentucky’s former assessment system, which only tested students in 4, 7, and 10 for reading and grades 5, 8, and 11 for mathematics. In the future, Kentucky will not be able to use Table 6 to answer 3C parts b and c (proficiency and above not using accommodations and using accommodations) until OSEP requires states to include the above desegregation of the data. DECS was able to use Table 6 for the alternate assessment data (e) to report proficiency rate in reading and math for students who where on the alternate portfolio. The overall percent of proficiency and above for students with disabilities in reading is 32.89% and in math 20.69%. DECS expects the rate of proficiency to rise considerably because we will be testing all students at each grade level 3 through 8 this school year (2006-2007). A copy of the additional accommodations vs. no accommodations data table has been provided for review (Indicator 3 Appendix C).

SPP Part B: Indicator 3 Kentucky
Part B State Performance Plan: 2005-2010 Page (OMB NO: 1820-0624 / Expiration Date: )
27
The validity and reliability of Section 618 data are addressed in Indicator 20. Measurable and Rigorous Targets:
FFY 3A Measurable and Rigorous Targets
2005 (2005-2006)
Overall: Fifty-three or (31%) of our districts will meet State AYP objectives for progress for disabilities subgroups (children with IEPs).
Reading: One hundred twenty-two or (69%) of our districts will meet State AYP objectives for progress for disabilities subgroups (children with IEPs) in reading.
Math: One hundred twelve or (63%) of our districts will meet State AYP objectives for progress for disabilities subgroups (children with IEPs) in math.
2006 (2006-2007)
Overall: Seventy-nine or (45%) of our districts will meet State AYP objectives for progress for disabilities subgroups (children with IEPs).
Reading: One hundred thirty-two or (75%) of our districts will meet State AYP objectives for progress for disabilities subgroups (children with IEPs) in reading.
Math: One hundred twenty-five or (71%) of our districts will meet State AYP objectives for progress for disabilities subgroups (children with IEPs) in math.
2007 (2007-2008)
Overall: One hundred three or (50%) of our districts will meet State AYP objectives for progress for disabilities subgroups (children with IEPs).
Reading: One hundred forty-two or (80%) of our districts will meet State AYP objectives for progress for disabilities subgroups (children with IEPs).
Math: One hundred thirty-eight or (78%) of our districts will meet State AYP objectives for progress for disabilities subgroups (children with IEPs).
2008 (2008-2009)
Overall: One hundred twenty-eight or (73%) of our districts will meet State AYP objectives for progress for disabilities subgroups (children with IEPs).
Reading: One hundred fifty-two or (86%) of our districts will meet State AYP objectives for progress for disabilities subgroups (children with IEPs) in reading.
Math: One hundred fifty-one or (85.7%) of our districts will meet State AYP objectives for progress for disabilities subgroups (children with IEPs) in math.
2009 (2009-2010)
Overall: One hundred fifty-three or (87%) of our districts will meet State AYP objectives for progress for disabilities subgroups (children with IEPs).
Reading: One hundred sixty-two or (92%) of our districts will meet State AYP objectives for progress for disabilities subgroups (children with IEPs) in reading.
Math: One hundred sixty-four or (93%) of our districts will meet State AYP objectives for progress for disabilities subgroups (children with IEPs) in math.
2010 (2010-2011)
Overall: One hundred seventy-six or (100%) of our districts will meet State AYP objectives for progress for disabilities subgroups (children with IEPs).
Reading: One hundred seventy-six or (100%) of our districts will meet State AYP objectives for progress for disabilities subgroups (children with IEPs) in reading.
Math: One hundred seventy-six or (100%) of our districts will meet State AYP objectives for progress for disabilities subgroups (children with IEPs) in math.
SPP Part B: Indicator 3 Kentucky
Part B State Performance Plan: 2005-2010 (OMB NO: 1820-0624 / Expiration Date: )
28
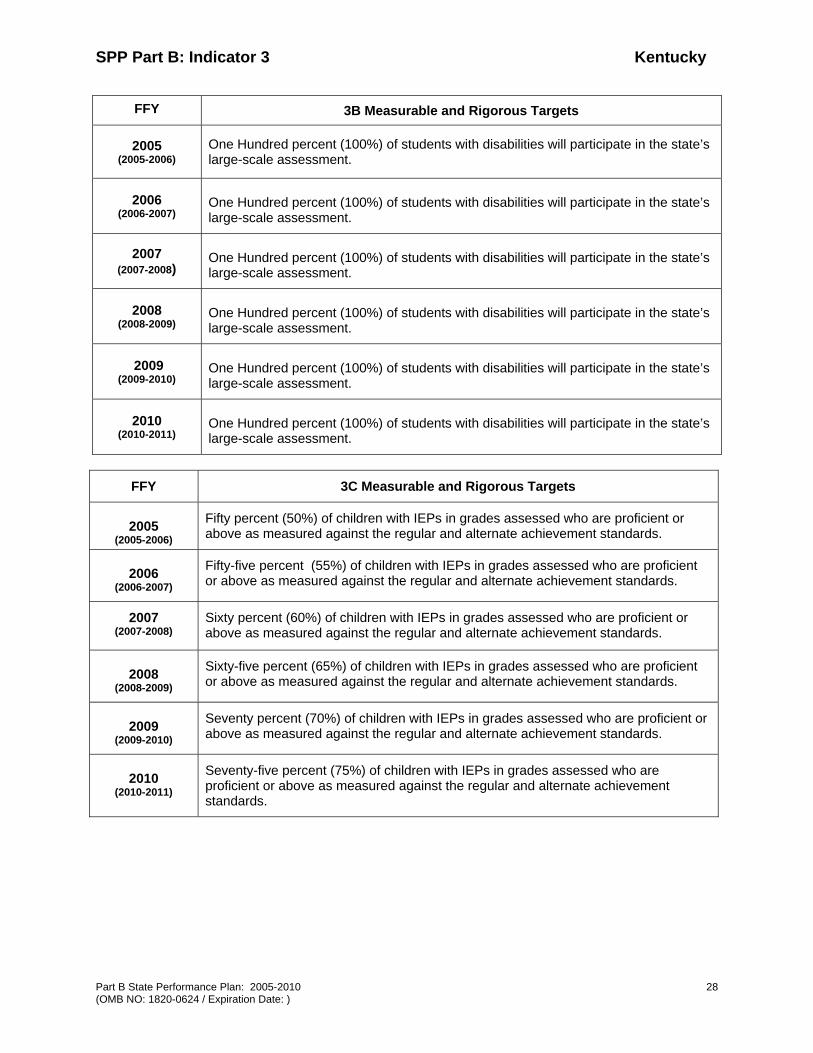
FFY 3B Measurable and Rigorous Targets
2005 (2005-2006)
One Hundred percent (100%) of students with disabilities will participate in the state’s large-scale assessment.
2006 (2006-2007)
One Hundred percent (100%) of students with disabilities will participate in the state’s large-scale assessment.
2007 (2007-2008)
One Hundred percent (100%) of students with disabilities will participate in the state’s large-scale assessment.
2008 (2008-2009)
One Hundred percent (100%) of students with disabilities will participate in the state’s large-scale assessment.
2009 (2009-2010)
One Hundred percent (100%) of students with disabilities will participate in the state’s large-scale assessment.
2010 (2010-2011)
One Hundred percent (100%) of students with disabilities will participate in the state’s large-scale assessment.
FFY 3C Measurable and Rigorous Targets
2005 (2005-2006)
Fifty percent (50%) of children with IEPs in grades assessed who are proficient or above as measured against the regular and alternate achievement standards.
2006 (2006-2007)
Fifty-five percent (55%) of children with IEPs in grades assessed who are proficient or above as measured against the regular and alternate achievement standards.
2007 (2007-2008)
Sixty percent (60%) of children with IEPs in grades assessed who are proficient or above as measured against the regular and alternate achievement standards.
2008 (2008-2009)
Sixty-five percent (65%) of children with IEPs in grades assessed who are proficient or above as measured against the regular and alternate achievement standards.
2009 (2009-2010)
Seventy percent (70%) of children with IEPs in grades assessed who are proficient or above as measured against the regular and alternate achievement standards.
2010 (2010-2011)
Seventy-five percent (75%) of children with IEPs in grades assessed who are proficient or above as measured against the regular and alternate achievement standards.

SPP Part B: Indicator 3 Kentucky
Part B State Performance Plan: 2005-2010 (OMB NO: 1820-0624 / Expiration Date: )
29
Improvement Activities/Timelines/Resources:
Improvement Timelines Resources
1. Develop training module to provide technical assistance to DOSEs, district, and school staff on how to use the student data tool to make data-driven decisions.
2006- 2007 DECS Special Education Co-ops
Office of Assessment and Accountability
2. DECS will analyze the 2005 KCMP data for areas of needed growth in order to design and provide technical assistance to each of the special education coops and districts.
2006
on-going
DECS Special Education Co-ops Mid South Regional Resource Center
3. DECS, in partnership with other divisions within the department, will conduct on-site visits to schools who are closing the achievement gap. A description of exemplary practices shown to reduce the achievement gaps will be written and then shared with struggling districts.
2006-2007 DECS Federal Programs and Equity Other KDE Divisions
4. DECS, in partnership with the Kentucky Accessible Materials Consortium (KAMC), will analyze the 5 UDL Pilot Schools to identify effective UDL practices (2007-2008).
2007-2008 DECS
KAMC
5. DECS will continue to fund the Literacy Consultant at each of the Special Education Co-ops
2005
on-going
DECS Various partners from across the state Special Education Co-ops
SPP Part B: Indicator 3 Kentucky
Part B State Performance Plan: 2005-2010 Page (OMB NO: 1820-0624 / Expiration Date: )
30
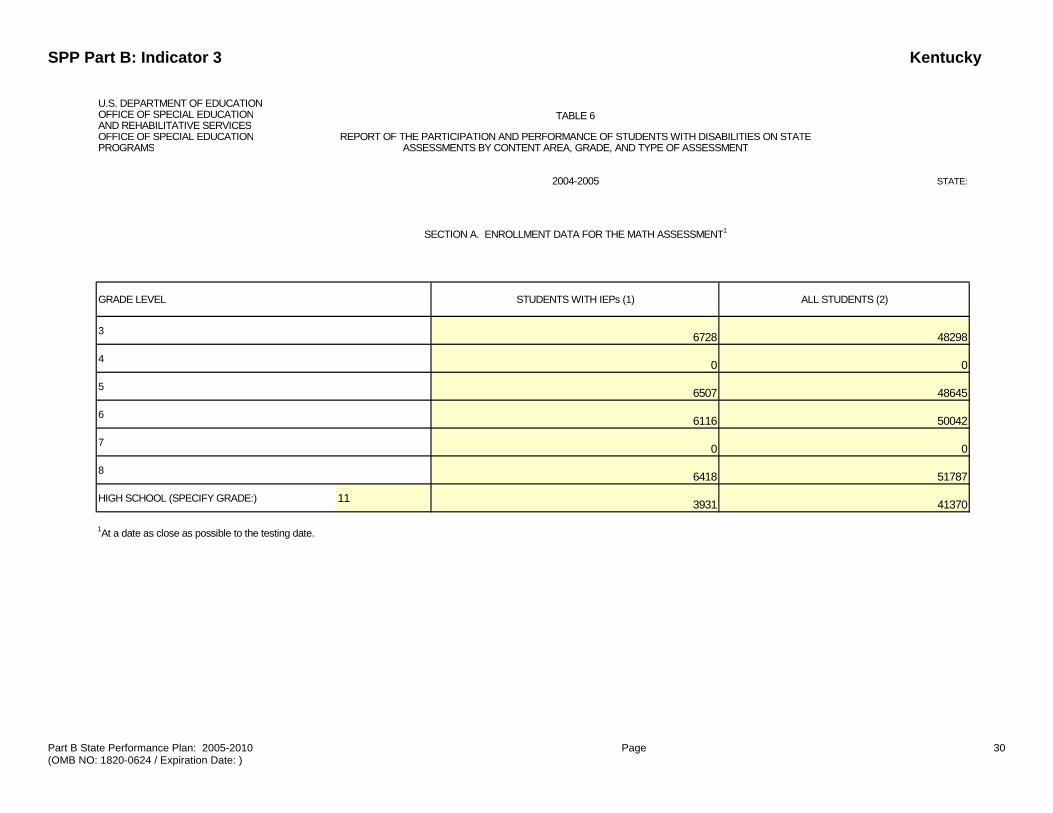
U.S. DEPARTMENT OF EDUCATIONOFFICE OF SPECIAL EDUCATION TABLE 6AND REHABILITATIVE SERVICESOFFICE OF SPECIAL EDUCATION REPORT OF THE PARTICIPATION AND PERFORMANCE OF STUDENTS WITH DISABILITIES ON STATEPROGRAMS ASSESSMENTS BY CONTENT AREA, GRADE, AND TYPE OF ASSESSMENT
2004-2005 STATE:
SECTION A. ENROLLMENT DATA FOR THE MATH ASSESSMENT1
GRADE LEVEL STUDENTS WITH IEPs (1) ALL STUDENTS (2)
3 6728 48298
4 0 0
5 6507 48645
6 6116 50042
7 0 0
8 6418 51787
HIGH SCHOOL (SPECIFY GRADE:) 11 3931 41370
1At a date as close as possible to the testing date.

SPP Part B: Indicator 3 Kentucky
Part B State Performance Plan: 2005-2010 Page (OMB NO: 1820-0624 / Expiration Date: )
31
U.S. DEPARTMENT OF EDUCATION PAGE 2 OF 18OFFICE OF SPECIAL EDUCATION TABLE 6AND REHABILITATIVE SERVICES OMB NO. 1820-0659OFFICE OF SPECIAL EDUCATION REPORT OF THE PARTICIPATION AND PERFORMANCE OF STUDENTS WITH DISABILITIES ON STATE PROGRAMS ASSESSMENTS BY CONTENT AREA, GRADE, AND TYPE OF ASSESSMENT FORM EXPIRES: 09/30/2007
2004-2005 STATE: KY - KENTUCKY
SECTION B. PARTICIPATION OF STUDENTS WITH DISABILITIES ON MATH ASSESSMENT
STUDENTS WITH DISABILITIES WHO TOOK REGULAR ASSESSMENT ON GRADE LEVEL ACHIEVEMENT STANDARDS
TOTAL (3)
SUBSET WHO TOOK THE ASSESSMENT WITH ACCOMODATIONS
(3A)
SUBSET WITH CHANGES TO THE ASSESSMENT THAT
INVALIDATED THEIR SCORE1
(3B)SUBSET WHOSE ASSESSMENT RESULTS WERE INVALID2 (3C)
3 6074 4318 0 0
4 0 0 0 0
5 6073 5525 0 0
6 5577 4630 0 0
7 0 0 0 0
8 5664 4544 0 0
HIGH SCHOOL : 113409 2552 0 0
1 Changes to the assessment that invalidate a score are changes in testing materials or procedures that enable a student to participate in the assessment, but result in a score that is not deemed by the State to be comparable to scores received by students without these changes. In some States these changes are called modifications or nonstandard administrations.
2 Invalid results are assessment results that cannot be used for reporting and or aggregation due to problems in the testing process (e.g. students do not take all portions of the assessment or students do not fill out the answer sheet correctly).
GRADE LEVEL
SPP Part B: Indicator 3 Kentucky
Part B State Performance Plan: 2005-2010 Page (OMB NO: 1820-0624 / Expiration Date: )
32
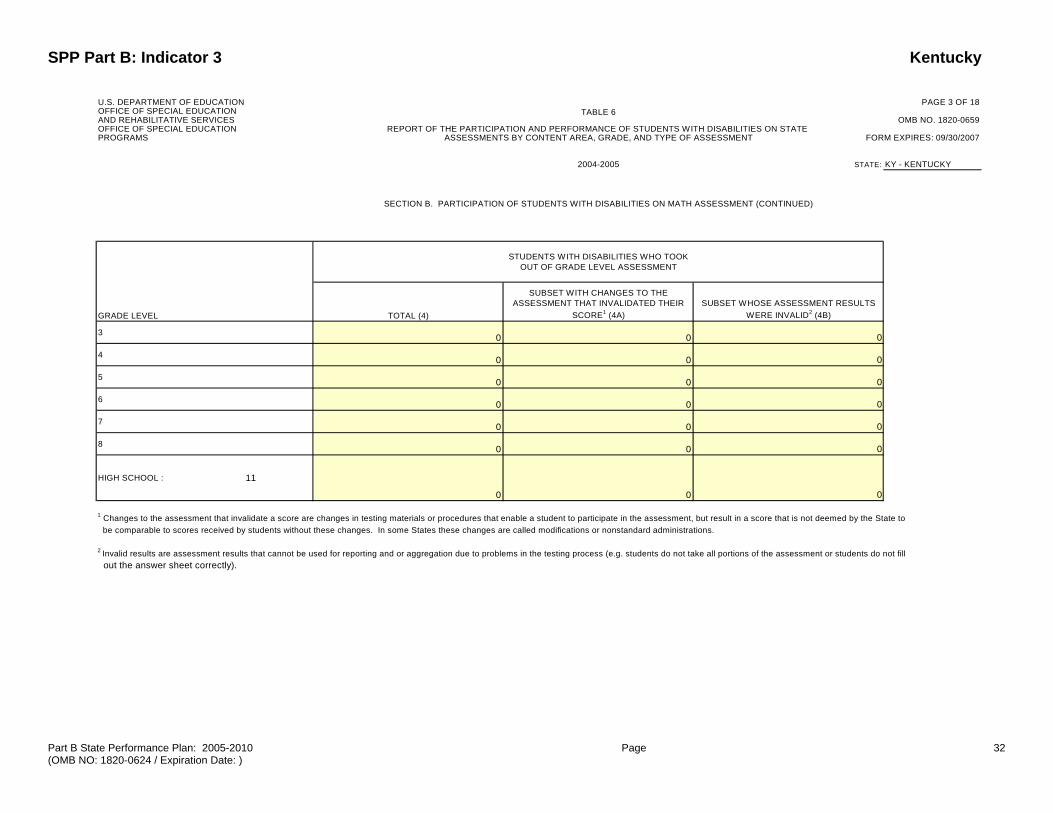
U.S. DEPARTMENT OF EDUCATION PAGE 3 OF 18OFFICE OF SPECIAL EDUCATION TABLE 6AND REHABILITATIVE SERVICES OMB NO. 1820-0659OFFICE OF SPECIAL EDUCATION REPORT OF THE PARTICIPATION AND PERFORMANCE OF STUDENTS WITH DISABILITIES ON STATE PROGRAMS ASSESSMENTS BY CONTENT AREA, GRADE, AND TYPE OF ASSESSMENT FORM EXPIRES: 09/30/2007
2004-2005 STATE: KY - KENTUCKY
SECTION B. PARTICIPATION OF STUDENTS WITH DISABILITIES ON MATH ASSESSMENT (CONTINUED)
STUDENTS WITH DISABILITIES WHO TOOK OUT OF GRADE LEVEL ASSESSMENT
TOTAL (4)
SUBSET WITH CHANGES TO THE ASSESSMENT THAT INVALIDATED THEIR
SCORE1 (4A)SUBSET WHOSE ASSESSMENT RESULTS
WERE INVALID2 (4B)
3 0 0 0
4 0 0 0
5 0 0 0
6 0 0 0
7 0 0 0
8 0 0 0
HIGH SCHOOL : 11
0 0 0
1 Changes to the assessment that invalidate a score are changes in testing materials or procedures that enable a student to participate in the assessment, but result in a score that is not deemed by the State to be comparable to scores received by students without these changes. In some States these changes are called modifications or nonstandard administrations.
2 Invalid results are assessment results that cannot be used for reporting and or aggregation due to problems in the testing process (e.g. students do not take all portions of the assessment or students do not fill out the answer sheet correctly).
GRADE LEVEL

SPP Part B: Indicator 3 Kentucky
Part B State Performance Plan: 2005-2010 Page (OMB NO: 1820-0624 / Expiration Date: )
33
U.S. DEPARTMENT OF EDUCATION PAGE 4 OF 18OFFICE OF SPECIAL EDUCATION TABLE 6AND REHABILITATIVE SERVICES OMB NO. 1820-0659OFFICE OF SPECIAL EDUCATION REPORT OF THE PARTICIPATION AND PERFORMANCE OF STUDENTS WITH DISABILITIES ON STATE PROGRAMS ASSESSMENTS BY CONTENT AREA, GRADE, AND TYPE OF ASSESSMENT FORM EXPIRES: 09/30/2007
2004-2005 STATE: KY - KENTUCKY
SECTION B. PARTICIPATION OF STUDENTS WITH DISABILITIES ON MATH ASSESSMENT (CONTINUED)
STUDENTS WITH DISABILITIES WHO TOOK ALTERNATE ASSESSMENT
TOTAL (5)
SUBSET WHOSE ALTERNATE WAS SCORED
AGAINST GRADE LEVEL STANDARDS (5A)
SUBSET WHOSE ALTERNATE WAS SCORED
AGAINST ALTERNATE ACHIEVEMENT
STANDARDS (5B)
SUBSET COUNTED AT THE LOWEST ACHIEVEMENT LEVEL BECAUSE OF THE
NCLB CAP3 (5C)
SUBSET WHOSE ASSESSMENT RESULTS
WERE INVALID4 (5D)
3 0 0 0 0 0
4 0 0 0 0 0
5 0 0 0 0 0
6 0 0 0 0 0
7 0 0 0 0 0
8535 0 535 0 0
HIGH SCHOOL : 110 0 0 0 0
3 NCLB cap is the limit on the percent of students whose scores can be held to alternate achievement standards in AYP calculations.
4 Invalid results are assessment results that cannot be used for reporting and or aggregation due to problems in the testing process (e.g. students do not take all portions of the assessment or students do not fill out
GRADE LEVEL

SPP Part B: Indicator 3 Kentucky
Part B State Performance Plan: 2005-2010 Page (OMB NO: 1820-0624 / Expiration Date: )
34
U.S. DEPARTMENT OF EDUCATION PAGE 5 OF 18OFFICE OF SPECIAL EDUCATION TABLE 6AND REHABILITATIVE SERVICES OMB NO. 1820-0659OFFICE OF SPECIAL EDUCATION REPORT OF THE PARTICIPATION AND PERFORMANCE OF STUDENTS WITH DISABILITIES ON STATEPROGRAMS ASSESSMENTS BY CONTENT AREA, GRADE, AND TYPE OF ASSESSMENT FORM EXPIRES: 09/30/2007
2004-2005 STATE: KY - KENTUCKY
SECTION B. PARTICIPATION OF STUDENTS WITH DISABILITIES ON MATH ASSESSMENT (CONTINUED)
STUDENTS WHO DID NOT TAKE ANY ASSESSMENT
PARENTAL EXEMPTION (6) ABSENT (7) EXEMPT FOR OTHER REASONS5 (8)
Sum of columns 3 through 8 should
equal col 1, Section A3 0 0 654 6728
4 0 0 0 0
5 0 0 434 6507
6 0 0 539 6116
7 0 0 0 0
8 0 0 219 6418
HIGH SCHOOL : 110 0 522 3931
5 Provide list of other reasons for exemption with the number of students exempted by each grade and reason for exemption.
GRADE LEVEL
SPP Part B: Indicator 3 Kentucky
Part B State Performance Plan: 2005-2010 Page (OMB NO: 1820-0624 / Expiration Date: )
35
SPP Part B: Indicator 3 Kentucky
Part B State Performance Plan: 2005-2010 Page (OMB NO: 1820-0624 / Expiration Date: )
36
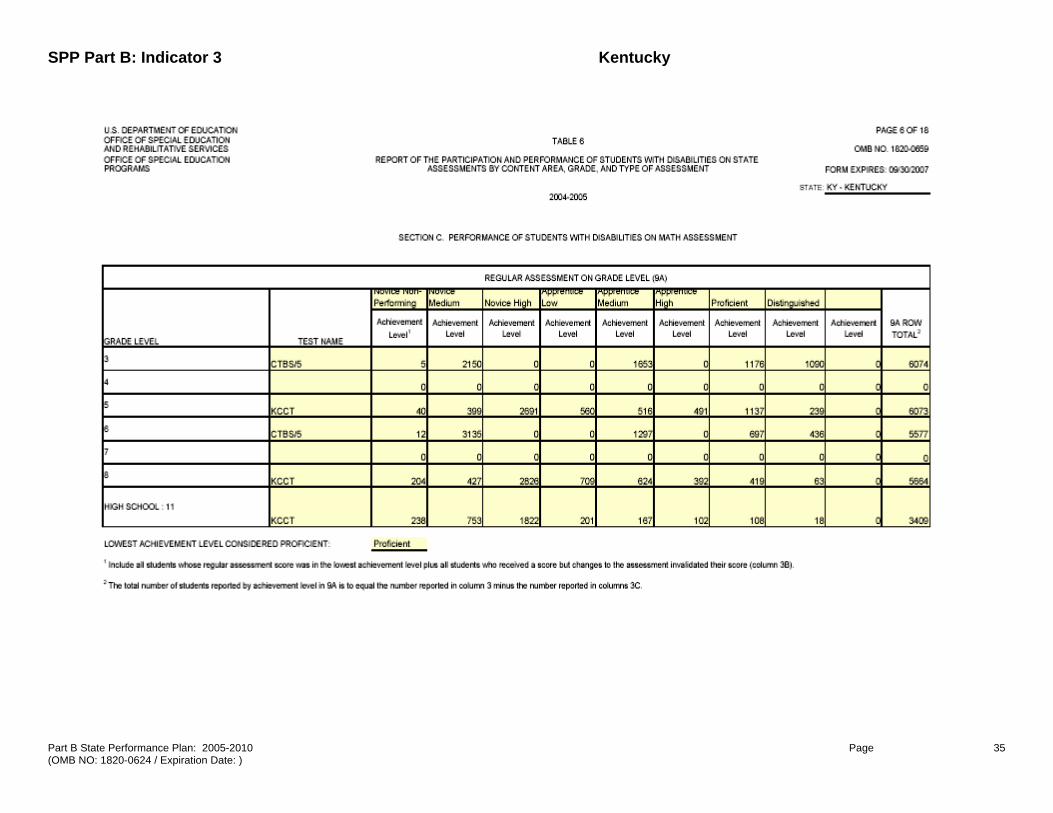
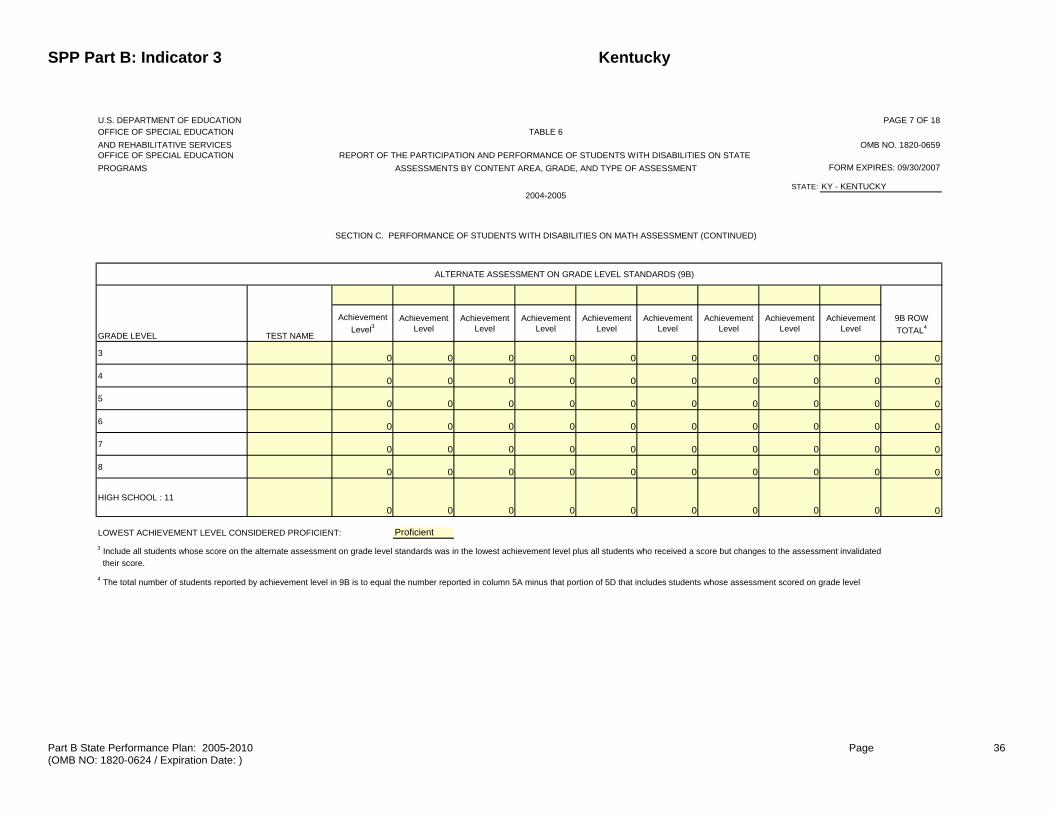
U.S. DEPARTMENT OF EDUCATION PAGE 7 OF 18OFFICE OF SPECIAL EDUCATION TABLE 6AND REHABILITATIVE SERVICES OMB NO. 1820-0659OFFICE OF SPECIAL EDUCATION REPORT OF THE PARTICIPATION AND PERFORMANCE OF STUDENTS WITH DISABILITIES ON STATE PROGRAMS ASSESSMENTS BY CONTENT AREA, GRADE, AND TYPE OF ASSESSMENT FORM EXPIRES: 09/30/2007
STATE: KY - KENTUCKY2004-2005
SECTION C. PERFORMANCE OF STUDENTS WITH DISABILITIES ON MATH ASSESSMENT (CONTINUED)
ALTERNATE ASSESSMENT ON GRADE LEVEL STANDARDS (9B)
GRADE LEVEL TEST NAME
Achievement Level3
Achievement Level
Achievement Level
Achievement Level
Achievement Level
Achievement Level
Achievement Level
Achievement Level
Achievement Level
9B ROW TOTAL4
3 0 0 0 0 0 0 0 0 0 0
4 0 0 0 0 0 0 0 0 0 0
5 0 0 0 0 0 0 0 0 0 0
6 0 0 0 0 0 0 0 0 0 0
7 0 0 0 0 0 0 0 0 0 0
8 0 0 0 0 0 0 0 0 0 0
HIGH SCHOOL : 110 0 0 0 0 0 0 0 0 0
LOWEST ACHIEVEMENT LEVEL CONSIDERED PROFICIENT: Proficient3 Include all students whose score on the alternate assessment on grade level standards was in the lowest achievement level plus all students who received a score but changes to the assessment invalidated their score.
4 The total number of students reported by achievement level in 9B is to equal the number reported in column 5A minus that portion of 5D that includes students whose assessment scored on grade level

SPP Part B: Indicator 3 Kentucky
Part B State Performance Plan: 2005-2010 Page (OMB NO: 1820-0624 / Expiration Date: )
37
U.S. DEPARTMENT OF EDUCATIONOFFICE OF SPECIAL EDUCATION TABLE 6AND REHABILITATIVE SERVICES OMBOFFICE OF SPECIAL EDUCATION REPORT OF THE PARTICIPATION AND PERFORMANCE OF STUDENTS WITH DISABILITIES ON STATE PROGRAMS ASSESSMENTS BY CONTENT AREA, GRADE, AND TYPE OF ASSESSMENT FORM EXPIR
STATE: KY - KENTUCK2004-2005
SECTION C. PERFORMANCE OF STUDENTS WITH DISABILITIES ON MATH ASSESSMENT (CONTINUED)
ALTERNATE ASSESSMENT SCORED AGAINST ALTERNATE STANDARDS (9C)
Novice Apprentice Proficient Distinguished
GRADE LEVEL TEST NAME
Achievement Level5
Achievement Level
Achievement Level
Achievement Level
Achievement Level
Achievement Level
Achievement Level
Achievement Level
Achievement Level
3 0 0 0 0 0 0 0 0 0
4 0 0 0 0 0 0 0 0 0
5 0 0 0 0 0 0 0 0 0
6 0 0 0 0 0 0 0 0 0
7 0 0 0 0 0 0 0 0 0
8 Ky Alternate Portfolio 74 71 137 253 0 0 0 0 0
HIGH SCHOOL : 110 0 0 0 0 0 0 0 0
LOWEST ACHIEVEMENT LEVEL CONSIDERED PROFICIENT: Proficient
5 Include all students whose assessment counted in the lowest achievement level because of the NCLB cap plus all students who received a score but changes to the assessment invalidated their score.
6 The total number of students reported by achievement level in 9C is to equal the number reported in column 4 plus the number reported in column 5B minus the number reported in columns 4B and that portion of 5D that includes students whose alternate assessment scored on alternate standards was invalid.

SPP Part B: Indicator 3 Kentucky
Part B State Performance Plan: 2005-2010 Page (OMB NO: 1820-0624 / Expiration Date: )
38
U.S. DEPARTMENT OF EDUCATION PAGE 9 OF 18OFFICE OF SPECIAL EDUCATION TABLE 6AND REHABILITATIVE SERVICES OMB NO. 1820-0659OFFICE OF SPECIAL EDUCATION REPORT OF THE PARTICIPATION AND PERFORMANCE OF STUDENTS WITH DISABILITIES ON STATE PROGRAMS ASSESSMENTS BY CONTENT AREA, GRADE, AND TYPE OF ASSESSMENT FORM EXPIRES: 09/30/2007
STATE: KY - KENTUCKY2004-2005
SECTION C. PERFORMANCE OF STUDENTS WITH DISABILITIES ON MATH ASSESSMENT (CONTINUED)
GRADE LEVEL
TOTAL FOR COLUMN 9A
(ON PAGE 6)TOTAL FOR COLUMN 9B
(ON PAGE 7)TOTAL FOR COLUMN 9C
(ON PAGE 8) NO VALID SCORE7 (10) TOTAL8 (11)
3 6074 0 0 654 6728
4 0 0 0 0 0
5 6073 0 0 434 6507
6 5577 0 0 539 6116
7 0 0 0 0 0
8 5664 0 535 219 6418
HIGH SCHOOL : 11 3409 0 0 522 3931
7 The number of students reported in column 10 is to equal the number reported in column 3C plus column 4B plus column 5D plus column 6 plus column 7 plus column 8.
8 The number of students reported in column 11, the row total, should equal the number of students with IEPs reported in Section A. If the number of students is not the same, provide an explanation.
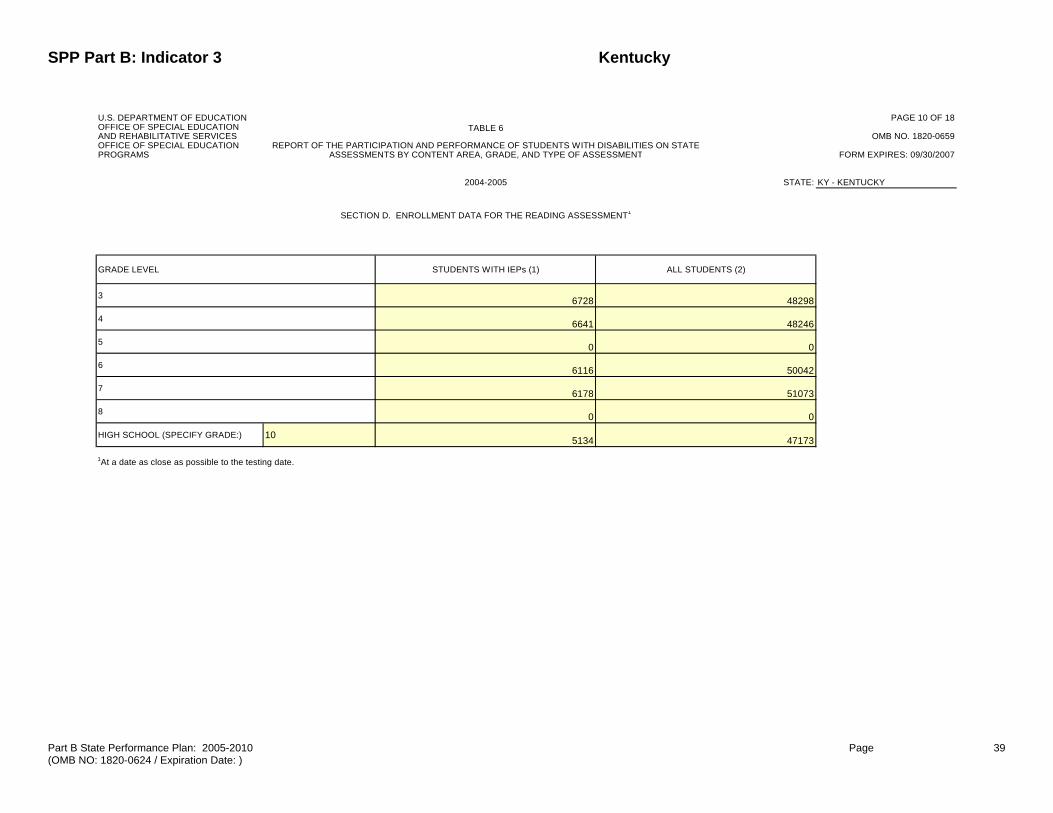
SPP Part B: Indicator 3 Kentucky
Part B State Performance Plan: 2005-2010 Page (OMB NO: 1820-0624 / Expiration Date: )
39
U.S. DEPARTMENT OF EDUCATION PAGE 10 OF 18OFFICE OF SPECIAL EDUCATION TABLE 6AND REHABILITATIVE SERVICES OMB NO. 1820-0659OFFICE OF SPECIAL EDUCATION REPORT OF THE PARTICIPATION AND PERFORMANCE OF STUDENTS WITH DISABILITIES ON STATEPROGRAMS ASSESSMENTS BY CONTENT AREA, GRADE, AND TYPE OF ASSESSMENT FORM EXPIRES: 09/30/2007
2004-2005 STATE: KY - KENTUCKY
SECTION D. ENROLLMENT DATA FOR THE READING ASSESSMENT1
GRADE LEVEL STUDENTS WITH IEPs (1) ALL STUDENTS (2)
3 6728 48298
4 6641 48246
5 0 0
6 6116 50042
7 6178 51073
8 0 0
HIGH SCHOOL (SPECIFY GRADE:) 10 5134 47173
1At a date as close as possible to the testing date.

SPP Part B: Indicator 3 Kentucky
Part B State Performance Plan: 2005-2010 Page (OMB NO: 1820-0624 / Expiration Date: )
40
U.S. DEPARTMENT OF EDUCATION PAGE 11 OF 18OFFICE OF SPECIAL EDUCATION TABLE 6AND REHABILITATIVE SERVICES OMB NO. 1820-0659OFFICE OF SPECIAL EDUCATION REPORT OF THE PARTICIPATION AND PERFORMANCE OF STUDENTS WITH DISABILITIES ON STATE PROGRAMS ASSESSMENTS BY CONTENT AREA, GRADE, AND TYPE OF ASSESSMENT FORM EXPIRES: 09/30/2007
2004-2005 STATE: KY - KENTUCKY
SECTION E. PARTICIPATION OF STUDENTS WITH DISABILITIES ON READING ASSESSMENT
STUDENTS WITH DISABILITIES WHO TOOK REGULAR ASSESSMENT ON GRADE LEVEL ACHIEVEMENT STANDARDS
TOTAL (3)
SUBSET WHO TOOK THE ASSESSMENT WITH ACCOMODATIONS
(3A)
SUBSET WITH CHANGES TO THE ASSESSMENT THAT
INVALIDATED THEIR SCORE1
(3B)SUBSET WHOSE ASSESSMENT RESULTS WERE INVALID2 (3C)
3 6071 4318 0 0
4 6035 4896 0 0
5 0 0 0 0
6 5570 4630 0 0
7 5712 4709 0 0
8 0 0 0 0
HIGH SCHOOL : 104612 3322 0 0
1 Changes to the assessment that invalidate a score are changes in testing materials or procedures that enable a student to participate in the assessment, but result in a score that is not deemed by the State to be comparable to scores received by students without these changes. In some States these changes are called modifications or nonstandard administrations.
2 Invalid results are assessment results that cannot be used for reporting and or aggregation due to problems in the testing process (e.g. students do not take all portions of the assessment or students do not fill
GRADE LEVEL

SPP Part B: Indicator 3 Kentucky
Part B State Performance Plan: 2005-2010 Page (OMB NO: 1820-0624 / Expiration Date: )
41
U.S. DEPARTMENT OF EDUCATION PAGE 12 OF 18OFFICE OF SPECIAL EDUCATION TABLE 6AND REHABILITATIVE SERVICES OMB NO. 1820-0659OFFICE OF SPECIAL EDUCATION REPORT OF THE PARTICIPATION AND PERFORMANCE OF STUDENTS WITH DISABILITIES ON STATE PROGRAMS ASSESSMENTS BY CONTENT AREA, GRADE, AND TYPE OF ASSESSMENT FORM EXPIRES: 09/30/2007
2004-2005 STATE: KY - KENTUCKY
SECTION E. PARTICIPATION OF STUDENTS WITH DISABILITIES ON READING ASSESSMENT (CONTINUED)
STUDENTS WITH DISABILITIES WHO TOOK OUT OF GRADE LEVEL ASSESSMENT
TOTAL (4)
SUBSET WITH CHANGES TO THE ASSESSMENT THAT INVALIDATED THEIR
SCORE1 (4A)SUBSET WHOSE ASSESSMENT RESULTS
WERE INVALID2 (4B)
3 0 0 0
4 0 0 0
5 0 0 0
6 0 0 0
7 0 0 0
8 0 0 0
HIGH SCHOOL : 10
0 0 0
1 Changes to the assessment that invalidate a score are changes in testing materials or procedures that enable a student to participate in the assessment, but result in a score that is not deemed by the State to be comparable to scores received by students without these changes. In some States these changes are called modifications or nonstandard administrations.
2 Invalid results are assessment results that cannot be used for reporting and or aggregation due to problems in the testing process (e.g. students do not take all portions of the assessment or students do not fill
GRADE LEVEL

SPP Part B: Indicator 3 Kentucky
Part B State Performance Plan: 2005-2010 Page (OMB NO: 1820-0624 / Expiration Date: )
42
U.S. DEPARTMENT OF EDUCATION PAGE 13 OF 18OFFICE OF SPECIAL EDUCATION TABLE 6AND REHABILITATIVE SERVICES OMB NO. 1820-0659OFFICE OF SPECIAL EDUCATION REPORT OF THE PARTICIPATION AND PERFORMANCE OF STUDENTS WITH DISABILITIES ON STATE PROGRAMS ASSESSMENTS BY CONTENT AREA, GRADE, AND TYPE OF ASSESSMENT FORM EXPIRES: 09/30/2007
2004-2005 STATE: KY - KENTUCKY
SECTION E. PARTICIPATION OF STUDENTS WITH DISABILITIES ON READING ASSESSMENT (CONTINUED)
STUDENTS WITH DISABILITIES WHO TOOK ALTERNATE ASSESSMENT
TOTAL (5)
SUBSET WHOSE ALTERNATE WAS SCORED
AGAINST GRADE LEVEL STANDARDS (5A)
SUBSET WHOSE ALTERNATE WAS SCORED
AGAINST ALTERNATE ACHIEVEMENT STANDARDS
(5B)
SUBSET COUNTED AT THE LOWEST ACHIEVEMENT LEVEL BECAUSE OF THE
NCLB CAP3 (5C)SUBSET WHOSE ASSESSMENT RESULTS WERE INVALID4 (5D)
3 0 0 0 0 0
4 450 0 450 0 0
5 0 0 0 0 0
6 0 0 0 0 0
7 0 0 0 0 0
8 0 0 0 0 0
HIGH SCHOOL : 100 0 0 0 0
3 NCLB cap is the limit on the percent of students whose scores can be held to alternate achievement standards in AYP calculations.
4 Invalid results are assessment results that cannot be used for reporting and or aggregation due to problems in the testing process (e.g. students do not take all portions of the assessment or students do not fill out the answer sheet correctly).
GRADE LEVEL
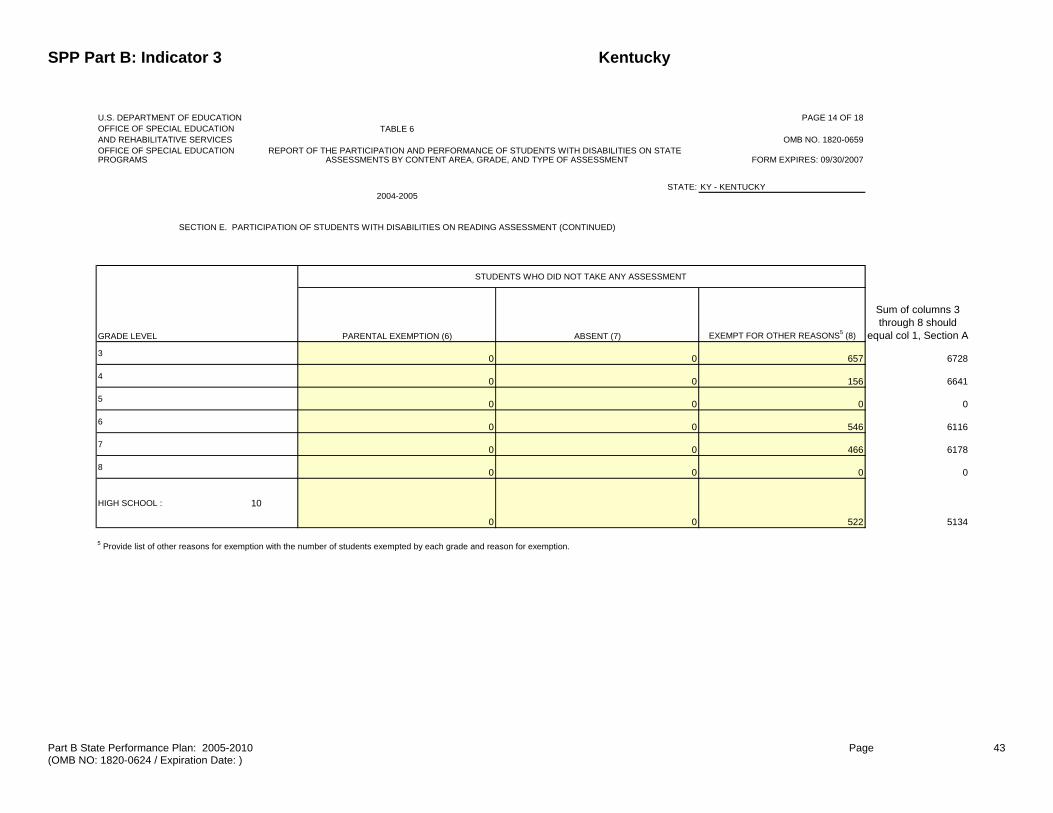
SPP Part B: Indicator 3 Kentucky
Part B State Performance Plan: 2005-2010 Page (OMB NO: 1820-0624 / Expiration Date: )
43
U.S. DEPARTMENT OF EDUCATION PAGE 14 OF 18OFFICE OF SPECIAL EDUCATION TABLE 6AND REHABILITATIVE SERVICES OMB NO. 1820-0659OFFICE OF SPECIAL EDUCATION REPORT OF THE PARTICIPATION AND PERFORMANCE OF STUDENTS WITH DISABILITIES ON STATEPROGRAMS ASSESSMENTS BY CONTENT AREA, GRADE, AND TYPE OF ASSESSMENT FORM EXPIRES: 09/30/2007
STATE: KY - KENTUCKY2004-2005
SECTION E. PARTICIPATION OF STUDENTS WITH DISABILITIES ON READING ASSESSMENT (CONTINUED)
STUDENTS WHO DID NOT TAKE ANY ASSESSMENT
PARENTAL EXEMPTION (6) ABSENT (7) EXEMPT FOR OTHER REASONS5 (8)
Sum of columns 3 through 8 should
equal col 1, Section A3 0 0 657 6728
4 0 0 156 6641
5 0 0 0 0
6 0 0 546 6116
7 0 0 466 6178
8 0 0 0 0
HIGH SCHOOL : 10
0 0 522 5134
5 Provide list of other reasons for exemption with the number of students exempted by each grade and reason for exemption.
GRADE LEVEL

SPP Part B: Indicator 3 Kentucky
Part B State Performance Plan: 2005-2010 Page (OMB NO: 1820-0624 / Expiration Date: )
44
U.S. DEPARTMENT OF EDUCATION PAGE 15 OF 18OFFICE OF SPECIAL EDUCATION TABLE 6AND REHABILITATIVE SERVICES OMB NO. 1820-0659OFFICE OF SPECIAL EDUCATION REPORT OF THE PARTICIPATION AND PERFORMANCE OF STUDENTS WITH DISABILITIES ON STATE PROGRAMS ASSESSMENTS BY CONTENT AREA, GRADE, AND TYPE OF ASSESSMENT FORM EXPIRES: 09/30/2007
STATE: KY - KENTUCKY2004-2005
SECTION F. PERFORMANCE OF STUDENTS WITH DISABILITIES ON READING ASSESSMENT
REGULAR ASSESSMENT ON GRADE LEVEL (9A)Novice Non Performing
Novice Medium Novice High
Apprentice Low
Apprentice Medium
Apprentice High Proficient
Distinguished
GRADE LEVEL TEST NAME
Achievement Level1
Achievement Level
Achievement Level
Achievement Level
Achievement Level
Achievement Level
Achievement Level
Achievement Level
Achievement Level
9A ROW TOTAL2
3 CTBS/5 0 1960 0 0 1868 0 1274 969 0 6071
4 KCCT 6 65 1333 573 618 634 2574 232 0 6035
5 0 0 0 0 0 0 0 0 0 0
6 CTBS/5 0 2427 0 0 1862 0 871 410 0 5570
7 KCCT 24 98 1522 916 928 826 1337 61 0 5712
8 0 0 0 0 0 0 0 0 0 0
HIGH SCHOOL : 10KCCT 72 489 1502 1240 705 391 183 30 0 4612
LOWEST ACHIEVEMENT LEVEL CONSIDERED PROFICIENT: Proficient
1 Include all students whose regular assessment score was in the lowest achievement level plus all students who received a score but changes to the assessment invalidated their score (column 3B).
2 The total number of students reported by achievement level in 9A is to equal the number reported in column 3 minus the number reported in columns 3C.
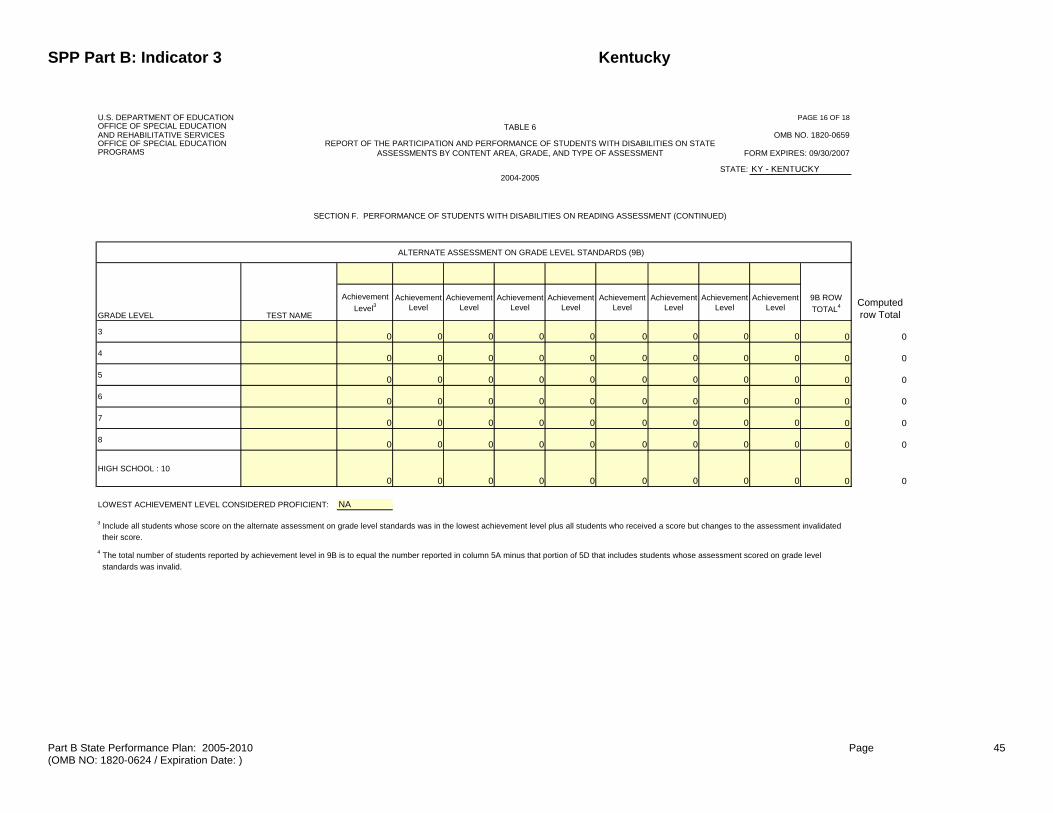
SPP Part B: Indicator 3 Kentucky
Part B State Performance Plan: 2005-2010 Page (OMB NO: 1820-0624 / Expiration Date: )
45
U.S. DEPARTMENT OF EDUCATION PAGE 16 OF 18OFFICE OF SPECIAL EDUCATION TABLE 6AND REHABILITATIVE SERVICES OMB NO. 1820-0659OFFICE OF SPECIAL EDUCATION REPORT OF THE PARTICIPATION AND PERFORMANCE OF STUDENTS WITH DISABILITIES ON STATEPROGRAMS ASSESSMENTS BY CONTENT AREA, GRADE, AND TYPE OF ASSESSMENT FORM EXPIRES: 09/30/2007
STATE: KY - KENTUCKY2004-2005
SECTION F. PERFORMANCE OF STUDENTS WITH DISABILITIES ON READING ASSESSMENT (CONTINUED)
ALTERNATE ASSESSMENT ON GRADE LEVEL STANDARDS (9B)
GRADE LEVEL TEST NAME
Achievement Level3
Achievement Level
Achievement Level
Achievement Level
Achievement Level
Achievement Level
Achievement Level
Achievement Level
Achievement Level
9B ROW TOTAL4
3 0 0 0 0 0 0 0 0 0 0 0
4 0 0 0 0 0 0 0 0 0 0 0
5 0 0 0 0 0 0 0 0 0 0 0
6 0 0 0 0 0 0 0 0 0 0 0
7 0 0 0 0 0 0 0 0 0 0 0
8 0 0 0 0 0 0 0 0 0 0 0
HIGH SCHOOL : 100 0 0 0 0 0 0 0 0 0 0
LOWEST ACHIEVEMENT LEVEL CONSIDERED PROFICIENT: NA
3 Include all students whose score on the alternate assessment on grade level standards was in the lowest achievement level plus all students who received a score but changes to the assessment invalidated their score.
4 The total number of students reported by achievement level in 9B is to equal the number reported in column 5A minus that portion of 5D that includes students whose assessment scored on grade level standards was invalid.
Computed row Total

SPP Part B: Indicator 3 Kentucky
Part B State Performance Plan: 2005-2010 Page (OMB NO: 1820-0624 / Expiration Date: )
46
U.S. DEPARTMENT OF EDUCATION PAGE 17 OF 18OFFICE OF SPECIAL EDUCATION TABLE 6AND REHABILITATIVE SERVICES OMB NO. 1820-0659OFFICE OF SPECIAL EDUCATION REPORT OF THE PARTICIPATION AND PERFORMANCE OF STUDENTS WITH DISABILITIES ON STATE PROGRAMS ASSESSMENTS BY CONTENT AREA, GRADE, AND TYPE OF ASSESSMENT FORM EXPIRES: 09/30/2007
STATE: KY - KENTUCKY2004-2005
SECTION F. PERFORMANCE OF STUDENTS WITH DISABILITIES ON READING ASSESSMENT (CONTINUED)
ALTERNATE ASSESSMENT SCORED AGAINST ALTERNATE STANDARDS (9C)
Novice Apprentice ProficientDistinguished
GRADE LEVEL TEST NAME
Achievement Level5
Achievement Level
Achievement Level
Achievement Level
Achievement Level
Achievement Level
Achievement Level
Achievement Level
Achievement Level
9C ROW TOTAL6
3 0 0 0 0 0 0 0 0 0 0
4 Ky Alternate Portfolio 31 55 95 269 0 0 0 0 0 450
5 0 0 0 0 0 0 0 0 0 0
6 0 0 0 0 0 0 0 0 0 0
7 0 0 0 0 0 0 0 0 0 0
8 0 0 0 0 0 0 0 0 0 0
HIGH SCHOOL : 100 0 0 0 0 0 0 0 0 0
LOWEST ACHIEVEMENT LEVEL CONSIDERED PROFICIENT: Proficient
5 Include all students whose assessment counted in the lowest achievement level because of the NCLB cap plus all students who received a score but changes to the assessment invalidated their score.
6 The total number of students reported by achievement level in 9C is to equal the number reported in column 4 plus the number reported in column 5B minus the number reported in columns 4B and that portion of 5D that includes students whose alternate assessment scored on alternate standard was invalid.

SPP Part B: Indicator 3 Kentucky
Part B State Performance Plan: 2005-2010 Page (OMB NO: 1820-0624 / Expiration Date: )
47
U.S. DEPARTMENT OF EDUCATION PAGE 18 OF 18OFFICE OF SPECIAL EDUCATION TABLE 6AND REHABILITATIVE SERVICES OMB NO. 1820-0659OFFICE OF SPECIAL EDUCATION REPORT OF THE PARTICIPATION AND PERFORMANCE OF STUDENTS WITH DISABILITIES ON STATE PROGRAMS ASSESSMENTS BY CONTENT AREA, GRADE, AND TYPE OF ASSESSMENT FORM EXPIRES: 09/30/2007
STATE: KY - KENTUCKY2004-2005
SECTION F. PERFORMANCE OF STUDENTS WITH DISABILITIES ON READING ASSESSMENT (CONTINUED)
GRADE LEVELTOTAL FOR COLUMN 9A
(ON PAGE 15)TOTAL FOR COLUMN 9B
(ON PAGE 16)TOTAL FOR COLUMN 9C
(ON PAGE 17) NO VALID SCORE7 (10) TOTAL8 (11)
Number reported in col 1, Section A
3 6071 0 0 657 6728 6728
4 6035 0 450 156 6641 6641
5 0 0 0 0 0 0
6 5570 0 0 546 6116 6116
7 5712 0 0 466 6178 6178
8 0 0 0 0 0 0
HIGH SCHOOL (SPECIFY GRADE:) 10 4612 0 0 522 5134 5134
7 The number of students reported in column 10 is to equal the number reported in column 3C plus column 4B plus column 5D plus column 6 plus column 7 plus column 8.
8 The number of students reported in column 11, the row total, should equal the number of students with IEPs reported in Section A. If the number of students is not the same, provide an explanation.
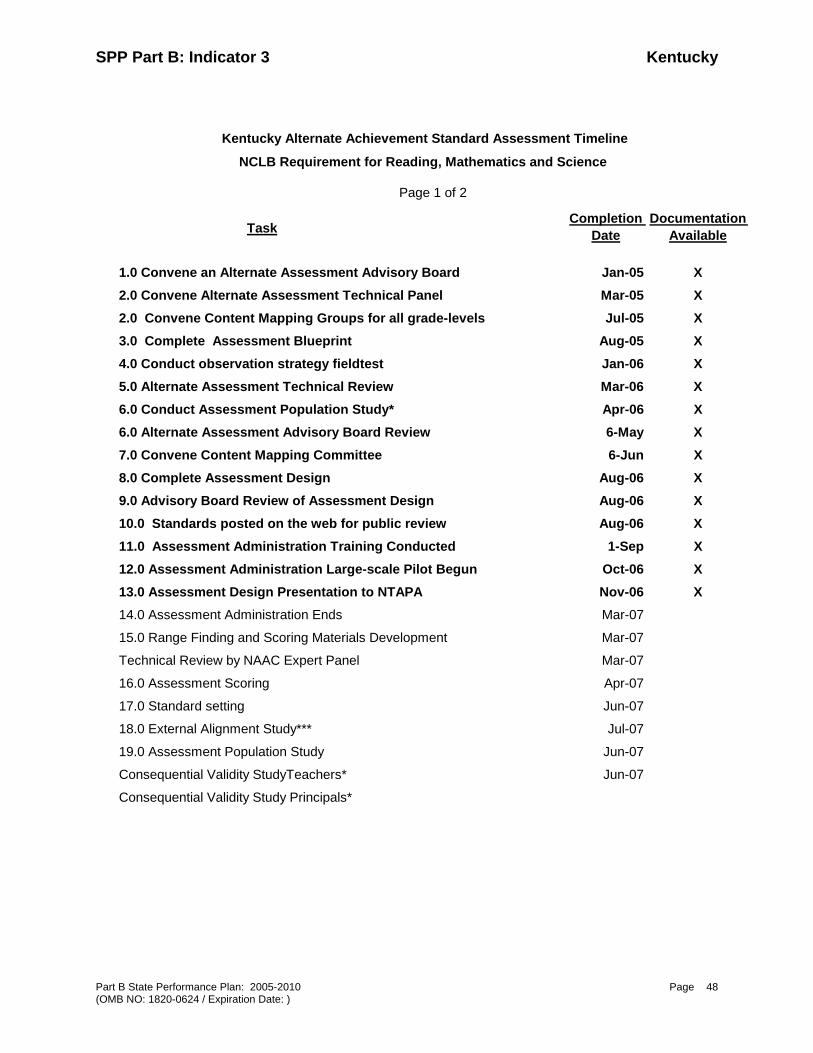
SPP Part B: Indicator 3 Kentucky
Part B State Performance Plan: 2005-2010 Page (OMB NO: 1820-0624 / Expiration Date: )
48
TaskCompletion
DateDocumentation
Available
1.0 Convene an Alternate Assessment Advisory Board Jan-05 X2.0 Convene Alternate Assessment Technical Panel Mar-05 X2.0 Convene Content Mapping Groups for all grade-levels Jul-05 X3.0 Complete Assessment Blueprint Aug-05 X4.0 Conduct observation strategy fieldtest Jan-06 X5.0 Alternate Assessment Technical Review Mar-06 X6.0 Conduct Assessment Population Study* Apr-06 X6.0 Alternate Assessment Advisory Board Review 6-May X7.0 Convene Content Mapping Committee 6-Jun X8.0 Complete Assessment Design Aug-06 X9.0 Advisory Board Review of Assessment Design Aug-06 X10.0 Standards posted on the web for public review Aug-06 X11.0 Assessment Administration Training Conducted 1-Sep X12.0 Assessment Administration Large-scale Pilot Begun Oct-06 X13.0 Assessment Design Presentation to NTAPA Nov-06 X14.0 Assessment Administration Ends Mar-07
15.0 Range Finding and Scoring Materials Development Mar-07
Technical Review by NAAC Expert Panel Mar-07
16.0 Assessment Scoring Apr-07
17.0 Standard setting Jun-07
18.0 External Alignment Study*** Jul-07
19.0 Assessment Population Study Jun-07
Consequential Validity StudyTeachers* Jun-07
Consequential Validity Study Principals*
Kentucky Alternate Achievement Standard Assessment Timeline
NCLB Requirement for Reading, Mathematics and Science
Page 1 of 2
SPP Part B: Indicator 3 Kentucky
Part B State Performance Plan: 2005-2010 (OMB NO: 1820-0624 / Expiration Date: )
49
TaskCompletion
DateDocumentation
Available
20.0 NTAPA Review Jun-07
21.0 Advisory Board Review Jun-07
22.0 Parent reporting Materials Completed Jul-07
23.0 School reporting Materials Completed Jul-07
24.0 Achievement Standards Adopted ******** State board******
25.0 Blueprint Adjustments Aug-07
26.0 Technical Manual Completed Aug-07
27.0 Post reporting Consequential Validity Study*** Aug/Sept 07
28.0 Student Work Audit*** Aug-07
* Studies conducted or proposed by the National Alternate Assessment Center
**** Proposed but not assigned
Kentucky Alternate Achievement Standard Assessment Timeline
NCLB Requirement for Reading, Mathematics and Science
Page 2 of 2
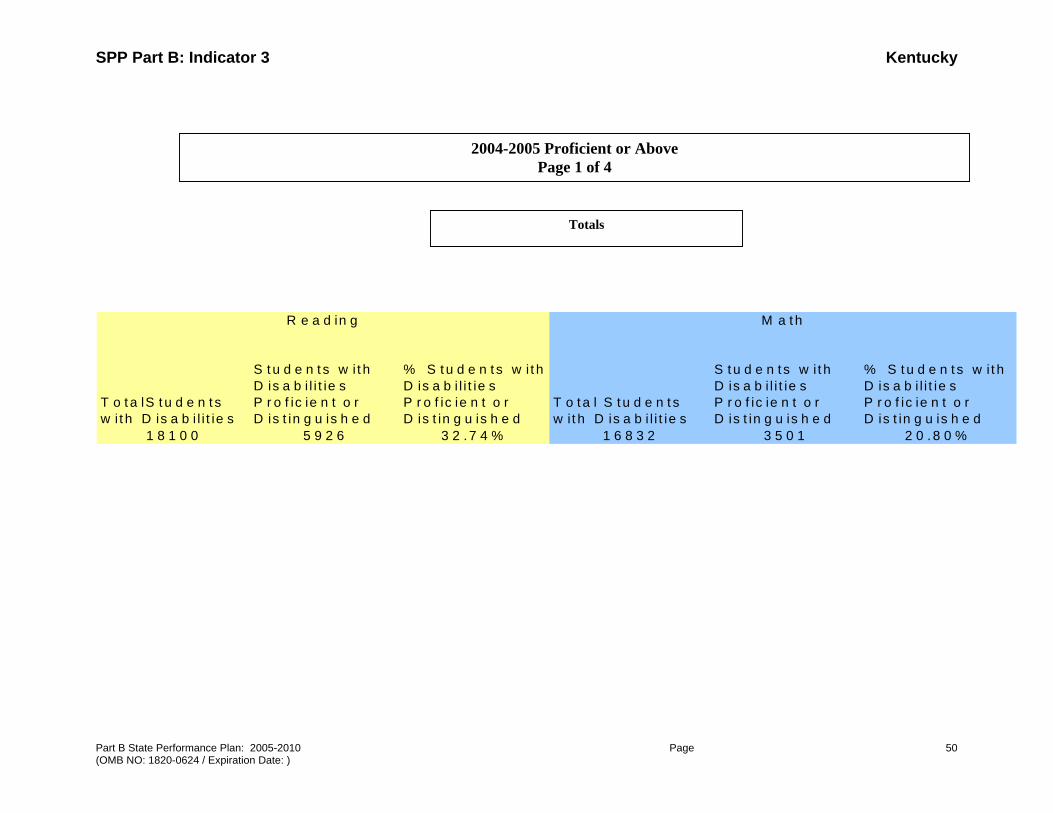
SPP Part B: Indicator 3 Kentucky
Part B State Performance Plan: 2005-2010 Page (OMB NO: 1820-0624 / Expiration Date: )
50
T o t a lS t u d e n t s w i t h D is a b i l i t ie s
S t u d e n t s w i t h D is a b i l i t ie s P r o f ic ie n t o r D is t in g u is h e d
% S t u d e n t s w i t h D is a b i l i t ie s P r o f ic ie n t o r D is t in g u is h e d
T o t a l S t u d e n t s w i t h D is a b i l i t ie s
S t u d e n ts w i t h D is a b i l i t ie s P r o f ic ie n t o r D is t in g u is h e d
% S t u d e n t s w i t h D is a b i l i t ie s P r o f ic ie n t o r D is t in g u is h e d
1 8 1 0 0 5 9 2 6 3 2 .7 4 % 1 6 8 3 2 3 5 0 1 2 0 . 8 0 %
R e a d in g M a t h
2004-2005 Proficient or Above Page 1 of 4
Totals
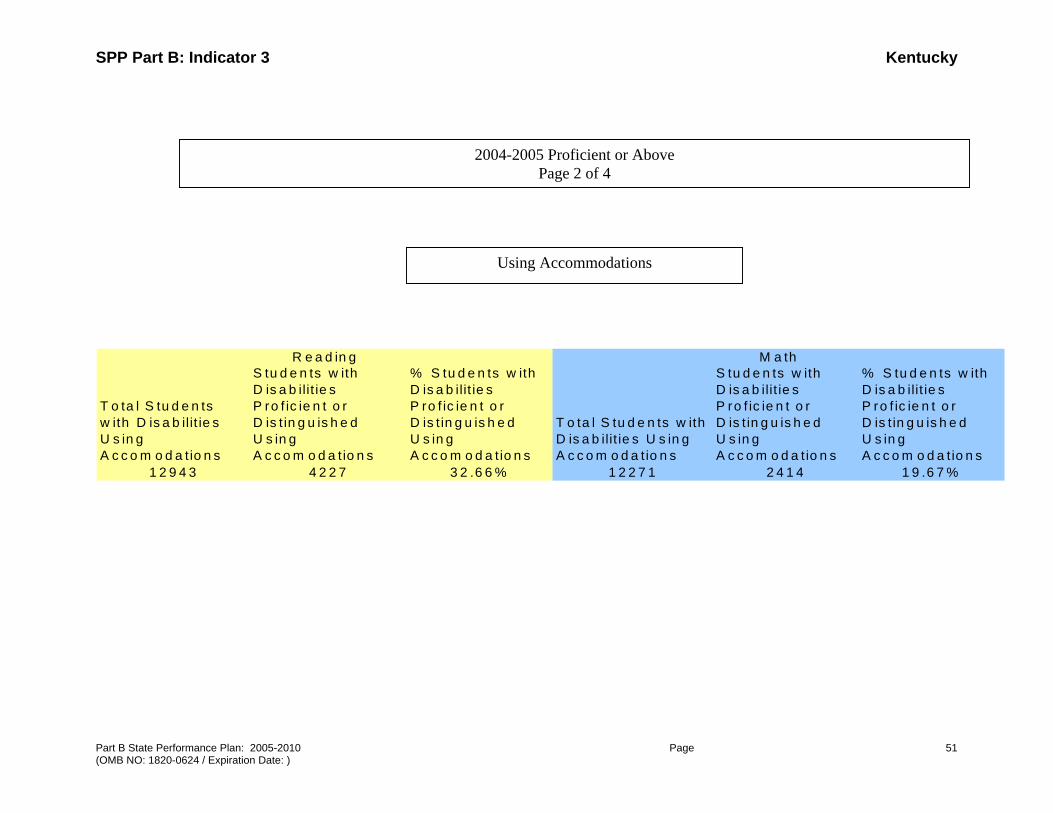
SPP Part B: Indicator 3 Kentucky
Part B State Performance Plan: 2005-2010 Page (OMB NO: 1820-0624 / Expiration Date: )
51
T o ta l S tu d e n ts w ith D is a b ilit ie s U s in g A c c o m o d a tio n s
S tu d e n ts w ith D is a b ilit ie s P ro f ic ie n t o r D is t in g u is h e d U s in g A c c o m o d a tio n s
% S tu d e n ts w ith D is a b ilit ie s P ro f ic ie n t o r D is t in g u is h e d U s in g A c c o m o d a tio n s
1 2 9 4 3 4 2 2 7 3 2 .6 6 % 1 2 2 7 1 2 4 1 4 1 9 .6 7 %
R e a d in g M a th
2004-2005 Proficient or Above Page 2 of 4
Using Accommodations
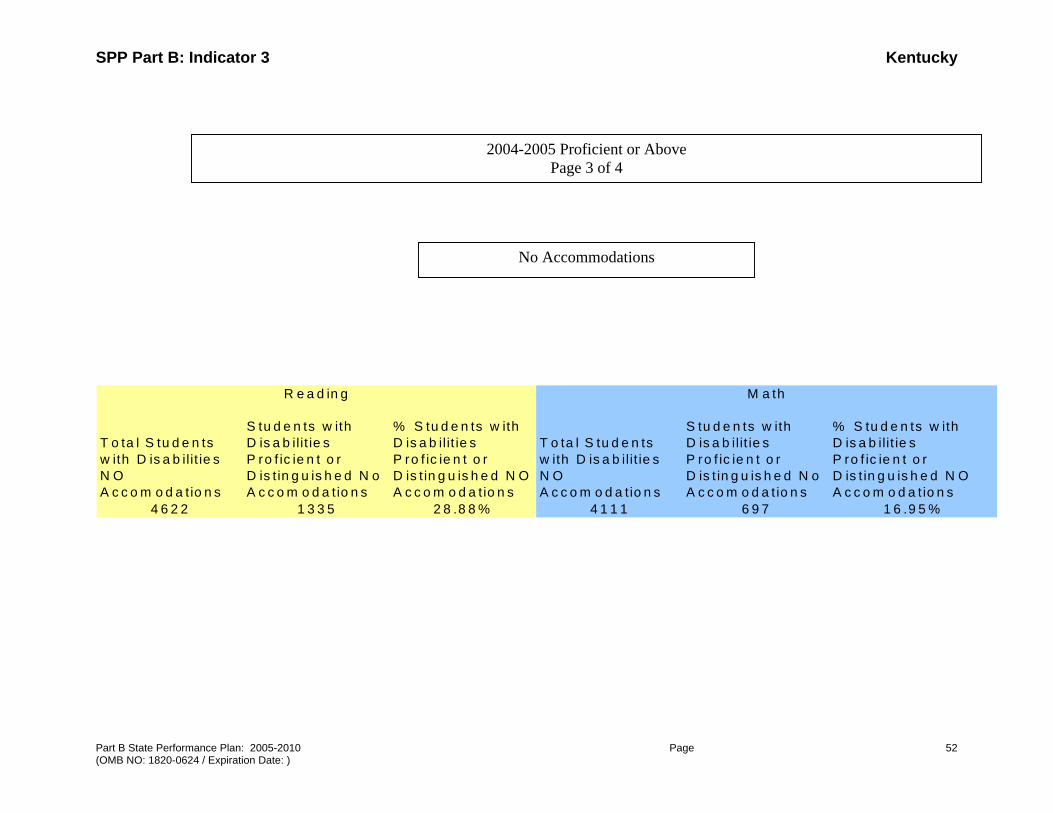
SPP Part B: Indicator 3 Kentucky
Part B State Performance Plan: 2005-2010 Page (OMB NO: 1820-0624 / Expiration Date: )
52
T o ta l S tu d e n ts w ith D is a b ilit ie s N O A c c o m o d a tio n s
S tu d e n ts w ith D is a b ilit ie s P ro f ic ie n t o r D is t in g u is h e d N o A c c o m o d a tio n s
% S tu d e n ts w ith D is a b ilit ie s P ro f ic ie n t o r D is t in g u is h e d N O A c c o m o d a tio n s
T o ta l S tu d e n ts w ith D is a b ilit ie s N O A c c o m o d a tio n s
S tu d e n ts w ith D is a b ilit ie s P ro f ic ie n t o r D is t in g u is h e d N o A c c o m o d a t io n s
% S tu d e n ts w ith D is a b ilit ie s P ro f ic ie n t o r D is t in g u is h e d N O A c c o m o d a t io n s
4 6 2 2 1 3 3 5 2 8 .8 8 % 4 1 1 1 6 9 7 1 6 .9 5 %
R e a d in g M a th
2004-2005 Proficient or Above Page 3 of 4
No Accommodations
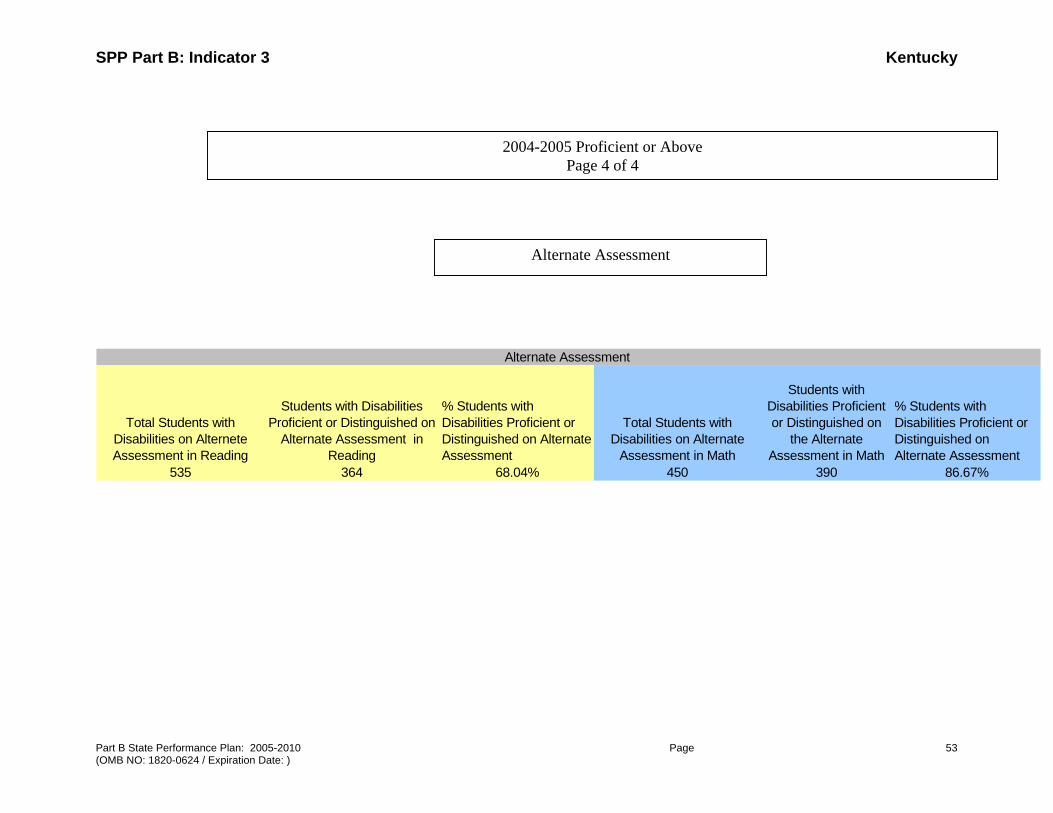
SPP Part B: Indicator 3 Kentucky
Part B State Performance Plan: 2005-2010 Page (OMB NO: 1820-0624 / Expiration Date: )
53
Total Students with Disabilities on Alternete Assessment in Reading
Students with Disabilities Proficient or Distinguished on
Alternate Assessment in Reading
% Students with Disabilities Proficient or Distinguished on Alternate Assessment
Total Students with Disabilities on Alternate
Assessment in Math
Students with Disabilities Proficient or Distinguished on
the Alternate Assessment in Math
% Students with Disabilities Proficient or Distinguished on Alternate Assessment
535 364 68.04% 450 390 86.67%
Alternate Assessment
2004-2005 Proficient or Above Page 4 of 4
Alternate Assessment
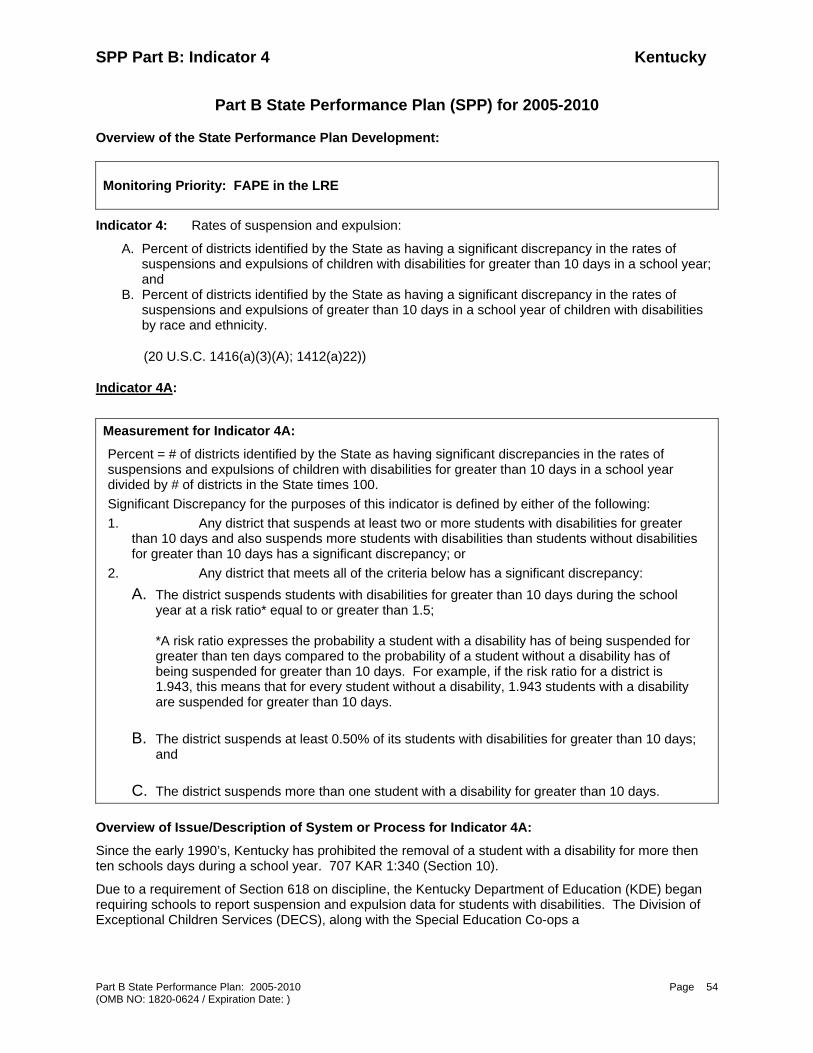
SPP Part B: Indicator 4 Kentucky
Part B State Performance Plan: 2005-2010 Page (OMB NO: 1820-0624 / Expiration Date: )
54
Part B State Performance Plan (SPP) for 2005-2010
Overview of the State Performance Plan Development:
Monitoring Priority: FAPE in the LRE
Indicator 4: Rates of suspension and expulsion:
A. Percent of districts identified by the State as having a significant discrepancy in the rates of suspensions and expulsions of children with disabilities for greater than 10 days in a school year; and
B. Percent of districts identified by the State as having a significant discrepancy in the rates of suspensions and expulsions of greater than 10 days in a school year of children with disabilities by race and ethnicity.
(20 U.S.C. 1416(a)(3)(A); 1412(a)22))
Indicator 4A:
Measurement for Indicator 4A:
Percent = # of districts identified by the State as having significant discrepancies in the rates of suspensions and expulsions of children with disabilities for greater than 10 days in a school year divided by # of districts in the State times 100. Significant Discrepancy for the purposes of this indicator is defined by either of the following: 1. Any district that suspends at least two or more students with disabilities for greater
than 10 days and also suspends more students with disabilities than students without disabilities for greater than 10 days has a significant discrepancy; or
2. Any district that meets all of the criteria below has a significant discrepancy: A. The district suspends students with disabilities for greater than 10 days during the school
year at a risk ratio* equal to or greater than 1.5; *A risk ratio expresses the probability a student with a disability has of being suspended for greater than ten days compared to the probability of a student without a disability has of being suspended for greater than 10 days. For example, if the risk ratio for a district is 1.943, this means that for every student without a disability, 1.943 students with a disability are suspended for greater than 10 days.
B. The district suspends at least 0.50% of its students with disabilities for greater than 10 days; and
C. The district suspends more than one student with a disability for greater than 10 days.
Overview of Issue/Description of System or Process for Indicator 4A:
Since the early 1990’s, Kentucky has prohibited the removal of a student with a disability for more then ten schools days during a school year. 707 KAR 1:340 (Section 10).
Due to a requirement of Section 618 on discipline, the Kentucky Department of Education (KDE) began requiring schools to report suspension and expulsion data for students with disabilities. The Division of Exceptional Children Services (DECS), along with the Special Education Co-ops a

SPP Part B: Indicator 4 Kentucky
Part B State Performance Plan: 2005-2010 Page (OMB NO: 1820-0624 / Expiration Date: )
55
and local school districts, utilize these data to prompt change in instructional programs and monitor the effectiveness of policies and practices.
To respond to a growing number of students being removed from the classroom due to behavioral issues, DECS designed a pilot project in 1997 that eventually became the Kentucky Center for Instructional Discipline (KCID). The foundation of their work is grounded in schoolwide positive behavior supports (PBS). One of the concepts taught is how to analyze and disaggregate discipline data for decision-making. A significant number of these schools have experienced a reduction in the number of suspensions and expulsions due to implementation of improved systems around policies/procedures and analysis of data. With the continued support of DECS and the Special Education Co-ops, KCID plans to expand its number of schools beyond its current 150.
DECS supports two major annual conferences that aligns with KCID and its mission. The Center for Safe Schools Conference and the Behavior Institute collectively draw approximately 2500 administrators, teachers, and support staff each year. Both conferences focus on building capacity on school safety and removing behavior as a barrier.
In response to the Office of Special Education and Rehabilitative Services letter, received March 24, 2006, the following corrective action for indicator 4A (Table B-Part B, page 1) was implemented to assure compliance with 34 CFR §300.146. Kentucky’s Continuous Monitoring Process (KCMP) requires districts to review/revise their district policies and procedures with regard to its suspension and expulsion practices.
Through the efforts of DECS, Special Education Co-ops, KCID, the Center for School Safety, and district self-evaluation (KCMP), school districts are better able to recognize and respond to behavioral issues in the classroom. DECS believes through the efforts described above, that Kentucky will begin to experience sustainable change in reducing the use of suspension as the primary response to challenging behavior
The process for identifying if a district in Kentucky has a significant discrepancy includes first determining the number of students in the district who have been suspended for greater than ten days. Next we determine of that number of students how many are students without a disability and how many are students with disabilities. When we have determined the numbers of students with and without disabilities who have been suspended, a rate or percentage of those students from each population is calculated. Kentucky then looks at these two rates for each district and calculates a ‘risk ratio’ that expresses the rate of suspensions for greater than ten days for students with disabilities compared to the rate of suspensions for students without a disability. As noted in the definition for significant discrepancy, when this risk ratio is equal to or exceeds 1.5 then that district is identified as potentially having a significant discrepancy in the suspension of students with disabilities. Because in many cases the number of students with or without disabilities being suspended for greater than ten days was so small, Kentucky determined that to be identified the district must have suspended at a minimum two students with disabilities and at least one half of one percent of its students with disabilities. Kentucky further determined that if a district suspended more students with disabilities for greater than ten days than the number of students without disabilities that it suspended for greater than ten days, then that district regardless of its risk ratio would also be identified as having a significant discrepancy in the number of students with disabilities that it suspends out of school for greater than ten days.
In identifying districts with a significant discrepancy, Kentucky chose to use additional processes beyond the risk ratio method due to concerns using this method exclusively. When a district suspends students with a disability for greater than ten days and does not suspend students without a disability, then that district has no suspension rate for its non-disabled students. As a result, a risk ratio could not be determined for the district. However, it was cause for concern that students with disabilities were being suspended for greater than ten days when students without disabilities were not. Therefore, these districts were also identified as having a significant discrepancy in its suspension of students with disabilities.
Further, the risk ratio method can potentially identify a district as discrepant based on the suspension of a single student with a disability. After additional analysis, KDE chose to identify a district as
SPP Part B: Indicator 4 Kentucky
Part B State Performance Plan: 2005-2010 Page (OMB NO: 1820-0624 / Expiration Date: )
56
having a significant discrepancy if the district had a risk ratio of 1.5 and also suspended at least one half of one percent and a minimum of 2 students with disabilities.
On the following pages, Table 4A reports suspension data of students with and without disabilities by district including: 1. the number and percent of students without disabilities who were suspended out of school for greater
than ten days, 2. the number and percent of students with disabilities who were suspended for greater than ten days, 3. the risk ratio of a student with a disability to be suspended for greater than ten days compared to a
student without a disability, and 4. an indication as to whether that district was identified as having a significant discrepancy in the
suspension of children with disabilities for greater than ten days in comparison with its suspension of students without disabilities who have been suspended for greater than 10 days.
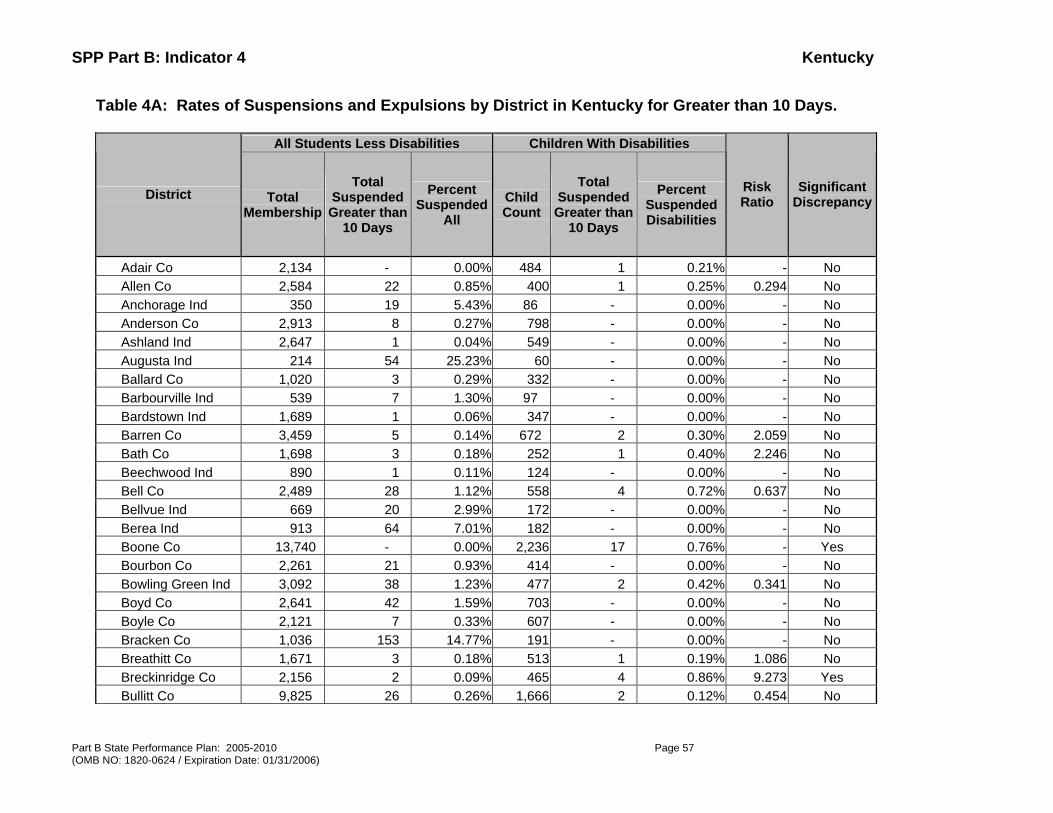
SPP Part B: Indicator 4 Kentucky
Part B State Performance Plan: 2005-2010 Page 57 (OMB NO: 1820-0624 / Expiration Date: 01/31/2006)
Table 4A: Rates of Suspensions and Expulsions by District in Kentucky for Greater than 10 Days.
All Students Less Disabilities Children With Disabilities
District Total Membership
Total Suspended Greater than
10 Days
Percent Suspended
All Child Count
Total Suspended Greater than
10 Days
Percent Suspended Disabilities
Risk Ratio
Significant Discrepancy
Adair Co 2,134 - 0.00% 484 1 0.21% - No Allen Co 2,584 22 0.85% 400 1 0.25% 0.294 No Anchorage Ind 350 19 5.43% 86 - 0.00% - No Anderson Co 2,913 8 0.27% 798 - 0.00% - No Ashland Ind 2,647 1 0.04% 549 - 0.00% - No Augusta Ind 214 54 25.23% 60 - 0.00% - No Ballard Co 1,020 3 0.29% 332 - 0.00% - No Barbourville Ind 539 7 1.30% 97 - 0.00% - No Bardstown Ind 1,689 1 0.06% 347 - 0.00% - No Barren Co 3,459 5 0.14% 672 2 0.30% 2.059 No Bath Co 1,698 3 0.18% 252 1 0.40% 2.246 No Beechwood Ind 890 1 0.11% 124 - 0.00% - No Bell Co 2,489 28 1.12% 558 4 0.72% 0.637 No Bellvue Ind 669 20 2.99% 172 - 0.00% - No Berea Ind 913 64 7.01% 182 - 0.00% - No Boone Co 13,740 - 0.00% 2,236 17 0.76% - Yes Bourbon Co 2,261 21 0.93% 414 - 0.00% - No Bowling Green Ind 3,092 38 1.23% 477 2 0.42% 0.341 No Boyd Co 2,641 42 1.59% 703 - 0.00% - No Boyle Co 2,121 7 0.33% 607 - 0.00% - No Bracken Co 1,036 153 14.77% 191 - 0.00% - No Breathitt Co 1,671 3 0.18% 513 1 0.19% 1.086 No Breckinridge Co 2,156 2 0.09% 465 4 0.86% 9.273 Yes Bullitt Co 9,825 26 0.26% 1,666 2 0.12% 0.454 No

SPP Part B: Indicator 4 Kentucky
Part B State Performance Plan: 2005-2010 Page 58 (OMB NO: 1820-0624 / Expiration Date: 01/31/2006)
All Students Less Disabilities Children With Disabilities
District Total Membership
Total Suspended Greater than
10 Days
Percent Suspended
All Child Count
Total Suspended Greater than
10 Days
Percent Suspended Disabilities
Risk Ratio
Significant Discrepancy
Burgin Ind 337 49 14.54% 90 - 0.00% - No Butler Co 1,810 1 0.06% 361 1 0.28% 5.014 No Caldwell Co 1,684 27 1.60% 311 4 1.29% 0.802 No Calloway Co 2,256 17 0.75% 545 - 0.00% - No Campbell Co 3,670 28 0.76% 910 4 0.44% 0.576 No Campbellsville Ind 933 1 0.11% 281 - 0.00% - No Carlisle Co 651 294 45.16% 153 - 0.00% - No Carroll Co 1,537 15 0.98% 312 - 0.00% - No Carter Co 3,909 7 0.18% 930 4 0.43% 2.402 No Casey Co 1,968 - 0.00% 415 2 0.48% - Yes Caverna Ind 616 2 0.32% 166 - 0.00% - No Christian Co 7,448 17 0.23% 1,504 1 0.07% 0.291 No Clark Co 4,525 6 0.13% 813 2 0.25% 1.855 No Clay Co 2,974 8 0.27% 902 - 0.00% - No Clinton Co 1,228 4 0.33% 366 - 0.00% - No Cloverport Ind 199 62 31.16% 95 - 0.00% - No Corbin Ind 1,947 107 5.50% 280 1 0.36% 0.065 No Covington Ind 3,115 4 0.13% 902 1 0.11% 0.863 No Crittenden Co 1,036 - 0.00% 267 1 0.37% - No Cumberland Co 879 6 0.68% 216 1 0.46% 0.678 No Danville Ind 1,406 5 0.36% 368 - 0.00% - No Daviess Co 8,969 3 0.03% 1,883 - 0.00% - No Dawson Springs Ind 495 12 2.42% 176 - 0.00% - No Dayton Ind 804 4 0.50% 239 - 0.00% - No East Berstadt Ind 411 6 1.46% 89 - 0.00% - No Edmonson Co 1,576 99 6.28% 443 - 0.00% - No

SPP Part B: Indicator 4 Kentucky
Part B State Performance Plan: 2005-2010 Page 59 (OMB NO: 1820-0624 / Expiration Date: 01/31/2006)
All Students Less Disabilities Children With Disabilities
District Total Membership
Total Suspended Greater than
10 Days
Percent Suspended
All Child Count
Total Suspended Greater than
10 Days
Percent Suspended Disabilities
Risk Ratio
Significant Discrepancy
Elizabethtown Ind 2,002 7 0.35% 303 1 0.33% 0.944 No Elliott Co 899 16 1.78% 281 - 0.00% - No Eminence Ind 497 3 0.60% 84 - 0.00% - No Erlanger Ind 1,875 - 0.00% 397 6 1.51% - Yes Estill Co 1,989 - 0.00% 498 2 0.40% - Yes Fairview Ind 638 21 3.29% 119 - 0.00% - No Fayette Co 29,888 20 0.07% 3,676 4 0.11% 1.626 No Fleming Co 2,088 4 0.19% 373 7 1.88% 9.796 Yes Floyd Co 5,277 - 0.00% 1,310 4 0.31% - Yes Fort Thomas Ind 2,059 22 1.07% 243 - 0.00% - No Frankfort Ind 658 49 7.45% 247 - 0.00% - No Franklin Co 4,970 6 0.12% 799 3 0.38% 3.110 No Fulton Co 521 4 0.77% 155 - 0.00% - No Fulton Ind 333 9 2.70% 104 1 0.96% 0.356 No Gallatin Co 1,202 34 2.83% 296 5 1.69% 0.597 No Garrard Co 2,035 24 1.18% 422 1 0.24% 0.201 No Glasgow Ind 1,609 16 0.99% 336 - 0.00% - No Grant Co 3,220 6 0.19% 556 - 0.00% - No Graves Co 3,857 15 0.39% 690 - 0.00% - No Grayson Co 3,529 25 0.71% 613 16 2.61% 3.684 Yes Green Co 1,368 2 0.15% 273 - 0.00% - No Greenup Co 2,587 54 2.09% 530 - 0.00% - No Hancock Co 1,301 13 1.00% 249 - 0.00% - No Hardin Co 10,943 35 0.32% 2,291 - 0.00% - No Harlan Co 3,748 2 0.05% 817 - 0.00% - No Harlan Ind 726 1 0.14% 179 - 0.00% - No

SPP Part B: Indicator 4 Kentucky
Part B State Performance Plan: 2005-2010 Page 60 (OMB NO: 1820-0624 / Expiration Date: 01/31/2006)
All Students Less Disabilities Children With Disabilities
District Total Membership
Total Suspended Greater than
10 Days
Percent Suspended
All Child Count
Total Suspended Greater than
10 Days
Percent Suspended Disabilities
Risk Ratio
Significant Discrepancy
Harrison Co 2,643 24 0.91% 538 - 0.00% - No Harrodsburg Ind 662 100 15.11% 249 2 0.80% 0.053 No Hart Co 1,945 42 2.16% 481 - 0.00% - No Hazard Ind 726 8 1.10% 164 - 0.00% - No Henderson Co 5,659 21 0.37% 1,181 - 0.00% - No Henry Co 1,839 4 0.22% 281 1 0.36% 1.636 No Hickman Co 590 33 5.59% 182 - 0.00% - No Hopkins Co 5,398 - 0.00% 1,558 14 0.90% - Yes Jackson Co 1,692 5 0.30% 530 - 0.00% - No Jackson Ind 473 18 3.81% 77 - 0.00% - No Jefferson Co 78,142 - 0.00% 13,792 83 0.60% - Yes Jenkins Ind 465 7 1.51% 100 - 0.00% - No Jessamine Co 5,679 12 0.21% 1,214 - 0.00% - No Johnson Co 3,009 1 0.03% 655 - 0.00% - No Kenton Co 10,664 13 0.12% 1,844 12 0.65% 5.338 Yes Knott Co 2,180 - 0.00% 518 5 0.97% - Yes Knox Co 3,890 4 0.10% 880 3 0.34% 3.315 No Larue Co 1,910 21 1.10% 452 - 0.00% - No Laurel Co 7,244 7 0.10% 1,559 - 0.00% - No Lawrence Co 2,085 27 1.29% 484 1 0.21% 0.160 No Lee Co 988 9 0.91% 218 1 0.46% 0.504 No Leslie Co 1,624 16 0.99% 404 2 0.50% 0.502 No Letcher Co 2,603 4 0.15% 808 - 0.00% - No Lewis Co 1,985 240 12.09% 421 - 0.00% - No Lincoln Co 3,235 - 0.00% 1,032 7 0.68% - Yes Livingston Co 1,086 3 0.28% 249 - 0.00% - No
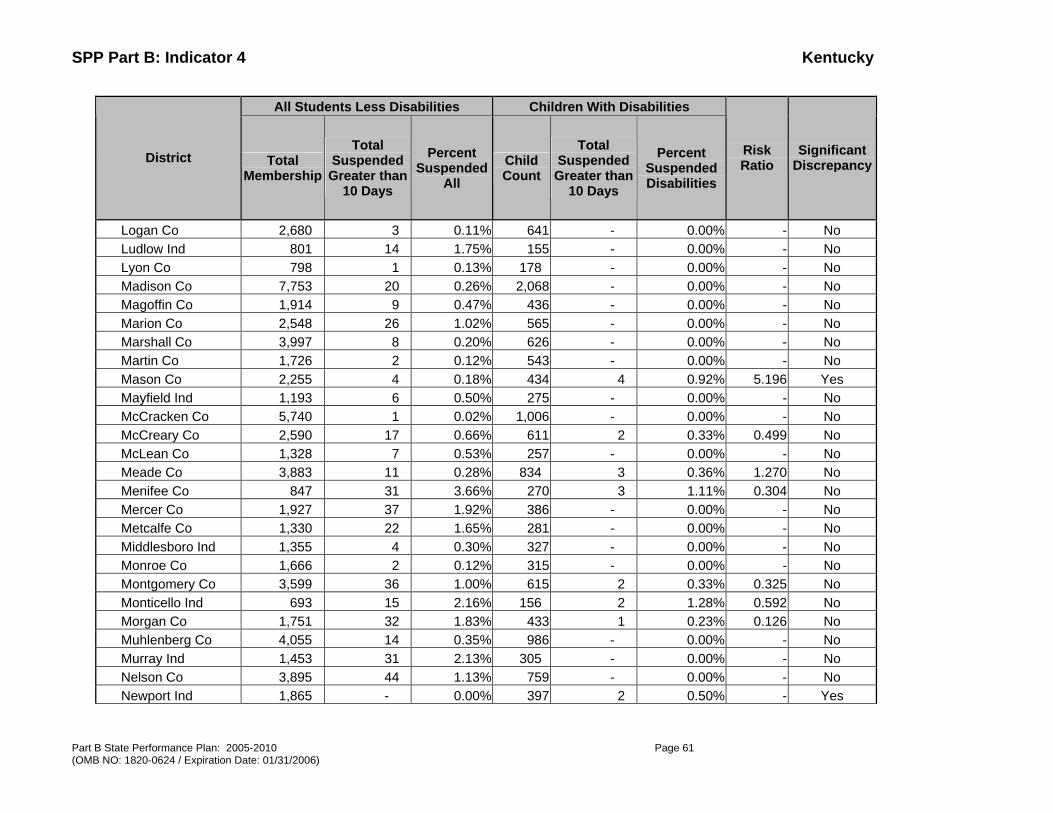
SPP Part B: Indicator 4 Kentucky
Part B State Performance Plan: 2005-2010 Page 61 (OMB NO: 1820-0624 / Expiration Date: 01/31/2006)
All Students Less Disabilities Children With Disabilities
District Total Membership
Total Suspended Greater than
10 Days
Percent Suspended
All Child Count
Total Suspended Greater than
10 Days
Percent Suspended Disabilities
Risk Ratio
Significant Discrepancy
Logan Co 2,680 3 0.11% 641 - 0.00% - No Ludlow Ind 801 14 1.75% 155 - 0.00% - No Lyon Co 798 1 0.13% 178 - 0.00% - No Madison Co 7,753 20 0.26% 2,068 - 0.00% - No Magoffin Co 1,914 9 0.47% 436 - 0.00% - No Marion Co 2,548 26 1.02% 565 - 0.00% - No Marshall Co 3,997 8 0.20% 626 - 0.00% - No Martin Co 1,726 2 0.12% 543 - 0.00% - No Mason Co 2,255 4 0.18% 434 4 0.92% 5.196 Yes Mayfield Ind 1,193 6 0.50% 275 - 0.00% - No McCracken Co 5,740 1 0.02% 1,006 - 0.00% - No McCreary Co 2,590 17 0.66% 611 2 0.33% 0.499 No McLean Co 1,328 7 0.53% 257 - 0.00% - No Meade Co 3,883 11 0.28% 834 3 0.36% 1.270 No Menifee Co 847 31 3.66% 270 3 1.11% 0.304 No Mercer Co 1,927 37 1.92% 386 - 0.00% - No Metcalfe Co 1,330 22 1.65% 281 - 0.00% - No Middlesboro Ind 1,355 4 0.30% 327 - 0.00% - No Monroe Co 1,666 2 0.12% 315 - 0.00% - No Montgomery Co 3,599 36 1.00% 615 2 0.33% 0.325 No Monticello Ind 693 15 2.16% 156 2 1.28% 0.592 No Morgan Co 1,751 32 1.83% 433 1 0.23% 0.126 No Muhlenberg Co 4,055 14 0.35% 986 - 0.00% - No Murray Ind 1,453 31 2.13% 305 - 0.00% - No Nelson Co 3,895 44 1.13% 759 - 0.00% - No Newport Ind 1,865 - 0.00% 397 2 0.50% - Yes

SPP Part B: Indicator 4 Kentucky
Part B State Performance Plan: 2005-2010 Page 62 (OMB NO: 1820-0624 / Expiration Date: 01/31/2006)
All Students Less Disabilities Children With Disabilities
District Total Membership
Total Suspended Greater than
10 Days
Percent Suspended
All Child Count
Total Suspended Greater than
10 Days
Percent Suspended Disabilities
Risk Ratio
Significant Discrepancy
Nicholas Co 1,002 39 3.89% 181 3 1.66% 0.426 No Ohio Co 3,232 1 0.03% 704 - 0.00% - No Oldham Co 8,688 72 0.83% 1,595 - 0.00% - No Owen Co 1,652 16 0.97% 228 - 0.00% - No Owensboro Ind 3,028 23 0.76% 863 1 0.12% 0.153 No Owsley Co 656 - 0.00% 135 1 0.74% - No Paducah Ind 2,466 - 0.00% 427 20 4.68% - Yes Paintsville Ind 766 54 7.05% 86 - 0.00% - No Paris Ind 629 15 2.38% 91 - 0.00% - No Pendleton Co 2,322 13 0.56% 439 - 0.00% - No Perry Co 3,379 2 0.06% 987 - 0.00% - No Pike Co 8,350 2 0.02% 1,491 1 0.07% 2.800 No Pikeville Ind 1,121 29 2.59% 136 - 0.00% - No Pineville Ind 478 21 4.39% 91 - 0.00% - No Powell Co 2,023 19 0.94% 497 - 0.00% - No Providence Ind 297 5 1.68% 90 - 0.00% - No Pulaski Co 6,334 3 0.05% 1,270 - 0.00% - No Raceland Ind 863 6 0.70% 108 - 0.00% - No Robertson Co 328 46 14.02% 80 1 1.25% 0.089 No Rockcastle Co 2,379 5 0.21% 549 - 0.00% - No Rowan Co 2,366 6 0.25% 598 6 1.00% 3.957 Yes Russell Co 2,269 5 0.22% 570 - 0.00% - No Russell Ind 1,828 26 1.42% 291 - 0.00% - No Russellville Ind 925 8 0.86% 247 2 0.81% 0.936 No Science Hill Ind 394 1 0.25% 76 - 0.00% - No Scott Co 5,643 68 1.21% 1,000 2 0.20% 0.166 No
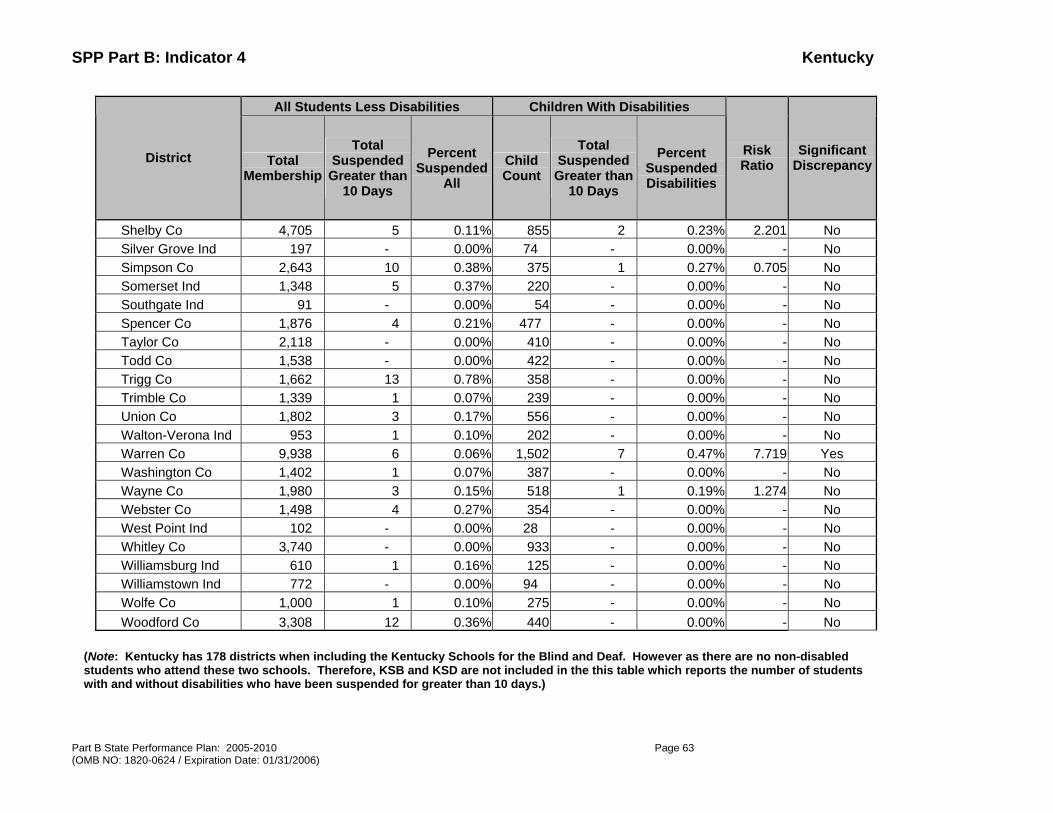
SPP Part B: Indicator 4 Kentucky
Part B State Performance Plan: 2005-2010 Page 63 (OMB NO: 1820-0624 / Expiration Date: 01/31/2006)
All Students Less Disabilities Children With Disabilities
District Total Membership
Total Suspended Greater than
10 Days
Percent Suspended
All Child Count
Total Suspended Greater than
10 Days
Percent Suspended Disabilities
Risk Ratio
Significant Discrepancy
Shelby Co 4,705 5 0.11% 855 2 0.23% 2.201 No Silver Grove Ind 197 - 0.00% 74 - 0.00% - No Simpson Co 2,643 10 0.38% 375 1 0.27% 0.705 No Somerset Ind 1,348 5 0.37% 220 - 0.00% - No Southgate Ind 91 - 0.00% 54 - 0.00% - No Spencer Co 1,876 4 0.21% 477 - 0.00% - No Taylor Co 2,118 - 0.00% 410 - 0.00% - No Todd Co 1,538 - 0.00% 422 - 0.00% - No Trigg Co 1,662 13 0.78% 358 - 0.00% - No Trimble Co 1,339 1 0.07% 239 - 0.00% - No Union Co 1,802 3 0.17% 556 - 0.00% - No Walton-Verona Ind 953 1 0.10% 202 - 0.00% - No Warren Co 9,938 6 0.06% 1,502 7 0.47% 7.719 Yes Washington Co 1,402 1 0.07% 387 - 0.00% - No Wayne Co 1,980 3 0.15% 518 1 0.19% 1.274 No Webster Co 1,498 4 0.27% 354 - 0.00% - No West Point Ind 102 - 0.00% 28 - 0.00% - No Whitley Co 3,740 - 0.00% 933 - 0.00% - No Williamsburg Ind 610 1 0.16% 125 - 0.00% - No Williamstown Ind 772 - 0.00% 94 - 0.00% - No Wolfe Co 1,000 1 0.10% 275 - 0.00% - No Woodford Co 3,308 12 0.36% 440 - 0.00% - No
(Note: Kentucky has 178 districts when including the Kentucky Schools for the Blind and Deaf. However as there are no non-disabled students who attend these two schools. Therefore, KSB and KSD are not included in the this table which reports the number of students with and without disabilities who have been suspended for greater than 10 days.)
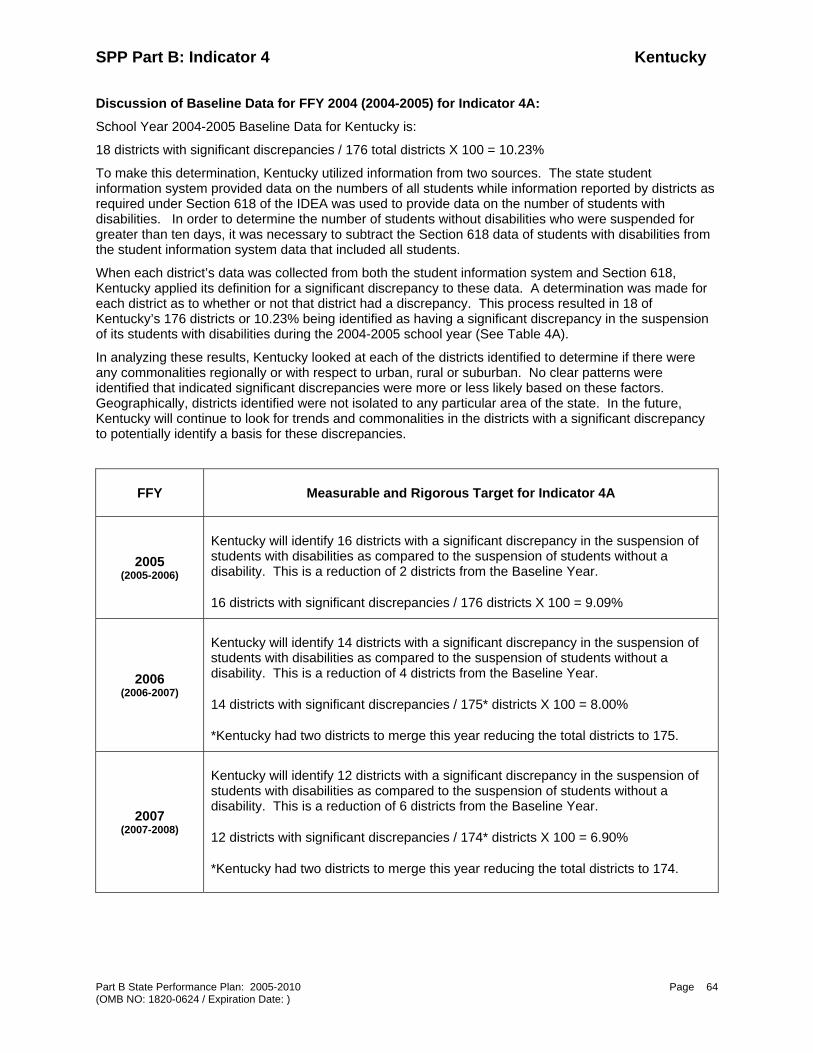
SPP Part B: Indicator 4 Kentucky
Part B State Performance Plan: 2005-2010 Page (OMB NO: 1820-0624 / Expiration Date: )
64
Discussion of Baseline Data for FFY 2004 (2004-2005) for Indicator 4A:
School Year 2004-2005 Baseline Data for Kentucky is:
18 districts with significant discrepancies / 176 total districts X 100 = 10.23%
To make this determination, Kentucky utilized information from two sources. The state student information system provided data on the numbers of all students while information reported by districts as required under Section 618 of the IDEA was used to provide data on the number of students with disabilities. In order to determine the number of students without disabilities who were suspended for greater than ten days, it was necessary to subtract the Section 618 data of students with disabilities from the student information system data that included all students.
When each district’s data was collected from both the student information system and Section 618, Kentucky applied its definition for a significant discrepancy to these data. A determination was made for each district as to whether or not that district had a discrepancy. This process resulted in 18 of Kentucky’s 176 districts or 10.23% being identified as having a significant discrepancy in the suspension of its students with disabilities during the 2004-2005 school year (See Table 4A).
In analyzing these results, Kentucky looked at each of the districts identified to determine if there were any commonalities regionally or with respect to urban, rural or suburban. No clear patterns were identified that indicated significant discrepancies were more or less likely based on these factors. Geographically, districts identified were not isolated to any particular area of the state. In the future, Kentucky will continue to look for trends and commonalities in the districts with a significant discrepancy to potentially identify a basis for these discrepancies.
FFY Measurable and Rigorous Target for Indicator 4A
2005 (2005-2006)
Kentucky will identify 16 districts with a significant discrepancy in the suspension of students with disabilities as compared to the suspension of students without a disability. This is a reduction of 2 districts from the Baseline Year.
16 districts with significant discrepancies / 176 districts X 100 = 9.09%
2006 (2006-2007)
Kentucky will identify 14 districts with a significant discrepancy in the suspension of students with disabilities as compared to the suspension of students without a disability. This is a reduction of 4 districts from the Baseline Year.
14 districts with significant discrepancies / 175* districts X 100 = 8.00%
*Kentucky had two districts to merge this year reducing the total districts to 175.
2007 (2007-2008)
Kentucky will identify 12 districts with a significant discrepancy in the suspension of students with disabilities as compared to the suspension of students without a disability. This is a reduction of 6 districts from the Baseline Year.
12 districts with significant discrepancies / 174* districts X 100 = 6.90%
*Kentucky had two districts to merge this year reducing the total districts to 174.
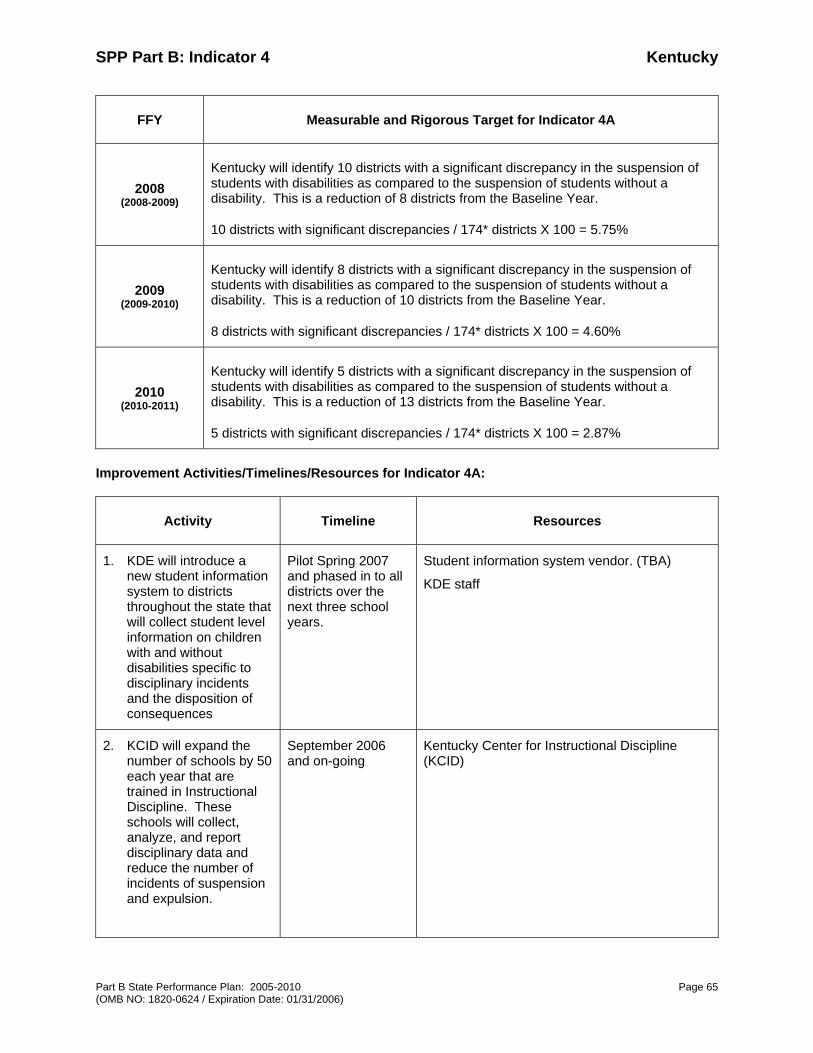
SPP Part B: Indicator 4 Kentucky
Part B State Performance Plan: 2005-2010 Page 65 (OMB NO: 1820-0624 / Expiration Date: 01/31/2006)
FFY Measurable and Rigorous Target for Indicator 4A
2008 (2008-2009)
Kentucky will identify 10 districts with a significant discrepancy in the suspension of students with disabilities as compared to the suspension of students without a disability. This is a reduction of 8 districts from the Baseline Year.
10 districts with significant discrepancies / 174* districts X 100 = 5.75%
2009 (2009-2010)
Kentucky will identify 8 districts with a significant discrepancy in the suspension of students with disabilities as compared to the suspension of students without a disability. This is a reduction of 10 districts from the Baseline Year.
8 districts with significant discrepancies / 174* districts X 100 = 4.60%
2010 (2010-2011)
Kentucky will identify 5 districts with a significant discrepancy in the suspension of students with disabilities as compared to the suspension of students without a disability. This is a reduction of 13 districts from the Baseline Year.
5 districts with significant discrepancies / 174* districts X 100 = 2.87%
Improvement Activities/Timelines/Resources for Indicator 4A:
Activity Timeline Resources
1. KDE will introduce a new student information system to districts throughout the state that will collect student level information on children with and without disabilities specific to disciplinary incidents and the disposition of consequences
Pilot Spring 2007 and phased in to all districts over the next three school years.
Student information system vendor. (TBA)
KDE staff
2. KCID will expand the number of schools by 50 each year that are trained in Instructional Discipline. These schools will collect, analyze, and report disciplinary data and reduce the number of incidents of suspension and expulsion.
September 2006 and on-going
Kentucky Center for Instructional Discipline (KCID)
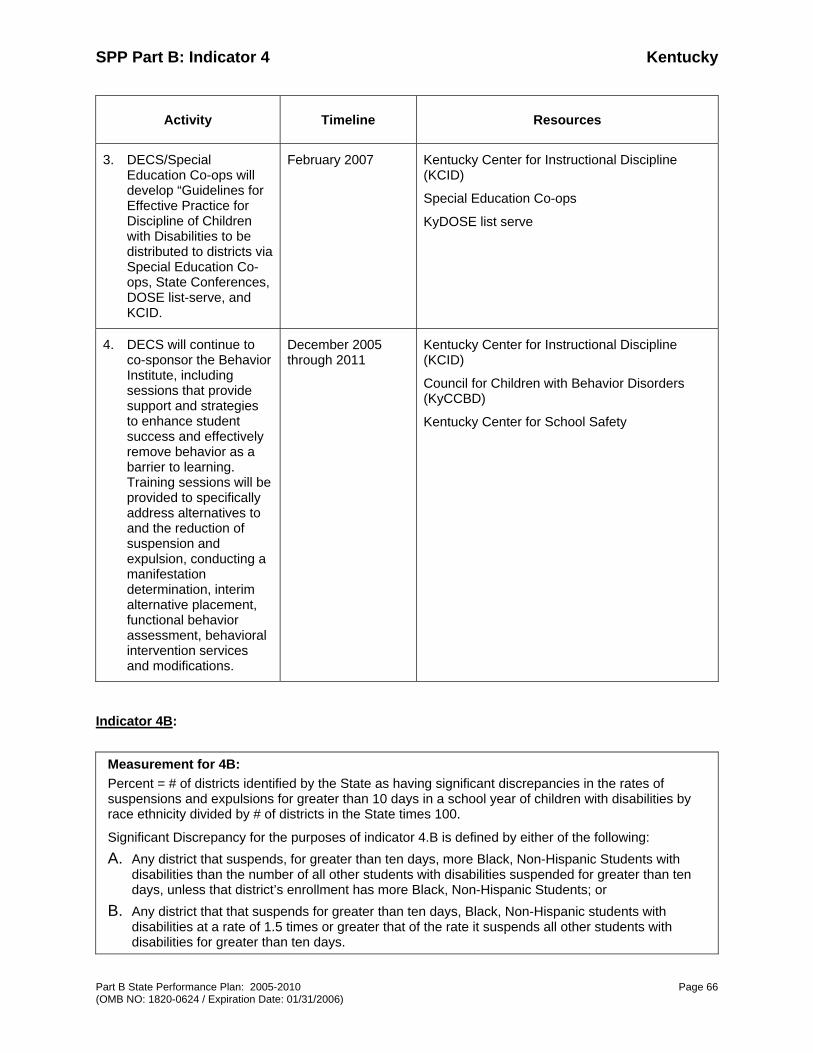
SPP Part B: Indicator 4 Kentucky
Part B State Performance Plan: 2005-2010 Page 66 (OMB NO: 1820-0624 / Expiration Date: 01/31/2006)
Activity Timeline Resources
3. DECS/Special Education Co-ops will develop “Guidelines for Effective Practice for Discipline of Children with Disabilities to be distributed to districts via Special Education Co-ops, State Conferences, DOSE list-serve, and KCID.
February 2007 Kentucky Center for Instructional Discipline (KCID)
Special Education Co-ops
KyDOSE list serve
4. DECS will continue to co-sponsor the Behavior Institute, including sessions that provide support and strategies to enhance student success and effectively remove behavior as a barrier to learning. Training sessions will be provided to specifically address alternatives to and the reduction of suspension and expulsion, conducting a manifestation determination, interim alternative placement, functional behavior assessment, behavioral intervention services and modifications.
December 2005 through 2011
Kentucky Center for Instructional Discipline (KCID)
Council for Children with Behavior Disorders (KyCCBD)
Kentucky Center for School Safety
Indicator 4B:
Measurement for 4B: Percent = # of districts identified by the State as having significant discrepancies in the rates of suspensions and expulsions for greater than 10 days in a school year of children with disabilities by race ethnicity divided by # of districts in the State times 100.
Significant Discrepancy for the purposes of indicator 4.B is defined by either of the following: A. Any district that suspends, for greater than ten days, more Black, Non-Hispanic Students with
disabilities than the number of all other students with disabilities suspended for greater than ten days, unless that district’s enrollment has more Black, Non-Hispanic Students; or
B. Any district that that suspends for greater than ten days, Black, Non-Hispanic students with disabilities at a rate of 1.5 times or greater that of the rate it suspends all other students with disabilities for greater than ten days.
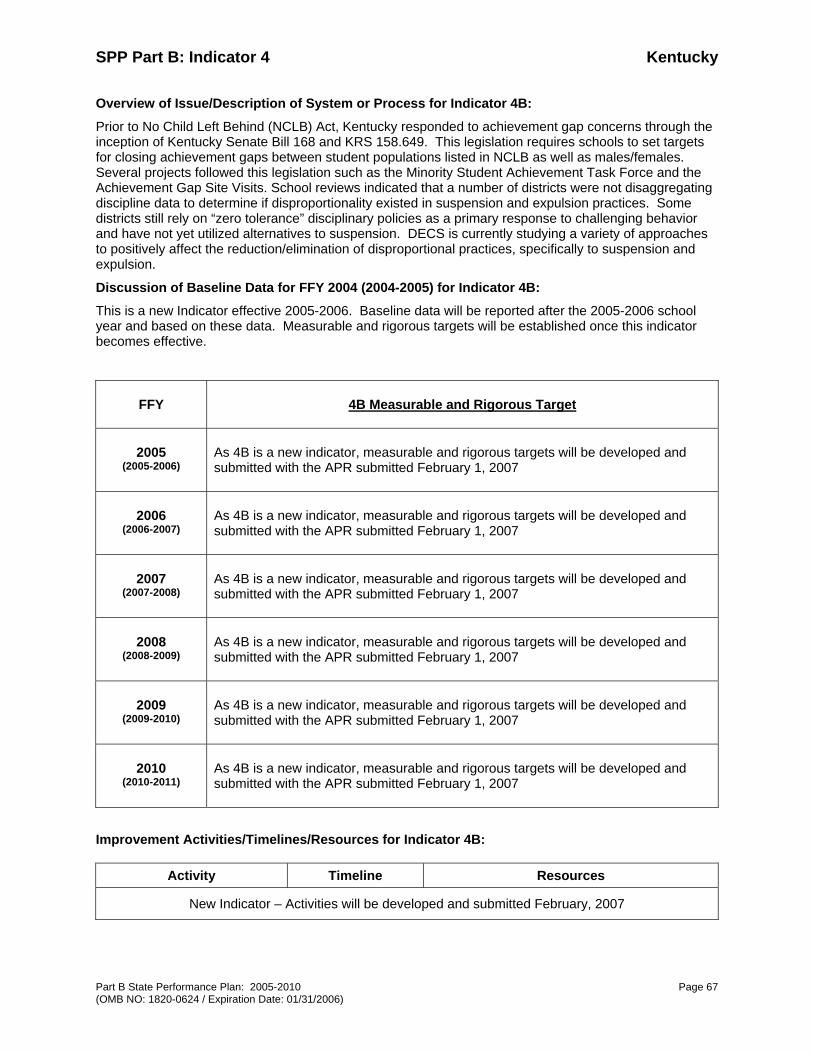
SPP Part B: Indicator 4 Kentucky
Part B State Performance Plan: 2005-2010 Page 67 (OMB NO: 1820-0624 / Expiration Date: 01/31/2006)
Overview of Issue/Description of System or Process for Indicator 4B:
Prior to No Child Left Behind (NCLB) Act, Kentucky responded to achievement gap concerns through the inception of Kentucky Senate Bill 168 and KRS 158.649. This legislation requires schools to set targets for closing achievement gaps between student populations listed in NCLB as well as males/females. Several projects followed this legislation such as the Minority Student Achievement Task Force and the Achievement Gap Site Visits. School reviews indicated that a number of districts were not disaggregating discipline data to determine if disproportionality existed in suspension and expulsion practices. Some districts still rely on “zero tolerance” disciplinary policies as a primary response to challenging behavior and have not yet utilized alternatives to suspension. DECS is currently studying a variety of approaches to positively affect the reduction/elimination of disproportional practices, specifically to suspension and expulsion.
Discussion of Baseline Data for FFY 2004 (2004-2005) for Indicator 4B:
This is a new Indicator effective 2005-2006. Baseline data will be reported after the 2005-2006 school year and based on these data. Measurable and rigorous targets will be established once this indicator becomes effective.
FFY 4B Measurable and Rigorous Target
2005 (2005-2006)
As 4B is a new indicator, measurable and rigorous targets will be developed and submitted with the APR submitted February 1, 2007
2006 (2006-2007)
As 4B is a new indicator, measurable and rigorous targets will be developed and submitted with the APR submitted February 1, 2007
2007 (2007-2008)
As 4B is a new indicator, measurable and rigorous targets will be developed and submitted with the APR submitted February 1, 2007
2008 (2008-2009)
As 4B is a new indicator, measurable and rigorous targets will be developed and submitted with the APR submitted February 1, 2007
2009 (2009-2010)
As 4B is a new indicator, measurable and rigorous targets will be developed and submitted with the APR submitted February 1, 2007
2010 (2010-2011)
As 4B is a new indicator, measurable and rigorous targets will be developed and submitted with the APR submitted February 1, 2007
Improvement Activities/Timelines/Resources for Indicator 4B:
Activity Timeline Resources
New Indicator – Activities will be developed and submitted February, 2007
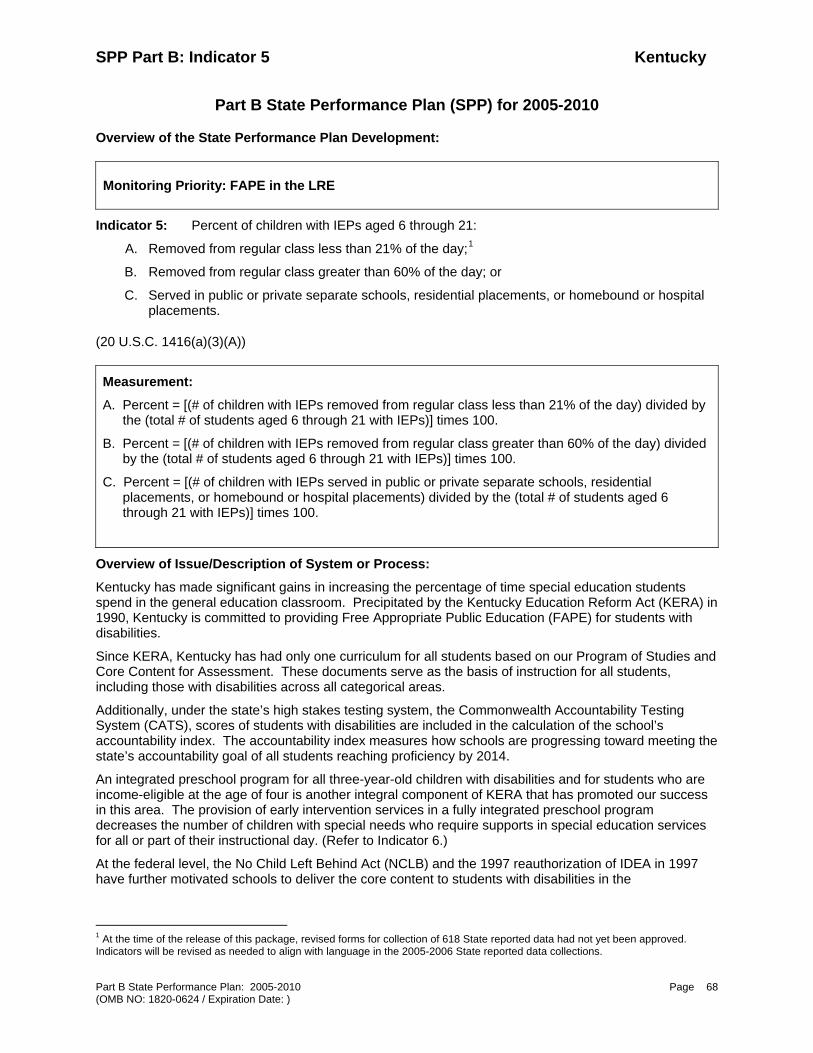
SPP Part B: Indicator 5 Kentucky
Part B State Performance Plan: 2005-2010 Page (OMB NO: 1820-0624 / Expiration Date: )
68
Part B State Performance Plan (SPP) for 2005-2010
Overview of the State Performance Plan Development:
Monitoring Priority: FAPE in the LRE
Indicator 5: Percent of children with IEPs aged 6 through 21:
A. Removed from regular class less than 21% of the day;1
B. Removed from regular class greater than 60% of the day; or
C. Served in public or private separate schools, residential placements, or homebound or hospital placements.
(20 U.S.C. 1416(a)(3)(A))
Measurement:
A. Percent = [(# of children with IEPs removed from regular class less than 21% of the day) divided by the (total # of students aged 6 through 21 with IEPs)] times 100.
B. Percent = [(# of children with IEPs removed from regular class greater than 60% of the day) divided by the (total # of students aged 6 through 21 with IEPs)] times 100.
C. Percent = [(# of children with IEPs served in public or private separate schools, residential placements, or homebound or hospital placements) divided by the (total # of students aged 6 through 21 with IEPs)] times 100.
Overview of Issue/Description of System or Process:
Kentucky has made significant gains in increasing the percentage of time special education students spend in the general education classroom. Precipitated by the Kentucky Education Reform Act (KERA) in 1990, Kentucky is committed to providing Free Appropriate Public Education (FAPE) for students with disabilities.
Since KERA, Kentucky has had only one curriculum for all students based on our Program of Studies and Core Content for Assessment. These documents serve as the basis of instruction for all students, including those with disabilities across all categorical areas.
Additionally, under the state’s high stakes testing system, the Commonwealth Accountability Testing System (CATS), scores of students with disabilities are included in the calculation of the school’s accountability index. The accountability index measures how schools are progressing toward meeting the state’s accountability goal of all students reaching proficiency by 2014.
An integrated preschool program for all three-year-old children with disabilities and for students who are income-eligible at the age of four is another integral component of KERA that has promoted our success in this area. The provision of early intervention services in a fully integrated preschool program decreases the number of children with special needs who require supports in special education services for all or part of their instructional day. (Refer to Indicator 6.)
At the federal level, the No Child Left Behind Act (NCLB) and the 1997 reauthorization of IDEA in 1997 have further motivated schools to deliver the core content to students with disabilities in the
1 At the time of the release of this package, revised forms for collection of 618 State reported data had not yet been approved. Indicators will be revised as needed to align with language in the 2005-2006 State reported data collections.

SPP Part B: Indicator 5 Kentucky
Part B State Performance Plan: 2005-2010 Page (OMB NO: 1820-0624 / Expiration Date: )
69
general education classroom staffed by content-certified teachers meeting NCLB’s highly qualified requirements. These pieces of legislation have also contributed to the significant gains Kentucky has made in this area.
Baseline Data for FFY 2004 (2004-2005):
*The 2.30% is a change from the 4% Kentucky reported in the 2005 SPP submission. The data was reported incorrectly due to a calculation error.
Discussion of Baseline Data:
An analysis of the FFY2003 and 2004 Kentucky Continuous Monitoring Process (KCMP) data as well as a review of substantiated complaints, hearings, and mediations, indicates only 9 of Kentucky’s one hundred seventy-eight districts had LRE violations. Included in the district number are the Kentucky School for the Deaf and the Kentucky School for the Blind. Moreover, Kentucky’s placement of students in the general education classroom is higher than the national average. The above figures are based on Kentucky’s December 1 Child Count Data that reports placement options as 80% or more time in the general education setting; 40 to 80% of the instructional day in general education setting; and less than 40% in the general education program. Other students are tracked as receiving services in a public day school, private day school, public residential school, private residential school, home/hospital services, correctional facilities, and placement by parents in private schools. Children who are home schooled are considered by legislation to be enrolled in private school placements. Although not requested by OSEP, we collect data on the number of children placed in the general education classroom 40-80% of the day. Currently, 24% of students with disabilities are placed in the general education classroom between 40-80% of the day.
The Division of Exceptional Children (DECS) and our State Advisory Panel reviewed annual trend child count data from the last three years to establish Kentucky’s targets for the next three years. In setting the measurable and rigorous targets for FAPE in the 2005 SPP, the state did not compromise the individual needs of the child as determined by the Admissions and Release Committee (ARC)/Individual Education Program (IEP) team. Placement decisions will continue to be the responsibility of the ARC/IEP team and will be based on each child’s unique needs. The validity and reliability of the Section 618 data are addressed in Indicator 20.
FFY 5A Measurable and Rigorous Targets
2005 (2005 – 2006)
Increase the number of students spending 80% or more of their instructional day in the general education program from 62 percent to 63 percent.
2007 (2007 – 2008)
Increase the number of students spending 80% or more of their instructional day in the general education program from 63 percent to 64 percent.
2009 (2009-2010)
Increase the number of students spending 80% or more of their instructional day in the general education program from 64 percent to 65 percent.
A. Removed from regular class less than 21% 62%
B. Removed from regular class greater than 60% 11.7%
C. Served in other public or private schools, residential placements, or homebound or hospital placements
*2.30%
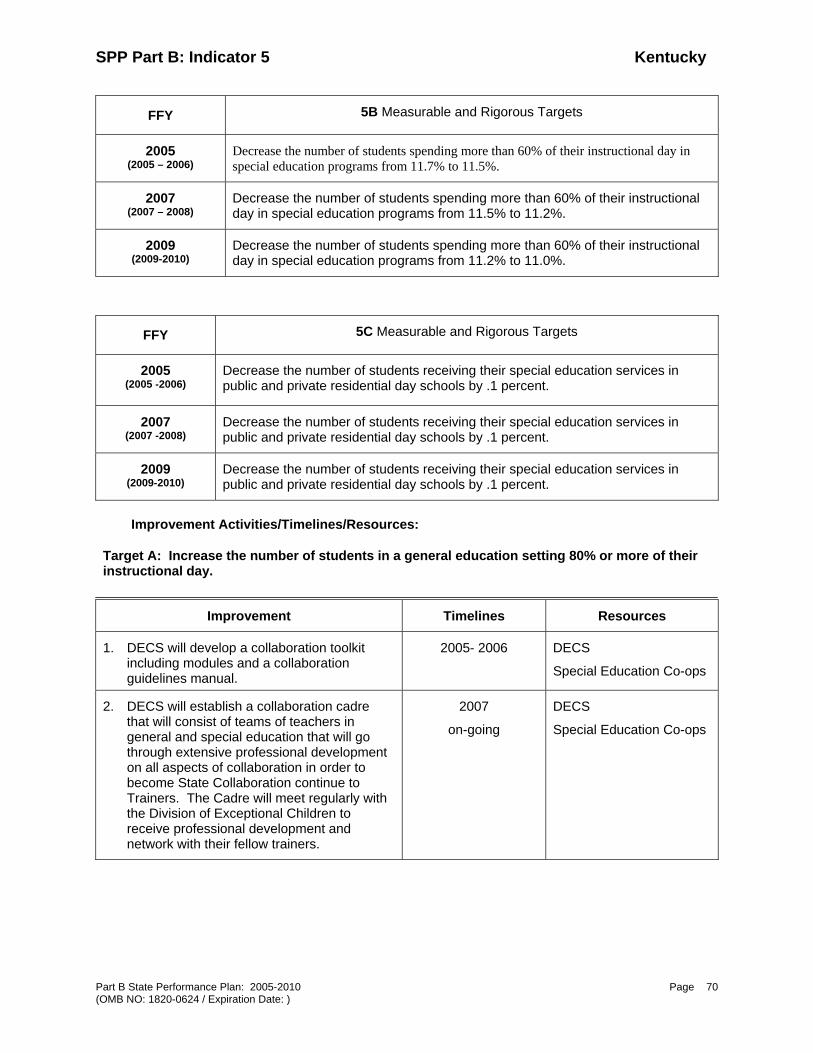
SPP Part B: Indicator 5 Kentucky
Part B State Performance Plan: 2005-2010 Page (OMB NO: 1820-0624 / Expiration Date: )
70
FFY 5B Measurable and Rigorous Targets
2005 (2005 – 2006)
Decrease the number of students spending more than 60% of their instructional day in special education programs from 11.7% to 11.5%.
2007 (2007 – 2008)
Decrease the number of students spending more than 60% of their instructional day in special education programs from 11.5% to 11.2%.
2009 (2009-2010)
Decrease the number of students spending more than 60% of their instructional day in special education programs from 11.2% to 11.0%.
FFY 5C Measurable and Rigorous Targets
2005 (2005 -2006)
Decrease the number of students receiving their special education services in public and private residential day schools by .1 percent.
2007 (2007 -2008)
Decrease the number of students receiving their special education services in public and private residential day schools by .1 percent.
2009 (2009-2010)
Decrease the number of students receiving their special education services in public and private residential day schools by .1 percent.
Improvement Activities/Timelines/Resources:
Target A: Increase the number of students in a general education setting 80% or more of their instructional day.
Improvement Timelines Resources
1. DECS will develop a collaboration toolkit including modules and a collaboration guidelines manual.
2005- 2006 DECS
Special Education Co-ops
2. DECS will establish a collaboration cadre that will consist of teams of teachers in general and special education that will go through extensive professional development on all aspects of collaboration in order to become State Collaboration continue to Trainers. The Cadre will meet regularly with the Division of Exceptional Children to receive professional development and network with their fellow trainers.
2007
on-going
DECS
Special Education Co-ops

SPP Part B: Indicator 5 Kentucky
Part B State Performance Plan: 2005-2010 Page 71 (OMB NO: 1820-0624 / Expiration Date: 01/31/2006)
Improvement Timelines Resources
3. DECS, through the Statewide Support System for the Collaborative Teaching Model, will identify model schools/teams of special and general educators throughout the state that are effectively using the collaborative teaching model to ensure students with disabilities are receiving access and making progress within the general education curriculum. These schools/teams will be used as collaboration model sites.
2008- 2009 DECS
Special Education Co-ops
4. DECS will create a web site for collaboration that can be linked to the KDE Division of Exceptional Children web page that will provide districts with access to articles, collaboration strategies for teacher teams and students, conflict resolution strategies, and implementation of effective collaboration strategies.
2009- 2010
DECS
Special Education Co-ops
Mid South Regional Resource Center
5. DECS, in collaboration with the Office for Leadership and School Improvement, will jointly work to fully train and utilize Kentucky’s Highly Skilled Educators and Special Education Mentors to support the collaborative teaching model in the schools where they manage school improvement.
2007- 2008 DECS
Office for Leadership and School Improvement
Target B: Increase the number of students who are placed in the general education setting for 40-80% of their instructional day.
Improvement Timelines Resources
1. The Kentucky Accessibility Materials Consortium (KAMC) will assist all Kentucky schools in using digital curriculum to address the diverse learning needs of students with disabilities. As evidence, annual reports from the KAMC will show an increase in the number of schools requesting materials from the KAMD, the types and quantity of materials requested from the KAMD, and the number of times the Digital Curriculum Best Practices website is accessed.
2008
ongoing
DECS
KAMC
2. DECS will increase the use of CATS online assessment use to at least 95% of Kentucky schools with eligible students.
2010-2011 DECS
Division of Assessment
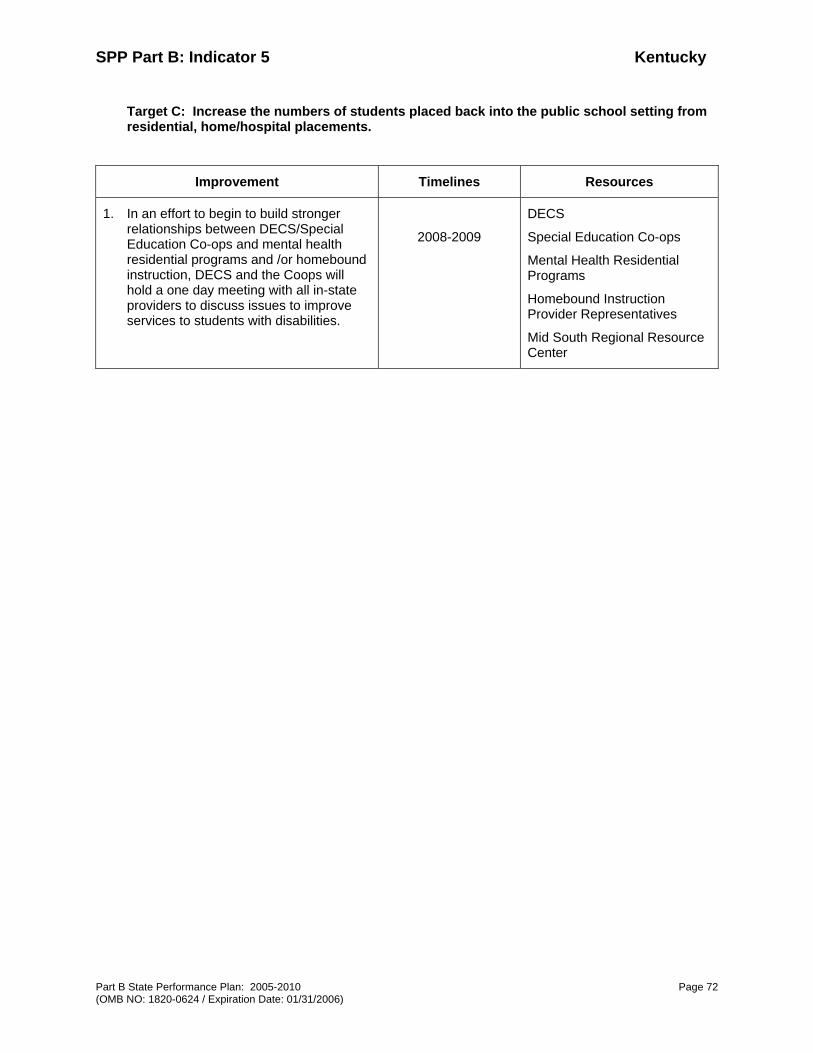
SPP Part B: Indicator 5 Kentucky
Part B State Performance Plan: 2005-2010 Page 72 (OMB NO: 1820-0624 / Expiration Date: 01/31/2006)
Target C: Increase the numbers of students placed back into the public school setting from residential, home/hospital placements.
Improvement Timelines Resources
1. In an effort to begin to build stronger relationships between DECS/Special Education Co-ops and mental health residential programs and /or homebound instruction, DECS and the Coops will hold a one day meeting with all in-state providers to discuss issues to improve services to students with disabilities.
2008-2009
DECS
Special Education Co-ops
Mental Health Residential Programs
Homebound Instruction Provider Representatives
Mid South Regional Resource Center

SPP Part B: Indicator 6 Kentucky
Part B State Performance Plan: 2005-2010 Page (OMB NO: 1820-0624 / Expiration Date: )
73
Part B State Performance Plan (SPP) for 2005-2010
Overview of the State Performance Plan Development: See Introduction Monitoring Priority: FAPE in the LRE
Indicator 6: Percent of preschool children with IEPs who received special education and related
services in settings with typically developing peers (e.g., early childhood settings, home, and part-time early childhood/part-time early childhood special education settings).
(20 U.S.C. 1416(a)(3)(A)) Measurement: Percent = # of preschool children with IEPs who received all special education services in settings with typically developing peers divided by the total # of preschool children with IEPs times 100.
Overview of Issue/Description of System or Process: A. Kentucky Demographics – Discussion of Data
There are currently over 266,000 children under the age of five in Kentucky. Twenty-six percent (26%) of those children live in poverty (KIDS Count, 2005), ranking Kentucky 42nd in the nation in meeting the needs of children and families. Kentucky also has a large percentage of children (59%) who live in homes where both parents are in the workforce. Preschool children are served by a number of agencies within the state. State data indicate that in the year 2004-2005, Kentucky served:
• 11,052 infants and toddlers through Part C.
• 13,440 three and four-year-olds with disabilities and 8,020 4-year-old children at risk of educational failure in the state funded preschool program (December 1, 2005).
• 14,342 children through Head Start programs.
Additionally, Kentucky has 9,184 Licensed/Regulated Child Care Homes and 2,173 Licensed/Regulated Child Care Centers that provide out-of-home care for families.
B. Historical Background Over the last fifteen years, Kentucky has provided inclusive environments for young children with disabilities. The Kentucky Education Reform Act (KERA) of 1990 established preschool programs for young children at risk of educational failure. These state-funded programs serve four-year-old children who are eligible for free lunch and three and four-year-old children with a diagnosed disability or developmental delay. The regulations further require that the state-funded preschool program be inclusive and serve children in the least restrictive environment.
In 1999, Kentucky began a comprehensive effort to address the unmet needs of young children and their families. The effort included input from thousands of Kentucky citizens and resulted in the passage of HB 706, known as the KIDS NOW Early Childhood Development Initiative. KIDS NOW is a results-oriented initiative that builds on existing resources, fosters public/private partnerships, and ensures collaborative planning and implementation at the state and local level.
SPP Part B: Indicator 6 Kentucky
Part B State Performance Plan: 2005-2010 Page 74 (OMB NO: 1820-0624 / Expiration Date: 01/31/2006)
To further support its commitment to ensure the brightest possible future for all Kentucky children, Kentucky developed a series of documents to assist parents, educators, and childcare providers. Described below are the four documents in Kentucky’s Building a Strong Foundation for School Success series.
Kentucky Early Childhood Standards
In 2001, two work groups convened to construct the Kentucky Early Childhood Standards that were released in 2003. The Standards are a framework to assist parents, early care and education professionals, administrators, and other stakeholders in understanding what Kentucky wants all children to know and be able to do from birth through four years of age. Drawn from current research, they outline a shared set of expectations for young children that provide the foundation for competencies critical to later academic success. The Kentucky Early Childhood Standards provide standards, benchmarks, a developmental continuum, and examples for each learning domain (birth to three) and content area of development (three and four). They are aligned with the K-12 Program of Studies, Head Start Outcomes Framework, and OSEP Early Childhood Outcomes.
The Standards are universally designed and are applicable to all early care and education environments across the state. They address the early language/communication, early literacy, and social-emotional skills of preschool-age children and are grouped by age ranges (birth-to-three, three and four) rather than by specific ages. This allows children of differing abilities to progress through the standards with a focus on the development of knowledge and skills, not chronological age. Specific examples are provided for the developmental continuums that include how a child with a disability might demonstrate a specific benchmark.
In addition to KDE, many agencies have adopted the Kentucky Early Childhood Standards. They include First Steps (Kentucky Early Intervention System), regulated childcare, HANDS Voluntary Home Visitation Program, Even Start, Kentucky Family Literacy Programs, and other programs working with young children and their families. Since their release, thousands of early childhood professionals have been trained in the use of the Kentucky Early Childhood Standards at state and regional conferences/institutes, through training provided by Early Childhood Regional Training Centers, Child Care Resource and Referral Agencies, KDE, and institutions of higher education. Both two and four-year institutions of higher education are using the Kentucky Early Childhood Standards as a consistent base for all early childhood courses, including the related early childhood standards in their syllabus and course content.
Kentucky Early Childhood Standards Parent Guides
Released in August 2004, The Parent Guide for Children Birth -Three and the Parent Guide for Children Three and Four, translate the Kentucky Early Childhood Standards into a usable format for parents and families. These documents assist parents in understanding the developmental sequence that unfolds in the first four years of life, their role in supporting development and learning during this period, and the connection between the early years and later academic success.
The Guides assist parents in their role as the primary teachers and caregivers of their children and provide a tool that gives appropriate child development information related to child outcomes. Individuals that work with young children and their families are trained in the use of the Parent Guides and understand their link with the Kentucky Early Childhood Standards. The following programs use the Parent Guides:
• Health Access Nurturing Development Services (HANDS) Voluntary Home Visitation Program • First Steps (Kentucky Early Intervention System) • Even Start • Head Start/Early Head Start • Family Resource Youth Services Centers • Early Childhood Mental Health Program

SPP Part B: Indicator 6 Kentucky
Part B State Performance Plan: 2005-2010 Page 75 (OMB NO: 1820-0624 / Expiration Date: 01/31/2006)
• Kentucky Institute for Family Literacy • State Funded Preschool • Children’s Advocacy Centers • Early Childhood Regional Training Centers • Community Early Childhood Councils • Healthy Start in Child Care • Higher Education Early Childhood Departments • Child Care Providers • Healthy Babies Campaign
Kentucky Early Childhood Continuous Assessment Guide
In 2003-2004, a broad based, collaborative work group convened to develop the Kentucky Early Childhood Continuous Assessment Guide as a companion piece to the Kentucky Early Childhood Standards. It provides recommended guidelines and practices in screening, diagnostic, classroom/instructional and program evaluation. Kentucky’s Early Childhood Continuous Assessment Guide:
• Presents a universally designed, continuous assessment process
• Is comprehensive
• Serves as a tool for matching program goals with assessment procedures and instruments that help programs meet goals
• Provides information and tools to measure how well children are meeting the early childhood standards
Hundreds of early childhood professionals were trained in the use of the Early Childhood Continuous Assessment Guide. It was disseminated to all Early Childhood Regional Training Centers, community and technical colleges with early childhood programs, the eight state-funded public universities for use in their Interdisciplinary Early Childhood Education (IECE) Certification courses, and all Community Early Childhood Councils. Kentucky Early Childhood Quality Self-Study
The final document of the Building a Strong Foundation for School Success series, the research-based Kentucky Early Childhood Quality Self-Study, was released June 2005. It helps program personnel identify adult behaviors, environmental characteristics, program structural factors, and personnel considerations that contribute to high-quality learning environments for all children birth to five years of age. Transition, diversity, guidance, training, and children with special needs are topics embedded throughout the Quality Self-Study.
Another crucial component to Kentucky’s comprehensive effort to improve outcomes for preschool children and their families is the Kentucky General Supervision Enhancement Grant (GSEG) Project. GSEG early childhood activities helps programs design or refine their current assessment system to ensure the system:
1. Is comprehensive and addresses all levels of a continuous assessment system (i.e., screening, diagnostic, classroom/instructional, and program evaluation)
2. Is viable for children with and without disabilities
3. Provides data on the extent to which children are meeting the state standards.
GSEG staff will analyze data collected in this project and will use it to assist First Steps, KDE, Division of Child Care, and other stakeholders in providing a continuous assessment system that measures the extent to which young children with disabilities are being included in the assessment
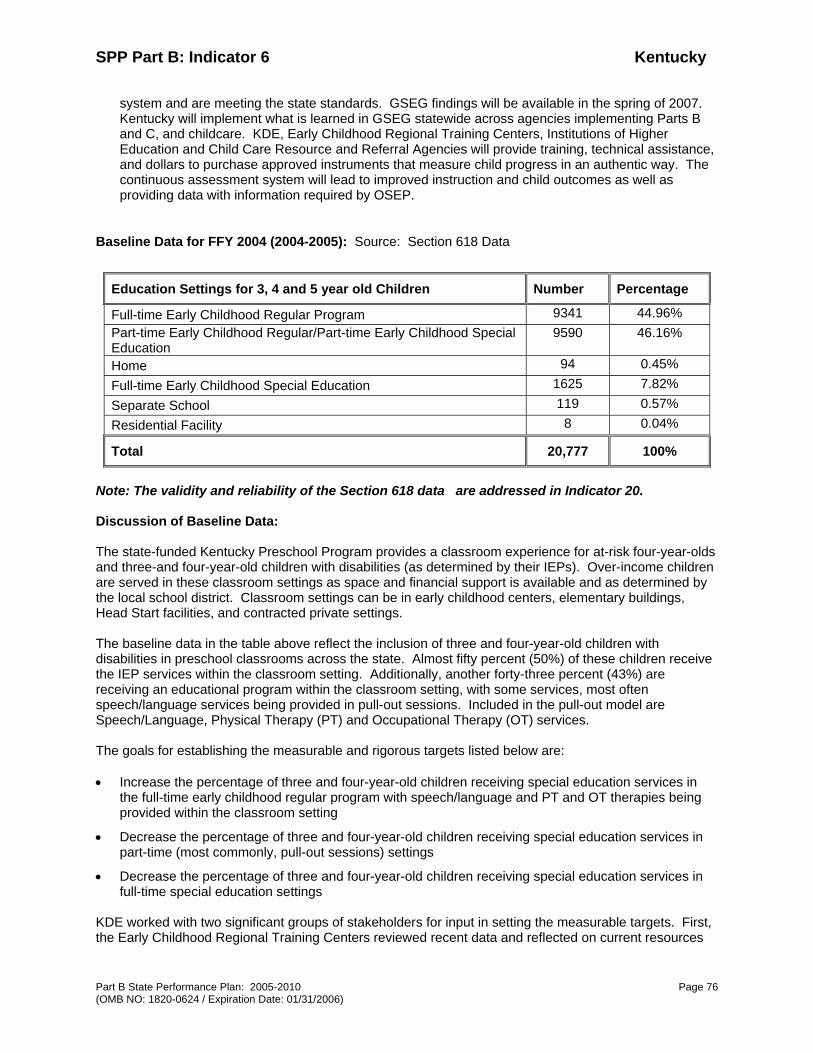
SPP Part B: Indicator 6 Kentucky
Part B State Performance Plan: 2005-2010 Page 76 (OMB NO: 1820-0624 / Expiration Date: 01/31/2006)
system and are meeting the state standards. GSEG findings will be available in the spring of 2007. Kentucky will implement what is learned in GSEG statewide across agencies implementing Parts B and C, and childcare. KDE, Early Childhood Regional Training Centers, Institutions of Higher Education and Child Care Resource and Referral Agencies will provide training, technical assistance, and dollars to purchase approved instruments that measure child progress in an authentic way. The continuous assessment system will lead to improved instruction and child outcomes as well as providing data with information required by OSEP.
Baseline Data for FFY 2004 (2004-2005): Source: Section 618 Data
Education Settings for 3, 4 and 5 year old Children Number Percentage
Full-time Early Childhood Regular Program 9341 44.96% Part-time Early Childhood Regular/Part-time Early Childhood Special Education
9590 46.16%
Home 94 0.45% Full-time Early Childhood Special Education 1625 7.82% Separate School 119 0.57% Residential Facility 8 0.04%
Total 20,777 100%
Note: The validity and reliability of the Section 618 data are addressed in Indicator 20. Discussion of Baseline Data: The state-funded Kentucky Preschool Program provides a classroom experience for at-risk four-year-olds and three-and four-year-old children with disabilities (as determined by their IEPs). Over-income children are served in these classroom settings as space and financial support is available and as determined by the local school district. Classroom settings can be in early childhood centers, elementary buildings, Head Start facilities, and contracted private settings. The baseline data in the table above reflect the inclusion of three and four-year-old children with disabilities in preschool classrooms across the state. Almost fifty percent (50%) of these children receive the IEP services within the classroom setting. Additionally, another forty-three percent (43%) are receiving an educational program within the classroom setting, with some services, most often speech/language services being provided in pull-out sessions. Included in the pull-out model are Speech/Language, Physical Therapy (PT) and Occupational Therapy (OT) services. The goals for establishing the measurable and rigorous targets listed below are: • Increase the percentage of three and four-year-old children receiving special education services in
the full-time early childhood regular program with speech/language and PT and OT therapies being provided within the classroom setting
• Decrease the percentage of three and four-year-old children receiving special education services in part-time (most commonly, pull-out sessions) settings
• Decrease the percentage of three and four-year-old children receiving special education services in full-time special education settings
KDE worked with two significant groups of stakeholders for input in setting the measurable targets. First, the Early Childhood Regional Training Centers reviewed recent data and reflected on current resources

SPP Part B: Indicator 6 Kentucky
Part B State Performance Plan: 2005-2010 Page 77 (OMB NO: 1820-0624 / Expiration Date: 01/31/2006)
and capacity to implement the changes. Then, all Preschool Coordinators were emailed the draft response to Indicator 6 and asked if the proposed targets were obtainable, reasonable, and realistic.
FFY Measurable and Rigorous Target
2005 (2005-2006)
Increase Full-time Early Childhood Regular Program participation to 48.67%.
Decrease Part-time Early Childhood Regular/Part-time Early Childhood Special Education participation to 42.5%.
Decrease Full-time Early Childhood Special Education participation to 7.83%.
2006 (2006-2007)
Increase Full-time Early Childhood Regular Program participation to 49.34%.
Decrease Part-time Early Childhood Regular/Part-time Early Childhood Special Education participation to 42%.
Decrease Full-time Early Childhood Special Education participation to 7.66 %.
2007 (2007-2008)
Increase Full-time Early Childhood Regular Program participation to 50.01%.
Decrease Part-time Early Childhood Regular/Part-time Early Childhood Special Education participation to 41.5%.
Decrease Full-time Early Childhood Special Education participation to 7.52%.
2008 (2008-2009)
Increase Full-time Early Childhood Regular Program participation to 50.68%.
Decrease Part-time Early Childhood Regular/Part-time Early Childhood Special Education participation to 41%.
Decrease Full-time Early Childhood Special Education participation to 7.35%.
2009 (2009-2010)
Increase Full-time Early Childhood Regular Program participation to 51.35%.
Decrease Part-time Early Childhood Regular/Part-time Early Childhood Special Education participation to 40.5%.
Decrease Full-time Early Childhood Special Education participation to 7.18%.
2010 (2010-2011)
Increase Full-time Early Childhood Regular Program participation to 52%.
Decrease Part-time Early Childhood Regular/Part-time Early Childhood Special Education participation to 40%.
Decrease Full-time Early Childhood Special Education participation to 7%.
Improvement Activities/Timelines/Resources:
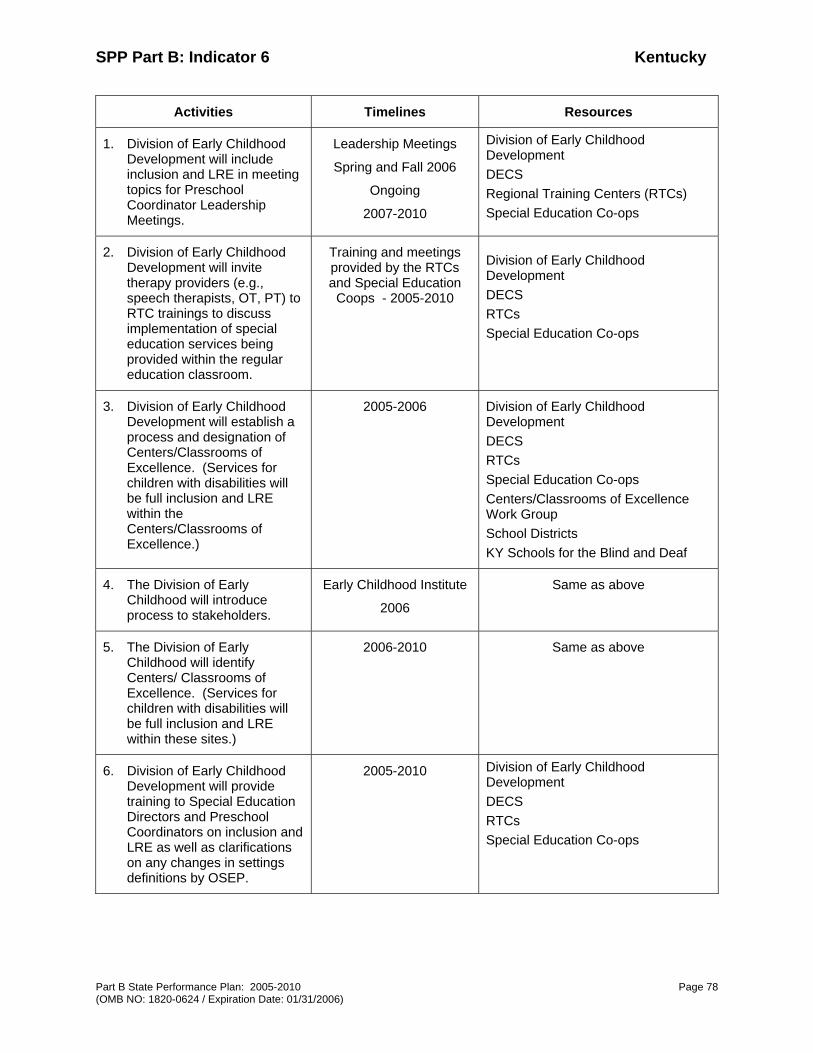
SPP Part B: Indicator 6 Kentucky
Part B State Performance Plan: 2005-2010 Page 78 (OMB NO: 1820-0624 / Expiration Date: 01/31/2006)
Activities Timelines Resources
1. Division of Early Childhood Development will include inclusion and LRE in meeting topics for Preschool Coordinator Leadership Meetings.
Leadership Meetings
Spring and Fall 2006
Ongoing
2007-2010
Division of Early Childhood Development DECS Regional Training Centers (RTCs) Special Education Co-ops
2. Division of Early Childhood Development will invite therapy providers (e.g., speech therapists, OT, PT) to RTC trainings to discuss implementation of special education services being provided within the regular education classroom.
Training and meetings provided by the RTCs and Special Education
Coops - 2005-2010
Division of Early Childhood Development DECS RTCs Special Education Co-ops
3. Division of Early Childhood Development will establish a process and designation of Centers/Classrooms of Excellence. (Services for children with disabilities will be full inclusion and LRE within the Centers/Classrooms of Excellence.)
2005-2006 Division of Early Childhood Development DECS RTCs Special Education Co-ops Centers/Classrooms of Excellence Work Group School Districts KY Schools for the Blind and Deaf
4. The Division of Early Childhood will introduce process to stakeholders.
Early Childhood Institute
2006
Same as above
5. The Division of Early Childhood will identify Centers/ Classrooms of Excellence. (Services for children with disabilities will be full inclusion and LRE within these sites.)
2006-2010 Same as above
6. Division of Early Childhood Development will provide training to Special Education Directors and Preschool Coordinators on inclusion and LRE as well as clarifications on any changes in settings definitions by OSEP.
2005-2010 Division of Early Childhood Development DECS RTCs Special Education Co-ops

SPP Part B: Indicator 6 Kentucky
Part B State Performance Plan: 2005-2010 Page 79 (OMB NO: 1820-0624 / Expiration Date: 01/31/2006)
Activities Timelines Resources
7. Division of Early Childhood Development will contact Institutions of Higher Education (IHEs) with occupational therapy (OT), physical therapy (PT), and other special education therapy programs to encourage them to offer coursework, on an elective basis, in integration of children with low-incidence disabilities in regular education settings.
2005-2010 Division of Early Childhood Development
IHEs
DECS
RTCs
Special Education Co-ops
KY Schools for the Blind and Deaf
8. Division of Early Childhood Development will provide specific training sessions at the annual Infant and Toddler Institute on integration of special services to young children in the classroom.
Fall
2006- 2010
Division of Early Childhood Development
DECS
RTCs
Special Education Co-ops
First Steps
Division of Child Care
9. Division of Early Childhood Development will provide training and technical assistance to districts with high rates of preschoolers identified with disabilities to address appropriate child find procedures.
Winter-Spring
2007-2010
Division of Early Childhood Development
DECS
RTCs
Special Education Co-ops
SPP Part B: Indicator 7 Kentucky
Part B State Performance Plan: 2005-2010 Page (OMB NO: 1820-0624 / Expiration Date: )
80
Part B State Performance Plan (SPP) for 2005-2010
Overview of the State Performance Plan Development: See Introduction Monitoring Priority: FAPE in the LRE
Indicator 7: Percent of preschool children with IEPs who demonstrate improved:
A. Positive social-emotional skills (including social relationships); B. Acquisition and use of knowledge and skills (including early language/ communication and early
literacy); and C. Use of appropriate behaviors to meet their needs.
(20 U.S.C. 1416 (a)(3)(A))
Measurement:
A. Positive social-emotional skills (including social relationships):
a. Percent of preschool children who reach or maintain functioning at a level comparable to same-aged peers = # of preschool children who reach or maintain functioning at a level comparable to same-aged peers divided by # of preschool children with IEPs assessed times 100.
b. Percent of preschool children who improve functioning = # of preschool children who improved functioning divided by # of preschool children with IEPs assessed times 100.
c. Percent of preschool children who did not improve functioning = # of preschool children who did not improve functioning divided by # of preschool children with IEPs assessed times 100.
If children meet the criteria for a, report them in a. Do not include children reported in a in b or c. If a + b + c does not sum to 100%, explain the difference.
B. Acquisition and use of knowledge and skills (including early language/ communication and early literacy)
a. Percent of preschool children who reach or maintain functioning at a level comparable to same-aged peers = # of preschool children who reach or maintain functioning at a level comparable to same-aged peers divided by # of preschool children with IEPs assessed times 100.
b. Percent of preschool children who improved functioning = # of preschool children who improved functioning divided by # of preschool children with IEPs assessed times 100.
c. Percent of preschool children who did not improve functioning = # of preschool children who did not improve functioning divided by # of preschool children with IEPs assessed times 100.
If children meet the criteria for a, report them in a. Do not include children reported in a in b or c. If a + b + c does not sum to 100%, explain the difference.
C. Use of appropriate behaviors to meet their needs:
a. Percent of preschool children who reach or maintain functioning at a level comparable to same-aged peers = # of preschool children who reach or maintain functioning at a level comparable to same-aged peers divided by # of preschool children with IEPs assessed times 100.

SPP Part B: Indicator 7 Kentucky
Part B State Performance Plan: 2005-2010 Page 81 (OMB NO: 1820-0624 / Expiration Date: 01/31/2006)
b. Percent of preschool children who improved functioning = # of preschool children who improved functioning divided by # of preschool children with IEPs assessed times 100.
c. Percent of preschool children who did not improve functioning = # of preschool children who
did not improve functioning divided by # of preschool children with IEPs assessed times 100.
If children meet the criteria for a, report them in a. Do not include children reported in a in b or c. If a + b + c does not sum to 100%, explain the difference.
Overview of Issue/Description of System or Process
Kentucky has chosen to develop a statewide continuous assessment system that is applicable to any program serving young children. Data from the assessment system will be collected through an online system currently housed at the University of Kentucky. KDE is implementing this system for all three and four year old children served by local school districts. The assessment system is designed to provide instructional guidance to teachers as well as provide data for OSEP performance reporting.
The outcome measurement system for Kentucky includes:
1. Policies and procedures to guide outcome assessment and measurement practices.
2. Provision of training and technical assistance supports to administrators and service providers in outcome data collection, reporting, and use of Kentucky’s five Early Childhood Regional Training Centers (RTCs) to provide training to providers, administrators, and families.
3. Quality assurance and monitoring procedures to ensure the accuracy of the outcome data.
4. Data system elements for outcome data input and maintenance, and outcome data analysis functions.
A description of each outcome measurement follows. 1. Policies and procedures to guide outcome assessment and measurement practices
Kentucky provides guidance for all early childhood programs in assessment through its Kentucky Early Childhood Continuous Assessment Guide described in detail in Indicator 6. The Guide lists recommended assessment tools for screening, diagnosis and classroom/instructional strategies. Initially, the use of the recommended assessment instruments was voluntary; however, at the end of the 2005-2006 school year, districts were required to select an outcome measurement assessment tool and are beginning to administer curriculum-based assessments as training is received.
Six of the recommended assessment instruments have data management systems and linkage to the Kentucky Early Childhood Standards available on-line. An asterisk in the chart of recommended assessments notes these.
Kentucky Recommended Preschool Assessments
*Assessment Evaluation Programming System (AEPS)
The Carolina Curriculum for Preschoolers with Special Needs (CCPSN)
* Brigance Inventory of Early Development
Transdisciplinary Play Based Assessment (TPBA)
* The Creative Curriculum
* The Ounce Scale
SPP Part B: Indicator 7 Kentucky
Part B State Performance Plan: 2005-2010 Page 82 (OMB NO: 1820-0624 / Expiration Date: 01/31/2006)
Early Learning Accomplishment Profile (E-LAP)
The Carolina Curriculum for Infants & Toddlers with Special Needs (CCITSN)
* High Scope Child Observation Record (COR)
The Work Sampling System (WSS)
* Learning Accomplishment Profile 3 (LAP-3)
Hawaii Early Learning Profile (HELP)
These approved classroom/instructional assessment tools are aligned with the Kentucky Early Childhood Standards and the OSEP Early Childhood Outcomes and are included in the Kentucky Early Childhood Continuous Assessment Guide. KDE will revise the Guide with an addendum detailing alignment to OSEP Early Childhood Outcomes and will post the revised document to its website as well as disseminate through trainings. Policies are in place to measure progress through data from evaluations and reevaluations. They require:
• Conducting a full and individualized evaluation of a child's needs before placement of a student
with a disability in a special education program.
• Using multiple sources of data rather than a single test score to determine eligibility.
• Using a variety of evaluation procedures that may include, but are not limited to, observations, interviews, behavior checklists, structured interactions, play assessment, adaptive and developmental scales, criterion-referenced and norm-referenced instruments, clinical judgment, and tests of basic concepts or other techniques and procedures as deemed appropriate by the professional(s) conducting the evaluations.
• Conducting observations in the child’s natural environment (i.e., the setting within the community where preschool children without disabilities usually are found such home, child care, State-Funded Preschool, Head Start).
• Documenting areas of strength as well as areas of concern.
• Having one or more qualified professionals (teacher, social worker, program coordinator, or other involved professionals) conduct observations.
2. Provision of training and technical assistance supports to administrators and service providers in outcome data collection, reporting, and use of Kentucky’s five RTCs to provide training to providers, administrators, and families in:
• Using curriculum-based assessments and outcome measurements.
• Reporting data.
• Interpreting and using data for program improvement.
KDE, RTCs, the University of Kentucky Training Into Practice Project (K-TIPP), General Supervision Enhancement Grant (GSEG) staff and consultants will continue to provide training on related existing modules and develop additional modules as needs are identified. As needed, publishers of approved assessment tools will provide targeted assessment training. As follow-up to these regional trainings, on-site visits to support districts in phasing in the outcome measurement will occur each year. The phase-in process will use the state’s fifteen Area Development Districts (ADD) to identify participating districts. According to the plan, the number of districts participating in the assessment system increases until all districts are participating. This phase-in plan was approved by OSEP after verification that the phase-in was representative of the state. Jefferson County, the state’s largest district, will begin participation in Phase 1. All districts are required to report assessment data on all children by 2010.

SPP Part B: Indicator 7 Kentucky
Part B State Performance Plan: 2005-2010 Page 83 (OMB NO: 1820-0624 / Expiration Date: 01/31/2006)
3. Quality assurance and monitoring procedures to ensure the accuracy and completeness of the outcome data
As the use of outcomes-based assessment tools is phased in, KDE will monitor the accuracy and completeness of data by requiring districts to include supporting evidence-based on classroom/instructional assessment in all IEP records. When IEPs are selected for records review, KDE will require that a review of information used for the outcome ratings will be included in the protocol.
4. Data system elements for outcome data input and maintenance, and outcome data analysis functions
At the state level, Kentucky can aggregate child assessment data from the classroom to the school to the district level. This capability allows use of the early childhood developmental domains/content area standards and OSEP early childhood outcomes to evaluate child progress. As part of our GSEG early childhood objectives, staff is working with publishers of three approved classroom/instructional instruments to link assessment tools to the Kentucky Early Childhood Standards and to measure outcomes.
Baseline Data for FFY 2004 (2004-2005): This is a new indicator. Baseline data will be reported in the 2008 APR. Below is a discussion of the implementation of the preschool assessment system and status of the data collection. Development of Assessment System Key stakeholders (i.e., First Steps (Part C), Early Childhood RTCs, preschool coordinators, teachers, institutions of higher education, the KDE Divisions of Early Childhood Development and Exceptional Children Services, and the Division of Child Care in the Cabinet for Health and Family Services) provided input in the development of this continuous assessment plan. Population Included in Measurement All children enrolled in the state-funded Kentucky Preschool Program will participate in the assessment system. Administration of Assessments Teachers, teacher assistants, parents, and auxiliary staff (Speech/OT/PT etc.) will observe children in their natural environments and record data about specific children. Teachers and, in some cases, teacher assistants, will collect data from multiple sources and request data from parents and auxiliary staff to get a comprehensive picture of the child’s knowledge and skills. They will enter the observation data into the Kentucky Early Childhood Data System (KEDS) platform. To ensure continuous assessment, they must, at minimum, enter data weekly. The KEDS platform will link the items on the approved instrument with the Kentucky Early Childhood Standards to inform and improve instruction over the school year. Data Collection
KDE will provide districts with two data points at which child data will be downloaded and analyzed for child progress in the three OSEP Early Childhood Outcomes. The KEDS data platform will give each child a rating and aggregate that data by program, district, school, and by state.

SPP Part B: Indicator 7 Kentucky
Part B State Performance Plan: 2005-2010 Page 84 (OMB NO: 1820-0624 / Expiration Date: 01/31/2006)
Data Analysis The outcome data from the first data point will be matched to exit outcome ratings for individual children. At the state level, analysis of matched scores and alignment with the Kentucky Early Childhood Standards and the OSEP Outcomes will yield data for each of the three outcomes:
a. Percent of preschool children who reach or maintain functioning at a level comparable to same-aged
peers (categorized as a)
b. Percent of preschool children who improved functioning
These are children with higher ratings at exit or who do not have increased rating scores but whom the team decides have made progress based on available data (categorized as b).
c. Percent of preschool children who did not improve functioning
These are children who do not have increased rating scores and who the team decides have not made progress based on available data (categorized as c). In addition, the state will analyze by district and state the mean and distribution of the entry status of children, exit status, and percentages of children who increased ratings from entry to exit (moved nearer to typical development). Data Reporting KDE will disaggregate data on those children with IEPs who are younger than 54 months of age when the first IEP is completed and who receive services for at least 6 months before kindergarten entry. This disaggregated data will be reported to OSEP under Indicator 7 of the Annual Performance Report.
At the state and district levels, all districts report data in the Kentucky Continuous Monitoring Process (KCMP) (Cluster Area FAPE in the LRE: Preschool Improvement, Probe 6.1) as part of the monitoring self-assessment process. Districts report on at least ten percent (10%) of the children with a disability (not less than 10 nor more than 50 children) in the KCMP. Children in all categories are included in the 10%. Additionally, when KDE monitors a district, it must send KDE a roster of children in each category of disability. KDE then chooses a representative sample of 10% of the participating children to verify self-monitoring findings reported by the district. Beginning in 2007-08, scores will be reported according to the percent of children who:
a. Did not improve functioning
b. Improved functioning but not sufficient to move nearer to functioning comparable to same–aged peers
c. Improved functioning to a level nearer to same-aged peers but did not reach it. [improved developmental trajectory]
d. Improved functioning to reach a level comparable to same-aged peers [gap closers]
e. Maintained functioning at a level comparable to same-aged peers
The chart on the following page summarizes Kentucky’s outcome assessment plan.
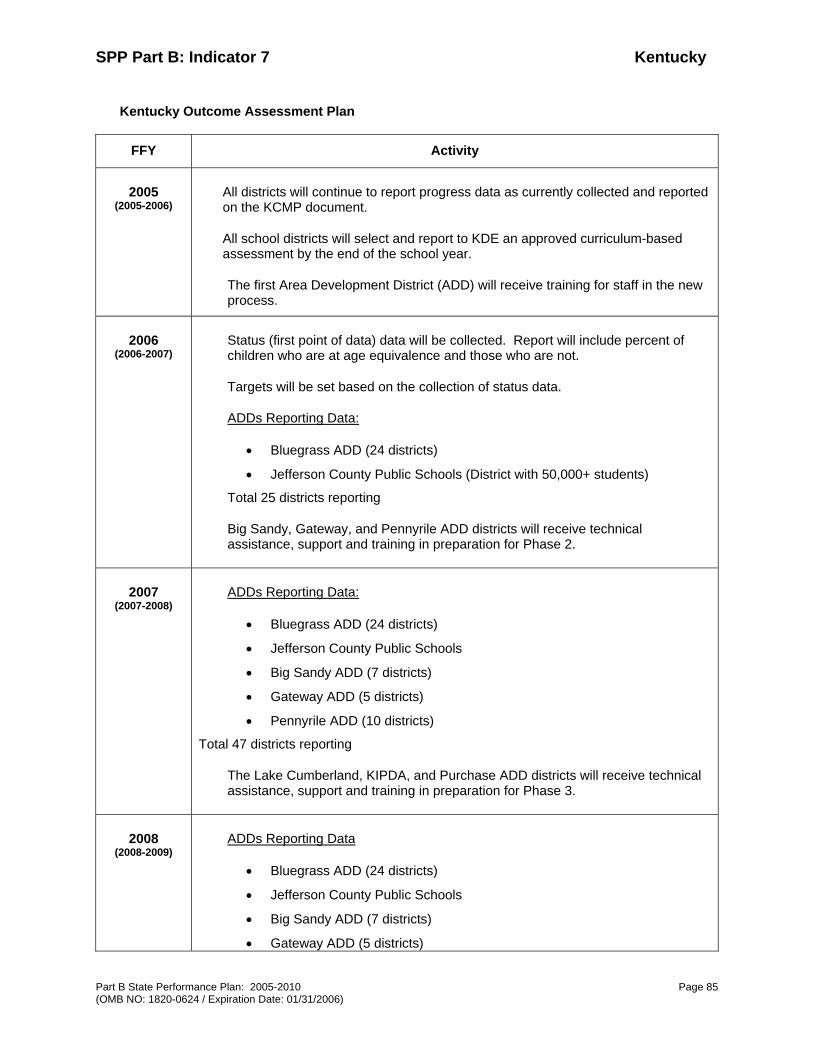
SPP Part B: Indicator 7 Kentucky
Part B State Performance Plan: 2005-2010 Page 85 (OMB NO: 1820-0624 / Expiration Date: 01/31/2006)
Kentucky Outcome Assessment Plan
FFY Activity
2005 (2005-2006)
All districts will continue to report progress data as currently collected and reported on the KCMP document.
All school districts will select and report to KDE an approved curriculum-based assessment by the end of the school year.
The first Area Development District (ADD) will receive training for staff in the new process.
2006 (2006-2007)
Status (first point of data) data will be collected. Report will include percent of children who are at age equivalence and those who are not.
Targets will be set based on the collection of status data.
ADDs Reporting Data:
• Bluegrass ADD (24 districts)
• Jefferson County Public Schools (District with 50,000+ students)
Total 25 districts reporting
Big Sandy, Gateway, and Pennyrile ADD districts will receive technical assistance, support and training in preparation for Phase 2.
2007 (2007-2008)
ADDs Reporting Data:
• Bluegrass ADD (24 districts)
• Jefferson County Public Schools
• Big Sandy ADD (7 districts)
• Gateway ADD (5 districts)
• Pennyrile ADD (10 districts)
Total 47 districts reporting
The Lake Cumberland, KIPDA, and Purchase ADD districts will receive technical assistance, support and training in preparation for Phase 3.
2008 (2008-2009)
ADDs Reporting Data
• Bluegrass ADD (24 districts)
• Jefferson County Public Schools
• Big Sandy ADD (7 districts)
• Gateway ADD (5 districts)

SPP Part B: Indicator 7 Kentucky
Part B State Performance Plan: 2005-2010 Page 86 (OMB NO: 1820-0624 / Expiration Date: 01/31/2006)
FFY Activity
• Pennyrile ADD (10 districts)
• Lake Cumberland ADD (14 districts)
• KIPDA ADD (7 districts)
• Purchase ADD (12 districts)
Total 80 districts reporting
Cumberland Valley, Buffalo Trace, Lincoln Trail, and Green River ADD districts will receive technical assistance, support and training in preparation for Phase 4.
2009 (2009-2010)
ADDs Reporting Data
• Bluegrass ADD (24 districts)
• Jefferson County Public Schools
• Big Sandy ADD (7 districts)
• Gateway ADD (5 districts)
• Pennyrile ADD (10 districts)
• Lake Cumberland ADD (14 districts)
• KIPDA ADD (7 districts)
• Purchase ADD (12 districts)
• Cumberland Valley ADD (15 districts)
• Buffalo Trace ADD (6 districts)
• Lincoln Trail ADD (9 districts)
• Green River ADD (12 districts)
Total 122 districts reporting
Kentucky River, Northern Kentucky, Barren River, and FIVCO will receive technical assistance, support and training in preparation for Phase 5.
2010 (2010-2011)
ADDs Reporting Data
• Bluegrass ADD (24 districts)
• Jefferson County Public Schools
• Big Sandy ADD (7 districts)
• Gateway ADD (5 districts)
• Pennyrile ADD (10 districts)
• Lake Cumberland ADD (14 districts)
• KIPDA ADD (7 districts)

SPP Part B: Indicator 7 Kentucky
Part B State Performance Plan: 2005-2010 Page 87 (OMB NO: 1820-0624 / Expiration Date: 01/31/2006)
FFY Activity
• Purchase ADD (12 districts)
• Cumberland Valley ADD (15 districts)
• Buffalo Trace ADD (6 districts)
• Lincoln Trail ADD (9 districts)
• Green River ADD (12 districts)
• Kentucky River ADD (11 districts)
• Northern Kentucky ADD (20 districts)
• Barren River ADD (14 districts)
• FIVCO ADD (9 districts)
Total 176 districts reporting (all districts in Kentucky)
KDE will report on district program performance for all participating ADDs. Targets will be compared and adjusted as needed.

SPP Part B: Indicator 7 Kentucky
Part B State Performance Plan: 2005-2010 88 (OMB NO: 1820-0624 / Expiration Date: 01/31/2006)
Data Collection Activities:
Phase 1 districts submitted data to KEDS on November 30, 2006. This data forms the status data required by OSEP for the APR due in February 2007. See above for descriptions of continuing data collection activities.
Improvement Activities/Timelines/Resources Activities and timelines were described above to implement the assessment data collection for this indicator. Improvement activities will be developed for the 2008 APR after baseline data are collected and targets set.
1 – 2006 – 2007
2 – 2007 – 2008
3 – 2008 – 2009 4 – 2009 – 2010 5 – 2010 – 2011
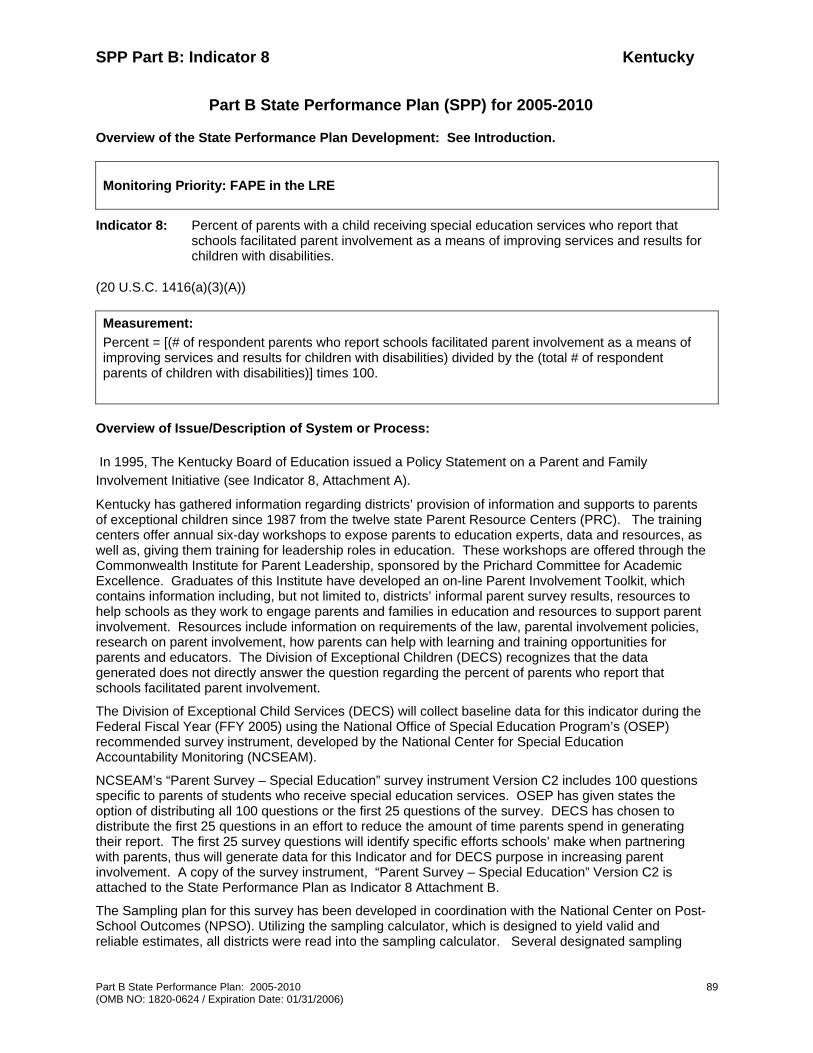
SPP Part B: Indicator 8 Kentucky
Part B State Performance Plan: 2005-2010 89 (OMB NO: 1820-0624 / Expiration Date: 01/31/2006)
Part B State Performance Plan (SPP) for 2005-2010
Overview of the State Performance Plan Development: See Introduction.
Monitoring Priority: FAPE in the LRE
Indicator 8: Percent of parents with a child receiving special education services who report that schools facilitated parent involvement as a means of improving services and results for children with disabilities.
(20 U.S.C. 1416(a)(3)(A))
Measurement: Percent = [(# of respondent parents who report schools facilitated parent involvement as a means of improving services and results for children with disabilities) divided by the (total # of respondent parents of children with disabilities)] times 100.
Overview of Issue/Description of System or Process:
In 1995, The Kentucky Board of Education issued a Policy Statement on a Parent and Family Involvement Initiative (see Indicator 8, Attachment A).
Kentucky has gathered information regarding districts’ provision of information and supports to parents of exceptional children since 1987 from the twelve state Parent Resource Centers (PRC). The training centers offer annual six-day workshops to expose parents to education experts, data and resources, as well as, giving them training for leadership roles in education. These workshops are offered through the Commonwealth Institute for Parent Leadership, sponsored by the Prichard Committee for Academic Excellence. Graduates of this Institute have developed an on-line Parent Involvement Toolkit, which contains information including, but not limited to, districts’ informal parent survey results, resources to help schools as they work to engage parents and families in education and resources to support parent involvement. Resources include information on requirements of the law, parental involvement policies, research on parent involvement, how parents can help with learning and training opportunities for parents and educators. The Division of Exceptional Children (DECS) recognizes that the data generated does not directly answer the question regarding the percent of parents who report that schools facilitated parent involvement.
The Division of Exceptional Child Services (DECS) will collect baseline data for this indicator during the Federal Fiscal Year (FFY 2005) using the National Office of Special Education Program’s (OSEP) recommended survey instrument, developed by the National Center for Special Education Accountability Monitoring (NCSEAM).
NCSEAM’s “Parent Survey – Special Education” survey instrument Version C2 includes 100 questions specific to parents of students who receive special education services. OSEP has given states the option of distributing all 100 questions or the first 25 questions of the survey. DECS has chosen to distribute the first 25 questions in an effort to reduce the amount of time parents spend in generating their report. The first 25 survey questions will identify specific efforts schools’ make when partnering with parents, thus will generate data for this Indicator and for DECS purpose in increasing parent involvement. A copy of the survey instrument, “Parent Survey – Special Education” Version C2 is attached to the State Performance Plan as Indicator 8 Attachment B.
The Sampling plan for this survey has been developed in coordination with the National Center on Post-School Outcomes (NPSO). Utilizing the sampling calculator, which is designed to yield valid and reliable estimates, all districts were read into the sampling calculator. Several designated sampling
SPP Part B: Indicator 8 Kentucky
Part B State Performance Plan: 2005-2010 90 (OMB NO: 1820-0624 / Expiration Date: 01/31/2006)
variables for each district (size of the district, location of the district, etc.) were included. The calculator then selected districts for the yearly sample in such a way as to be representative of the state at a specified level of confidence (e.g., + or – 3%). Every district will be sampled at least once every six years and will annually include Kentucky’s districts with the largest average daily attendance (ADA). As part of our focused monitoring process, some districts may be sampled more often, should monitoring results warrant. A copy of Kentucky’s Representative Sample is attached to this State Performance Plan as Indicator 14 Attachment B. (See Indicator 14)
DECS will coordinate with the Human Development Institute (HDI) and the University of Kentucky to determine correlation of data from Indicator 14 and this Indicator in order to identify the impact of parent involvement on graduation rates, as well as impact on other State Performance Plan (SPP) Indicators.
For this indicator, it was necessary to further develop the sampling plan to ensure participation of parents with children with disabilities across all age and grade levels are surveyed. The student database created includes students with disabilities ages 3-21 and the following:
a. school name and code
b. system name and code
c. student grade
d. student area of eligibility
e. student demographic data
f. parent/guardian name
NCSEAM utilizes Rash data analysis to determine reliability and validity of the date gathering method.
DECS has developed a timeline to demonstrate their efforts to collect the data and develop measurable and rigorous targets. Additionally, to collect baseline data the survey cover letter will ask the parents to reflect on the 2005-2006 school year as they are completing the survey. For FFY 2005 the survey will be issued prior to May 2007 to gather input from parents. This will initiate an annual cycle to gather comparison data to determine progress on this indicator.
Stakeholder input has been obtained by The State Advisory Panel for Exceptional Children (SAPEC) and will be solicited throughout the survey process. A subgroup of the state advisory panel is in place and will review survey data once it is received by DECS, identify measurable and rigorous targets, and plan improvement activities.
Discussion of Baseline Data:
In the initial attempt to obtain the services of a contractor to collect statewide parent survey data, the routine procedure was not followed. This resulted in delays in finalizing the contract. The following table indicates the timelines, resources, and activities to be completed in order to generate the baseline data. Once generated, DECS will submit the baseline data indicating the percent of parents with a child receiving special education services who report that schools facilitated parent involvement as a means of improving services and results for children with disabilities to OSEP. The baseline data will then be given to the stakeholder group for their immediate consideration and to identify of measurable and rigorous targets.

SPP Part B: Indicator 8 Kentucky
Part B State Performance Plan: 2005-2010 91 (OMB NO: 1820-0624 / Expiration Date: 01/31/2006)
System Development – Activities/Timelines/Resources
Activities Timelines Resources
1. Synthesize current research on facilitating parent involvement and disseminate statewide via web postings and electronic communications to parent groups, directors of special education and other constituency groups.
2007 and on-going DECS
2. Develop and pilot a web-based survey in districts that have a Parent Resource Center to inform how to increase parent responses, data reliability and validity.
2007 KDE, DECS
3. Pinpoint districts that have low survey response rates and high numbers of unfavorable survey results and provide targeted technical assistance for improving parent involvement.
2007 and on-going KDE, DECS
PRCs
Kentucky Partnership for Families and Children (KPFC)
KY-SPIN
UPinKY
Special Education Co-ops Family Resource and Youth Service Centers
4. Partner with stakeholders to determine correlations across indicators 9, 10 and 14, to define trends, make predictions and uncover root causes, to inform the design and implementation of technical assistance activities.
2008 and on-going KDE, DECS Special Education Cooperatives PRC KY-SPIN
5. Provide networking opportunities for school district staff and parents through coordination of statewide agencies and technical assistance service providers at parent and professional conferences, and via web-postings.
2008 and on-going
KDE, DECS
PRC
KPFC
KYSPIN
Kentucky Council for Exceptional Children (KCEC)
UPinKY
Special Education Co-ops
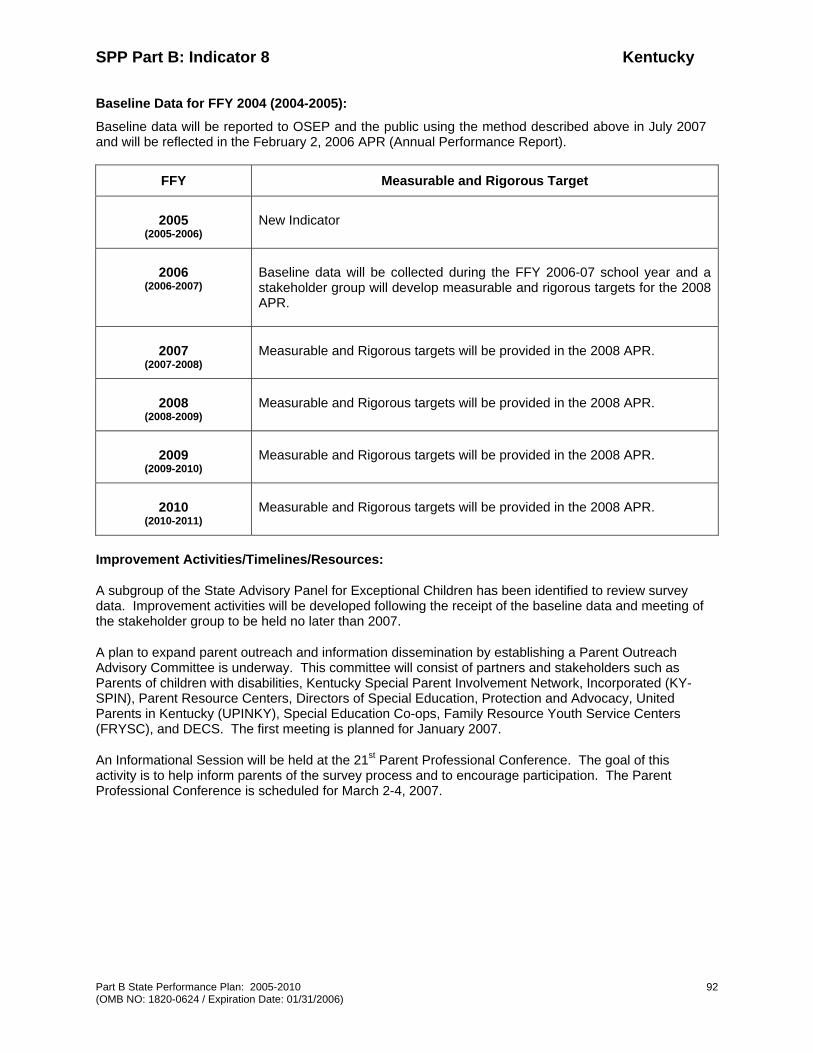
SPP Part B: Indicator 8 Kentucky
Part B State Performance Plan: 2005-2010 92 (OMB NO: 1820-0624 / Expiration Date: 01/31/2006)
Baseline Data for FFY 2004 (2004-2005):
Baseline data will be reported to OSEP and the public using the method described above in July 2007 and will be reflected in the February 2, 2006 APR (Annual Performance Report).
FFY Measurable and Rigorous Target
2005 (2005-2006)
New Indicator
2006 (2006-2007)
Baseline data will be collected during the FFY 2006-07 school year and a stakeholder group will develop measurable and rigorous targets for the 2008 APR.
2007 (2007-2008)
Measurable and Rigorous targets will be provided in the 2008 APR.
2008 (2008-2009)
Measurable and Rigorous targets will be provided in the 2008 APR.
2009 (2009-2010)
Measurable and Rigorous targets will be provided in the 2008 APR.
2010 (2010-2011)
Measurable and Rigorous targets will be provided in the 2008 APR.
Improvement Activities/Timelines/Resources:
A subgroup of the State Advisory Panel for Exceptional Children has been identified to review survey data. Improvement activities will be developed following the receipt of the baseline data and meeting of the stakeholder group to be held no later than 2007.
A plan to expand parent outreach and information dissemination by establishing a Parent Outreach Advisory Committee is underway. This committee will consist of partners and stakeholders such as Parents of children with disabilities, Kentucky Special Parent Involvement Network, Incorporated (KY-SPIN), Parent Resource Centers, Directors of Special Education, Protection and Advocacy, United Parents in Kentucky (UPINKY), Special Education Co-ops, Family Resource Youth Service Centers (FRYSC), and DECS. The first meeting is planned for January 2007.
An Informational Session will be held at the 21st Parent Professional Conference. The goal of this activity is to help inform parents of the survey process and to encourage participation. The Parent Professional Conference is scheduled for March 2-4, 2007.
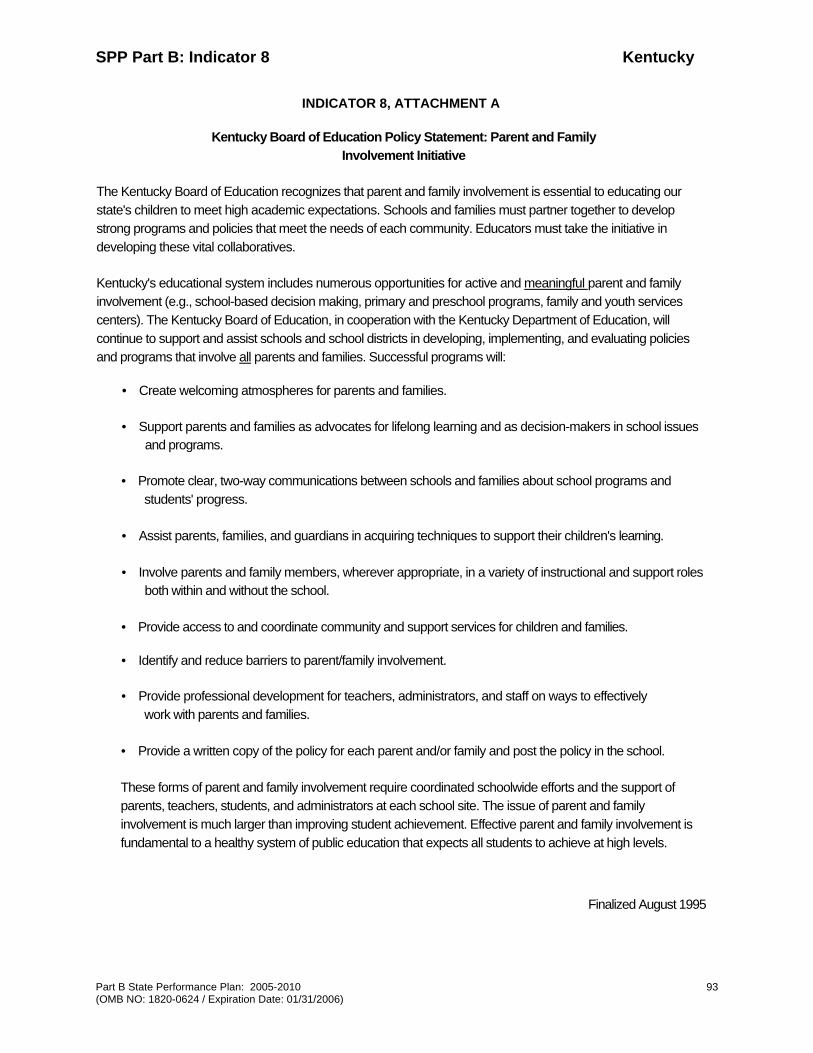
SPP Part B: Indicator 8 Kentucky
Part B State Performance Plan: 2005-2010 93 (OMB NO: 1820-0624 / Expiration Date: 01/31/2006)
INDICATOR 8, ATTACHMENT A
Kentucky Board of Education Policy Statement: Parent and Family Involvement Initiative
The Kentucky Board of Education recognizes that parent and family involvement is essential to educating our state's children to meet high academic expectations. Schools and families must partner together to develop strong programs and policies that meet the needs of each community. Educators must take the initiative in developing these vital collaboratives.
Kentucky's educational system includes numerous opportunities for active and meaningful parent and family involvement (e.g., school-based decision making, primary and preschool programs, family and youth services centers). The Kentucky Board of Education, in cooperation with the Kentucky Department of Education, will continue to support and assist schools and school districts in developing, implementing, and evaluating policies and programs that involve all parents and families. Successful programs will:
• Create welcoming atmospheres for parents and families.
• Support parents and families as advocates for lifelong learning and as decision-makers in school issues and programs.
• Promote clear, two-way communications between schools and families about school programs and students' progress.
• Assist parents, families, and guardians in acquiring techniques to support their children's learning.
• Involve parents and family members, wherever appropriate, in a variety of instructional and support roles both within and without the school.
• Provide access to and coordinate community and support services for children and families.
• Identify and reduce barriers to parent/family involvement.
• Provide professional development for teachers, administrators, and staff on ways to effectively work with parents and families.
• Provide a written copy of the policy for each parent and/or family and post the policy in the school.
These forms of parent and family involvement require coordinated schoolwide efforts and the support of parents, teachers, students, and administrators at each school site. The issue of parent and family involvement is much larger than improving student achievement. Effective parent and family involvement is fundamental to a healthy system of public education that expects all students to achieve at high levels.
Finalized August 1995

SPP Part B: Indicator 8 Kentucky
Part B State Performance Plan: 2005-2010 94 (OMB NO: 1820-0624 / Expiration Date: 01/31/2006)
Indicator 8 Attachment B
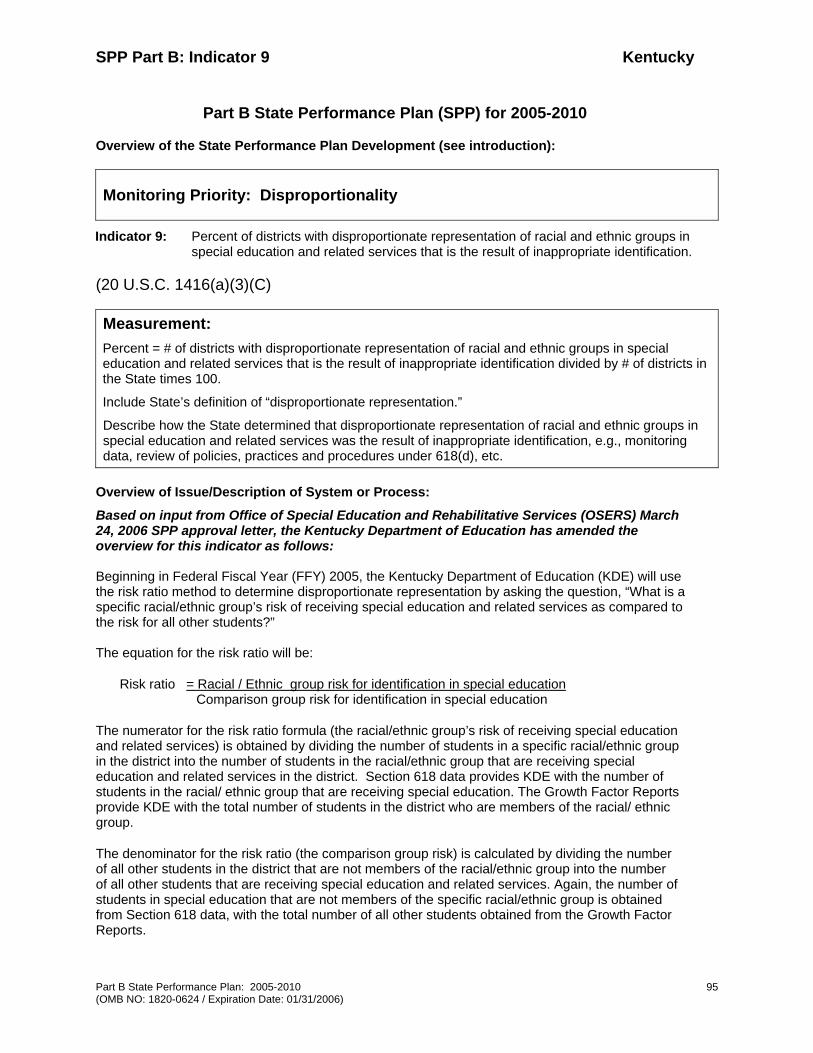
SPP Part B: Indicator 9 Kentucky
Part B State Performance Plan: 2005-2010 95 (OMB NO: 1820-0624 / Expiration Date: 01/31/2006)
Part B State Performance Plan (SPP) for 2005-2010
Overview of the State Performance Plan Development (see introduction):
Monitoring Priority: Disproportionality
Indicator 9: Percent of districts with disproportionate representation of racial and ethnic groups in special education and related services that is the result of inappropriate identification.
(20 U.S.C. 1416(a)(3)(C)
Measurement: Percent = # of districts with disproportionate representation of racial and ethnic groups in special education and related services that is the result of inappropriate identification divided by # of districts in the State times 100.
Include State’s definition of “disproportionate representation.”
Describe how the State determined that disproportionate representation of racial and ethnic groups in special education and related services was the result of inappropriate identification, e.g., monitoring data, review of policies, practices and procedures under 618(d), etc.
Overview of Issue/Description of System or Process:
Based on input from Office of Special Education and Rehabilitative Services (OSERS) March 24, 2006 SPP approval letter, the Kentucky Department of Education has amended the overview for this indicator as follows: Beginning in Federal Fiscal Year (FFY) 2005, the Kentucky Department of Education (KDE) will use the risk ratio method to determine disproportionate representation by asking the question, “What is a specific racial/ethnic group’s risk of receiving special education and related services as compared to the risk for all other students?” The equation for the risk ratio will be:
Risk ratio = Racial / Ethnic group risk for identification in special education Comparison group risk for identification in special education
The numerator for the risk ratio formula (the racial/ethnic group’s risk of receiving special education and related services) is obtained by dividing the number of students in a specific racial/ethnic group in the district into the number of students in the racial/ethnic group that are receiving special education and related services in the district. Section 618 data provides KDE with the number of students in the racial/ ethnic group that are receiving special education. The Growth Factor Reports provide KDE with the total number of students in the district who are members of the racial/ ethnic group.
The denominator for the risk ratio (the comparison group risk) is calculated by dividing the number of all other students in the district that are not members of the racial/ethnic group into the number of all other students that are receiving special education and related services. Again, the number of students in special education that are not members of the specific racial/ethnic group is obtained from Section 618 data, with the total number of all other students obtained from the Growth Factor Reports.
SPP Part B: Indicator 9 Kentucky
Part B State Performance Plan: 2005-2010 96 (OMB NO: 1820-0624 / Expiration Date: 01/31/2006)
To calculate the risk ratio, the comparison group’s risk of receiving special education and related services is divided into the specific racial/ ethnic group’s risk of receiving special education and related services. KDE has determined that if the specific racial/ethnic group members are 2.0 or more times likely to receive special education and related services than all other students, there is disproportionate representation. In addition, although Kentucky has established a risk ratio of 2.0, the Division of Exceptional Children Services (DECS) is requiring that districts, as a preventative measure, analyze their data for internal use if they attain a risk ratio within the 1.5 through 1.9 range.
Determining disproportionate representation through risk ratio is step one of the inquiry. The final step of the process is to determine whether the disproportionate representation of 2.0 or higher is due to inappropriate identification by the district.
DECS has established a process utilizing the Kentucky Continuous Monitoring Process (KCMP) to determine whether the disproportionate representation in special education in each district is due to inappropriate identification. DECS will provide data to districts that will indicate the risk ratio for receiving special education services for students who are African-American and students who are Hispanic. (Note: Since Kentucky has no other racial/ethnic groups of significant size, the data analysis is currently limited to these two groups.)
If the data provided to the district indicates a risk ratio of 1.5 or higher, the district will be required to analyze its data to determine if inappropriate identification is the reason for the increased risk. Requesting the district analysis when the data show a risk ratio of 1.5 and higher is a preventative step, since KDE will not formally identify the district as having disproportionate representation unless it reaches a risk ratio of 2.0 or higher. Since districts with risk ratios of 1.5 through 1.9 are analyzing their data as a preventive measure, DECS will take no further action toward districts with risk ratios under 2.0
Overall, Kentucky’s public school population is homogenous, with the vast majority of school districts having small numbers of racial/ethnic groups. Because of concerns about reliability of data for small numbers of students, DECS will look at data longitudinally for districts with small numbers of students in specific racial/ethnic groups, as set forth in Section II below. Note: Districts with significant racial/ethnic populations, i.e., more than the ‘n’ size (10 or more students), with a risk ratio of 2.0 and higher will complete the following procedures. Districts with significant racial/ethnic populations that have a risk ratio of 1.5 through 1.9 will also implement the following analysis for internal use and improvement planning.
Section I
1. DECS will provide each district with its risk ratio data through the KCMP data tools. If the district’s data indicate that the risk of specific racial/ethnic groups receiving special education and related services is 1.5 times or more than the risk for the comparison group, the district must analyze its data in the KCMP self-assessment and explain whether the elevated risk is due to inappropriate identification.
2. The KCMP provides sample questions for districts to use in analyzing whether its risk ratio of 1.5 or more is due to inappropriate identification. Additionally, the National Center for Culturally Responsive Educational Systems (NCCRESt) web site and technical assistance documents for data analysis were furnished to districts during KCMP training provided by the Special Education Co-ops.
3. Districts with a risk-ratio of 1.5 or higher will provide DECS with their KCMP analysis of whether the elevated risk is due to inappropriate identification. The “Explanation of Data” section of the KCMP will be the vehicle for the district analysis. The KCMP also includes a
SPP Part B: Indicator 9 Kentucky
Part B State Performance Plan: 2005-2010 97 (OMB NO: 1820-0624 / Expiration Date: 01/31/2006)
section for Improvement Activities in the event of inappropriate identification. If the district determines there is not inappropriate identification, the district will complete the Maintenance Activities section of the KCMP. Since districts with risk ratios of 1.5 to 1.9 are analyzing their data as a preventive measure, DECS will take no further action toward districts with risk ratios under 2.0
4. Upon receiving the KCMP self-assessment at the end of January, DECS and the Special Education Co-ops will review the explanation for districts with risk ratios of 2.0 and higher, to determine if the district is in compliance with this Indicator. Part of the inquiry will consist of whether there are reasons other than inappropriate identification that have resulted in disproportionate representation. As part of its review, DECS will notify the district to submit its local policies and procedures, evaluation instruments, and materials to DECS.
DECS will review the district’s procedures related to the availability and use of early intervening services including pre-referral interventions, the referral process, the selection and use of evaluation instruments and materials, and the selection and use of evaluation criteria. DECS will examine other data sources, including scholastic audits, inclusion of the district as a Tier 3 district under No Child Left Behind (NCLB), issues related to culture and climate, as well as institutional practices which may have contributed to inappropriate identification in special education. DECS will undertake steps to verify the district’s data, according to the district’s individual circumstances.
5. If the district demonstrates that, based on its individualized circumstances, the disproportionate representation of 2.0 and higher is not the result of inappropriate identification, DECS will take no additional action.
6. Districts with a risk ratio of 2.0 or higher whose data indicate that disproportionate representation for specific racial/ethnic groups in receiving special education and related services is due to inappropriate identification will be given one year to come into compliance from the date of notification of noncompliance. As part of the Corrective Action Plan, DECS will require the district to spend 15% of its Part B funds on comprehensive, coordinated early intervening services for general education students. The 2004 IDEA Reauthorization requires KDE to take this action so students in racial/ethnic groups will not be inappropriately identified and identified in a targeted disability category.
7. Technical assistance will be provided to the district in conjunction with other KDE divisions in addressing the root causes that contribute to the disproportionate representation of minority students in targeted disability categories.
Section II
For districts that do not have significant minority populations, i.e., less than 10 members of the specified racial/ethnic group, the following procedures will be followed:
1. Districts with elevated risk ratios will analyze their data in the same manner as districts with significant minority populations and will include either Improvement Plans or Maintenance Plans as appropriate with their KCMP submissions.
2. Since reliability of the data is a concern, based on the small number of minority students within the district, DECS will look at the data longitudinally (for two consecutive years) to ensure that the elevated risk ratio is due to inappropriate identification.
3. If, after two consecutive years, the data indicate that the district has disproportionate representation of racial/ethnic groups in special education due to inappropriate identification, DECS will cite the district as set forth below:
SPP Part B: Indicator 9 Kentucky
Part B State Performance Plan: 2005-2010 98 (OMB NO: 1820-0624 / Expiration Date: 01/31/2006)
4. Upon DECS’ finding of noncompliance, the district shall be required to develop a Corrective Action Plan (CAP) to remedy the problem within one year from the date of notification. As part of the CAP, DECS will require the district to spend 15% of its Part B funds on comprehensive, coordinated early intervening services for general education students. The 2004 IDEA Reauthorization requires KDE to take this action so students in racial/ethnic groups will not be inappropriately identified as needing special education and related services.
5. Technical assistance will be provided to the district in conjunction with other KDE divisions in addressing the root causes that contribute to the disproportionate representation of minority students in special education.
Discussion of Baseline Data:
As shown in the chart below, DECS has baseline data on the number of districts that have a risk ratio of 1.5 through 1.9, and 2.0 and higher. DECS does not currently have data on the number of districts whose disproportionate representation in special education is due to inappropriate identification.
The baseline data are incomplete since DECS completely overhauled the KCMP process in response to OSEP’s Annual Performance Report (APR) in 2004. At that time, the due date for the APR submission to OSEP was March 31. DECS revised the districts’ KCMP submission date to DECS from June 30 to January 30 so that the APR would contain current KCMP data. . At that time DECS believed that, in moving the submission date to January 30, it would have two months – from January 30 until March 31 – to review and analyze KCMP data for the APR.
Adjustments at the federal level in the APR schedule were necessitated by the IDEA Reauthorization in 2004. Under the 2004 Reauthorization, states’ initial SPPs were due to OSEP by December 4, 2005. The due date of subsequent SPPs and APRs was changed from the original March 31 date to February 1 of every year. With the change in the date of the SPP/APR submission to OSEP, DECS now has not 2 months, but 2 days between districts’ KCMP submissions and DECS’ own SPP/APR submission to OSEP.
DECS has attempted to work within these time constraints caused by the change in the SPP due date. For several SPP indicators in which DECS needs only raw data from districts, DECS has required districts to submit their raw data to DECS by November 15. For those indicators, DECS has had adequate time to analyze the KCMP data for inclusion in the SPP/APR.
This solution was not an option for Indicator 9. As stated in the Overview, determining compliance in this area is a two-part process. The first step is to determine the districts that are at or above the risk ratio of 2.0. The 2.0 figure was calculated by the DECS data manager, and sent to the districts for their evaluation of whether the 2.0 or higher was due to inappropriate identification. The second step of the process – the determination of whether the elevated risk is due to inappropriate identification – cannot be made by DECS until DECS receives the districts’ KCMP self-assessments in this area.
DECS will provide OSEP with the number of districts that are not in compliance with this Indicator as soon as possible after receipt and verification of the districts’ explanations and in no event later than the filing of KDE’s 2008 APR. DECS will also provide OSEP with Activities for this Indicator after the data on inappropriate identification is received and analyzed.

SPP Part B: Indicator 9 Kentucky
Part B State Performance Plan: 2005-2010 99 (OMB NO: 1820-0624 / Expiration Date: 01/31/2006)
Number of Districts Identified for Further Analysis
African American Hispanic
Identified Students >1.5
–1.9 Inappropriate Identification** >2.0 Inappropriate
Identification**>1.5-1.9
Inappropriate Identification** >2.0 Inappropriate
Identification
Total # of Districts with Identified Students Exceeding Acceptable Risk-Ratio
37 28 9 8
Asian American Indian
Identified Students >1.5
–1.9 Inappropriate Identification** >2.0 Inappropriate
Identification**>1.5-1.9
Inappropriate Identification** >2.0 Inappropriate
Identification
Total # of Districts with Identified Students Exceeding Acceptable Risk-Ratio
5 7 12 13
** The data on inappropriate identification will be submitted to OSEP after DECS receives the data from the districts on January 30, 2007. Baseline data will be available as soon as possible but no later than the 2008 APR.
FFY Measurable and Rigorous Target
2005 (2005-2006)
The percentage of districts with disproportionate representation of racial and ethnic groups in special education and related services that is the result of inappropriate identification will be zero percent (0)%.
2006 (2006-2007)
The percentage of districts with disproportionate representation of racial and ethnic groups in special education and related services that is the result of inappropriate identification will be zero percent (0)%.
2007 (2007-2008)
The percentage of districts with disproportionate representation of racial and ethnic groups in special education and related services that is the result of inappropriate identification will be zero percent (0)%.
SPP Part B: Indicator 9 Kentucky
Part B State Performance Plan: 2005-2010 100 (OMB NO: 1820-0624 / Expiration Date: 01/31/2006)
FFY Measurable and Rigorous Target
2008 (2008-2009)
The percentage of districts with disproportionate representation of racial and ethnic groups in special education and related services that is the result of inappropriate identification will be zero percent (0)%.
2009 (2009-2010)
The percentage of districts with disproportionate representation of racial and ethnic groups in special education and related services that is the result of inappropriate identification will be zero percent (0)%.
2010 (2010-2011)
The percentage of districts with disproportionate representation of racial and ethnic groups in special education and related services that is the result of inappropriate identification will be zero percent (0)%.
Improvement Activities/Timelines/Resources:
Improvement Timelines Resources
1. Develop, implement and refine professional development offerings for Kentucky teachers to provide instruction to all students utilizing culturally responsive, research-based methods before being referred for special education services.
2007 On-going KDE
2. Contract with an outside consultant with expertise in special education disproportionality to build capacity with SEA staff relative to disproportionality issues.
2007 On-going Outside Consultant
3. Develop in collaboration with stakeholders a self-assessment protocol for disproportionality to be utilized by districts in determining whether the disproportionality is the result of inappropriate polices, procedures or practices.
2007
NCCRESt Mid-South Regional Resource
Center KCMP Subcommittee
4. Provide on-going guidance to districts in the use of the disproportionality protocol. 2007 On-going
DECS Special Education
Co-ops
5. Study and refine the state’s current method of identifying districts with significant disproportionality.
2008 DECS
General Supervision Workgroup
6. Review data from Indicators 1,2, 4,5, 8 and 14 to determine if a correlation exists and if so, develop appropriate strategies.
2008 On-going
DECS General Supervision
Workgroup
SAPEC
SPP Part B: Indicator 10 Kentucky
Part B State Performance Plan: 2005-2010 101 (OMB NO: 1820-0624 / Expiration Date: 01/31/2006)
Part B State Performance Plan (SPP) for 2005-2010 Overview of the State Performance Plan Development (see introduction):
Monitoring Priority: Disproportionality
Indicator 10: Percent of districts with disproportionate representation of racial and ethnic groups in specific disability categories that is the result of inappropriate identification.
(20 U.S.C. 1416(a)(3)(C)
Measurement:
Percent = # of districts with disproportionate representation of racial and ethnic groups in specific disability categories that is the result of inappropriate identification divided by # of districts in the State times 100.
Include State’s definition of “disproportionate representation.”
Describe how the State determined that disproportionate representation of racial and ethnic groups in specific disability categories was the result of inappropriate identification, e.g., monitoring data, review of policies, practices and procedures under 618(d), etc.
Overview of Issue/Description of System or Process:
Based on input from the Office of Special Education and Rehabilitative Services (OSERS) March 24, 2006 SPP approval letter, KDE has amended the overview for this indicator as follows: Beginning in FFY 2005, the Kentucky Department of Education (KDE) will use the risk ratio method to determine disproportionate representation in disability categories by asking the question, “What is a specific racial/ethnic group’s risk of being identified in specific categories as compared to the risk for all other students?”
The equation for the risk ratio will be:
Risk ratio = Racial / Ethnic group risk for identification in disability category Comparison group risk for identification in disability category
The numerator for the risk ratio formula (the racial/ethnic group’s risk of identification in disability category) is obtained by dividing the number of students in a specific racial/ethnic group in the district into the number of students in the racial/ethnic group that are identified in each disability category in the district. Section 618 data provide KDE with the number of students in the racial/ ethnic group that are identified in a disability category. The Growth Factor Reports provide KDE with the total number of students in the district who are members of the racial/ ethnic group.
The denominator for the risk ratio (the comparison group risk) is calculated by dividing the number of all other students in the district that are not members of the racial/ethnic group into the number of all other students that are identified in the disability category. Again, the number of students in special education that are not members of the specific racial/ethnic group is obtained from Section 618 data, with the total number of all other students obtained from the Growth Factor Reports.
SPP Part B: Indicator 10 Kentucky
Part B State Performance Plan: 2005-2010 102 (OMB NO: 1820-0624 / Expiration Date: 01/31/2006)
To calculate the risk ratio, the comparison group’s risk of identification in a disability category is divided into the specific racial/ ethnic group’s risk of identification in the disability category. KDE has determined that, if the specific racial/ethnic group members are 2.0 or more times likely to be identified in the disability category than all other students, there is disproportionate representation. In addition, although Kentucky has established a risk ratio standard of 2.0, DECS is requesting that districts begin internally analyzing their data at the 1.5 level as a preventative step.
Determining disproportionate representation through risk ratio is step one of the inquiry. The final step of the process is to determine whether the disproportionate representation of 2.0 or higher is due to inappropriate identification by the district.
DECS has established a process utilizing the Kentucky Continuous Monitoring Process (KCMP) to determine whether the disproportionate identification in the disability category in each district is due to inappropriate identification. DECS will provide data to districts that will indicate the risk ratio for being identified in the disability category for students who are African-American and students who are Hispanic. (Note: Since Kentucky has no other racial/ethnic groups of significant size, the data analysis is currently limited to these two groups.)
The disability categories analyzed will be Mental Disabilities [MD] (including Mild Mental Disabilities (MMD) and Functional Mental Disabilities (FMD), Speech and Language (S/L) Disability, Emotional Behavioral Disabilities (EBD), Other Health Impairments (OHI), Specific Learning Disabilities (SLD), Developmental Delays (DD), and Autism (AUT). These categories include those targeted by the Office of Special Education Programs (OSEP) and additional categories Kentucky chose to include. If the data provided to the district indicate a risk ratio of 1.5 or higher in a disability category, the district will be required to analyze its data to determine if inappropriate identification is the reason for the increased risk. (Requesting that the district conduct internal analysis when the data show a risk ratio of 1.5 and higher is a preventative step, since KDE will not formally identify the district as having disproportionate representation unless it reaches a risk ratio of 2.0 or higher.)
Overall, Kentucky’s public school population is homogenous, with the vast majority of school districts having small numbers of racial/ethnic groups. Because of concerns about reliability of data for small numbers of students, DECS will look at data longitudinally for districts with small numbers of students in specific racial/ethnic groups, as set forth in Section II below. Note: Districts with significant racial/ethnic populations, i.e., more than the ‘n’ size (10 or more students), with a risk ratio of 2.0 and higher will complete the following procedures. Districts with significant racial/ethnic populations that have a risk ratio of 1.5 – 1.9 will also implement the following analysis for internal use and improvement planning.
Section 1
1. DECS will provide each district with its risk ratio data through the KCMP data tools. If the district’s data indicate that the risk of specific racial/ethnic groups identified in a disability category is 1.5 times or more than the risk for the comparison group, the district must analyze its data in the KCMP self-assessment and explain whether the elevated risk is due to inappropriate identification.
2. The KCMP provides sample questions for districts to use in analyzing whether its risk ratio of 1.5 or more is due to inappropriate identification. Additionally, the National Center for Culturally Responsive Educational Systems (NCCRESt) web site and technical assistance documents for data analysis were furnished to districts during KCMP training provided by the Special Education Co-ops.
3. Districts with a risk-ratio of 1.5 or higher will provide DECS with their KCMP analysis of whether the elevated risk is due to inappropriate identification. The “Explanation of Data” section of the KCMP will be the vehicle for the district analysis. The KCMP also includes a
SPP Part B: Indicator 10 Kentucky
Part B State Performance Plan: 2005-2010 103 (OMB NO: 1820-0624 / Expiration Date: 01/31/2006)
section for Improvement Activities in the event of inappropriate identification. If the district determines there is not inappropriate identification, the district will complete the Maintenance Activities section of the KCMP. Since districts with risk ratios of 1.5 to 1.9 are analyzing their data as a preventive measure, DECS will take no further action toward districts with risk ratios under 2.0
4. Upon receiving the KCMP self-assessment at the end of January, DECS and the Special Education Co-ops will review the explanation for districts with risk ratios of 2.0 and higher, to determine if the district is in compliance with this Indicator. Part of the inquiry will consist of whether there are reasons other than inappropriate identification that have resulted in disproportionate representation. As part of its review, DECS will notify the district to submit its local policies and procedures, evaluation instruments, and materials to DECS.
DECS will review the district’s procedures related to the availability and use of early intervening services including pre-referral interventions, the referral process, the selection and use of evaluation instruments and materials, and the selection and use of evaluation criteria. DECS will examine other data sources, including scholastic audits, inclusion of the district as a Tier 3 district under No Child Left Behind (NCLB), issues related to culture and climate, as well as institutional practices which may have contributed to inappropriate identification in a category. DECS will undertake steps to verify the district’s data, according to the district’s individual circumstances.
5. If the district demonstrates that, based on its individualized circumstances, the disproportionate representation of 2.0 and higher is not the result of inappropriate identification, DECS will take no additional action.
6. Districts with a risk ratio of 2.0 or higher whose data indicate that disproportionate representation in a disability category is due to inappropriate identification will be given one year to come into compliance from the date of notification of noncompliance. As part of the Corrective Action Plan (CAP), DECS will require the district to spend 15% of its Part B funds on comprehensive, coordinated early intervening services for general education students. The 2004 IDEA Reauthorization requires KDE to take this action so students in racial/ethnic groups will not be inappropriately identified and identified in a targeted disability category.
7. Technical assistance will be provided to the district in conjunction with other KDE divisions in addressing the root causes that contribute to the disproportionate representation of minority students in targeted disability categories.
Section II
For districts that do not have significant minority populations, i.e., less than 10 members of the specified racial/ethnic group, the following procedure will be followed:
1. Districts with elevated risk ratios will analyze their data in the same manner as districts with significant minority populations and will include either Improvement Plans or Maintenance Plans with their KCMP submissions.
2. Since reliability of the data is a concern based on the small number of minority students within the district, DECS will look at the data longitudinally (for two consecutive years) to ensure that the elevated risk ratio is due to inappropriate identification.
SPP Part B: Indicator 10 Kentucky
Part B State Performance Plan: 2005-2010 104 (OMB NO: 1820-0624 / Expiration Date: 01/31/2006)
3. If, after two consecutive years, the data indicate that the district has disproportionate representation of racial/ethnic groups in specific disability categories due to inappropriate identification, DECS will cite the district as set forth below:
4. Upon DECS’ finding of noncompliance, the district shall be required to develop a Corrective Action Plan to remedy the problem within one year from the date of notification. As part of the CAP, DECS will require the district to spend 15% of its Part B funds on comprehensive, coordinated early intervening services for general education students. The 2004 IDEA Reauthorization requires KDE to take this action so students in racial/ethnic groups will not be inappropriately identified in specific disability categories.
5. Technical assistance will be provided to the district in conjunction with other KDE divisions in addressing the root causes that contribute to the disproportionate representation of minority students in specific disability categories.
Discussion of Baseline Data:
As shown in the chart below, DECS has baseline data on the number of districts that have a risk ratio of 1.5 to 1.9, and 2.0 and higher. DECS does not currently have data on the number of districts whose disproportionate representation of racial/ethnic groups in certain categories of disability is due to inappropriate identification.
The baseline data is incomplete since DECS completely overhauled the KCMP process in response to OSEP’s Annual Performance Report (APR) in 2004. At that time, the due date for the APR submission to OSEP was March 31. DECS revised the districts’ KCMP submission date to DECS from June 30 to January 30 so that the APR would contain current KCMP data. At that time DECS believed that, in moving the submission date to January 30, it would have two months – from January 30 until March 31 – to review and analyze KCMP data for the APR.
Adjustments at the federal level in the APR schedule were necessitated by the IDEA Reauthorization in 2004. Under the 2004 Reauthorization, states’ initial SPPs were due to OSEP by December 2, 2005. The due date of subsequent SPPs and APRs was changed from the original March 31 date to February 1 of every year. With the change in the date of the SPP/APR submission to OSEP, DECS now has not 2 months, but 2 days between districts’ KCMP submissions and DECS’ own SPP/APR submission to OSEP.
DECS has attempted to work within these time constraints caused by the change in the SPP due date. For several SPP indicators in which DECS needs only raw data from districts, DECS has required districts to submit their raw data to DECS by November 15. For those indicators, DECS has had adequate time to analyze the KCMP data for inclusion in the SPP/APR.
This solution was not an option for Indicator 10. As stated in the Overview, determining compliance in this area is a two-part process. The first step is to determine the districts that are at or above the risk ratio of 2.0. The 2.0 figure was calculated by the DECS data manager, and sent to the districts for their evaluation of whether the 2.0 or higher was due to inappropriate identification. The second step of the process – the determination of whether the elevated risk is due to inappropriate identification – cannot be made by DECS until DECS receives the Districts’ KCMP self-assessments in this area.
DECS will provide OSEP with the number of Districts that are not in compliance with this indicator as soon as possible after receipt and verification of the districts’ explanations and in no event later than the filing of KDE’s 2008 APR. DECS will also provide OSEP with Activities for this Indicator after the data on inappropriate identification is received and analyzed.

SPP Part B: Indicator 10 Kentucky
Part B State Performance Plan: 2005-2010 105 (OMB NO: 1820-0624 / Expiration Date: 01/31/2006)
Number of Districts Identified for Further Analysis
African American Hispanic Category
>1.5-1.9
Inappropriate Identification**
>2.0 Inappropriate Identification**
>1.5-1.9
Inappropriate Identification**
>2.0 Inappropriate Identification**
MD 19 67 6 11
S/L 9 19 13 21
EBD 10 63 2 8
OHI 10 30 6 9
SLD 21 26 5 18
DD 16 32 5 22
AUT 3 24 1 5
Asian American Indian Category
>1.5-1.9
Inappropriate Identification**
>2.0 Inappropriate Identification**
>1.5-1.9
Inappropriate Identification**
>2.0 Inappropriate Identification**
MD 0 5 1 15
S/L 4 11 1 10
EBD 2 3 0 8
OHI 0 7 2 8
SLD 1 3 1 14
DD 0 7 1 5
AUT 0 8 0 3
** This data will be submitted to OSEP after DECS receives the data from districts on January 30, 2007. Baseline data will be available no later than the 2008 APR.

SPP Part B: Indicator 10 Kentucky
Part B State Performance Plan: 2005-2010 106 (OMB NO: 1820-0624 / Expiration Date: 01/31/2006)
FFY Measurable and Rigorous Target
2005 (2005-2006)
The percentage of districts with disproportionate representation of racial and ethnic groups in specific disability categories that is the result of inappropriate identification will be zero percent (0)%.
2006 (2006-2007)
The percentage of districts with disproportionate representation of racial and ethnic groups in specific disability categories that is the result of inappropriate identification will be zero percent (0)%.
2007 (2007-2008)
The percentage of districts with disproportionate representation of racial and ethnic groups in specific disability categories that is the result of inappropriate identification will be zero percent (0)%.
2008 (2008-2009)
The percentage of districts with disproportionate representation of racial and ethnic groups in specific disability categories that is the result of inappropriate identification will be zero percent (0)%.
2009 (2009-2010)
The percentage of districts with disproportionate representation of racial and ethnic groups in specific disability categories that is the result of inappropriate identification will be zero percent (0)%.
2010 (2010-2011)
The percentage of districts with disproportionate representation of racial and ethnic groups in specific disability categories that is the result of inappropriate identification will be zero percent (0)%.
Improvement Activities/Timelines/Resources:
Improvement Timelines Resources
7. Develop, implement and refine professional development offerings for Kentucky teachers to provide instruction to all students utilizing culturally responsive, research-based methods before being referred for special education services.
2007 On-going KDE
8. Contract with an outside consultant with expertise in special education disproportionality to build capacity with SEA staff relative to disproportionality issues.
2007 On-going Outside Consultant
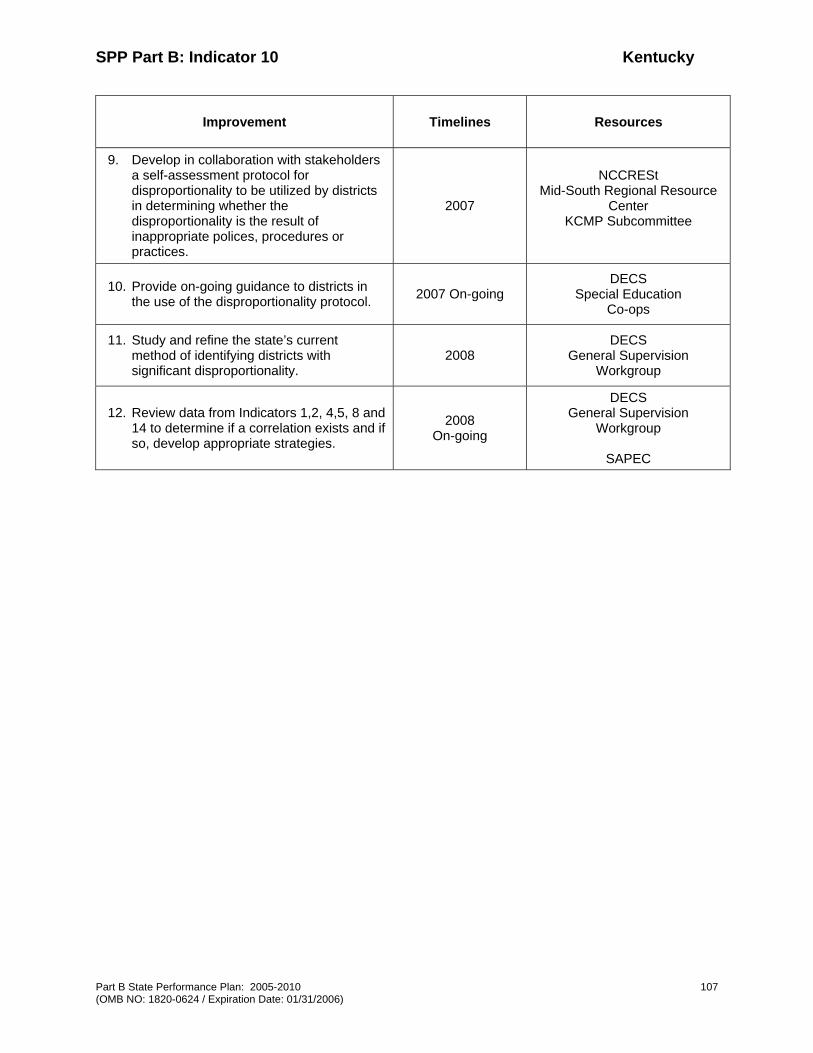
SPP Part B: Indicator 10 Kentucky
Part B State Performance Plan: 2005-2010 107 (OMB NO: 1820-0624 / Expiration Date: 01/31/2006)
Improvement Timelines Resources
9. Develop in collaboration with stakeholders a self-assessment protocol for disproportionality to be utilized by districts in determining whether the disproportionality is the result of inappropriate polices, procedures or practices.
2007
NCCRESt Mid-South Regional Resource
Center KCMP Subcommittee
10. Provide on-going guidance to districts in the use of the disproportionality protocol. 2007 On-going
DECS Special Education
Co-ops
11. Study and refine the state’s current method of identifying districts with significant disproportionality.
2008 DECS
General Supervision Workgroup
12. Review data from Indicators 1,2, 4,5, 8 and 14 to determine if a correlation exists and if so, develop appropriate strategies.
2008 On-going
DECS General Supervision
Workgroup
SAPEC
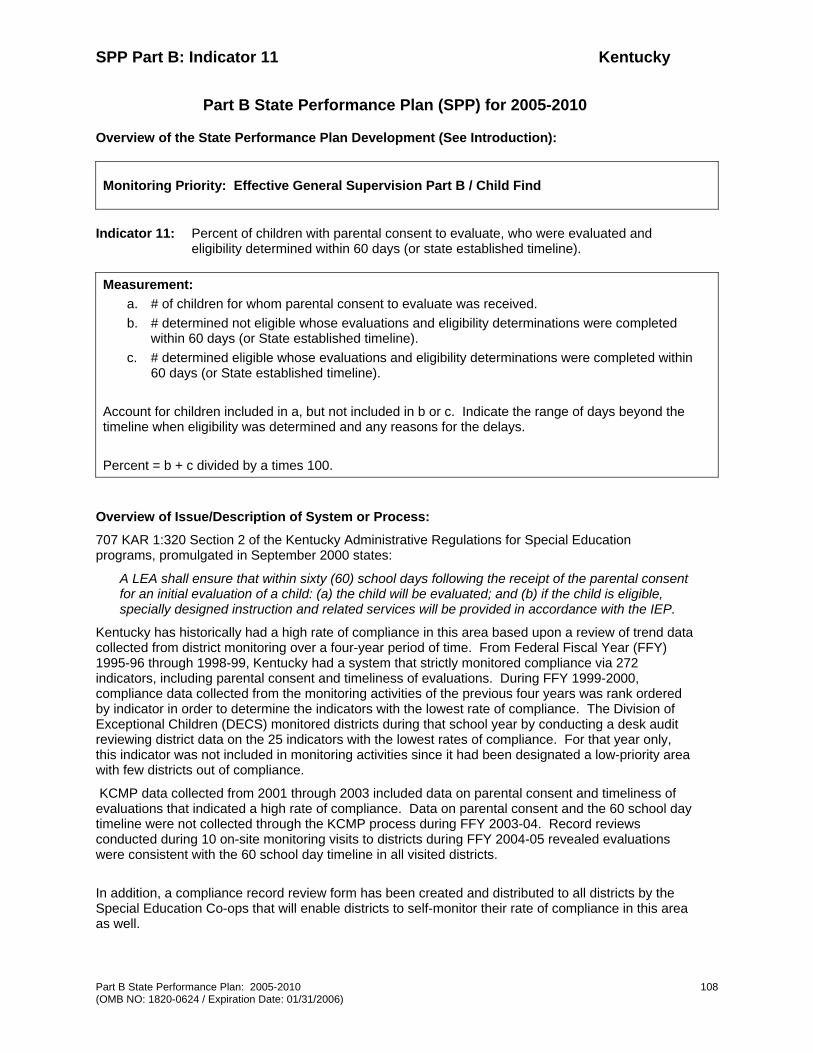
SPP Part B: Indicator 11 Kentucky
Part B State Performance Plan: 2005-2010 108 (OMB NO: 1820-0624 / Expiration Date: 01/31/2006)
Part B State Performance Plan (SPP) for 2005-2010
Overview of the State Performance Plan Development (See Introduction):
Monitoring Priority: Effective General Supervision Part B / Child Find
Indicator 11: Percent of children with parental consent to evaluate, who were evaluated and eligibility determined within 60 days (or state established timeline).
Measurement: a. # of children for whom parental consent to evaluate was received. b. # determined not eligible whose evaluations and eligibility determinations were completed
within 60 days (or State established timeline). c. # determined eligible whose evaluations and eligibility determinations were completed within
60 days (or State established timeline).
Account for children included in a, but not included in b or c. Indicate the range of days beyond the timeline when eligibility was determined and any reasons for the delays. Percent = b + c divided by a times 100.
Overview of Issue/Description of System or Process:
707 KAR 1:320 Section 2 of the Kentucky Administrative Regulations for Special Education programs, promulgated in September 2000 states:
A LEA shall ensure that within sixty (60) school days following the receipt of the parental consent for an initial evaluation of a child: (a) the child will be evaluated; and (b) if the child is eligible, specially designed instruction and related services will be provided in accordance with the IEP.
Kentucky has historically had a high rate of compliance in this area based upon a review of trend data collected from district monitoring over a four-year period of time. From Federal Fiscal Year (FFY) 1995-96 through 1998-99, Kentucky had a system that strictly monitored compliance via 272 indicators, including parental consent and timeliness of evaluations. During FFY 1999-2000, compliance data collected from the monitoring activities of the previous four years was rank ordered by indicator in order to determine the indicators with the lowest rate of compliance. The Division of Exceptional Children (DECS) monitored districts during that school year by conducting a desk audit reviewing district data on the 25 indicators with the lowest rates of compliance. For that year only, this indicator was not included in monitoring activities since it had been designated a low-priority area with few districts out of compliance.
KCMP data collected from 2001 through 2003 included data on parental consent and timeliness of evaluations that indicated a high rate of compliance. Data on parental consent and the 60 school day timeline were not collected through the KCMP process during FFY 2003-04. Record reviews conducted during 10 on-site monitoring visits to districts during FFY 2004-05 revealed evaluations were consistent with the 60 school day timeline in all visited districts. In addition, a compliance record review form has been created and distributed to all districts by the Special Education Co-ops that will enable districts to self-monitor their rate of compliance in this area as well.
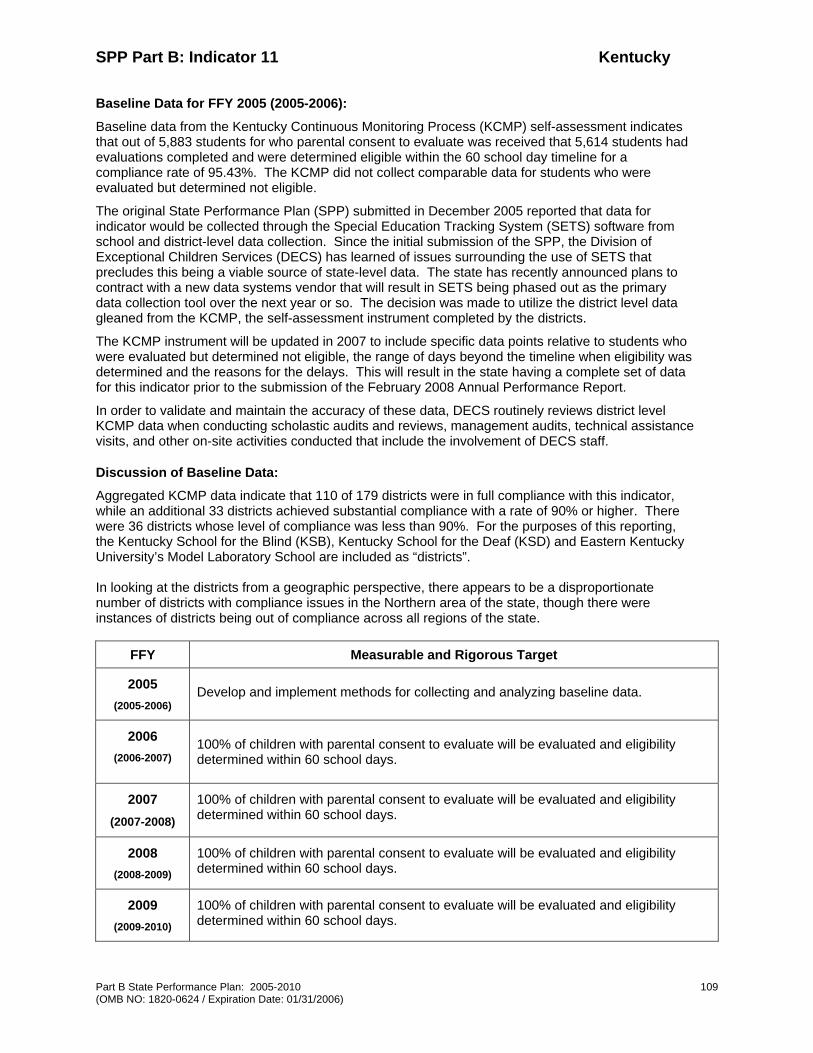
SPP Part B: Indicator 11 Kentucky
Part B State Performance Plan: 2005-2010 109 (OMB NO: 1820-0624 / Expiration Date: 01/31/2006)
Baseline Data for FFY 2005 (2005-2006):
Baseline data from the Kentucky Continuous Monitoring Process (KCMP) self-assessment indicates that out of 5,883 students for who parental consent to evaluate was received that 5,614 students had evaluations completed and were determined eligible within the 60 school day timeline for a compliance rate of 95.43%. The KCMP did not collect comparable data for students who were evaluated but determined not eligible.
The original State Performance Plan (SPP) submitted in December 2005 reported that data for indicator would be collected through the Special Education Tracking System (SETS) software from school and district-level data collection. Since the initial submission of the SPP, the Division of Exceptional Children Services (DECS) has learned of issues surrounding the use of SETS that precludes this being a viable source of state-level data. The state has recently announced plans to contract with a new data systems vendor that will result in SETS being phased out as the primary data collection tool over the next year or so. The decision was made to utilize the district level data gleaned from the KCMP, the self-assessment instrument completed by the districts.
The KCMP instrument will be updated in 2007 to include specific data points relative to students who were evaluated but determined not eligible, the range of days beyond the timeline when eligibility was determined and the reasons for the delays. This will result in the state having a complete set of data for this indicator prior to the submission of the February 2008 Annual Performance Report.
In order to validate and maintain the accuracy of these data, DECS routinely reviews district level KCMP data when conducting scholastic audits and reviews, management audits, technical assistance visits, and other on-site activities conducted that include the involvement of DECS staff.
Discussion of Baseline Data:
Aggregated KCMP data indicate that 110 of 179 districts were in full compliance with this indicator, while an additional 33 districts achieved substantial compliance with a rate of 90% or higher. There were 36 districts whose level of compliance was less than 90%. For the purposes of this reporting, the Kentucky School for the Blind (KSB), Kentucky School for the Deaf (KSD) and Eastern Kentucky University’s Model Laboratory School are included as “districts”. In looking at the districts from a geographic perspective, there appears to be a disproportionate number of districts with compliance issues in the Northern area of the state, though there were instances of districts being out of compliance across all regions of the state.
FFY Measurable and Rigorous Target
2005 (2005-2006)
Develop and implement methods for collecting and analyzing baseline data.
2006 (2006-2007)
100% of children with parental consent to evaluate will be evaluated and eligibility determined within 60 school days.
2007 (2007-2008)
100% of children with parental consent to evaluate will be evaluated and eligibility determined within 60 school days.
2008 (2008-2009)
100% of children with parental consent to evaluate will be evaluated and eligibility determined within 60 school days.
2009 (2009-2010)
100% of children with parental consent to evaluate will be evaluated and eligibility determined within 60 school days.
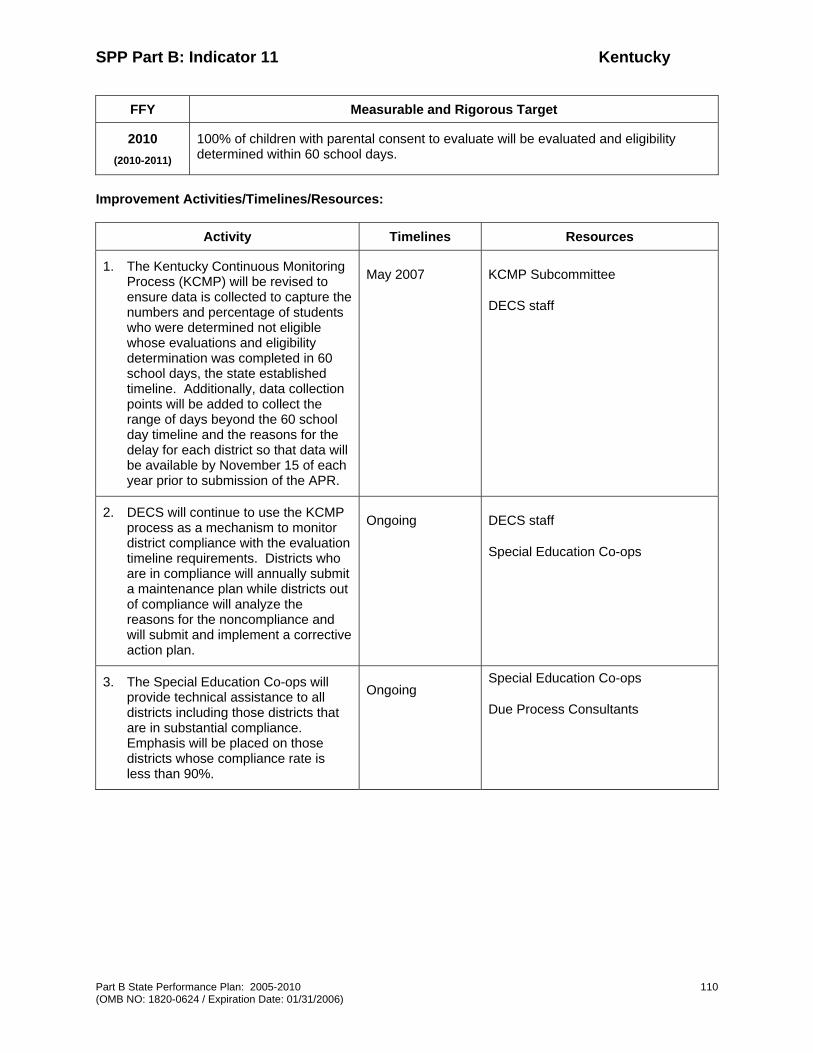
SPP Part B: Indicator 11 Kentucky
Part B State Performance Plan: 2005-2010 110 (OMB NO: 1820-0624 / Expiration Date: 01/31/2006)
FFY Measurable and Rigorous Target
2010 (2010-2011)
100% of children with parental consent to evaluate will be evaluated and eligibility determined within 60 school days.
Improvement Activities/Timelines/Resources:
Activity Timelines Resources
1. The Kentucky Continuous Monitoring Process (KCMP) will be revised to ensure data is collected to capture the numbers and percentage of students who were determined not eligible whose evaluations and eligibility determination was completed in 60 school days, the state established timeline. Additionally, data collection points will be added to collect the range of days beyond the 60 school day timeline and the reasons for the delay for each district so that data will be available by November 15 of each year prior to submission of the APR.
May 2007 KCMP Subcommittee
DECS staff
2. DECS will continue to use the KCMP process as a mechanism to monitor district compliance with the evaluation timeline requirements. Districts who are in compliance will annually submit a maintenance plan while districts out of compliance will analyze the reasons for the noncompliance and will submit and implement a corrective action plan.
Ongoing
DECS staff
Special Education Co-ops
3. The Special Education Co-ops will provide technical assistance to all districts including those districts that are in substantial compliance. Emphasis will be placed on those districts whose compliance rate is less than 90%.
Ongoing Special Education Co-ops
Due Process Consultants
SPP Part B: Indicator 12 Kentucky
Part B State Performance Plan: 2005-2010 111 (OMB NO: 1820-0624 / Expiration Date: 01/31/2006)
Part B State Performance Plan (SPP) for 2005-2010
Overview of the State Performance Plan Development: See Introduction
Monitoring Priority: Effective General Supervision Part B / Effective Transition
Indicator 12: Percent of children referred by Part C prior to age 3, who are found eligible for Part B, and who have an IEP developed and implemented by their third birthdays.
(20 U.S.C. 1416(a)(3)(B))
Measurement:
a. # of children who have been served in Part C and referred to Part B for eligibility determination.
b. # of those referred determined to be NOT eligible and whose eligibilities were determined prior to their third birthdays.
c. # of those found eligible who have an IEP developed and implemented by their third birthdays.
Account for children included in a but not included in b or c. Indicate the range of days beyond the third birthday when eligibility was determined and reasons for the delays.
Percent = c divided by a – b times 100.
Overview of Issue/Description of System or Process:
A. Historical Background
In collaboration with First Steps (Part C), KDE has funded the Kentucky Early Childhood Transition Project (KECTP) for many years. The KECTP focuses on transition evidence-based practice and on the interagency process of transition systems development for all children. KECTP provides training and support on transition issues to assist communities across the state in implementing a model of transition. Training is offered at the community level and is designed in collaboration with each community based on a self-assessment completed by each community team. Another training offered by KECTP is leadership training for state Interagency Coordinating Council (ICC) members, local Interagency Councils, Community Early Childhood Councils, district Early Intervention Council (DEIC) members and other state, regional, and local teams.
Other KECTP responsibilities include coordination of sites and state transition activities, coordination of training and resource dissemination, and provision of materials and resources as well as provision of ongoing training on assessing and facilitating social, behavioral and functional skills using the Helpful Entry Level Skills Checklist (HELS), Functional Assessment on Behavioral and Social Supports (FABSS), and accompanying materials. It also offers ongoing technical assistance for administrators from early intervention, local education agencies (preschool & first level primary), Head Start, Child Care programs, families, and others on developing interagency agreements at the local level.
Additionally, KECTP increases the awareness across the state on issues, policies, procedures, law, and regulations that impact early childhood transitions through an online resource for families and professionals. The website also includes products developed by the Project such as Families and the Transition Process: Primary Style and Step by Step: A Guide to Preschool Services. This website is used
SPP Part B: Indicator 12 Kentucky
Part B State Performance Plan: 2005-2010 112 (OMB NO: 1820-0624 / Expiration Date: 01/31/2006)
by the Early Childhood Regional Training Centers (RTCs), Head Start Disability Specialists Training Coordinators, Early Intervention Technical Assistance Teams, and Parent Training Networks.
In January 2001, Kentucky’s governor spearheaded efforts of public, private and community representatives in addressing early childhood transition by convening an Early Childhood Transition Summit. This resulted in the release of Transition in Early Childhood in June 2005. Implementation of its recommendations will improve outcomes for young children and their families by:
• Creating greater public and professional awareness of the need for transition planning
• Establishing transition supports and resources
• Guiding development of state policy related to transition
• Increasing recognition of recommended practices in transition
• Increasing family involvement in the transition process
• Increasing the number of successful transitions for children and their families
State and regional level teams were established to address transition issues and implement the Transition in Early Childhood. Partners involved include:
• Family Resource/Youth Services Centers
• Cabinet for Health and Family Services
• First Steps – Kentucky Early Intervention System • Health Access Nurturing Development Services (HANDS) Home Visitation Program • Division of Child Care • Commission for Children with Special Health Care Needs • Early Childhood Mental Health Specialists • KDE • Early Childhood RTCs • Head Start Collaboration Office • School Districts • KECTP • Institutions of Higher Education • National Early Childhood Transition Center • Child Care Resource and Referral Agencies • Head Start • Child Care Centers Kentucky is fortunate to have the National Early Childhood Transition Center located at the University of Kentucky. The National Early Childhood Transition Center, funded through the US Department of Education, Office of Special Education Programs, examines factors that promote successful transitions between infant/toddler programs, preschool programs, and public school programs for young children with disabilities and their families. Their resources are invaluable to Kentucky.
Most recently a Transition One-Stop website (www.transitiononestop.org) was launched. It is a collaborative effort involving the Human Development Institute (HDI), the Commission for Children with Special Health Care Needs, and KDE’s Special Education Cooperative Network (hereafter referred to as the Special Education Co-ops). This website provides information related to the many transitions individuals and families encounter across a life span.
SPP Part B: Indicator 12 Kentucky
Part B State Performance Plan: 2005-2010 113 (OMB NO: 1820-0624 / Expiration Date: 01/31/2006)
Baseline Data for FFY 2004 (2004-2005):
The data from the 2005 KCMP shows that in 2003-2004, 1,176 records of preschool students were reviewed. Of these records, 79.34% (929) indicated that children eligible for Part B services were evaluated and had an IEP in place by their third birthdays. The data from the KCMP is not an all-inclusive count of the number of children exiting Part C to B. All districts conduct reviews of 10% of student files not to exceed 50 files. In developing this sampling strategy, DECS received technical assistance from the OSEP technical assistance provider to ensure that the sample was valid and representative.
Using the 79.34% rate of compliance from the KCMP, the number of children found eligible who had an IEP developed and implemented by their third birthdays is approximately 1530 students out of a total of 1914 children referred from Part C to B (Kentucky Early Intervention System data). KDE does not currently collect the data requested in b of the Measurement (i.e., the number of children referred to Part B determined to be not eligible and whose eligibilities were determined prior to their third birthdays). This measure will be added to the KCMP Self-Monitoring Tool within the Early Childhood probes. To validate and maintain the accuracy of these data, DECS routinely reviews district level KCMP data when conducting scholastic audits and reviews, management audits, technical assistance visits, and other on-site activities conducted that include the involvement of DECS staff. The validity and reliability of KCMP data are addressed in more detail in Indicator 20.
Discussion of Baseline Data:
Effective transition from Part C to Part B through the sharing of data is one of the areas addressed by the General Supervision Enhancement Grant (GSEG). A signed Memorandum of Agreement (MOA) between the Part C lead agency and KDE established the authority to share data between the two agencies. FFY 2004 was the first year that Part B and C developed a plan to share data with local district directors of special education and preschool coordinators to facilitate smooth transitions for students and families from Part C to B. Data sharing began during the last quarter of 2004-05 school year. In the 2005-06 school year, a Part C student identifier was added to allow tracking of Part C student in the Part B data system. The collaborative team of Part C and Part B staff will use data to guide professional development and improve transition numbers. The existence of the collaborative team will allow the revision and refinement of the system.
Once information on children transitioning from Part C is received, districts are notified by KDE so they can begin the transition process. To date, KDE has received much positive feedback from local school districts receiving this information and are excited that, as a result, more children with disabilities who are served in Part C will receive needed services under Part B by their third birthdays.
FFY Measurable and Rigorous Target
2005 (2005-2006)
100% of Part B eligible children referred by Part C have an IEP developed and implemented by their third birthdays.
2006 (2006-2007)
100% of Part B eligible children referred by Part C have an IEP developed and implemented by their third birthdays.
2007 (2007-2008)
100% of Part B eligible children referred by Part C have an IEP developed and implemented by their third birthdays.

SPP Part B: Indicator 12 Kentucky
Part B State Performance Plan: 2005-2010 114 (OMB NO: 1820-0624 / Expiration Date: 01/31/2006)
FFY Measurable and Rigorous Target
2008 (2008-2009)
100% of Part B eligible children referred by Part C have an IEP developed and implemented by their third birthdays.
2009 (2009-2010)
100% of Part B eligible children referred by Part C have an IEP developed and implemented by their third birthdays.
2010 (2010-2011)
100% of Part B eligible children referred by Part C have an IEP developed and implemented by their third birthdays.
Improvement Activities/Timelines/Resources:
Activities Timelines Resources
1. DECS will continue work on the GSEG and work to merge Part C and Part B data systems.
December 2005 and on-going
Division of Early Childhood Development DECS GSEG staff Kentucky First Steps (Part C)
2. DECS will continue to fund KECTP to work with local and regional districts and stakeholders.
December 2005 and on-going
Division of Early Childhood Development DECS KECTP Community Early Childhood Councils Special Education Co-ops RTCs
3. DECS will require all districts to provide transition data through the KCMP.
December 2005 and on-going
Division of Early Childhood Development DECS Teachers Special Education Coordinators
4. Division of Early Childhood Development will address transition issues at fall and spring Leadership Meetings.
Spring & Fall 2006 and on-going
Division of Early Childhood Development
DECS
RTCs
5. Division of Early Childhood Development will provide transition training at the annual Early Childhood Institute.
June 2006 and on-going
Division of Early Childhood Development
DECS
RTCs
KECTP
SPP Part B: Indicator 12 Kentucky
Part B State Performance Plan: 2005-2010 115 (OMB NO: 1820-0624 / Expiration Date: 01/31/2006)
Activities Timelines Resources
6. Division of Early Childhood Development will provide transition training at the annual Infant and Toddler Institute.
August 2006 and on-going
Division of Early Childhood Development
DECS
KECTP
University of Kentucky
7. Division of Early Childhood Development will provide transition training at the annual Early Childhood Education Institute.
October 2006 and on-going
Division of Early Childhood Development
DECS
KECTP
KY Association for Early Childhood Education

SPP Part B: Indicator 13 Kentucky
Part B State Performance Plan: 2005-2010 Page 116 (OMB NO: 1820-0624 / Expiration Date: )
Part B State Performance Plan (SPP) for 2005-2010
Overview of the State Performance Plan Development: See Introduction.
Monitoring Priority: Effective General Supervision Part B / Effective Transition
Indicator 13: Percent of youth aged 16 and above with an IEP that includes coordinated, measurable, annual IEP goals and transition services that will reasonably enable the student to meet the post-secondary goals.
(20 U.S.C. 1416(a)(3)(B))
Measurement: Percent = [(# of youth with disabilities aged 16 and above with an IEP that includes coordinated, measurable, annual IEP goals and transition services that will reasonably enable the student to meet the post-secondary goals) divided by the (# of youth with an IEP age 16 and above)] times 100.
Overview of Issue/Description of System or Process:
Data for Indicator 13 were collected through the Kentucky Continuous Monitoring Process (KCMP). A description of the KCMP and the method used to select districts for monitoring can be found in the Overview of the State Performance Plan Development section.
Kentucky aligned items to measure this indicator to the priority indicators included in the 2005-2006 KCMP Reporting Instrument. Items included were:
• Does youth involvement occur through the ARC process relative to transition planning, beginning at age 14?
• Beginning at age 14, does each student’s IEP contain a Statement of Transition Service Needs?
• Has each youth with a disability completed an Individual Graduation Plan (IGP), including a projected course of study?
• Beginning at age 16, does each student’s IEP contain a Statement of Needed Transition Services including, if appropriate, a statement of the interagency responsibilities or any needed linkages?
• Beginning not later than the first IEP to be in effect when the student is 16, does the IEP include appropriate measurable postsecondary goal(s)?
KCMP data were collected by districts and submitted to KDE by November 15, 2006. Baseline data are presented under the section, Baseline Data for 2005-2006.
During the collection of data for KCMP 2005-2006, Kentucky received assistance from the National Secondary Transition Technical Assistance Center (NSTTAC) regarding more appropriate and effective methods for collecting data for Indicator 13. In September 2006, NSTTAC released the OSEP approved NSTTAC Indicator 13 Checklist that meets minimum SPP/APR requirements. Kentucky is revising KCMP to include the following items from the Checklist:
• Is (are) there a measurable postsecondary goal or goals that covers education or training, employment, and, as needed, independent living?
• Is (are) there annual IEP goal(s) that will reasonably enable the child to meet the postsecondary goal(s)?
• Are there transition services in the IEP that focus on improving the academic and functional achievement of the child to facilitate their movement from school to post-school?
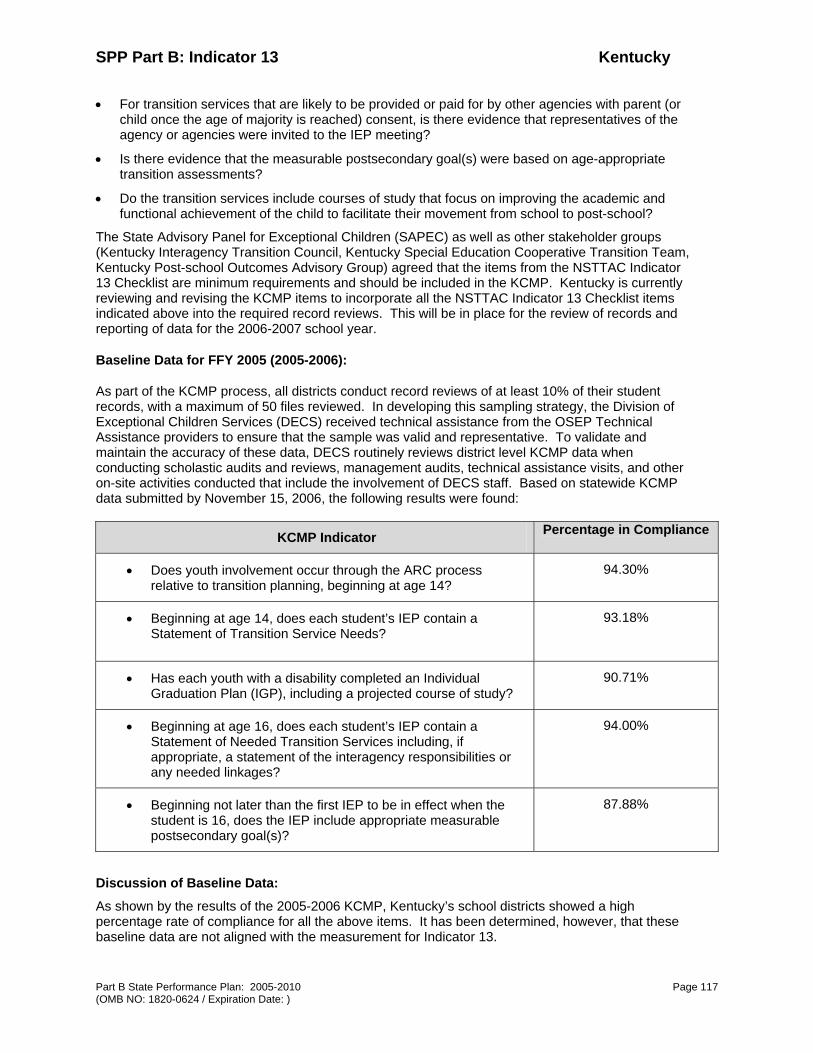
SPP Part B: Indicator 13 Kentucky
Part B State Performance Plan: 2005-2010 Page 117 (OMB NO: 1820-0624 / Expiration Date: )
• For transition services that are likely to be provided or paid for by other agencies with parent (or child once the age of majority is reached) consent, is there evidence that representatives of the agency or agencies were invited to the IEP meeting?
• Is there evidence that the measurable postsecondary goal(s) were based on age-appropriate transition assessments?
• Do the transition services include courses of study that focus on improving the academic and functional achievement of the child to facilitate their movement from school to post-school?
The State Advisory Panel for Exceptional Children (SAPEC) as well as other stakeholder groups (Kentucky Interagency Transition Council, Kentucky Special Education Cooperative Transition Team, Kentucky Post-school Outcomes Advisory Group) agreed that the items from the NSTTAC Indicator 13 Checklist are minimum requirements and should be included in the KCMP. Kentucky is currently reviewing and revising the KCMP items to incorporate all the NSTTAC Indicator 13 Checklist items indicated above into the required record reviews. This will be in place for the review of records and reporting of data for the 2006-2007 school year.
Baseline Data for FFY 2005 (2005-2006):
As part of the KCMP process, all districts conduct record reviews of at least 10% of their student records, with a maximum of 50 files reviewed. In developing this sampling strategy, the Division of Exceptional Children Services (DECS) received technical assistance from the OSEP Technical Assistance providers to ensure that the sample was valid and representative. To validate and maintain the accuracy of these data, DECS routinely reviews district level KCMP data when conducting scholastic audits and reviews, management audits, technical assistance visits, and other on-site activities conducted that include the involvement of DECS staff. Based on statewide KCMP data submitted by November 15, 2006, the following results were found:
KCMP Indicator Percentage in Compliance
• Does youth involvement occur through the ARC process relative to transition planning, beginning at age 14?
94.30%
• Beginning at age 14, does each student’s IEP contain a Statement of Transition Service Needs?
93.18%
• Has each youth with a disability completed an Individual Graduation Plan (IGP), including a projected course of study?
90.71%
• Beginning at age 16, does each student’s IEP contain a Statement of Needed Transition Services including, if appropriate, a statement of the interagency responsibilities or any needed linkages?
94.00%
• Beginning not later than the first IEP to be in effect when the student is 16, does the IEP include appropriate measurable postsecondary goal(s)?
87.88%
Discussion of Baseline Data:
As shown by the results of the 2005-2006 KCMP, Kentucky’s school districts showed a high percentage rate of compliance for all the above items. It has been determined, however, that these baseline data are not aligned with the measurement for Indicator 13.
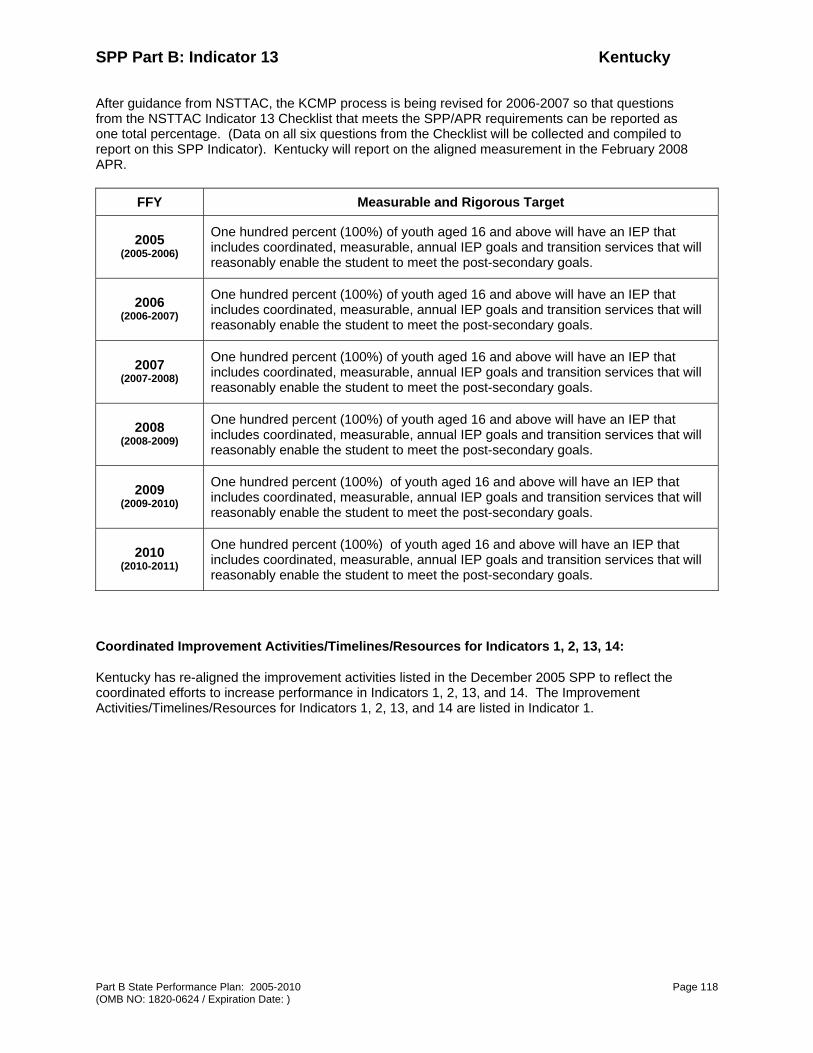
SPP Part B: Indicator 13 Kentucky
Part B State Performance Plan: 2005-2010 Page 118 (OMB NO: 1820-0624 / Expiration Date: )
After guidance from NSTTAC, the KCMP process is being revised for 2006-2007 so that questions from the NSTTAC Indicator 13 Checklist that meets the SPP/APR requirements can be reported as one total percentage. (Data on all six questions from the Checklist will be collected and compiled to report on this SPP Indicator). Kentucky will report on the aligned measurement in the February 2008 APR.
FFY Measurable and Rigorous Target
2005 (2005-2006)
One hundred percent (100%) of youth aged 16 and above will have an IEP that includes coordinated, measurable, annual IEP goals and transition services that will reasonably enable the student to meet the post-secondary goals.
2006 (2006-2007)
One hundred percent (100%) of youth aged 16 and above will have an IEP that includes coordinated, measurable, annual IEP goals and transition services that will reasonably enable the student to meet the post-secondary goals.
2007 (2007-2008)
One hundred percent (100%) of youth aged 16 and above will have an IEP that includes coordinated, measurable, annual IEP goals and transition services that will reasonably enable the student to meet the post-secondary goals.
2008 (2008-2009)
One hundred percent (100%) of youth aged 16 and above will have an IEP that includes coordinated, measurable, annual IEP goals and transition services that will reasonably enable the student to meet the post-secondary goals.
2009 (2009-2010)
One hundred percent (100%) of youth aged 16 and above will have an IEP that includes coordinated, measurable, annual IEP goals and transition services that will reasonably enable the student to meet the post-secondary goals.
2010 (2010-2011)
One hundred percent (100%) of youth aged 16 and above will have an IEP that includes coordinated, measurable, annual IEP goals and transition services that will reasonably enable the student to meet the post-secondary goals.
Coordinated Improvement Activities/Timelines/Resources for Indicators 1, 2, 13, 14:
Kentucky has re-aligned the improvement activities listed in the December 2005 SPP to reflect the coordinated efforts to increase performance in Indicators 1, 2, 13, and 14. The Improvement Activities/Timelines/Resources for Indicators 1, 2, 13, and 14 are listed in Indicator 1.
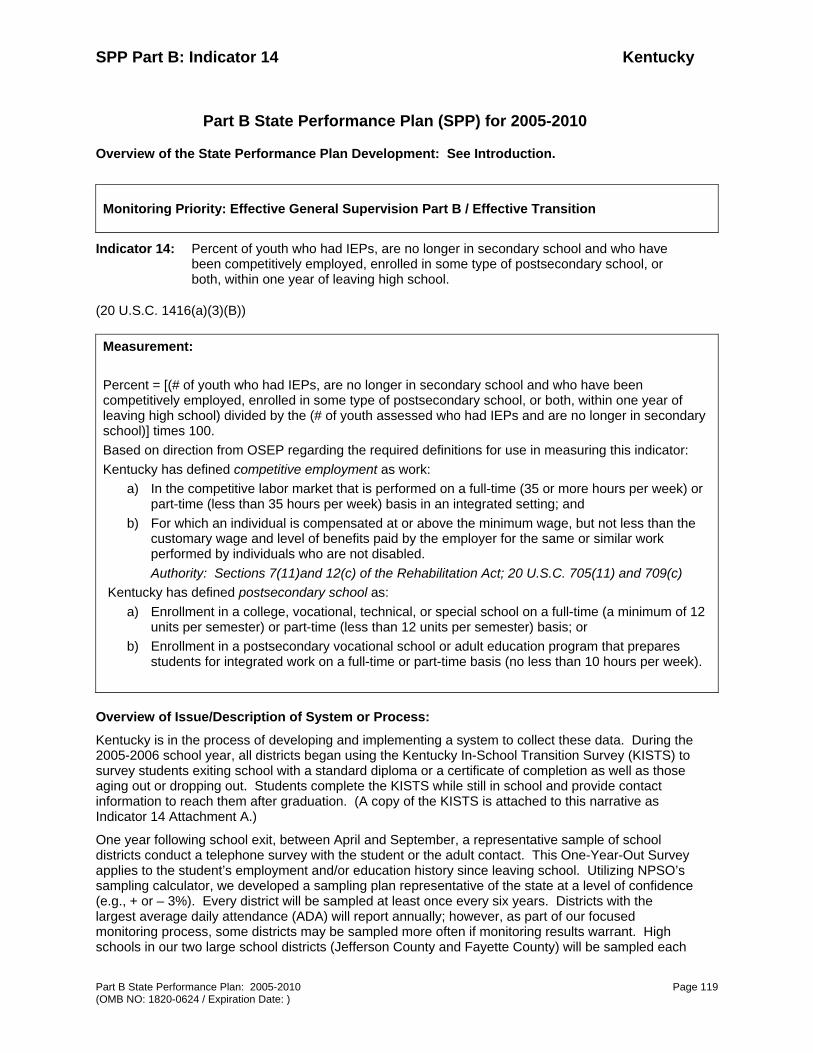
SPP Part B: Indicator 14 Kentucky
Part B State Performance Plan: 2005-2010 Page 119 (OMB NO: 1820-0624 / Expiration Date: )
Part B State Performance Plan (SPP) for 2005-2010
Overview of the State Performance Plan Development: See Introduction.
Monitoring Priority: Effective General Supervision Part B / Effective Transition
Indicator 14: Percent of youth who had IEPs, are no longer in secondary school and who have been competitively employed, enrolled in some type of postsecondary school, or both, within one year of leaving high school.
(20 U.S.C. 1416(a)(3)(B))
Measurement:
Percent = [(# of youth who had IEPs, are no longer in secondary school and who have been competitively employed, enrolled in some type of postsecondary school, or both, within one year of leaving high school) divided by the (# of youth assessed who had IEPs and are no longer in secondary school)] times 100. Based on direction from OSEP regarding the required definitions for use in measuring this indicator: Kentucky has defined competitive employment as work:
a) In the competitive labor market that is performed on a full-time (35 or more hours per week) or part-time (less than 35 hours per week) basis in an integrated setting; and
b) For which an individual is compensated at or above the minimum wage, but not less than the customary wage and level of benefits paid by the employer for the same or similar work performed by individuals who are not disabled. Authority: Sections 7(11)and 12(c) of the Rehabilitation Act; 20 U.S.C. 705(11) and 709(c)
Kentucky has defined postsecondary school as: a) Enrollment in a college, vocational, technical, or special school on a full-time (a minimum of 12
units per semester) or part-time (less than 12 units per semester) basis; or b) Enrollment in a postsecondary vocational school or adult education program that prepares
students for integrated work on a full-time or part-time basis (no less than 10 hours per week).
Overview of Issue/Description of System or Process:
Kentucky is in the process of developing and implementing a system to collect these data. During the 2005-2006 school year, all districts began using the Kentucky In-School Transition Survey (KISTS) to survey students exiting school with a standard diploma or a certificate of completion as well as those aging out or dropping out. Students complete the KISTS while still in school and provide contact information to reach them after graduation. (A copy of the KISTS is attached to this narrative as Indicator 14 Attachment A.)
One year following school exit, between April and September, a representative sample of school districts conduct a telephone survey with the student or the adult contact. This One-Year-Out Survey applies to the student’s employment and/or education history since leaving school. Utilizing NPSO’s sampling calculator, we developed a sampling plan representative of the state at a level of confidence (e.g., + or – 3%). Every district will be sampled at least once every six years. Districts with the largest average daily attendance (ADA) will report annually; however, as part of our focused monitoring process, some districts may be sampled more often if monitoring results warrant. High schools in our two large school districts (Jefferson County and Fayette County) will be sampled each

SPP Part B: Indicator 14 Kentucky
Part B State Performance Plan: 2005-2010 Page 120 (OMB NO: 1820-0624 / Expiration Date: )
of the six years. Kentucky will not report any information on performance that discloses personally identifiable information, is insufficient to yield statistically reliable information, or represents fewer than ten students (Kentucky’s n size).
Once data are gathered in the yearly post-school data collection, Kentucky will utilize the response calculator to conduct statistical comparisons between the original representative sample and the respondent group to identify how similar or different those two groups are on the designated variables (e.g., disability category, gender, ethnicity).
KDE and the Human Development Institute at the University of Kentucky (HDI-UK), with assistance from the National Post-School Outcomes Center (NPSOC), drafted the KISTS and the One-Year-Out Survey. The Kentucky Post-school Outcomes Advisory Group provides ongoing input into the review and revision of the surveys and the data collection system. It is representative of the parent/consumer groups, other participating agencies (such as the Office of Vocational Rehabilitation, Department for Mental Heath and Mental Retardation Services, Department of Community Based Services, secondary and postsecondary education, as well as KDE and HDI-UK. A copy of Kentucky’s Representative Sample is attached to this narrative as Indicator 14 Attachment B.
System Development – Activities/Timelines/Resources
Activities Timelines Resources
1. In partnership with the NPSO Center, design a data collection system and protocol through a Memorandum of Agreement with the HDI-UK to SIG.
Fall/Winter 2005 Division of Exceptional Children Services (DECS)
HDI-UK
National Post-School Outcomes Center
2. In partnership with HDI-UK, publicize the survey and explain how the data can assist schools and districts.
December 2005-
December 2006
DECS
KDE Transition Coordinator
HDI-UK
3. In partnership with HDI-UK and NPSO, design post-school outcome collection system and sampling plan.
January – July 2006 DECS
HDI-UK
NPSO consultant
4. Participate in the NPSO National Forum on Post-School Outcomes.
March 2006 DECS
HDI-UK Transition Coordinator
KDE SIG Transition Coordinator
District, parent, and student representatives
5. In partnership with HDI-UK, provide training on data collection and how it can assist schools and districts at Special Education Co-op Director’s meeting.
Early Spring 2006 DECS
KDE Transition Coordinator
State
District Administrators

SPP Part B: Indicator 14 Kentucky
Part B State Performance Plan: 2005-2010 Page 121 (OMB NO: 1820-0624 / Expiration Date: )
Activities Timelines Resources
6. Identify districts to begin participation in the process.
Early Spring 2006 DECS
Special Education Co-op Transition Coordinators
District Special Education Directors
7. In partnership with HDI-UK, gather information on 2005-06 student exiters through the Kentucky In School Transition Survey (KISTS)).
Late Spring 2006 DECS
Selected administrators and staff from districts reporting KISTS data
HDI-UK
8. Report results to public through the KDE and SIG Transition websites and through print media.
2008 and on-going DECS
9. Gather post-school outcome data on 2005-2006 student exiters sample districts.
April - August 2007 HDI-UK
Selected administrators and staff from districts reporting KISTS data
10. Build baseline of exit and post-school outcome data annually.
Fall 2006 and each Fall thereafter
DECS
HDI-UK
11. Analyze data at district and state level and compile simple, user-friendly reports.
Fall 2006 and each Fall thereafter
DECS
HDI-UK
12. Set six-year and annual rigorous and measurable targets based on baseline data collected to date (to be submitted in the APR due February, 2008.
Before February 2008 State Advisory Panel for Exceptional Children (SAPEC)
KDE Transition Coordinator
KDE Director
HDI-UK
13. Report results to public. Annually in late Fall DECS
14. Provide technical assistance to districts to learn to read and use the data in order to develop district improvement strategies; implement improvement activities
Annually in Winter/Spring
DECS
HDI-UK
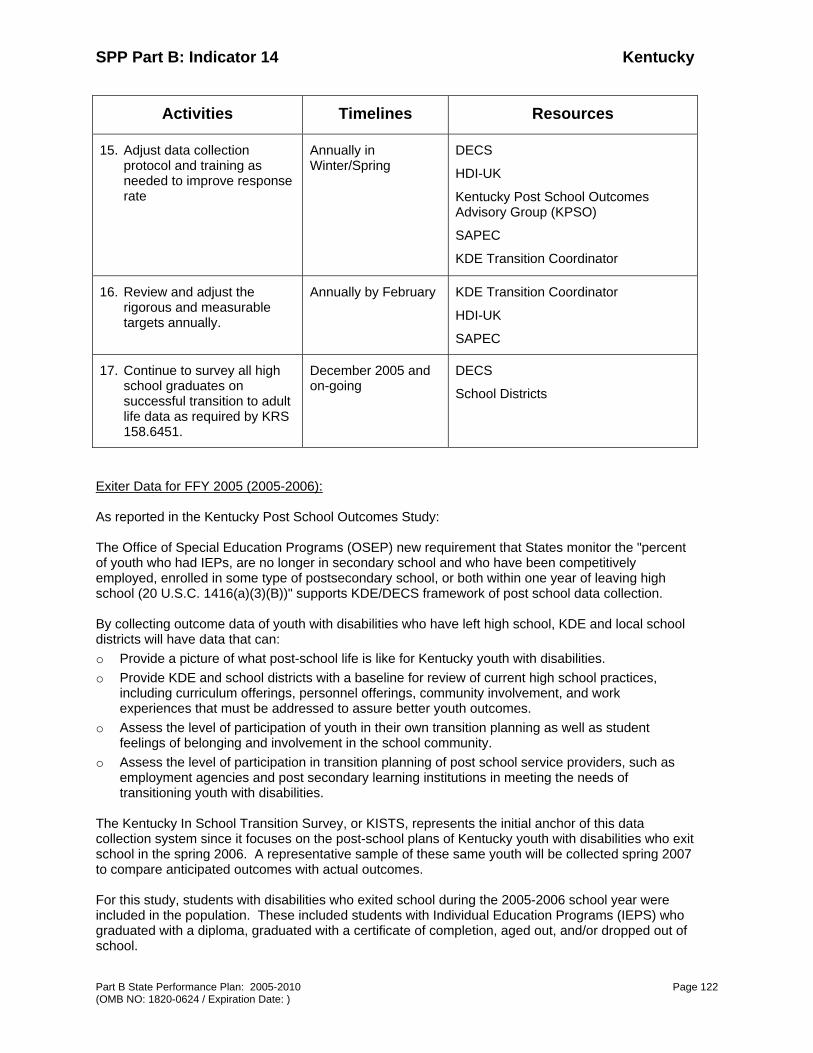
SPP Part B: Indicator 14 Kentucky
Part B State Performance Plan: 2005-2010 Page 122 (OMB NO: 1820-0624 / Expiration Date: )
Activities Timelines Resources
15. Adjust data collection protocol and training as needed to improve response rate
Annually in Winter/Spring
DECS
HDI-UK
Kentucky Post School Outcomes Advisory Group (KPSO)
SAPEC
KDE Transition Coordinator
16. Review and adjust the rigorous and measurable targets annually.
Annually by February KDE Transition Coordinator
HDI-UK
SAPEC
17. Continue to survey all high school graduates on successful transition to adult life data as required by KRS 158.6451.
December 2005 and on-going
DECS
School Districts
Exiter Data for FFY 2005 (2005-2006): As reported in the Kentucky Post School Outcomes Study:
The Office of Special Education Programs (OSEP) new requirement that States monitor the "percent of youth who had IEPs, are no longer in secondary school and who have been competitively employed, enrolled in some type of postsecondary school, or both within one year of leaving high school (20 U.S.C. 1416(a)(3)(B))" supports KDE/DECS framework of post school data collection. By collecting outcome data of youth with disabilities who have left high school, KDE and local school districts will have data that can: o Provide a picture of what post-school life is like for Kentucky youth with disabilities. o Provide KDE and school districts with a baseline for review of current high school practices,
including curriculum offerings, personnel offerings, community involvement, and work experiences that must be addressed to assure better youth outcomes.
o Assess the level of participation of youth in their own transition planning as well as student feelings of belonging and involvement in the school community.
o Assess the level of participation in transition planning of post school service providers, such as employment agencies and post secondary learning institutions in meeting the needs of transitioning youth with disabilities.
The Kentucky In School Transition Survey, or KISTS, represents the initial anchor of this data collection system since it focuses on the post-school plans of Kentucky youth with disabilities who exit school in the spring 2006. A representative sample of these same youth will be collected spring 2007 to compare anticipated outcomes with actual outcomes. For this study, students with disabilities who exited school during the 2005-2006 school year were included in the population. These included students with Individual Education Programs (IEPS) who graduated with a diploma, graduated with a certificate of completion, aged out, and/or dropped out of school.
SPP Part B: Indicator 14 Kentucky
Part B State Performance Plan: 2005-2010 Page 123 (OMB NO: 1820-0624 / Expiration Date: )
A total of 4,861 students with IEPs exited Kentucky schools during the 2005-2006 school year. Of that total, 3,133 surveys were returned. On the following page is a summary of survey results.
Baseline Data for FFY 2005 (2005-2006):
Baseline, targets and improvement activities are not due until the 2006-2007 APR to be submitted February 1, 2008. (Source: Part B SPP/APR Indicator Overview, Ruth Ryder presentation at National Accountability Conference, Denver, CO 10/06)
Discussion of Baseline Data:
We will determine measurable and rigorous targets when we submit the SPP for 2008.
Coordinated Improvement Activities/Timelines/Resources for Indicators 1, 2, 13, 14:
We will identify activities, timelines, and resources for Indicator 14 after baseline data is analyzed and will coordinate them with the activities, timelines, and resources for Indicators 1,2, and 13.
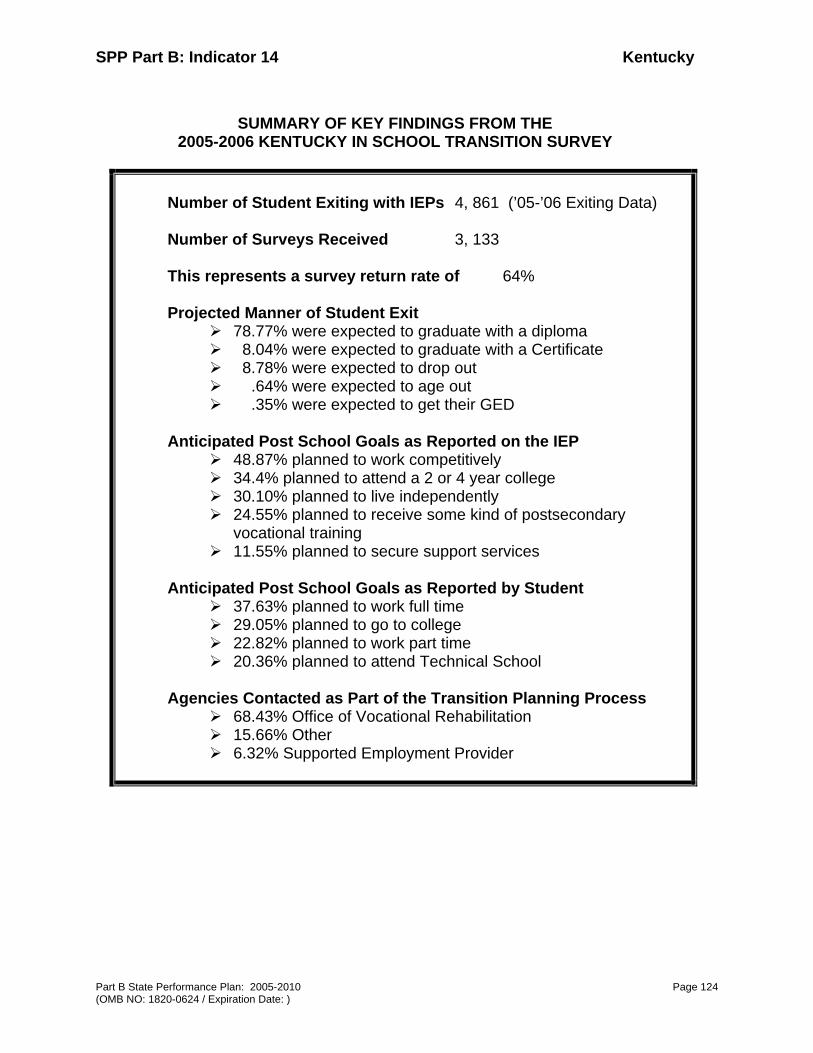
SPP Part B: Indicator 14 Kentucky
Part B State Performance Plan: 2005-2010 Page 124 (OMB NO: 1820-0624 / Expiration Date: )
SUMMARY OF KEY FINDINGS FROM THE
2005-2006 KENTUCKY IN SCHOOL TRANSITION SURVEY
Number of Student Exiting with IEPs 4, 861 (’05-’06 Exiting Data) Number of Surveys Received 3, 133 This represents a survey return rate of 64% Projected Manner of Student Exit
78.77% were expected to graduate with a diploma 8.04% were expected to graduate with a Certificate 8.78% were expected to drop out .64% were expected to age out .35% were expected to get their GED
Anticipated Post School Goals as Reported on the IEP
48.87% planned to work competitively 34.4% planned to attend a 2 or 4 year college 30.10% planned to live independently 24.55% planned to receive some kind of postsecondary
vocational training 11.55% planned to secure support services
Anticipated Post School Goals as Reported by Student
37.63% planned to work full time 29.05% planned to go to college 22.82% planned to work part time 20.36% planned to attend Technical School
Agencies Contacted as Part of the Transition Planning Process
68.43% Office of Vocational Rehabilitation 15.66% Other 6.32% Supported Employment Provider
SPP Part B: Indicator 14 Kentucky
Part B State Performance Plan: 2005-2010 Page 125 (OMB NO: 1820-0624 / Expiration Date: )
Attachment A Indicator 14
Kentucky In-School Transition Survey (KISTS)
2005-2006
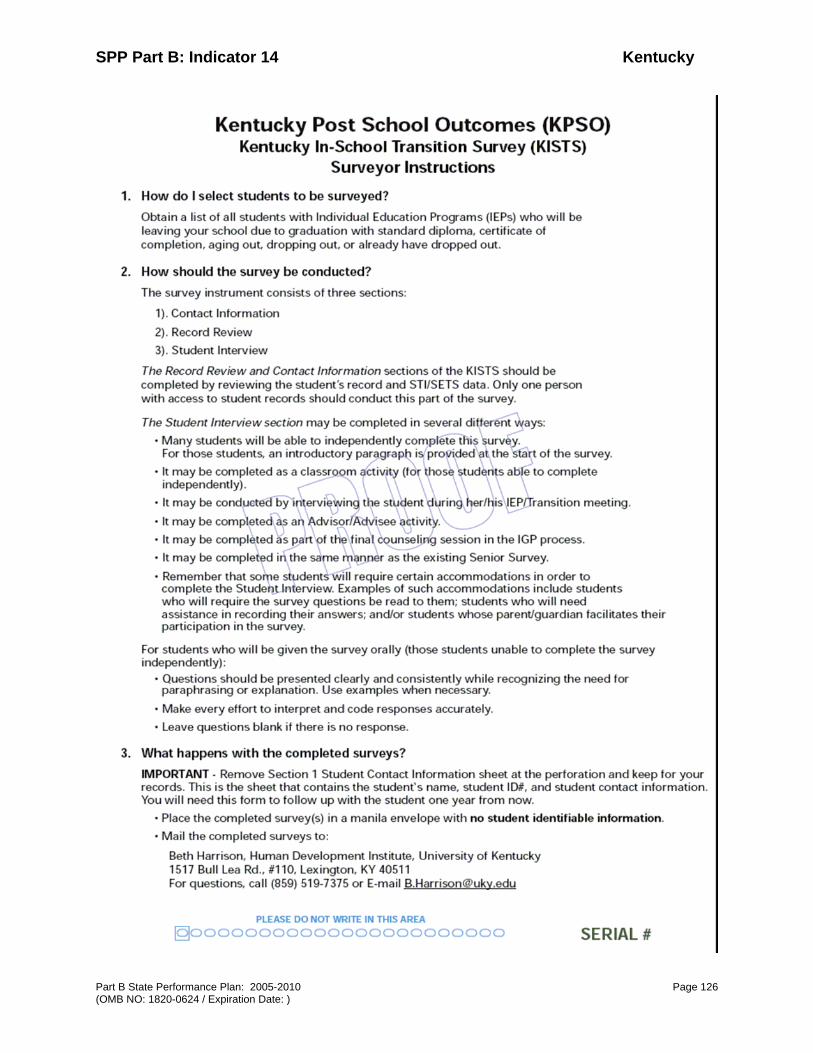
SPP Part B: Indicator 14 Kentucky
Part B State Performance Plan: 2005-2010 Page 126 (OMB NO: 1820-0624 / Expiration Date: )

SPP Part B: Indicator 14 Kentucky
Part B State Performance Plan: 2005-2010 Page 127 (OMB NO: 1820-0624 / Expiration Date: )

SPP Part B: Indicator 14 Kentucky
Part B State Performance Plan: 2005-2010 Page 128 (OMB NO: 1820-0624 / Expiration Date: )

SPP Part B: Indicator 14 Kentucky
Part B State Performance Plan: 2005-2010 Page 129 (OMB NO: 1820-0624 / Expiration Date: )
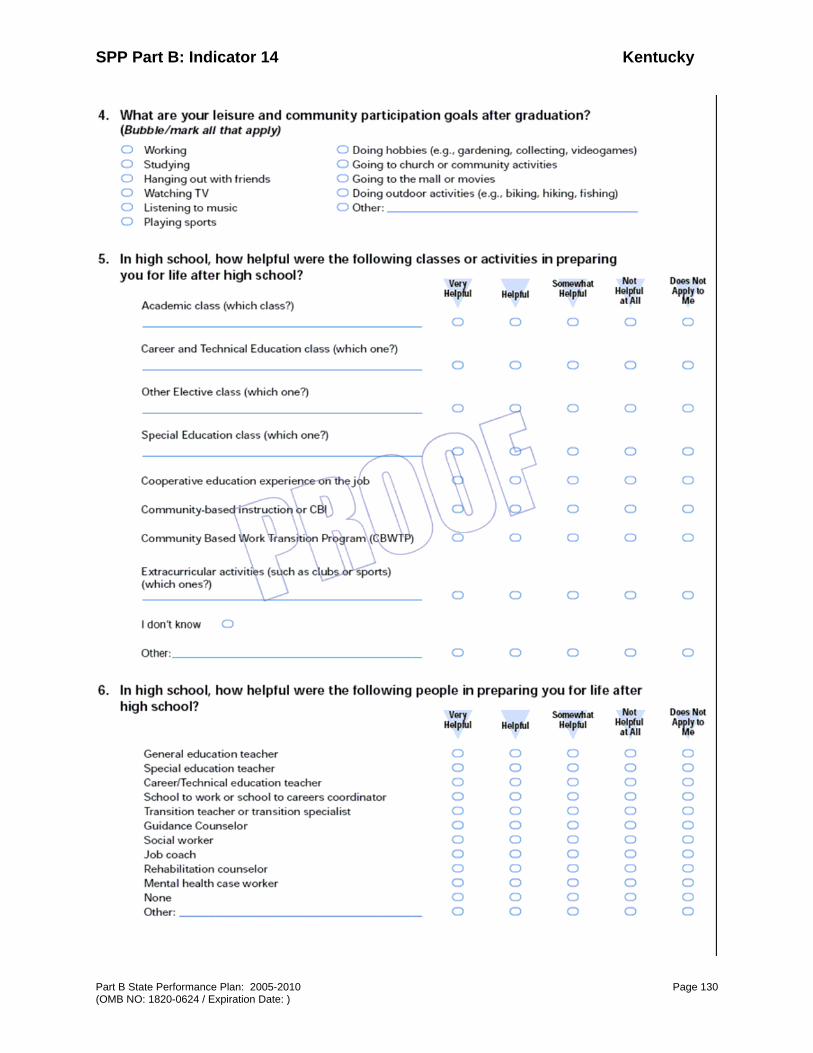
SPP Part B: Indicator 14 Kentucky
Part B State Performance Plan: 2005-2010 Page 130 (OMB NO: 1820-0624 / Expiration Date: )

SPP Part B: Indicator 14 Kentucky
Part B State Performance Plan: 2005-2010 Page 131 (OMB NO: 1820-0624 / Expiration Date: )

SPP Part B: Indicator 14 Kentucky
Part B State Performance Plan: 2005-2010 Page 132 (OMB NO: 1820-0624 / Expiration Date: )
Attachment B Indicator 14
Representative Sample as Determined by NPSO Sampling Calculator 2006 –2012
Representative Sample as determined by NPSO Sampling Calculator
District 2006-2007 2007-2008 2008-2009 2009-2010 2010-2011 2011-2012
Adair County X
Allen County X Anchorage Independent X
Anderson County X
Ashland Independent X
August Independent X
Ballard County X Barbourville Independent X
Bardstown Independent X
Barren County X
Bath County X Beechwood Independent X
Bell County X
Bellvue Independent X
Berea Independent X
Boone County X
Bourbon County X Bowling Green Independent X
Boyd County X
Boyle County X
Bracken County X
Breathitt County X
Breckinridge County X

SPP Part B: Indicator 14 Kentucky
Part B State Performance Plan: 2005-2010 Page 133 (OMB NO: 1820-0624 / Expiration Date: )
District 2006-2007 2007-2008 2008-2009 2009-2010 2010-2011 2011-2012
Bullitt County X
Burgin Independent X
Butler County X
Caldwell County X
Calloway County X
Campbell County X Campbellsville Independent X
Carlisle County X
Carroll County X
Carter County X
Casey County X
Caverna Independent X
Christian County X
Clay County X
Clinton County X Cloverport Independent X
Corbin Independent X Covington Independent X
Crittenden County X
Cumberland County X
Danville Independent X
Daviess County X Dawson Springs Independent X
Dayton Independent X East Bernstadt Independent X
Edmonson County X Elizabethtown Independent X
Elliott County X Eminence Independent X
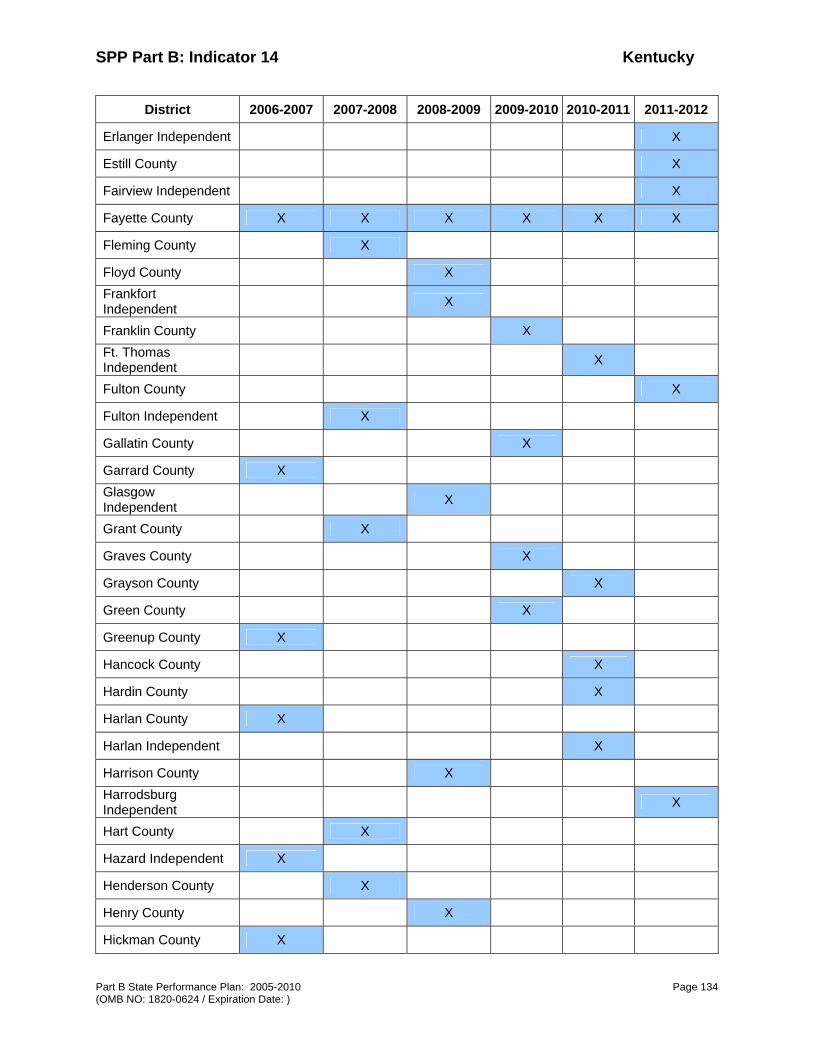
SPP Part B: Indicator 14 Kentucky
Part B State Performance Plan: 2005-2010 Page 134 (OMB NO: 1820-0624 / Expiration Date: )
District 2006-2007 2007-2008 2008-2009 2009-2010 2010-2011 2011-2012
Erlanger Independent X
Estill County X
Fairview Independent X
Fayette County X X X X X X
Fleming County X
Floyd County X Frankfort Independent X
Franklin County X Ft. Thomas Independent X
Fulton County X
Fulton Independent X
Gallatin County X
Garrard County X Glasgow Independent X
Grant County X
Graves County X
Grayson County X
Green County X
Greenup County X
Hancock County X
Hardin County X
Harlan County X
Harlan Independent X
Harrison County X Harrodsburg Independent X
Hart County X
Hazard Independent X
Henderson County X
Henry County X
Hickman County X
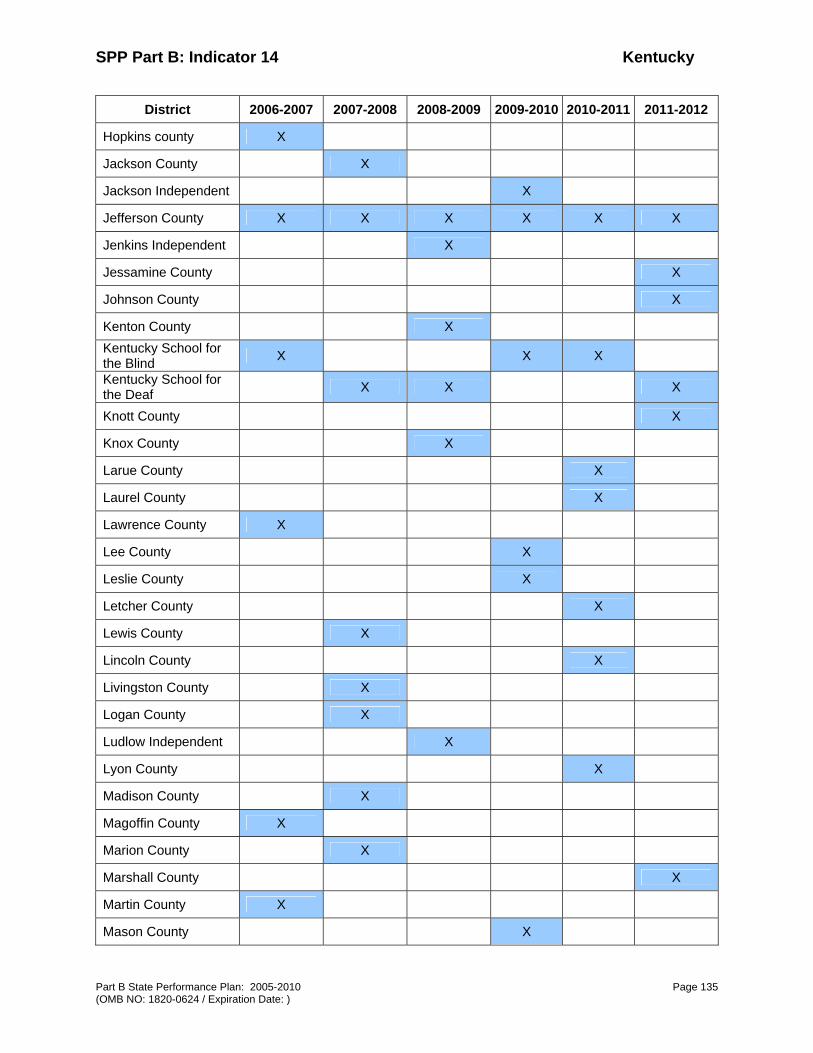
SPP Part B: Indicator 14 Kentucky
Part B State Performance Plan: 2005-2010 Page 135 (OMB NO: 1820-0624 / Expiration Date: )
District 2006-2007 2007-2008 2008-2009 2009-2010 2010-2011 2011-2012
Hopkins county X
Jackson County X
Jackson Independent X
Jefferson County X X X X X X
Jenkins Independent X
Jessamine County X
Johnson County X
Kenton County X Kentucky School for the Blind X X X
Kentucky School for the Deaf X X X
Knott County X
Knox County X
Larue County X
Laurel County X
Lawrence County X
Lee County X
Leslie County X
Letcher County X
Lewis County X
Lincoln County X
Livingston County X
Logan County X
Ludlow Independent X
Lyon County X
Madison County X
Magoffin County X
Marion County X
Marshall County X
Martin County X
Mason County X
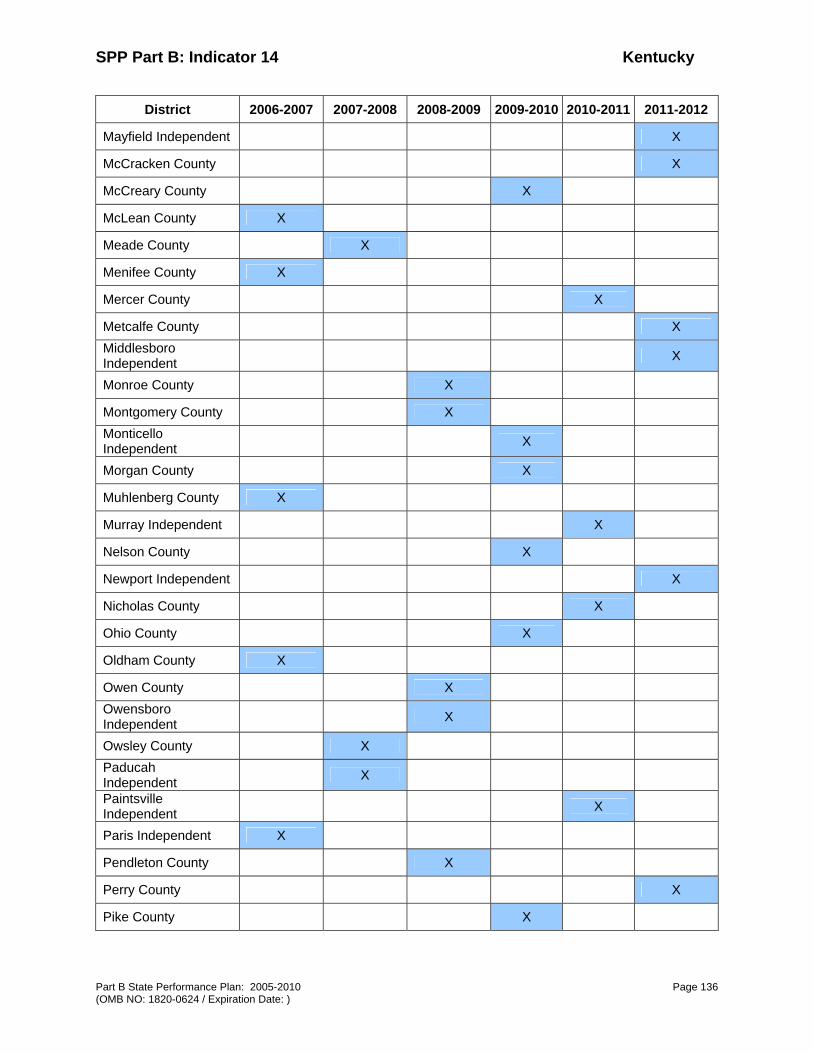
SPP Part B: Indicator 14 Kentucky
Part B State Performance Plan: 2005-2010 Page 136 (OMB NO: 1820-0624 / Expiration Date: )
District 2006-2007 2007-2008 2008-2009 2009-2010 2010-2011 2011-2012
Mayfield Independent X
McCracken County X
McCreary County X
McLean County X
Meade County X
Menifee County X
Mercer County X
Metcalfe County X Middlesboro Independent X
Monroe County X
Montgomery County X Monticello Independent X
Morgan County X
Muhlenberg County X
Murray Independent X
Nelson County X
Newport Independent X
Nicholas County X
Ohio County X
Oldham County X
Owen County X Owensboro Independent X
Owsley County X Paducah Independent X
Paintsville Independent X
Paris Independent X
Pendleton County X
Perry County X
Pike County X

SPP Part B: Indicator 14 Kentucky
Part B State Performance Plan: 2005-2010 Page 137 (OMB NO: 1820-0624 / Expiration Date: )
District 2006-2007 2007-2008 2008-2009 2009-2010 2010-2011 2011-2012
Pikeville Independent X
Pineville Independent X
Powell County X Providence Independent X
Pulaski County X Raceland Independent X
Robertson County X
Rockcastle County X
Rowan County X
Russell County X
Russell Independent X Russellville Independent X
Science Hill Independent X
Scott County X
Shelby County X Silver Grove Independent X
Simpson County X Somerset Independent X
Southgate Independent X
Spencer County X
Taylor County X
Todd County X
Trigg County X
Trimble County X
Union County X Walton-Verona Independent X
Warren County X
Washington County X
Wayne County X
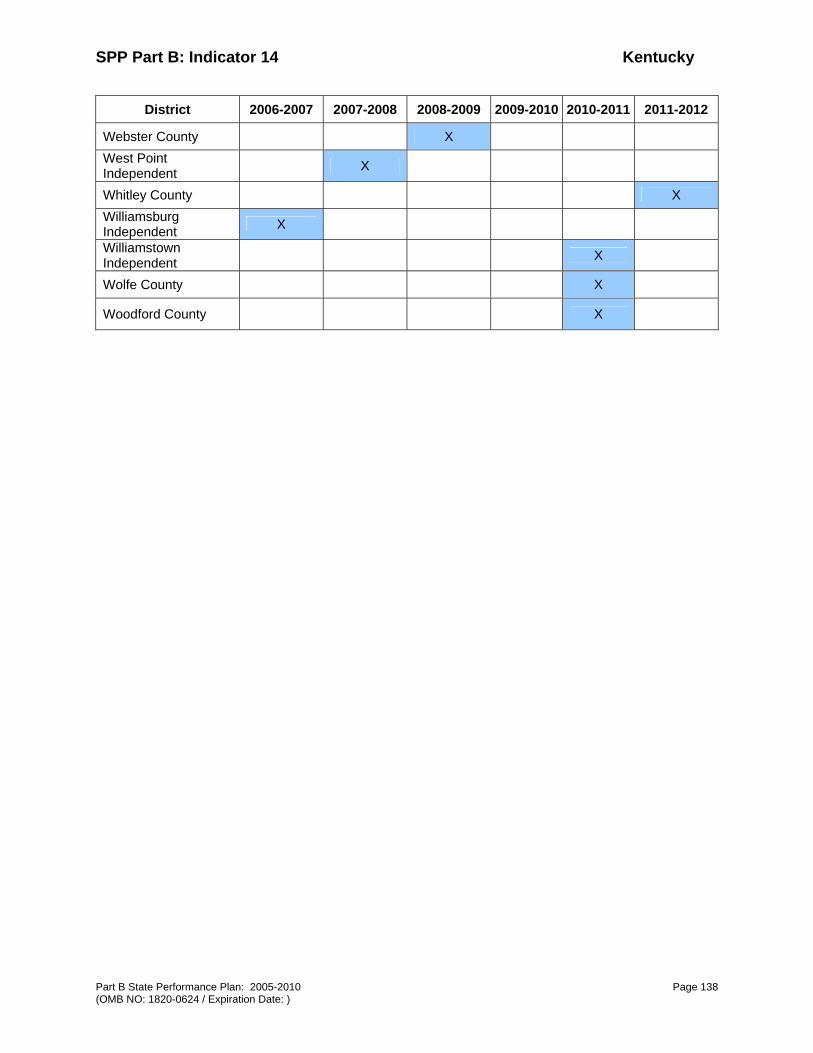
SPP Part B: Indicator 14 Kentucky
Part B State Performance Plan: 2005-2010 Page 138 (OMB NO: 1820-0624 / Expiration Date: )
District 2006-2007 2007-2008 2008-2009 2009-2010 2010-2011 2011-2012
Webster County X West Point Independent X
Whitley County X Williamsburg Independent X
Williamstown Independent X
Wolfe County X
Woodford County X
SPP Part B: Indicator 15 Kentucky
Part B State Performance Plan: 2005-2010 Page 139 (OMB NO: 1820-0624 / Expiration Date: )
Part B State Performance Plan (SPP) for 2005-2010
Overview of the State Performance Plan Development (See introduction):
Monitoring Priority: Effective General Supervision Part B / General Supervision
Indicator 15: General supervision system (including monitoring, complaints, hearings, etc.) identifies and corrects noncompliance as soon as possible but in no case later than one year from identification.
(20 U.S.C. 1416 (a)(3)(B))
Measurement:
A. Percent of noncompliance related to monitoring priority areas and indicators corrected within one year of identification:
a. # of findings of noncompliance made related to monitoring priority areas and indicators. b. # of corrections completed as soon as possible but in no case later than one year from
identification.
Percent = b divided by a times 100.
For any noncompliance not corrected within one year of identification, describe what actions, including technical assistance and/or enforcement that the State has taken.
B. Percent of noncompliance related to areas not included in the above monitoring priority areas and indicators corrected within one year of identification:
a. # of findings of noncompliance made related to such areas.
b. # of corrections completed as soon as possible but in no case later than one year from identification.
Percent = b divided by a times 100.
For any noncompliance not corrected within one year of identification, describe what actions, including technical assistance and/or enforcement that the State has taken.
C. Percent of noncompliance identified through other mechanisms (complaints, due process hearings, mediations, etc.) corrected within one year of identification:
a. # of agencies in which noncompliance was identified through other mechanisms.
b. # of findings of noncompliance made.
c. # of corrections completed as soon as possible but in no case later than one year from identification.
Percent = c divided by b times 100.
For any noncompliance not corrected within one year of identification, describe what actions, including technical assistance and/or enforcement that the State has taken.
Overview of Issue/Description of System or Process:
Prior to 1999, the Division of Exceptional Children Services’ (DECS’) system of Individuals with Disabilities (IDEA) monitoring took the form of strict compliance monitoring of the 178 districts in Kentucky. Due to prior citations from the National Office of Special Programs (OSEP) during its
SPP Part B: Indicator 15 Kentucky
Part B State Performance Plan: 2005-2010 Page 140 (OMB NO: 1820-0624 / Expiration Date: )
monitoring of DECS, DECS developed a monitoring instrument of 272 compliance items by which districts were monitored for IDEA compliance. As part of this system of strict compliance, DECS monitored districts on a five-year cycle. After the DECS monitoring team visited the district, DECS compiled and wrote a report and developed a Corrective Action Plan (CAP). Responsibility for monitoring the district CAP was given to the district’s Regional Exceptional Children Consultants (RECC) from the Regional Service Center. The RECC’s primary job responsibilities included providing technical assistance to districts in their region and follow-up on CAPs for monitoring and formal complaints, with updates to DECS on the status of the district’s CAP. During the late 1990s, OSEP moved from its system of strict compliance monitoring of State Education Agencies (SEAs) to a system of monitoring for student outcomes, as set forth in its Continuous Improvement Monitoring Process (CIMP). In viewing the CIMP requirements, DECS understood that the OSEP trend in monitoring had veered away from strict compliance monitoring toward a system of monitoring for results. Based on this trend, Kentucky asked for and received a one-year moratorium of the district monitoring process from OSEP in 1999 in order to revise its district monitoring system based on the CIMP. Kentucky’s new system of district monitoring – the Kentucky Continuous Monitoring Process or KCMP- began in 2000. Due to district lack of understanding regarding the KCMP indicators, the data received from districts are not beneficial to DECS’s analyses or making comparisons between districts. As a result, the KCMP indicators for districts were revised in 2001. KDE submitted its initial CIMP Self-Assessment to OSEP in December 2001 and its Improvement Plan, based on the CIMP, in July 2002. In 2003, OSEP sent its Response to KDE’s 2003 Improvement Plan, citing KDE in three areas on non-compliance. One of those areas was KDE’s monitoring of districts. In its review of the CIMP and the Improvement Plan, OSEP stated: Kentucky’s Self-Assessment included data indicating that the former monitoring system did not correct identified problems; and there is no data to verify that the revised monitoring system is correcting identified problems… [November 6, 2003 Response from OSEP] In the Spring 2003, the Regional Service Centers were abolished by action of the Kentucky legislature. The position of Regional Exceptional Children Consultant, by which districts received special education technical assistance on a regional basis, was also eliminated. Follow-up responsibility for CAPS reverted back to DECS at this time. In August 2003, prior to receiving the OSEP Response to the Improvement Plan, DECS convened a stakeholder group for the purpose of revising the KCMP indicators. By Spring 2004, the KCMP was redesigned through the efforts of the Monitoring Work Group and DECS. In order for KDE’s general supervision responsibilities to coordinate with OSEP’s approach, the new 2004 KCMP indicators were aligned with OSEP’s 2004 APR. The 2004 KCMP thus gave DECS quantifiable data to evaluate outcomes for students with disabilities. Additionally, the “new” KCMP asked for information in the areas of disproportional placement of minority students in special education and in placement of minority students within certain categories of disabilities. The area of disproportionality was not previously addressed in the former KCMP. Alignment of the KCMP with OSEP’s APR also meant that DECS had a data source from which to obtain APR data that had not been previously available to DECS. The new KCMP monitoring document was submitted by DECS to OSEP in June 2004 for its review. Along with the monitoring document, DECS also submitted a CD and notebook of the KCMP training developed by the work group and provided to the Special Education Co-ops in Summer 2004. DECS and OSEP staff later participated in a conference call in the Summer 2004 to discuss the new KCMP document.

SPP Part B: Indicator 15 Kentucky
Part B State Performance Plan: 2005-2010 Page 141 (OMB NO: 1820-0624 / Expiration Date: )
In addition to the Monitoring Work Group’s task in reviewing and revising the KCMP, the Work Group also developed a set of triggers to assist DECS in identifying districts in need of intervention in the spring of 2004. The Work Group’s triggers were utilized in developing DECS’ final process for identifying districts to receive on-site monitoring or assignment of a Special Education mentor during the fall of FFY 2004. Additionally, the Kentucky Board of Education’s priority of reducing the “gap” in assessment scores between students with and without disabilities entered into choosing districts in need of interventions. The final process included the following steps: o Identifying districts that did not meet AYP for reading and math o Identifying districts that had the largest gaps in reading and math on the Commonwealth
Accountability Testing System (CATS) assessment between students with and without disabilities o Identifying districts that had the largest gaps in performance in reading and math on the CATS
assessment for students with disabilities, as compared to the average performance of students with disabilities statewide
Numerical values were assigned to districts in each of the three categories. These values were averaged, then rank ordered from highest to lowest in order to prioritize where DECS needed to provide intervention. Based on the rank ordering, six districts were selected to receive Special Education Mentors. The next five districts were selected for on-site visits. The numbers of due process hearings, substantiated formal complaints and parent phone calls received by DECS were also factored into the decision of which districts would receive on-site visits. On July 20, 2005, DECS received formal notification from OSEP that there were “substantial numbers of Part B requirements that were not included” in the revised 2004 KCMP. While this was DECS’ first formal notification that OSEP believed the KCMP did not comply with IDEA requirements, DECS staff received early indications that the new KCMP might not comply with IDEA standards. As a result, DECS staff and the Kentucky’s Mid-South Resource Center liaison contacted the National Center for Special Education Accountability Monitoring (NCSEAM) in January 2005 to request that NCSEAM accept KDE as a partner. Prior to this, DECS had made a request for technical assistance but NCSEAM was not able to accept additional work at that time. NCSEAM accepted Kentucky as a potential client in the winter of 2005, Dr. Jane Nell Luster, NCSEAM’s Data Director, worked with DECS during the spring and made an on-site technical assistance visit in June 1-3, 2005. The 15 meeting participants included Dr. Johnnie Grissom, acting Director of DECS, the SAPEC chairperson, members of the Monitoring work group, DECS staff and the Mid-South liaison to Kentucky. At the culmination of the visit, NCSEAM and DECS entered into a partnership and developed a Focused Monitoring Implementation Checklist and a NCSEAM work plan for DECS. The current DECS director was appointed to his position in July 2005. Since that time, he and staff have met with Dr. Sandy Schmitz, NCSEAM’s Technical Assistance Director, to discuss revision of KDE’s IDEA monitoring process. Dr. Schmitz agreed to visit Kentucky in January 2006 to discuss substantive changes to KDE’s monitoring process, including the KCMP. Dr. Luster had a follow-up visit with DECS and the monitoring work group on December 5 and 6, 2005, to discuss KDE’s data needs, in order to assist KDE with ensuring its monitoring system is compliant with IDEA. Note: Another reason for the revision of KDE’s current monitoring system rests with actions taken by Congress. In the 2004 Reauthorization of IDEA, Congress required that SEAs submit State Performance Plans to OSEP, with follow-up APRs on a yearly basis. Few of the new SPP indicators are identical to the former APR. Even slight changes to the indicators significantly affect KDE’s ability to collect SPP data. The KDE current system of collecting data does not allow DECS to collect student level data that exists at the district level- while individual districts collect the data. DECS has utilized the 2004 KCMP as a district tool for self-evaluation, as a means of evaluating district performance under IDEA and as a way of

SPP Part B: Indicator 15 Kentucky
Part B State Performance Plan: 2005-2010 Page 142 (OMB NO: 1820-0624 / Expiration Date: )
obtaining needed data for the 2004 and 2005 APRs. While DECS’ realignment of the KCMP with the former APR appeared to be a good idea in 2003, changes in the SPP/APR indicators now mean that DECS must develop a new data collection plan for many of the new SPP/APR indicators. Baseline Data FFY 2004 (2004-2005):
KCMP self-assessments, based on the 2001 KCMP, were sent by districts to DECS in June 2004. KCMP self-assessments, based on the revised 2004 KCMP, were sent by districts to DECS by January 30, 2005.
Discussion of Baseline Data for Monitoring Target:
Based upon the system of triggers developed by the Work Group, a pilot program was instituted for FFY 2004-2005. Ten districts were identified in summer 2004 for on-site verification visits of their KCMP and other compliance issues set forth in IDEA. Five of those ten districts identified for visits were the lowest performing districts based on the triggers. (Districts that had already been assigned Special Education Mentors were excluded from the on-site visits.) Two of the ten districts chosen for visits were rated as exemplary districts using the established triggers. Three of the districts chosen for visits were selected at random. (In actuality, two of the three random districts requested visits). On-site visits commenced in Fall 2004 and continue to be conducted through winter and spring of 2005. When other programs at KDE required an on-site visit to a district, the programs along with DECS organized a coordinated technical assistance visit. This unified approach has provided technical assistance beyond compliance, and attempts to improve outcomes for all students and ensure all programs are evaluated for improvement of services to children. The pilot has continued through FFY 2005-2006 with some mid-course revisions based on the information gleaned from the previous year. Rather than identifying two districts as exemplary, exemplary practices within all districts visited will be noted. Upon compiling the report of findings, the district will be required to develop a corrective action plan (CAP) to address findings of noncompliance within one year from the submission of the aforementioned report. Twelve districts will receive on-site visits during the FFY 2005-2006. The triggers from FFY 2004- 2005 were reviewed and revised. Thus, nine of the districts were selected based on the following criterion:
o Meeting Adequate Yearly Progress (AYP)
o In-district gap between district–wide assessment scores (CATS) of students with and without disabilities
o Analysis of district’s CATS scores versus state CATS scores in KDE Core Content
o Number of dropouts of students with disabilities
o Number of students with disabilities suspended over 10 days or placed in alternate education
o Results of KCMP desk audits
o District complaints/ hearings/ mediations received by DECS
o Comparison of the gaps between students with and without disabilities in non-cognitive areas collected by the Office of Assessment and Accountability, i.e., attendance rates and successful transition rates to postsecondary outcomes
In districts with smaller student populations where the district is too small to have statistically significant numbers of students at each grade level, and therefore unable to produce reportable achievement gap data, the following criteria was used:
o Meeting Adequate Yearly Progress (AYP)
o Number of dropouts of students with disabilities
o Number of students with disabilities suspended over 10 days or placed in alternate education
SPP Part B: Indicator 15 Kentucky
Part B State Performance Plan: 2005-2010 Page 143 (OMB NO: 1820-0624 / Expiration Date: )
o Results of KCMP desk audits
o District Complaints/ hearings/ mediations received by DECS
o Comparison of the gaps between students with and without disabilities in non-cognitive areas collected by the Office of Assessment and Accountability, i.e., attendance rates and successful transition rates to postsecondary outcomes
o Historical information based on the districts’ past KCMP data and past compliance issues
The district will be required to develop a corrective action plan (CAP) to address any area(s) of noncompliance within one calendar year from the DECS issuance of the report. In addition to addressing areas of noncompliance, the report will include a discussion of effective research-based instructional practices that have been proven to enhance student achievement. The team leader for the on-site visit will be required to follow-up with the district to provide any technical assistance and support needed to accomplish the completion of the district’s corrective action plan. The leader will also be responsible for maintaining the data on the status of the district’s CAP for the duration of the year. As necessary, additional on-site visits will be made to verify all noncompliance issues have been corrected. The CAP for Russellville Independent, a FFY 2004-2005 on-site visit, was closed November 2005. Other monitoring CAPs for FFY 2004-2005 on-site visits are pending within the one-year timeline. As set forth in 707 KAR 1:380 Section 3, for districts who fail to correct identified issues of noncompliance within the one year time period the DECS will:
• Employ intensive assistance for at least a two-year period. The intensive assistance may include consultation, training, technical assistance or assignment of a special education mentor within the district in order to remedy all findings of noncompliance.
• Utilize more progressive sanctions if a district fails to comply within the two-year time frame, as follows:
o DECS may grant conditional approval of IDEA funds. Conditions and timelines for continuing to receive IDEA funds will be stated in an application approval letter sent to DECS by the district for approval. Conditional funding may be employed for more than one year before imposing the next sanction.
o DECS may withhold payment of IDEA funds if a district fails or refuses to meet the conditions or timelines in the conditional approval letter.
o DECS may withhold Support Education Excellence in Kentucky (SEEK) add-on funds. SEEK add-on funds will be held in a trust as required in KRS 157.224.
o Other sanctions available under state and federal law will be employed as circumstances warrant.
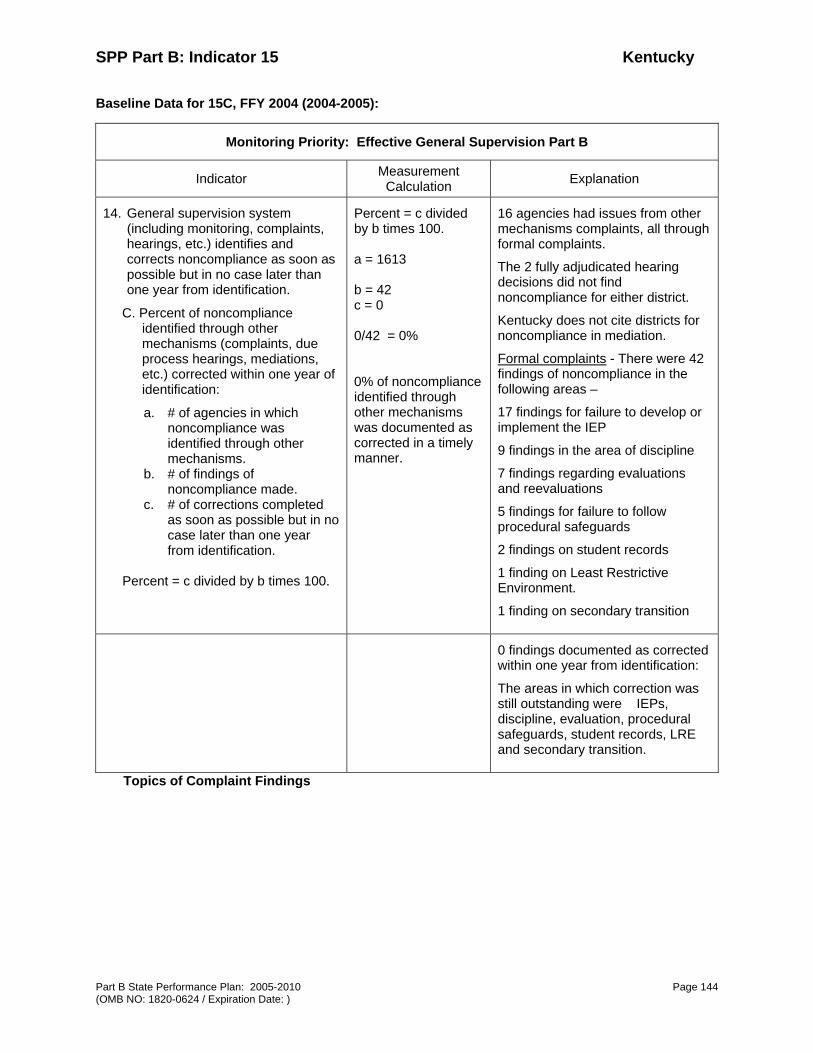
SPP Part B: Indicator 15 Kentucky
Part B State Performance Plan: 2005-2010 Page 144 (OMB NO: 1820-0624 / Expiration Date: )
Baseline Data for 15C, FFY 2004 (2004-2005):
Monitoring Priority: Effective General Supervision Part B
Indicator Measurement Calculation Explanation
14. General supervision system (including monitoring, complaints, hearings, etc.) identifies and corrects noncompliance as soon as possible but in no case later than one year from identification.
C. Percent of noncompliance identified through other mechanisms (complaints, due process hearings, mediations, etc.) corrected within one year of identification:
a. # of agencies in which noncompliance was identified through other mechanisms.
b. # of findings of noncompliance made.
c. # of corrections completed as soon as possible but in no case later than one year from identification.
Percent = c divided by b times 100.
Percent = c divided by b times 100. a = 1613 b = 42 c = 0 0/42 = 0% 0% of noncompliance identified through other mechanisms was documented as corrected in a timely manner.
16 agencies had issues from other mechanisms complaints, all through formal complaints.
The 2 fully adjudicated hearing decisions did not find noncompliance for either district.
Kentucky does not cite districts for noncompliance in mediation.
Formal complaints - There were 42 findings of noncompliance in the following areas –
17 findings for failure to develop or implement the IEP
9 findings in the area of discipline
7 findings regarding evaluations and reevaluations
5 findings for failure to follow procedural safeguards
2 findings on student records
1 finding on Least Restrictive Environment.
1 finding on secondary transition
0 findings documented as corrected within one year from identification:
The areas in which correction was still outstanding were IEPs, discipline, evaluation, procedural safeguards, student records, LRE and secondary transition.
Topics of Complaint Findings
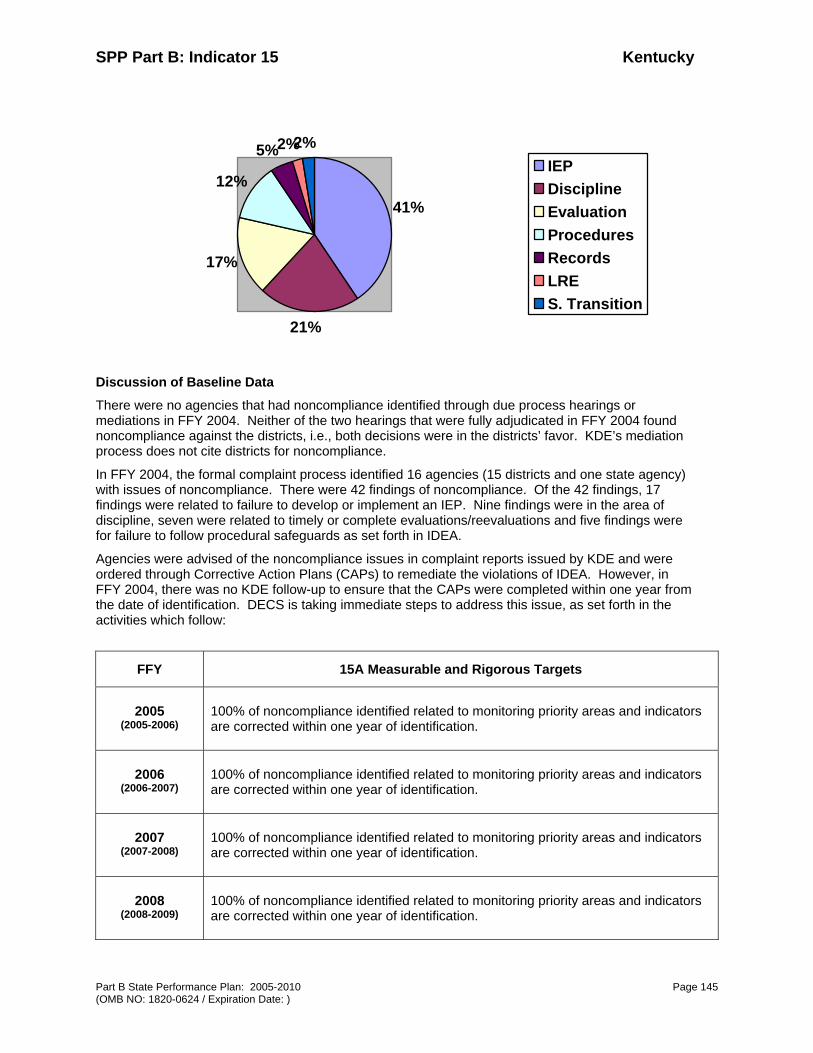
SPP Part B: Indicator 15 Kentucky
Part B State Performance Plan: 2005-2010 Page 145 (OMB NO: 1820-0624 / Expiration Date: )
41%
21%
17%
12%
5%2%2%IEPDisciplineEvaluationProceduresRecordsLRES. Transition
Discussion of Baseline Data
There were no agencies that had noncompliance identified through due process hearings or mediations in FFY 2004. Neither of the two hearings that were fully adjudicated in FFY 2004 found noncompliance against the districts, i.e., both decisions were in the districts’ favor. KDE’s mediation process does not cite districts for noncompliance.
In FFY 2004, the formal complaint process identified 16 agencies (15 districts and one state agency) with issues of noncompliance. There were 42 findings of noncompliance. Of the 42 findings, 17 findings were related to failure to develop or implement an IEP. Nine findings were in the area of discipline, seven were related to timely or complete evaluations/reevaluations and five findings were for failure to follow procedural safeguards as set forth in IDEA.
Agencies were advised of the noncompliance issues in complaint reports issued by KDE and were ordered through Corrective Action Plans (CAPs) to remediate the violations of IDEA. However, in FFY 2004, there was no KDE follow-up to ensure that the CAPs were completed within one year from the date of identification. DECS is taking immediate steps to address this issue, as set forth in the activities which follow:
FFY 15A Measurable and Rigorous Targets
2005 (2005-2006)
100% of noncompliance identified related to monitoring priority areas and indicators are corrected within one year of identification.
2006 (2006-2007)
100% of noncompliance identified related to monitoring priority areas and indicators are corrected within one year of identification.
2007 (2007-2008)
100% of noncompliance identified related to monitoring priority areas and indicators are corrected within one year of identification.
2008 (2008-2009)
100% of noncompliance identified related to monitoring priority areas and indicators are corrected within one year of identification.
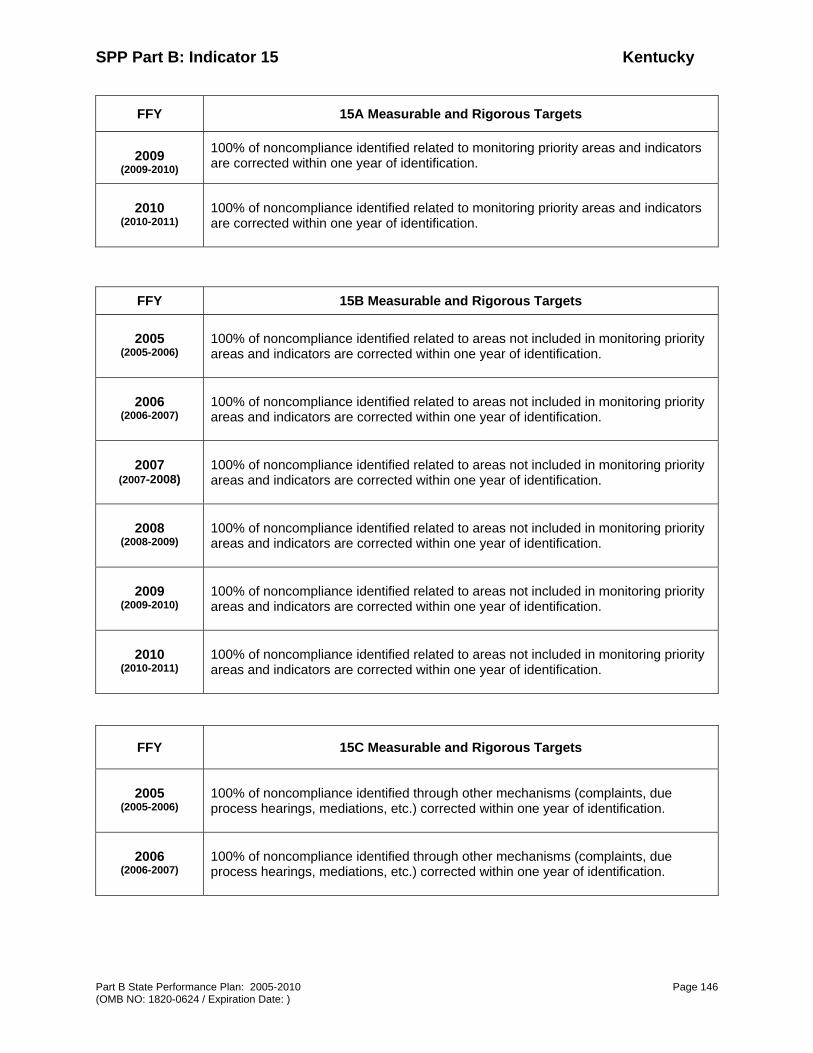
SPP Part B: Indicator 15 Kentucky
Part B State Performance Plan: 2005-2010 Page 146 (OMB NO: 1820-0624 / Expiration Date: )
FFY 15A Measurable and Rigorous Targets
2009 (2009-2010)
100% of noncompliance identified related to monitoring priority areas and indicators are corrected within one year of identification.
2010 (2010-2011)
100% of noncompliance identified related to monitoring priority areas and indicators are corrected within one year of identification.
FFY 15B Measurable and Rigorous Targets
2005 (2005-2006)
100% of noncompliance identified related to areas not included in monitoring priority areas and indicators are corrected within one year of identification.
2006 (2006-2007)
100% of noncompliance identified related to areas not included in monitoring priority areas and indicators are corrected within one year of identification.
2007 (2007-2008)
100% of noncompliance identified related to areas not included in monitoring priority areas and indicators are corrected within one year of identification.
2008 (2008-2009)
100% of noncompliance identified related to areas not included in monitoring priority areas and indicators are corrected within one year of identification.
2009 (2009-2010)
100% of noncompliance identified related to areas not included in monitoring priority areas and indicators are corrected within one year of identification.
2010 (2010-2011)
100% of noncompliance identified related to areas not included in monitoring priority areas and indicators are corrected within one year of identification.
FFY 15C Measurable and Rigorous Targets
2005 (2005-2006)
100% of noncompliance identified through other mechanisms (complaints, due process hearings, mediations, etc.) corrected within one year of identification.
2006 (2006-2007)
100% of noncompliance identified through other mechanisms (complaints, due process hearings, mediations, etc.) corrected within one year of identification.

SPP Part B: Indicator 15 Kentucky
Part B State Performance Plan: 2005-2010 Page 147 (OMB NO: 1820-0624 / Expiration Date: )
FFY 15C Measurable and Rigorous Targets
2007 (2007-2008)
100% of noncompliance identified through other mechanisms (complaints, due process hearings, mediations, etc.) corrected within one year of identification.
2008 (2008-2009)
100% of noncompliance identified through other mechanisms (complaints, due process hearings, mediations, etc.) corrected within one year of identification.
2009 (2009-2010)
100% of noncompliance identified through other mechanisms (complaints, due process hearings, mediations, etc.) corrected within one year of identification.
2010 (2010-2011)
100% of noncompliance identified through other mechanisms (complaints, due process hearings, mediations, etc.) corrected within one year of identification.
Improvement Activities/Timelines/Resources:
Activity Timeline Resources
1. KDE complaint investigators will contact districts with outstanding CAPS for FFY 2004 to determine the CAP status.
By January 1, 2006 DECS
2. KDE complaint investigators will meet with the DECS director to discuss all complaints from FFY 2004 whose CAPs have not been completed.
By January 15, 2006 DECS
3. For CAPs exceeding one year, the DECS director will require the district DOSE to meet and resolve all outstanding issues.
February 28, 2006 DECS
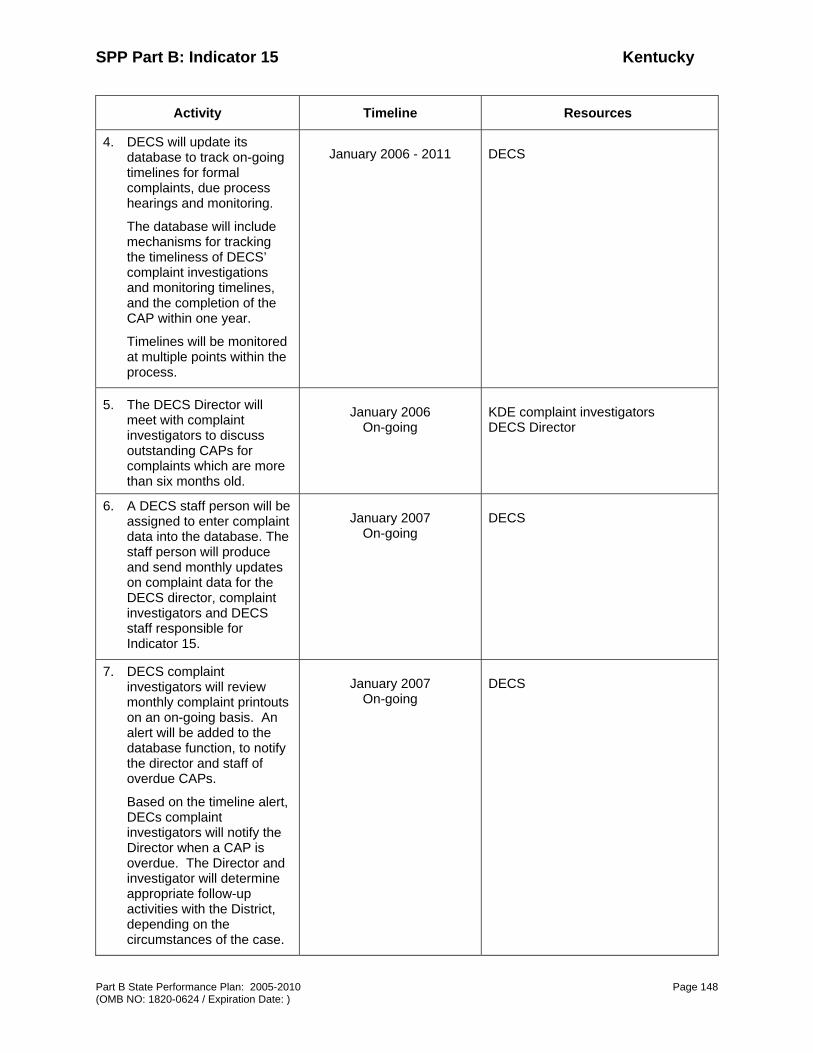
SPP Part B: Indicator 15 Kentucky
Part B State Performance Plan: 2005-2010 Page 148 (OMB NO: 1820-0624 / Expiration Date: )
Activity Timeline Resources
4. DECS will update its database to track on-going timelines for formal complaints, due process hearings and monitoring.
The database will include mechanisms for tracking the timeliness of DECS’ complaint investigations and monitoring timelines, and the completion of the CAP within one year.
Timelines will be monitored at multiple points within the process.
January 2006 - 2011 DECS
5. The DECS Director will meet with complaint investigators to discuss outstanding CAPs for complaints which are more than six months old.
January 2006 On-going
KDE complaint investigators DECS Director
6. A DECS staff person will be assigned to enter complaint data into the database. The staff person will produce and send monthly updates on complaint data for the DECS director, complaint investigators and DECS staff responsible for Indicator 15.
January 2007 On-going
DECS
7. DECS complaint investigators will review monthly complaint printouts on an on-going basis. An alert will be added to the database function, to notify the director and staff of overdue CAPs.
Based on the timeline alert, DECs complaint investigators will notify the Director when a CAP is overdue. The Director and investigator will determine appropriate follow-up activities with the District, depending on the circumstances of the case.
January 2007 On-going
DECS

SPP Part B: Indicator 16 Kentucky
Part B State Performance Plan: 2005-2010 Page 149 (OMB NO: 1820-0624 / Expiration Date: )
Part B State Performance Plan (SPP) for 2005-2010
Overview of the State Performance Plan Development (see introduction):
Monitoring Priority: Effective General Supervision Part B / General Supervision
Indicator 16: Percent of signed written complaints with reports issued that were resolved within 60-day timeline or a timeline extended for exceptional circumstances with respect to a particular complaint.
(20 U.S.C. 1416(a)(3)(B))
Measurement: Percent = (1.1(b) + 1.1(c)) divided by (1.1) times 100.
Overview of Issue/Description of System or Process:
As part of their general supervisory responsibility under IDEA, State Education Agencies (SEAs) are charged with administering a formal complaint system. Parents, students, organizations or individuals may file a formal written complaint, alleging violations of IDEA by a district. 34 CFR 300.660- 300.662. In discharging this function, the SEA has a 60-day timeline in which it must investigate the complaint and issue a report on its findings. If the district has violated IDEA, the SEA also writes a corrective action plan for the district that requires the district to take certain steps to achieve compliance with the law. The complaint timeline of 60 days is mandatory and may be exceeded only under extraordinary circumstances that exist with reference to a particular complaint. In Kentucky, the IDEA complaint provisions have been promulgated as regulations at 707 KAR 1:340, Section 15. Since the 1990’s, Kentucky has utilized an early complaint resolution process through which districts may investigate themselves when a formal written complaint is filed against them. The impetus behind this system was to allow districts an opportunity to resolve school-level problems of which the Director of Special Education (DoSE) was not previously aware. Under Kentucky’s complaint system, districts are given the option of investigating themselves and submitting a report to DECS of the investigation, findings and the corrective action plan, if needed. Upon receipt of the district report, the DECS investigator reviews the findings and takes additional evidence if needed. DECS then accepts the district investigation findings, accepts it in part or rejects the findings. If the district declines to investigate, the DECS investigator conducts an on-site visit. The early resolution process has been successful at resolving complaints without formal administrative action. As demonstrated by the FFY 2004 data, 20% of complaints (9 of 41 complaints) filed by parents were withdrawn before DECS issued its final report. As noted in Indicator 15, in 1999 the Office of Special Education Programs (OSEP) moved from its former system of strict compliance monitoring of SEAs to the Continuous Improvement Monitoring Process (CIMP), a system of monitoring for student outcomes. Kentucky submitted its initial CIMP Self-Assessment to OSEP in December 2001. In its Self-Assessment report, KDE found itself noncompliant in three areas of general supervision. One of the noncompliance areas was the Kentucky Department of Education’s (KDE) failure to comply with IDEA’s 60-day timeline for investigating and resolving complaints. KDE submitted an Improvement Plan to OSEP in 2002 based on the CIMP report.
In 2002, the KDE Office of Special Instructional Services (OSIS) moved the responsibility of complaint investigation from consultants within DECS to a newly hired attorney within the Office of Legal and Legislative Services (OLLS). The attorney had 20 years of experience in special education law and

SPP Part B: Indicator 16 Kentucky
Part B State Performance Plan: 2005-2010 Page 150 (OMB NO: 1820-0624 / Expiration Date: )
investigative experience. She was given responsibility for administering the due process hearing system and handling litigation for KDE, as well as investigating complaints.
By letter dated November 6, 2003, OSEP responded to Kentucky’s 2002 Improvement Plan. OSEP cited KDE in the same general supervision areas as set forth in the 2001 Self-Assessment report, including compliance with timelines for formal complaints. The letter required KDE to provide OSEP with progress reports in the areas of noncompliance. The progress reports were submitted to OSEP on January 31 and June 1, 2004. Also during this time period (March 30, 2004), KDE submitted its 2004 APR with FFY 2002 data on compliance with complaint resolution timelines. The FFY 2002 data showed that KDE’s percentage of timely complaint resolutions had risen to 55%, up from 41% in FFY 2001.
The data on complaint resolutions timelines in the June 1, 2004 Progress Report showed greater improvement in percentages for FFY 2003 than the previous year. For the first eleven months of FFY 2003, 30 of the 32 complaints were finalized within 60 days as required by law (94%). One complaint was late, due to exceptional circumstances that existed with respect to that complaint. One complaint was late when the attorney/ investigator retired and could not be replaced under state hiring procedures.
In OSEP’s Verification Visit letter of May 17, 2004, OSEP determined that KDE had corrected its failure to ensure that all complaints are resolved in a timely manner. Upon the retirement of the attorney/investigator in March 2004, a new attorney was hired as KDE complaint investigator in May 2004, also within OLLS. The job responsibilities of the attorney also included administration of due process hearings and mediations, as well as handling legal cases on behalf of KDE. On July 20, 2005, OSEP responded to Kentucky’s 2004 APR. OSEP noted KDE’s progress (from 41% in FFY 2001 to 55% in FFY 2002, to 94% for the first 11 months of FFY 2003) in resolving complaints in a timely manner. However, OSEP reversed its conclusion set forth in the May 2004 Verification Visit letter that Kentucky had corrected its failure to ensure that all complaints were resolved in a timely manner. OSEP advised KDE that it must demonstrate full compliance regarding timely resolution of complaints by December 2, 2005. In October 2005, the complaint investigation process was revised. Responsibility for complaint investigations was moved to the Division of Exceptional Children Services (DECS) from OLLS. This system is further described under “Review of Baseline Data.”
Baseline Data for FFY 2004 (2004-2005) including data from FFY 2003:
FFY Complaints with reports issued
Reports within timeline
Reports with extended timelines
Percentage resolved within 60- day timeline
2003 35 32 3 91%
2004 32 20 12 62.5%

SPP Part B: Indicator 16 Kentucky
Part B State Performance Plan: 2005-2010 Page 151 (OMB NO: 1820-0624 / Expiration Date: )
Discussion of Baseline Data:
FFY 2003 Data
In FFY 2003, 42 complaints were filed, of which 7 were pending within timelines on July 1, 2004. Of the 35 complaints which were finalized during 2003-2004:
• Thirty-two (32) were completed within the 60-day timeline (91%).
• In two cases, the timelines were briefly extended due to exceptional circumstances, namely, the parent submitted a response to the district investigation shortly before the expiration of the 60-day timeline. (These circumstances meet the definition of “exceptional circumstances” related to a particular complaint under IDEA but were not included in the baseline data as complaints being resolved within the 60-day timeline.)
• One complaint was late during the month and a half time period between the retirement of the attorney/ investigator and the arrival of the new investigator. During the lapse of time before the new attorney was hired, DECS staff undertook the complaint investigation responsibility in addition to their other duties. In its July 20, 2005 letter, OSEP has concluded, and DECS agrees, that this situation is not an “exceptional circumstance” related to a particular complaint.
FFY 2004 Data
During FFY 2004, 41 complaints were filed. 9 complaints were withdrawn prior to the 60-day timeline for resolution of formal complaints under IDEA. Of the 32 remaining complaints:
• Twenty (20) of 32 complaints were resolved within the 60-day timeline.
For the 12 complaints with reports submitted after 60 days:
• One was a class complaint
• Of the 11 remaining complaints, nine were extended to give the complainant additional time to respond to the district’s investigation,
• For the remaining two complaints, both were late, one by one day
Data from FFY 2004 indicate that the improvements made over the preceding two years were not systemic in nature. In September 2004, the DECS director realized the enormity of the investigative task and added an additional experienced DECS consultant to assist with the complaint investigation process. The consultant was assigned to review the entire complaint file after the district submitted its self-investigation. The DECS consultant reviewed the parent’s complaint and the district response and made initial recommendations in light of the parent’s allegations. The consultant also noted possible violations not originally alleged by the parents. The consultant forwarded her conclusions to the attorney for his review and final report.
When the current DECS director, Larry Taylor, began in July, 2005, one of his first priorities was to improve the way in which parent telephone calls and complaints were handled by DECS. Feeling that DECS needed to take responsibility for resolving parent complaints, Mr. Taylor revised the entire system of investigating formal and informal complaints, effective October 1, 2005. Two DECS consultants were assigned responsibility for investigating formal complaints. A uniform process was developed for initiating formal complaints, investigating complaints, writing the reports and obtaining legal clearance on the report from the DECS’ staff attorney prior to Mr. Taylor issuing the report. Stringent procedures have been developed to ensure that the 60-day timelines are met, including intermediate checkpoints along the process. Corrective Action Plans (CAPs) will also be included in this process and scrutinized to ensure that the one-year timelines for completion of the CAP are met.
In the past two months in which this system has been utilized, only two complaints have been filed with DECS. One was informally resolved and the other is pending within timelines.
One of Mr. Taylor’s goals in devising the new formal/ informal complaint process was to resolve parent issues with districts as effectively and expeditiously as possible in order to meet the needs of
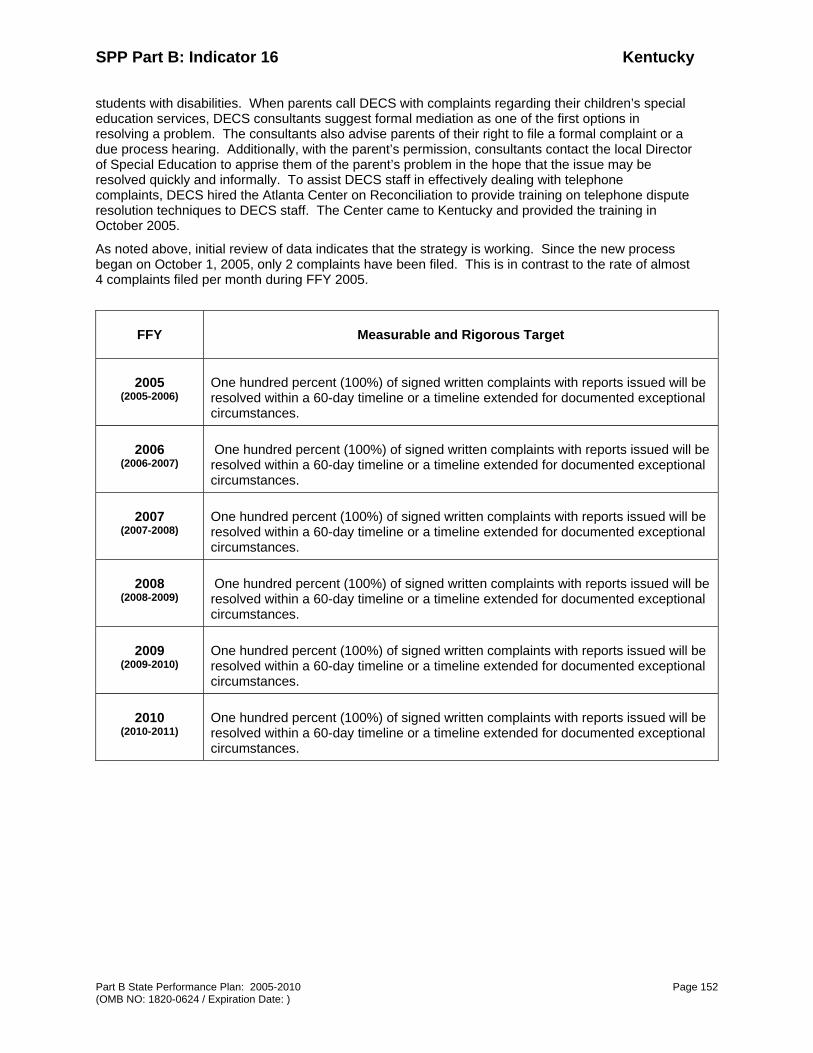
SPP Part B: Indicator 16 Kentucky
Part B State Performance Plan: 2005-2010 Page 152 (OMB NO: 1820-0624 / Expiration Date: )
students with disabilities. When parents call DECS with complaints regarding their children’s special education services, DECS consultants suggest formal mediation as one of the first options in resolving a problem. The consultants also advise parents of their right to file a formal complaint or a due process hearing. Additionally, with the parent’s permission, consultants contact the local Director of Special Education to apprise them of the parent’s problem in the hope that the issue may be resolved quickly and informally. To assist DECS staff in effectively dealing with telephone complaints, DECS hired the Atlanta Center on Reconciliation to provide training on telephone dispute resolution techniques to DECS staff. The Center came to Kentucky and provided the training in October 2005.
As noted above, initial review of data indicates that the strategy is working. Since the new process began on October 1, 2005, only 2 complaints have been filed. This is in contrast to the rate of almost 4 complaints filed per month during FFY 2005.
FFY Measurable and Rigorous Target
2005 (2005-2006)
One hundred percent (100%) of signed written complaints with reports issued will be resolved within a 60-day timeline or a timeline extended for documented exceptional circumstances.
2006 (2006-2007)
One hundred percent (100%) of signed written complaints with reports issued will be resolved within a 60-day timeline or a timeline extended for documented exceptional circumstances.
2007 (2007-2008)
One hundred percent (100%) of signed written complaints with reports issued will be resolved within a 60-day timeline or a timeline extended for documented exceptional circumstances.
2008 (2008-2009)
One hundred percent (100%) of signed written complaints with reports issued will be resolved within a 60-day timeline or a timeline extended for documented exceptional circumstances.
2009 (2009-2010)
One hundred percent (100%) of signed written complaints with reports issued will be resolved within a 60-day timeline or a timeline extended for documented exceptional circumstances.
2010 (2010-2011)
One hundred percent (100%) of signed written complaints with reports issued will be resolved within a 60-day timeline or a timeline extended for documented exceptional circumstances.

SPP Part B: Indicator 16 Kentucky
Part B State Performance Plan: 2005-2010 Page 153 (OMB NO: 1820-0624 / Expiration Date: )
Improvement Activities/Timelines/Resources:
Activity Timeline Resources
1. DECS will monitor complaint timelines on an on-going basis and assign additional staff, If needed, to investigate complaints.
December 2005
On-going
DECS
2. DECS Director will require written justification from the investigators explaining the “exceptional circumstance” prior to extending the timelines for complaints.
December 2005
On-going
DECS
3. DECS will update its database to track on-going timelines for formal complaints. The database will include mechanisms for tracking the timeliness of DECS’ investigation and ensuring completion of the Corrective Action Plan by the district within one year.
Timelines will be monitored at multiple points within the process.
By January 2006 - 2011 DECS
4. KDE will obtain complaint investigator training for new investigators.
By May 2006 DECS
Kevin McDowell, Indiana Department of Education
SPP Part B: Indicator 17 Kentucky
Part B State Performance Plan: 2005-2010 Page 154 (OMB NO: 1820-0624 / Expiration Date: )
Part B State Performance Plan (SPP) for 2005-2010
Overview of the State Performance Plan Development (see introduction):
Monitoring Priority: Effective General Supervision Part B / General Supervision
Indicator 17: Percent of fully adjudicated due process hearing requests that were fully adjudicated within the 45-day timeline or a timeline that is properly extended by the hearing officer at the request of either party.
(20 U.S.C. 1416(a)(3)(B))
Measurement: Percent = (3.2(a) + 3.2(b)) divided by (3.2) times 100.
Overview of Issue/Description of System or Process:
Federal law sets forth the timeline under IDEA for the resolution of due process hearings. A hearing decision is to be rendered within 45 days of the hearing request, unless the hearing officer has granted a specific extension of time at the request of either party. 34 CFR 300.511. During the late 1990s, OSEP moved from its former system of strict compliance monitoring of State Education Agencies (SEAs) to a system of monitoring for outcomes, as set forth in the Continuous Improvement Monitoring Process (CIMP). Kentucky submitted its initial CIMP Self-Assessment to OSEP in December 2001. In its Self-Assessment report, KDE found itself noncompliant in three areas of general supervision. One area was timely resolution of due process hearings. As noted above, IDEA imposes a timeline of 45 days for hearings to be completed. Any extension of the 45 days timeline must be at the request of the parties and granted by the hearing officer for a specific period of time. The Self-Assessment found that hearing officers did not always document extensions of the 45-day timeline. In 2002, Kentucky developed an Improvement Plan to address this area of IDEA non-compliance. In its November 6, 2003 response to KDE’s CIMP Improvement Plan, OSEP also found KDE noncompliant in the same three areas of general supervision which were identified by the CIMP Self-Assessment. In the area of due process hearing timelines, OSEP found:
Kentucky’s Self-Assessment included data indicating that hearings are not completed within 45 days and specific extensions of time at the request of either party and granted by the hearing officer are not documented…
KDE submitted its 2004 APR (FFY 2002) to OSEP on March 30, 2004. As set forth in the 2004 APR:
During 2002-2003, nineteen hearings were resolved, with the remainder pending within timelines agreed to or requested by the parties. Of the nineteen resolved, 63% were timely resolved, (12 of 19), 5% (1 of 19) were one day late and 32% (6 of 19) were more than one day late. This was a decrease from 2001-01 in which 71% were timely resolved. [See the chart below for 2004 APR data submitted to OSEP.] Of the 6 hearings that were more than 1 day overdue, 2 parents withdrew their hearing requests. DECS declined to renew the contract of one hearing officer who was perpetually late with his decisions and began monitoring another hearing officer’s cases as well as limiting his assignments.
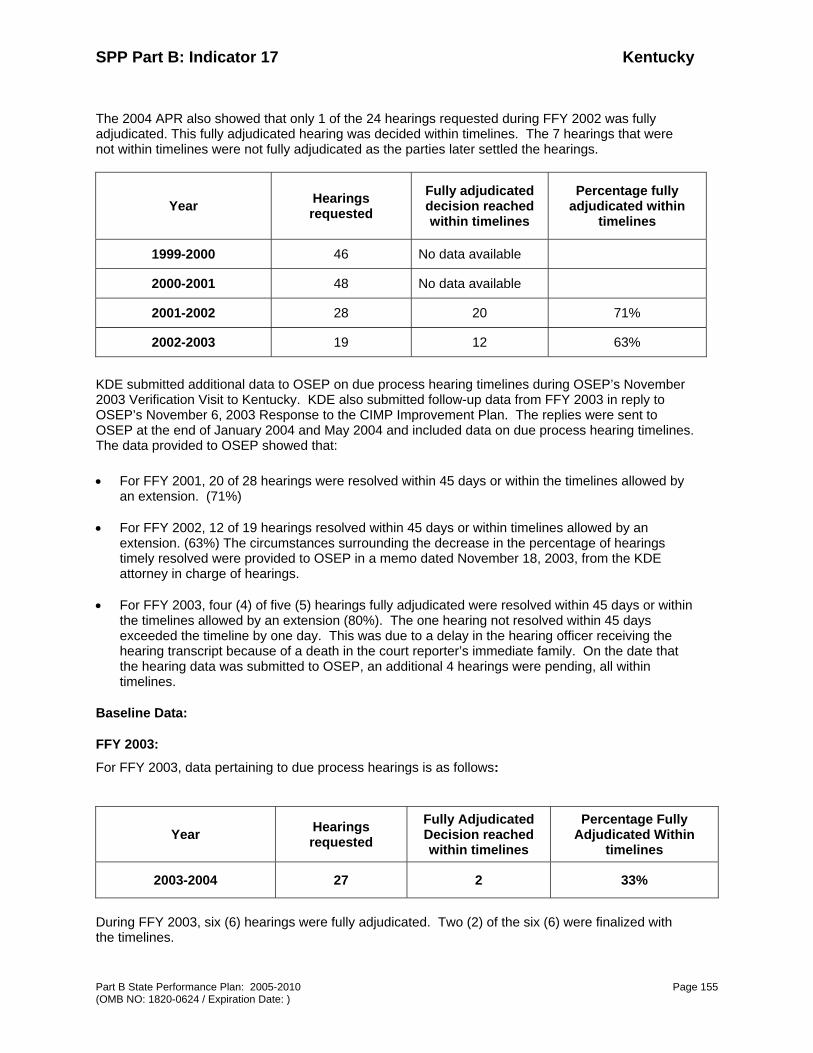
SPP Part B: Indicator 17 Kentucky
Part B State Performance Plan: 2005-2010 Page 155 (OMB NO: 1820-0624 / Expiration Date: )
The 2004 APR also showed that only 1 of the 24 hearings requested during FFY 2002 was fully adjudicated. This fully adjudicated hearing was decided within timelines. The 7 hearings that were not within timelines were not fully adjudicated as the parties later settled the hearings.
Year Hearings requested
Fully adjudicated decision reached within timelines
Percentage fully adjudicated within
timelines
1999-2000 46 No data available
2000-2001 48 No data available
2001-2002 28 20 71%
2002-2003 19 12 63%
KDE submitted additional data to OSEP on due process hearing timelines during OSEP’s November 2003 Verification Visit to Kentucky. KDE also submitted follow-up data from FFY 2003 in reply to OSEP’s November 6, 2003 Response to the CIMP Improvement Plan. The replies were sent to OSEP at the end of January 2004 and May 2004 and included data on due process hearing timelines. The data provided to OSEP showed that: • For FFY 2001, 20 of 28 hearings were resolved within 45 days or within the timelines allowed by
an extension. (71%)
• For FFY 2002, 12 of 19 hearings resolved within 45 days or within timelines allowed by an extension. (63%) The circumstances surrounding the decrease in the percentage of hearings timely resolved were provided to OSEP in a memo dated November 18, 2003, from the KDE attorney in charge of hearings.
• For FFY 2003, four (4) of five (5) hearings fully adjudicated were resolved within 45 days or within the timelines allowed by an extension (80%). The one hearing not resolved within 45 days exceeded the timeline by one day. This was due to a delay in the hearing officer receiving the hearing transcript because of a death in the court reporter’s immediate family. On the date that the hearing data was submitted to OSEP, an additional 4 hearings were pending, all within timelines.
Baseline Data:
FFY 2003:
For FFY 2003, data pertaining to due process hearings is as follows:
Year Hearings requested
Fully Adjudicated Decision reached within timelines
Percentage Fully Adjudicated Within
timelines
2003-2004 27 2 33%
During FFY 2003, six (6) hearings were fully adjudicated. Two (2) of the six (6) were finalized with the timelines.
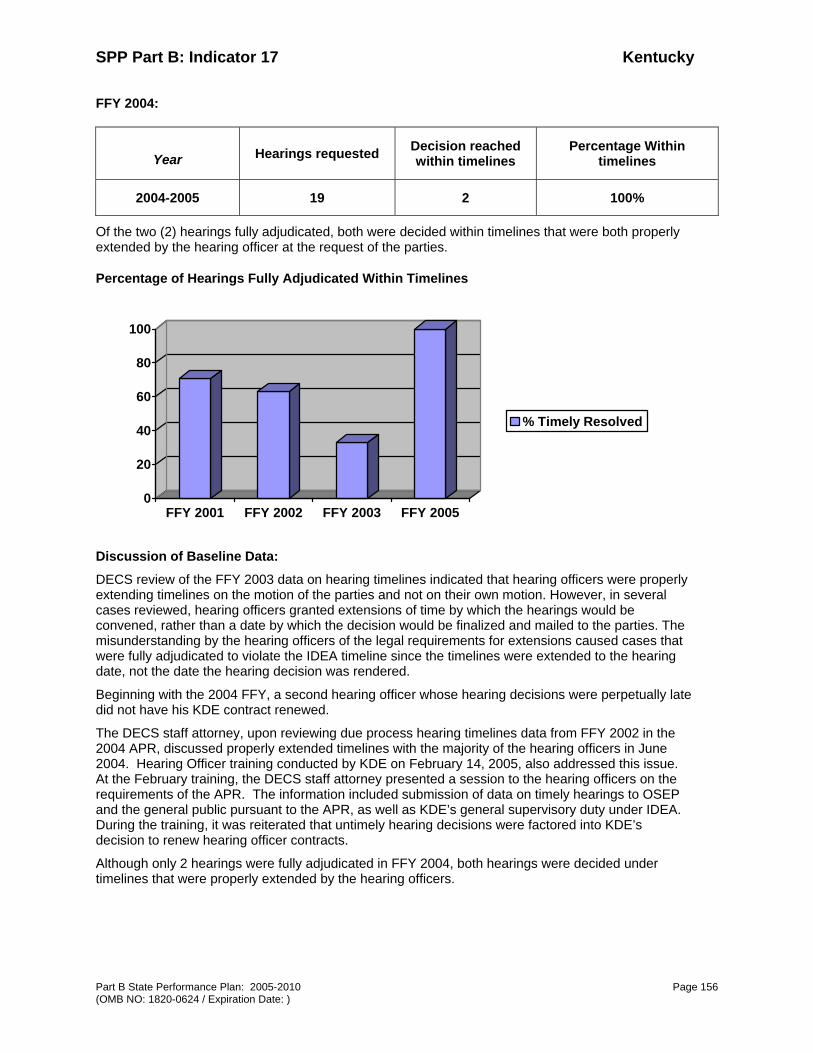
SPP Part B: Indicator 17 Kentucky
Part B State Performance Plan: 2005-2010 Page 156 (OMB NO: 1820-0624 / Expiration Date: )
FFY 2004:
Year Hearings requested Decision reached within timelines
Percentage Within timelines
2004-2005 19 2 100%
Of the two (2) hearings fully adjudicated, both were decided within timelines that were both properly extended by the hearing officer at the request of the parties.
Percentage of Hearings Fully Adjudicated Within Timelines
0
20
40
60
80
100
FFY 2001 FFY 2002 FFY 2003 FFY 2005
% Timely Resolved
Discussion of Baseline Data:
DECS review of the FFY 2003 data on hearing timelines indicated that hearing officers were properly extending timelines on the motion of the parties and not on their own motion. However, in several cases reviewed, hearing officers granted extensions of time by which the hearings would be convened, rather than a date by which the decision would be finalized and mailed to the parties. The misunderstanding by the hearing officers of the legal requirements for extensions caused cases that were fully adjudicated to violate the IDEA timeline since the timelines were extended to the hearing date, not the date the hearing decision was rendered.
Beginning with the 2004 FFY, a second hearing officer whose hearing decisions were perpetually late did not have his KDE contract renewed.
The DECS staff attorney, upon reviewing due process hearing timelines data from FFY 2002 in the 2004 APR, discussed properly extended timelines with the majority of the hearing officers in June 2004. Hearing Officer training conducted by KDE on February 14, 2005, also addressed this issue. At the February training, the DECS staff attorney presented a session to the hearing officers on the requirements of the APR. The information included submission of data on timely hearings to OSEP and the general public pursuant to the APR, as well as KDE’s general supervisory duty under IDEA. During the training, it was reiterated that untimely hearing decisions were factored into KDE’s decision to renew hearing officer contracts.
Although only 2 hearings were fully adjudicated in FFY 2004, both hearings were decided under timelines that were properly extended by the hearing officers.
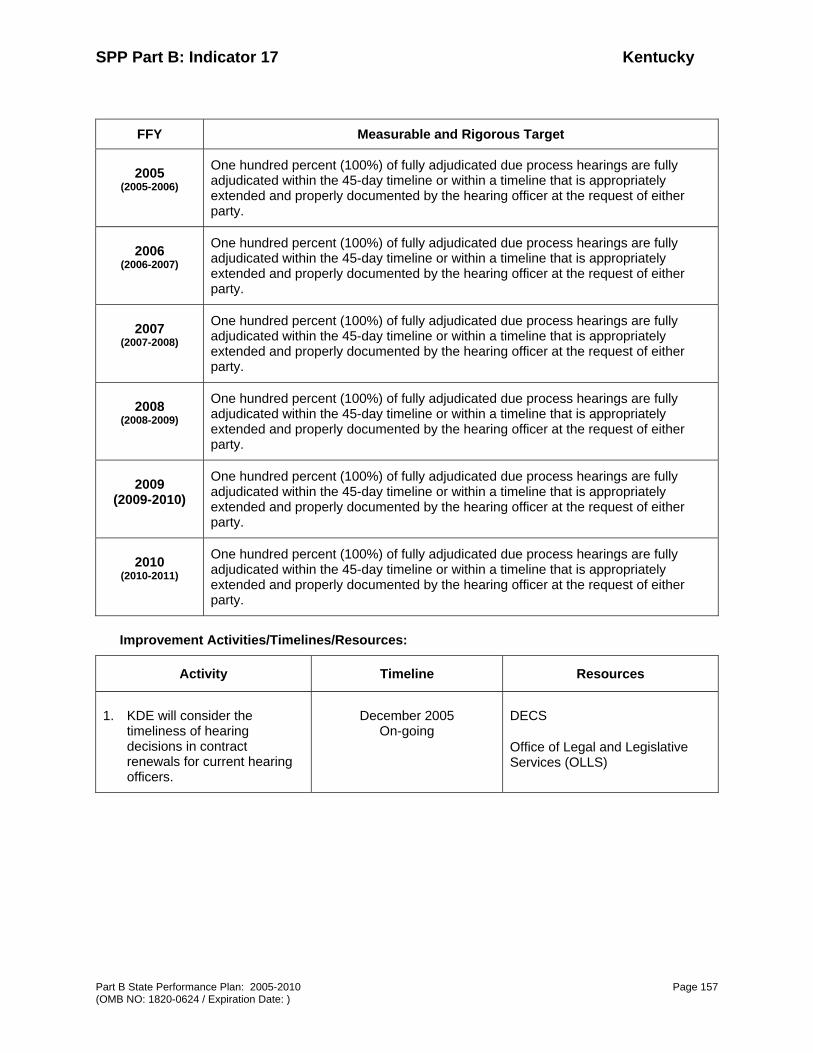
SPP Part B: Indicator 17 Kentucky
Part B State Performance Plan: 2005-2010 Page 157 (OMB NO: 1820-0624 / Expiration Date: )
FFY Measurable and Rigorous Target
2005 (2005-2006)
One hundred percent (100%) of fully adjudicated due process hearings are fully adjudicated within the 45-day timeline or within a timeline that is appropriately extended and properly documented by the hearing officer at the request of either party.
2006 (2006-2007)
One hundred percent (100%) of fully adjudicated due process hearings are fully adjudicated within the 45-day timeline or within a timeline that is appropriately extended and properly documented by the hearing officer at the request of either party.
2007 (2007-2008)
One hundred percent (100%) of fully adjudicated due process hearings are fully adjudicated within the 45-day timeline or within a timeline that is appropriately extended and properly documented by the hearing officer at the request of either party.
2008 (2008-2009)
One hundred percent (100%) of fully adjudicated due process hearings are fully adjudicated within the 45-day timeline or within a timeline that is appropriately extended and properly documented by the hearing officer at the request of either party.
2009 (2009-2010)
One hundred percent (100%) of fully adjudicated due process hearings are fully adjudicated within the 45-day timeline or within a timeline that is appropriately extended and properly documented by the hearing officer at the request of either party.
2010 (2010-2011)
One hundred percent (100%) of fully adjudicated due process hearings are fully adjudicated within the 45-day timeline or within a timeline that is appropriately extended and properly documented by the hearing officer at the request of either party.
Improvement Activities/Timelines/Resources:
Activity Timeline Resources
1. KDE will consider the timeliness of hearing decisions in contract renewals for current hearing officers.
December 2005 On-going
DECS
Office of Legal and Legislative Services (OLLS)

SPP Part B: Indicator 17 Kentucky
Part B State Performance Plan: 2005-2010 Page 158 (OMB NO: 1820-0624 / Expiration Date: )
Activity Timeline Resources
2. DECS will update its electronic database to track on-going timelines for due process hearings. The database will include a section to enter data on extensions of the 60-day timeline issued by hearing officers, and will automatically track whether the hearing is finalized by the set timelines.
January 2006 - 2011
DECS
3. The Office of Legal and Legislative Services (OLLS) in conjunction with DECS will continue annual training of hearing officers on the requirements of the APR and SPP regarding timely adjudication of hearings.
January 2006 - 2011 DECS
OLLS

SPP Part B: Indicator 18 Kentucky
Part B State Performance Plan: 2005-2010 Page 159 (OMB NO: 1820-0624 / Expiration Date: )
Part B State Performance Plan (SPP) for 2005-2010
Overview of the State Performance Plan Development (see introduction):
Monitoring Priority: Effective General Supervision Part B / General Supervision
Indicator 18: Percent of hearing requests that went to resolution sessions that were resolved through resolution session settlement agreements.
(20 U.S.C. 1416(a)(3(B))
Measurement: Percent = 3.1(a) divided by (3.1) times 100.
Overview of Issue/Description of System or Process:
The 2004 IDEA Reauthorization amended IDEA provisions regarding due process hearings. The Reauthorization requires resolution sessions to be convened at the school district level once a due process hearing is requested, unless both parties waive the requirement. As this new requirement did not go into effect until July 1, 2005, no resolution sessions were convened during FFY 2004 in Kentucky.
Traditionally, Kentucky’s formal dispute mechanisms (due process hearings, formal complaints and mediations) that resolve IDEA disagreements between parents and school districts are not heavily utilized. Since FFY 2000, the number of hearings requested has steadily declined, from a high of 48 hearings requested in FFY 2000 to a low of 19 hearings requested in FFY 2002. During FFY 2004, 19 hearings were requested. Of the 19 hearings, only 2 hearings were fully adjudicated. The remainder were settled prior to adjudication. Thus resolution sessions appear to have great promise in Kentucky as an additional tool to help parents and districts reach agreement without resorting to the time and expense of a formal administrative hearing.
DECS consulted with the State Advisory Panel for Exceptional Children Services (SAPEC) in October 2006 and again in January 2007, , to obtain its recommendations on the setting of Targets for Indicator 18. Indicator Targets were set from the input given by the SAPEC. Input on Activities was also obtained from the SAPEC by DECS and was utilized by DECS in the development of the Activities listed below.
Baseline Data for FFY 2005 (2005-2006): 68% of hearing requests (11 of 16 hearings requested ) that went to resolution sessions were resolved through resolution session settlement agreements.
Note: The three (3) hearing requests, which were resolved prior to the convening of the resolution sessions, were not counted as unsuccessful resolution sessions for the purpose of establishing the baseline data.
Discussion of Baseline Data:
As noted above, during FFY 2005 (July 1, 2005 though June 30, 2006) KDE received 19 due process hearing requests. Of those 19 potential hearings, all but 3 were resolved, either through resolution sessions, mediation or informal settlement at the district level. The data show the following information:
• 3 hearing requests were resolved or taken to mediation prior to the resolution session being
convened.

SPP Part B: Indicator 18 Kentucky
Part B State Performance Plan: 2005-2010 Page 160 (OMB NO: 1820-0624 / Expiration Date: )
• 11 hearing requests were resolved by resolution agreements. • 5 hearings requests were not resolved through resolution sessions. However, 2 were later
resolved through settlement agreements between the parties.
Of the three (3) hearings that were not resolved through the process of resolution session, mediation or settlement:
• One was dismissed by order of the hearing officer. • One was fully adjudicated. • One hearing is pending.
FFY Measurable and Rigorous Target
2006 (2006-2007)
Seventy percent (70%) of hearing requests that went to resolution sessions are resolved through resolution session settlement agreements.
2007 (2007-2008)
Seventy-three percent (73%) of hearing requests that went to resolution sessions are resolved through resolution session settlement agreements.
2008 (2008-2009)
Seventy-five percent (75%) of hearing requests that went to resolution sessions are resolved through resolution session settlement agreements.
Number of Hearing Requests that were Resolved Through Resolution Sessions
Agreements of 19 Requests
1132 3
Resolved Through Resolution session Agreements
Resolved Prior to Resolution Sessions
Resolved Through Agreement After UnsuccessfulResolution SessionNot Resolved
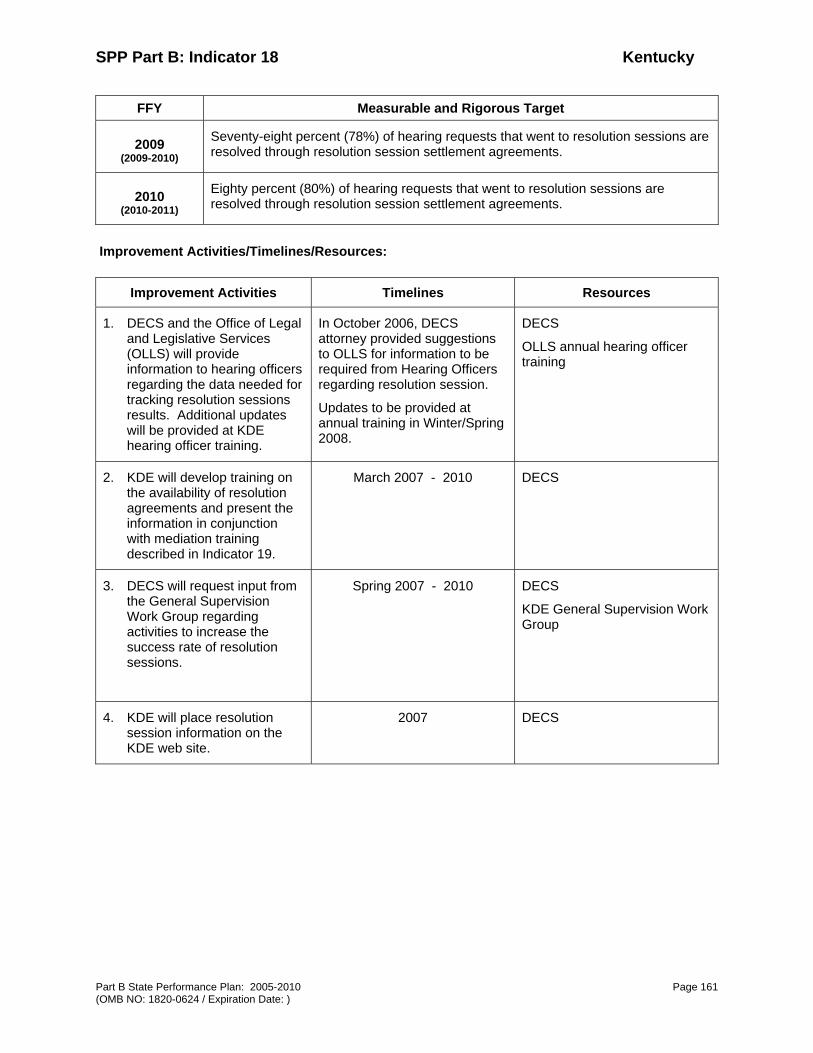
SPP Part B: Indicator 18 Kentucky
Part B State Performance Plan: 2005-2010 Page 161 (OMB NO: 1820-0624 / Expiration Date: )
FFY Measurable and Rigorous Target
2009 (2009-2010)
Seventy-eight percent (78%) of hearing requests that went to resolution sessions are resolved through resolution session settlement agreements.
2010 (2010-2011)
Eighty percent (80%) of hearing requests that went to resolution sessions are resolved through resolution session settlement agreements.
Improvement Activities/Timelines/Resources:
Improvement Activities Timelines Resources
1. DECS and the Office of Legal and Legislative Services (OLLS) will provide information to hearing officers regarding the data needed for tracking resolution sessions results. Additional updates will be provided at KDE hearing officer training.
In October 2006, DECS attorney provided suggestions to OLLS for information to be required from Hearing Officers regarding resolution session.
Updates to be provided at annual training in Winter/Spring 2008.
DECS
OLLS annual hearing officer training
2. KDE will develop training on the availability of resolution agreements and present the information in conjunction with mediation training described in Indicator 19.
March 2007 - 2010 DECS
3. DECS will request input from the General Supervision Work Group regarding activities to increase the success rate of resolution sessions.
Spring 2007 - 2010 DECS
KDE General Supervision Work Group
4. KDE will place resolution session information on the KDE web site.
2007 DECS
SPP Part B: Indicator 19 Kentucky
Part B State Performance Plan: 2005-2010 Page 162 (OMB NO: 1820-0624 / Expiration Date: )
Part B State Performance Plan (SPP) for 2005-2010
Overview of the State Performance Plan Development (see introduction):
Monitoring Priority: Effective General Supervision Part B / General Supervision
Indicator 19: Percent of mediations held that resulted in mediation agreements.
(20 U.S.C. 1416(a)(3)(B))
Measurement: Percent = (2.1(a)(i) + 2.1(b)(i)) divided by (2.1) times 100.
Overview of Issue/Description of System or Process:
Kentucky’s mediation system for resolving IDEA disputes has been in place since the early 1990’s. Kentucky’s mediators are selected through a Request For Proposal (RFP) for Services issued by KDE. The RFP sets forth mediator qualifications and the criteria by which the candidates will be evaluated. Potential mediators submit applications to KDE. Mediators who are chosen are hired through a personal services contract with KDE.
The 2004 APR included a review of mediation data beginning in FFY 1999 through FFY 2002. The data showed a substantial decline in requests for mediation during that time period. A high of 33 mediations were requested in FFY 1999, with a decrease to18 mediations requested in FFY 2000, and an slight increase to 19 mediation requests in FFY 2001. In FFY 2002, the number of mediations requested decreased to 12. This is consistent with Kentucky’s overall decline in the number of IDEA dispute resolution procedures (hearings, complaints and mediations) since 1999-2000.
As reported in the 2004 APR, of the 12 mediations requested, 8 resulted in agreements, with 4 mediations pending at the end of the FFY for a success rate of 75%. The 2004 APR did not require specific targets or activities with regard to the area of mediation. However, as a result of the 2004 APR, DECS staff began to identify ways to increase awareness of mediation as an alternative to formal disputes. Training which DECS secured through the Atlanta Center for Reconciliation in August 2004 resulted in four DECS staff becoming certified in the process of Reconciliation Mediation (the system of mediation used in Kentucky). Information on the benefits of Reconciliation Mediation was shared with the Director of Special Education listserv via DECS’ electronic newsletter, E ‘Specially DECS.
An outcome of the newsletter article was the collaboration between the DECS staff attorney and a Director of Special Education in jointly developing training entitled Developing a Mediation Mentality. The goal of the training was to emphasize the dual purpose of Reconciliation Mediation, since correctly utilized, it is a tool that fosters a positive working relationship between parents and school districts in addition to resolving IDEA disputes. The training was presented at the November 2004 Council for Exceptional Children (CEC) Conference and the February 2005 Parent/ Professional Conference. Approximately 60 teachers, parents, and administrators attended these sessions. Both of these events took place after the end of the 2003 FFY.
Data collected for the 2005 APR from FFY 2003 (July 1, 2003 to June 30, 2004) showed a decrease in mediation requests from 12 to 9, with the number resolved through agreement dropping from 75% to 66% percent. In FFY 2004, after the publication of the E ’Specially DECS article and the presentation, Developing a Mediation Mentality at the CEC and Parent/Professional conferences, the number of mediations requested rose from 9 to 13. If the numbers of mediations requested during
SPP Part B: Indicator 19 Kentucky
Part B State Performance Plan: 2005-2010 Page 163 (OMB NO: 1820-0624 / Expiration Date: )
the first quarter of the current year keep pace with the first quarter, another slight increase in the number of mediations requested will be recorded in FFY 2005.
Baseline Data for FFY 2003 (2003- 04):
In FFY 2003, 9 mediations were requested, with 3 related to hearings and 6 unrelated to hearings.
All 3 hearing-related mediations were resolved by agreement. 3 of the 6 non- hearings mediations were resolved by agreement, with 1 pending at the end of the FFY.
66% of the total mediations requested (6 of 9) were resolved through mediation agreements.
Baseline Data for FFY 2004 (2004-05):
13 mediations were requested.
7 reached agreements. (53.8%)
The remaining 6 mediations resulted in no agreements reached. (46.2%)
Of the 13 mediations requested, 4 were related to hearing requests. 2 of the 4 were resolved by agreement.
Baseline Data for FFY 2005 (July 1 – October 31, 2005)
For the first four months of FFY 2005, 5 mediations were requested, with 2 being successfully resolved through agreement. One case was resolved prior to the formal mediation. Of the two mediations remaining, one mediation was unsuccessful and one mediation is currently pending.
Discussion of Baseline Data:
KDE consulted the State Advisory Panel for Exceptional Children (SAPEC) regarding Measurable and Rigorous Targets and Activities for Indicator 19. The Panel also concluded the mediation process is significantly under-utilized. This conclusion comports with data from the Consortium for Appropriate Dispute Resolution (CADRE) showing that Kentucky is one of the lowest users of mediations among states within the nation.
The SAPEC’s analysis of the data indicated that the low number of mediations, combined with fluctuations in the number of agreements reached, significantly affect the percentages of disputes resolved through agreement. (See baseline data for FFY 2003 and FFY 2004.) Although much of the SAPEC’s concern focused on the small number of mediations in Kentucky, input from the SAPEC on Targets focused solely on the Indicator, i.e., increasing the number of mediations resolved by agreement. At the behest of the SAPEC, Activities focus both on increasing the number of mediations resolved by mediation agreements and increasing the number of mediations requested.
The final Target for 2011 was set at 85%. This percentage was chosen based on the October 26, 2005 OSEP Technical Assistance teleconference, in which the presenters noted that 85% of mediation resolved by agreement was an acceptable target. Kentucky’s rate of mediation agreements has gone steadily down, from a high of 75% in FFY 2002, to 66% in FFY 2003 to the current rate of 53.8%. Due to the small numbers of mediations requested, the downward trend in the data is not felt to be a reliable indicator of future success in resolving mediations by agreement.
The Measurable and Rigorous Targets reflect a small increase in percentages of mediations resolved for the first two years of the SPP, with larger increases projected for the final four years of the SPP. Most Activities that concentrate on increasing the utilization rate of mediations will not affect the number of mediations resolved by agreement. Since the Activities that focus on increasing the numbers of mediation agreements reached are complex, these activities will take longer to achieve results.

SPP Part B: Indicator 19 Kentucky
Part B State Performance Plan: 2005-2010 Page 164 (OMB NO: 1820-0624 / Expiration Date: )
Number of Mediations Requested
Percentage of Mediations Resulting in Mediation Agreements
0
5
10
15
20
25
30
35
FFY1999
FFY2000
FFY2001
FFY2002
FFY2003
FFY2004
Requested Mediations
0
10
20
30
40
50
60
70
FFY1999
FFY2000
FFY2001
FFY2002
FFY2003
FFY2004
% Resulting in MediationAgreement
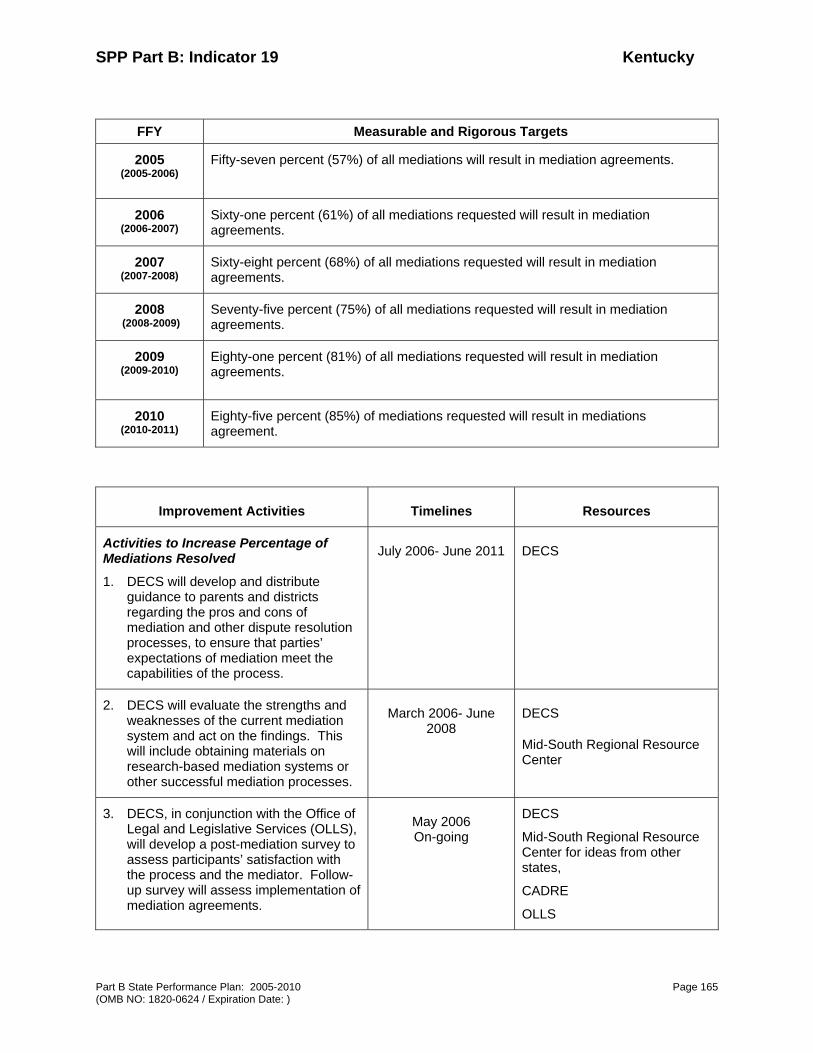
SPP Part B: Indicator 19 Kentucky
Part B State Performance Plan: 2005-2010 Page 165 (OMB NO: 1820-0624 / Expiration Date: )
FFY Measurable and Rigorous Targets
2005 (2005-2006)
Fifty-seven percent (57%) of all mediations will result in mediation agreements.
2006 (2006-2007)
Sixty-one percent (61%) of all mediations requested will result in mediation agreements.
2007 (2007-2008)
Sixty-eight percent (68%) of all mediations requested will result in mediation agreements.
2008 (2008-2009)
Seventy-five percent (75%) of all mediations requested will result in mediation agreements.
2009 (2009-2010)
Eighty-one percent (81%) of all mediations requested will result in mediation agreements.
2010 (2010-2011)
Eighty-five percent (85%) of mediations requested will result in mediations agreement.
Improvement Activities Timelines Resources
Activities to Increase Percentage of Mediations Resolved
1. DECS will develop and distribute guidance to parents and districts regarding the pros and cons of mediation and other dispute resolution processes, to ensure that parties’ expectations of mediation meet the capabilities of the process.
July 2006- June 2011 DECS
2. DECS will evaluate the strengths and weaknesses of the current mediation system and act on the findings. This will include obtaining materials on research-based mediation systems or other successful mediation processes.
March 2006- June 2008
DECS
Mid-South Regional Resource Center
3. DECS, in conjunction with the Office of Legal and Legislative Services (OLLS), will develop a post-mediation survey to assess participants’ satisfaction with the process and the mediator. Follow-up survey will assess implementation of mediation agreements.
May 2006 On-going
DECS
Mid-South Regional Resource Center for ideas from other states,
CADRE
OLLS
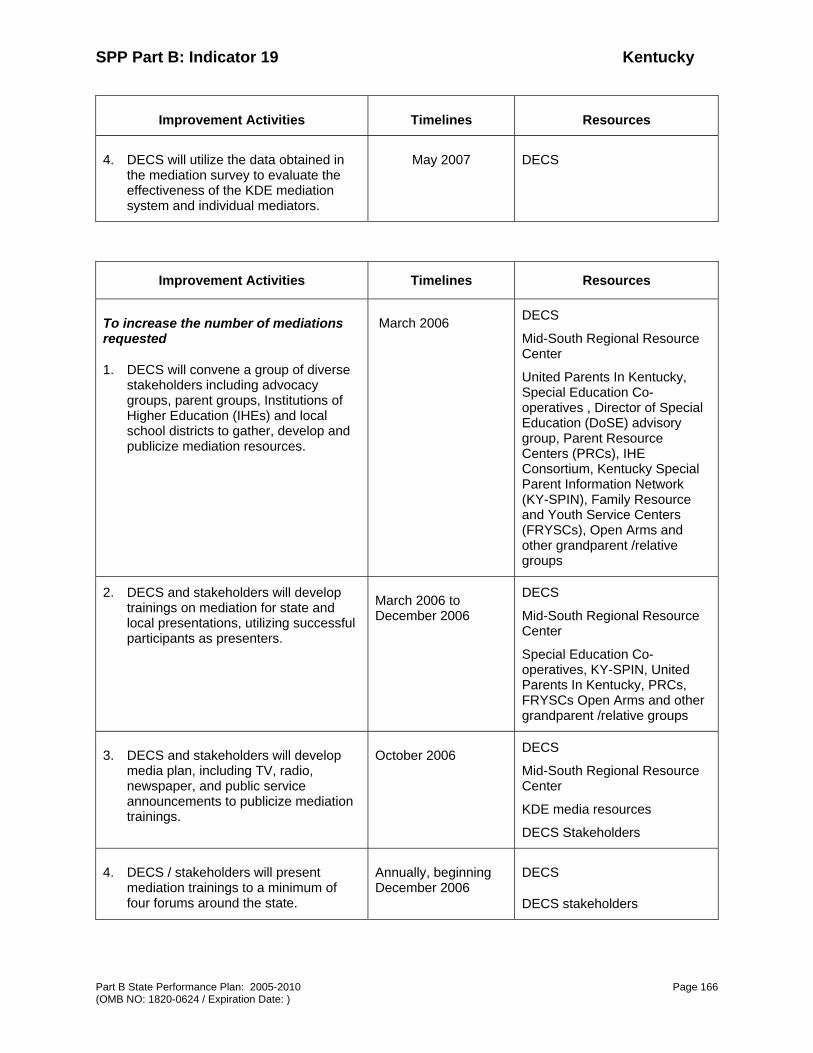
SPP Part B: Indicator 19 Kentucky
Part B State Performance Plan: 2005-2010 Page 166 (OMB NO: 1820-0624 / Expiration Date: )
Improvement Activities Timelines Resources
4. DECS will utilize the data obtained in the mediation survey to evaluate the effectiveness of the KDE mediation system and individual mediators.
May 2007 DECS
Improvement Activities Timelines Resources
To increase the number of mediations requested
1. DECS will convene a group of diverse stakeholders including advocacy groups, parent groups, Institutions of Higher Education (IHEs) and local school districts to gather, develop and publicize mediation resources.
March 2006
DECS
Mid-South Regional Resource Center
United Parents In Kentucky, Special Education Co-operatives , Director of Special Education (DoSE) advisory group, Parent Resource Centers (PRCs), IHE Consortium, Kentucky Special Parent Information Network (KY-SPIN), Family Resource and Youth Service Centers (FRYSCs), Open Arms and other grandparent /relative groups
2. DECS and stakeholders will develop trainings on mediation for state and local presentations, utilizing successful participants as presenters.
March 2006 to December 2006
DECS
Mid-South Regional Resource Center
Special Education Co-operatives, KY-SPIN, United Parents In Kentucky, PRCs, FRYSCs Open Arms and other grandparent /relative groups
3. DECS and stakeholders will develop media plan, including TV, radio, newspaper, and public service announcements to publicize mediation trainings.
October 2006 DECS
Mid-South Regional Resource Center
KDE media resources
DECS Stakeholders
4. DECS / stakeholders will present mediation trainings to a minimum of four forums around the state.
Annually, beginning December 2006
DECS
DECS stakeholders

SPP Part B: Indicator 19 Kentucky
Part B State Performance Plan: 2005-2010 Page 167 (OMB NO: 1820-0624 / Expiration Date: )
Improvement Activities Timelines Resources
5. KDE will distribute paper copies or web site address of Special Education Mediation, A Guide for Parents to parent groups.
September 2006 DECS
Alliance /CADRE materials
6. DECS will distribute video on mediation process to Parent Resource Centers, special education co-operatives, and statewide parent groups or publicize web site address with information regarding web access to the materials.
September 2006 DECS
Parent Advocacy Coalition for Educational Rights (PACER) and CADRE video
7. DECS will a develop mediation packet for distribution to parents/guardians at transition points (Part C to B, preschool to Kindergarten, middle to high school Individual Graduation Plan meetings).
May 2007 -June 2011 DECS
First Steps, Head Start, PRCs, FRYSCs, Inter-agency Transition Project, Kentucky Early Childhood Transition Project (KECTP)
8. DECS staff will present on the topic of mediation with current or former mediators at the 2006 Parent/ Professional Conference, 2006 Regional Training Center Conference, the 2007 Head Start conference and the 2007 CEC Conference.
September 200,
February 2007
June 2007
November 2007
DECS
Kentucky IDEA mediators
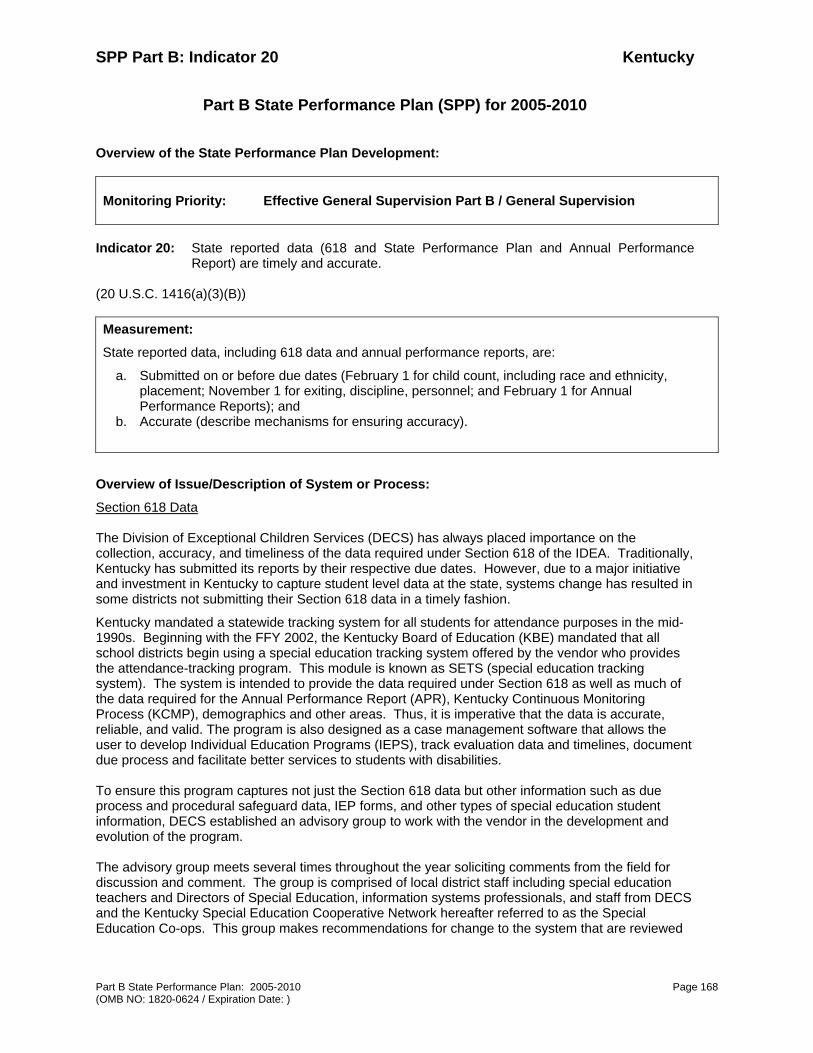
SPP Part B: Indicator 20 Kentucky
Part B State Performance Plan: 2005-2010 Page 168 (OMB NO: 1820-0624 / Expiration Date: )
Part B State Performance Plan (SPP) for 2005-2010
Overview of the State Performance Plan Development:
Monitoring Priority: Effective General Supervision Part B / General Supervision
Indicator 20: State reported data (618 and State Performance Plan and Annual Performance
Report) are timely and accurate. (20 U.S.C. 1416(a)(3)(B)) Measurement:
State reported data, including 618 data and annual performance reports, are:
a. Submitted on or before due dates (February 1 for child count, including race and ethnicity, placement; November 1 for exiting, discipline, personnel; and February 1 for Annual Performance Reports); and
b. Accurate (describe mechanisms for ensuring accuracy).
Overview of Issue/Description of System or Process:
Section 618 Data The Division of Exceptional Children Services (DECS) has always placed importance on the collection, accuracy, and timeliness of the data required under Section 618 of the IDEA. Traditionally, Kentucky has submitted its reports by their respective due dates. However, due to a major initiative and investment in Kentucky to capture student level data at the state, systems change has resulted in some districts not submitting their Section 618 data in a timely fashion.
Kentucky mandated a statewide tracking system for all students for attendance purposes in the mid-1990s. Beginning with the FFY 2002, the Kentucky Board of Education (KBE) mandated that all school districts begin using a special education tracking system offered by the vendor who provides the attendance-tracking program. This module is known as SETS (special education tracking system). The system is intended to provide the data required under Section 618 as well as much of the data required for the Annual Performance Report (APR), Kentucky Continuous Monitoring Process (KCMP), demographics and other areas. Thus, it is imperative that the data is accurate, reliable, and valid. The program is also designed as a case management software that allows the user to develop Individual Education Programs (IEPS), track evaluation data and timelines, document due process and facilitate better services to students with disabilities. To ensure this program captures not just the Section 618 data but other information such as due process and procedural safeguard data, IEP forms, and other types of special education student information, DECS established an advisory group to work with the vendor in the development and evolution of the program. The advisory group meets several times throughout the year soliciting comments from the field for discussion and comment. The group is comprised of local district staff including special education teachers and Directors of Special Education, information systems professionals, and staff from DECS and the Kentucky Special Education Cooperative Network hereafter referred to as the Special Education Co-ops. This group makes recommendations for change to the system that are reviewed

SPP Part B: Indicator 20 Kentucky
Part B State Performance Plan: 2005-2010 Page 169 (OMB NO: 1820-0624 / Expiration Date: )
by DECS and Kentucky Department of Education (KDE) leadership and are then submitted to the vendor for modification to the product annually. In addition to making modification requests, the advisory group also works with staff from the vendor to determine training needs and objectives. The vendor provides training agendas and plans with the group for review and approval prior to actual training of the system. Once approved, the vendor works with the KDE to establish two series of trainings for the various student information system (SIS) products including SETS and the attendance package. There are regional trainings twice each year at multiple locations across the state. One set of trainings is conducted prior to the beginning of the school year and one prior to the end of the school year. The two trainings, while similar, have somewhat different content based on the time of the training and the information needed by the user at that point. In addition to the two trainings listed above, the vendor offers a toll-free support number Monday through Friday during normal business hours. Training sessions at several conferences across the state are also presented, and web based trainings for the December 1 child count are provided. This year, six WebEx trainings provided step-by-step instructions to district staff on extracting child count and other data in the system. The SIS is designed to ensure information reported is accurate. Internal checks are established to exclude the reporting of students who have not completed the evaluation process and for whom an eligibility determination has not been made. The SIS also excludes students who have not started receiving services even if their eligibility has been determined. Students who have outdated evaluation information and out-of-date IEPs are also excluded. To further verify the accuracy of the SIS, field staff in the Division of School Finance who conduct attendance audits check student folders of those children receiving funding for special transportation to confirm special transportation is listed as a related service in the student’s current IEP. With all the opportunities for training and the support lines of communication, districts and their staff have multiple avenues for training and assistance in using the student information system (SIS). There is also a listserv established for users of the special education software program. The listserv allows users to ask questions among themselves and find practical solutions from other users in the field. This is a user-based and operated listserv. Staff from KDE and the student information system vendor audits the listserv and will often respond to questions. Annual Performance Report (APR) The APR has been submitted to the Office of Special Education Programs (OSEP) in a timely manner. For the first two years in which the APR was required (2004 and 2005), work on the APR began in the summer preceding the March in which the APR was due and continued through the end of March. During the development of the 2004 APR, at least 8 DECS consultants and supervisors and the complaint investigative attorney with Office of Legal and Legislative Services (OLLS) were involved in writing sections of the APR, obtaining relevant data for the report, or both. The DECS staff attorney was involved full-time with the organization, writing and timely submission of the APR. DECS staff also attended all OSEP and TA&D-sponsored events over the past two years in which technical assistance on the APR was provided and participated in the OSEP teleconferences offering technical assistance. During the summer of 2004, all DECS staff were required by the DECS director to participate in either the 2005 APR work group or another important DECS initiative. At that time, 14 DECS consultants and supervisors were involved in the development of the 2005 APR. The DECS attorney continued her APR assignment. DECS also received assistance from three DECS support staff, the KDE Early Childhood Division Director and an early childhood transition consultant with IHDI at the University of Kentucky.

SPP Part B: Indicator 20 Kentucky
Part B State Performance Plan: 2005-2010 Page 170 (OMB NO: 1820-0624 / Expiration Date: )
For both the 2004 and 2005 APR, DECS received invaluable technical assistance from its Mid-South Regional Resource Center (MSRRC) state liaison. DECS believed the work with the APR was vital to its meeting the needs of students with disabilities, making the APR one of its priorities for Mid-South’s work with Kentucky. DECS also consulted with the State Advisory Panel for Exceptional Children (SAPEC) for its input on the APR. Due to time constraints in 2004, SAPEC involvement in the APR was after the fact, rather than prior to submission to OSEP. DECS staff made APR presentations to the SAPEC beginning in Spring 2004 and again at the Fall 2004 meeting. In 2004, as an acknowledgement of the importance of the APR, the SAPEC realigned its committee structure around the APR cluster areas [General Supervision, Transition (Secondary and Early Childhood), Parent Involvement and FAPE in the LRE] so that the SAPEC’s work would parallel the work of DECS. At the SAPEC meeting in Fall 2004, DECS staff who had worked on the 2005 APR met with each individual “cluster” committee to review the APR information and to gather recommendations for the APR from the SAPEC. At the February 2005 SAPEC meeting, DECS staff met with the individual SAPEC committees to review and revise the 2005 APR prior to its submission to OSEP. DECS has made an on-going commitment to sending DECS staff to SAPEC meetings, for the purpose of providing SPP/APR information to each committee and gathering stakeholder input. A massive amount of staff time has been dedicated to the timely submission of a well-thought out, complete APR during 2004 and 2005. Each year, the task has grown easier as DECS staff better understands the APR process and objectives, the data required to complete the report and the amount of time required to submit a comprehensive APR. While the amount of time spent in preparing the APR is significant, the time spent on the task is proportionate to the importance placed upon it by DECS as a document that guides the work of DECS. Baseline Data for FFY 2004 (2004-2005): The child count, race and ethnicity, and placement data tables for FFY 2004 were submitted electronically to Westat using its electronic data transmission system on February 28, 2005. The exiting, discipline, and personnel data tables for the 2004-2005 school year were submitted electronically to Westat on October 26, 2005. The 2004 APR was submitted to OSEP electronically on March 30, 2004. To determine timeliness as a percent, Kentucky decided to count the number of reports that are to be submitted to the US Department of Education, Office of Special Education Programs and determine the percent of those reports that were submitted on or before their due date. For accuracy, Kentucky chose to determine the percent of those reports that had to be revised after the due date. For timeliness, during the 2004-2005 school year, Kentucky submitted four (4) of the six (6) required federal reports (Tables 1 through 5 and the Annual Performance Report) on or before their established due dates. This means that Kentucky was 66.67 percent timely in meeting this objective. For accuracy, during the 2004-2005 school year, Kentucky had to revise and resubmit four (4) of its required reports due to either revisions in local data or errors made in processing these data at KDE. This resulted in Kentucky only being 33.33% accurate by this standard.

SPP Part B: Indicator 20 Kentucky
Part B State Performance Plan: 2005-2010 Page 171 (OMB NO: 1820-0624 / Expiration Date: )
Table 20: 2004-2005 Report of Timeliness and Accuracy of Federal Reporting
Status Table 1 Table 2 Table 3 Table 4 Table 5 Table 6 SPP APR Percent
Timely 0 1 0 1 1 NA NA 1 66.67%Accurate 0 1 0 0 0 NA NA 1 33.33%
Discussion of Baseline Data:
Section 618 Data Historically, Kentucky has been timely in its submission of Section 618 State Reported Data. However over the previous two years, data for the child count, race/ethnicity and placement were submitted after their due date. This has been the result of issues associated with implementation of the state’s SIS, specifically the special education tracking system (SETS) of the program. As the SETS component of the SIS is a relatively new requirement, a few districts have experienced concerns with generating appropriate child count, placement and other Section 618 data. These concerns were due to system checks intended to validate the reliability of the special education data. These checks are designed to preclude counting or reporting children who are not eligible because they may not have a current IEP, reevaluations are past due, or some required data are either missing or incomplete within the SETS program. The data for exiting, discipline and personnel have been submitted by their required due dates each year via the use of the electronic data reporting through Westat. Annual Performance Report The 2004 APR was the initial year for the submission of an annual report from state education agencies (SEAs) to OSEP on the performance of students with disabilities. Prior to 2004, the SEA reports were due every two years and were called the Biennial Performance Report (BPR). Not only was the timing of the Report changed but the APR itself was a much more comprehensive document than the BPR. Because the items being measured in the APR were different and more comprehensive than the BPR, DECS staff’s experience with the BPR did not translate to writing the new APR. Many data requirements in the APR indicators were new. Terms and definitions were different than anything required by OSEP in the past, which caused uncertainty for staff in the beginning of the process. Because DECS began work on the APR in August 2003, it had eight months to complete the report. However, the eight- month period was the same period as two major OSEP requirements for DECS: the OSEP Verification Visit in November 2003 and the DECS initial update to OSEP on the KDE’s Improvement Plan in January 2004. Fortunately, much of the information required for the APR could be extrapolated from the work done for the Verification Visit and the update to the Improvement Plan. The 2004 APR was submitted to OSEP one day before the deadline of March 31, 2004, due to the work of nine DECS staff spending hundreds of hours in deliberation, study, training, data collection, meetings and writing the document. In realizing the work involved in preparing the APR and the ultimate importance of the report, the DECS director made the 2005 APR a priority of the division. 18 DECS staff, including supervisors, consultants, an attorney and support staff developed the 2005 APR.
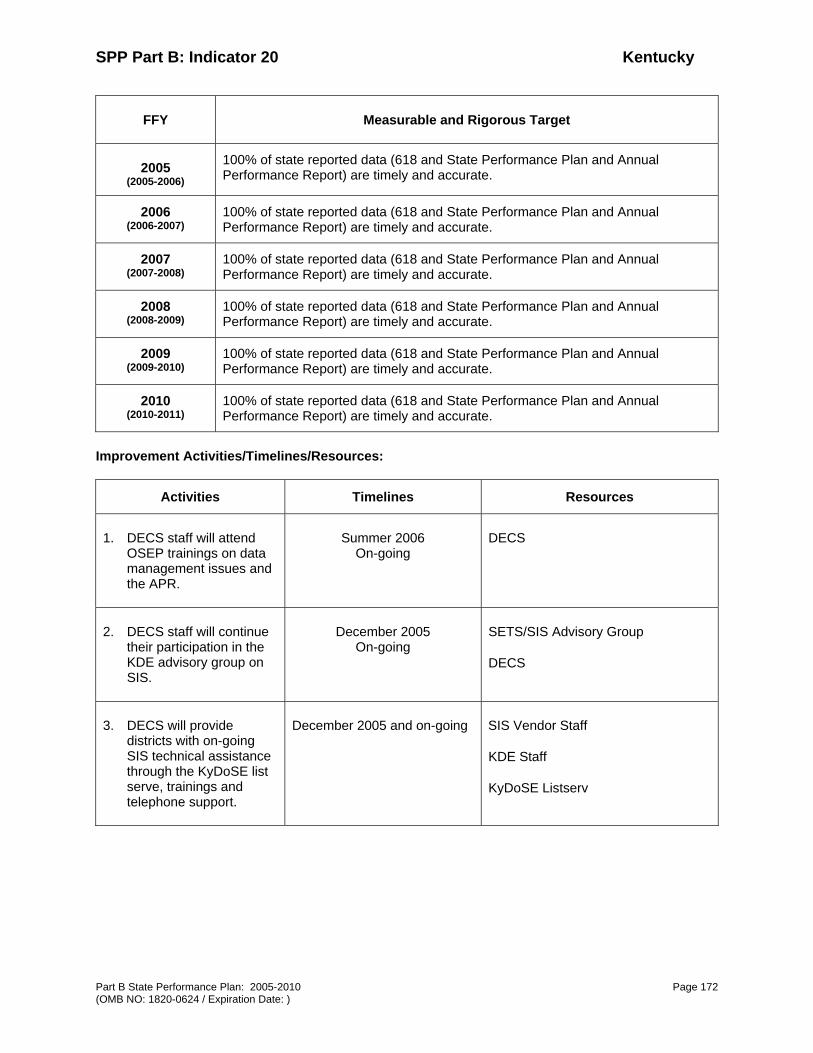
SPP Part B: Indicator 20 Kentucky
Part B State Performance Plan: 2005-2010 Page 172 (OMB NO: 1820-0624 / Expiration Date: )
FFY Measurable and Rigorous Target
2005 (2005-2006)
100% of state reported data (618 and State Performance Plan and Annual Performance Report) are timely and accurate.
2006 (2006-2007)
100% of state reported data (618 and State Performance Plan and Annual Performance Report) are timely and accurate.
2007 (2007-2008)
100% of state reported data (618 and State Performance Plan and Annual Performance Report) are timely and accurate.
2008 (2008-2009)
100% of state reported data (618 and State Performance Plan and Annual Performance Report) are timely and accurate.
2009 (2009-2010)
100% of state reported data (618 and State Performance Plan and Annual Performance Report) are timely and accurate.
2010 (2010-2011)
100% of state reported data (618 and State Performance Plan and Annual Performance Report) are timely and accurate.
Improvement Activities/Timelines/Resources:
Activities Timelines Resources
1. DECS staff will attend OSEP trainings on data management issues and the APR.
Summer 2006 On-going
DECS
2. DECS staff will continue their participation in the KDE advisory group on SIS.
December 2005 On-going
SETS/SIS Advisory Group
DECS
3. DECS will provide districts with on-going SIS technical assistance through the KyDoSE list serve, trainings and telephone support.
December 2005 and on-going SIS Vendor Staff
KDE Staff
KyDoSE Listserv
SPP Part B: Indicator 20 Kentucky
Part B State Performance Plan: 2005-2010 Page 173 (OMB NO: 1820-0624 / Expiration Date: )
Activities Timelines Resources
4. Prior to submission of Section 618 Data, DECS staff will review and analyze data for validity and reliability including error and consistency checks.
January 2007 and ongoing DECS staff