siteresources.worldbank.orgsiteresources.worldbank.org/intmena/resources/mena... · region’s...
TRANSCRIPT
Middle EastandNorth Africa
Working PaperSeries
No. 52
April 2011
The World Bank
Produced by theOffice of the Chief Economist
Summaries in Arabic and French
Does MENA’sGovernance lead to Spatial Agglomeration and Disparities?
byAbdoul’ Ganiou MijiyawaAfrican Centre for Economic Transformation, ACET
Alexander KremerWorld Bank
Loïc WhitmoreWorld Bank
Middle East and North Africa
Working Paper Series
No. 52
Does MENA’s Governance lead to Spatial Agglomeration and Disparities?1
by
Abdoul’ Ganiou Mijiyawa2
African Centre for Economic Transformation, ACET
Alexander Kremer World Bank
Loïc Whitmore
World Bank
April 2011
Discussion papers are not formal publications of the World Bank. They represent preliminary and often unpolished results of country analysis and research. Circulation is intended to encourage discussion and comments; citation and the use of the paper should take account of its provisional character. The findings and conclusions of the paper are entirely those of the authors and should not be attributed to the World Bank, its affiliated organizations, or to members of its Board of Executive Directors or the countries they represent.
1 This paper is a by-product of the World Bank flagship report, Poor Places, Thriving People: How the
Middle East and North Africa Can Rise Above Spatial Disparities. The paper was written before the region’s political changes of early 2011, but deals with issues that are clearly relevant to them. All errors and inaccuracies are those of the authors. The views expressed in this paper are those of the authors and not of their respective affiliated institutions. 2 Comments and suggestions are welcome and should be sent at the corresponding author at: [email protected].

TABLE OF CONTENTS
ABSTRACT ............................................................................................................................ I
1. INTRODUCTION ......................................................................................................... 1
2. STATISTICAL ANALYSIS ............................................................................................ 3 Comparison of political governance between MENA and other world countries ........ 3
Comparison of political rights between MENA and other world countries .......................... 5
Comparison of political stability between MENA and other world countries ...................... 6 Comparison of spatial imbalances between MENA and other world countries ........... 7
3. ECONOMETRIC ANALYSIS ........................................................................................ 11
Background: Model of Ades and Glaeser (1995) ....................................................... 11 Empirical Strategy .................................................................................................... 11 Econometric specification, data and sources of data .................................................. 13
4. BASIC RESULTS ........................................................................................................ 16
Robustness Checks ................................................................................................... 19
5. CONCLUSION ............................................................................................................ 21
REFERENCES ........................................................................................................................ 30
FIGURES Figure 1. Political rights in MENA and other world countries ....................................... 5 Figure 2. Political stability in MENA and other world countries ................................... 6 Figure 3. Urban-rural consumption ratio in each of MENA country and other world
countries ........................................................................................................ 10
TABLES Table 1. Comparison of political governance between MENA countries and three other
groups of countries ........................................................................................ 4 Table 2. Unconditional differences of agglomeration rate between MENA and other
countries ........................................................................................................ 9 Table 3. Basic Results ................................................................................................. 18 APPENDIX TABLES Table A.1. Description of Main Variables ....................................................................... 23 Table A.2. Robustness check with the Polity 2 index ...................................................... 24 Table A.3. Robustness check with the voice and accountability index ............................. 25 Table A.4. Robustness check with coup d’état index ....................................................... 26 Table A.5. Robustness check with GDP per capita data from Pen World Table 6.2 ......... 27 Table A.6. Robustness check with data over the period 1970-2007 ................................. 28 Table A.7. Robustness check with urbanization data ...................................................... 29

i
ABSTRACT
In this paper we analyse the link between spatial agglomeration, spatial disparities and political governance with an emphasis on the MENA region. The agglomeration index and the urban-rural consumption ratio are used respectively as a measurement of spatial agglomeration and spatial disparities. We distinguish two aspects of political governance: political rights and political stability. Statistically, we find that agglomeration rate is higher in MENA, whereas the indexes of political rights and political stability are lower in MENA compared to the rest of the world and other lower middle income countries.
When running the regressions, the data better fit the agglomeration model than the urban-rural consumption ratio model. Using cross-sectional data for 182 countries around the world, we find that the political rights index is negatively and significantly linked to the agglomeration rate. Our results suggest that an improvement in MENA countries’ level of political rights to the average of the rest of the world would be associated with agglomeration rate 4 percentage points lower than its average level in the region. The data also reveal an inverted-U relationship between the agglomeration rate and GDP per capita, and a negative relationship between trade openness and the agglomeration rate. Keywords: Spatial disparities, Agglomeration rate, Urban-rural consumption ratio, MENA JEL Classification: R12, R15, R19

ii
����
�� �� ���� � ��� ������� ����� ������� ��������� ������ ������ ��� ���� ����� �� � ��! �� "#$�� � �% ���&� '��(� ) &� � '�� *�+ ,�� �� .����.���� *�+ /�� 0� � �� 123��4� ����� ������ &5� ��$������� ��������� ������ ������ 6�� �� ����� .,���� ��$ ���� � ��� ������� ���� 7���� �� ������ ��� �! �� :
)� � ������ � ��4�� ������� .� � '�� �� ������ ��9� :�;� � �2� �<��=���ٕ� ��� � �% ���&� '��(� ) & �� ����� �� &�� ? .(� ������� ��9� ����� �!��� �� � � ������� � ��4�� ������� )� � � &5� @;.�� �����
�.�� �'���� ������ .
��+� �� �� � � ������ A#��� �/�% �� �� 7���� ������� �% �2� �B ���4� ����� ���.��� ���� A#�� /�� 0� � �� 123��4� .���.����� �� �/C 9���� �������182 1��$ �% ��� ���9� D��% *�& �� <����
������ ��9�� ������� )� � &5� ��� ��=��E �4� �#� <����� <�'��� � . �&�� �% *E �3�E ����. ��� F=����� )� � ?���� �� ��� )� � G����� ��9� ����� �!�� �� �=��� '����� *E ��� H�� � '��� ������ ������
����� @�;.��4 <��� � '��� �� �=��� ?����� '����� �� � � ������ ��9� �� ���=� '� � . <�/�% ������� 0&��� 6��9� ��� '. ��& �� �!2+ 1��$ �%)Inverted U-Curve (�� ��9� ��� F���� ����E �� � ;� 7���� ����
������ ��9�� � ���� K��;�� ��� ����� �!2+� ����� .
������ ��� : �� � �% ���&� '��(� ) &� � '�� � /�� 0� � �� 123��4� ���� ������� ��9� ������� �������
JEL Classification: R12, R15, R19
iii
Résumé
Dans ce document, nous analysons le lien entre l’agglomération spatiale, les disparités spatiales et la gouvernance politique, en prêtant une attention particulière à la région MENA. L’indice de l’agglomération et le ratio de consommation urbaine/rurale sont respectivement utilisés comme mesures de l’agglomération spatiale et des disparités spatiales. Nous distinguons deux aspects de la gouvernance politique : les droits politiques et la stabilité politique. Sur le plan statistique, nous observons que le taux d’agglomération est supérieur dans la région MENA, alors que les indices des droits politiques et de la stabilité politique y sont plus bas par rapport au reste du monde et aux autres pays à revenu intermédiaire de la tranche inférieure.
Lors de la modélisation des régressions, les données conviennent mieux au modèle
d’agglomération qu’au modèle du ratio de consommation urbaine/rurale. Nous appuyant sur des données intersectorielles portant sur 182 pays à travers le monde, nous observons que l’indice des droits politiques présente une corrélation négative et manifeste avec le taux d’agglomération. Nos résultats donnent à penser qu’une amélioration du niveau des droits politiques dans les pays de la région MENA visant à atteindre la moyenne du reste du monde serait associée à un taux d’agglomération de 4 points de pourcentage inférieur au niveau moyen dans la région. Les données révèlent également une relation en U inversé entre le taux d’agglomération et le PIB par habitant, ainsi qu’une relation négative entre l’ouverture en matière commerciale et le taux d’agglomération. Mots clés : disparités spatiales, taux d’agglomération, ratio de consommation urbaine/rurale, MENA JEL Classification: R12, R15, R19

1
1. Introduction
In 1999, His Majesty King Mohamed VI of Morocco opened his first Revolution Day
speech by asking how rural development can stem rural-urban migration3. In Iran, President
Ahmadinejad stated that 40 percent of the 2008 fiscal year budget would be spent in rural
areas (Christian Science monitor, 2007). Countries like Brazil and India dedicate a significant
share of their budgets to investments intended to ease regional imbalances. In recent years, the
World Bank has increased its focus on regional disparities and the economic opportunities
and challenges that they may present. The effort of the Bank in understanding spatial
imbalances issues culminated in the 2009 World Development Report. Though a certain
amount of spatial imbalances may be beneficial because of spill-over effects of economic
activities agglomeration, countries around the world are concerned about spatial imbalances.
This concern is legitimate since the internal stability and the long-run development of
countries depend upon the ability of governments to assure inclusive development to all
regions and all people, whichever their living place.
However, dealing with spatial imbalances requires a good understanding of their
causes. Indeed, governments cannot implement appropriate policies to dampen spatial
imbalances if they do not have a clear understanding of the reasons behind such disparities.
This is where this paper seeks to make a contribution. Before going further in our analysis, it
is important to clarify two spatial imbalance concepts: spatial agglomeration is the tight
concentration of business in a certain area; spatial disparities are gaps in living standards
between people in different places.
Political-economy factors have increasingly been highlighted as relevant determinants
of spatial imbalances. For instance, in their seminal paper, Ades and Glaeser (1995) showed
that dictator countries and politically unstable countries have, on average, higher level of
urban concentration – an element of spatial agglomeration – compared to democratic and
more stable countries. Along the same line, Kim (2008a) stresses the need to consider
governance and institutional factors in explaining spatial inequality across countries.
Moreover, regional differences in the quality of institutions have been highlighted as relevant
explanatory factors of spatial imbalances (Banerjee and Iyer, 2005; Kapur and Kim, 2006;
Kim, 2007; and Bruhn and Gallego, 2007). Political institutions that determine the
3 Speech of H.M. King Mohamed VI of Morocco on the occasion of the 46th anniversary of the Revolution.
2
distribution of power between federal State and local governments have also been considered
as determinants of spatial inequality (Henderso, 2002; Sokoloff and Zolt, 2006; Kim, 2008b;
Rodriguez-Pose and Ezcurra, 2010; 2009a,b). Thus, scholars increasingly see political
governance as an explaining factor of spatial imbalances.
Political governance is relatively weak in MENA countries. For instance, it has been
shown that the quality of political governance – level of external accountability – is weaker in
the MENA region compared with the rest of the world (World Bank, 2003). Given the results
of the aforementioned papers about the role of political governance in explaining spatial
imbalances, one could thus assume that the MENA region may be one of the regions with the
highest spatial imbalances. However, little is known as regards: (a) the degree of political
governance weakness in MENA countries compared to other world countries, (b) the degree
of spatial imbalances in the MENA region compared to the rest of the world, (c) the
characteristics of the link between political governance and spatial imbalances in MENA.
In this paper we pursue three main objectives. Firstly, we seek to quantify the gap in
political governance between MENA countries and other world countries. Secondly, based on
statistical and cross-sectional analyses, we try to quantify the degree of spatial imbalances in
MENA countries compared to other countries. And thirdly, inspired by the paper of Ades and
Glaeser (1995), we estimate a model of the determinants of spatial imbalances and use the
results of this model to quantify the potential gains for MENA countries, in terms of a
reduction in spatial imbalances, if these countries were to improve the quality of political
governance to the level of their counterparts. To the best of our knowledge, this is the first
paper to analyse the patterns of spatial imbalances, and the link between political governance
and spatial imbalances with an emphasis on MENA countries.
Our statistical analysis shows that MENA countries lag behind other world countries,
both in terms of political rights and political stability. The degree of economic agglomeration
is higher in MENA compared to the rest of the world. The results of our econometric analysis
indicate that, an increase in political rights is negatively and significantly related to the
agglomeration rate. More interestingly, our results suggest that an improvement in MENA
countries’ level of political rights to the average of the rest of the world would be associated
with agglomeration rate 4 percentage points lower than its average level in the region. The
data also reveal an inverted-U relationship between the agglomeration rate and GDP per
capita, and a negative relationship between trade openness and the agglomeration rate.
3
The rest of the paper is organized as follows. In the next section we perform a
statistical analysis of the gap in terms of political governance and spatial imbalances between
MENA countries and other groups of countries. In the third section we carry out an
econometric analysis. The fourth section is devoted to the presentation of the results of the
analysis. The last section presents our conclusions and related policy implications.
2. Statistical analysis
2.1 Comparison of political governance between MENA and other world countries
When we talk about political governance, two key aspects must be distinguished:
political rights and political stability. In this paper, we distinguish both these aspects of
political governance, using the index of political rights from the Freedom House (2009)
(henceforth FH index) and the index of political stability from Kaufman, Kraay and Mastruzzi
(2009) (henceforth KKM index).4
Political rights characterize the participation of people in political processes in a
country. According to the Freedom House, political rights enable people to participate freely
in the political process, including the rights to vote for distinct alternatives in legitimate
elections, compete for public office, join political parties and organizations, and elect
representatives who have a distinctive impact on public policies and are accountable to the
electorate. The FH index ranges between 1 and 7, the higher the value of the index the lower
the level of political rights in a country. The index is computed annually from 1972 to 2008.
For the purposes of our analyses, we calculate the average value of the FH index for each
country over the period 1972-2008, and take the reverse of this average, so that higher values
are assigned to countries where people enjoy better political rights.
The KKM index measures perceptions of the likelihood that the government will be
destabilized or overthrown by unconstitutional or violent means, including politically-
motivated violence and terrorism. It was computed every two years from 1996 to 2000 and
annually over the period 2002-08. The index ranges between -2.5 and +2.5, with high values
4 The data from the Freedom House are free of access and can be downloaded at: www.freedomhouse.org/template. The data from Kaufmann et al. are also free of access and are available at: www.govindicators.org. The Kaufman et al. data set is a product of the World Bank governance project.
4
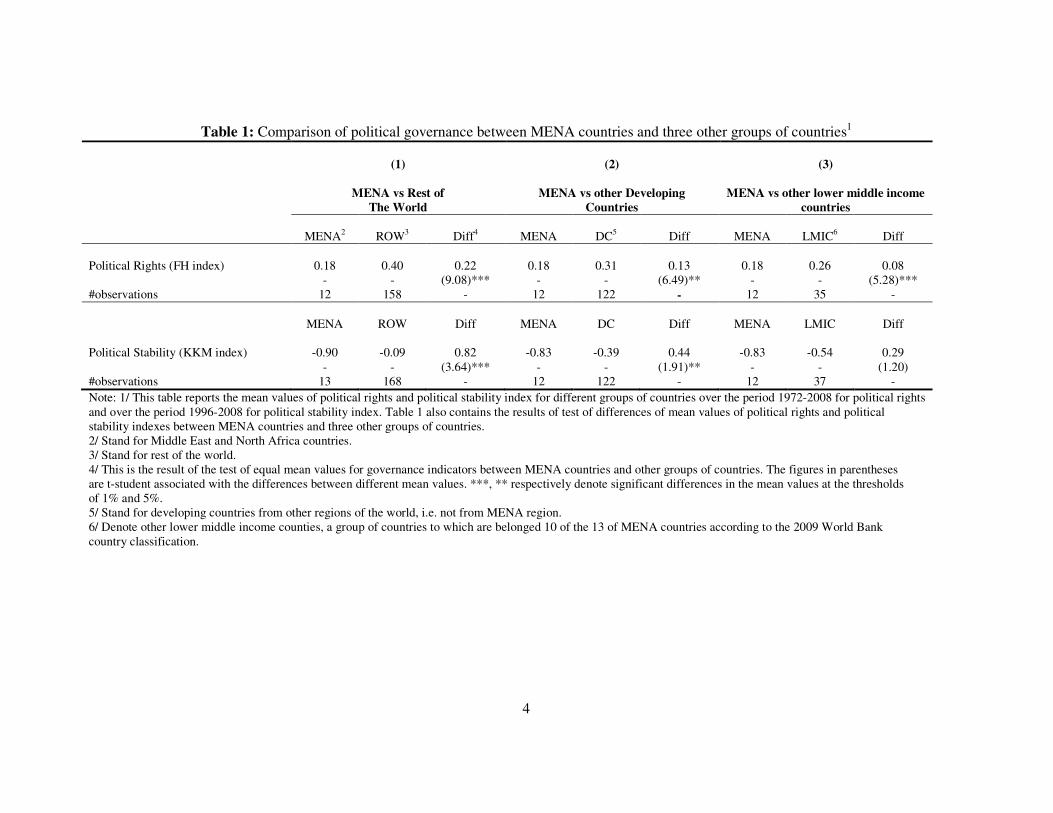
Table 1: Comparison of political governance between MENA countries and three other groups of countries1
(1)
MENA vs Rest of
The World
(2)
MENA vs other Developing
Countries
(3)
MENA vs other lower middle income
countries
MENA2
ROW3
Diff4
MENA
DC5
Diff
MENA
LMIC6
Diff
Political Rights (FH index)
0.18
0.40
0.22
0.18
0.31
0.13
0.18
0.26
0.08
- - (9.08)*** - - (6.49)** - - (5.28)*** #observations 12 158 - 12 122 - 12 35 -
MENA ROW Diff MENA DC Diff MENA LMIC Diff Political Stability (KKM index)
-0.90
-0.09
0.82
-0.83
-0.39
0.44
-0.83
-0.54
0.29
- - (3.64)*** - - (1.91)** - - (1.20) #observations 13 168 - 12 122 - 12 37 -
Note: 1/ This table reports the mean values of political rights and political stability index for different groups of countries over the period 1972-2008 for political rights and over the period 1996-2008 for political stability index. Table 1 also contains the results of test of differences of mean values of political rights and political stability indexes between MENA countries and three other groups of countries. 2/ Stand for Middle East and North Africa countries. 3/ Stand for rest of the world. 4/ This is the result of the test of equal mean values for governance indicators between MENA countries and other groups of countries. The figures in parentheses are t-student associated with the differences between different mean values. ***, ** respectively denote significant differences in the mean values at the thresholds of 1% and 5%. 5/ Stand for developing countries from other regions of the world, i.e. not from MENA region. 6/ Denote other lower middle income counties, a group of countries to which are belonged 10 of the 13 of MENA countries according to the 2009 World Bank country classification.
5
corresponding to countries with increased political stability. For each country, we compute
the average value of the KKM index over the period 1996-2008.
2.1.1 Comparison of political rights between MENA and other world countries
We compare the level of the political rights index in MENA with that of three other
country groups: the rest of the world, other developing countries and countries with a level of
income similar to the MENA region. Throughout the paper, when we talk about MENA
countries, we do not refer to the 21 countries of the region, but 13 of them.5
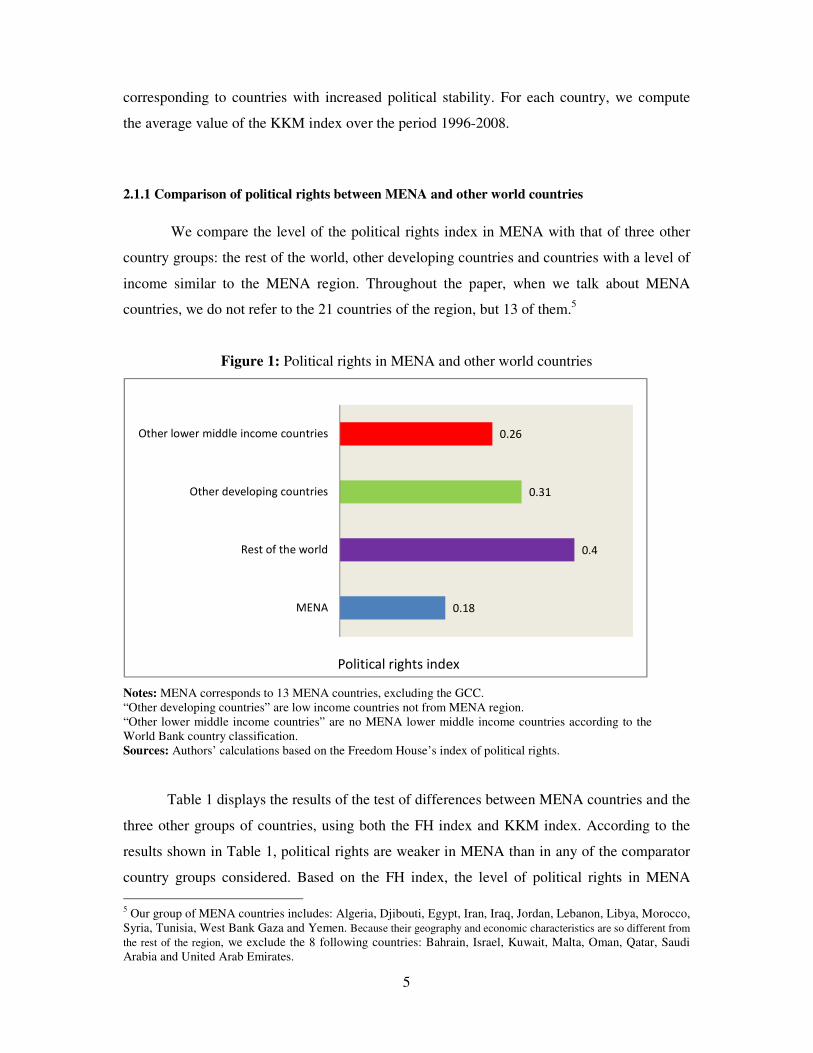
Figure 1: Political rights in MENA and other world countries
Notes: MENA corresponds to 13 MENA countries, excluding the GCC. “Other developing countries” are low income countries not from MENA region. “Other lower middle income countries” are no MENA lower middle income countries according to the World Bank country classification. Sources: Authors’ calculations based on the Freedom House’s index of political rights.
Table 1 displays the results of the test of differences between MENA countries and the
three other groups of countries, using both the FH index and KKM index. According to the
results shown in Table 1, political rights are weaker in MENA than in any of the comparator
country groups considered. Based on the FH index, the level of political rights in MENA
5 Our group of MENA countries includes: Algeria, Djibouti, Egypt, Iran, Iraq, Jordan, Lebanon, Libya, Morocco, Syria, Tunisia, West Bank Gaza and Yemen. Because their geography and economic characteristics are so different from
the rest of the region, we exclude the 8 following countries: Bahrain, Israel, Kuwait, Malta, Oman, Qatar, Saudi Arabia and United Arab Emirates.
0.18
0.4
0.31
0.26
MENA
Rest of the world
Other developing countries
Other lower middle income countries
Political rights index
6
countries is 0.22 point lower than in the rest of the world and 0.13 point lower than in other
developing countries. These results are significant at 1 percent level.
We also compare the MENA region with countries with a similar level of income per
capita, i.e. other lower-middle income countries according to the World Bank 2009 countries
classification.6 From Table 1, we can see that the level of political rights in other lower-
middle income countries is 0.08 point higher than the level of political rights in MENA.
Figure 1 illustrates how, based on the FH index, MENA is lagging behind other
country groups and the rest of the world, in terms of political rights.
2.1.2 Comparison of political stability between MENA and other world countries
We now compare the average performance of MENA countries in terms of political
stability with the performances of the same three groups of countries (rest of the world,
countries from other developing regions and countries with a level of GNI per capita similar
to the MENA region).
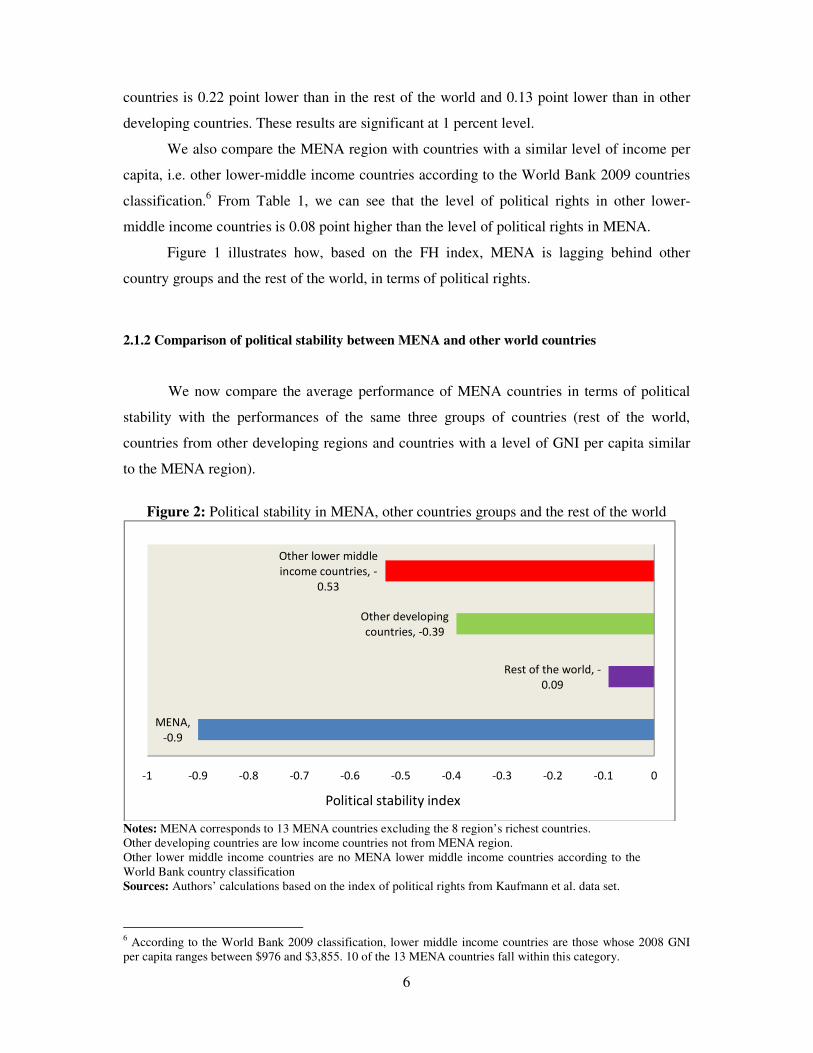
Figure 2: Political stability in MENA, other countries groups and the rest of the world
Notes: MENA corresponds to 13 MENA countries excluding the 8 region’s richest countries. Other developing countries are low income countries not from MENA region. Other lower middle income countries are no MENA lower middle income countries according to the World Bank country classification
Sources: Authors’ calculations based on the index of political rights from Kaufmann et al. data set.
6 According to the World Bank 2009 classification, lower middle income countries are those whose 2008 GNI per capita ranges between $976 and $3,855. 10 of the 13 MENA countries fall within this category.
MENA,
-0.9
Rest of the world, -
0.09
Other developing
countries, -0.39
Other lower middle
income countries, -
0.53
-1 -0.9 -0.8 -0.7 -0.6 -0.5 -0.4 -0.3 -0.2 -0.1 0
Political stability index
7
Our results are presented in Table 1. In terms of political stability, the rest of the world
performs better than MENA by 0.82 point. This difference is significant at 1 percent level and
close to the standard deviation of the KKM index in our sample (0.94, see appendix). When
we compare the KKM index in MENA with other developing countries, we also find a gap to
the detriment of the MENA region. Compared to countries with a similar level of income, the
KKM index shows that MENA is lagging behind by 0.29 point; however this difference is not
statistically significant. 7
Figure 2 illustrates the differences in political stability between MENA countries and
each of the three other country groups.
The analyses above suggest that MENA countries lag behind other world countries
both in terms of political stability as well as in terms of political rights. Our statistical
analyses show that in terms of the quality of political governance, the highest gaps are found
when we compare MENA with the rest of the world, and the lowest gaps are between the
MENA region and other lower middle income countries.
2.2 Comparison of spatial imbalances between MENA and other world countries
Spatial imbalances can characterize two different aspects of inequality: the
concentration of production or the divergence in living standards across space (2009 World
Development Report, henceforth 2009 WDR). The divergence in living standards across space
can be measured by the ratio of urban-rural consumption or by access to public services. The
concentration of production can be measured by either the agglomeration index or the
urbanization rate (2009 WDR).
The agglomeration index is a relatively new indicator of the concentration of
economic activity, proposed by the team of 2009 WDR. It is calculated on the basis of three
criteria: (i) minimum population size to define a sizable settlement; (ii) minimum population
density; and, (iii) maximum travel time, by road, to a sizable settlement. More specifically, to
be considered as urban or dense or agglomerated, an area must satisfy the following criteria:
• The area density population exceeds a threshold of 150 persons per square kilometre;
• The area has access to a sizable settlement within some reasonable travel time (60
minutes by road);
7 It is not easy to establish a statistically significant difference of governance indexes across countries when one uses the KKM index. This is a fact that the authors of the data themselves highlight in Kaufmann et al. (2008).
8
• The settlement the area has access is large, i.e. the settlement has a minimum of
50,000 inhabitants.
The agglomeration index ranges between 0 and 100 and is thus expressed as a
percentage. Its concept is analogous to that of urban population, in the sense that it is a
summary measure of the proportion of a country’s population living in areas of high density.
We obtain data on the agglomeration index from Table A2 of the 2009 WDR.
Compared to other indicators of economic concentration (e.g. urbanization rate,
primacy index), the first and biggest advantage of the agglomeration index is its comparability
across countries. In fact, the agglomeration index, differently from the traditional urbanization
rate, is not based on national definitions of urban area, which differ from one country to
another and make international comparisons difficult. Compared to the primacy index, which
is based on the population size of the main city in a country, the agglomeration index appears
more reliable, as the definition of the geographical delimitation of a country’s main city is
quite often problematic.
In addition to its relative advantages vis-à-vis the other indicators, the fact that the
agglomeration index is a new indicator makes it more attractive for analytical purposes.
Moreover, the agglomeration index is available for almost all the world countries. Thus, for
international comparisons of the degree of economic activities concentration, we use the
agglomeration index. Data are available for the year 2000 and 182 countries around the world,
including both developed and developing countries.
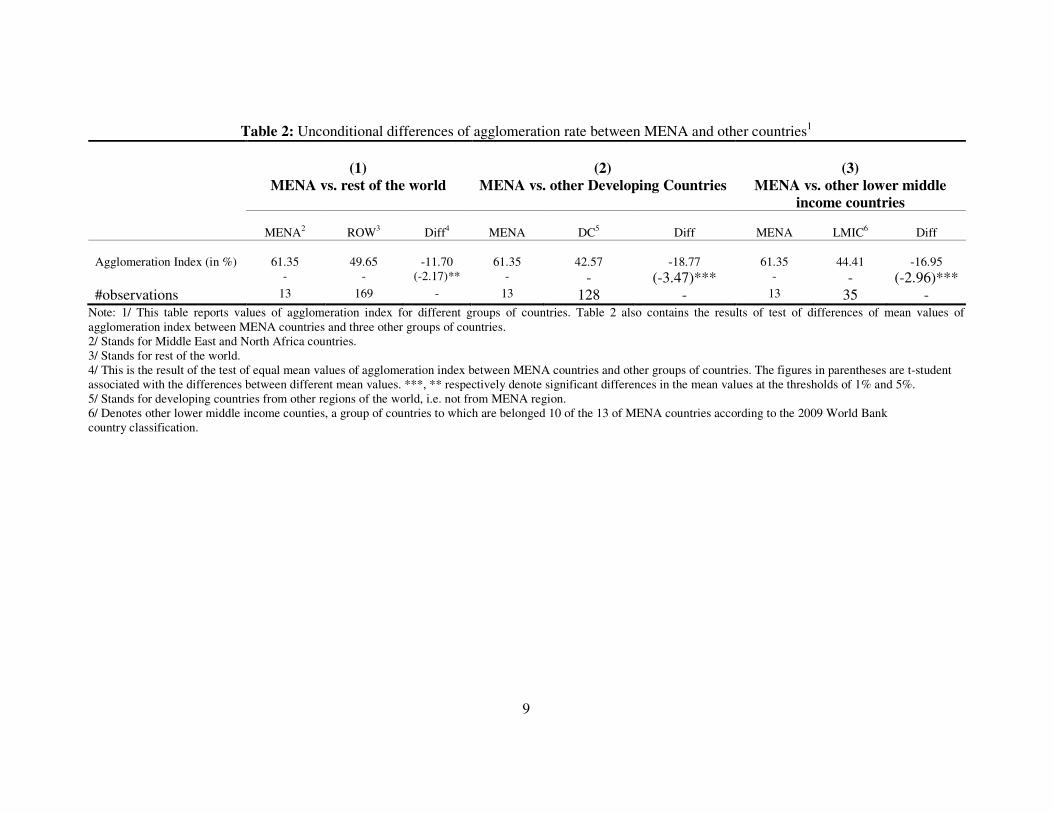
Table 2 presents the results of test of differences in agglomeration rate between
MENA countries and other country groups. As we can see from Table 2, the agglomeration
index is higher in MENA compared to other country groups. Compared to the rest of the
world, the agglomeration index in MENA is 11.7 percentage points higher. This result is
statistically significant. The gap is much higher when we compare the agglomeration index of
MENA countries with other developing countries: the agglomeration index in MENA is 18.8
percentage points higher relative to other developing countries. When we compare the
agglomeration rate in MENA countries with countries having a similar level of income per
capita, the data suggest a gap of 17 percentage points in favor of the MENA region.
9
Table 2: Unconditional differences of agglomeration rate between MENA and other countries1
(1)
MENA vs. rest of the world
(2)
MENA vs. other Developing Countries
(3)
MENA vs. other lower middle
income countries
MENA2
ROW3
Diff4
MENA
DC5
Diff
MENA
LMIC6
Diff Agglomeration Index (in %)
61.35
49.65
-11.70
61.35
42.57
-18.77
61.35
44.41
-16.95
- - (-2.17)** - - (-3.47)*** - - (-2.96)*** #observations 13 169 - 13 128 - 13 35 -
Note: 1/ This table reports values of agglomeration index for different groups of countries. Table 2 also contains the results of test of differences of mean values of agglomeration index between MENA countries and three other groups of countries. 2/ Stands for Middle East and North Africa countries. 3/ Stands for rest of the world. 4/ This is the result of the test of equal mean values of agglomeration index between MENA countries and other groups of countries. The figures in parentheses are t-student associated with the differences between different mean values. ***, ** respectively denote significant differences in the mean values at the thresholds of 1% and 5%. 5/ Stands for developing countries from other regions of the world, i.e. not from MENA region. 6/ Denotes other lower middle income counties, a group of countries to which are belonged 10 of the 13 of MENA countries according to the 2009 World Bank country classification.
10
Data on per capita urban and rural consumption are available for 77 countries. We use
these data to calculate the ratio of urban-rural consumption; this ratio is an indicator of livings
standard disparities between urban and rural populations within a country. The consumption
data are available for only 6 of the 13 MENA countries. Therefore, we do not compare the
mean value of the consumption ratio of the MENA region with the other country groups, as
we did with the agglomeration data, but we compare each MENA country with the average of
the rest of countries for which we have data on rural and urban consumption.
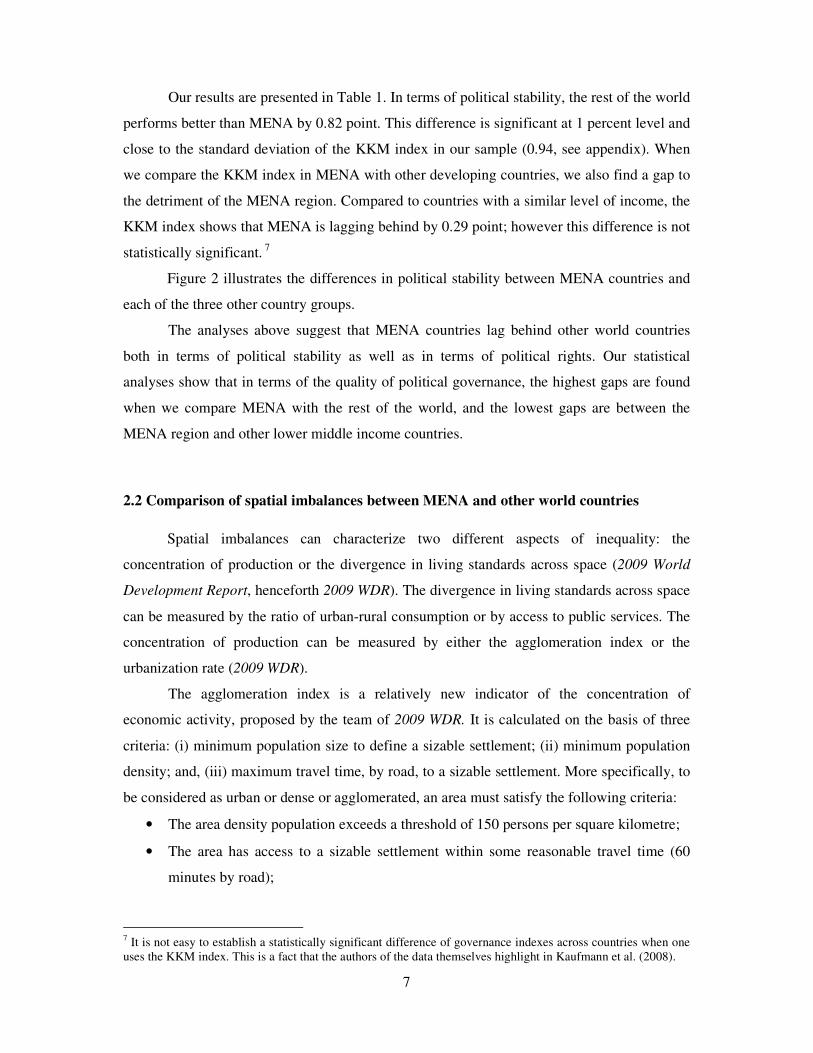
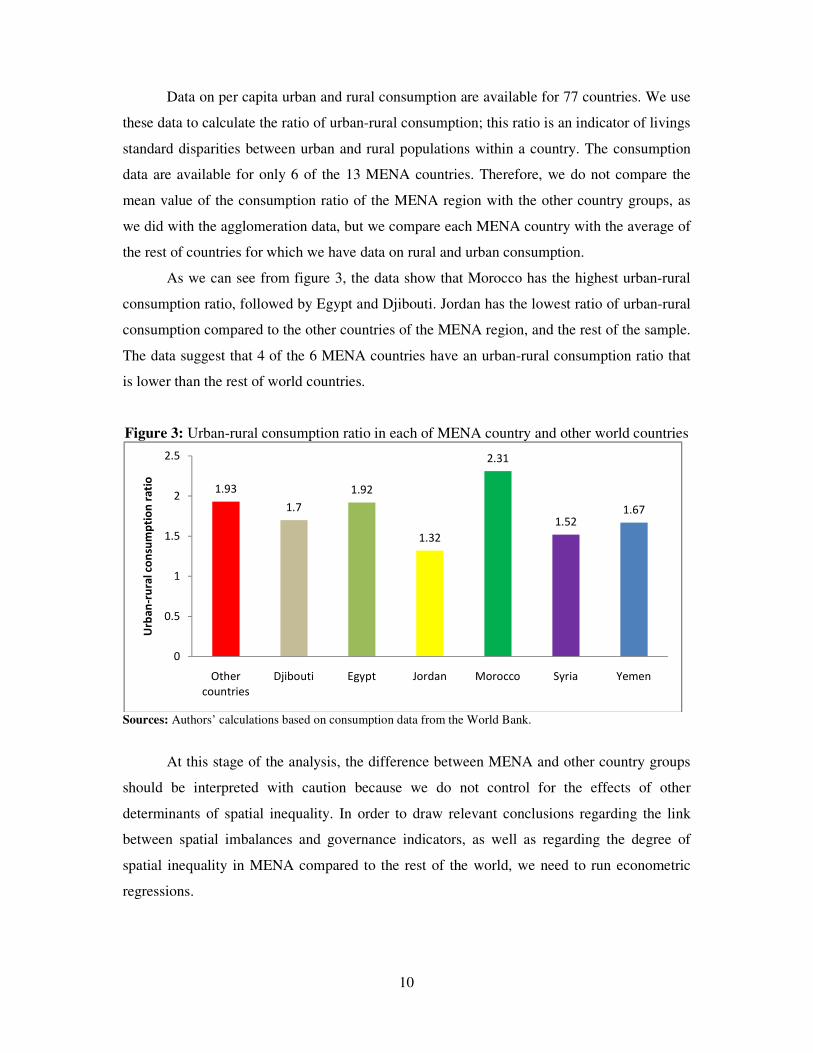
As we can see from figure 3, the data show that Morocco has the highest urban-rural
consumption ratio, followed by Egypt and Djibouti. Jordan has the lowest ratio of urban-rural
consumption compared to the other countries of the MENA region, and the rest of the sample.
The data suggest that 4 of the 6 MENA countries have an urban-rural consumption ratio that
is lower than the rest of world countries.
Figure 3: Urban-rural consumption ratio in each of MENA country and other world countries
Sources: Authors’ calculations based on consumption data from the World Bank.
At this stage of the analysis, the difference between MENA and other country groups
should be interpreted with caution because we do not control for the effects of other
determinants of spatial inequality. In order to draw relevant conclusions regarding the link
between spatial imbalances and governance indicators, as well as regarding the degree of
spatial inequality in MENA compared to the rest of the world, we need to run econometric
regressions.
1.93
1.7
1.92
1.32
2.31
1.521.67
0
0.5
1
1.5
2
2.5
Other
countries
Djibouti Egypt Jordan Morocco Syria Yemen
Urb
an
-ru
ral co
nsu
mp
tio
n r
ati
o
11
3. Econometric Analysis
3.1 Background: Model of Ades and Glaeser (1995)
We take advantage of the model of Ades and Glaeser (1995) to analyse the
determinants of spatial imbalances. These authors develop a political-economy model of
spatial imbalances. More specifically, Ades and Glaeser show that in democratic countries, so
in countries where people enjoy a higher level of political rights, one should observe less
urban concentration, because politicians need the support of the median voter or “the
hinterland people” in order to stay in office. The argument of Ades and Glaeser (1995)
implies that, in democratic countries, policymakers are more sensitive to the interest and well
being of hinterland people, who may not need to migrate towards cities or urban areas to
improve their lives. Based on this argument of Ades and Glaeser, we expect lower spatial
imbalances in more democratic countries, both in terms of activities agglomeration, as well in
terms of livings standard difference.
In their paper, Ades and Glaeser (1995) also show that in countries where the
government is susceptible to political instability (coups and violence), the government is
threatened by its direct neighbour citizens, i.e. the urban population. In order to prevent
threats from the urban population, in countries with a high level of political instability, the
government offers some premium (in form of lower income tax) to the urban population. By
so doing, the government induces a concentration of the population in urban areas, as all
citizens would like to benefit from the “urban premium”. The implication of this argument
from Ades and Gleser (1995) is that, in countries with a high level of political stability, one
should observe less urban concentration and less difference in consumption between urban
and rural areas, as the “urban premium” offered by the government would be lower.
3.2 Empirical Strategy
We introduce some changes to the original model of Ades and Glaeser (1995). The
first modification is the change of the indicator of spatial agglomeration. As we mentioned
before, our preferred measurement of the degree of economic activities concentration is the
agglomeration index, which is not the case for Ades and Glaeser who used the primacy index.
Moreover, in this paper we also run regressions with an indicator of livings standard
12
disparities and not only with an indicator of economic activities concentration as did Ades and
Glaeser.
The second modification that we introduce in the model of Ades and Glaeser (1995) is
taking into account the non linearity in the relationship between spatial disparities and
economic development. Indeed, it is possible to imagine that economic activities
concentration increases with the level of GDP per capita until a certain threshold after which
an increase in GDP per capita would be accompanied by a reduction in the degree of
agglomeration, possibly because of congestion effects. In order to reduce the congestion
effects, there is a need to shift economic activities to other areas. Consequently, the degree of
agglomeration and differences in living standards across areas should decline with the level of
development, after a certain threshold.
The idea of non linearity in the relationship between spatial disparities and economic
development has also been highlighted by the authors of the 2009 WDR. However, in the
model of Ades and Glaeser, only the level of GDP per capita is used as an explanatory
variable and not its quadratic value, therefore they do not analyse the possibility of non
linearity in the link between spatial disparities and economic development. To the best of our
knowledge, our analysis is the first rigorous attempt to estimate a non linear relation between
spatial imbalances and economic development, even though the idea is well shared by many
scholars.
The third change that we introduce compared to the original model of Ades and
Glaeser, is the use of continuous values for the political rights index, instead of a dummy for
dictatorship versus democratic character of a political regime. As we mentioned before, one of
our objectives is to quantify the benefit for MENA countries in terms of spatial inequality
reduction if these countries were to reach the level of political rights granted in comparator
countries. For this kind of empirical investigation, the continuous values of the governance
indicators are much more suited. Moreover, though our indicator of political rights is
computed by the Freedom House, as in the case of Ades and Glaeser (1995), in this paper we
use data over the period 1972-2008. Ades and Glaeser used the average values of a dummy
variable related to the index of political rights for the years 1970, 1975, 1980 and 1985. By
taking the average values of the political rights index over the period 1972-2008, not only do
we use updated data for the political rights index, but we also reduce potential measurement
errors associated with this variable.
In the context of this paper, the last and important modification that we introduce to
the model of Ades and Glaeser (1995) is the use of a MENA dummy variable as an
13
explanatory variable of spatial imbalances. By doing so, we can quantify the gap between
MENA countries and the rest of our country sample, after having controlled for the
determinants of spatial imbalances.
3.3 Econometric specification, data and sources of data
Besides the modifications, we keep in our model some of the control variables that
were used by Ades and Glaeser (1995). Hence, the models that we estimate are as follows:
i i i i i i
aglomeration index c polrights polstab mena X ε= + + + + + (1)
i i i i i i
Consumption ratio c polrights polstab mena X ε= + + + + + (2)
The dependent variables are indicators of spatial imbalances. In equation (1), the
dependent variable is the agglomeration index, and in equation (2) it is the urban-rural
consumption ratio. Therefore, equation (1) is related to the concentration of economic
activities, whereas equation (2) is used to analyse the determinants of differences in living
standards between rural and urban populations within countries.
The list of explanatory variables comprises an index of political rights and an index of
political stability; both are respectively denoted i
polrights and i
polstab in our models. As we
explained before, based on the model of Ades and Glaeser (1995), we expect a negative effect
of the indexes of political rights and political stability on the agglomeration index and the
urban-rural consumption ratio.
We introduce in our models a dummy variable for MENA countries, which is denoted
imena . The MENA dummy is a variable taking the value of one for the 13 countries from the
MENA region and zero otherwise. Given the results of our statistical analysis related to the
gap between MENA and other country groups, both in terms of agglomeration rate and
political governance quality, we expect a positive effect of the MENA dummy on the
indicators of spatial imbalances. The coefficient associated with the MENA dummy may be
significant or insignificant in our regressions. In the case that the MENA coefficient is
significant, this may suggest the existence of some specific factors which determine spatial
imbalances in the MENA region that the model does not properly incorporate. On the other
hand, if the coefficient associated with the MENA dummy is not significant, this reveals that
14
our model incorporates sufficient variables and that there are no additional factors that make
spatial imbalances look different in MENA compared to the rest of the world.
In this paper, the indexes of political rights, political stability and the MENA dummy
are our main variables of interest. In addition to these three variables, based on Ades and
Glaeser (1995), we also control for other determinants of spatial imbalances. These variables
are represented by iX in our econometric models. Except otherwise indicated, all the
explanatory variables are from the World Bank (2009), World Development Indicators
database. We calculate the average values of the explanatory variables over the period 1960-
2007 for each our country sample.
The list of i
X variables comprises an indicator of trade openness, i.e. the degree of a
country’s participation in international trade. We expect a negative effect of trade openness on
the indicators of spatial inequality. Indeed, Krugman and Levias (1996) show that when tariff
rates are very high for trade with the rest of the world, manufacturing and workers tend to
concentrate in one primate city. However, when trade is liberalized, centripetal forces decline
causing manufacturing and workers to disperse to other cities. Hence, according to Krugman
and Levias (1996) trade liberalization or trade openness causes spatial equality8. Our indicator
for trade openness is the sum of exports and imports as a share of GDP.
We also control for the share of paved roads in a country’s total road network. The
data on the share of paved roads are from the CIA Factbook and are estimated for the most
recent year for each our country sample. In this paper, the share of paved roads is a proxy for
government expenditure in transportation infrastructure9. We expect a negative effect of the
share of paved roads on spatial imbalances. The higher the share of paved roads, the lower
transportation cost. And Krugman (1991) shows that when transportation is expensive,
activities group together to save on travel costs, and goods become cheaper in the urban
compared to the rural area. Based on this theory, we can predict that spatial disparities and
spatial agglomeration would be higher when transportation is more costly.
Still following the tradition of the model of Ades and Glaeser, we control for the
logarithm of the population working in the agricultural sector, i.e. the labour force working in
8 For other theoretical arguments related to the link between trade openness and spatial disparity, one can refer to the works of Kim (2008), Puga and Venables (1999) and Paluzie (2001). 9 We prefer the share of paved roads instead of government expenditure on transportation, because the former is available for most of our country sample. Using data on government expenditure for transportation will generate missing observations because these data are available for only few countries. In addition, government expenditure in transportation and the share of paved roads are very likely linked; therefore we can use the percent of paved roads as a proxy for public expenditure on transportation infrastructure.
15
farming, forestry, hunting and fishing. The proportion of population employed in the
agricultural sector provides an indication of a country’s level of industrialization. The higher
the labour force working in the agricultural sector, the lower urban concentration, as this
population is less willing to abandon its assets in the hinterland to migrate in the city. Hence,
we expect a negative relation between the number of the population in the agricultural sector
and the agglomeration index. We also expect a negative link between the size of the
agricultural labour force and the ratio of urban-rural consumption, as the higher the number of
agricultural population, the higher rural consumption.
Spatial disparities may also be related to country size (Williamson, 1965). Therefore,
in our model, we also control for the size of countries. This is generally measured either by
the size of the population or by the land area. In this paper, we use both indicators of country
size by including the logarithm of the population size and the logarithm of country land area
as explanatory variables.
Land area may have an ambiguous effect on spatial imbalances. Indeed, big countries
in terms of land area are countries where transportation cost may be high because of distance
between different localities. In this case, the link between land area and spatial imbalances is
probably positive. However, a large country is very likely to be endowed with many natural
resources located in different areas of the country. It is likely that, in order to exploit these
natural resources, inhabitants spread-out across the country, thus reducing urban concentration
and consumption disparities. Based on this argument, it is possible that land area and spatial
imbalances are negatively associated.
The link between spatial imbalances and population size is probably positive, i.e.
population size might increase spatial inequality. When the population size is high, the
number of opportunities per capita is reduced; therefore people are concentrated in the area
where they can mostly take advantage of the existing opportunities. Moreover, countries with
a large population are generally more heterogeneous, and are countries where sub-national
governments may follow very different policies, inducing spatial imbalances (Rodriguez-Pose
and Ezcurra, 2010; 2009a,b).
In this paper we control for the effect of economic development on spatial imbalances.
Since the pioneer work of Williamson (1965), the empirical literature on spatial inequality has
emphasized the importance of the level of economic development in explaining spatial
imbalances (see for instance, Amos, 1988; Terrasi, 1999; Petrakos, Rodriguez-Pose and
Rovolis, 2005). However, in this paper, we assume that the relationship between spatial
imbalances and economic development might not be linear. The idea of non linearity in the
16
relationship between spatial imbalances and economic development is also shared by many
other authors (see Petrakos and Brada, 1989; Thisse, 2000)10.
In order to take into account the non linear relation between the level of economic
development and spatial imbalances, we use as explanatory variables of the agglomeration
index and the urban-rural consumption ratio, the logarithm of GDP per capita and its
quadratic value. The non linear effect should be characterised by a positive and significant
effect of the logarithm of GDP per capita and a negative and significant effect of its quadratic
value on the spatial imbalances indicators. Data on GDP per capita are expressed in 2000
constant dollar.
We run regressions using OLS and estimate the two models presented above. The
dependent variables, i.e. the agglomeration index and the urban-rural consumption ratio are
available for the year 2000, while most of the explanatory variables cover the period 1960-
2007. This unintentional situation contributes to reduce potential simultaneity errors and thus
endogeneity issues in our econometric regressions.
4. Basic Results
The basic results of our econometric analysis are reported in Table 3. It appears that
for the same explanatory variables, we obtain different results depending on the indicator of
spatial imbalances considered. In the exception of trade openness and land area, which have a
negative effect whichever the indicator of spatial imbalances considered, the coefficients
associated with the other explanatory variables change with the indicator of spatial inequality.
Moreover, the coefficients associated with land area and trade openness are significant at 1%
level in the agglomeration model, whereas they are not significant in the model relating to
spatial consumption disparities11.
Of over 10 dependent variables, 7 are statistically significant in the model related to
the agglomeration index, whereas only 3 dependent variables are significant in the model
10 New economic geography models show that economic growth is often associated with an uneven spatial development (Krugman, 1998; Fujita and Thisse, 2002). 11 When we run simple correlations between the variables, we also find differences between the two models. For instance, we find a positive correlation between the agglomeration index and the governance indicators: the correlation between the agglomeration index and the political rights index is 0.40 and the correlation between the agglomeration index and the political stability index is 0.39. Both correlations are significant at 1% level. Differently, the correlation between the urban-rural consumption ratio and the political rights index is -0.09 and not significant, whereas the correlation between urban-rural consumption ratio and the political stability index is -0.22 and significant at 10% level. These correlations are not shown but are available upon request.
17
related to the ratio of urban-rural consumption. When observing the goodness of fit (adjusted
R-squared) of the two models, we can see that the data fit the agglomeration model by far
better than the model of consumption disparities. The results show that 75% of the variation in
the agglomeration index is explained, whereas only 22% of the variation in consumption ratio
is explained by the explanatory variables. Further research is needed to understand why such a
difference exists between the two models. The remainder of this paper will focus on the
results of the agglomeration model, in light of its superior performance.
In Table 3 we can see that the coefficient associated with the MENA dummy is
positive but insignificant. While the results of our statistical analyses had suggested that the
degree of economic activities agglomeration in MENA countries is 11.7 percentage points
higher than in the rest of the world, after controlling for other determinants, our econometric
analysis finds that the gap between MENA countries and the rest of the world is no longer
significant. Moreover, our results confirm that our model incorporates sufficient relevant
factors, meaning that there are no additional factors specific to the MENA region that affect
spatial imbalances differently in this region compared to the rest of the world.
When we look at the coefficients associated with the political governance indicators,
from Table 3, we can see that the coefficient associated with the political rights index is
negative and significant at 1% level. Improving the level of political rights is favourable to
agglomeration reduction; this result confirms one of the predictions of the model of Ades and
Glaeser (1995). The result suggests that, a one standard deviation increase in the political
rights index (0.29) would roughly induce a reduction of 5 percentage points in the
agglomeration index (0.29 x -16.657).
Based on the results in Table 3, it is possible to quantify the potential gain in terms of
agglomeration reduction that MENA countries would achieve if they were to improve their
political governance to the levels of comparator countries. Everything else equal, the results in
Table 3 suggest that, if MENA countries were to bridge the political right’s gap between the
region and other developing countries, the degree of agglomeration would fall by 2.2 points.
Furthermore, if MENA countries were to reach the level of political rights granted in the rest
of the world, the agglomeration rate in MENA would be reduced by 3.7 percents point. Let’s
imagine that MENA countries reach the level of political rights of countries with a similar
level of income per capita, what would be the effect on the agglomeration index? The results
in Table 3 suggest that in this case, MENA countries would benefit from a reduction of 1.3
percent point in the level of agglomeration.
18
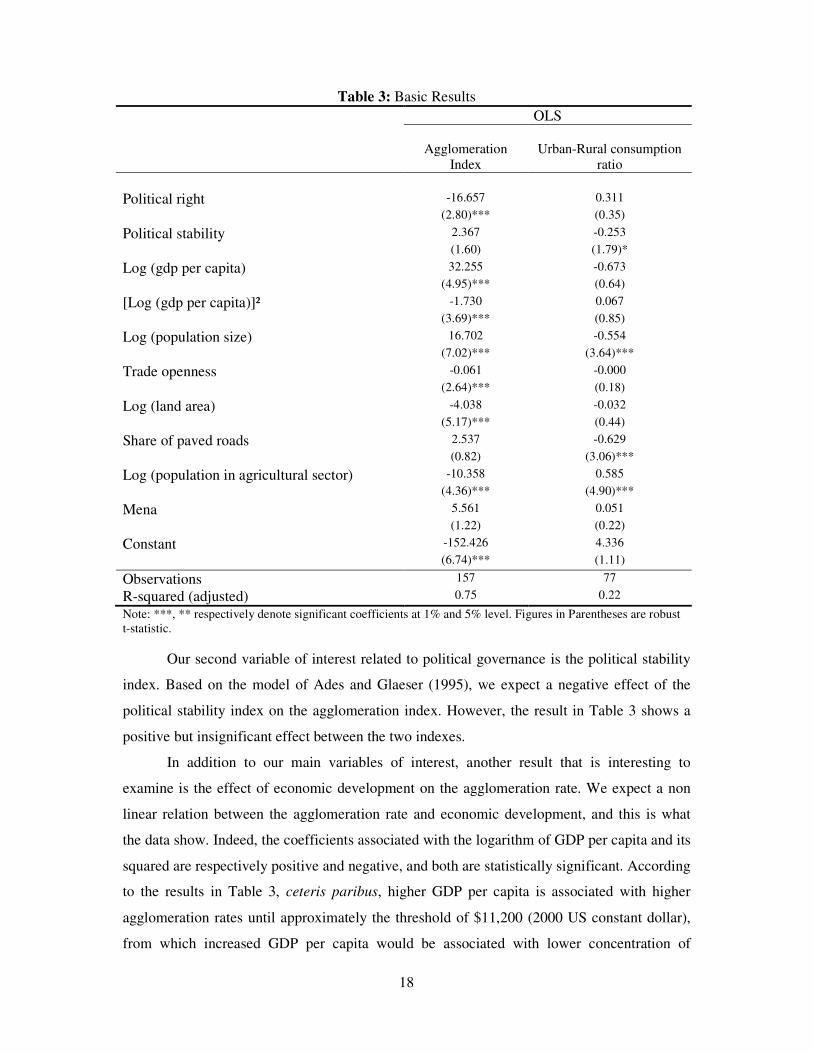
Table 3: Basic Results
OLS
Agglomeration
Index
Urban-Rural consumption
ratio
Political right -16.657 0.311
(2.80)*** (0.35)
Political stability 2.367 -0.253
(1.60) (1.79)*
Log (gdp per capita) 32.255 -0.673
(4.95)*** (0.64)
[Log (gdp per capita)]² -1.730 0.067
(3.69)*** (0.85)
Log (population size) 16.702 -0.554
(7.02)*** (3.64)***
Trade openness -0.061 -0.000
(2.64)*** (0.18)
Log (land area) -4.038 -0.032
(5.17)*** (0.44)
Share of paved roads 2.537 -0.629
(0.82) (3.06)***
Log (population in agricultural sector) -10.358 0.585
(4.36)*** (4.90)***
Mena 5.561 0.051
(1.22) (0.22)
Constant -152.426 4.336
(6.74)*** (1.11)
Observations 157 77
R-squared (adjusted) 0.75 0.22
Note: ***, ** respectively denote significant coefficients at 1% and 5% level. Figures in Parentheses are robust t-statistic.
Our second variable of interest related to political governance is the political stability
index. Based on the model of Ades and Glaeser (1995), we expect a negative effect of the
political stability index on the agglomeration index. However, the result in Table 3 shows a
positive but insignificant effect between the two indexes.
In addition to our main variables of interest, another result that is interesting to
examine is the effect of economic development on the agglomeration rate. We expect a non
linear relation between the agglomeration rate and economic development, and this is what
the data show. Indeed, the coefficients associated with the logarithm of GDP per capita and its
squared are respectively positive and negative, and both are statistically significant. According
to the results in Table 3, ceteris paribus, higher GDP per capita is associated with higher
agglomeration rates until approximately the threshold of $11,200 (2000 US constant dollar),
from which increased GDP per capita would be associated with lower concentration of
19
economic activities. This is a reasonable threshold. Only 30 countries in our sample have
reached this threshold and most of them are rich or high income countries according to the
World Bank classification12.
From Table 3 we can see that the effect of trade openness on the agglomeration index
is negative and significant at 1% level. This result suggests that an increase of 1 percentage
point in trade openness would induce a reduction of 0.06 percentage point in the
agglomeration rate.
We obtain a negative and significant effect of the political rights index on the
agglomeration index; our results also reveal an inverted-U relationship between the level of
economic development and the agglomeration index. We also find a negative relationship
between trade openness and the agglomeration rate. One final question we must ask ourselves
is whether our findings are robust.
4.1 Robustness Checks
The results of all the robustness checks performed are reported in the appendix. The
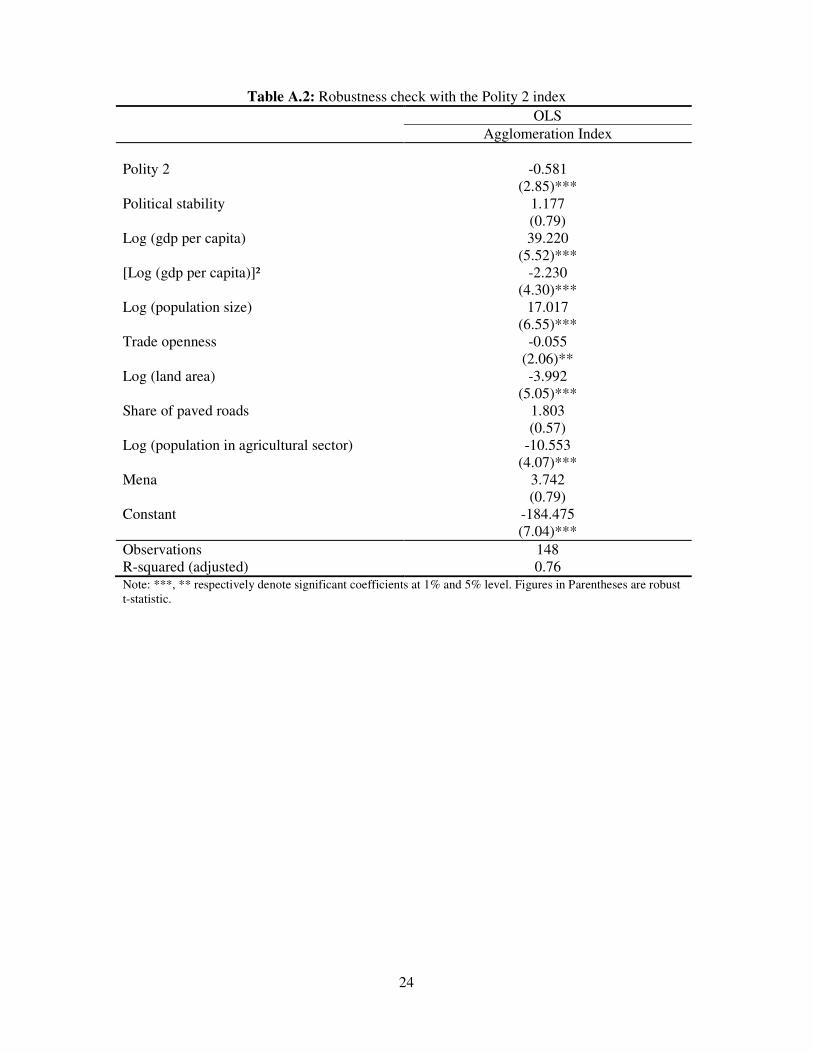
first robustness check that we carry out consists in changing the political rights index. Instead
of the political rights index from the Freedom House, we use another indicator from the Polity
IV; this is the polity 2 index. The polity 2 index measures the level of democracy, corrected
from the level of dictatorship of political regime. Polity 2 ranges between -10 and +10, with a
high value indicating a high level of democracy.13 The results of this first robustness check
reported in Table A.2 show that our main results are not affected by this change: we still
obtain a negative and significant effect of the political rights index on the agglomeration
index. The MENA dummy as well as the political stability index remain statistically
insignificant. We also find an inverted-U relationship between GDP per capita and the
agglomeration index. Despite the change of the political rights index, the link between the
agglomeration index and trade openness is negative and significant.
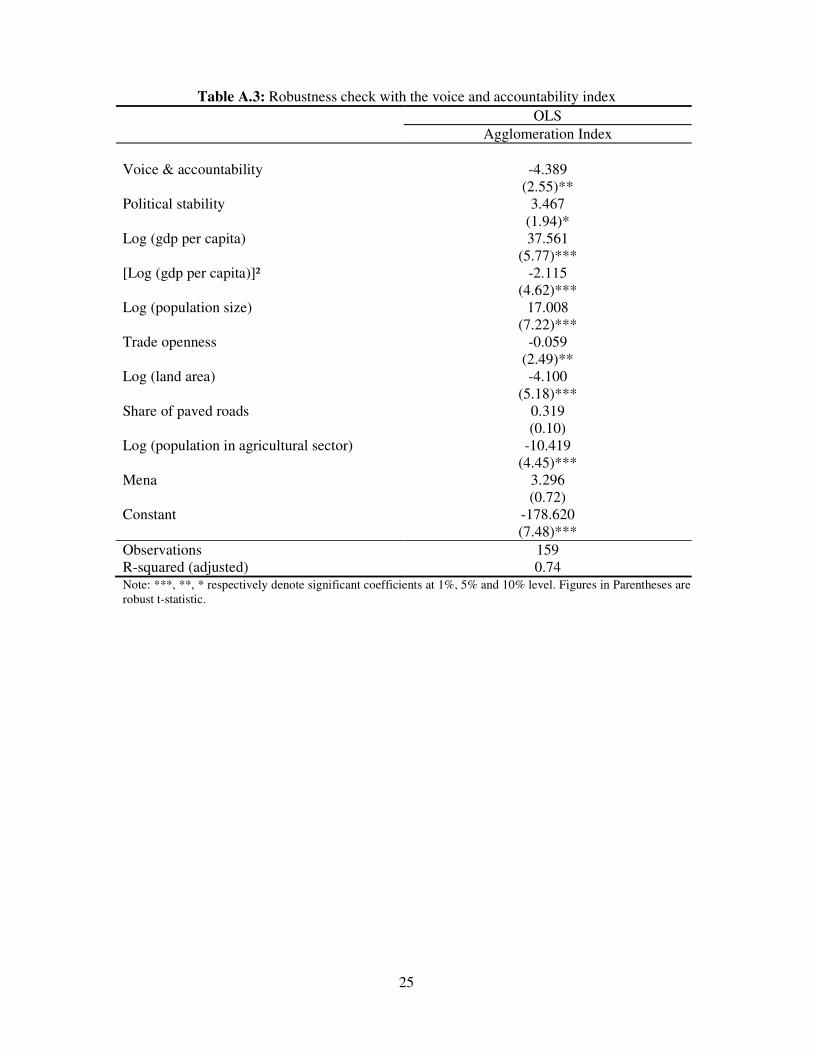
Another indicator of political rights that we use is the voice and accountability index
from Kaufmann et al. (2009). This index ranges between -2.5 and 2.5, with a high value
corresponding to countries where policy makers are more accountable vis-à-vis the people
12 In our sample the list of countries which have reached this threshold is as follows: Australia, Austria, Bahamas, Belgium, Brunei, Canada, Denmark, Finland, France, French Polynesia, Germany, Hong Kong, Iceland, Ireland, Israel, Italy, Japan, Kuwait, Luxembourg, Macao, Netherlands, Norway, Qatar, San Marino, Singapore, Sweden, Switzerland, United Arab Emirates, United Kingdom and United States. 13 The data of Polity 2 can be downloaded freely from http://www.systemicpeace.org/inscr/inscr.htm.
20
they govern. When we use the voice and accountability index there is no change in our initial
findings.
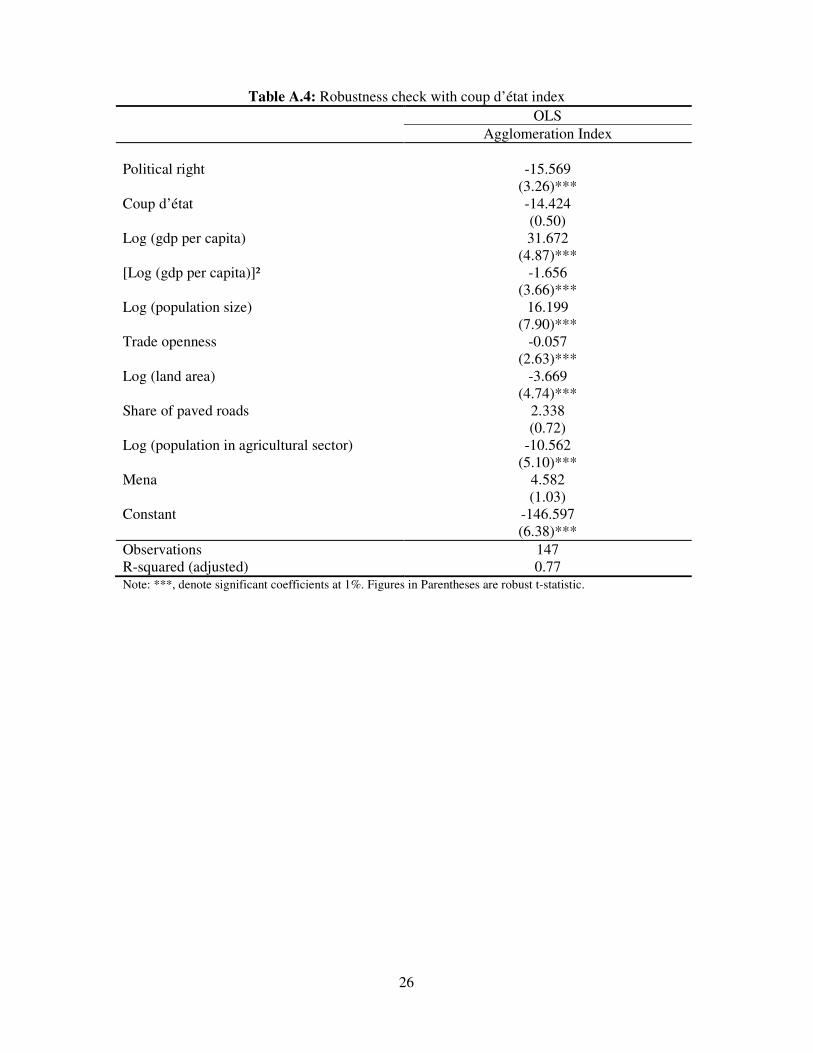
Instead of changing the index of political rights, this time we change the indicator of
political stability. In place of the political stability index from Kaufmann et al. (2009), we use
data on coups events from the Polity IV project. The data compile descriptive information on
all coups occurring in countries with a population greater than 500,000 during the period
1960-2006. A coup is defined as a forceful seizure of executive authority and office by a
dissident/opposition faction within the country’s ruling or political elites that results in a
substantial change in the executive leadership and the policies of the prior regime. For the
purpose of our analyses, we focus on the annual number of successful coups over the period
1960-2006, and compute the average over that period. In order for a coup to be considered
“successful”, effective authority must be exercised by new executive for at least one month14.
When we use the new indicator for political stability, the results in the appendix show that the
political rights index is still negative and significant. The coefficient associated with the
number of “successful” coups is negative but not significant. We still obtain a non linear
relation between spatial agglomeration and economic development, and the MENA dummy is
positive but not significant as we previously found.
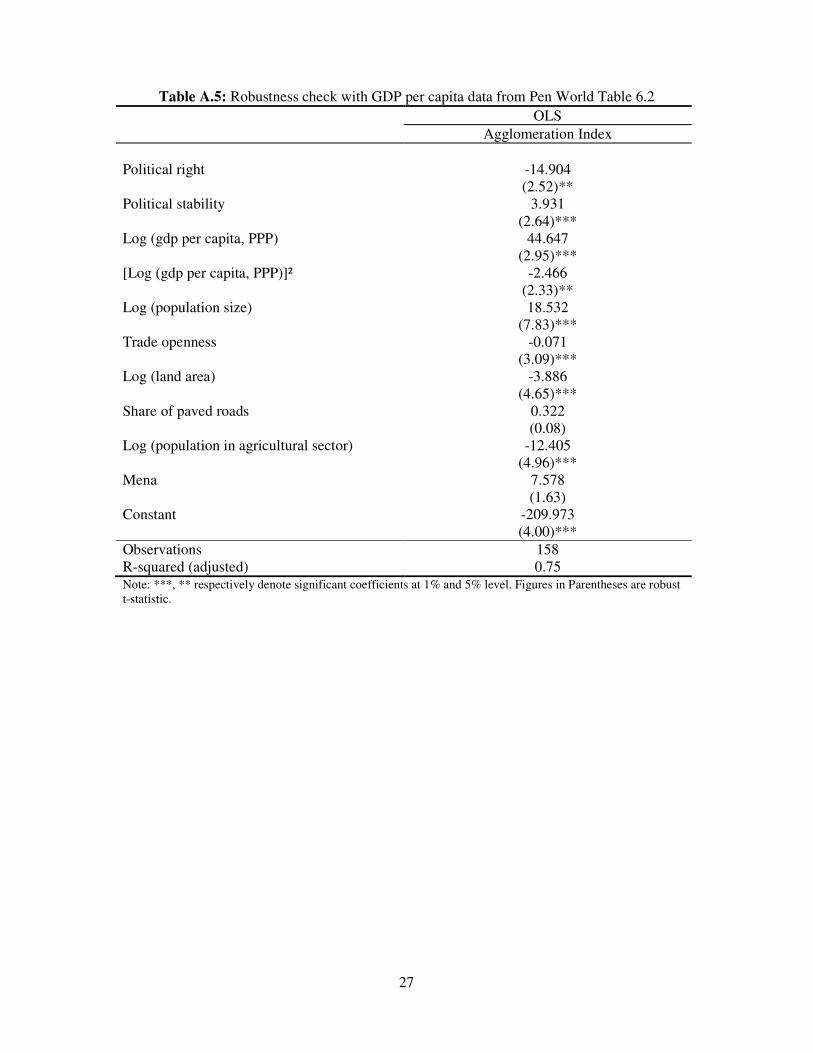
As a measurement of the level of economic development, we initially used data on
GDP per capita (2000 constant US dollar) from the World Development Indicators. As a
robustness check, we change the measurement of GDP per capita. We use data from the Pen
World Table 6.2. The GDP per capita from Pen World Table is corrected for purchasing
power parity.15 When we use GDP per capita from the Pen World Table, as it appears in Table
A.5 in appendix, our main results are not affected by this change. We still obtain an inverted-
U relation between spatial agglomeration and the level of income per capita. This time, the
turn point is approximately estimated at $8,550 (PPP converted).
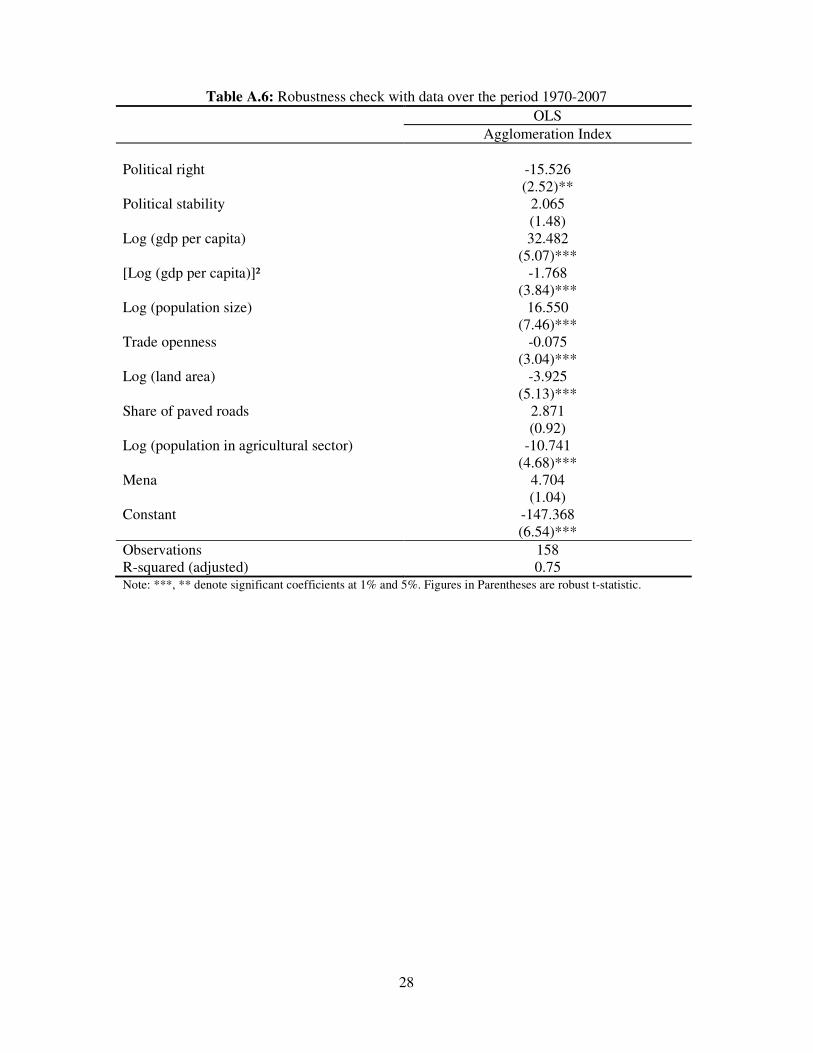
Most of the independent variables that we use cover the period 1960-2007. As an
additional robustness check of our results, we consider data over the sub period 1970-2007. It
is possible to imagine that the oil crisis induced some behavioural changes, including that of a
change in the habit of people in their places of residence. In a period of crisis, people may
decide to return to their villages instead of living in cities where the social network is less
effective. Therefore, we rerun our regressions with most our independent variables covering
14 For more description on coup d’état data, one might refer to the following link: http://www.systemicpeace.org/inscr/inscr.htm. 15 The Pen World Table 6.2 data are freely accessible at: http://pwt.econ.upenn.edu/php_site/pwt_index.php.
21
the period 1970-2007. In spite of this change, our main results remain unaffected: we still
obtain a negative and significant effect of the political rights index on the agglomeration
index, and the MENA dummy is still not significant. We also find a non linear relation
between the agglomeration index and GDP per capita. The return point is estimated at $9,782
(2000 US constant dollar).
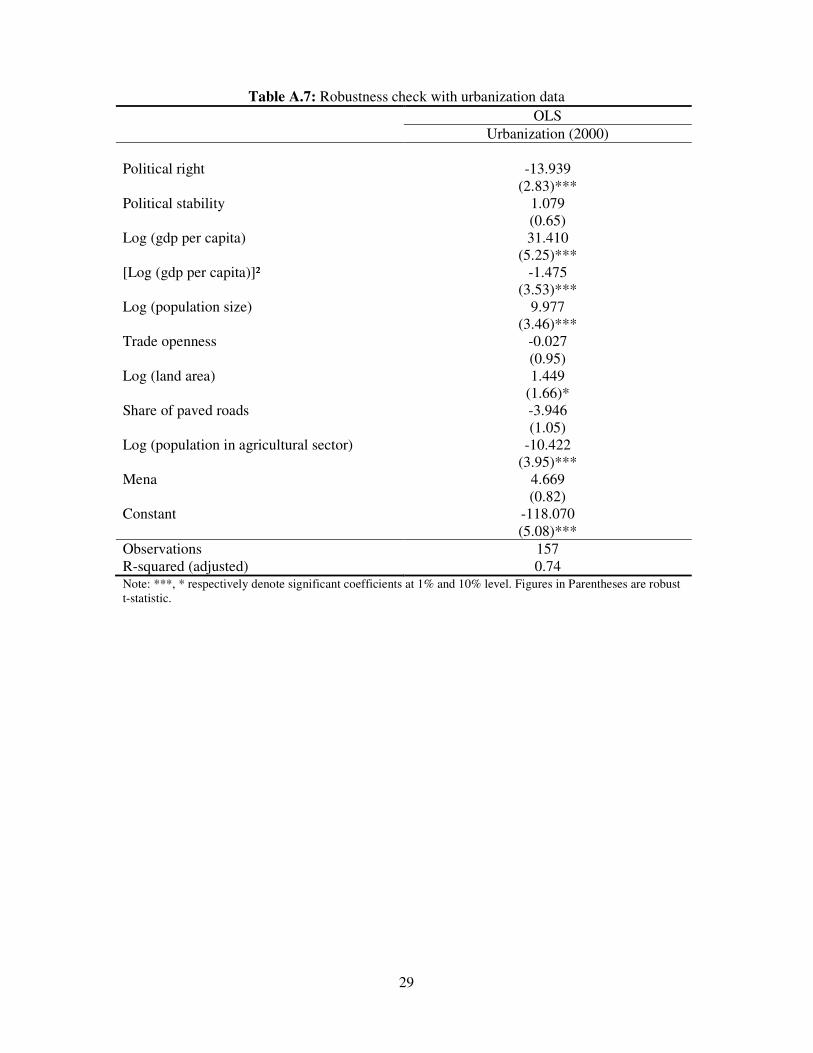
We also test the robustness of our results compared to the indicator of spatial
economic activities concentration. Instead of the agglomeration index, we use the urbanisation
rate data. We obtain data on the urbanisation rate for year 2000 from the same source as the
agglomeration index, i.e. from Table A2 of 2009 WDR. As we can see from Table A.7,
despite this change our main results remain unaffected.
5. Conclusion
In this paper we have analyzed the gaps in terms of political governance and spatial
imbalances between MENA countries and other world countries. We use two indicators for
spatial imbalances: the agglomeration rate and the ratio of urban-rural consumption. The
agglomeration rate measures the concentration of economic activities, while the ratio of
urban-rural consumption is a proxy for spatial differences in living standards between rural
and urban populations. Both indicators of spatial imbalances are from the World Bank. As
measurements of political governance, we use data on political rights from the Freedom
House (2009), and the political stability index from Kaufmann et al. (2009). Based on the
model of Ades and Glaeser (1995), we estimate the effect of political governance indicators
on the indicators of spatial imbalances. We use the results of these regressions to quantify the
potential gains for MENA countries in terms of spatial imbalances reduction if these countries
were to improve the quality of political governance.
In terms of political rights and political stability, the results of our statistical analysis
suggest that, the quality of political governance in MENA is lower compared to other country
groups: rest of the world, other developing countries and other lower middle income
countries. However, the degree of agglomeration in MENA is higher compared to the other
world countries.
We use cross-sectional data to estimate two different econometric models: one related
to the agglomeration of economic activities and the other related to the difference in
consumption per capita between urban and rural populations. The results of our regressions
22
show that the agglomeration model performs better. Indeed, for the same explanatory
variables, 7 out of 10 variables are significant in the agglomeration model, whereas only 3
variables are significant in the model related to the ratio of urban-rural consumption.
Moreover, the goodness of fit of the agglomeration model is 0.75, compared to 0.22 for the
consumption ratio model. Further research is needed to understand why this difference
between the two models exists. We focus our comments on the agglomeration model.
Our regressions, based on a sample of 182 countries, show that political rights index is
negatively and significantly related to the agglomeration index. An increase in the level of
political rights is therefore favourable for a reduction in spatial agglomeration. According to
our results, if MENA countries increased their average level of political rights (0.18) to the
average of the rest of the world (0.40), the payoff for MENA countries would be a reduction
of 4 percentage points in the agglomeration rate. The data also reveal an inverted-U
relationship between the agglomeration rate and the level of economic development. In
particular, we find a positive and significant relationship between the agglomeration rate and
GDP per capita up to the threshold of $11,200 (2000 US constant dollar), a level from which
an increase in GDP per capita would be accompanied by a reduction in the agglomeration
rate. This is a reasonable threshold; only 30 countries of our sample have reached such a level
of income per capita. We also find a negative and significant relationship between trade
openness and the agglomeration index. This result suggests that an increase in trade openness
would reduce spatial agglomeration. The main findings of this paper are robust.
Our results suggest that MENA countries should improve the quality of political
governance. More specifically, an improvement in the level of political rights would help
MENA countries to reduce spatial agglomeration. Our findings also suggest that MENA
countries could use other instruments associated with lower spatial concentration of economic
activities. Indeed, according to our results, MENA countries could take advantage of trade
openness to reduce spatial agglomeration.
23
Appendix
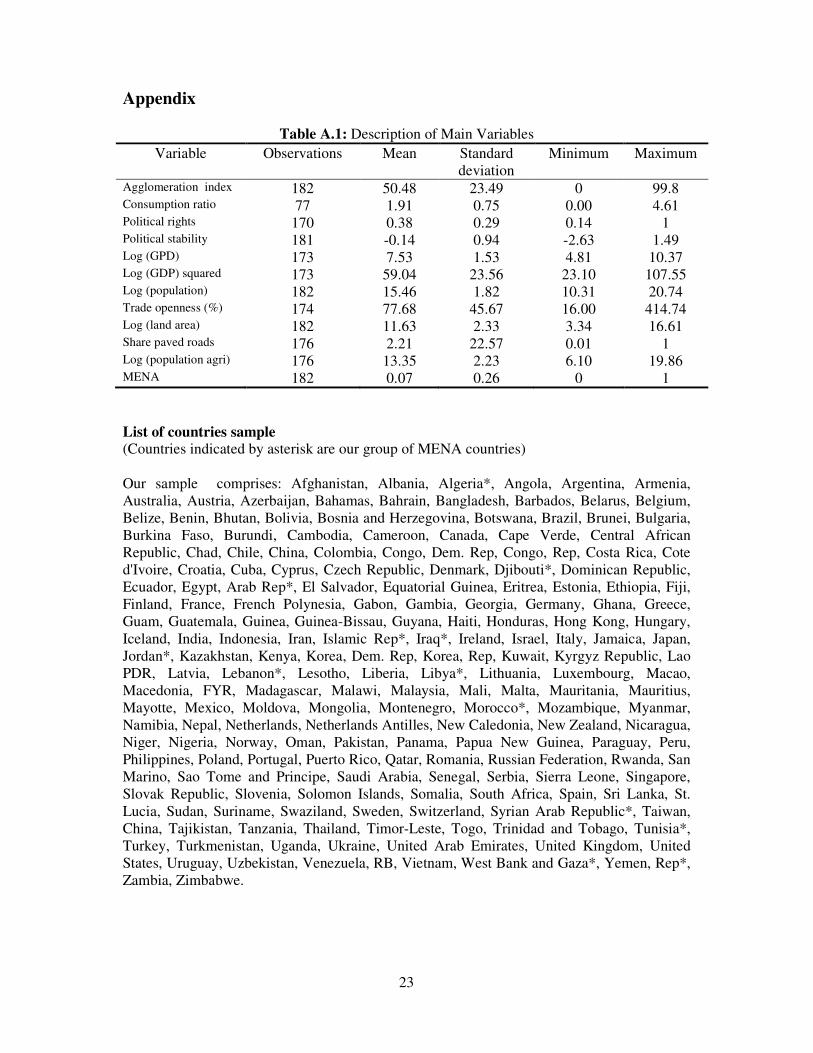
Table A.1: Description of Main Variables
Variable Observations Mean Standard deviation
Minimum Maximum
Agglomeration index 182 50.48 23.49 0 99.8 Consumption ratio 77 1.91 0.75 0.00 4.61 Political rights 170 0.38 0.29 0.14 1 Political stability 181 -0.14 0.94 -2.63 1.49 Log (GPD) 173 7.53 1.53 4.81 10.37 Log (GDP) squared 173 59.04 23.56 23.10 107.55 Log (population) 182 15.46 1.82 10.31 20.74 Trade openness (%) 174 77.68 45.67 16.00 414.74 Log (land area) 182 11.63 2.33 3.34 16.61 Share paved roads 176 2.21 22.57 0.01 1 Log (population agri) 176 13.35 2.23 6.10 19.86 MENA 182 0.07 0.26 0 1
List of countries sample (Countries indicated by asterisk are our group of MENA countries) Our sample comprises: Afghanistan, Albania, Algeria*, Angola, Argentina, Armenia, Australia, Austria, Azerbaijan, Bahamas, Bahrain, Bangladesh, Barbados, Belarus, Belgium, Belize, Benin, Bhutan, Bolivia, Bosnia and Herzegovina, Botswana, Brazil, Brunei, Bulgaria, Burkina Faso, Burundi, Cambodia, Cameroon, Canada, Cape Verde, Central African Republic, Chad, Chile, China, Colombia, Congo, Dem. Rep, Congo, Rep, Costa Rica, Cote d'Ivoire, Croatia, Cuba, Cyprus, Czech Republic, Denmark, Djibouti*, Dominican Republic, Ecuador, Egypt, Arab Rep*, El Salvador, Equatorial Guinea, Eritrea, Estonia, Ethiopia, Fiji, Finland, France, French Polynesia, Gabon, Gambia, Georgia, Germany, Ghana, Greece, Guam, Guatemala, Guinea, Guinea-Bissau, Guyana, Haiti, Honduras, Hong Kong, Hungary, Iceland, India, Indonesia, Iran, Islamic Rep*, Iraq*, Ireland, Israel, Italy, Jamaica, Japan, Jordan*, Kazakhstan, Kenya, Korea, Dem. Rep, Korea, Rep, Kuwait, Kyrgyz Republic, Lao PDR, Latvia, Lebanon*, Lesotho, Liberia, Libya*, Lithuania, Luxembourg, Macao, Macedonia, FYR, Madagascar, Malawi, Malaysia, Mali, Malta, Mauritania, Mauritius, Mayotte, Mexico, Moldova, Mongolia, Montenegro, Morocco*, Mozambique, Myanmar, Namibia, Nepal, Netherlands, Netherlands Antilles, New Caledonia, New Zealand, Nicaragua, Niger, Nigeria, Norway, Oman, Pakistan, Panama, Papua New Guinea, Paraguay, Peru, Philippines, Poland, Portugal, Puerto Rico, Qatar, Romania, Russian Federation, Rwanda, San Marino, Sao Tome and Principe, Saudi Arabia, Senegal, Serbia, Sierra Leone, Singapore, Slovak Republic, Slovenia, Solomon Islands, Somalia, South Africa, Spain, Sri Lanka, St. Lucia, Sudan, Suriname, Swaziland, Sweden, Switzerland, Syrian Arab Republic*, Taiwan, China, Tajikistan, Tanzania, Thailand, Timor-Leste, Togo, Trinidad and Tobago, Tunisia*, Turkey, Turkmenistan, Uganda, Ukraine, United Arab Emirates, United Kingdom, United States, Uruguay, Uzbekistan, Venezuela, RB, Vietnam, West Bank and Gaza*, Yemen, Rep*, Zambia, Zimbabwe.
24
Table A.2: Robustness check with the Polity 2 index OLS Agglomeration Index
Polity 2 -0.581 (2.85)*** Political stability 1.177 (0.79) Log (gdp per capita) 39.220 (5.52)*** [Log (gdp per capita)]² -2.230 (4.30)*** Log (population size) 17.017 (6.55)*** Trade openness -0.055 (2.06)** Log (land area) -3.992 (5.05)*** Share of paved roads 1.803 (0.57) Log (population in agricultural sector) -10.553 (4.07)*** Mena 3.742 (0.79) Constant -184.475 (7.04)***
Observations 148 R-squared (adjusted) 0.76 Note: ***, ** respectively denote significant coefficients at 1% and 5% level. Figures in Parentheses are robust t-statistic.
25
Table A.3: Robustness check with the voice and accountability index OLS Agglomeration Index
Voice & accountability -4.389 (2.55)** Political stability 3.467 (1.94)* Log (gdp per capita) 37.561 (5.77)*** [Log (gdp per capita)]² -2.115 (4.62)*** Log (population size) 17.008 (7.22)*** Trade openness -0.059 (2.49)** Log (land area) -4.100 (5.18)*** Share of paved roads 0.319 (0.10) Log (population in agricultural sector) -10.419 (4.45)*** Mena 3.296 (0.72) Constant -178.620 (7.48)***
Observations 159 R-squared (adjusted) 0.74 Note: ***, **, * respectively denote significant coefficients at 1%, 5% and 10% level. Figures in Parentheses are robust t-statistic.
26
Table A.4: Robustness check with coup d’état index
OLS
Agglomeration Index
Political right -15.569 (3.26)*** Coup d’état -14.424 (0.50) Log (gdp per capita) 31.672 (4.87)*** [Log (gdp per capita)]² -1.656 (3.66)*** Log (population size) 16.199 (7.90)*** Trade openness -0.057 (2.63)*** Log (land area) -3.669 (4.74)*** Share of paved roads 2.338 (0.72) Log (population in agricultural sector) -10.562 (5.10)*** Mena 4.582 (1.03) Constant -146.597 (6.38)***
Observations 147 R-squared (adjusted) 0.77 Note: ***, denote significant coefficients at 1%. Figures in Parentheses are robust t-statistic.
27
Table A.5: Robustness check with GDP per capita data from Pen World Table 6.2 OLS Agglomeration Index Political right -14.904 (2.52)** Political stability 3.931 (2.64)*** Log (gdp per capita, PPP) 44.647 (2.95)*** [Log (gdp per capita, PPP)]² -2.466 (2.33)** Log (population size) 18.532 (7.83)*** Trade openness -0.071 (3.09)*** Log (land area) -3.886 (4.65)*** Share of paved roads 0.322 (0.08) Log (population in agricultural sector) -12.405 (4.96)*** Mena 7.578 (1.63) Constant -209.973 (4.00)***
Observations 158 R-squared (adjusted) 0.75 Note: ***, ** respectively denote significant coefficients at 1% and 5% level. Figures in Parentheses are robust t-statistic.
28
Table A.6: Robustness check with data over the period 1970-2007 OLS Agglomeration Index Political right -15.526 (2.52)** Political stability 2.065 (1.48) Log (gdp per capita) 32.482 (5.07)*** [Log (gdp per capita)]² -1.768 (3.84)*** Log (population size) 16.550 (7.46)*** Trade openness -0.075 (3.04)*** Log (land area) -3.925 (5.13)*** Share of paved roads 2.871 (0.92) Log (population in agricultural sector) -10.741 (4.68)*** Mena 4.704 (1.04) Constant -147.368 (6.54)***
Observations 158 R-squared (adjusted) 0.75 Note: ***, ** denote significant coefficients at 1% and 5%. Figures in Parentheses are robust t-statistic.
29
Table A.7: Robustness check with urbanization data OLS Urbanization (2000) Political right -13.939 (2.83)*** Political stability 1.079 (0.65) Log (gdp per capita) 31.410 (5.25)*** [Log (gdp per capita)]² -1.475 (3.53)*** Log (population size) 9.977 (3.46)*** Trade openness -0.027 (0.95) Log (land area) 1.449 (1.66)* Share of paved roads -3.946 (1.05) Log (population in agricultural sector) -10.422 (3.95)*** Mena 4.669 (0.82) Constant -118.070 (5.08)*** Observations 157 R-squared (adjusted) 0.74 Note: ***, * respectively denote significant coefficients at 1% and 10% level. Figures in Parentheses are robust t-statistic.
30
References
Ades Alberto F, Glaeser E.L. 1995. “Trade and Circuses: Explaining Urban Giants.” Quarterly Journal of Economics 110: 195-227. Amos O.M. 1988. “Unbalanced Regional Growth and Regional Income Inequality in the
Latter Stages of Development.” Regional Science and Urban Economics 18: 549-566. Banerjee Abhijit V, Iyer L. 2005. “History, Institutions and Economic Performance: The
Legacy of Colonial Land Tenure Systems in India.” American Economic Review 95: 1190–1213.
Christian Science Monitor. (2007, December 7). “Ahmadinejad: rock star in rural Iran.”
Christian Science Monitor.
Bruhn M, Gallego, Francisco A. 2007. “Good, Bad, and Ugly Colonial Activities: Studying Development Across the Americas.” Unpublished paper.
Fujita M., Thisse J.F. 2002. Economics of Agglomeration. Cambridge: Cambridge
University Press.
Henderson J. V. 2002. “Urbanization in Developing Countries.” World Bank Research
Observer 17(1): 89–112. Kapur S, Kim S. 2006. “British Colonial Institutions and Economic Development in India.”
NBER Working Paper #12613. National Bureau of Economic Research, Cambridge, MA.
Kaufmann D, Kraay A, Mastruzzi M. 2009. “Governance Matters VIII Aggregate and
Individual Governance Indicators 1996–2008.” World Bank Policy Research Working Paper no. 4978. Washington, D.C.: World Bank.
_________ 2008. “Governance Matters VII Aggregate and Individual Governance Indicators 1996-2007.” World Bank Policy Research Working Paper no. 4654. Washington, D.C.: World Bank.
Kim S. 2007. “Institutions and U.S. Regional Development: A Study of Massachusetts and
Virginia.” NBER Working Paper #13431. National Bureau of Economic Research, Cambridge, MA.
_________ 2008a. “Spatial Inequality and Economic Development: Theories, Facts, and
Policies.” Commission on Growth and Development Working Paper no. 16. Washington, D.C.: Commission on Growth and Development.
_________ 2008b. “Political Institutions, Federalism and U.S. Urban Development: The Case of American Exceptionalism.” In progress.
Krugman P. 1991. “Increasing Returns and Economic Geography.” Journal of Political
Economy XCIX: 483-99.
_________ 1998. “What’s New about the New Economic Geography?” Oxford Review
31
of Economic Policy 14: 7-17.
Krugmann P, Livas Elizondo, R. 1996. Trade Policy and the Third World Metropolis.” Journal of Development Economics 49: 137-150. Paluzie E. 2001. “Trade Policy and Regional Inequalities.” Papers in Regional Science
80: 67-86. Petrakos B, Branda J. 1989. “Metropolitan Concentration in Developing Countries.”
Kyklos 42: 556-578. Petrakos G, Rodríguez-Pose A., Rovolis, A. 2005. “Growth, Integration and Regional
Inequality in Europe.” Environment and Planning 37: 1837-1855. Puga D, Venables Anthony J. 1999. “Agglomeration and Economic Development: Import
Substitution vs. Trade Liberalisation.” Economic Journal 109: 292–311. Rodríguez-Pose Andrés, Ezcurra R. 2010. “Does Decentralization matter for Regional
Disparities? A Cross-Country Analysis.” Journal of Economic Geography 10(5): 619- 644.
_________ 2009a. “Does Decentralization matter for Regional Disparities? A Cross-Country
Analysis.” Imdea Working Papers Series in Economics and Social Sciences no. 2009/04. Madrid: Imdea.
_________ 2009b. “Does Decentralization matter for Regional Disparities? A Cross-Country
Analysis.” SERC Discussion Paper no.25 (July2009). London: SERC. Sokoloff K L, Zolt E. M. 2006. “Inequality and the Evolution of Institution of Taxation:
Evidence from the Economic History of the Americas.” Unpublished paper. Terrasi M. 1999. “Convergence and Divergence across Italian Regions.” Annals of
Regional Science 33: 491-510. Thisse J.F. 2000. “Agglomeration and Regional Imbalance: Why? And is it Bad?”
Papers of the European Investment Bank 5: 47-67. Williamson J. G. 1965. “Regional Inequality and the Process of National Development: A
Description of Patterns.” Economic Development and Cultural Change 13: 3-45. World Bank. 2003. Better Governance for Development in the Middle East and North Africa:
Enhancing Inclusiveness and Accountability. Washington, DC: World Bank. _________ 2008. 2009 World Development Report: Reshaping Economic geography.
Washington, DC: World Bank. _________ 2009. World Development Indicators Database. Washington, DC: World Bank.
_________2011. Poor Places, Thriving People. How the Middle East and North
Africa Can Rise Above Spatial Disparities. Washington, DC: World Bank.
32
MENA Working Paper Series
No. 1 Has Labor Migration Promoted Economic Integration in the Middle East? June 1992. Nemat Shafik, The World Bank and Georgetown University.
No. 2 The Welfare Effects of Oil Booms in a Prototypical Small Gulf State. September 1992. Ahmed Al-Mutuwa, United Arab Emirates University and John T.
Cuddington, Georgetown University.
No. 3 Economic and Social Development in the Middle East and North Africa. October 1992. Ishac Diwan and Lyn Squire, The World Bank.
No. 4 The Link Between Trade Liberalization and Multi-Factor Productivity: The Case of Morocco. February 1993. Mona Haddad, The World Bank.
No. 5 Labor Markets in the Middle East and North Africa. February 1993. Christopher A. Pissarides, The London School of Economics and Political
Science.
No. 6 International Competitiveness of the Private Industry and the Constraints to its
Development: The Case of Morocco. June 1993. Hamid Alavi, The World Bank.
No. 7 An Extended RMSM-X Model for Egypt: Quantifications of Market-Oriented
Reforms. September 1993. Karsten Nimb Pedersen, The World Bank.
No. 8 A Report on the Egyptian Tax System. October 1993. Mark Gersovitz, Roger H. Gordon and Joel Slemrod, The World Bank.
No. 9 Economic Development and Cooperation in the Middle East and North Africa.
November 1993. Ishac Diwan and Lyn Squire, The World Bank.
No. 10 External Finance in the Middle East: Trends and Prospects. December 1993. Ishac Diwan, John Underwood and Lyn Squire, The World Bank.
No. 11 Tax Incidence on Agriculture in Morocco (1985-1989). April 1994. Jean-Paul Azam, CERDI, University of Auvergne, Clermont-Ferrand
(France) et CSAE, Oxford (U.K).
No. 12 The Demographic Dimensions of Poverty in Jordan. August 1994. Chantal Worzala, The World Bank.
No. 13 Fertility and Family Planning in Iran. November 1994. Rodolfo A. Bulatao and Gail Richardson, The World Bank.
No. 14 Investment Efficiency, Human Capital & Migration A Productivity Analysis of the
Jordanian Economy. May 1995. Gaston Gelos, Yale University, Department of Economics.
No. 15 Tax Effects on Investment in Morocco. August 1995. David Sewell, Thomas Tsiopoulos and Jack Mintz, The World Bank.
No. 16 Reconstruction in Lebanon: Challenges for Macroeconomic Management. April 1999. Daniela Gressani and John Page, The World Bank.
33
No. 17 Towards a Virtuous Circle: A Nutrition Review of the Middle East and North Africa. August 1999. Regional HNP Knowledge Management, The World Bank.
No. 18 Has Education Had a Growth Payoff in the MENA Region? December 1999. Lant Pritchett, The World Bank.
No. 19 Rationalizing Public Sector Employment in the MENA Region.
December 2000. Elizabeth Ruppert Bulmer, The World Bank.
No. 20 Achieving Faster Economic Growth in Tunisia. March 2001. Auguste T. Kouamé, The World Bank.
No. 21 Trade Options for the Palestinian Economy: Some Orders of Magnitude. March 2001. Claus Astrup and Sébastien Dessus, The World Bank.
No. 22 Human Capital and Growth: The Recovered Role of Educational Systems. April 2001. Sébastien Dessus, The World Bank.
No. 23 Governance And The Business Environment In West Bank/Gaza. May 2001. David Sewell, The World Bank.
No. 24 The Impact of Future Labor Policy Options on the Palestinian Labor Market. June 2001. Elizabeth Ruppert Bulmer, The World Bank.
No. 25 Reform and Elusive Growth in the Middle-East – What Has Happened in the 1990s? July 2002. Dipak Dasgupta, Jennifer Keller and T.G. Srinivasan, The World Bank.
No. 26 Risks and Macro-Economic Impacts of HIV-AIDS in the Middle East and North
Africa: Why waiting to intervene can be costly. July 2002. David A. Robalino, Carol Jenkins and Karim El Maroufi, The World Bank.
No. 27 Exchange Rate Regime and Competitiveness of Manufactured Exports: The Case of
MENA Countries. August 2002. Mustapha Kamel Nabli and Marie-Ange Véganzonès-Varoudakis, The
World Bank.
No. 28 Governance and the Investment Climate in Yemen. September 2002. Arup Banerji and Caralee McLiesh, The World Bank.
No. 29 Exporting Labor or Goods? Long-term Implications for the Palestinian Economy. October 2002. Claus Astrup and Sébastien Dessus, The World Bank.
No. 30 Poverty and Transfers in Yemen. December 2002. Dominique van de Walle, The World Bank.
No. 31 Yemen and the Millennium Development Goals. March 2003. Qaiser Khan and Susan Chase, The World Bank.
No. 32 Making Trade Work for Jobs : International Evidence and Lessons for MENA.
July 2003. Dipak Dasgupta, Mustapha Kamel Nabli, Christopher Pissarides (LSE), and
Aristomene Varoudakis, The World Bank.
No. 33 Opening up Telecommunications to Competition and MENA Integration in the World Economy. July 2003. Carlo Maria Rossotto, Khalid Sekkat and Aristomene
Varoudakis, The World Bank.
No. 34 Growth, Private Investment and the Cost of Doing Business in Tunisia. February 2004. Anós Casero, Paloma, and Aristomene Varoudakis. The World Bank.
34
No. 35 Current World Trade Agenda - Issues and Implications for the MENA Region. May 2004. Dipak Dasgupta, Mustapha Kamel Nabli, T.G. Srinivasan and Aristomene
Varoudakis, The World Bank.
No. 36 Reforms and Growth in MENA Countries - New Empirical Evidence. May 2004. Mustapha Kamel Nabli, and Marie-Ange Véganzonès-Varoudakis, The World
Bank.
No. 37 Gainers and Losers from Trade Reform in Morocco. August 2004. Martin Ravallion and Michael Lokshin, The World Bank.
No. 38 Fiscal and Public Debt Sustainability in Egypt.
September 2004. Pedro Alba, Sherine El-Shawarby and Farrukh Iqbal, The World Bank.
No. 39 Trade and Foreign Exchange Liberalization, Investment Climate and FDI in the
MENA Countries. September 2004. Khalid Sekkat and Marie-Ange Véganzonès-Varoudakis, The World Bank.
No. 40 Migration and Trade in MENA – Problems or Solutions? October 2004. Sara Johansson de Silva and Carlos Silva-Jáuregui, The World Bank.
No. 41 Do Basic Services and Poverty Programs Reach Morocco’s Poor? Evidence from
Poverty and Spending Maps October 2004. Dominique van de Walle, The World Bank.
No. 42 Economic Growth in Egypt: Constraints and Determinants
October 2005. Anton Dobronogov and Farrukh Iqbal, The World Bank.
No. 43 Lebanon – Trade and Competition Policies for Growth: A General Equilibrium
Analysis May 2006. Sébastien Dessus and Joey Ghaleb, The World Bank.
No. 44 Trade and Investment Integration of the Maghreb May 2006. Paul Brenton, Eugenia Baroncelli and Mariem Malouche, The World Bank.
No. 45 Total Factor Productivity in Tunisian Manufacturing Sectors: Convergence or
Catch-up with OECD Members? June 2006. Mohamed El Arbi Chaffai, Patrick Plane and Dorra Triki Guermazi
No. 46 Implicit Pension Debt in the Middle East and North Africa: Magnitude and Fiscal
Implications June 2006. David A. Robalino and Tatyana Bogomolova, The World Bank.
No. 47 Water, Food Security and Agricultural Policy in the Middle East and North Africa
Region July 2006. Shobha Shetty, The World Bank.
No. 48 Explaining Large Inventories: the Case of Iran
September 2006. Anton Dobronogov and Ahmad R. Jalali-Naini, The World Bank.
No. 49 Job Creation in a High Growth Environment: The MENA Region
December 2007. Mustapha K. Nabli, Carlos Silva- Jáuregui and Sara Johansson de
Silva, The World Bank.

35
No. 50 Economics of "Policy-Induced" Fragmentation: The Costs of Closures Regime to
West Bank and Gaza January 2008. Sebnem Akkaya, Norbert Fiess, Bartlomiej Kaminski and Gael Raballand,
The World Bank.
No. 51 Centralization, Decentralization and Conflict in the Middle East and North Africa April 2011. Mehmet Serkan Tosun and Serdar Yilma, The World Bank.