, r.e. massey and m.c. shannon agricultural and applied ...€¦ · formulation of available...
TRANSCRIPT
J.A. Lory1, R.E. Massey2 and M.C. Shannon3
1Plant Sciences, 2Agricultural and Applied Economics, 3Animal ScienceUniversity of Missouri, Columbia MO 65211

Software is commonly used to optimize diets based on nutritional needs of the animal while identifying low-cost formulation of available ingredients.
Feed optimization programs only consider input costs for evaluating low-cost rations.
National Swine Nutrition Guide (NSNG) Diet Formulation and Evaluation Software (NSNG, 2010) estimates manure fertilizer value of different diets Does not include manure value as part of the optimization routine.
Diet recommendations Available P was reduced in 2007 for 50-130 lb pigs; constant,
otherwise. Ca was reduced in 2007 for all diets – affects Ca:P ratios that can
affect P in the manure. Amino Acid changed (some increased, some decreased) in 2007 – can
affect N in manure by affecting crude protein in diet.

Regulatory and voluntary strategy to minimize impact of manure management on water quality is to fully utilize manure nutrients as fertilizer for crop production(USEPA, 2008).
Fertilizer nutrients can be a significant component of net income on swine operations (e.g. Lory et al., 2004).
Fertilizer value of nutrients excreted by pigs can vary widely due to many factors including: diet, manure handling system, method of application and soil nutrient status.

0
100
200
300
400
500
600
2002 2003 2004 2005 2006 2007 2008 2009 2010 2011 2012
Co
st
($
/to
n)
Corn Soybean Meal (47.5%) DDG
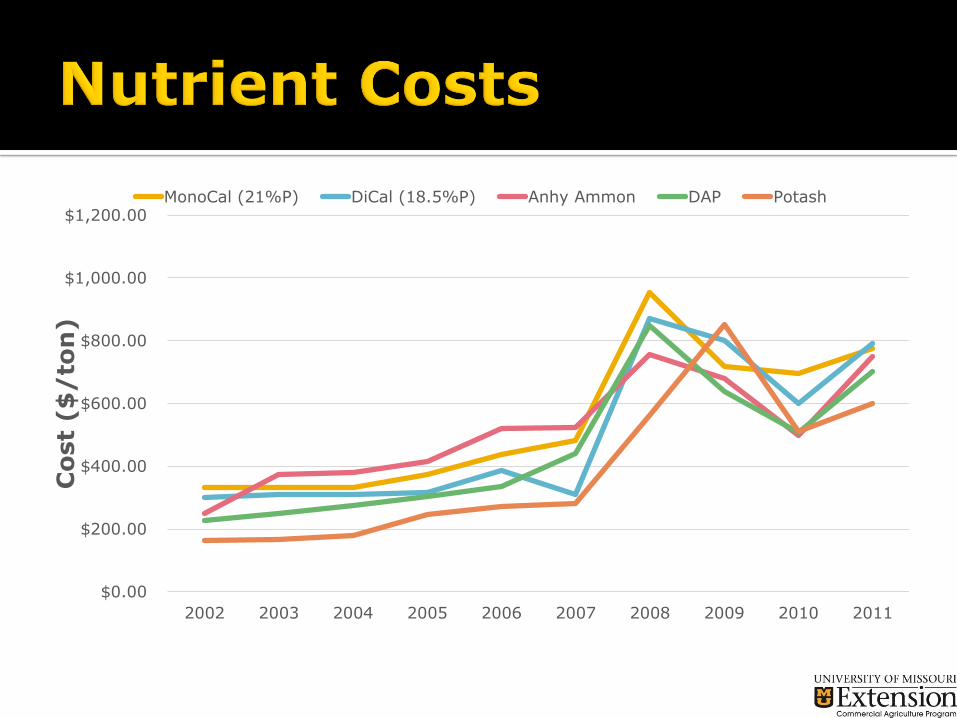
$0.00
$200.00
$400.00
$600.00
$800.00
$1,000.00
$1,200.00
2002 2003 2004 2005 2006 2007 2008 2009 2010 2011
Co
st
($
/to
n)
MonoCal (21%P) DiCal (18.5%P) Anhy Ammon DAP Potash

Assess the impact of incorporating manure into feed management decisions.
How have changes in low-cost diets over the period from 2002 to 2011 affected estimated fertilizer value of manure?
Period covers the widespread adoption of incorporating corn dried distillers grains with solubles (DDG) into swine diets.
Determine how low-cost diets would have changed if fertilizer value of excreted was integrated as a c0-product into linear programming feed optimization routines.
The goal is no longer least cost ration formulation but jointly considering ration cost and manure value.

Evaluated four diets: grower-1 (23-35 kg pigs) and finish-2 (91-113 kg pigs) diets, with or without DDG as a feed component option.
Diet composition constraints based on Kansas State University Swine Nutrition Guide (1998; 2007).
In DDG diets maximum constraint was 40% inclusion for grower-1 and 30% for finish-2.
Feed component composition based on NSNG (2010). Feed costs for corn, soybean meal (SBM) and distillers grains with
solubles (DDG) based on USDA Annual Prices Summary (2001-2011). Prices for minerals and phytase based on production records from the
Missouri Swine Feed Group (personal communication). Fertilizer value of N, P and K based on USDA Annual Prices Summary
(2001-2011). Nutrient retention (N, P, K) of pigs based on equations in NSNG (2010). Nutrient availability for crop production of excreted nutrients based on
slurry tank manure injected into soil. Excreted N, P and K were assumed to be 70%, 100% and100% available, respectively.
Phytase effectiveness based on Naturophos option in NSNG (2010). Linear programming optimization routines executed in Microsoft Excel
Solver.

Key assumptions: Excreted nutrients are the difference between fed nutrient
and retained nutrients.
Over feeding nutrients in swine diets does not further increase nutrient retention of pigs(e.g. Henley et al., 2012;McDonnell et al., 2011) .
Curvilinear relationship between phytase units (FTU kg-1) and P availability (%) linearized for optimization routine by transforming relationships into six linear segments with decreasing effectiveness.
Farmers received full fertilizer value for plant-available manure N, P and K.

Results

$0.00
$50.00
$100.00
$150.00
$200.00
$250.00
$300.00
$350.00
Cost
($/t
on)
50-70 lb phase
No DDG 40% DDG
$0.00
$50.00
$100.00
$150.00
$200.00
$250.00
$300.00
$350.00
170-210 lb phase
No DDG 30% DDG

0
5
10
15
20
25
30
35
40
45
lb.
N/t
on f
eed)
50-70 lb phase
No DDG 40% DDG
1997 Constraints 2007 Constraints
0
5
10
15
20
25
30
35
40
45
210-250 lb phase
No DDG 30% DDG
1997 Constraints 2007 Constraints

0
5
10
15
20
25
lb.
P2O
5/t
on feed)
50-70 lb phase
No DDG 40% DDG
1997 Constraints 2007 Constraints
0
5
10
15
20
25
210-250 lb phase
No DDG 30% DDG
1997 Constraints 2007 Constraints

0
5
10
15
20
25
lb.
K2O
/ton feed)
50-70 lb phase
No DDG 40% DDG
1997 Constraints 2007 Constraints
0
5
10
15
20
25
210-250 lb phase
No DDG 30% DDG
1997 Constraints 2007 Constraints

0
2
4
6
8
10
12
14
lb.
P/t
on feed)
No DDG in diet
Corn P SBM P DDG P Mineral P
1997 Constraints 2007 Constraints
0
2
4
6
8
10
12
14
40% DDG in diet
Corn P SBM P DDG P Mineral P
1997 Constraints 2007 Constraints

0.00
5.00
10.00
15.00
20.00
25.00
30.00
35.00
40.00
45.00
2003 2004 2005 2006 2007 2008 2009 2010 2011
Valu
e (
$/
ton
of
feed
)
50-70 lb No DDG 50-70 lb 40% DDG 210-250 lb No DDG 210-250 lb 30% DDG
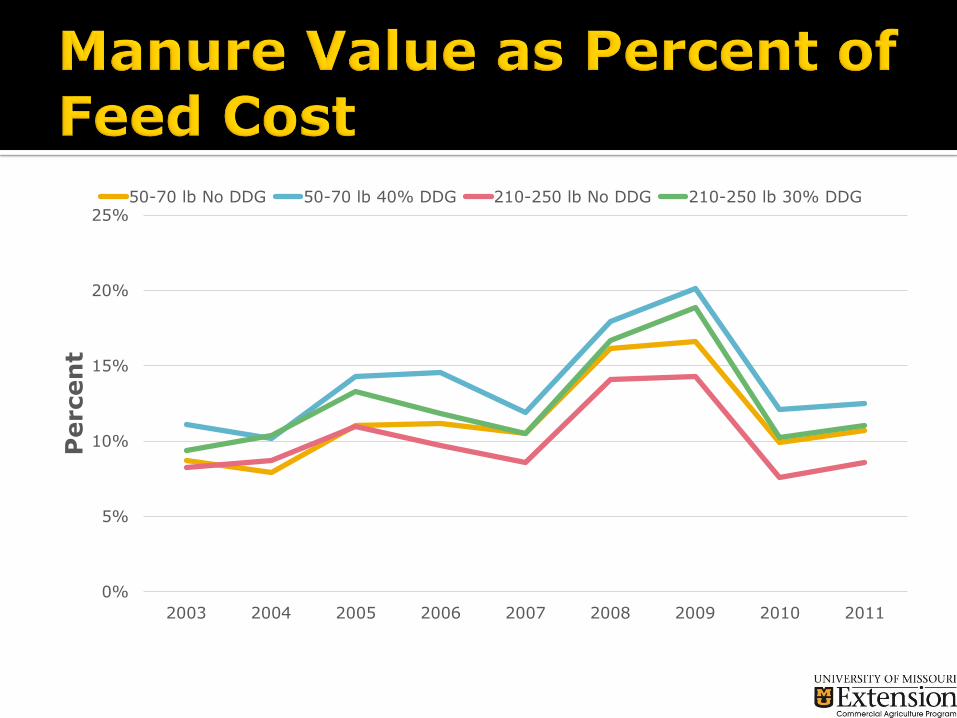
0%
5%
10%
15%
20%
25%
2003 2004 2005 2006 2007 2008 2009 2010 2011
Percen
t
50-70 lb No DDG 50-70 lb 40% DDG 210-250 lb No DDG 210-250 lb 30% DDG

Feeder Pig, $38.55
Feed, $107.18
Variable Costs, $22.19
Operating Interest, $3.32
Fixed Costs, $8.45
Costs: $184.04 /hog (58% feed)Loss: $ 12.47 /hogManure1: $ 8.41 /hog
1ISU analysis did not include manure value.

-40.00
-30.00
-20.00
-10.00
0.00
10.00
20.00
30.00
40.00
2003 2004 2005 2006 2007 2008 2009 2010 2011 2012
Includes Full Manure Value
No Manure Value
Pro
fit/
Lo
ss (
$/p
ig)

DDG always the low-cost diet.
DDG always increased diet CP and excreted N.
In Grower diets, DDG diet is the low-P diet. In Finish diets, Corn-SBM diets is the low-P diet.
Differences are small.
There are fewer manure nutrients due to diet changes over time; but increasing fertilizer costs have made manure nutrients more valuable.

Results

0
2
4
6
8
10
12
14
lb.
P/t
on feed)
Manure value not in
optimizationCorn P SBM P DDG P MonoCal P DiCal P
1997 Constraints 2007 Constraints
0
2
4
6
8
10
12
14
Manure value in
optimization
Corn P SBM P DDG P
MonoCal P Dical P
1997 Constraints 2007 Constraints

Change ($ Mg-1)
Year Diet Cost Manure Value Net Value
2007 1.91 2.45 0.542008 0.00 0.00 0.002009 0.00 0.00 0.002010 0.35 0.38 0.042011 1.03 1.20 0.17

0
1
2
3
4
5
6
7
8
9
10
lb.
P/t
on feed)
Manure value not in
optimizationCorn P SBM P DDG P MonoCal P DiCal P
1997 Constraints 2007 Constraints
0
1
2
3
4
5
6
7
8
9
10
Manure value in
optimizationCorn P SBM P DDG P
MonoCal P Dical P
1997 Constraints 2007 Constraints
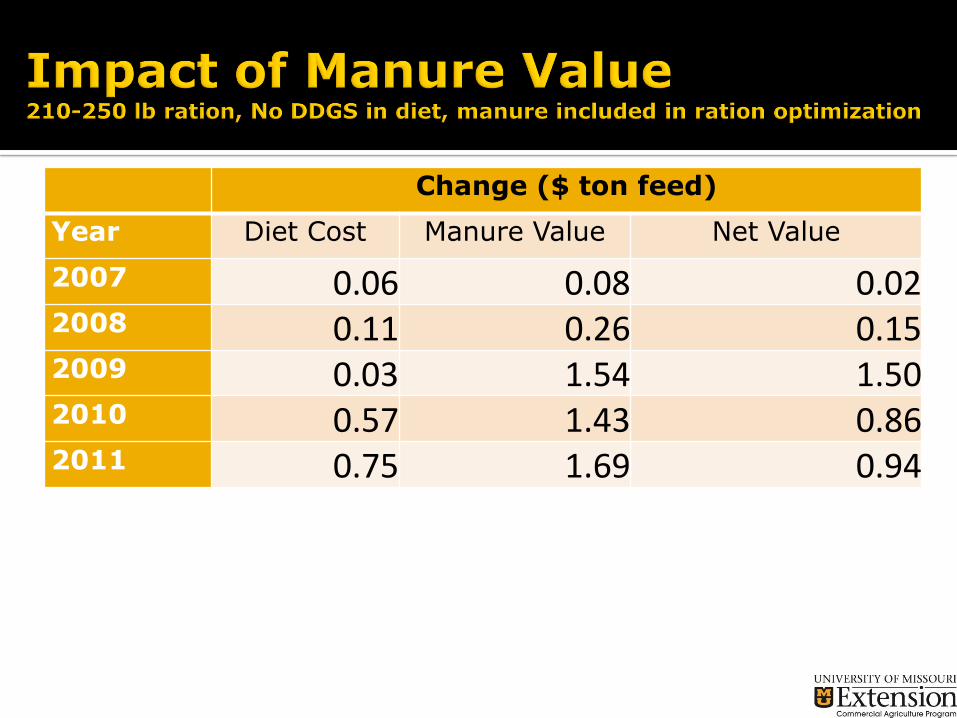
Change ($ ton feed)
Year Diet Cost Manure Value Net Value
2007 0.06 0.08 0.022008 0.11 0.26 0.152009 0.03 1.54 1.502010 0.57 1.43 0.862011 0.75 1.69 0.94
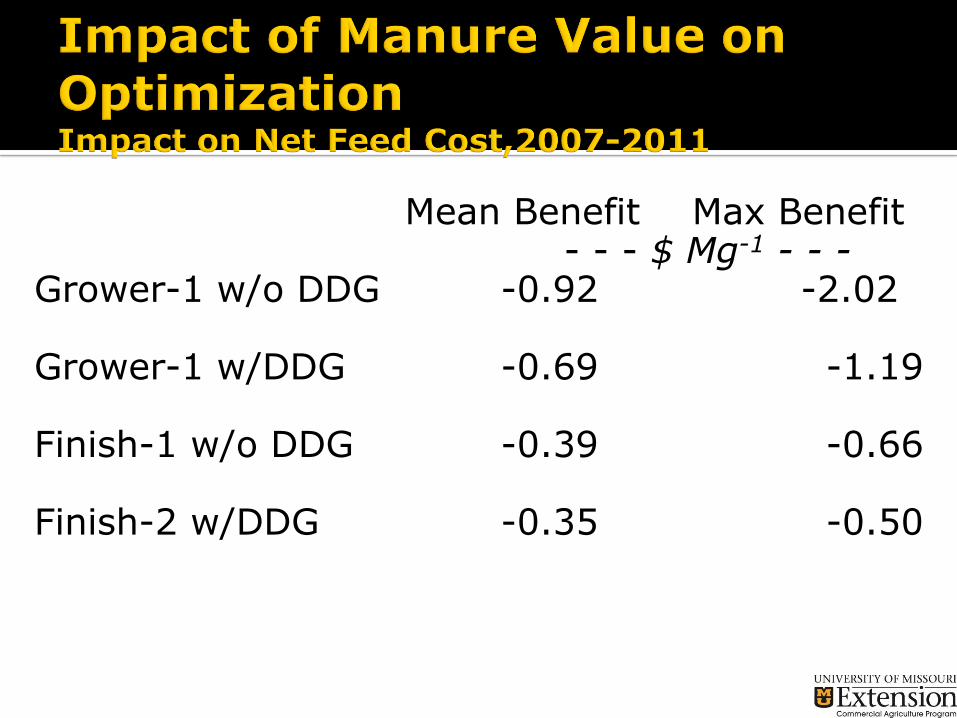
Mean Benefit Max Benefit- - - $ Mg-1 - - -
Grower-1 w/o DDG -0.92 -2.02
Grower-1 w/DDG -0.69 -1.19
Finish-1 w/o DDG -0.39 -0.66
Finish-2 w/DDG -0.35 -0.50

$0.00 $0.20 $0.40 $0.60 $0.80 $1.00
50-70
70-90
90-130
130-170
170-210
210-250
Net Feed Cost Difference between Manure included and Manure not included in optimization
Net Feed Cost = Feed Cost –Manure Value
DDG
No DDG

1. Had no effect on diet composition 2001-2006.
2. Small benefits but worth evaluating in 2007-2011.
3. Eliminated phytase from diets containing DDG.
4. Reduced or eliminated phytase in C-SBM diets. Controlled by energy in diet and P-density of P sources.

Manure is a significant source of value to livestock producers.
Opportunities exist to integrate the value of manure into the least cost diet decision so that net income is optimized. Impact is currently small.
Caveat: cost of diets are certain expense; value of manure is uncertain revenue.
Minimizing P Excretion in C-SBM diets still limited by P availability of corn.