storage.googleapis.com...part 3 1. start powerpoint application. open learning curve presentation....
TRANSCRIPT
Chapter 1: Slides with SmartArt & Pictures ................................. 1
Working with SmartArt
Formatting Pictures
Adjust Group Buttons
Picture Styles Group Buttons
Chapter 2: Slides with Charts & Shapes .................................... 12
Working with Charts
Aligning Shapes
Distributing Shapes Evenly
Grouping and Ungrouping Shapes
Ordering Shapes
Chapter 3: Slides with Media & Links ....................................... 21
Editing Media
Adding Bookmark to Media
Formatting Media
Linking Slides Using Hyperlinks
Linking Slides Using Action Buttons
Chapter 4: Slides with Animations ........................................... 30
Adding and Removing Animation Effects
Multiple Animations
Animation Painter
Animation Pane
Animation Effects Options
Chapter 5: Hardware and Software .......................................... 41
Hardware Components
Software Components
Book 5
Sample
Cop
y

Chapter 6: Formatting Pictures in Word .................................... 46
Wrapping Text
Picture Sizing
Picture Adjustment
Picture Styles
Chapter 7: Layout & Design in Word ......................................... 54
Page Setup Options
Columns and Text Boxes
Header/Footer and Styles
Printing a Document
Chapter 8: Indent & Tabs in Word ............................................. 63
Using Indents
Using Tabs
Multilevel Lists
Chapter 9: More on Tables in Word .......................................... 72
Table Design and Layout
Buttons in Design Tab of Table Tools
Buttons in Layout Tabs of Table Tools
Chapter 10: Storage Devices ..................................................... 82
Internal/External Hard Disk
CD or DVD
Pen Drive and SD Card
Chapter 11: Editing Videos with Movie Maker ......................... 86
Adding Media and Photos
Publishing and Saving Movies
Splitting and Trimming Video Clips
Audio Levels in a Video
Chapter 12: Enhancing Videos with Movie Maker .................... 93
Transitions, Visual Effects, Pan and Zoom
Movie Titles, Captions and Credits
Snapshots, Narrations, Emphasis and Webcam Video
Book 5
Sample
Cop
y
12
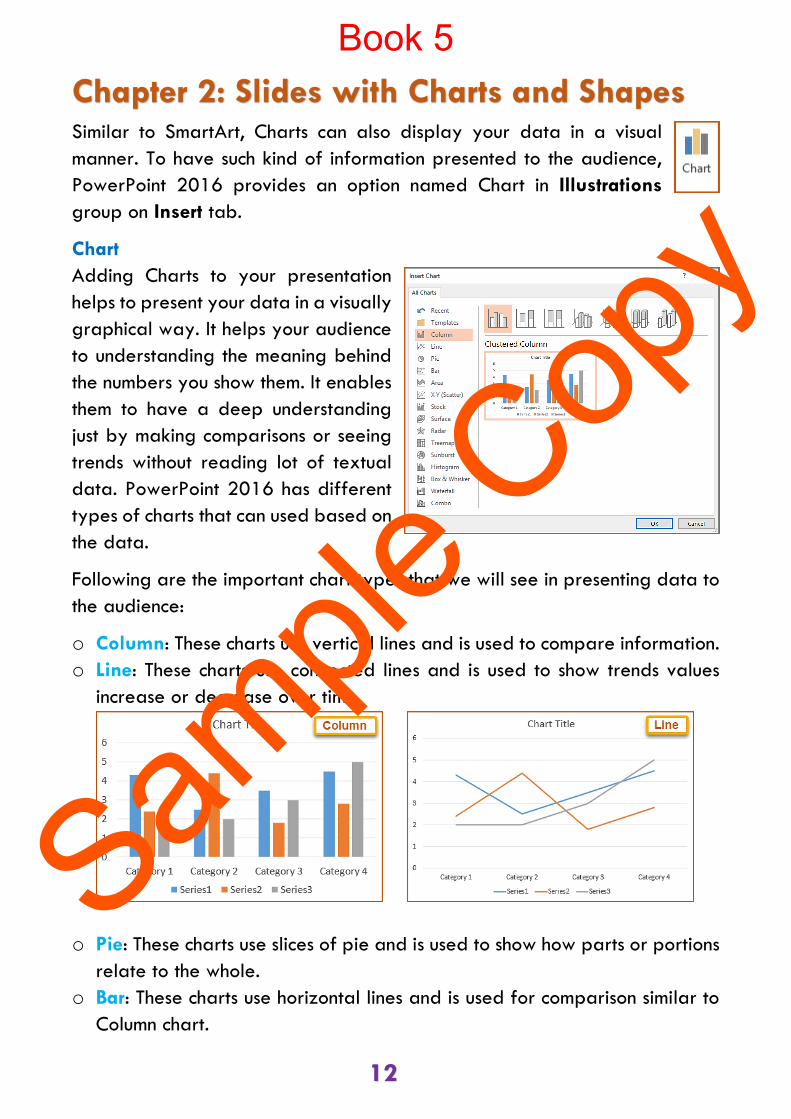
Chapter 2: Slides with Charts and Shapes Similar to SmartArt, Charts can also display your data in a visual
manner. To have such kind of information presented to the audience,
PowerPoint 2016 provides an option named Chart in Illustrations
group on Insert tab.
Chart
Adding Charts to your presentation
helps to present your data in a visually
graphical way. It helps your audience
to understanding the meaning behind
the numbers you show them. It enables
them to have a deep understanding
just by making comparisons or seeing
trends without reading lot of textual
data. PowerPoint 2016 has different
types of charts that can used based on
the data.
Following are the important chart types that we will see in presenting data to
the audience:
o Column: These charts use vertical lines and is used to compare information.
o Line: These charts use connected lines and is used to show trends values
increase or decrease over time.
o Pie: These charts use slices of pie and is used to show how parts or portions
relate to the whole.
o Bar: These charts use horizontal lines and is used for comparison similar to
Column chart.
Book 5
Sample
Cop
y

13
o Area: These charts use connected lines with filled areas under the lines and
is used to show trends similar to Line chart.
As seen above, every chart has five important parts that are as follows:
o Chart Title: It tells you what the chart is about.
o Horizontal Axis (X Axis): It classifies the categories in the chart.
o Vertical Axis (Y Axis): It displays the range values of the column.
o Data Series: It contains related data points in the chart.
o Legend: It categorizes each color of data series in the chart.
To insert a chart with data on a slide
1. On Insert tab in Illustrations group, click on
Chart button to insert it on a slide.
2. On Insert Column dialog box, choose the
desired chart type and click on OK button.
3. The chart is inserted and a linked spreadsheet is displayed. Enter your
data in this sheet. The data entered in this sheet will be seen on the chart.
4. Once done, click on Close button to close the spreadsheet.
5. To edit the data on this sheet again; click the Edit Data button on Design
(Chart Tools) tab in Data group.
Book 5
Sample
Cop
y

14
Once a Chart is added to a slide, two tabs Design and Format
under Chart Tools appears. The Format tab options are
already known to us. The Design tab has options to modify
chart type, layout and styles such as:
o Change Chart Type: This button allows you to change to a different chart
type.
o Quick Layout: This button allows you to change the overall layout of the
chart.
o Change Colors: This button changes the overall color theme of the chart.
o Chart Styles: It allows you to change the overall visual style of the chart.
Arranging Shapes
The shapes can be arranged, ordered and grouped
as needed on the slide in your presentation. These
arrangement options are found in Arrange group on
Format tab and can helps in redefining the look of a
slide having number of shapes.
Aligning Shapes
Alignment is the placement of the shapes on a slide. The shapes can be
aligned to the slide margin or to other objects on the slide.
To align shapes to each other or to slide margin
1. Press SHIFT key and click on the all the shapes you want to select.
2. On Format tab in Arrange group, click on Align button
and choose Align Selected Objects or Align to Slide.
3. Again, on Format tab in Arrange group, click on Align
button and choose from these six alignment options: left,
center, right, top, middle and bottom.
4. The shapes will align with respect to each other or to the
margins or edges of the slide based on option your
selection.
Book 5
Sample
Cop
y

15
Distributing Shapes Evenly
Distributing evenly means to arrange shapes at equal distance from each
other across the page. You can distribute shapes evenly either horizontally or
vertically.
To distribute shapes evenly on a page
1. Press SHIFT key and click on the all the shapes you want to select.
2. On Format tab in Arrange group, click on Align button and choose
Distribute Horizontally or Distribute Vertically.
3. The shapes will be distributed evenly across the slide.
Grouping and Ungrouping Shapes
Grouping means to join shapes together to move and format them as if they
were a single shape. Ungrouping means to break the connection between the
grouped shapes so that you can move and format them one by one.
To group or ungroup shapes
1. Press SHIFT key and click on the all the shapes you want to select.
2. On Format tab in Arrange group, click on Group button to join them.
3. On Format tab in Arrange group, click on Ungroup button to disconnect
them.
Ordering Shapes
Ordering means to change the level of the shapes by bringing forward or
taking backward. This ordering of shapes is important when we stack or
overlap the shapes. Stacking means placing shapes one over the other.
To bring forward
1. On Format tab in Arrange group, click on Bring Forward button and
choose one of the following option:
a. Bring Forward: To bring the selected shape forward one level.
b. Bring to Front: To bring the selected shape in front of all the other
objects.
To send backward
1. On Format tab in Arrange group, click on Send Backward button and
choose one of the following option:
Book 5
Sample
Cop
y
16
a. Send Backward: To send the selected shape backward one level.
b. Send to Back: To send the selected shape behind all the other objects.
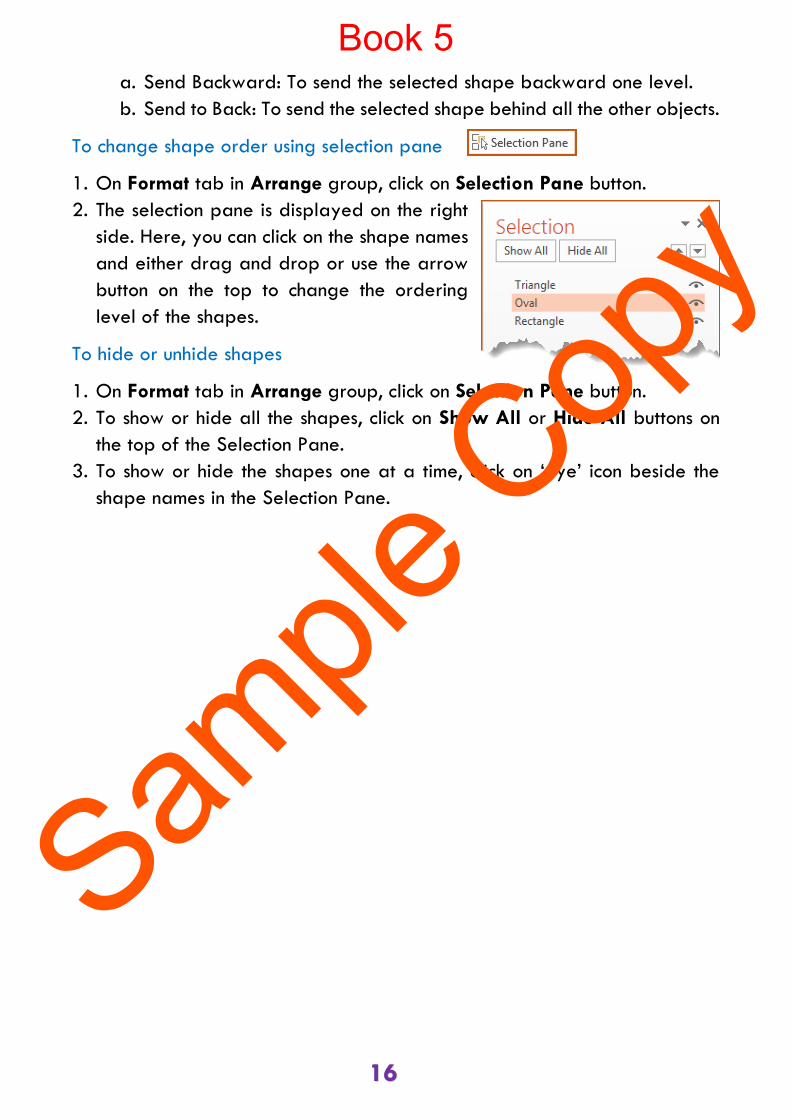
To change shape order using selection pane
1. On Format tab in Arrange group, click on Selection Pane button.
2. The selection pane is displayed on the right
side. Here, you can click on the shape names
and either drag and drop or use the arrow
button on the top to change the ordering
level of the shapes.
To hide or unhide shapes
1. On Format tab in Arrange group, click on Selection Pane button.
2. To show or hide all the shapes, click on Show All or Hide All buttons on
the top of the Selection Pane.
3. To show or hide the shapes one at a time, click on ‘eye’ icon beside the
shape names in the Selection Pane.
Book 5
Sample
Cop
y

17
A. Fill in the blanks:
1. ____________________ means to join shapes together to move and
format them as if they were a single shape.
2. _____________________ is the placement of the shapes on a slide.
3. ________________________ means to break the connection between the
grouped shapes so that you can move and format them one by one.
4. _____________________ means to change the level of the shapes by
bringing forward or taking backward.
5. _____________________________ means to arrange shapes at equal
distance from each other across the page.
6. ____________________ means placing shapes one over the other.
B. Write T for true and F for false statements:
1. Adding Charts to your presentation helps to present your data in a visually
graphical way. (_____)
2. New Chart Type button allows changing to a different chart type. (_____)
3. Quick Layout button changes the overall layout of the chart. (_____)
4. Change Styles button changes the overall color theme of the chart. (_____)
5. Chart Color change the overall visual style of the chart. (_____)
C. Name the following charts:
1. It uses connected lines to show trends values increase or decrease over
time. ______________________________________________________
2. It uses slices to show how parts or portions relate to the whole. __________
3. It uses horizontal lines for comparison. _____________________________
4. It uses vertical lines to compare information. ________________________
5. It uses connected lines with filled areas under to show trends. ___________
Book 5
Sample
Cop
y
18
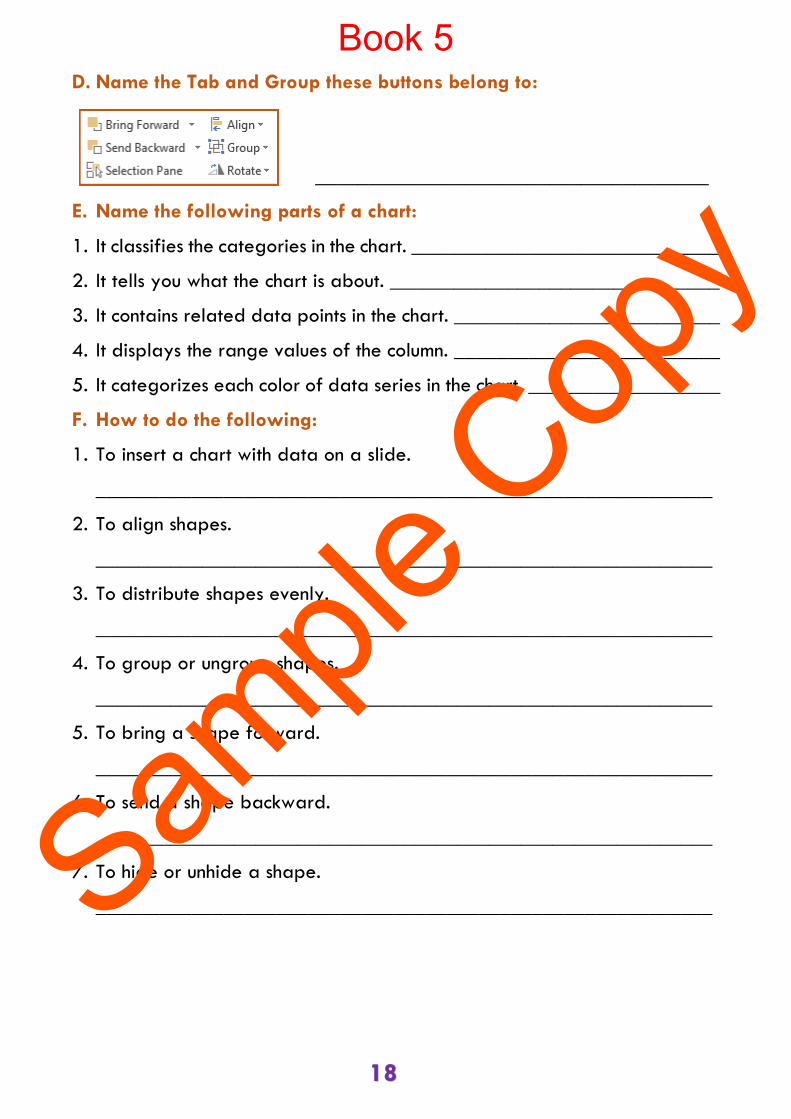
D. Name the Tab and Group these buttons belong to:
_____________________________________
E. Name the following parts of a chart:
1. It classifies the categories in the chart. _____________________________
2. It tells you what the chart is about. _______________________________
3. It contains related data points in the chart. _________________________
4. It displays the range values of the column. _________________________
5. It categorizes each color of data series in the chart. __________________
F. How to do the following:
1. To insert a chart with data on a slide.
__________________________________________________________
2. To align shapes.
__________________________________________________________
3. To distribute shapes evenly.
__________________________________________________________
4. To group or ungroup shapes.
__________________________________________________________
5. To bring a shape forward.
__________________________________________________________
6. To send a shape backward.
__________________________________________________________
7. To hide or unhide a shape.
__________________________________________________________
Book 5
Sample
Cop
y
19
PART 1
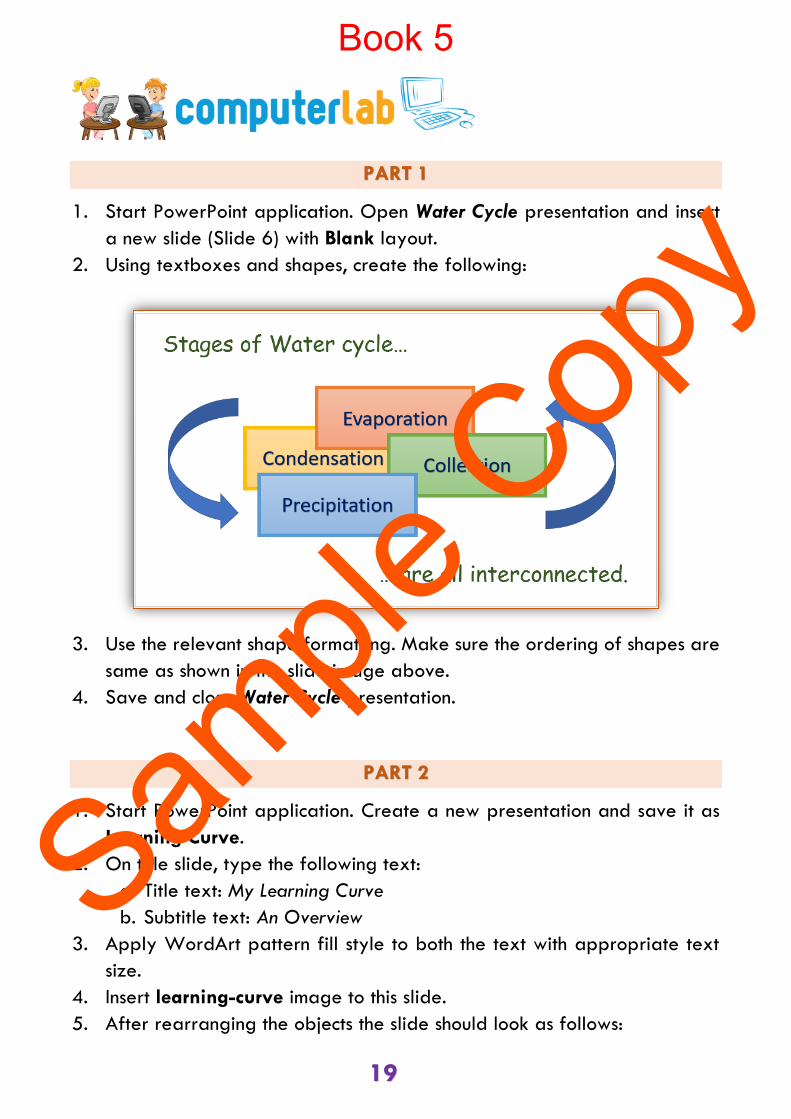
1. Start PowerPoint application. Open Water Cycle presentation and insert
a new slide (Slide 6) with Blank layout.
2. Using textboxes and shapes, create the following:
3. Use the relevant shape formatting. Make sure the ordering of shapes are
same as shown in the slide image above.
4. Save and close Water Cycle presentation.
PART 2
1. Start PowerPoint application. Create a new presentation and save it as
Learning Curve.
2. On title slide, type the following text:
a. Title text: My Learning Curve
b. Subtitle text: An Overview
3. Apply WordArt pattern fill style to both the text with appropriate text
size.
4. Insert learning-curve image to this slide.
5. After rearranging the objects the slide should look as follows:
Book 5
Sample
Cop
y

20
6. Insert a new slide (Slide 2) with a Blank layout.
7. Add the following pie chart to this slide.
8. Make sure you change the size and font color of the title and labels in this
pie chart.
PART 3
1. Start PowerPoint application. Open Learning Curve presentation.
2. Insert a new slide (Slide 3) with a Blank layout.
3. Using shapes and its formatting, create Slide 3 as shown.
Book 5
Sample
Cop
y

72
Chapter 9: More on Tables in Word We have done tables before, and here we will learn some advance editing
table options. These advance options will allows you to enhance the table’s
design and layout.
Table Design and Layout
While working with Tables in Word 2016, two Table Tools tabs appear:
Design and Layout. Using the buttons from these two tabs, you can do lot of
editing and modification to the design and layout of your table.
Buttons in Design Tab of Table Tools
o Table Styles: To quickly change the visual style of your table. Each style
uses a unique combination of borders and shading to change the
appearance of your table. Hover over a style in the gallery to preview it
in your document.
o Shading: To change the color of one or all table cells.
o Borders: There are different options for Borders that are as
follows:
a. Borders: To add or remove borders from your table.
b. Border Style: To format specific borders in your table using a common
style or one that you recently applied.
c. Line Style: To change the line style of a
new border.
d. Line Weight: To change the line width of
a new border.
e. Pen Color: To change the color of a new border.
f. Border Painter: To copy format style of one border and apply the same
to another. It is similar to Format Painter.
Book 5
Sample
Cop
y
73
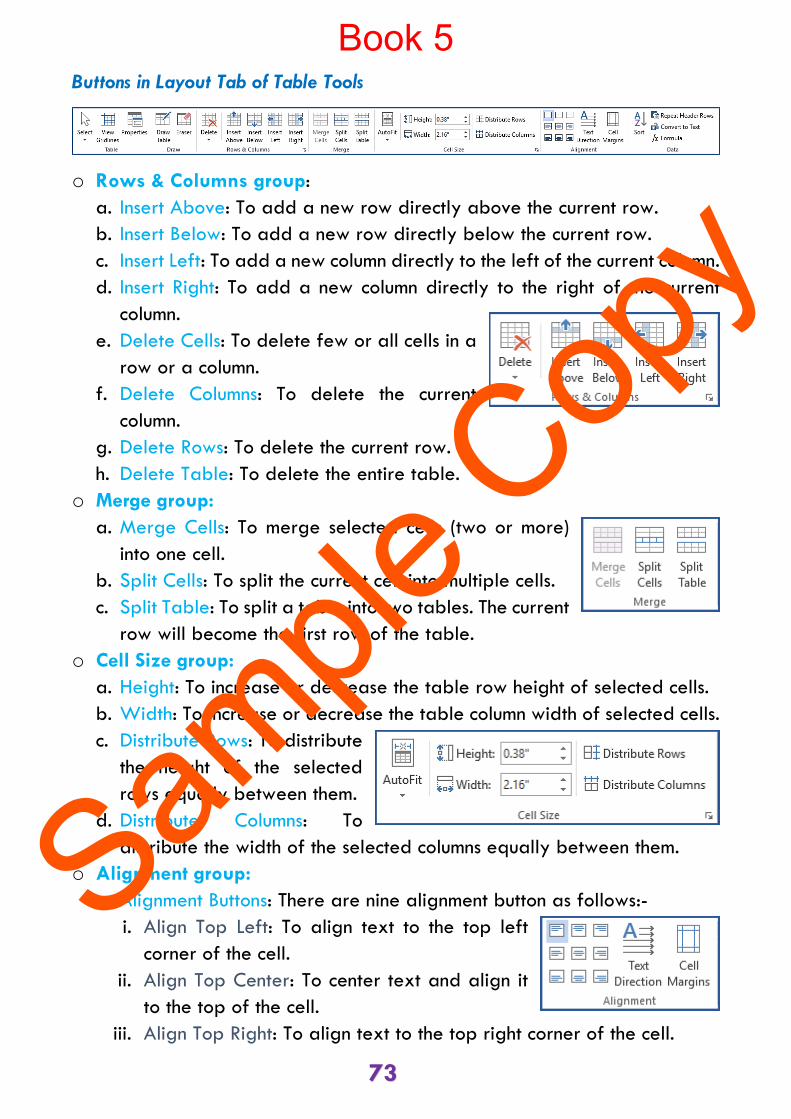
Buttons in Layout Tab of Table Tools
o Rows & Columns group:
a. Insert Above: To add a new row directly above the current row.
b. Insert Below: To add a new row directly below the current row.
c. Insert Left: To add a new column directly to the left of the current column.
d. Insert Right: To add a new column directly to the right of the current
column.
e. Delete Cells: To delete few or all cells in a
row or a column.
f. Delete Columns: To delete the current
column.
g. Delete Rows: To delete the current row.
h. Delete Table: To delete the entire table.
o Merge group:
a. Merge Cells: To merge selected cells (two or more)
into one cell.
b. Split Cells: To split the current cell into multiple cells.
c. Split Table: To split a table into two tables. The current
row will become the first row of the table.
o Cell Size group:
a. Height: To increase or decrease the table row height of selected cells.
b. Width: To increase or decrease the table column width of selected cells.
c. Distribute Rows: To distribute
the height of the selected
rows equally between them.
d. Distribute Columns: To
distribute the width of the selected columns equally between them.
o Alignment group:
a. Alignment Buttons: There are nine alignment button as follows:-
i. Align Top Left: To align text to the top left
corner of the cell.
ii. Align Top Center: To center text and align it
to the top of the cell.
iii. Align Top Right: To align text to the top right corner of the cell.
Book 5
Sample
Cop
y
74
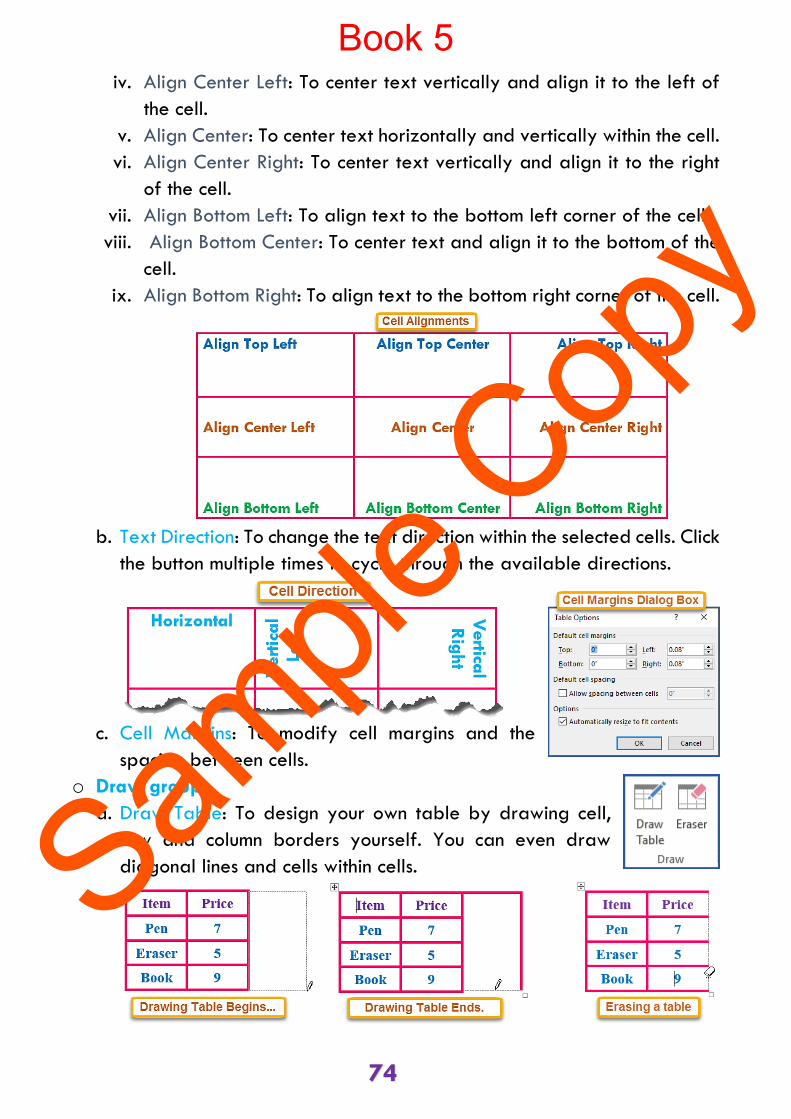
iv. Align Center Left: To center text vertically and align it to the left of
the cell.
v. Align Center: To center text horizontally and vertically within the cell.
vi. Align Center Right: To center text vertically and align it to the right
of the cell.
vii. Align Bottom Left: To align text to the bottom left corner of the cell.
viii. Align Bottom Center: To center text and align it to the bottom of the
cell.
ix. Align Bottom Right: To align text to the bottom right corner of the cell.
b. Text Direction: To change the text direction within the selected cells. Click
the button multiple times to cycle through the available directions.
c. Cell Margins: To modify cell margins and the
spacing between cells.
o Draw group
a. Draw Table: To design your own table by drawing cell,
row and column borders yourself. You can even draw
diagonal lines and cells within cells.
Book 5
Sample
Cop
y

75
b. Eraser: To remove specific borders in a table to create merged cells.
o Data group:
a. Repeat Header Rows: To mark multiple rows as
header rows. If your table spans multiple pages,
the header rows will appear on every page.
b. Sort: To arrange the current selection in alphabetical or numerical order.
This is mainly useful if you are trying to organize data in a table.
c. Convert to Text: To convert the table to regular text. You can choose
which text character to use to separate the columns.
Book 5
Sample
Cop
y

76
d. Formula: To add a formula to a cell to perform a simple calculation such
as SUM or COUNT.
Book 5
Sample
Cop
y
77
A. Fill in the blanks:
1. ___________________ changes the color of one or all table cells.
2. __________________________ changes the line width of a new border.
3. ________________________ changes the color of a new border.
4. _______________________________ copies format style of one border
and apply the same to another.
5. _________________ centers text horizontally and vertically within the cell.
B. Write T for true and F for false statements:
1. Click the text directions button multiple times to cycle through the available
directions. (_____)
2. Distribute Rows button distributes the width of the selected rows equally
between them. (_____)
3. Height button increases or decreases the table column height of selected
cells. (_____)
C. Name the button to perform the following actions:
1. To design your own table by drawing cell, row and column borders
yourself. ___________________________________________________
2. To remove specific borders in a table to create merged cells. ___________
3. To arrange the current selection in alphabetical or numerical order. ______
4. To convert the table to regular text. ______________________________
5. To mark multiple rows as header rows. ____________________________
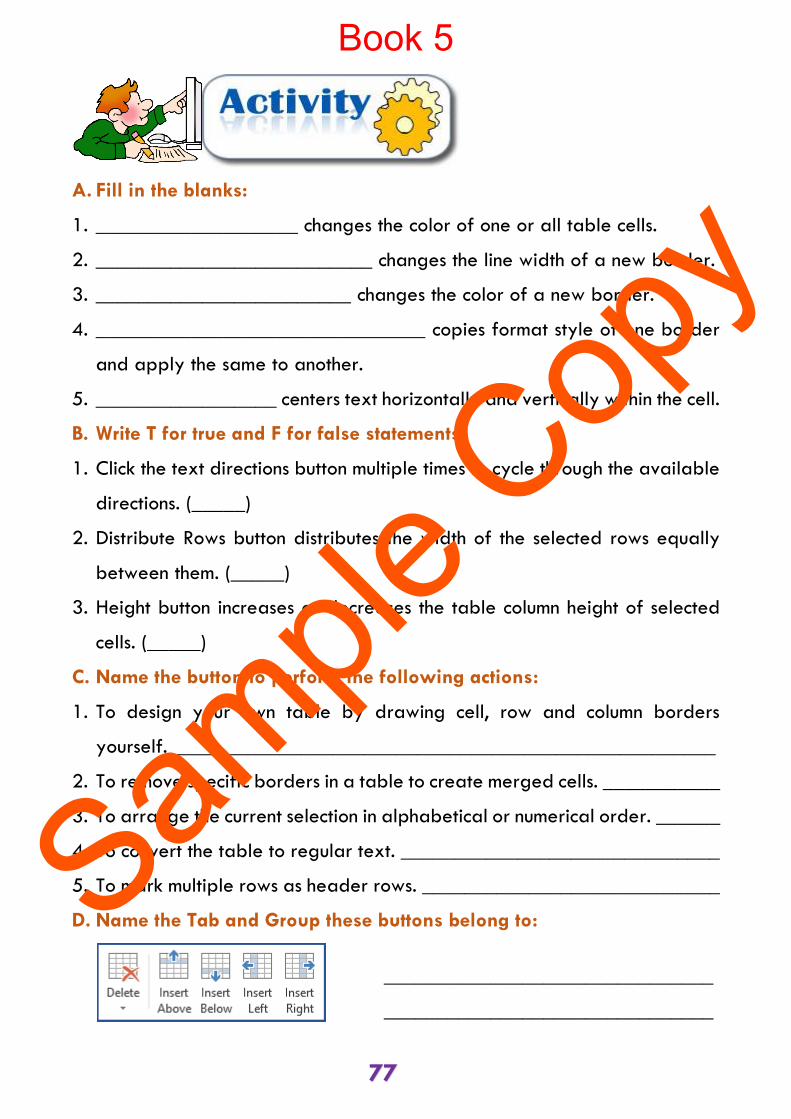
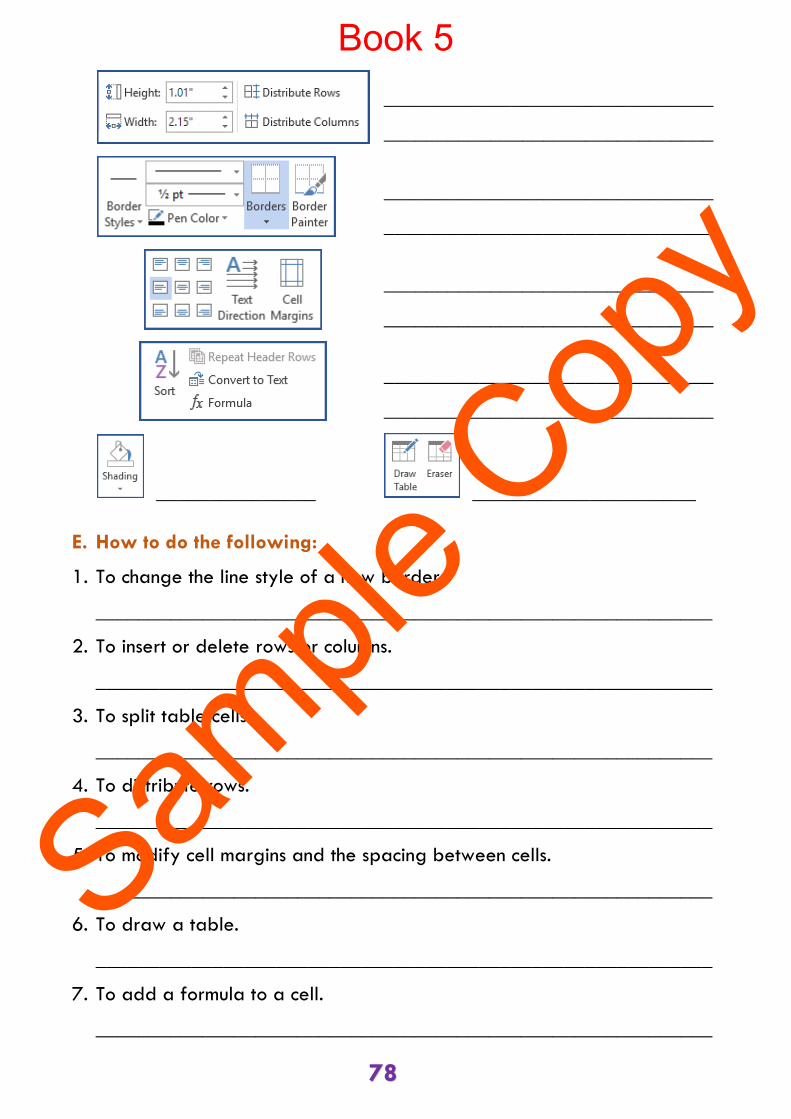
D. Name the Tab and Group these buttons belong to:
_______________________________
_______________________________
Book 5
Sample
Cop
y
78
_______________________________
_______________________________
_______________________________
_______________________________
_______________________________
_______________________________
_______________________________
_______________________________
_______________ _____________________
E. How to do the following:
1. To change the line style of a new border.
__________________________________________________________
2. To insert or delete rows or columns.
__________________________________________________________
3. To split table cells.
__________________________________________________________
4. To distribute rows.
__________________________________________________________
5. To modify cell margins and the spacing between cells.
__________________________________________________________
6. To draw a table.
__________________________________________________________
7. To add a formula to a cell.
__________________________________________________________
Book 5
Sample
Cop
y
79
PART 1
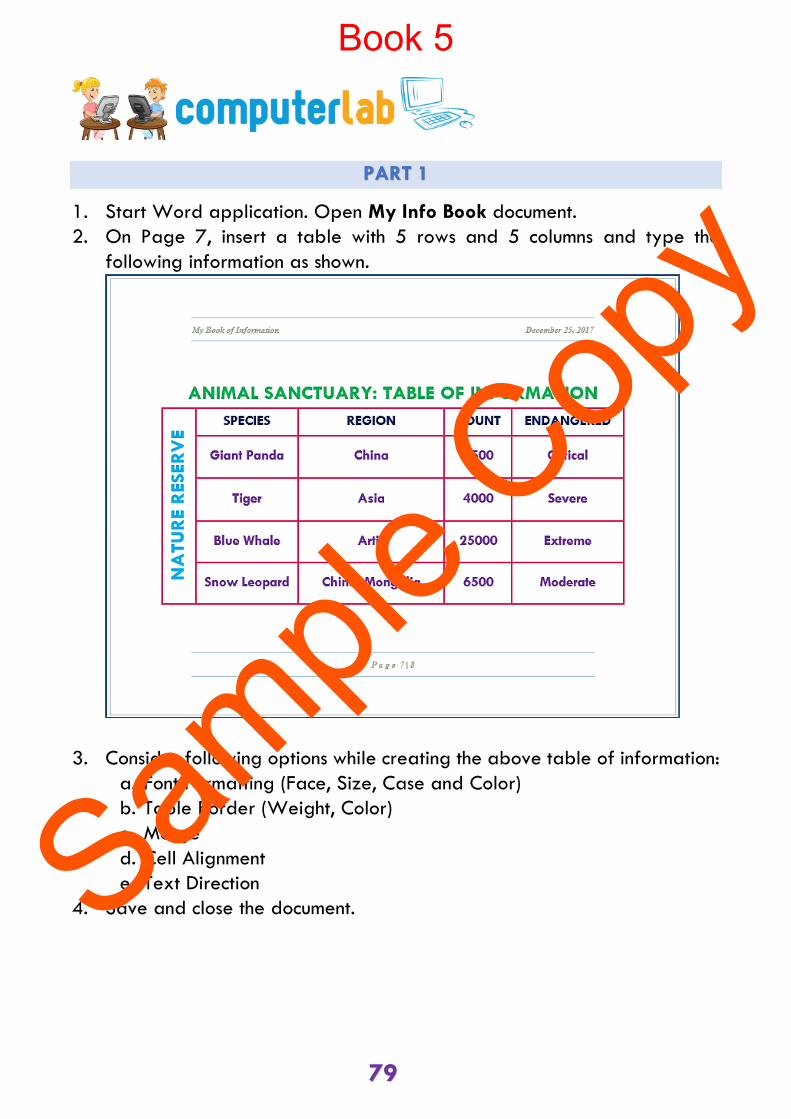
1. Start Word application. Open My Info Book document.
2. On Page 7, insert a table with 5 rows and 5 columns and type the
following information as shown.
3. Consider following options while creating the above table of information:
a. Font Formatting (Face, Size, Case and Color)
b. Table Border (Weight, Color)
c. Merge
d. Cell Alignment
e. Text Direction
4. Save and close the document.
Book 5
Sample
Cop
y

80
PART 2
1. Start Word application. Open My Info Book document.
2. On Page 8, insert a table having 5 rows
and 2 columns and type the information in
it as shown on the side.
3. Use formula command to total up the count.
Also, apply suitable font and table
formatting.
4. Using Draw Table command, draw 3rd
column (with 1 row)
5. Type the following text in it and change its
text direction to vertical right:
These figures are as per the counting conducted on 20th December 2017 by
Zoo Officials.
6. Insert the picture zoo on the left position of this page.
7. Now, Page 8 should appear as shown.
8. Save and close the document.
Book 5
Sample
Cop
y