ي ˆ ا ˙˝˛ ا ما ا ا ا - meu
TRANSCRIPT

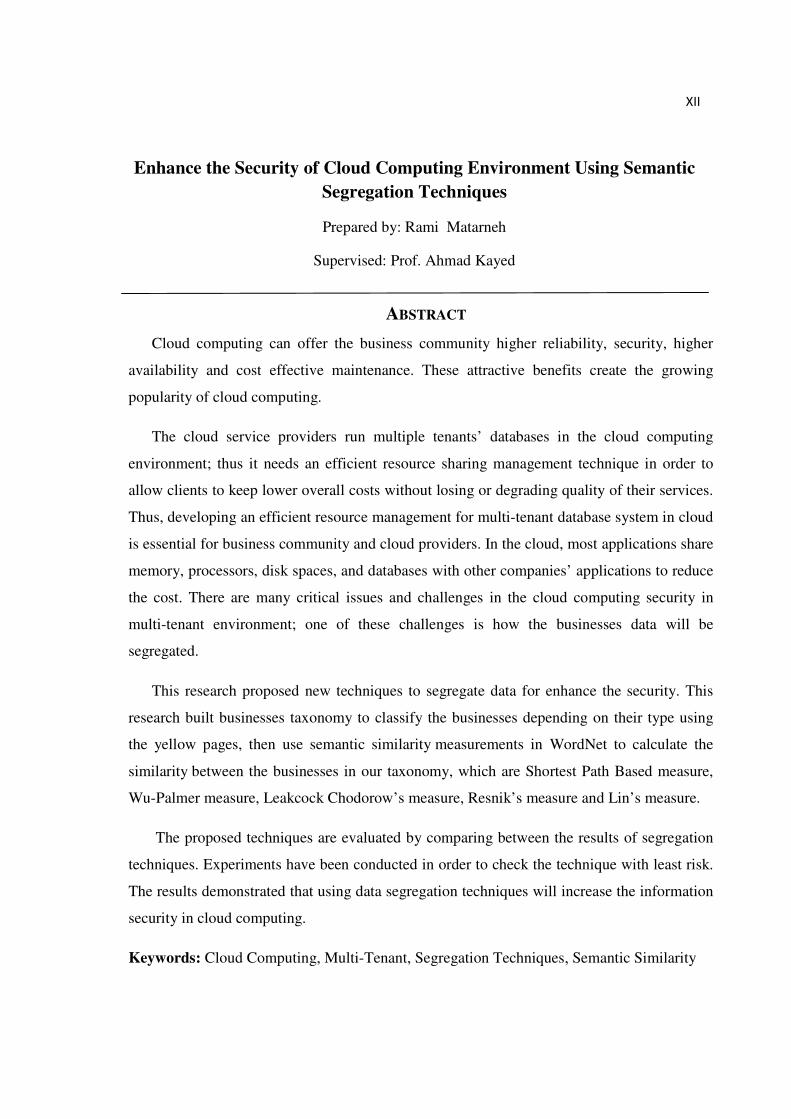
Enhance the Security of Cloud Computing Environment Using Semantic
Segregation Techniques
ام ����� �� � ��� �� ا�����ي����� ا��� �� �� ا������ ا����ا�
by
Rami Yaser Matarneh
Supervisor
Prof. Ahmad K. A. Kayed
A Thesis Submitted in Partial Fulfilment of the Requirements
Of the Master Degree in Computer Science
Faculty of Information Technology
Middle East University
January, 2015

II

III

IV

V
ACKNOWLEDGEMENTS
I would like to express my sincere appreciation to Prof. Ahmad Kayed for his guidance,
helping and encouraging my efforts during this research and support and motivation
throughout Master’s Thesis.
I would like to thank my family. For their support, encouragement, quiet patience and
unwavering love. They were always standing with me through the good times and bad.
I would like to thank my colleagues in work Omran Al-bakkar and Sandy Msandeh For
their support.
Thank You All...

VI
Contents
Acknowledgements ................................................................................................................ V
List of Figures ...................................................................................................................... IX
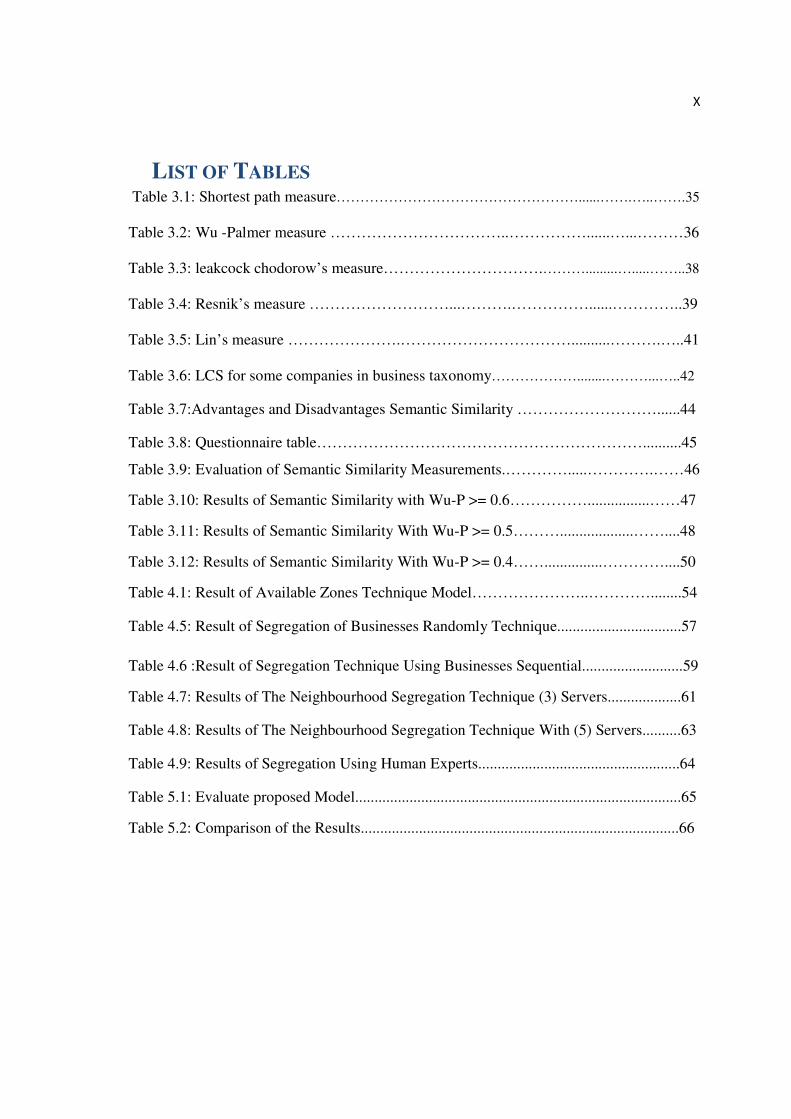
List of Tables ......................................................................................................................... X
List of Abbreviations ........................................................................................................... XI
Abstract ............................................................................................................................... XII
Abstract in Arabic ا����� .................................................................................... XIII
1. CHAPTER ONE .............................................................................................................. 1
1.1. Introduction ................................................................................................................... 1
1.2. Research Problem .......................................................................................................... 4
1.3. Research Objectives ....................................................................................................... 5
1.4. Motivation ..................................................................................................................... 5
1.5. Research Methodology .................................................................................................. 6
1.6. Thesis Layout ................................................................................................................. 7
2. Chapter two ..................................................................................................................... 8
Background and Literature Review ........................................................................................ 8
2.1. Preface ........................................................................................................................... 8
2.2. Background .................................................................................................................... 8
Cloud Computing ....................................................................................................................... 8
Types of Cloud ......................................................................................................................... 10
Types of cloud providers ......................................................................................................... 11
Benefits and Motivation of Cloud Computing ......................................................................... 12
Service Level Agreement (SLA) ................................................................................................ 12
Multi tenancy .......................................................................................................................... 12
Benefits of multi-tenant in cloud computing ........................................................................... 13
multi-tenancy approaches ....................................................................................................... 13
MULTI-TENANCY SECURITY ISSUES .......................................................................................... 15
Segregation ............................................................................................................................. 15
importance of data segregation .............................................................................................. 17
Web Service ............................................................................................................................. 18
WordNet .................................................................................................................................. 19

VII
semantic similarity .................................................................................................................. 20
2.3. Literature Review & Related Works ............................................................................. 21
3. Chapter three ................................................................................................................. 25
taxonomy building ................................................................................................................ 25
3.1. Preface ......................................................................................................................... 25
3.2. Introduction ................................................................................................................. 25
3.3. Yellow Page Classification ............................................................................................ 26
Businesses Classification ......................................................................................................... 26
3.4. WORDNET and Semantic Similarity Measures ............................................................. 30
3.5. Semantic Similarity Measurement Evaluation ............................................................. 43
3.5.1. Previous studies ....................................................................................................... 43
3.5.2. Questionnaires ......................................................................................................... 44
3.6. Accepted cutting point of Wu-p measure .................................................................... 47
Summary ................................................................................................................................. 51
4. Chapter four ...................................................................................................................... 52
Segregation techniques ........................................................................................................... 52
4.1. Introduction ................................................................................................................. 52
4.2. DATASET Overview ...................................................................................................... 52
4.3. experiments Environment and Procedures .................................................................. 53
4.4. segregation using Available zones techniques ............................................................. 53
4.4.1. THE MODEL .............................................................................................................. 53
4.4.2. THE PROCEDURE ...................................................................................................... 54
4.4.3. THE RESULTS: ........................................................................................................... 54
4.5. segregation of Businesses randomly ............................................................................ 55
4.5.1. THE Model ................................................................................................................ 55
4.5.2. THE PROCEDURE ...................................................................................................... 56
4.5.3. THE Results............................................................................................................... 57
4.6. Segregation using sequential servers ........................................................................... 58
4.6.1. THE PROCEDURE ...................................................................................................... 58
4.7. Neighbourhood’s segregation ...................................................................................... 59
4.7.1. THE PROCEDURE ...................................................................................................... 60

VIII
4.7.2. THE Result ................................................................................................................ 61
4.7.3. THE Result ................................................................................................................ 63
4.8. Segregation using Expert human.................................................................................. 63
4.9. Results and Evaluation ................................................................................................. 64
4.1. Summary ...................................................................................................................... 66
5. Chapter five ....................................................................................................................... 67
Conclusion ............................................................................................................................ 67
5.1. OVERVIEW ................................................................................................................... 67
5.2. Conclusion ................................................................................................................... 67
5.4 Future Work ................................................................................................................. 68
References ............................................................................................................................. 69
Appendix ............................................................................................................................... 75

IX
LIST OF FIGURES
Figure 2.1: Growth of cloud and grid computing since 2005 ………………….…..............8
Figure 2.2: Types of cloud deployment ………………...………………………...………10
Figure 2.3: Separate Databases …………………..……………………………….……....14
Figure 2.4: Shared Databases, Separate Schemas …………………...…………….……...14
Figure 2.5: Shared Database, Shared Schemas …………………...…………….……...…14
Figure 2.6: Segregation Consumer ………………...…………………….………...………16
Figure 3.1: Level of taxonomy………………..…………….………………….….....…...26
Figure 3.2: Education Taxonomy………………………………………...………..…..…..27
Figure 3.3: Financial Services Taxonomy………………………………..…………….….28
Figure 3.5: Health & Medical Taxonomy………………………………………………….29
Figure 3.5: Taxonomy of Businesses………………………….………………………………………………..…..29
Figure 3.6: Example of WordNet………………………………………………………....…..………………..……33
Figure 4.1: Available Zones Technique Model………………………………………….....……….………..53
Figure 4.2: Proposed Model …………......…………………………………………………………...........………..56
Figure 4.3: Segregation As Neighbourhood Businesses with 3 locations……………………….…61
Figure 4.4: Segregation As Neighbourhood Businesses with 5 locations………………………….62
X
LIST OF TABLES Table 3.1: Shortest path measure……………………………………………......…….…..…….35
Table 3.2: Wu -Palmer measure ……………………………..……………......…...………36
Table 3.3: leakcock chodorow’s measure………………………….……….........….....……..38
Table 3.4: Resnik’s measure ………………………...……….……………......…………..39
Table 3.5: Lin’s measure ………………….……………………………..........……….…..41
Table 3.6: LCS for some companies in business taxonomy………………........………...…..42
Table 3.7:Advantages and Disadvantages Semantic Similarity ………………………......44
Table 3.8: Questionnaire table………………………………………………………..........45
Table 3.9: Evaluation of Semantic Similarity Measurements.………….....………….……46
Table 3.10: Results of Semantic Similarity with Wu-P >= 0.6……………................……47
Table 3.11: Results of Semantic Similarity With Wu-P >= 0.5………...................……....48
Table 3.12: Results of Semantic Similarity With Wu-P >= 0.4……...............…………....50
Table 4.1: Result of Available Zones Technique Model…………………..…………........54
Table 4.5: Result of Segregation of Businesses Randomly Technique................................57
Table 4.6 :Result of Segregation Technique Using Businesses Sequential..........................59
Table 4.7: Results of The Neighbourhood Segregation Technique (3) Servers...................61
Table 4.8: Results of The Neighbourhood Segregation Technique With (5) Servers..........63
Table 4.9: Results of Segregation Using Human Experts....................................................64
Table 5.1: Evaluate proposed Model....................................................................................65
Table 5.2: Comparison of the Results..................................................................................66

XI
LIST OF ABBREVIATIONS
CC Cloud Computing
CIA Confidentiality, Integrity and Availability
CSP Cloud Service Provider
DLP Data Leak Prevention
DUNS Data Universal Numbering System
IaaS Infrastructure as a Service
IC Information Content
IT Information Technology
LCS Least Common Subsumer
NIST National Institute of Standards and Technology
PaaS Platform as a Service
SaaS Software as a Service
SOAP Simple Object Access protocol
UDDI Universal Description, Discovery, and Integration
URL Uniform Resource Locator
VB Visual Basic
VM Virtual Machine
WSDL Web Services Description Language
XII
Enhance the Security of Cloud Computing Environment Using Semantic
Segregation Techniques
Prepared by: Rami Matarneh
Supervised: Prof. Ahmad Kayed
ABSTRACT
Cloud computing can offer the business community higher reliability, security, higher
availability and cost effective maintenance. These attractive benefits create the growing
popularity of cloud computing.
The cloud service providers run multiple tenants’ databases in the cloud computing
environment; thus it needs an efficient resource sharing management technique in order to
allow clients to keep lower overall costs without losing or degrading quality of their services.
Thus, developing an efficient resource management for multi-tenant database system in cloud
is essential for business community and cloud providers. In the cloud, most applications share
memory, processors, disk spaces, and databases with other companies’ applications to reduce
the cost. There are many critical issues and challenges in the cloud computing security in
multi-tenant environment; one of these challenges is how the businesses data will be
segregated.
This research proposed new techniques to segregate data for enhance the security. This
research built businesses taxonomy to classify the businesses depending on their type using
the yellow pages, then use semantic similarity measurements in WordNet to calculate the
similarity between the businesses in our taxonomy, which are Shortest Path Based measure,
Wu-Palmer measure, Leakcock Chodorow’s measure, Resnik’s measure and Lin’s measure.
The proposed techniques are evaluated by comparing between the results of segregation
techniques. Experiments have been conducted in order to check the technique with least risk.
The results demonstrated that using data segregation techniques will increase the information
security in cloud computing.
Keywords: Cloud Computing, Multi-Tenant, Segregation Techniques, Semantic Similarity

XIII
�� ا�����ي�ام ����� ا��� � ��� ����� ا��� �� �� ا������ ا���
را�� ا����ر��: إ��اد
�!�آ �� أ ر��آ��ا ذ����أ: فا��إ
___________________________________________________________
�ا� �
������� ������� � � ����� ������������ ��� ��������� ������ ���� ����� ���� ��� �
������� ����� ��� ��� ���� �� !� !"��� #$%.
'�"� ��(� ������� !����� ��� ��)*� !������ �� � ����+��� ,�� -��. ��� /���� 0������ 1������ 02��(2 ,��3 ���������� 4���� ��. �� ���� ��� �5���� �� 2 �� ������3 6������ 7���� ���,���. 0������ ��������� ,��� ��8� !������ ��� '��+����� ����9 ����� �� ��� ���%� �����
����� '�"�.
��"��� �(� :��*�� ������� ����� 02 !� ��8�� �5(� �� �� !������ ��� :��*�� ;� � !����(�� ������� !����� '�"� ��� ������ ��� �. !������ �% �� ������� ����� 02 !���(�� ��5� ��. ���(�
������� ����� 0������ ��� ���� :��*� ��� ;�<<� , !����� �<2 ���� 6�� !������ #$% �����������> (� �� � .
������ ����� 02 !���(�� ��5� ��. ����� �� �� !����� �<�� 4�� � /$�� ����� #$% �� � . #$% � �� :�$ ��(� �(��8 ��� ;����� ����?� 6��<� @��� ��� ������@��<� ���� ����� , A��� � ����� ��
B��*�� ���� -���� ���9�� ���*�� ����� ��� �<�� ��� � ����� ����9 #$% ���.
���� �� ����� �C� �� ��� � �� ��� ����� -���� ,�(� DE���� ���� � �C� �� �>�� � �� ���� �� ��� �� ������� ����� 02 !���(�� ��5� ��. ��� ,�8� . '�(�� �<�� ��� � ������� B� DE���� !�>5
������� ����� 02 !���(�� ��5� ��. �� ��"� 6� ��������� !������.
����� ���: 1����� ����� ����+��� ,�� 1�<�� ��� � 1���9�� ���*��.

1
1. CHAPTER ONE
1.1. INTRODUCTION
Recently, organizations and industries face many problems; doing certain office and
business tasks, retrieving information and gaining services while paying huge amounts of
money. Nowadays, using up-to-date technologies and computing services can help solving
several problems by click of a button. One of the suggested solutions is designing a cloud
full of services and resources.
Cloud Computing is a model that permits computing to be obtained as a service,
thereby changing computing from a capital rigorous activity to an expense item. Cloud
computing empowers consumers to focus on solving their specific business problems rather
than on constructing and maintaining computing infrastructure. Cloud computing is likely to
be one of the good solutions which has been found during hard times; where cloud has been
proven to be a considerable benefit to any organization due to its flexibility and pay-as-you-
go cost structure (Beik R. 2012).
The increasing demand on cloud computing services was empowered as a result of
embracing features like convenience and on-demand access to shared resources by using
several tenants. Many computing services moved to the cloud, and cloud computing had to
scale-up dynamically to support new demands without losing quality of service (Beloglazov
A & Buyya R. 2013).

2
A multi-tenant database is the primary characteristic of software as a service “SaaS”;
it allows SaaS vendors to run a single instance application which supports multiple tenants on
the same hardware, software and network infrastructure (Xiaohong. z.et al. 2012).
Public clouds are designed to store data from different organizations on same server
which is cost-effective. Also, cloud services provider uses multi tenant environment for many
reasons: high performance, low memory, optimum utilization for storage and low cost by
using one engine (Sen j. 2013).
However; multiple clients store their own data using the applications that are provided
by cloud service provider. In such cases, it would be a set of data for different clients in the
same place that depends on cloud service provider. Data leakage from client to another may
be possible through this environment. Therefore, the service provider should have techniques
to segregate business’s data from each other at the physical level and database level (Rai.M et
al., 2013).
One of the most challenges of cloud computing is how clients will be isolated from
each others which may increase security effectively. The attention has received regarding the
data segregation in a cloud computing model and there is recognition for the need of
management to multi tenancy across the cloud computing (Sen. J, 2013).
Data is always exposed to be threaded through both internal and external. The less
separation would increase the hacking of hypervisor, where a shared CPU can be attacked
and the data can be manipulated, deleted or destroyed as a result of this attack. Any problem
to segregate business’s data may cause the loss of data (Chandran S &Angepat M, 2010).

3
As previously mentioned, cloud services provider store several tenant in the same
database and the same location. So, how cloud securely isolates users and differentiate
between the memory and storage for each user. While, this failure could lead to leakage of
data from one customer to another (Kurmus A .et al. 2011). Since the same set of tables has
hosted multiple tenants' data, the term “Data Segregation” has been introduced.
Data segregation, in the simplest sense, is data isolation. In cloud environment the
data is not specifically segregated. However, It is distributed throughout the cloud network
(Chandran S & Angepat M, 2010).
Several studies were conducted to segregate the data in cloud environment. In
this research performed different tests to gather information and results in order to find a
solution for the management of multi-tenant and how to segregate the data depending on
businesses type.
This research takes several techniques to find out that the best way to segregate
clients’ data. These techniques are built to segregate the closer businesses type by
constructing classification for businesses, depending on yellow pages that classify
companies according to businesses type, and calculate the distance between these
businesses by using semantic similarity measurement.

4
1.2. RESEARCH PROBLEM
In multi tenancy, data is stored in a shared environment where one customer’s data
is stored alongside another customer. This research takes in consideration that all
safeguards use to save data from any possible leakage from user to other.
Cloud services provider stores several tenants in the same database and in the same
servers for many reasons: performance, memory, size and cost. Data leakage from user to
another is possible in this environment.
This research discusses how to ensure that the multiple users can not see each others
data. Thus, data segregation is technique that is used to enhance tenant’s data security. This
thesis develops a technique to enhance the security in cloud computing by segregating
business that has same domain businesses type.
In order to apply segregation as a technique, this thesis built taxonomy to classify
the businesses depending on their types. Then use a semantic similarity measurement to
calculate the similarity of businesses, in order to enhance the security in cloud.
The goal has been accomplished by answering the following questions:
1- How the company can be classified according to their businesses type?
2- How can calculate the similarityof businesses?
3- How can develop the techniques to segregate the data businesses that have the same
businesses type?

5
1.3. RESEARCH OBJECTIVES
The main objective of this work is enhancing the security in the cloud. This research
discusses how to ensure that the multiple clients cannot see each other, specially, the clients
that have the same type of businesses. This will be accomplished by developing a
technique. And to achieve the research objectives, this thesis are adopting the following
steps:
1. Enhancing the security by developing new approach to manage several tenancy in cloud
computing.
2. Finding new technique to classify the businesses according to their types.
3. Using the semantic similarity measurement to calculate the similarity between
businesses.
4. Determining the best technique to segregate the businesses data, specially, the businesses
which have similar type of businesses.
1.4. MOTIVATION
The main motivation to conduct this project is that scientist all through the years
focuses on improving better services for end users and how to provide them with golden
experiences of using the cloud. Recently, the main attention goes around the security of
cloud computing.

6
Cloud computing is an evolving paradigm with lots of benefits. It can be seen as an
integration of traditional computing and network technologies. The cloud computing
security has become a hot topic in the industry and academic research works. In particular,
the data security has been concerned by organizations and users which use cloud
computing. So, that motivates us to propose a new approach to enhance the security by
segregate the data in cloud computing.
1.5. RESEARCH METHODOLOGY
Security in cloud computing faces several challenges. One of these challenges is storing
client’s data because clients store their data in the same provider, and the provider uses
multi tenancy to achieve cost effective.Research methodology as follow:
� The implementation and evaluation of the proposed techniques.
� How the data segregation will help to reducing the risks.
� Design and employ VB.NET software that can be used to evaluate the proposed
algorithms.
� Draw the conclusion that clarifies and explains the process and the results
briefly.
The methodology that is used to develop our model contains the following phases:
� Study and Analysis Phase.
� Design and Implementation Phase
� Test Phase

7
1.6. THESIS LAYOUT
The layout of the thesis is corresponded to the structure of the work, as undertaken
throughout the study. In addition to the introductory chapter, the thesis includes four
chapters, references and appendices. A brief content description for the four chapters is
presented below:
Chapter 2 provides the summary of the literature review and related works. It details
and analyses the project elements and identifies all of the factors for each element and their
assessment techniques.
Chapter 3 provides the design of the proposed techniques and includes the
experiments with their assessment techniques.
Chapter 4 presents the techniques and more of experiments and provides the main
outcomes of these experiments. In order to determine the optimum techniques this will be
used to enhancing the security.
Chapter 5 concludes the project and suggests future work in order to improve the
final setup and lead to better implementation of the system.

8
2. CHAPTER TWO
BACKGROUND AND LITERATURE REVIEW
2.1. PREFACE
This chapter provides a background and literature review about the main concepts
covered by this research. It is divided into three sections. Section 2.2 discusses the
necessary background information that is needed for a better understanding for the
embedded topics of the thesis. The Literature review and the related works are discussed in
section 2.3. Finally, section 2.4 presents a summary.
2.2. BACKGROUND
CLOUD COMPUTING
Cloud computing is a subscription-based service where network storage space and
computer resources can be gained by a subscription. And through using cloud, the
information can be accessed from anywhere and at any time (Huth A& Cebula J. 2011).
Figure 2.1 below shows the increase of using the cloud computing.
Figure 2.1: Growth of cloud and grid computing since 2005 (Patel et al., 2011).

9
In a traditional computer setup; it is required for a person to be in the same location
where data storage device is. The cloud removes the need of person to be in the same
physical location where data storage device is. Cloud providers can host the hardware and
software which are necessary to run home or business applications (Lodha P & Wadhe A.
2013).
For small businesses that cannot afford the same amount of hardware and storage
space as a bigger company; it is really helpful to use the cloud as a solution. Small
companies can store their information in the cloud, removing the cost of purchasing and
storing memory devices. Additionally, because you only need to buy the amount of storage
space you will use, a business can purchase more space or reduce their subscription as their
business grows or as they find they need less storage space (Taleen A .2013).
Having an internet connection is the only requirement that you need to access the
cloud. This means that if you want to look at a specific file that has been stored in the
cloud, you must, firstly, establish an internet connection either through a wireless, wired
internet or a mobile broadband connection. One of the benefits of cloud is that you can
access the file from wherever you are with any device. These devices could be a desktop,
laptop, tablet, or phone. This can, also, help your business to work more smoothly because
anyone, who can connect to the internet and your cloud, is able to work on documents,
access the application, and store data (Taleen A .2013).

10
TYPES OF CLOUD
There are different types of clouds computing that you can subscribe to depending on what
services and requirements a subscriber needs .Figure 2.2 below show the types of cloud
deployment (Huth A & Cebula J. 2011).
1. Public Cloud - A public cloud can be accessed by any subscriber with an internet
connection and access to the cloud space.
2. Private Cloud - A private cloud is established for a specific group or organization and
limits access to just that group.
3. Community Cloud - A community cloud is shared among two or more organizations that
have similar cloud requirements.
4. Hybrid Cloud - A hybrid cloud is essentially a combination of at least two clouds, where
the clouds included are a mixture of public, private, or community.
Figure 2.2: Types of cloud deployment (Acutesys, 2011).

11
TYPES OF CLOUD PROVIDERS
A person can subscribe to any of the three types of cloud providers: Software as a
Service (SaaS), Platform as a Service (PaaS), and Infrastructure as a Service (IaaS),
According to their needs.
These three types differ in the amount of control that a subscriber has over the
information, and conversely, how much is expected from the provider to do for the
subscriber. Briefly, here is what expected from each type (Huth A& Cebula J. 2011).
1. Software as a Service - A SaaS provider gives subscribers access to both resources and
applications. SaaS makes it unnecessary for you to have a physical copy of software to
install on your devices. SaaS also makes it easier to have the same software on all of your
devices at once by accessing it on the cloud. In a SaaS agreement, you have the least
control over the cloud.
2. Platform as a Service - A PaaS system goes a level above the Software as a Service
setup. A PaaS provider gives subscribers access to the components that they require to
develop and operate applications over the internet.
3. Infrastructure as a Service - An IaaS agreement, as the name states, deals primarily with
computational infrastructure. In an IaaS agreement, the subscriber completely outsourced
the storage and resources, such as hardware and software, which they need (Lawal B et al.
2013).

12
BENEFITS AND MOTIVATION OF CLOUD COMPUTING
Many organizations want to utilize clouds because they are low cost, scalable, provide
easy remote access, higher performance and the list goes on and so on. When you consider
that you do not need to invest in any type of infrastructure, hardware, technical support, and
all users need in order to access information and data through Internet (Sahu B .et al. 2014).
Also no need to worry about the storage in cloud since storage it is virtually limitless.
Cloud computing additionally provides the scalability that many organizations need with
just the click of a button (Greenwell R .et al. 2014).
SERVICE LEVEL AGREEMENT (SLA)
Cloud computing typically involves two organizations; the clients and the service
provider. The security responsibilities of each party must be made clear. This is typically
done by means of a service level agreement (SLA) which applies to the services provided,
and the terms of the contract between the clients and the services provider (Kyriazis
D.2013).
MULTI TENANCY
Multi tenancy is one of the main characteristics of cloud computing. Multiple clients
store their own data using the applications provided by the cloud service provider. (Rai,
M.et al. 2013).
Multi Tenant database architecture is where many users, typically unrelated when
placed into the context of a cloud, make use of shared resources. In a cloud, this allows for
multiple customer applications to be consolidated, removing the need for separate systems
for each tenant. Multi-tenant database architectures can reduce the total cost of ownership

13
because multiple businesses are consolidating onto the same operational system and need
one database engine (heng L. et al.2012).
BENEFITS OF MULTI-TENANT IN CLOUD COMPUTING
Multi tenant in a cloud can handle high traffic volumes at low cost. It can reduce the
total cost of ownership by aggregating clients together. This includes money for hardware,
software, operational expenditures for bandwidth, network and personnel. Multi tenancy
allows for pooling of resources. This improves the utilization by eliminating need to
provision each client for maximum load (Rai, M.et al. 2013).
The goal of a multi tenant in a cloud is to minimize the number of machines
required while still maintaining query and application performance goals. Ultimately, multi
tenant data platforms must minimize cost by efficient resource sharing (Martinez.C. 2012).
MULTI-TENANCY APPROACHES
Multi tenancy on the cloud, have three main approaches. These approaches are:
1. Separate databases
In the separate databases approach, each tenant has its own separate database. This
makes it easy to extend the application’s data model to meet tenant’s individual needs and
recovering the database in case of a required backup. But since each tenant has its own
database, this approach leads to higher costs (Karaca. H, 2013). Figure 2.3 shows the
separate databases architecture.

14
Figure 2.3: Separate Databases (Karaca. H, 2013. 2013)
2. Shared Database, Separate Schemas
Hosting multiple tenants in the same database, with each tenant having his own set of
tables is the second approach. This approach is also relatively easier to implement
compared to shared everything approach. The data model extension is also easier for each
particular tenant.
Figure 2.4 show the separate databases architecture (Karaca. H, 2013. 2013).
3. Shared Database, Shared Schema
The third approach uses the same database and the same tables to host multiple tenants’
data. Since this approach allows serving the largest number of tenants per database
instance, it has the lowest hardware and backup costs compared to the other two
approaches. But it requires additional development effort to ensure the data isolation and
security among tenants (Karaca. H. 2013) Figure 2.5 shows the shared database, shared
schema architecture.
Figure 2.5: Shared Database, Shared Schemas (Karaca. H. 2013)

15
MULTI-TENANCY SECURITY ISSUES
The fundamental security issue with multi tenancy is that clients use cloud
computing by employing single and the same computer hardware to share and process
information. This presents a number of challenges in terms of compliance, security and
privacy (Srinivas C et al. 2013).
In such case it would be a set of data for different client in the same server and same
infrastructure depending on the cloud service provider, data leakage from client to another
is possible through this environment. So, should be there a solution to avoid the data
leakage, this solution service must be smart enough to segregation the data for each clients
(Mahmood Z& Hill R. 2010).
SEGREGATION
Data segregation is the separations of data of one client of other clients (Figure 2.6).
Consumer A, Consumer B, and Consumer C share the same commodity resources but due
to segregation they have their own data separate from each other. In the cloud environment,
the resources are shared by multiple clients this means the data for multiple customers may
be stored or processed on the same physical servers (Kaur K & Vashisht S.2013).

16
Clients may not know where their data is being stored and there may be a risk of
data being stored alongside other client’s information, Data segregation and data location
are of particular importance in the cloud computing, given the disparate physical location of
data and shared computing resources (Sen J, 2013).
Figure 2.6: Segregation Consumer (Kaur K& Vashisht S.2013).
All the resources are shared in the cloud so every service shares resources such as
space on the provider’s servers and other parts of the provider’s infrastructure. Hypervisor
is used to create virtual containers on the provider’s hardware for each of its clients, but
still there is lack of security of data of the clients. Data is stored in a shared environment
where one client’s data is stored alongside another client’s data (Kaur K& Vashisht
S.2013).

17
IMPORTANCE OF DATA SEGREGATION
� Loss of Sensitive Information
In cloud all the resources are shared. To reduce the cost, data from different clients
is stored in the same container, if there is aggregation of data done by the service under the
control of cloud service provider. There is logical isolation between the data of each and
every client, but the risk of data leakage from client to another is possible (Amar B .2012).
� Less Reliability
Data from many organizations is just logically separated from each other. It can be
mixed. If your data is not secure or might be accessed by another person then you never
prefer to store your data on the cloud. A disgruntled employee could alter or destroy the
data using his or her own access credentials. If cloud storage system is not reliable, no one
wants to save the data on an unreliable system (Sen J, 2013).
� Lack of Availability
As previously mentioned without data separation, one organization can access the
data of another organization. It is also possible that data might be misused or get lost. You
can’t compromise your data only to reduce the cost. Organizations always need their data to
run their businesses so we need to separate the data for high availability (Kaur K &
Vashisht .2013).
This research aims to build businesses taxonomy to classify the companies
depending on their business type. Yellow page is one of components of web service which

18
classifies the companies depending on their types. Thus, this research will use yellow pages
to build the businesses taxonomy.
WEB SERVICE
According to Deng.F (2012) a web service is a method of communication between
two electronic devices over a network. The web service contains three components:
1. Simple Object Access protocol (SOAP), which is the protocol for the exchange of
XML messages via HTTP & HTTPS protocol.
2. Web Services Description Language (WSDL), which is the language of the XML
format for describing Web services.
3. Universal Description, Discovery, and Integration (UDDI), which is an online
directory of services provided by a Web server and allows them to get to know each other
UDDI information is often described as being divided into three main categories of
business information:
White Pages: Business name, address, contact information, Web site, and Data Universal
Numbering System (DUNS) or other identifying number.
Yellow Pages: Type of business, location, and products, including various categorization
taxonomies for geo-graphical location, industry type, business ID.
Green Pages: Technical information about business services, such as how to interact with
them, business process definitions, and so on. A pointer to the business's WSDL file, if any,

19
would be placed here. Information in this category describes a service’s
features/functionality, including a unique ID for the service. This category is quite new and
specific to the internet.
WORDNET
WordNet is an online lexical database of english nouns, verbs, adjectives and
adverbs that are grouped into sets of cognitive synonyms (synsets), each expressing distinct
concept. Synsets are interlinked by means of conceptual-semantic and lexical relations.
WordNet groups words together based on their meanings, so it superficially resembles a
thesaurus (Ester, M .et al .1996).
WordNet divides words into nouns, verbs, adjectives, adverbs. However these four
groups are organized in different ways. WordNet organizes the nouns depending on the
hierarchy of subjects, verbs according to lexical collection relationship, adjectives and
adverbs according to N-dimensional space. For example, we illustrate the 25 base classes
from the nouns (Ester, M .et al .1996).
(Snasel et al., 2005) studied the WordNet ontology and semantic analysis
mechanism in order to retrieve data from Internet to the user PC. The authors explained that
despite of the big advantage of semantic there still several problems that need to be solved.
When retrieving information, it is important to consider the dimensions of the desired
document. The authors suggest a method for retrieving information called LSI (Latent
Semantic Index) which is numerical method that discovers latent semantics. In this paper

20
authors present a basic method for mapping LSI concepts. The results of the test of the
proposed method show that the method was strong enough in semantic retrieving data.
SEMANTIC SIMILARITY
Nagwani explained that the semantic similarity is a concept whereby a set of documents
or terms within term lists assign a metric based on the likeness of their meaning / semantic
content. Various semantic similarity techniques are available which can be used for
measuring the semantic similarity between text documents (Nagwani N. 2011).
Described the different types of the semantic similarity:
1) Path Length Similarity Measures:
� Path
� Wu - Palmer
� Leacock & Chodorow
2) Information Content Similarity Measures:
� Resnik
� Lin
� Jiang &Conrath
3) Semantic Relatedness Measures
� Extended Gloss Overlaps (Adapted Lesk)
� Context Vectors
� Hirst& St-Onge. Also define the WordNet as a machine readable dictionary created
at the Cognitive Science Laboratory at Princeton University. Unlike most
dictionaries, WordNet contains only open-class words (nouns, verbs, adjectives,
and adverbs) (Nagwani N. 2011).

21
2.3. LITERATURE REVIEW & RELATED WORKS
(Curran K., 2011) provided an overview of the key aspects of cloud computing
which has five key attributes which grant it some advantages over similar technologies and
these attributes include:
1.Multi tenancy (shared resources): Unlike previous computing models, which
assumed dedicated resources dedicated to a single user or owner, cloud computing Is based
on a business model in which resources are shared at the network, host and application
level.
2. Massive scalability: Cloud computing provides the ability to scale to tens of
thousands of systems, as well as the ability to massively scale bandwidth and storage space.
3. Elasticity: Users can rapidly increase and decrease their computing resources as
needed, as well as release resources for other uses when they are no longer required.
4. Pay as you go: Users pay for only the resources they actually use and for only the
time they require them.
5. Self-provisioning of resources: Users self-provision resources, such as additional
systems (processing capability, software & storage) and network resources.
Zhang. Z and Fu. S (2011) focus on the principle of cloud computing and define it
as virtual pool of computing resources. They elaborate on the actual workings of cloud
computing and asserts the presence of mandatory application environments, that enables
the users to access and store data in a dynamic manner. Moreover, Zhang et al. (2010),
identify the different cloud computing styles. They introduce SaaS, utility computing,
network service, PaaS, Management service provider, commercial service platform and

22
integrating internet. They define SaaS as a type of cloud computing that transfer programs
to its end users through a browser. Utility computing is defined as a service offered by
cloud computing through its characteristic features such as virtualization, memory and data
center pool. Network service is defined as a service closely linked with SaaS, which
provides the developers the necessary platform to develop applications for the cloud
(Zhang.Z et al, 2011).
With respect to the economics of cloud adoption and growth, Armbrust et al (2009)
claim that cloud computing enables trade off decisions more fluid due to the elasticity
feature of the cloud. In addition, they claim that hardware resource costs such as computing
and storage are comparatively low in cloud computing. And, while adopting cloud
computing, the organizations need to conduct appropriate analysis with respect to the
demand and utility and operational costs. Spinola (2009) outlines the risks of cloud as
potential challenges for the active deployment of services. Issues pertinent to data security,
confidentiality, data segregation, SLAs and licensing and legal systems have questioned the
credibility of cloud computing.
Subashin S, (2011) surveyed of the different security risks that posed a threat to the
cloud. Also surveyed more specifically to the different security issues that has emanated
due to the nature of the service delivery models of a cloud computing system and define the
elements key for each. Security issues in SaaS: the following key security elements should
be carefully considered as an integral part of the SaaS application development and
deployment process: Data security, Network security, Data locality, Data integrity, Data
segregation, Data access, Authentication and authorization, Data confidentiality, Web

23
application security, Data breaches, Virtualization vulnerability, Availability, Backup,
Identity management and sign-on process. Security issues in PaaS: in the PaaS model, the
provider might give some control to the people to build applications on top of the platform.
Hackers are likely to attack visible code, including but not limited to code running in user
context. They are likely to attack the infrastructure and perform extensive black box testing.
Security issues in IaaS: the security responsibilities of both the provider and the consumer
greatly differ between cloud service models (Subashin S., 2011).
Chen Z, (2010) discussed the evolvement of cloud computing paradigm and
presents a framework for secure cloud computing through IT auditing. The research
approach is to establish a general framework using checklists by following data flow and its
lifecycle. The checklists are made based on the cloud deployment models and cloud service
models. The contribution of the paper is to understand the implication of cloud computing
and what is meant to secure cloud computing via IT auditing rather than propose a new
methodology and new technology to secure cloud computing. Their checklist focuses on
the following: Data location Aware, Data ownership aware, Data protection plan and best
practice, data processing isolation, data lock-in, IaaS IT architecture, regulatory compliance
(Chen Z, 2010).
Budanitsky .A, (2006) proposed to evaluate similarity measurements based on
WordNet. However, the authors have evaluated five measurements lexical semantics
distance. The authors mentioned that most of their work was limited to the narrower notion
of similarity measures. These relationships include not just hyponymy and the non
hyponymy relationships in WordNet such as meronymy but also associative and ad hoc

24
relationships. As the authors mentioned, these can include just about any kind of functional
relation or frequent association in the world (Budanitsky.A, 2006).
Li et al., 2003 highlighted that the similarity between words and concepts had become
difficult problem that face many applications and artificial intelligence. Tries to predict the
determination of semantic similarity by a number of information resources that contain
semantic information from lexical taxonomy. They also indicated how information sources
could be used effectively by using variety of strategies for using various possible
information resources. However, authors argued that all first-hand information sources
need to be processed in similarity measure. Besides that, authors claimed that humans can
compare word similarity with a finite interval between similar and non-similar (Li et al.,
2003).
(Miller et al., 2006) proposed an introduction to Word Net. They highlighted on the
difficulty differences between WordNet and standard dictionary is that WordNet divide
word into five elements: nouns, verbs, adjectives, adverbs and function words, and in fact
the WordNet contains only four elements: nouns, verbs, adjectives and adverbs. Also,
authors have indicated the lexical matrix and explained the principle of this matrix and how
it can be used in semantic analysis to find matches between concepts (Miller et al., 2006).
In summary there are limited studies which take into consideration the security in cloud
computing around the world. Most of the previous studies emphasize on how to decrease
the cost and increase the security. So, our thesis goes hand by hand with these works to find
an optimal technique to achieve a suitable cost and security.

25
3. CHAPTER THREE
TAXONOMY BUILDING
3.1. PREFACE
Several research studies have been done to improve the security in cloud computing.
This chapter develop a model to enhance the security of cloud by segregating businesses
that have the same businesses type. This is done through building classification for the
businesses according to their types. Finally, In Section 3.4 semantic similarity measurement
is used to calculate the distance between businesses.
3.2. INTRODUCTION
This research develops a new technique to reduce the risks of using cloud by segregating
the businesses which have the same type of business through the following steps:
� Building classification of businesses according to their type using UDDI
component.
� Using semantic similarity measurement to calculate the distance between
businesses.
� Applying several experiments to determine the most efficient technique.

26
3.3. YELLOW PAGE CLASSIFICATION
This section focuses on building classification of businesses depending on yellow
pages. The yellow pages are one of UDDI components which are responsible for the
registration of companies depending on their businesses type.
Companies register their contact information, including details such as phone, fax
numbers, and web site. The Registration contains information categories for searching,
such as industry type code, business type, and so on. Other businesses can search about the
information, which has been registered in UDDI, to find suppliers for parts, helping
services and marketplaces (Feng. D.2012).
BUSINESSES CLASSIFICATION
According to the yellow pages, this research built a classification of businesses as a
first step to prepare the proposal model. As previously mentioned yellow pages are used to
register companies depending on their businesses type. So, figure 3.1 shows the level of
taxonomy.
Figure 3.1: Level of taxonomy (Feng. D.2012).

27
To build the taxonomy, choose three main businesses which are education, financial
services and medical services. These businesses are chosen because they are the most
popular companies using in yellow pages. And can expand this taxonomy to include more
businesses in future works.
� Education businesses
According to the yellow pages, education businesses contain three main categories
schools, colleges and universities. Then, these main categories are divided into several
categories, as shown in Figure 3.2.
Figure 3.2: Education Taxonomy (Perrigne. I. 2010).

28
� Financial services
The Yellow pages, also, classify the financial services to three main categories
bank, insurance and investment. And as what happened in the previous process, the main
categories are divided into other categories, as shown in Figure 3.3.
Figure 3.3: Financial Services Taxonomy (Perrigne. I.2010).
� Medical services
Medical services face the same stages. That started by dividing it into categories
dentists, diagnosis and doctors. After that, these categories are divided into several types.
Figure 3.4 shows these stages
29
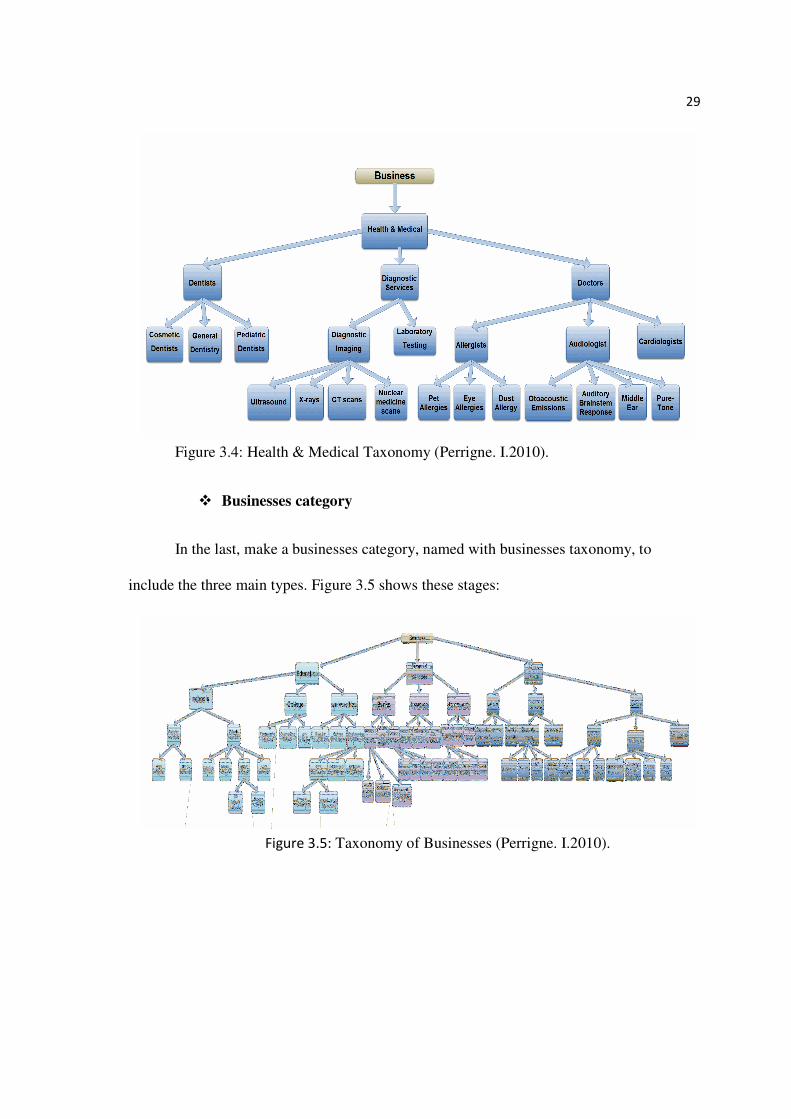
Figure 3.4: Health & Medical Taxonomy (Perrigne. I.2010).
� Businesses category
In the last, make a businesses category, named with businesses taxonomy, to
include the three main types. Figure 3.5 shows these stages:
Figure 3.5: Taxonomy of Businesses (Perrigne. I.2010).

30
As previously mentioned, calculating the similarity between businesses type is one
of the most methodologies in this thesis. WordNet use semantic similarity measurement to
compute the similarity between concepts. This thesis will use this measurement to find the
similarity between businesses in businesses taxonomy.
3.4. WORDNET AND SEMANTIC SIMILARITY MEASURES
WordNet is a large lexical database of English. WordNet Nouns, verbs, adverbs
and adjectives are organized by a variety of semantic relations into synonym sets (synsets),
which represent one concept. Some of the Examples of semantic relations, used by
WordNet, are synonymy, autonomy, hyponymy, member, similar, domain and cause and so
on (Meng L et al., 2014-A).
WordNet uses several measurements to calculate the similarity between concepts.
This research will apply these measurements to calculate the similarity between businesses
in the businesses taxonomy shown in Figure 3.3. These measurements they are:
1-The Shortest Path based Measure
This measure computes the semantic relationship of word senses by counting the
number of nodes to get the shortest path between the senses in the WordNet (Miller et al.,
2006).
Formal:
��� ���� �, � � � ����_��� � ��� … (3.1)
Where is:
� Sim (C1, C2): Semantic similarity between concept C1 and concept C2.
� C1: Concept 1, C2: Concept 2.
31
� Deep_Max: The max depth of the taxonomy.
� Len: The shortest path between concepts.
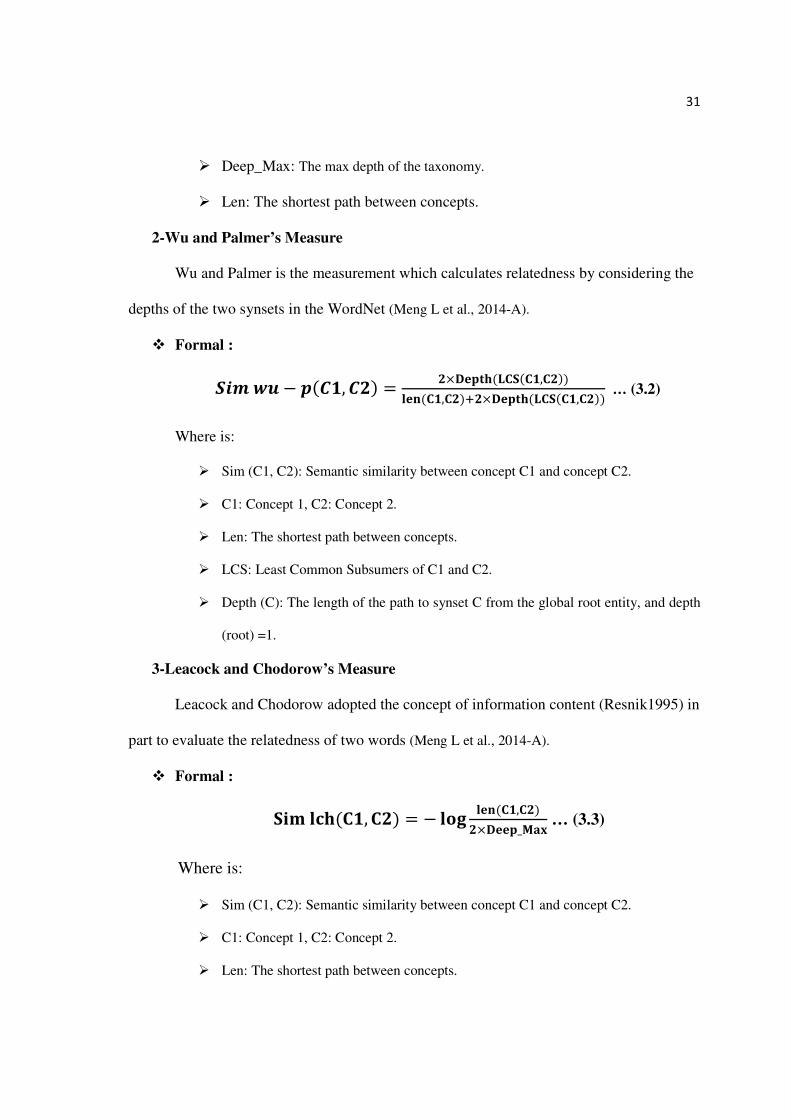
2-Wu and Palmer’s Measure
Wu and Palmer is the measurement which calculates relatedness by considering the
depths of the two synsets in the WordNet (Meng L et al., 2014-A).
� Formal :
��� �� � ���, � � � ���������, ��
���, �! ���������, �� … (3.2)
Where is:
� Sim (C1, C2): Semantic similarity between concept C1 and concept C2.
� C1: Concept 1, C2: Concept 2.
� Len: The shortest path between concepts.
� LCS: Least Common Subsumers of C1 and C2.
� Depth (C): The length of the path to synset C from the global root entity, and depth
(root) =1.
3-Leacock and Chodorow’s Measure
Leacock and Chodorow adopted the concept of information content (Resnik1995) in
part to evaluate the relatedness of two words (Meng L et al., 2014-A).
� Formal :
��� "��, � � � #$ ���, �
�����_��� … (3.3)
Where is:
� Sim (C1, C2): Semantic similarity between concept C1 and concept C2.
� C1: Concept 1, C2: Concept 2.
� Len: The shortest path between concepts.

32
� Deep_Max: The max depth of the taxonomy.
4-Resnik’s Measure
Resnik is defined as the measurement for calculating the similarity between two
synsets to be the information content of their lowest super-ordinate, last specific common
subsumer (Meng L et al., 2014-A).
� Formal :
���%�&��'�, � � (���, �� … (3.4)
Where is:
� Sim (C1, C2): Semantic similarity between concept C1 and concept C2.
� C1: Concept 1, C2: Concept 2.
� Deep_Max: The max depth of the taxonomy.
� Depth (C): The length of the path to synset C from the global root entity.
� LCS: Least Common Subsumers of C1 and C2.
� IC: Information Content
)��� � #$ �������
#$ ����_����… (3.5)
5-Lin’s Measure
Lin introduces another way of computing the similarity to distinguish among word
senses (Meng L et al., 2014-A).
� Formal :
��� ���, � � �(�� �, ��
(��!( �… (3.6)
Where is:
� Sim (C1, C2): Semantic similarity between concept C1 and concept C2.

33
� C1: Concept 1, C2: Concept 2.
� Deep_Max: The max depth of the taxonomy.
� Depth (C): The length of the path to synset C from the global root entity.
� LCS: Least Common Subsumers of C1 and C2.
� IC: Information content
The related concepts in the measurements, here, are important to be defined. An
example figure 3.6 explains these concepts.
Figure 3.6: Example of WordNet (Meng L .2014).
In the following, this research introduces a metric amount as an example to each concept:
� Len (Bus, Train) is (2).
� LCS (Bus, Train) public transport.

34
� Depth (Bus) is (7).
� Deep_Max is (10).
After the explanation of the measurements, this research chased (19) companies
from our taxonomy, to calculate the similarity between businesses.
1. The Shortest Path Based Measurement
The similarity between high schools and middle schools in the shortest path
measure, depending on businesses taxonomy the len between high schools & middle
schools is (2), and the Deep_Max of businesses taxonomy is (6). So, according to equation
(3.1) the similarity in shortest path based measure is:
��� ���� �, � � � ����_��� � ���
��� ���� *�$� �"�## & , ��++ � &"�## &� � � , �
��� ���� *�$� �"�## & , ��++ � &"�## &� � �-
Calculate the outcome value (sim Path) which are (10) in percentage value.
Therefore, this research chooses two companies with the same business domain
(Adjustment Bonds). We have found that the len is (0) and the output of the similarity is
(12). Thus, 12 is the maximum value which represents in (100%), according to our
example, (10) will represent.//�./
.0� 83.3.
Table 3.1, shows the similarity between some businesses by the shortest path
measure.

35
Table 3.1: The Shortest Path Measure
No C1:concept 1 C2: concept 2 simpath %
1 High schools Middle schools 10 83.3%
2 Ice hockey schools Racing schools 10 83.3%
3 Middle schools Racing schools 7 58.3%
4 Racing schools Arts colleges 6 50%
5 Community colleges Counselling College 10 83.3%
6 Arts colleges Coastal engineering 6 50%
7 Coastal engineering Construction engineering 10 83.3%
8 Construction engineering Software Engineering 9 75%
9 Software Engineering Postal savings banks 4 33.3%
10 Community development bank Coastal engineering 3 25%
11 Offshore banks Law schools 4 33.3%
12 Callable Bonds Offshore banks 6 50%
13 Callable Bonds Racing schools 3 25%
14 Convertible Bonds X-rays 4 33.3%
15 Ultrasound Nuclear medicine scans 10 83.3%
16 Eye Allergies Middle Ear 8 66.6%
17 Middle Ear Middle schools 4 33.3%
18 Cardiologists Software Engineering 5 41.6%
19 Adjustment Bonds Adjustment Bonds 12 100%

36
2. Wu- Palmer’s Measure
The similarity among high schools and middle schools by Wu & Palmer’s measure,
depending on businesses taxonomy the len between high schools & middle schools is (2) ,
the LCS(High schools and Middle schools) is regular school, thus, the Depth LCS(High
schools and Middle schools) is (4).So, according to equation (3.2) the similarity in Wu-P
measure is:
��� �� � ���, � � � � 45�678����, � ��
���, � 9 � ��������, ��
��� �� � �*�$� &"�## & , ��++ � &"�## &� � � :
9 � :
��� �� � �*�$� &"�## & , ��++ � &"�## &� � -. ;
Table 3.2, shows the similarity between some businesses by the Wu-p measure.
Table 3.2: The Wu-P Measurement.
No. C1:concept 1 C2: concept 2 Sim wu-p %
1 High schools Middle schools 0.8 80%
2 Ice hockey schools Racing schools 0.83 83%
3 Middle schools Racing schools 0.54 54%
4 Racing schools Arts colleges 0.4 40%
5 Community colleges Counselling College 0.6 60%
6 Arts colleges Coastal engineering 0.4 40%
7 Coastal engineering Construction engineering 0.83 83%
8 Construction engineering Software Engineering 0.72 72%
9 Software Engineering Postal savings banks 0.2 20%
37
No. C1:concept 1 C2: concept 2 Sim wu-p %
10 Community development bank Coastal engineering 0.18
18%
11 Offshore banks Law schools 0.2 20%
12 Callable Bonds Offshore banks 0.4 40%
13 Callable Bonds Racing schools 0.18 18%
14 Convertible Bonds X-rays 0.2 20%
15 Ultrasound Nuclear medicine scans 0.8 80%
16 Eye Allergies Middle Ear 0.6 60%
17 Middle Ear Middle schools 0.2 20%
18 Cardiologists Software Engineering 0.22 22%
19 Adjustment Bonds Adjustment Bonds 1 100%
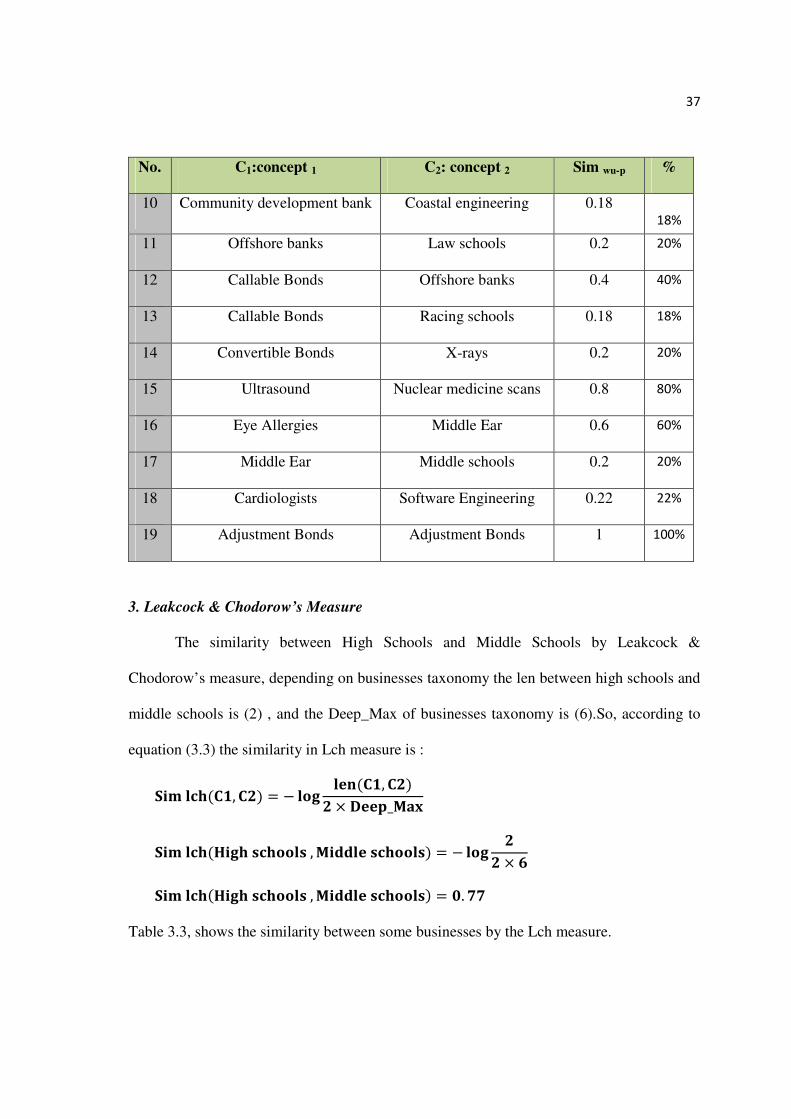
3. Leakcock & Chodorow’s Measure
The similarity between High Schools and Middle Schools by Leakcock &
Chodorow’s measure, depending on businesses taxonomy the len between high schools and
middle schools is (2) , and the Deep_Max of businesses taxonomy is (6).So, according to
equation (3.3) the similarity in Lch measure is :
��� "��, � � � #$ ���, �
� ����_���
��� "�*�$� &"�## & , ��++ � &"�## &� � � #$
� ,
��� "�*�$� &"�## & , ��++ � &"�## &� � -. <<
Table 3.3, shows the similarity between some businesses by the Lch measure.

38
Table 3.3: The Leakcock & Chodorow’s Measure
No. C1:concept 1 C2: concept 2 Siml&ch %
1 High schools Middle schools 0.77 77%
2 Ice hockey schools Racing schools 0.77 77%
3 Middle schools Racing schools 0.38 38%
4 Racing schools Arts colleges 0.30 30%
5 Community colleges Counselling College 0.77 77%
6 Arts colleges Coastal engineering 0.30 30%
7 Coastal engineering Construction engineering 0.77 77%
8 Construction engineering Software Engineering 0.60 60%
9 Software Engineering Postal savings banks 0.17 17%
10 Community development bank Coastal engineering 0.12 12%
11 Offshore banks Law schools 0.17 17%
12 Callable Bonds Offshore banks 0.30 30%
13 Callable Bonds Racing schools 0.12 12%
14 Convertible Bonds X-rays 0.17 17%
15 Ultrasound Nuclear medicine scans 0.77 77%
16 Eye Allergies Middle Ear 0.47 47%
17 Middle Ear Middle schools 0.17 17%
18 Cardiologists Software Engineering 0.23 23%
19 Adjustment Bonds Adjustment Bonds 0 100%

39
4. Resnik’s Measure
The similarity between high schools & middle schools by Resnik’s measure,
depending on businesses taxonomy, the LCS(High schools and Middle schools) is regular
school, thus, the Depth regular school is (4), and the Deep_Max of businesses taxonomy is
(6).So, according to equation (3.5) the similarity in resnik’s measure is :
���%�&��'�, � � (���, ��
���%�&��'*�$� &"�## & , ��++ � &"�## &� � (%�$= �> �"�## �
)�%�$= �> �"�## � � #$ �����%�$= �> �"�## �
#$ ����_����
)�%�$= �> �"�## � � #$ :�
#$ ,�
���%�&��'*�$� &"�## & , ��++ � &"�## &� � -. <<
Table 3.4, shows the similarity between some businesses by the resnik’s measure.
Table 3.4: The Resnik’s Measure
No. C1:concept 1 C2: concept 2 SimResnik %
1 High schools Middle schools 0.77 77%
2 Ice hockey schools Racing schools 0.89 89%
3 Middle schools Racing schools 0.61 61%
4 Racing schools Arts colleges 0.38 38%
5 Community colleges Counselling College 0.61 61%
6 Arts colleges Coastal engineering 0.38 38%
7 Coastal engineering Construction engineering 0.88 88%

40
No. C1:concept 1 C2: concept 2 SimResnik %
8 Construction engineering Software Engineering 0.77 77%
9 Software Engineering Postal savings banks 0 0%
10 Community development bank Coastal engineering 0 0%
11 Offshore banks Law schools 0 0%
12 Callable Bonds Offshore banks 0.38 38%
13 Callable Bonds Racing schools 0 0%
14 Convertible Bonds X-rays 0 0%
15 Ultrasound Nuclear medicine scans 0.77 77%
16 Eye Allergies Middle Ear 0.61 61%
17 Middle Ear Middle schools 0 0%
18 Cardiologists Software Engineering 0 0%
19 Adjustment Bonds Adjustment Bonds 0.89 89%
5. Lin’s Measure
The similarity among high schools & middle schools by Lin’s measure, depending
on businesses taxonomy, the LCS(High schools and Middle schools) is regular school, thus,
the Depth of regular school is (4), and the Deep_Max of businesses taxonomy is (6).So,
according to equation (5) the similarity in lin’s measure is :

41
��� ���, � � � (�� �, ��
(�� 9 ( �
��� ��*�$� &"�## & ,��++ � &"�## &� � � (%�$= �> �"�## �
(*�$� &"�## &� 9 (��++ � �"�## &�
)�%�$= �> �"�## � � #$ :�
#$ ,�� -. <<
)�*�$� �"�## &� � #$ ?�
#$ ,�� -. ;@
)���++ � �"�## &� � #$ ?�
#$ ,�� -. ;@
��� ��*�$� &"�## & ,��++ � &"�## &� � � -. <<
-. ;@ 9 -. ;@
��� ��*�$� &"�## & ,��++ � &"�## &� � -. ;,
Table 5, shows the similarity between some businesses by the lin’s measure.
Table 3.5: The Lin’s Measure
No. C1:concept 1 C2: concept 2 Simlin %
1 High schools Middle schools 0.86 86%
2 Ice hockey schools Racing schools 0.89 89%
3 Middle schools Racing schools 0.64 64%
4 Racing schools Arts colleges 0.42 42%
5 Community colleges Counselling College 0.79 79%
6 Arts colleges Coastal engineering 0.42 42%
7 Coastal engineering Construction engineering 0.88 88%
8 Construction engineering Software Engineering 0.81 81%
9 Software Engineering Postal savings banks 0 0%

42
No. C1:concept 1 C2: concept 2 Simlin %
10 Community development bank Coastal engineering 0 0%
11 Offshore banks Law schools 0 0%
12 Callable Bonds Offshore banks 0.42 42%
13 Callable Bonds Racing schools 0 0%
14 Convertible Bonds X-rays 0 0%
15 Ultrasound Nuclear medicine scans 0.86 86%
16 Eye Allergies Middle Ear 0.68 68%
17 Middle Ear Middle schools 0 0%
18 Cardiologists Software Engineering 0 0%
19 Adjustment Bonds Adjustment Bonds 1 100%
Table 3.6: The LCS for Some Companies in Business Taxonomy
No. C1:concept 1 C2: concept 2 LCS(C1,C2)
1 High schools Middle schools Regular schools
2 Ice hockey schools Racing schools Sport schools
3 Middle schools Racing schools Schools
4 Racing schools Arts colleges Education
5 Community colleges Counselling College College
6 Arts colleges Coastal engineering Education
7 Coastal engineering Construction engineering Civil Engineering
8 Construction engineering Software Engineering Engineering universities

43
No. C1:concept 1 C2: concept 2 LCS(C1,C2)
9 Software Engineering Postal savings banks Business
10 Community development bank Coastal engineering Business
11 Offshore banks Law schools Business
12 Callable Bonds Offshore banks Financial Services
13 Callable Bonds Racing schools Business
14 Convertible Bonds X-rays Business
15 Ultrasound Nuclear medicine scans Diagnostic Imaging
16 Eye Allergies Middle Ear Doctors
17 Middle Ear Middle schools Business
18 Cardiologists Software Engineering Business
19 Adjustment Bonds Adjustment Bonds Adjustment Bonds
3.5. SEMANTIC SIMILARITY MEASUREMENT EVALUATION
This classification is done according to the yellow pages depending on their
businesses type. Then, the semantic similarity measurement is applied to calculate the
similarity between businesses. So now, this thesis is evaluating the measurements, by two
approaches, to get the suitable one for our proposed model.
3.5.1. PREVIOUS STUDIES
Michelizzi J. (2005) illustrated Wu-p measurement by calculating the similarity
between two concepts using the depth of the two concepts, Michelizzi J refer to use the

44
Wu-P measurement (Michelizzi J. 2005). Table 3.7 shows some advantages and
disadvantages of Semantic Similarity measurement according to Meng et al (2014-B).
Table 3.7.Advantages and Disadvantages Semantic Similarity (Meng et al, 2014-B)
Measure Features Advantages Disadvantages
Shortest path
count of edges between concepts
Simple two pairs with equal lengths of shortest path will have the same similarity
Wu-P path length to subsumer, scaled by subsumer path to root
Simple two pairs with the same LCS and equal lengths of shortest path will have the same similarity
L&C count of edges between and log smoothing
Simple two pairs with equal lengths of shortest path will have the same similarity
Resnik IC of LCS Simple two pairs with the same LSC will have the same similarity
Lin IC of LCS and the compared concepts
take the IC of compared concepts into considerate
two pairs with the same summation of IC(c1) and IC(c2) will have the same similarity
The results of this step present that Wu-P (similarity measurement which is based
on path lengths between the concepts to calculate the similarity between them) is the best
measurement to work with.
3.5.2. QUESTIONNAIRES
The study is conducted to investigate the best measurement tools depending on the
advertisement company “Yellow Pages Jordan for advertising Company”. The data is
collected quantitatively by questionnaire prepared by the researcher from 18 participants.
The Population is taken by stratified sampling method as the following:-
� Sales: 33.3%
� Marketing: 44.4%
45
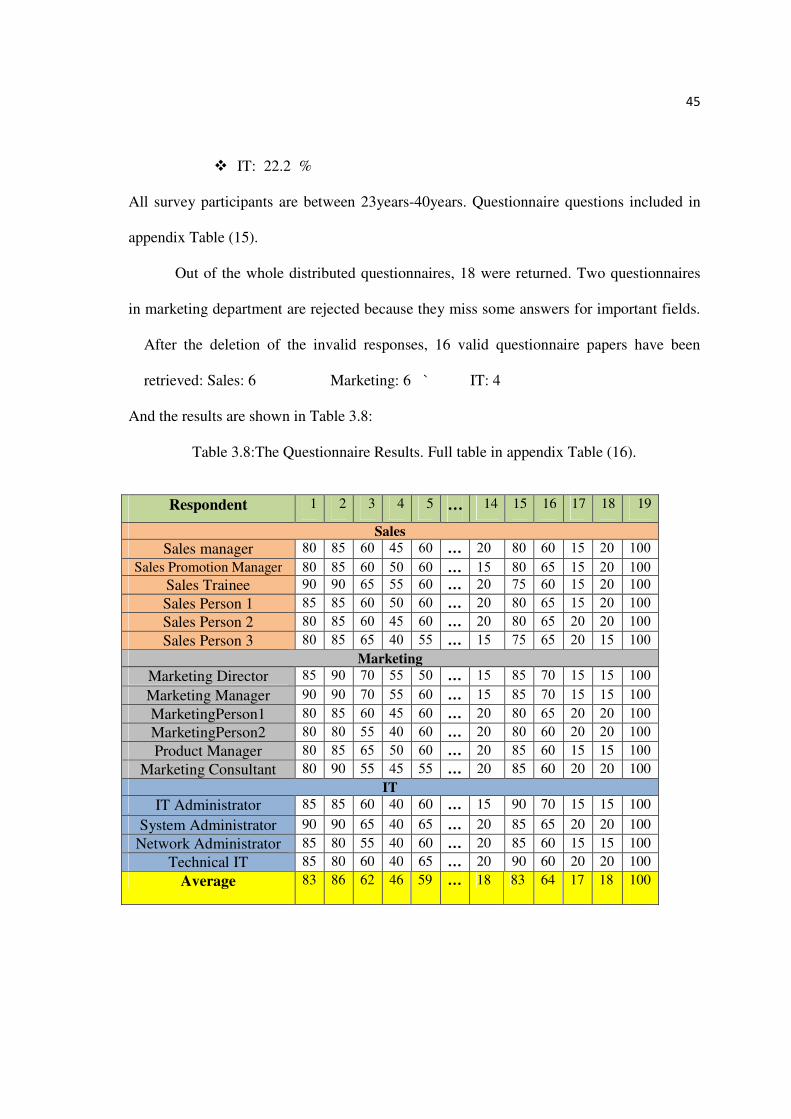
� IT: 22.2 %
All survey participants are between 23years-40years. Questionnaire questions included in
appendix Table (15).
Out of the whole distributed questionnaires, 18 were returned. Two questionnaires
in marketing department are rejected because they miss some answers for important fields.
After the deletion of the invalid responses, 16 valid questionnaire papers have been
retrieved: Sales: 6 Marketing: 6 ` IT: 4
And the results are shown in Table 3.8:
Table 3.8:The Questionnaire Results. Full table in appendix Table (16).
Respondent 1 2 3 4 5 … 14 15 16 17 18 19
Sales
Sales manager 80 85 60 45 60 … 20 80 60 15 20 100
Sales Promotion Manager 80 85 60 50 60 … 15 80 65 15 20 100
Sales Trainee 90 90 65 55 60 … 20 75 60 15 20 100
Sales Person 1 85 85 60 50 60 … 20 80 65 15 20 100
Sales Person 2 80 85 60 45 60 … 20 80 65 20 20 100
Sales Person 3 80 85 65 40 55 … 15 75 65 20 15 100
Marketing
Marketing Director 85 90 70 55 50 … 15 85 70 15 15 100
Marketing Manager 90 90 70 55 60 … 15 85 70 15 15 100
MarketingPerson1 80 85 60 45 60 … 20 80 65 20 20 100
MarketingPerson2 80 80 55 40 60 … 20 80 60 20 20 100
Product Manager 80 85 65 50 60 … 20 85 60 15 15 100
Marketing Consultant 80 90 55 45 55 … 20 85 60 20 20 100
IT
IT Administrator 85 85 60 40 60 … 15 90 70 15 15 100
System Administrator 90 90 65 40 65 … 20 85 65 20 20 100
Network Administrator 85 80 55 40 60 … 20 85 60 15 15 100
Technical IT 85 80 60 40 65 … 20 90 60 20 20 100
Average 83 86 62 46 59 … 18 83 64 17 18 100

46
After getting the results of questionnaire, we compare these results with the
semantic similarity measurements to find the optimal measure through calculating the
average of errors according to the measurements. Since the |80-83|=3 which (80) is the
result of Wu-P measurements, calculated in table 3.2 and (83) in the questionnaire table 3.8
the result is (-3), then tacking absolute value of (-3) to get the (3) as result of error between
Wu-P and expert person. The results are shown in Table 3.9:
Table 3.9:The Evaluation of Semantic Similarity Measurements. Full Table in Appendix Table (2)
No Path Error W u- P Error L&Ch Error Resnik Error Lin Error Expert person
1 83% 0 80% 3 77% 6 77% 6 86% 3 83%
2 83% 3 83% 3 77% 9 89% 3 89% 3 86%
3 58% 4 54% 8 38% 24 61% 1 64% 2 62%
4 50% 4 40% 6 30% 16 38% 8 42% 4 46%
.
.
.
.
.
.
.
.
.
.
.
.
.
.
.
.
.
.
.
.
.
.
.
.
.
.
.
.
.
.
.
.
.
.
.
.
13 25% 6 18% 1 12% 7 0% 19 0% 19 19%
14 33% 15 20% 2 17% 1 0% 18 0% 18 18%
15 83% 0 80% 3 77% 6 77% 6 86% 3 83%
16 67% 3 60% 4 47% 17 61% 3 68% 4 64%
17 33% 16 20% 3 17% 0 0% 17 0% 17 17%
18 41% 23 22% 4 23% 5 0% 18 0% 18 18%
19 100
%
0 100% 0 100% 0 89% 11 100
%
0 100%
Error 8%
3.1%
9.1%
9.7%
9.2%

47
3.6. ACCEPTED CUTTING POINT OF WU-P MEASURE
After the above experiment finished and refer to use Wu-P measure in our research.
However, the range of Wu-P measure between zeros to one. So, there are many cutting
point threshold available in the Wu-P similarity measure. Thus, we need to determine
which threshold to use in this research. Our experiments depending on expert human and
using score value (0.6, 0.5 and 0.4). According to expert opinion this experiment selects
value (1) if the companies can’t stay together, and select value (0) if the companies can stay
together. If Wu-P higher than cutting points then their will be conformity with expert
opinion so the error will be (0) as shown below.
1. Cutting point = 0.6
The similarity between Callable Bonds and Offshore banks depending on Wu-P measure
is (0.4), which is lower than the cutting point (0.6). So; the error is (1), this result is rejected
because these companies have the same type of businesses and should not be together, as
shown in columns (12) in Table 3.10 . And so on.
Table 3.10: Results When Use the Cutting Point (0.6). Full Table in Appendix Table (6).
No Company 1 Company 2 Wu-P Wu-P>0.6 Error E.P
1 High schools Middle schools 0.8 1 0 1
2 Ice hockey schools Racing schools 0.83 1 0 1
3 Middle schools Racing schools 0.54 0 1 1
4 Racing schools Arts colleges 0.4 0 1 1
5 Community colleges Counselling College 0.6 1 0 1
. . . . . . .

48
. . . . . . .
11 Offshore banks Law schools 0.2 0 0 0
12 Callable Bonds Offshore banks 0.4 0 1 1
13 Callable Bonds Racing schools 0.18 0 0 0
14 Convertible Bonds X-rays 0.2 0 0 0
15 Ultrasound Nuclear medicine 0.8 1 0 1
16 Eye Allergies Middle Ear 0.6 1 0 1
17 Middle Ear Middle schools 0.2 0 0 0
18 Cardiologists Software Engineering 0.22 0 0 0
19 Adjustment Bonds Adjustment Bonds 1 1 0 1
Average Error 21%
2. Cutting point = 0.5
The similarity between Callable Bonds and Offshore banks depending on Wu-P measure
is (0.4), which is lower than the cutting point (0.5). So; the error is (1), this result is rejected
because these companies have the same type of businesses and should not be together, as
shown in columns (12) in below table and so on. See Table 3.11.
Table 3.11: Results When Use the Cutting Point (0.5). Full Table in Appendix Table (7).
No Company 1 Company 2 Wu-P Wu-P>0.5 Error E.P
1 High schools Middle schools 0.8 1 0 1
2 Ice hockey schools Racing schools 0.83 1 0 1
3 Middle schools Racing schools 0.54 0 1 1
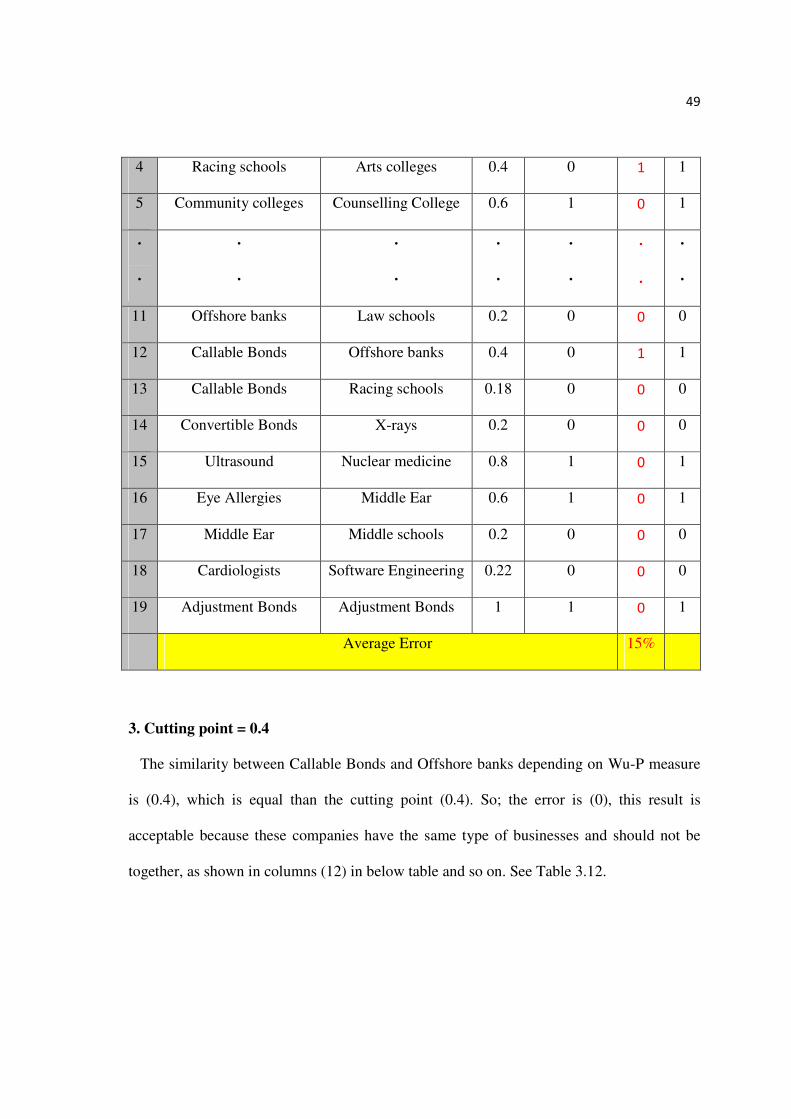
49
4 Racing schools Arts colleges 0.4 0 1 1
5 Community colleges Counselling College 0.6 1 0 1
.
.
.
.
.
.
.
.
.
.
.
.
.
.
11 Offshore banks Law schools 0.2 0 0 0
12 Callable Bonds Offshore banks 0.4 0 1 1
13 Callable Bonds Racing schools 0.18 0 0 0
14 Convertible Bonds X-rays 0.2 0 0 0
15 Ultrasound Nuclear medicine 0.8 1 0 1
16 Eye Allergies Middle Ear 0.6 1 0 1
17 Middle Ear Middle schools 0.2 0 0 0
18 Cardiologists Software Engineering 0.22 0 0 0
19 Adjustment Bonds Adjustment Bonds 1 1 0 1
Average Error 15%
3. Cutting point = 0.4
The similarity between Callable Bonds and Offshore banks depending on Wu-P measure
is (0.4), which is equal than the cutting point (0.4). So; the error is (0), this result is
acceptable because these companies have the same type of businesses and should not be
together, as shown in columns (12) in below table and so on. See Table 3.12.

50
Table 3.12: Results When Use the Cutting Point (0.4). Full Table in Appendix Table (8).
No Company 1 Company 2 Wu-P Wu-P>0.4 Error E.P
1 High schools Middle schools 0.8 1 0 1
2 Ice hockey schools Racing schools 0.83 1 0 1
3 Middle schools Racing schools 0.54 1 0 1
4 Racing schools Arts colleges 0.4 1 0 1
5 Community colleges Counselling College 0.6 1 0 1
.
.
.
.
.
.
.
.
.
.
.
.
.
.
11 Offshore banks Law schools 0.2 0 0 0
12 Callable Bonds Offshore banks 0.4 1 0 1
13 Callable Bonds Racing schools 0.18 0 0 0
14 Convertible Bonds X-rays 0.2 0 0 0
15 Ultrasound Nuclear medicine 0.8 1 0 1
16 Eye Allergies Middle Ear 0.6 1 0 1
17 Middle Ear Middle schools 0.2 0 0 0
18 Cardiologists Software Engineering 0.22 0 0 0
19 Adjustment Bonds Adjustment Bonds 1 1 0 1
Average Error 10%

51
SUMMARY
This research depends on using the Wu-Palmer measure (Wu-P) to calculate the
similarity between businesses type. From Table: 3.10, 3.11 and 3.12, the average error is
21%, 15% and, 10% sequentially. Thus, we consider cutting point 0.4 with the minimum
average error (10%).

52
4. CHAPTER FOUR
SEGREGATION TECHNIQUES
4.1. INTRODUCTION
In this section, the research shows several techniques to segregate the clients’ data
depending on size and similarity of business type, these techniques are:
1- Available Zones Technique
2-Businesses Randomly
3-- Businesses Sequential Server Technique
4- Businesses Neighbourhood
A) Businesses Neighbourhood with (3) Servers
B) Businesses Neighbourhood with (5) Servers
4.2. DATASET OVERVIEW
This part presents a brief idea about data that is used in our thesis where the data varies
depending on the needs. In this thesis, we assume that the dataset contains (48) companies
and (50) servers. These companies are classified according to our taxonomy which is found
in figure 3.5 that is explained in Chapter Three.

53
4.3. EXPERIMENTS ENVIRONMENT AND PROCEDURES
The experiment is a simplified approach for presentation and evaluation of techniques.
This thesis develops a set of techniques to achieve its main objective. This objective is
defined by enhancing the security through segregating the businesses which have the same
scope of companies’ data. These techniques need to be built on real software. So, it is
necessary to develop our model through a software platform. Is achieved by using
Microsoft VB.NET software. Finally, compare the results of techniques after segregation.
4.4. SEGREGATION USING AVAILABLE ZONES TECHNIQUES
This experiment presents distribution for businesses’ data over servers, depending on
the size of businesses’ data. This technique, available zones technique, is proposed by San
j. (2013). We use the Microsoft VB.NET to implement this technique. Figure 4.1 shows the
model.
4.4.1. THE MODEL
Figure 4.1: Available Zones Technique

54
4.4.2. THE PROCEDURE
In this experiment, the algorithm is designed to determine which server will be
selected depending on businesses data size. To determine the server, (48) companies
have been chosen from the businesses taxonomy, Figure 3.5. Also, it is assumed (50)
servers which refer to the same service provider, each server capacity are (1000) GB.
� The data come from the companies through SLA to cloud service provider. Then
the proposed model by San J. (2013) determines which server will be selected
through the following algorithms to store the data:
1- Select server from the data set randomly.
2- Check the server size if there is available size to insert the data.
3- If there isn’t available size, select other server randomly, and follow the same
procedure until finding the server with the available size.
4.4.3. THE RESULTS:
After the implementation of this technique by using Microsoft VB.NET, we have
found that some companies which have the same type of businesses share the same server.
And the red colours as shown in Table 4.1, identifies these companies
Table 4.1: Results of Available Zones Technique
No Company Name Size Server
ID No Company Name Size Server
ID
1 High schools 500 32 25 Commercial Banks 100 20
2 Middle schools 600 35 26 Community bank 100 48
3 Religious Schools 150 1 27 Vehicle Insurance 150 27
4 Music schools 50 3 28 Life Insurance 200 28
5 Ice hockey schools 500 3 29 Mailbox Bank 350 4
6 Racing schools 400 6 30 Telephone Banking 600 2
7 Law schools 350 40 31 Internet Banking 100 27

55
No Company Name Size Server
ID No Company Name Size Server
ID
8 Community colleges 850 8 32 SMS Bank 150 32
9 Counselling College 950 9 33 General Dentistry 50 33
10 Arts colleges 1000 10 34 Paediatric Dentists 100 34
11 Regular universities 100 32 35 Ultrasound 50 36
12 Culture universities 250 45 36 X-rays 50 36
13 Coastal engineering 650 16 37 CT scans 100 10
14 Construction engineering 750 1 38 Nuclear medicine scans 50 38
15 Mechanical Engineering 350 15 39 Laboratory Testing 150 50
16 Software Engineering 550 16 40 Pet Allergies 50 40
17 Convertible Bonds 1000 17 41 Eye Allergies 50 2
18 Callable Bonds 150 23 42 Dust Allergy 150 11
19 Adjustment Bonds 700 48 43 Otoacoustic Emissions 100 22
20 Stocks 600 20 44 Auditory Brainstem 200 37
21 Mutual Funds 550 21 45 Middle Ear 50 5
22 Health Insurance 200 20 46 Pure-Tone 200 16
23 Offshore banks 850 23 47 Cosmetic Dentists 100 12
24 Postal savings banks 900 24 48 Cardiologists 50 48
4.5. SEGREGATION OF BUSINESSES RANDOMLY
This experiment focuses on the segregation of businesses depending on businesses
type. We will use businesses taxonomy. Figure3.5, and use the Wu-P as measurement to
calculate the similarity between businesses type. The experiment was implemented on a
VB.NET.
4.5.1. THE MODEL
The proposed model, which is shown in Figure 4.2, includes four main components:
company, servers, SLA and tasks.
SLA: Data size and scope of company business.
Task1: similarity between businesses type.

56
Task 2: Size of company data.
Figure 4.2: The Proposed Model
4.5.2. THE PROCEDURE
The data come from the companies (X) through SLA to cloud service provider.
Then the proposed model determines which server will be selected through the
following algorithms to store the data into servers:
1-Select server from the data set randomly.
2-After choosing (0.4) a cutting point value, if the result of similarity between company
(X) and company (Y) more than (0.4), it means that company(X) and company (Y) are
too close of businesses type. Therefore, company (Y) can’t stay on the same server with
company (X) as security procedure. Thus, search to find optimal server, by using the
same previous algorithms, to store the (Y) company’s data where the result of formal is
less than 0.4.

57
3- This research take in consideration that the company data size is the other parameter
in our algorithm. So we have two parameters: the similarity of the company(X) and
company (Y) businesses and the available zone. This research suppose that the
maximum server size is (1000) GB, as mentioned in the dataset part. If the zone can not
accept the size of data company, there will be a message:” the remaining size in the
selected server is not enough for the new company”, but if the zone is available this
message appears: “the remaining size in the selected server is enough for the new
company”.
4.5.3. THE RESULTS
The result in table 4.5 shows that, there isn’t any business with same type in the
same server.
Table 4.5 The Result of Segregation Using Businesses Randomly Technique.
NO Company Name Size Server
ID NO Company Name Size Server
ID
1 High schools 500 50 25 Commercial Banks 100 48
2 Middle schools 600 45 26 Community bank 100 14
3 Religious Schools 150 29 27 Vehicle Insurance 150 2
4 Music schools 50 10 28 Life Insurance 200 10
5 Ice hockey schools 500 48 29 Mailbox Bank 350 7
6 Racing schools 400 12 30 Telephone Banking 600 14
7 Law schools 350 21 31 Internet Banking 100 4
8 Community colleges 850 32 32 SMS Bank 150 10
9 Counselling College 950 29 33 General Dentistry 50 18
10 Arts colleges 1000 18 34 Paediatric Dentists 100 42
11 Regular universities 100 28 35 Ultrasound 50 27
12 Culture universities 250 43 36 X-rays 50 47
13 Coastal engineering 650 1 37 CT scans 100 21
14 Construction engineering 750 5 38 Nuclear medicine scans 50 29
15 Mechanical Engineering 350 36 39 Laboratory Testing 150 6
16 Software Engineering 550 22 40 Pet Allergies 50 50
17 Convertible Bonds 1000 28 41 Eye Allergies 50 7

58
NO Company Name Size Server
ID NO Company Name Size Server
ID
18 Callable Bonds 150 45 42 Dust Allergy 150 30
19 Adjustment Bonds 700 12 43 Otoacoustic Emissions 100 15
20 Stocks 600 9 44 Auditory Brainstem 200 12
21 Mutual Funds 550 4 45 Middle Ear 50 3
22 Health Insurance 200 21 46 Pure-Tone 200 38
23 Offshore banks 850 15 47 Cosmetic Dentists 100 39
24 Postal savings banks 900 43 48 Cardiologists 50 47
4.6. SEGREGATION USING SEQUENTIAL SERVERS
In this experiment, the study designs an algorithm to determinate which server will
be selected sequentially. Then, This research use Microsoft Visual Studio VB.NET to apply
this technique. See this experiment in the appendix.
4.6.1. THE PROCEDURE
1-Select a server sequentially. Start with server (1) to insert the (X) company data.
2-Check the size of server
3-Check the selected server:
4-If the server is empty, inserts company (X)
5-If the server contains a company (Y1…Yn) check the similarity between the
company (X) and the other companies in the selected server: if the similarities between
these companies are less than (0.4) store the company (X) in this server. Otherwise, search
sequentially fro another server to find the similarity between companies less than (0.4).

59
4.6.2. THE RESULT
Table 4.6 shows the result of the segregation through sequential server technique.
The result shows that there aren’t any businesses with same type in the same server.
Table 4.6 Result of Segregation Technique Using Businesses Sequential Server.
No Company Name Size Server
ID No Company Name Size Server
ID
1 High schools 500 1 25 Commercial Banks 100 5
2 Middle schools 600 2 26 Community bank 100 7
3 Religious Schools 150 3 27 Vehicle Insurance 150 8
4 Music schools 50 4 28 Life Insurance 200 12
5 Ice hockey schools 500 5 29 Mailbox Bank 350 13
6 Racing schools 400 6 30 Telephone Banking 600 15
7 Law schools 350 7 31 Internet Banking 100 14
8 Community colleges 850 8 32 SMS Bank 150 16
9 Counselling College 950 9 33 General Dentistry 50 1
10 Arts colleges 1000 10 34 Paediatric Dentists 100 2
11 Regular universities 100 11 35 Ultrasound 50 3
12 Culture universities 250 12 36 X-rays 50 4
13 Coastal engineering 650 13 37 CT scans 100 5
14 Construction engineering 750 14 38 Nuclear medicine scans 50 7
15 Mechanical Engineering 350 15 39 Laboratory Testing 150 12
16 Software Engineering 550 16 40 Pet Allergies 50 11
17 Convertible Bonds 1000 17 41 Eye Allergies 50 14
18 Callable Bonds 150 1 42 Dust Allergy 150 16
19 Adjustment Bonds 700 3 43 Otoacoustic Emissions 100 18
20 Stocks 600 6 44 Auditory Brainstem 200 19
21 Mutual Funds 550 4 45 Middle Ear 50 15
22 Health Insurance 200 2 46 Pure-Tone 200 20
23 Offshore banks 850 11 47 Cosmetic Dentists 100 21
24 Postal savings banks 900 18 48 Cardiologists 50 22
4.7. NEIGHBOURHOOD’S SEGREGATION
As mentioned, the segregation must be in the database level and in the physical
level. And in the previous experiments, this research gets a succeeded in businesses
segregation at the database level.

60
Neighbourhood’s segregation technique is chosen in this study because it focuses on
the database level and on the physical level. All that happen to enhance the security of
cloud computing. This technique takes three factors:
1- Size of company data.
2- Similarity between businesses.
3- Location of selected server.
4.7.1. THE PROCEDURE
1-The thesis uses two experiments to work with. These experiments design the
algorithm to determinate which server will be selected depending on businesses type,
server location and company data size.
2-Apply size algorithm and similarity between businesses techniques.
3-Apply server location algorithm as the following:
� Select server ID randomly.
� Check the similarity of the new company with the other companies in the
selected server if there are.
� Check the similarity between the new and the other companies which are found
in the servers that occur alongside the selected server.
This research derived from this technique two approaches:
1- Segregation Neighbourhood Businesses with 3 Servers.
This approach designs technique to determine which server will be selected in order to
insert companies’ data. This is done by checking the similarity of new company with other

61
companies in a selected server. Then, the checking arrives to the servers which occur after
and before the selected server. Finally, choose the server which includes the least similarity
to store the new company’s data in, depending on (0.4) as a cutting point value. See Figure
4.3. And the results are shown in Table 4.7.
Figure 4.3 Segregation Using Neighbourhood Businesses with 3 servers.
4.7.2. THE RESULT
Table 4.7: The Results of Neighbourhood Segregation Technique With (3) Servers
No Company Name Size Server
ID
No Company Name Size Server
ID
1 High schools 500 42 25 Commercial Banks 100 18
2 Middle schools 600 10 26 Community bank 100 45
3 Religious Schools 150 17 27 Vehicle Insurance 150 50
4 Music schools 50 1 28 Life Insurance 200 37
5 Ice hockey schools 500 37 29 Mailbox Bank 350 24
6 Racing schools 400 12 30 Telephone Banking 600 7
7 Law schools 350 34 31 Internet Banking 100 5
8 Community colleges 850 23 32 SMS Bank 150 43
9 Counselling College 950 44 33 General Dentistry 50 12
10 Arts colleges 1000 14 34 Paediatric Dentists 100 2
11 Regular universities 100 27 35 Ultrasound 50 23
12 Culture universities 250 7 36 X-rays 50 9
13 Coastal engineering 650 29 37 CT scans 100 7
14 Construction engineering 750 47 38 Nuclear medicine scans 50 50
15 Mechanical Engineering 350 30 39 Laboratory Testing 150 5
16 Software Engineering 550 21 40 Pet Allergies 50 34
17 Convertible Bonds 1000 28 41 Eye Allergies 50 48
18 Callable Bonds 150 41 42 Dust Allergy 150 5
19 Adjustment Bonds 700 36 43 Otoacoustic Emissions 100 13
20 Stocks 600 31 44 Auditory Brainstem 200 25

62
21 Mutual Funds 550 6 45 Middle Ear 50 38
22 Health Insurance 200 10 46 Pure-Tone 200 36
23 Offshore banks 850 33 47 Cosmetic Dentists 100 45
24 Postal savings banks 900 16 48 Cardiologists 50 11
2- Segregation Neighbourhood Businesses with (5) Servers.
This approach designs algorithm to determine which server will be selected in order
to insert companies’ data. That will happen by checking the similarity of new company
with other companies in a selected server. Then, the checking arrives to four servers:
two servers in the lift side and two in the right. Finally, choose the server which
includes the least similarity to store the new company’s data in, depending on (0.4) as a
cutting point value. But if the value (0.4) of cutting point isn’t suitable, you can
increase the value up to (0.6). See figure 4.4. And the results are shown in Table 4.8.
Figure 4.4: Segregation Using Neighbourhood Businesses with 5 Servers.

63
4.7.3. THE RESULT
Table 4.8: The Results of Neighbourhood Segregation Technique With (5) Servers.
No Company Name Size Server
ID
No Company Name Size Server
ID
1 High schools 500 4 25 Commercial Banks 100 50
2 Middle schools 600 14 26 Community bank 100 4
3 Religious Schools 150 24 27 Vehicle Insurance 150 39
4 Music schools 50 34 28 Life Insurance 200 46
5 Ice hockey schools 500 44 29 Mailbox Bank 350 30
6 Racing schools 400 50 30 Telephone Banking 600 11
7 Law schools 350 10 31 Internet Banking 100 25
8 Community colleges 850 20 32 SMS Bank 150 33
9 Counseling College 950 29 33 General Dentistry 50 1
10 Arts colleges 1000 40 34 Pediatric Dentists 100 10
11 Regular universities 100 7 35 Ultrasound 50 5
12 Culture universities 250 17 36 X-rays 50 30
13 Coastal engineering 650 36 37 CT scans 100 39
14 Construction engineering 750 24 38 Nuclear medicine scans 50 50
15 Mechanical Engineering 350 34 39 Laboratory Testing 150 20
16 Software Engineering 550 10 40 Pet Allergies 50 35
17 Convertible Bonds 1000 8 41 Eye Allergies 50 25
18 Callable Bonds 150 19 42 Dust Allergy 150 30
19 Adjustment Bonds 700 12 43 Otoacoustic Emissions 100 15
20 Stocks 600 15 44 Auditory Brainstem 200 45
21 Mutual Funds 550 28 45 Middle Ear 50 1
22 Health Insurance 200 30 46 Pure-Tone 200 9
23 Offshore banks 850 43 47 Cosmetic Dentists 100 19
24 Postal savings banks 900 35 48 Cardiologists 50 30
4.8. SEGREGATION USING EXPERT HUMAN
In this stage, this research distributes the companies to the servers depending on Yellow
Pages Jordan Company for Advertising. Table 4.10 shows the results, and for more details
see the questionnaire Table 3.9.
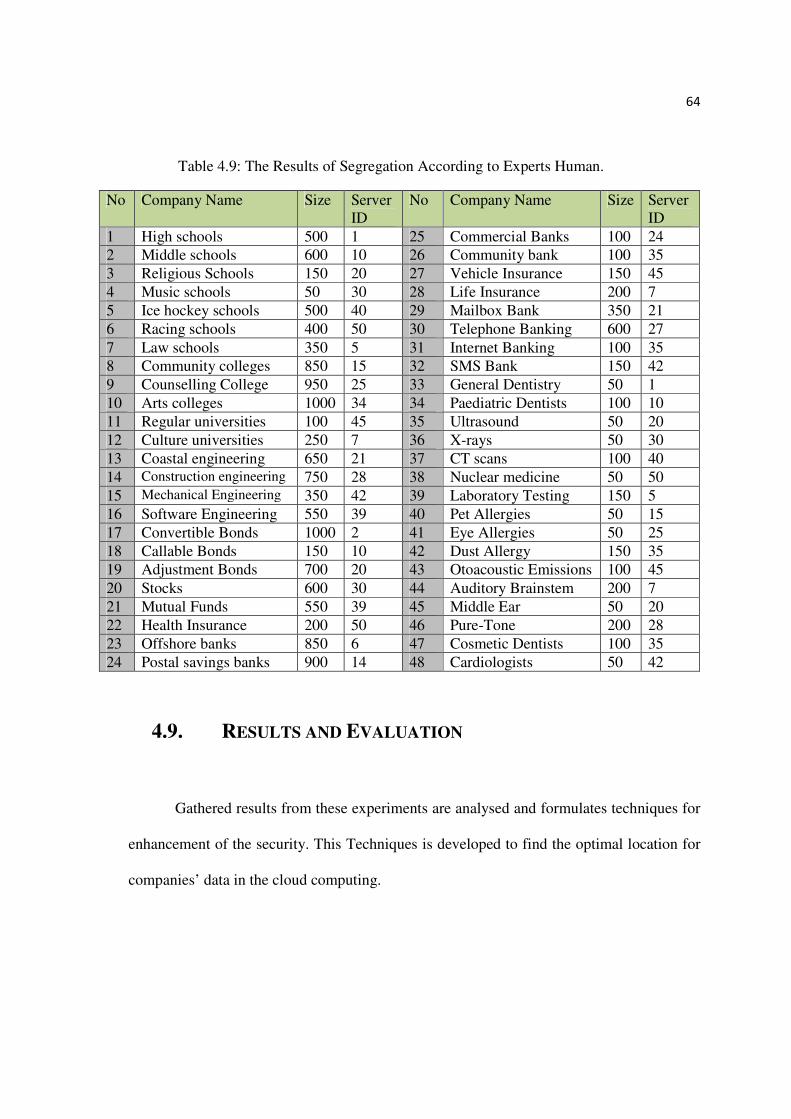
64
Table 4.9: The Results of Segregation According to Experts Human.
No Company Name Size Server ID
No Company Name Size Server ID
1 High schools 500 1 25 Commercial Banks 100 24
2 Middle schools 600 10 26 Community bank 100 35
3 Religious Schools 150 20 27 Vehicle Insurance 150 45
4 Music schools 50 30 28 Life Insurance 200 7
5 Ice hockey schools 500 40 29 Mailbox Bank 350 21
6 Racing schools 400 50 30 Telephone Banking 600 27
7 Law schools 350 5 31 Internet Banking 100 35
8 Community colleges 850 15 32 SMS Bank 150 42
9 Counselling College 950 25 33 General Dentistry 50 1
10 Arts colleges 1000 34 34 Paediatric Dentists 100 10
11 Regular universities 100 45 35 Ultrasound 50 20
12 Culture universities 250 7 36 X-rays 50 30
13 Coastal engineering 650 21 37 CT scans 100 40
14 Construction engineering 750 28 38 Nuclear medicine 50 50
15 Mechanical Engineering 350 42 39 Laboratory Testing 150 5
16 Software Engineering 550 39 40 Pet Allergies 50 15
17 Convertible Bonds 1000 2 41 Eye Allergies 50 25
18 Callable Bonds 150 10 42 Dust Allergy 150 35
19 Adjustment Bonds 700 20 43 Otoacoustic Emissions 100 45
20 Stocks 600 30 44 Auditory Brainstem 200 7
21 Mutual Funds 550 39 45 Middle Ear 50 20
22 Health Insurance 200 50 46 Pure-Tone 200 28
23 Offshore banks 850 6 47 Cosmetic Dentists 100 35
24 Postal savings banks 900 14 48 Cardiologists 50 42
4.9. RESULTS AND EVALUATION
Gathered results from these experiments are analysed and formulates techniques for
enhancement of the security. This Techniques is developed to find the optimal location for
companies’ data in the cloud computing.

65
As a result, this research succeeded to enhance the security in cloud computing
environment by using businesses segregation with (5) servers technique. The evaluation is
shown in Table 4.10 and the comparison of the results is in Table 4.11.
Table 4.10: Evaluate Proposed Model. Full Evaluation in Appendix Table (9,10,11,12,13,14)

66
4.1. SUMMARY
Table 4.11: The Comparison the Results
Techniques Error
Segregation Using Availability zones 20.8%
Segregation Using Businesses Randomly 19.7%
Segregation Using Businesses Sequential 17.8%
Segregation Using Neighbourhood Businesses
(3) Servers 16.8%
(5) Servers 12.6%
Our work is summarised by five steps: firstly, draw the taxonomy of businesses type
depending on yellow pages; then, applying the semantic similarity measurements to
calculate the similarity between businesses type. And choose the Wu-P measurement to
find the similarity between businesses. After that, design techniques to distribute businesses
data’s over servers. Finally, this research made evaluation to these techniques in order to
find the optimal technique. From that, we arrive to the optimal technique which is
segregation using Neighbourhood Businesses with 5 servers. However by applying this
technique and comparing it with the others, this research achieved enhancing for the
security.

67
5. CHAPTER FIVE
CONCLUSION
5.1. OVERVIEW
This chapter contains future works and summarizes the work which our thesis has done.
This research discussed the future work that will indicate how can exploit this thesis to
build new idea and resolve new problems. And the conclusion of the thesis is based on
practical results of experiments conducted in order to check and analyse the system
efficiency.
5.2. CONCLUSION
Cloud computing is on-demand access to the shared resources. It helps to reduce costs,
reduce management responsibilities and increase efficiency of organizations. And it is
found, there are many advantages but, also, we have challenges. These challenges are
related to the loss of sensitive information, price, reliability, outages, data mobility etc. This
thesis focuses on and discusses the security issues, data separation and the methods by
which we can separate the data for security purposes, availability and cost.
The general purpose of this research is to use certain techniques to decreasing the
risk. This project shows the greatest technique for enhancing the security through a number
of experiments. However, it has been recommended that further research is necessary to be
conducted to make the technique more suitable to cloud computing security.

68
This study builds techniques in order to achieve the main goal. The proposed techniques
were built to distribute the companies over the servers efficiently with minimum risk to
avoid the leakage. This study included a literature review, which indicated that there is still
a need to use different techniques.
In summary, the overall information was presented in this research work related to
the critical analysis and previous studies in cloud computing, in order to afford opportunity
for researchers to enhancing the security in the cloud computing as well as to help those
who have the potential to implement this work in the future. Furthermore, the findings of
our thesis can be beneficial for the other research works, as well as being a milestone on the
way to further progress.
5.4 FUTURE WORK
Further works need to be conducted. So, this research suggests few ideas to be studied in
the future:
1. Taking other factor to improve security in multi tenancy.
2. Enhancing the semantic similarity measurement.
3. Expand businesses taxonomy to include more businesses.
4. Use other way to evaluate our techniques.

69
REFERENCES
Armbrust, M.I, Fox, A.R, Griffith, R.E, Joseph, A.N D,Katz,R.A, Konwinski, Andy, L.E,
Gunho, P.A, David, R.A,Ariel, S.T, and Zaharia, M.A; (2009) Above the Clouds:
ABerkeley View of Cloud Computing. Technical Report. University of California
database. Technical Report No. UCB/EECS-2009-28Available at:
http://www.eecs.berkeley.edu/Pubs/TechRpts/2009/EECS-2009-28.html (Acc. 2011-9-
15).
Beik, R. (2012, May). Green Cloud Computing: An Energy-Aware Layer in Software
Architecture. In Engineering and Technology (S-CET), 2012 Spring Congress on (pp. 1-
4). IEEE.
Beloglazov, A., & Buyya, R. (2010, May). Energy efficient resource management in
virtualized cloud data centers. In Proceedings of the 2010 10th IEEE/ACM International
Conference on Cluster, Cloud and Grid Computing (pp. 826-831). IEEE Computer
Society.
Budanitsky, A., & Hirst, G. (2006). Evaluating wordnet-based measures of lexical
semantic relatedness. Computational Linguistics, 32(1), 13-47.
Buyya, R., Vecchiola, C., & Selvi, S. T. (2013). Mastering cloud computing. Tata
McGraw-Hill Education.

70
Chandran, S N & Angepat, M R. (2010). Cloud Computing: Analysing the risks involved
in cloudcomputing environments.School of Innovation, Design and Engineering,
Mälardalen University, Västerås, Sweden.
Chen, Z., & Yoon, J. (2010). It auditing to assure a secure cloud computing. In Services
(SERVICES-1), 2010 6th World Congress, 253-259, Doi: 10.1109/SERVICES.2010.118.
Curran, K. R (2011).Word similarity on the taxonomy of WordNet, Vol. 2, Issue X,
Nov.2011 ISSN 2320-6875.
Deng, F. E (2012). Web Service Matching based on Semantic Classification. (Published
doctoral dissertation). School of Health and Society Department of Computer Science
Ester, M., Kriegel, H. P., Sander, J., & Xu, X. (1996, August). A density-based algorithm
for discovering clusters in large spatial databases with noise. In Kdd (Vol. 96, pp. 226-
231).
Greenwell, R., Liu, X., & Chalmers, K. (2014). Benefits management of cloud
computing investments. International Journal of Advanced Computer Science and
Applications (IJACSA), 5(6).
Heng, L., Dan, Y., & Xiaohong, Z. (2012). Survey on Multi-Tenant Data Architecture
for SaaS. International Journal of Computer Science Issues(IJCSI), 9(6).þ
Huth, A., & Cebula, J. (2011). The Basics of Cloud Computing. United States
Computer.þ

71
Karaca H. A (2013). Migration of an On-Premise Single-Tenant Enterprise
Application to the Azure Cloud: The Multi-Tenancy Case Study. (Published doctoral
dissertation). UNIVERSITY OF TARTU. Malaysia.
Kaur, K., & Vashisht, S. (2013). Data Separation Issues in Cloud Computing.
International Journal for Advance Research in Engineering and technology, I (10), 26-29.
Kurmus, A., Gupta, M., Pletka, R., Cachin, C., & Haas, R. (2011, December). A
comparison of secure multi-tenancy architectures for filesystem storage clouds. In
Proceedings of the 12th International Middleware Conference (pp. 460-479).
International Federation for Information Processing.
Kyriazis, D.I (2013).Cloud Computing Service Level Agreements,EUROPEAN
COMMISSION DIRECTORATE GENERAL COMMUNICATIONS NETWORKS,
CONTENT AND TECHNOLOGY UNIT E2 - SOFTWARE AND SERVICES, CLOUD.
Li, Y., Bandar, Z. A., & McLean, D. (2003). An approach for measuring semantic
similarity between words using multiple information sources.Knowledge and Data
Engineering, IEEE Transactions on, 15(4), 871-882.
Lin, D. (1998, July). An information-theoretic definition of similarity. In ICML (Vol.
98, pp. 296-304).
Lodha, P. R., & Wadhe, M. A. P. An Introduction to Cloud Computing With
Reference To Service Provided By the Cloud, Cloud Performance and Benchmarks.
International Journal in Engineering Research and Development. (69-75).

72
Mahmood, Z. A(2010), Cloud Computing for Enterprise Architectures, ISSN 1617-
7975 ISBN 978-1-4471-2235-7 e-ISBN 978-1-4471-2236-4 DOI 10.1007/978-1-4471-
2236-4.
Martinez, C. G. (2012). Study of resource management for multitenant database
systems in cloud computing. UNIVERSITY OF COLORADO AT DENVER.
Meng, L., Huang, R., & Gu, J. (2014-A). Measuring Semantic Similarity of Word Pairs
Using Path and Information Content. International Journal of Future Generation
Communication & Networking, 7(3).
Meng, L., Huang, R., & Gu, J. (2014-B). Obtaining Information Content of Concepts:
An Overview. International Journal of Multimedia & Ubiquitous Engineering, 9(8).
Michelizzi, J. (2005) Semantic relatedness applied to all words sense disambiguation,
(Doctoral dissertation), University of Minnesota, Twin Cities, U.S., (On-Line).
Miller, G. A., & Hristea, F. (2006). WordNet nouns: Classes and instances.
Computational Linguistics, 32(1), 1-3.
Nagwani, N. K., & Verma, S. (2011). A frequent term and semantic similarity based
single document text summarization algorithm. International Journal of Computer
Applications, 17(2), 36-40.
Perrigne, I.S (2010). Competition and Nonlinear Pricing in Yellow Pages, Working
Paper, Pennsylvania State University.

73
Rai, P.K, Bunkar,R.K&Mishra,V.I(2014), Data Security and Privacy Protection Issues
in Cloud Computing, IOSR Journal of Computer Engineering (IOSR-JCE) e-ISSN:
2278-0661, p- ISSN: 2278-8727Volume 16, Issue 1, Ver. IX (Feb. 2014), PP 39-44.
San. J A (2013).Security and Security andPrivacy Privacy Privacy Issues in Cloud
Computing Computin.Innovation Labs, Tata Consultancy Services Ltd., Kolkata, INDIA.
Snasel, V., Moravec, P., & Pokorny, J. (2005, April). WordNet ontology based model for
web retrieval. In Web Information Retrieval and Integration, 2005. WIRI'05.
Proceedings. International Workshop on Challenges in (pp. 220-225). IEEE.
Spínola, M. (2009). An Essential Guide to Possibilities and Risks of Cloud Computing:
a Pragmatic Effective and Hype Free Approach for Strategic Enterprise Decision
Making. Computing. Available at: http://www. mariaspinola. com/CloudComputing.
php(Acc. 2011-9-15).
Srinivas C. C (2013),SECURITY TECHNIQUES FOR MULTI TENANCY
APPLICATIONS IN CLOUD,International Journal of Computer Science and Mobile
Computing Vol.2 Issue. 8, August- 2013, pg. 248-251.
Taleen J. K (2013). Resource Allocation Technique to Obtain Energy Efficient Cloud.
(Unpublished doctoral dissertation), Middle East University, Jordan, Amman.
Wu, Z., & Palmer, M. (1994, June). Verbs semantics and lexical selection. In
Proceedings of the 32nd annual meeting on Association for Computational Linguistics
(pp. 133-138). Association for Computational Linguistics.

74
Zhang, Z., & Fu, S. (2011, November). Characterizing power and energy usage in cloud
computing systems. In Cloud Computing Technology and Science (CloudCom), 2011
IEEE Third International Conference on (pp. 146-153). IEEE.

75
APPENDIX
1- Figure of Software

76
2-Evaluation of semantic similarity measurement
No. Path Error W & P Error L&Ch Error Resnik Error Lin Error Expert person
1 83% 0 80% 3 77% 6 77% 6 86% 3 83%
2 83% 3 83% 3 77% 9 89% 3 89% 3 86%
3 58% 4 54% 8 38% 24 61% 1 64% 2 62%
4 50% 4 40% 6 30% 16 38% 8 42% 4 46%
5 83% 24 60% 1 77% 18 61% 2 79% 20 59%
6 50% 6 40% 4 30% 14 38% 6 42% 2 44%
7 83% 1 83% 1 77% 7 88% 4 88% 4 84%
8 75% 5 72% 8 60% 20 77% 3 81% 1 80%
9 33% 15 20% 2 17% 1 0% 18 0% 18 18%
10 25% 7 18% 0 12% 6 0% 18 0% 18 18%
11 33% 15 20% 2 17% 1 0% 18 0% 18 18%
12 50% 5 40% 5 30% 15 38% 7 42% 3 45%
13 25% 6 18% 1 12% 7 0% 19 0% 19 19%
14 33% 15 20% 2 17% 1 0% 18 0% 18 18%
15 83% 0 80% 3 77% 6 77% 6 86% 3 83%
16 67% 3 60% 4 47% 17 61% 3 68% 4 64%
17 33% 16 20% 3 17% 0 0% 17 0% 17 17%
18 41% 23 22% 4 23% 5 0% 18 0% 18 18%
19 100% 0 100% 0 100% 0 89% 11 100% 0 100%
Error 8% 3.1% 9.1% 9.7% 9.2%

77
3. Available Zone
Company –ID Company Name Company Data
Size
Server – ID
1 High schools 500 32
2 Middle schools 600 2
3 Religious Schools 150 4
4 Music schools 50 3
5 Ice hockey schools 500 5
6 Racing schools 400 6
7 Law schools 350 7
8 Community colleges 850 8
9 Counseling College 950 9
10 Arts colleges 1000 10
11 Regular universities 100 11
12 Culture universities 250 12
13 Coastal engineering 650 13
14 Construction engineering 750 1
15 Mechanical Engineering 350 15
16 Software Engineering 550 16
17 Convertible Bonds 1000 17
18 Callable Bonds 150 18
19 Adjustment Bonds 700 19
20 Stocks 600 20
21 Mutual Funds 550 21
22 Health Insurance 200 22
23 Offshore banks 850 23
24 Postal savings banks 900 24
25 Commercial Banks 100 25
26 Community development bank 100 26
27 Vehicle Insurance 150 27
28 Life Insurance 200 28
29 Mailbox Bank (Online Bank) 350 29
30 Telephone Banking 600 30
31 Internet Banking (Online Bank) 650 31
32 SMS Bank (Online Bank) 300 32
33 General Dentistry 750 33
34 Pediatric Dentists 1000 34
35 Ultrasound 100 35
36 X-rays 250 36
37 CT scans 850 37
38 Nuclear medicine scans 800 38
39 Laboratory Testing 400 39
40 Pet Allergies 700 40

78
Company –ID Company Name Company Data
Size Server – ID
41 Eye Allergies 450 41
42 Dust Allergy 300 42
43 Otoacoustic Emissions 100 43
44 Auditory Brainstem Response 200 44
45 Middle Ear 750 45
46 Pure-Tone 600 46
47 Cosmetic Dentists 100 47
48 Cardiologists 500 48
4. Business segregation
First
Company
Scorned
Company
Server
- ID
Depth
LCS
LEN Result Decision
High schools ****** 32 0 0 0 Company Find Available Server, and Moved to it.
Middle schools
****** 17 0 0 0 Company Find Available Server, and Moved to it.
Religious Schools
****** 14 0 0 0 Company Find Available Server, and Moved to it.
Music schools
****** 22 0 0 0 Company Find Available Server, and Moved to it.
Ice hockey schools
****** 30 0 0 0 Company Find Available Server, and Moved to it.
Racing schools
****** 34 0 0 0 Company Find Available Server, and Moved to it.
Law schools ****** 9 0 0 0 Company Find Available Server, and Moved to it.
Community colleges
****** 48 0 0 0 Company Find Available Server, and Moved to it.
Counselling College
****** 4 0 0 0 Company Find Available Server, and Moved to it.
Arts colleges Community colleges
48 3 2 0.75 Companies Can NOT Stay on This.

79
First
Company
Scorned
Company
Server
- ID
Depth
LCS
LEN Result Decision
Regular universities
****** 33 0 0 0 Company Find Available Server, and Moved to it.
Culture universities
****** 12 0 0 0 Company Find Available Server, and Moved to it.
Coastal engineering
****** 28 0 0 0 Company Find Available Server, and Moved to it.
Mechanical Engineering
****** 31 0 0 0 Company Find Available Server, and Moved to it.
Software Engineering
****** 27 0 0 0 Company Find Available Server, and Moved to it.
Convertible Bonds
****** 2 0 0 0 Company Find Available Server, and Moved to it.
Callable Bonds
High schools 32 1 8 0.2 Companies Can Stay on This server.
Adjustment Bonds
****** 41 0 0 0 Company Find Available Server, and Moved to it.
Stocks ****** 44 0 0 0 Company Find Available Server, and Moved to it.
Mutual Funds
****** 13 0 0 0 Company Find Available Server, and Moved to it.
Health Insurance
****** 36 0 0 0 Company Find Available Server, and Moved to it.
Offshore banks
****** 19 0 0 0 Company Find Available Server, and Moved to it.
Postal savings banks
****** 5 0 0 0 Company Find Available Server, and Moved to it.
Commercial Banks
****** 37 0 0 0 Company Find Available Server, and Moved to it.

80
First
Company
Scorned
Company
Server
- ID
Depth
LCS
LEN Result Decision
Vehicle Insurance
Stocks 44 2 4 0.5 Companies Can NOT Stay on This server.
Vehicle Insurance
Ice hockey schools
30 1 8 0.2 Companies Can Stay on This server.
Life Insurance
****** 6 0 0 0 Company Find Available Server, and Moved to it.
Mailbox Bank (Online Bank)
****** 1 0 0 0 Company Find Available Server, and Moved to it.
Telephone Banking (Online Bank)
Community colleges
48 1 7 0.222 Companies Can Stay on This server.
Internet Banking (Online Bank)
****** 10 0 0 0 Company Find Available Server, and Moved to it.
SMS Bank (Online Bank)
Community development bank
20 3 3 0.667 Companies Can NOT Stay on This server.
SMS Bank (Online Bank)
****** 40 0 0 0 Company Find Available Server, and Moved to it.
General Dentistry
****** 42 0 0 0 Company Find Available Server, and Moved to it.
Paediatric Dentists
Software Engineering
27 1 7 0.222 Companies Can Stay on This server.
Ultrasound ****** 24 0 0 0 Company Find Available Server, and Moved to it.
X-rays Health Insurance
36 1 7 0.222 Companies Can Stay on This server.
CT scans ****** 25 0 0 0 Company Find Available Server, and Moved to it.
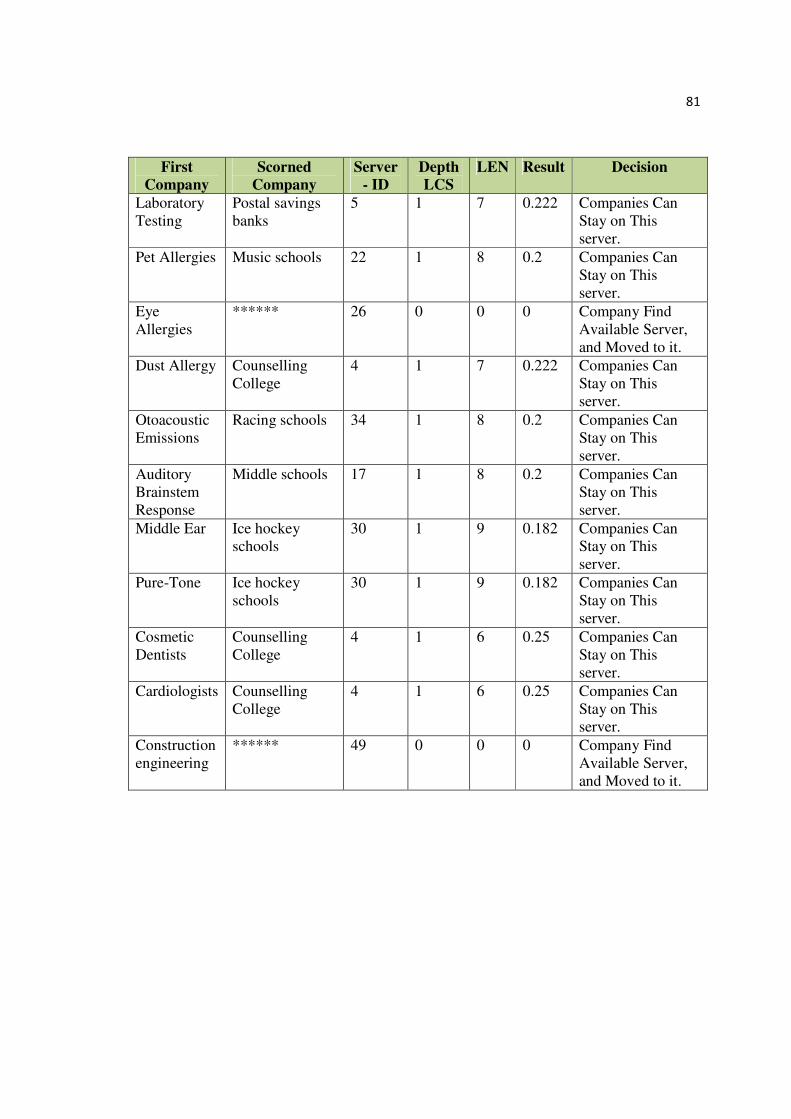
81
First
Company
Scorned
Company
Server
- ID
Depth
LCS
LEN Result Decision
Laboratory Testing
Postal savings banks
5 1 7 0.222 Companies Can Stay on This server.
Pet Allergies Music schools 22 1 8 0.2 Companies Can Stay on This server.
Eye Allergies
****** 26 0 0 0 Company Find Available Server, and Moved to it.
Dust Allergy Counselling College
4 1 7 0.222 Companies Can Stay on This server.
Otoacoustic Emissions
Racing schools 34 1 8 0.2 Companies Can Stay on This server.
Auditory Brainstem Response
Middle schools 17 1 8 0.2 Companies Can Stay on This server.
Middle Ear Ice hockey schools
30 1 9 0.182 Companies Can Stay on This server.
Pure-Tone Ice hockey schools
30 1 9 0.182 Companies Can Stay on This server.
Cosmetic Dentists
Counselling College
4 1 6 0.25 Companies Can Stay on This server.
Cardiologists Counselling College
4 1 6 0.25 Companies Can Stay on This server.
Construction engineering
****** 49 0 0 0 Company Find Available Server, and Moved to it.

82
5. Sequential Segregation
First
Company
Second
Company
Server
ID
Depth
LCS
LEN Result Decision
****** High schools 1 0 0 0 Direct Inserted to the Server because it does not have any company to compare with
High schools
Middle schools
1 4 2 0.8 The distance is greater than the test value ( 40 ) >>> the remaining size in the Selected Server is NOT enough for the New company
****** Middle schools
2 0 0 0 Direct Inserted to the Server because it does not have any company to compare with
High schools
Religious Schools
1 3 4 0.6 The distance is greater than the test value ( 40 ) >>> the remaining size in the Selected Server is enough for the New company
Middle schools
Religious Schools
2 3 4 0.6 The distance is greater than the test value ( 40 ) >>> the remaining size in the Selected Server is enough for the New company
****** Religious Schools
3 0 0 0 Direct Inserted to the Server because it does not have any company to compare with

83
First
Company
Second
Company
Server
ID
Depth
LCS
LEN Result Decision
Middle schools
Music schools
2 3 4 0.6 The distance is greater than the test value ( 40 ) >>> the remaining size in the Selected Server is NOT enough for the New company
Religious Schools
Music schools
3 4 2 0.8 The distance is greater than the test value ( 40 ) >>> the remaining size in the Selected Server is enough for the New company
****** Music schools
4 0 0 0 Direct Inserted to the Server because it does not have any company to compare with
High schools
Ice hockey schools
1 3 5 0.545 The distance is greater than the test value ( 40 ) >>> the remaining size in the Selected Server is NOT enough for the New company
Middle schools
Ice hockey schools
2 3 5 0.545 The distance is greater than the test value ( 40 ) >>> the remaining size in the Selected Server is NOT enough for the New company
Religious Schools
Ice hockey schools
3 4 3 0.727 The distance is greater than the test value ( 40 ) >>> the remaining size in the Selected Server is enough for the New company

84
First
Company
Second
Company
Server
ID
Depth
LCS
LEN Result Decision
****** Ice hockey schools
5 0 0 0 Direct Inserted to the Server because it does not have any company to compare with
High schools
Racing schools
1 3 5 0.545 The distance is greater than the test value ( 40 ) >>> the remaining size in the Selected Server is enough for the New company
Middle schools
Racing schools
2 3 5 0.545 The distance is greater than the test value ( 40 ) >>> the remaining size in the Selected Server is NOT enough for the New company
Religious Schools
Racing schools
3 4 3 0.727 The distance is greater than the test value ( 40 ) >>> the remaining size in the Selected Server is enough for the New company
Music schools
Racing schools
4 4 3 0.727 The distance is greater than the test value ( 40 ) >>> the remaining size in the Selected Server is enough for the New company
Ice hockey schools
Racing schools
5 5 2 0.833 The distance is greater than the test value ( 40 ) >>> the remaining size in the Selected Server is enough for the New company

85
First
Company
Second
Company
Server
ID
Depth
LCS
LEN Result Decision
High schools
Law schools 1 3 4 0.6 The distance is greater than the test value ( 40 ) >>> the remaining size in the Selected Server is enough for the New company
Middle schools
Law schools 2 3 4 0.6 The distance is greater than the test value ( 40 ) >>> the remaining size in the Selected Server is enough for the New company
Religious Schools
Law schools 3 4 2 0.8 The distance is greater than the test value ( 40 ) >>> the remaining size in the Selected Server is enough for the New company
Music schools
Law schools 4 4 2 0.8 The distance is greater than the test value ( 40 ) >>> the remaining size in the Selected Server is enough for the New company
Ice hockey schools
Law schools 5 4 3 0.727 The distance is greater than the test value ( 40 ) >>> the remaining size in the Selected Server is enough for the New company
Racing schools
Law schools 6 4 3 0.727 The distance is greater than the test value ( 40 ) >>> the remaining size in the Selected Server is enough for the New company

86
First
Company
Second
Company
Server
ID
Depth
LCS
LEN Result Decision
High schools
Community colleges
1 2 5 0.444 The distance is greater than the test value ( 40 ) >>> the remaining size in the Selected Server is NOT enough for the New company
Middle schools
Community colleges
2 2 5 0.444 The distance is greater than the test value ( 40 ) >>> the remaining size in the Selected Server is NOT enough for the New company
Religious Schools
Community colleges
3 2 5 0.444 The distance is greater than the test value ( 40 ) >>> the remaining size in the Selected Server is NOT enough for the New company
Music schools
Community colleges
4 2 5 0.444 The distance is greater than the test value ( 40 ) >>> the remaining size in the Selected Server is NOT enough for the New company
Ice hockey schools
Community colleges
5 2 6 0.4 The distance is Lower or Equal than the test value ( 40 ) >>> the remaining size in the Selected Server is NOT enough for the New company

87
First
Company
Second
Company
Server
ID
Depth
LCS
LEN Result Decision
Law schools Community colleges
7 2 5 0.444 The distance is greater than the test value ( 40 ) >>> the remaining size in the Selected Server is NOT enough for the New company
****** Community colleges
8 0 0 0 Direct Inserted to the Server because it does not have any company to compare with
High schools
Counselling College
1 2 5 0.444 The distance is greater than the test value ( 40 ) >>> the remaining size in the Selected Server is NOT enough for the New company
Middle schools
Counselling College
2 2 5 0.444 The distance is greater than the test value ( 40 ) >>> the remaining size in the Selected Server is NOT enough for the New company
Religious Schools
Counselling College
3 2 5 0.444 The distance is greater than the test value ( 40 ) >>> the remaining size in the Selected Server is NOT enough for the New company
Music schools
Counselling College
4 2 5 0.444 The distance is greater than the test value ( 40 ) >>> the remaining size in the Selected Server is NOT enough for the New company

88
First
Company
Second
Company
Server
ID
Depth
LCS
LEN Result Decision
Racing schools
Counselling College
6 2 6 0.4 The distance is Lower or Equal than the test value ( 40 ) >>> the remaining size in the Selected Server is NOT enough for the New company
Law schools Counselling College
7 2 5 0.444 The distance is greater than the test value ( 40 ) >>> the remaining size in the Selected Server is NOT enough for the New company
Community colleges
Counselling College
8 3 2 0.75 The distance is greater than the test value ( 40 ) >>> the remaining size in the Selected Server is NOT enough for the New company
****** Counselling College
9 0 0 0 Direct Inserted to the Server because it does not have any company to compare with
High schools
Arts colleges 1 2 5 0.444 The distance is greater than the test value ( 40 ) >>> the remaining size in the Selected Server is NOT enough for the New company
Middle schools
Arts colleges 2 2 5 0.444 The distance is greater than the test value ( 40 ) >>> the remaining size in the Selected Server is NOT enough for the New company

89
First
Company
Second
Company
Server
ID
Depth
LCS
LEN Result Decision
Music schools
Arts colleges 4 2 5 0.444 The distance is greater than the test value ( 40 ) >>> the remaining size in the Selected Server is NOT enough for the New company
Ice hockey schools
Arts colleges 5 2 6 0.4 The distance is Lower or Equal than the test value ( 40 ) >>> the remaining size in the Selected Server is NOT enough for the New company
Racing schools
Arts colleges 6 2 6 0.4 The distance is Lower or Equal than the test value ( 40 ) >>> the remaining size in the Selected Server is NOT enough for the New company
Law schools Arts colleges 7 2 5 0.444 The distance is greater than the test value ( 40 ) >>> the remaining size in the Selected Server is NOT enough for the New company
Community colleges
Arts colleges 8 3 2 0.75 The distance is greater than the test value ( 40 ) >>> the remaining size in the Selected Server is NOT enough for the New company

90
First
Company
Second
Company
Server
ID
Depth
LCS
LEN Result Decision
****** Arts colleges 10 0 0 0 Direct Inserted to the Server because it does not have any company to compare with
High schools
Regular universities
1 2 5 0.444 The distance is greater than the test value ( 40 ) >>> the remaining size in the Selected Server is enough for the New company
Middle schools
Regular universities
2 2 5 0.444 The distance is greater than the test value ( 40 ) >>> the remaining size in the Selected Server is enough for the New company
Religious Schools
Regular universities
3 2 5 0.444 The distance is greater than the test value ( 40 ) >>> the remaining size in the Selected Server is enough for the New company
Music schools
Regular universities
4 2 5 0.444 The distance is greater than the test value ( 40 ) >>> the remaining size in the Selected Server is enough for the New company
Ice hockey schools
Regular universities
5 2 6 0.4 This server is Perfect for this Company because it have a free size and the WU & P is Lower than Tested Value ( 50 )

91
First
Company
Second
Company
Server
ID
Depth
LCS
LEN Result Decision
Middle schools
Culture universities
2 2 5 0.444 The distance is greater than the test value ( 40 ) >>> the remaining size in the Selected Server is enough for the New company
Religious Schools
Culture universities
3 2 5 0.444 The distance is greater than the test value ( 40 ) >>> the remaining size in the Selected Server is enough for the New company
Music schools
Culture universities
4 2 5 0.444 The distance is greater than the test value ( 40 ) >>> the remaining size in the Selected Server is enough for the New company
High schools
Culture universities
1 2 5 0.444 The distance is greater than the test value ( 40 ) >>> the remaining size in the Selected Server is enough for the New company
Middle schools
Culture universities
2 2 5 0.444 The distance is greater than the test value ( 40 ) >>> the remaining size in the Selected Server is enough for the New company
Religious Schools
Culture universities
3 2 5 0.444 The distance is greater than the test value ( 40 ) >>> the remaining size in the Selected Server is enough for the New company

92
First
Company
Second
Company
Server
ID
Depth
LCS
LEN Result Decision
High schools
Coastal engineering
1 2 7 0.364 The distance is Lower or Equal than the test value ( 40 ) >>> the remaining size in the Selected Server is NOT enough for the New company
Middle schools
Coastal engineering
2 2 7 0.364 The distance is Lower or Equal than the test value ( 40 ) >>> the remaining size in the Selected Server is NOT enough for the New company
Religious Schools
Coastal engineering
3 2 7 0.364 This server is Perfect for this Company because it have a free size and the WU & P is Lower than Tested Value ( 50 )
High schools
Construction engineering
1 2 7 0.364 The distance is Lower or Equal than the test value ( 40 ) >>> the remaining size in the Selected Server is NOT enough for the New company
Middle schools
Construction engineering
2 2 7 0.364 The distance is Lower or Equal than the test value ( 40 ) >>> the remaining size in the Selected Server is NOT enough for the New company

93
6-cutting point 60
Company 1 Company 2 Wu-P Wu-P>60 Error E.P
High schools Middle schools 0.8 1 0 1
Ice hockey schools Racing schools 0.83 1 0 1
Middle schools Racing schools 0.54 0 1 1
Racing schools Arts colleges 0.4 0 1 1
Community colleges Counselling College 0.6 1 0 1
Arts colleges Coastal engineering 0.4 0 1 1
Coastal engineering Construction engineering 0.83 1 0 1
Construction engineering Software Engineering 0.72 1 0 1
Software Engineering Postal savings banks 0.2 0 0 0
development bank Coastal engineering 0.18 0 0 0
Offshore banks Law schools 0.2 0 0 0
Callable Bonds Offshore banks 0.4 0 1 1
Callable Bonds Racing schools 0.18 0 0 0
Convertible Bonds X-rays 0.2 0 0 0
Ultrasound Nuclear medicine 0.8 1 0 1
Eye Allergies Middle Ear 0.6 1 0 1
Middle Ear Middle schools 0.2 0 0 0
Cardiologists Software Engineering 0.22 0 0 0
Adjustment Bonds Adjustment Bonds 1 1 0 1
Error 21%

94
7-cutting point 0.5
Company 1 Company 2 Wu-P Wu-P>50 Error E.P High schools Middle schools 0.8 1 0 1
Ice hockey schools Racing schools 0.83 1 0 1
Middle schools Racing schools 0.54 1 0 1
Racing schools Arts colleges 0.4 0 1 1
Community colleges Counselling College 0.6 1 0 1
Arts colleges Coastal engineering 0.4 0 1 1
Coastal engineering Construction engineering 0.83 1 0 1
Construction engineering Software Engineering 0.72 1 0 1
Software Engineering Postal savings banks 0.2 0 0 0
development bank Coastal engineering 0.18 0 0 0
Offshore banks Law schools 0.2 0 0 0
Callable Bonds Offshore banks 0.4 0 1 1
Callable Bonds Racing schools 0.18 0 0 0
Convertible Bonds X-rays 0.2 0 0 0
Ultrasound Nuclear medicine 0.8 1 0 1
Eye Allergies Middle Ear 0.6 1 0 1
Middle Ear Middle schools 0.2 0 0 0
Cardiologists Software Engineering 0.22 0 0 0
Adjustment Bonds Adjustment Bonds 1 1 0 1
Error 15%
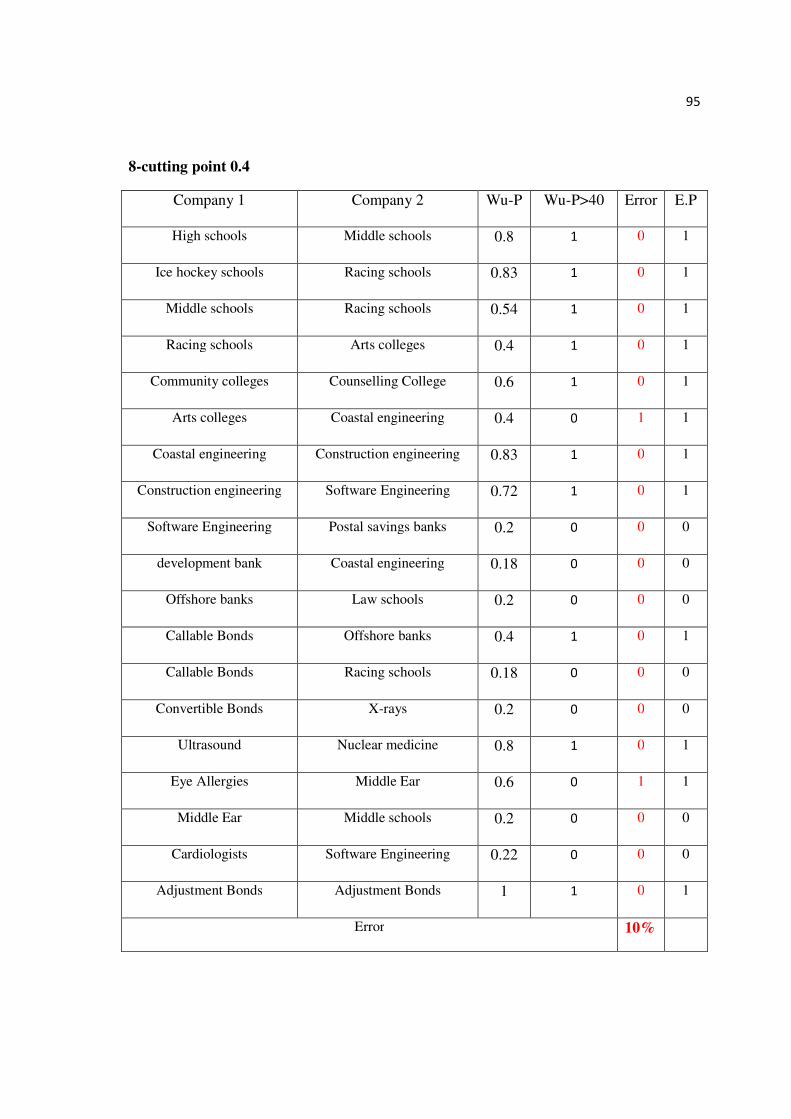
95
8-cutting point 0.4
Company 1 Company 2 Wu-P Wu-P>40 Error E.P
High schools Middle schools 0.8 1 0 1
Ice hockey schools Racing schools 0.83 1 0 1
Middle schools Racing schools 0.54 1 0 1
Racing schools Arts colleges 0.4 1 0 1
Community colleges Counselling College 0.6 1 0 1
Arts colleges Coastal engineering 0.4 0 1 1
Coastal engineering Construction engineering 0.83 1 0 1
Construction engineering Software Engineering 0.72 1 0 1
Software Engineering Postal savings banks 0.2 0 0 0
development bank Coastal engineering 0.18 0 0 0
Offshore banks Law schools 0.2 0 0 0
Callable Bonds Offshore banks 0.4 1 0 1
Callable Bonds Racing schools 0.18 0 0 0
Convertible Bonds X-rays 0.2 0 0 0
Ultrasound Nuclear medicine 0.8 1 0 1
Eye Allergies Middle Ear 0.6 0 1 1
Middle Ear Middle schools 0.2 0 0 0
Cardiologists Software Engineering 0.22 0 0 0
Adjustment Bonds Adjustment Bonds 1 1 0 1
Error 10%

96
9-Evaluation available zone
Company Name Server ID By
human
Server ID By
Available zone
Error
High schools 1 32 31
Middle schools 10 35 25
Religious Schools 20 1 19
Music schools 30 3 27
Ice hockey schools 40 3 37
Racing schools 50 6 44
Law schools 5 40 35
Community colleges 15 8 7
Counselling College 25 9 16
Arts colleges 34 10 24
Regular universities 45 32 13
Culture universities 7 45 38
Coastal engineering 21 16 5
Construction engineering 28 1 27
Mechanical Engineering 42 15 27
Software Engineering 39 16 23
Convertible Bonds 2 17 15
Callable Bonds 10 23 13
Adjustment Bonds 20 48 28
Stocks 30 20 10
Mutual Funds 39 21 18
Health Insurance 50 20 30
Offshore banks 6 23 17
Postal savings banks 14 24 10
Commercial Banks 24 20 4
development bank 35 23 12
Vehicle Insurance 45 27 18
Life Insurance 7 28 21
Mailbox Bank 21 4 17
Telephone Banking 27 2 25
Internet Banking 35 27 8
SMS Bank 42 32 10
General Dentistry 1 33 32
Paediatric Dentists 10 34 24
Ultrasound 20 36 16
X-rays 30 36 6
CT scans 40 10 30
Nuclear medicine scans 50 38 12
Laboratory Testing 5 50 45

97
10 –Evaluation businesses randomly
Company Name Server ID By
human
Server ID By
Available zone
Error
Pet Allergies 15 40 25
Eye Allergies 25 2 23
Dust Allergy 35 11 24
Otoacoustic Emissions 45 22 23
Auditory Response 7 37 30
Middle Ear 20 5 15
Pure-Tone 28 16 12
Cosmetic Dentists 35 12 23
Cardiologists 42 48 6
Average Error :20.8%
Company Name Server ID By
Human
Server ID By
businesses Randomly
Error
High schools 1 50 49
Middle schools 10 45 35
Religious Schools 20 29 9
Music schools 30 10 20
Ice hockey schools 40 48 8
Racing schools 50 12 38
Law schools 5 21 16
Community colleges 15 32 17
Counselling College 25 29 4
Arts colleges 34 18 16
Regular universities 45 28 17
Culture universities 7 43 36
Coastal engineering 21 1 20
Construction engineering 28 5 23
Mechanical Engineering 42 36 6
Software Engineering 39 22 17
Convertible Bonds 2 28 26
Callable Bonds 10 45 35
Adjustment Bonds 20 12 8
Stocks 30 9 21
Mutual Funds 39 4 35
Health Insurance 50 21 29
Offshore banks 6 15 9
Postal savings banks 14 43 29
Commercial Banks 24 48 24

98
11 –Evaluation businesses Sequential
Company Name Server ID By
Human
Server ID By
businesses Randomly
Error
development bank 35 14 21
Vehicle Insurance 45 2 43
Life Insurance 7 10 3
Mailbox Bank 21 7 14
Telephone Banking 27 14 13
Internet Banking 35 4 31
SMS Bank 42 10 32
General Dentistry 1 18 17
Paediatric Dentists 10 42 32
Ultrasound 20 27 7
X-rays 30 47 17
CT scans 40 21 19
Nuclear medicine scans 50 29 21
Laboratory Testing 5 6 1
Pet Allergies 15 50 35
Eye Allergies 25 7 18
Dust Allergy 35 30 5
Otoacoustic Emissions 45 15 30
Auditory Response 7 12 5
Middle Ear 20 3 17
Pure-Tone 28 38 10
Cosmetic Dentists 35 39 4
Cardiologists 42 47 5
Average Error :19.7%
Company Name Server ID By
Human
Server ID By
businesses Sequential
Error
High schools 1 1 0
Middle schools 10 2 8
Religious Schools 20 3 17
Music schools 30 4 26
Ice hockey schools 40 5 35
Racing schools 50 6 44
Law schools 5 7 2
Community colleges 15 8 7
Counselling College 25 9 16
Arts colleges 34 10 24
Regular universities 45 11 34
Culture universities 7 12 5
Coastal engineering 21 13 8

99
Company Name Server ID By
Human
Server ID By
businesses Sequential
Error
Construction engineering 28 14 14
Mechanical Engineering 42 15 27
Software Engineering 39 16 23
Convertible Bonds 2 17 15
Callable Bonds 10 1 9
Adjustment Bonds 20 3 17
Stocks 30 6 24
Mutual Funds 39 4 35
Health Insurance 50 2 48
Offshore banks 6 11 5
Postal savings banks 14 18 4
Commercial Banks 24 5 19
development bank 35 7 28
Vehicle Insurance 45 8 37
Life Insurance 7 12 5
Mailbox Bank 21 13 8
Telephone Banking 27 15 12
Internet Banking 35 14 21
SMS Bank 42 16 26
General Dentistry 1 1 0
Paediatric Dentists 10 2 8
Ultrasound 20 3 17
X-rays 30 4 26
CT scans 40 5 35
Nuclear medicine scans 50 7 43
Laboratory Testing 5 12 7
Pet Allergies 15 11 4
Eye Allergies 25 14 11
Dust Allergy 35 16 19
Otoacoustic Emissions 45 18 27
Auditory Response 7 19 12
Middle Ear 20 15 5
Pure-Tone 28 20 8
Cosmetic Dentists 35 21 14
Cardiologists 42 22 20
Average Error :17.8%

100
12 –Evaluation Businesses Segregation with 3 Servers
Company Name Server ID By
Human
Server ID By
businesses segregation with
3 servers
Error
High schools 1 42 41
Middle schools 10 10 0
Religious Schools 20 17 3
Music schools 30 1 29
Ice hockey schools 40 37 3
Racing schools 50 12 38
Law schools 5 34 29
Community colleges 15 23 8
Counselling College 25 44 19
Arts colleges 34 14 20
Regular universities 45 27 18
Culture universities 7 7 0
Coastal engineering 21 29 8
Construction engineering 28 47 19
Mechanical Engineering 42 30 12
Software Engineering 39 21 18
Convertible Bonds 2 28 26
Callable Bonds 10 41 31
Adjustment Bonds 20 36 16
Stocks 30 31 1
Mutual Funds 39 6 33
Health Insurance 50 10 40
Offshore banks 6 33 27
Postal savings banks 14 16 2
Commercial Banks 24 18 6
development bank 35 45 10
Vehicle Insurance 45 50 5
Life Insurance 7 37 30
Mailbox Bank 21 24 3
Telephone Banking 27 7 20
Internet Banking 35 5 30
SMS Bank 42 43 1
General Dentistry 1 12 11

101
14 –Evaluation businesses segregation with 5 servers
Company Name Server ID By
Human
Server ID By
businesses segregation with
3 servers
Error
Paediatric Dentists 10 2 8
Ultrasound 20 23 3
X-rays 30 9 21
CT scans 40 7 33
Nuclear medicine scans 50 50 0
Laboratory Testing 5 5 0
Pet Allergies 15 34 19
Eye Allergies 25 48 23
Dust Allergy 35 5 30
Otoacoustic Emissions 45 13 32
Auditory Response 7 25 18
Middle Ear 20 38 18
Pure-Tone 28 36 8
Cosmetic Dentists 35 45 10
Cardiologists 42 11 31
Average Error :16.8%
Company Name Server ID By
Human
Server ID By
businesses segregation
with5 servers
Error
High schools 1 4 3
Middle schools 10 14 4
Religious Schools 20 24 4
Music schools 30 34 4
Ice hockey schools 40 44 4
Racing schools 50 50 0
Law schools 5 10 5
Community colleges 15 20 5
Counselling College 25 29 4
Arts colleges 34 40 6
Regular universities 45 7 38
Culture universities 7 17 10
Coastal engineering 21 36 15
Construction engineering 28 24 4
Mechanical Engineering 42 34 8
Software Engineering 39 10 29
Convertible Bonds 2 8 6

102
15. Questionnaire
Question One
A) How much the similarity between High schools& Middle schools:
1)80 2)85 3)90
Company Name Server ID By
Human
Server ID By
businesses segregation
with5 servers
Error
Callable Bonds 10 19 9
Adjustment Bonds 20 12 8
Stocks 30 15 15
Mutual Funds 39 28 11
Health Insurance 50 30 20
Offshore banks 6 43 37
Postal savings banks 14 35 21
Commercial Banks 24 50 26
development bank 35 4 31
Vehicle Insurance 45 39 6
Life Insurance 7 46 39
Mailbox Bank 21 30 9
Telephone Banking 27 11 16
Internet Banking 35 25 10
SMS Bank 42 33 9
General Dentistry 1 1 0
Paediatric Dentists 10 10 0
Ultrasound 20 5 15
X-rays 30 30 0
CT scans 40 39 1
Nuclear medicine scans 50 50 0
Laboratory Testing 5 20 15
Pet Allergies 15 35 20
Eye Allergies 25 25 0
Dust Allergy 35 30 5
Otoacoustic Emissions 45 15 30
Auditory Response 7 45 38
Middle Ear 20 1 19
Pure-Tone 28 9 19
Cosmetic Dentists 35 19 16
Cardiologists 42 30 12
Average Error :12.6%
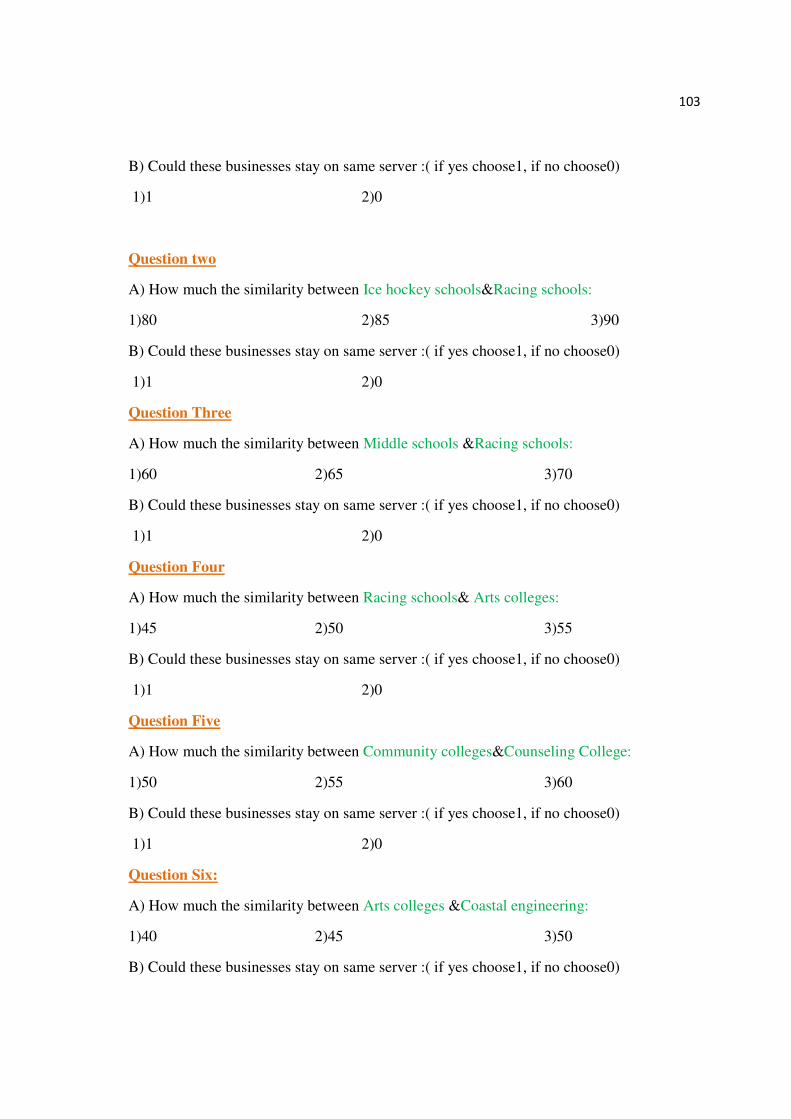
103
B) Could these businesses stay on same server :( if yes choose1, if no choose0)
1)1 2)0
Question two
A) How much the similarity between Ice hockey schools &Racing schools:
1)80 2)85 3)90
B) Could these businesses stay on same server :( if yes choose1, if no choose0)
1)1 2)0
Question Three
A) How much the similarity between Middle schools &Racing schools:
1)60 2)65 3)70
B) Could these businesses stay on same server :( if yes choose1, if no choose0)
1)1 2)0
Question Four
A) How much the similarity between Racing schools& Arts colleges:
1)45 2)50 3)55
B) Could these businesses stay on same server :( if yes choose1, if no choose0)
1)1 2)0
Question Five
A) How much the similarity between Community colleges&Counseling College:
1)50 2)55 3)60
B) Could these businesses stay on same server :( if yes choose1, if no choose0)
1)1 2)0
Question Six:
A) How much the similarity between Arts colleges &Coastal engineering:
1)40 2)45 3)50
B) Could these businesses stay on same server :( if yes choose1, if no choose0)

104
1)1 2)0
Question seven:
A) How much the similarity between Coastal engineering &Construction engineering:
1)80 2)85 3)90
B) Could these businesses stay on same server :( if yes choose1, if no choose0)
1)1 2)0
Question Eight:
A) How much the similarity between Constructions engineering& Software Engineering:
1)80 2)85 3)90
B) Could these businesses stay on same server :( if yes choose1, if no choose0)
1)1 2)0
Question Nine:
A) How much the similarity between Software Engineering &Postal savings banks:
1)10 2)15 3)20
B) Could these businesses stay on same server :( if yes choose1, if no choose0)
1)1 2)0
Question Ten:
A) How much the similarity between Community development bank& Coastal engineering:
1)10 2)15 3)20
B) Could these businesses stay on same server :( if yes choose1, if no choose0)
1)1 2)0
Question Eleventh:
A) How much the similarity between Off shore banks& Law schools:
1)10 2)15 3)20
B) Could these businesses stay on same server :( if yes choose1, if no choose0)
1)1 2)0

105
Question Twelfth:
A) How much the similarity between Callable Bonds& Offshore banks:
1)40 2)45 3)50
B) Could these businesses stay on same server :( if yes choose1, if no choose0)
1)1 2)0
Question Thirteenth:
A) How much the similarity between Callable Bonds&Racing schools:
1)10 2)15 3)20
B) Could these businesses stay on same server :( if yes choose1, if no choose0)
1)1 2)0
Question Fourteenth:
A) How much the similarity between Convertible Bonds&X-rays:
1)10 2)15 3)20
B) Could these businesses stay on same server :( if yes choose1, if no choose0)
1)1 2)0
Question Fifteenth:
A) How much the similarity between Ultrasound&Nuclear medicine scans:
1)75 2)80 3)85
B) Could these businesses stay on same server :( if yes choose1, if no choose0)
1)1 2)0
Question Sixteenth:
A) How much the similarity between Eye Allergies&Middle Ear:
1)75 2)80 3)85
B) Could these businesses stay on same server :( if yes choose1, if no choose0)
1)1 2)0
Question Seventeenth:
A) How much the similarity between Middle Ear&Middle schools:
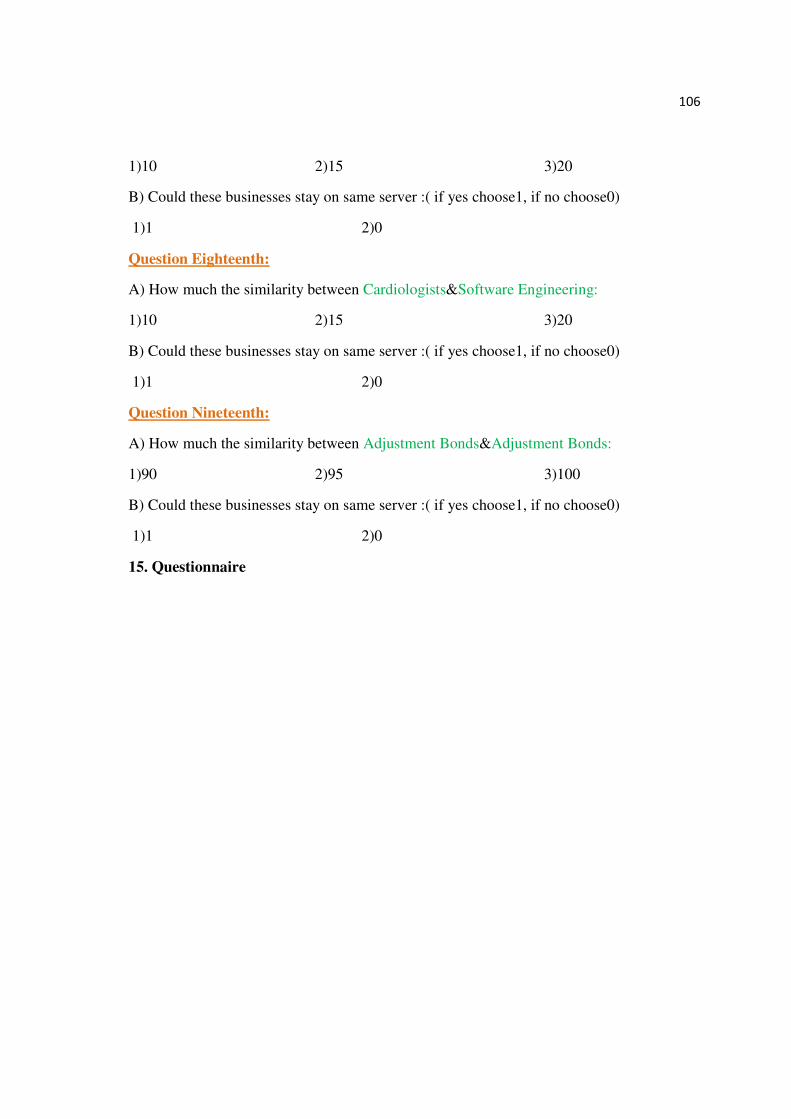
106
1)10 2)15 3)20
B) Could these businesses stay on same server :( if yes choose1, if no choose0)
1)1 2)0
Question Eighteenth:
A) How much the similarity between Cardiologists&Software Engineering:
1)10 2)15 3)20
B) Could these businesses stay on same server :( if yes choose1, if no choose0)
1)1 2)0
Question Nineteenth:
A) How much the similarity between Adjustment Bonds&Adjustment Bonds:
1)90 2)95 3)100
B) Could these businesses stay on same server :( if yes choose1, if no choose0)
1)1 2)0
15. Questionnaire

107
For the more results, you can contact with author at:[email protected]
Respondent 1 2 3 4 5 6 7 8 9 10 11 12 13 14 15 16 17 18 19
Sales
Sales Manager
80 85 60 45 60 45 85 80 15 15 15 45 20 20 80 60 15 20 100
Sales Promotion Manager
80 85 60 50 60 40 80 80 15 15 15 40 20 15 80 65 15 20 100
Sales Trainee
90 90 65 55 60 50 85 80 20 15 20 45 15 20 75 60 15 20 100
Sales Person 1
85 85 60 50 60 45 80 85 15 20 15 45 20 20 80 65 15 20 100
Sales Person 2
80 85 60 45 60 45 85 80 15 15 15 45 20 20 80 65 20 20 100
Sales Person 3
80 85 65 40 55 50 85 85 20 20 15 45 20 15 75 65 20 15 100
Marketing
Marketing Director
85 90 70 55 50 50 80 90 15 15 15 50 15 15 85 70 15 15 100
Marketing Manager
90 90 70 55 60 50 90 85 20 20 20 50 15 15 85 70 15 15 100
MarketingPerson1
80 85 60 45 60 45 85 80 15 15 15 40 20 20 80 65 20 20 100
MarketingPerson2
80 80 55 40 60 40 85 75 20 20 20 40 20 20 80 60 20 20 100
Product Manager
80 85 65 50 60 45 85 75 20 20 20 50 20 20 85 60 15 15 100
Marketing Consultant
80 90 55 45 55 40 90 80 20 20 20 45 20 20 85 60 20 20 100
IT
IT Administrat
or
85 85 60 40 60 40 80 80 15 15 15 40 15 15 90 70 15 15 100
System Administrat
or
90 90 65 40 65 45 85 75 20 20 20 45 20 20 85 65 20 20 100
Network Administrat
or
85 80 55 40 60 40 85 75 20 20 20 40 20 20 85 60 15 15 100
Technical IT
85 80 60 40 65 40 85 75 20 20 20 50 20 20 90 60 20 20 100
Average 83 86 62 46 59 44 84 80 18 18 18 45 19 18 83 64 17 18 100