it is the steps someone takes to identify a question, develop a hypothesis, design and carry out...
TRANSCRIPT

THE SCIENTIFIC METHOD
A WAY TO SOLVE A PROBLEM

What is the Scientific Method?
It is the steps someone takes to identify a question, develop a hypothesis, design and carry out steps or procedures to test the hypothesis, and document observations and findings to share with someone else.

TYPES OF OBSERVATIONS
Quantitative- involves numbers Gravity- 9.8m/sec/sec
Qualitative- physical or chemical qualities
Observations lead to the development of a question.
Direct observations vs. Inference?- LOTS OF INFERENCE IN CHEMISRY!!
Hmmm…what does an atom look like?

The question leads one to…
gather information
(you find s Thomson’s Plum Pudding Model for atomic structure- there are
electrons embedded in a sea of positive charge)
and form a hypothesis
( If Thomson's Plum Pudding model was to be accurate, then big alpha particles will pass through the gold foil with only a few minor deflections because alpha particles are heavy
and the charge in the "plum pudding model" is widely spread.)

The next step scientists take is to create and conduct an experiment to test their hypothesis.
( Rutherford’s Gold Foil Experiment)
Controls- same (atoms Thompson investigated)
Independent variable- what the experimenter manipulates (changes)…
(Alpha particles- large and positive were used and fired through Gold leaf)
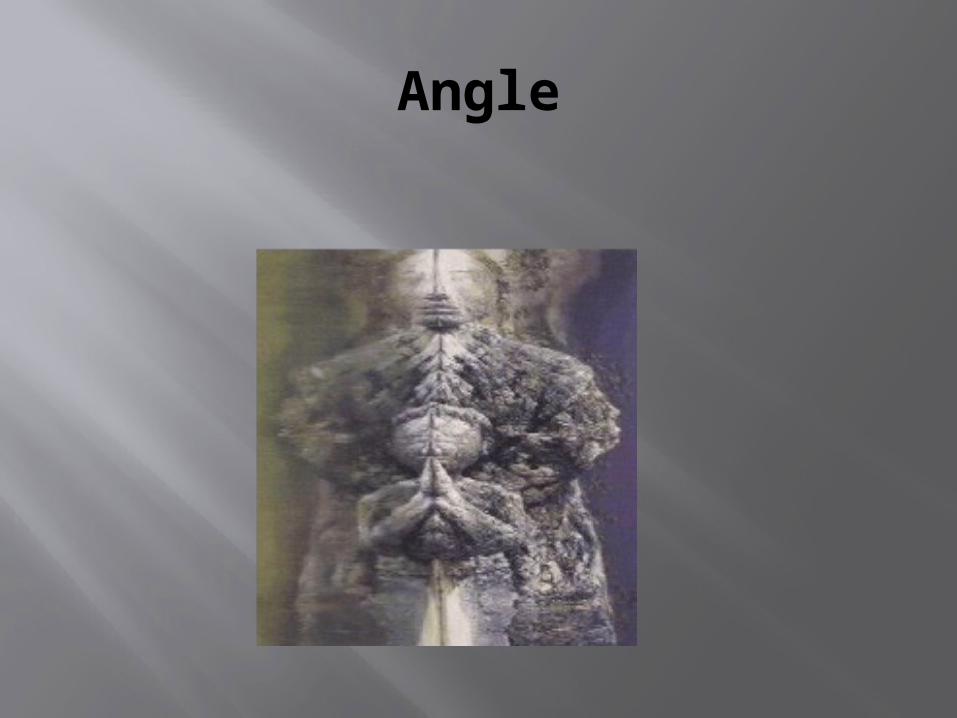
Dependent variable-What the experimenter is measuring
(Angle of deflection)
RESULTS, ANALYSIS, and CONCLUSION:
Finally you gather information based on your experiment, analyze the data to determine what your experiment showed you about the phenomena you questioned, and come up with a conclusion based on it. Was your hypothesis correct? Incorrect? Why? What other questions does it leave you with?

The steps of the Scientific Method are:
Observations lead to Questions Background Research-what do we
already know Hypothesis- what do we expect will occur Conduct Experiment- Procedures/Method Collect and Analyze
Results/Table/stats/graphs Conclusion

PERSPECTIVE CHANGES EVERYTHING
IS SCIENCE OBJECTIVE OR SUBJECTIVE???

A lesson in perspective:What we see is dependent on our gaze

What we see is dependent on…

WHAT WE SEE IS DEPENDENT
…ON HOW CLOSE WE LOOK…
CONCLUSIONS ARE NEVER OBJECTIVE…ALWAYS SUBJECTIVE

Scientific Theories and Laws Scientific theory- explanation that has been tested by repeated
experiments
Theories must explain observations simply and clearly(theory that heat is the energy of particles in motion explains how the far end of a metal tube gets hot when placed in an open flame)
Experiments must illustrate theory is repeatable( the far end of the tube ALWAYS gets hot regardless of how many times it is done)
You must be able to make predictions based on it.( you might predict that anything that makes particles move faster will make the object hotter. Sawing a piece of wood will make the particles move faster, and will make it hotter as well.)
Scientific law states a repeated observation of nature but doesn’t explain why warm objects become cooler.

Math and models
Equations describes relationships between quantitative measurements
It is a universal language.
Universal law of gravitation

MODELS
Represent things that are either too large, small, or complex to study easily. Also to as a mental picture to predict what will happen (eg. Chemical equations)
Computer models-often mathematical models that can save time and $$ because calculations are done by machines (eg. Crash test for motion/forces to improve car design)
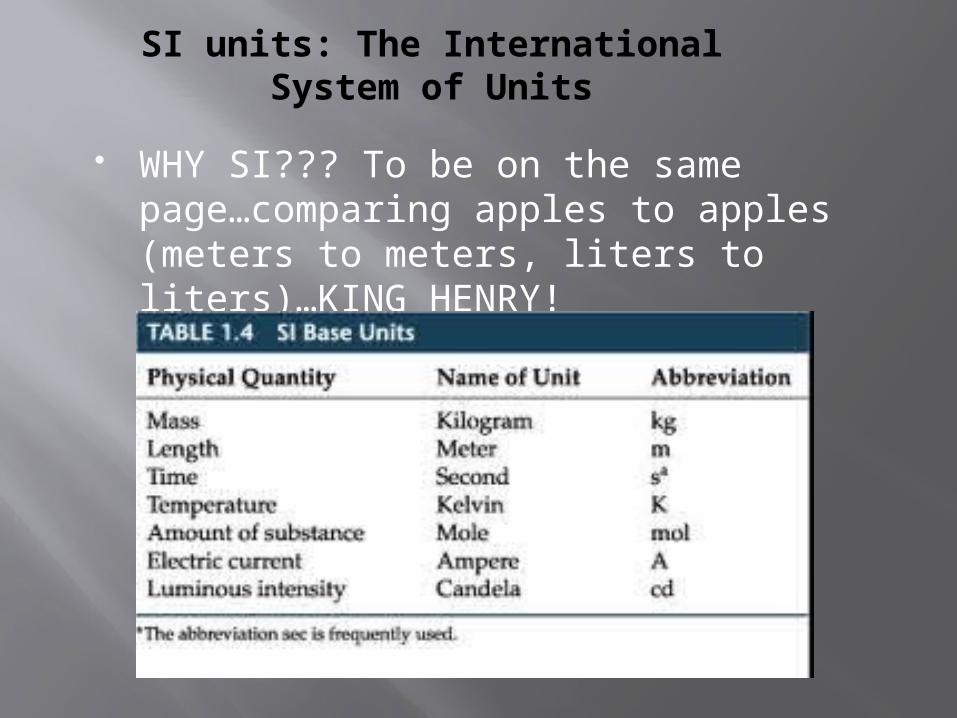
SI units: The International System of Units
WHY SI??? To be on the same page…comparing apples to apples (meters to meters, liters to liters)…KING HENRY!


Units are just like numbers…they can be multiplied, divided, and reduced!
SI prefixes are for very large or very small measurements…instead of expressing that you traveled 800,000 m in distance, you would use 800 km to avoid using several zeros.
SI prefixes are in multiples of 10. This makes it easy to convert SI units into
larger or smaller units by moving the decimal.
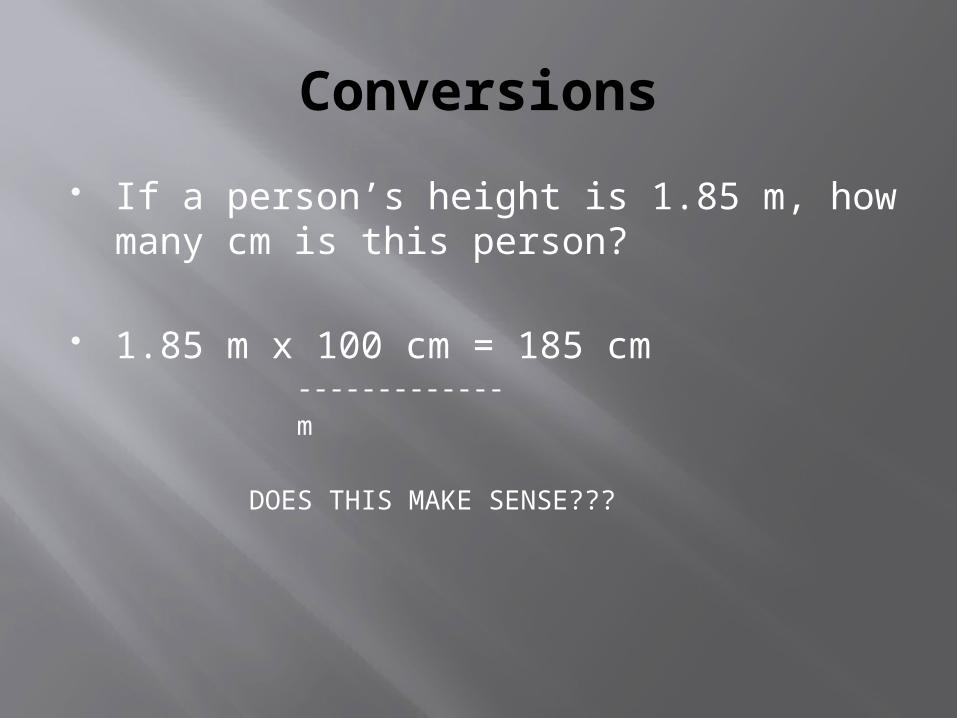
Conversions
If a person’s height is 1.85 m, how many cm is this person?
1.85 m x 100 cm = 185 cm -------------
m
DOES THIS MAKE SENSE???

DATA ANALYSIS
Using the Metric System
Scientific Notation
Percent Error
Using Significant Figures
Accuracy and Precision
Graphing Techniques

Base Units (Fundamental Units)
QUANTITY NAME SYMBOL_______________________________________________ Length meter m
-----------------------------------------------------------------------------
Mass kilogram kg-------------------------------------------------------------------------
------ Time second s
--------------------------------------------------------------------Amount of Substance mole mol

Derived Units
Base Units – independent of other units Derived Units – combination of base units
Examples density g/L (grams per liter) volume m x m x m = meters cubed

Making Unit Conversions
Make conversions by moving the decimal point to the left or the right using:
“ king henry died unit drinking chocolate milk”
Examples1. 12.0 cm = __________m2. 39.5 mL = __________L3. 28.7 mg = __________kg

SCIENTIFIC NOTATION
Scientific Notation: Easy way to express very large or small numbers
A.0 x 10x
A – number with one non-zero digit before decimal
x -exponent- whole number that expresses the number decimal places
if x is (-) then it is a smaller if x is (+) than it is larger
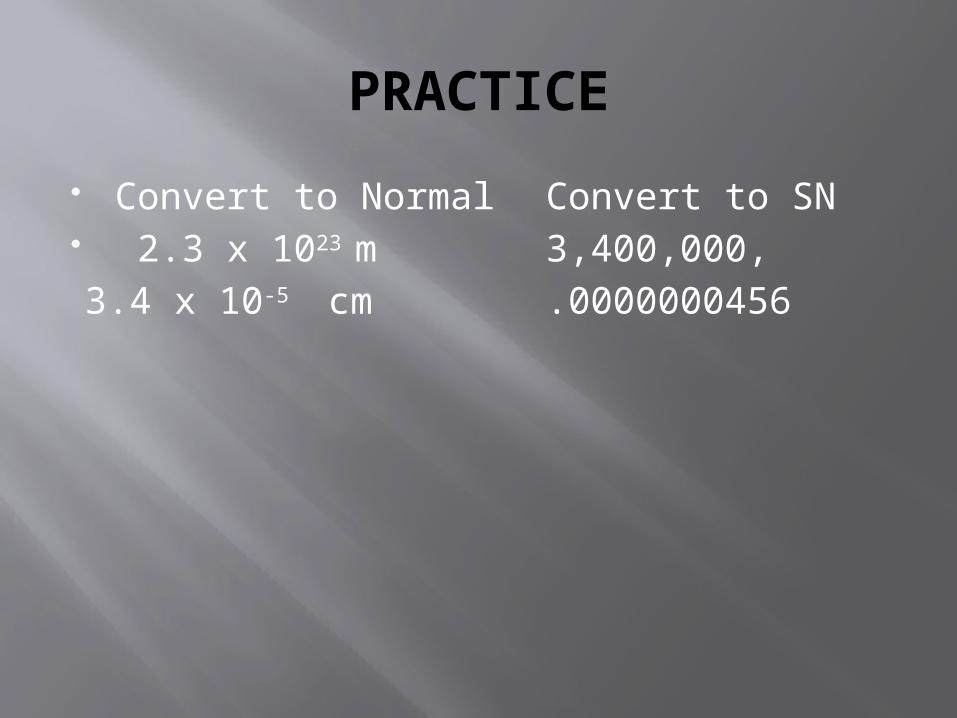
PRACTICE
Convert to Normal Convert to SN 2.3 x 10²³ m 3,400,000, 3.4 x 10⁻⁵ cm
.0000000456

Multiplying
Calculating in Scientific notation Multiplying-
Multiple the numbers Add the exponents
(2.0 x 10⁴) (4.0 x 10³) = 8.0 x 10⁷

Dividing divide the numbers subtract the denominator exponent from the
numerator exponent
9.0 x 10⁷ 3.0 x 10²
3.0 x 10⁵

Add
Add or subtract get the exponents of all # to be the same calculate as stated make sure the final answer is in correct scientific
notation form 7.0 x 10 4 + 3.0 x 10 3 = 7. 0 x 104 + .3 x 104 = 7.3 x 10⁴
70,000 + 3,000 = 73000= 7.3 x10⁴

subtract
7.0 x 10 4 - 3.0 x 10 3 = 7.0x 10⁴ – .30 x 104 = 6.7 x 10⁴
70,000 - 3 000 =67,000

PRACTICE
Add: 2.3 x 103 cm + 3.4 x 10⁵ cmSubtract: 2.3 x 103 cm - 3.4 x 10⁵ cmMultiply: : 2.3 x 103 cm X 3.4 x 105 cm Divide: : 2.3 x 103 cm / 3.4 x 105 cm

What is % error? How far off were your results?
The absolute value of the difference between the value obtained (what you measured) and an ideal value (what you should have obtained)
Divided by the ideal value (what you should’ve obtained)
Times 100.

Calculating Percent Error
% Error =accepted value–experimental value X 100= %
accepted value
Subtract -Divide then multiply by 100

Calculating Percent Error
EXAMPLE – A student determines the density of a piece of wood to be .45g/cm. The actual value is .55g/cm.
What is the student’s percent error? .55 - .45 X 100% = .10 = .18 x
100% = 18% .55 .55

Introduction
If someone asks you how many inches there are in 3 feet, you would quickly tell them that there are 36 inches.
Simple calculations, such as these, we are able to do with little effort.
However, if we work with unfamiliar units, such as converting grams into pounds, we might multiply when we should have divided.

The fraction ( 4 x 5) / 5 can be simplified by dividing the numerator (top of fraction) and the denominator (bottom of fraction) by 5:
Likewise, the units in (ft x lb) / ft reduces to pounds (lb) when the same units ( ft )are canceled:
5
5 4
5
5 4 = 4
ft
lb ft
ft
lb ft = lb

CONVERSION FACTOR
A CONVERSION FACTOR is a given Ratio-Relationship between two values that can also be written as TWO DIFFERENT FRACTIONS.
For example, 454 grams =1.00 pound, states that there are 454 grams in 1.00 pound or that 1.00 pound is equal to 454 grams.

Ratio-Relationship
We can write this Ratio-Relationship as two different CONVERSION-FACTOR-FRACTIONS:
These fractions may also be written in words as 454 grams per 1.00 pound or as 1.00 pound per 454 grams, respectively. The "per" means to divide by.
454 grams
1.00 pound
1.00 pound
454 gramsor as
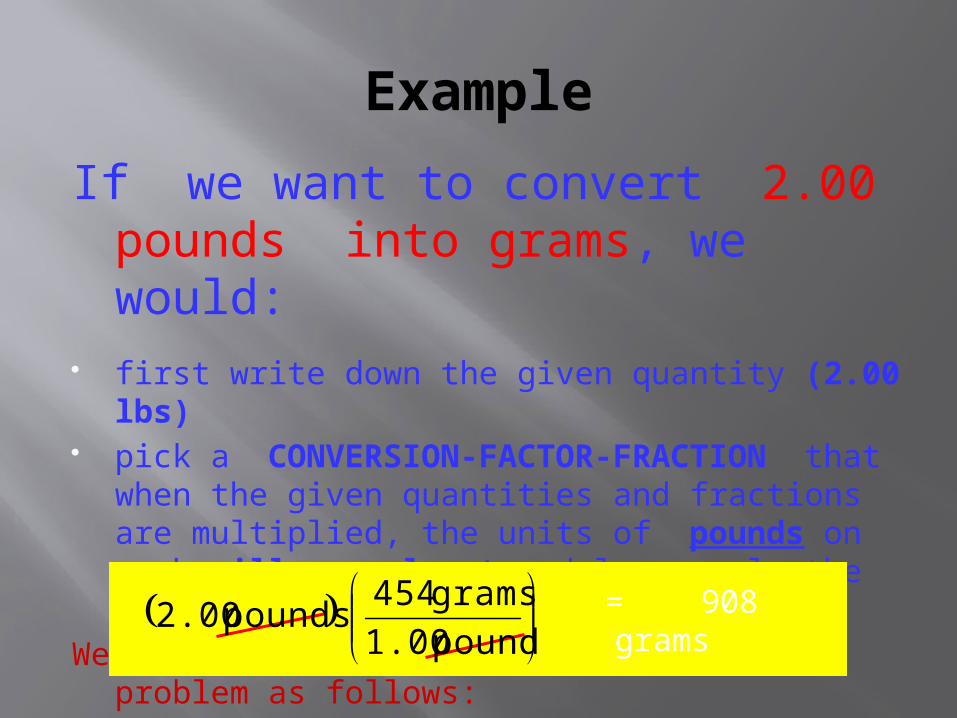
Example
If we want to convert 2.00 pounds into grams, we would:
first write down the given quantity (2.00 lbs) pick a CONVERSION-FACTOR-FRACTION
that when the given quantities and fractions are multiplied, the units of pounds on each will cancel out and leave only the desired units, grams.
We will write the final set-up for the problem as follows:
pound 1.00
grams 454 pounds 2.00 = 908 grams

Conversion factors continued...
If we had used the other conversion-factor-fraction in the problem:
We would know that the ABOVE problem was set-up incorrectly since WE COULD NOT CANCEL Out the
units of pounds and the answer with pounds / grams makes no sense.
grams 454
pound 1.00 pounds 2.00
grams
2pounds 0044.0=

Four-step approach
When using the Factor-Label Method it is helpful to follow a four-step approach
in solving problems: 1. What is question – How many sec in 56 min2. What are the equalities- 1 min = 60 sec3. Set up problem (bridges) 56 min 60 sec 4. 1 min5. Solve the math problem -multiple
everything on top6. and bottom then divide 56 x 60 / 1

Using Significant Figures (Digits)
value determined by the instrument of measurement plus one estimated digit
reflects the precision of an instrument
example – if an instrument gives a length value to the tenth place – you would estimate the value to the hundredths place
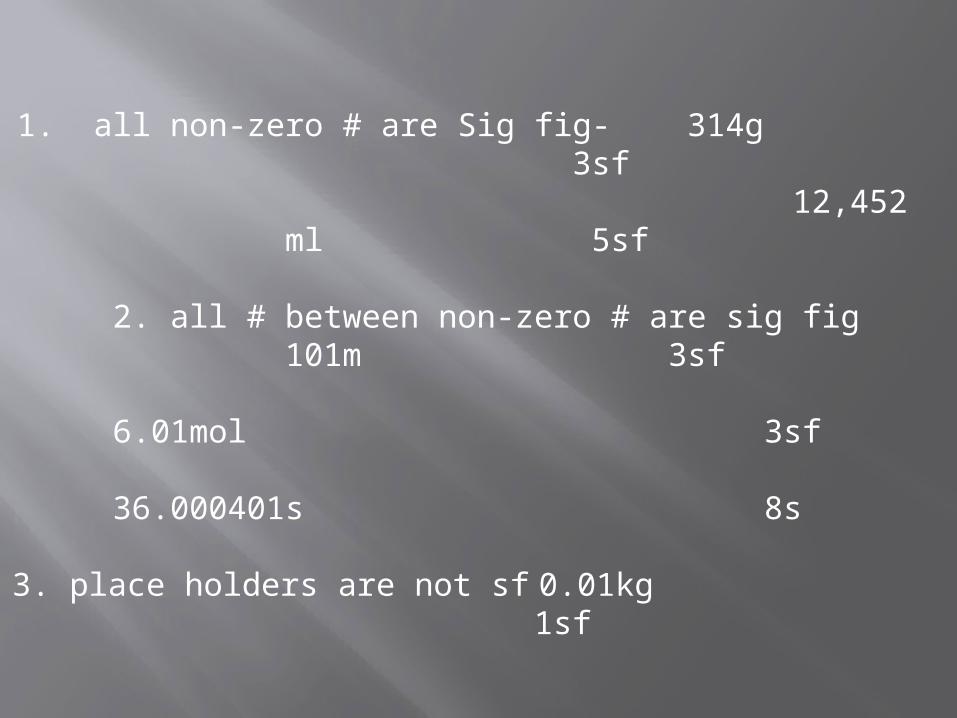
1. all non-zero # are Sig fig- 314g 3sf
12,452 ml 5sf
2. all # between non-zero # are sig fig 101m 3sf
6.01mol 3sf
36.000401s 8s
3. place holders are not sf 0.01kg 1sf
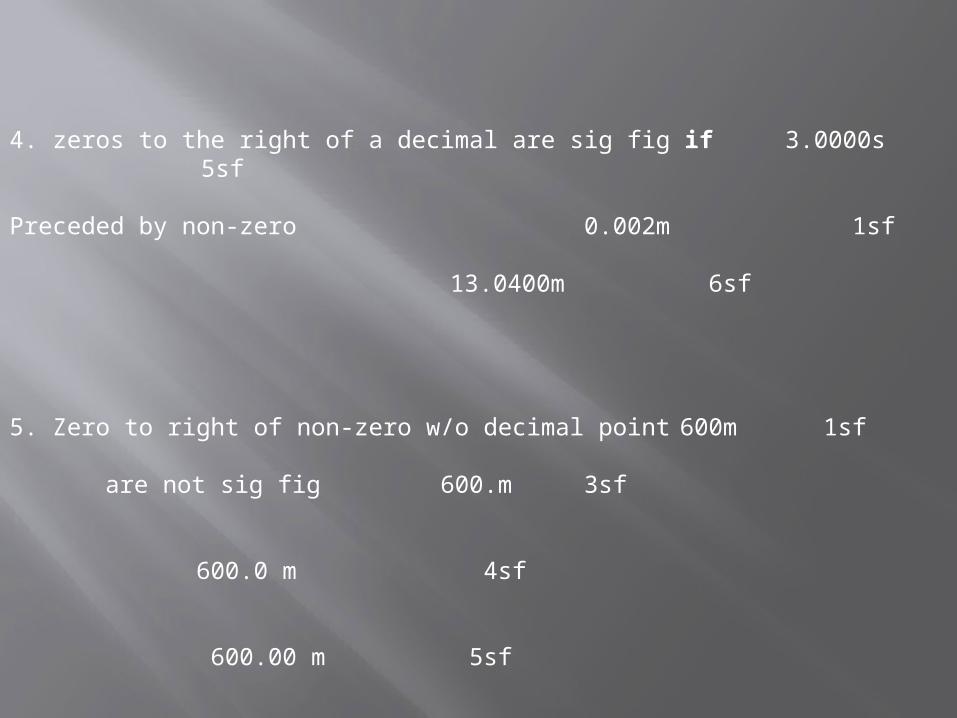
4. zeros to the right of a decimal are sig fig if 3.0000s 5sf
Preceded by non-zero 0.002m 1sf
13.0400m 6sf
5. Zero to right of non-zero w/o decimal point 600m 1sf
are not sig fig 600.m 3sf
600.0 m 4sf
600.00 m 5sf

RULES FOR USING SIGNIFICANT FIGURES
use the arrow rule to determine the number of significant digits
decimal present all numbers to right of the first non zero are significant (draw the arrow from left to right)
----------> 463 3 sig. digits----------> 125.78 5 sig. digits----------> .0000568 3 sig. digits----------> 865 000 000. 9 sig. digits

RULES FOR USING SIGNIFICANT FIGURES
use the arrow rule to determine the number of significant digits
decimal not present < -------- all numbers to the left of the first non zero are significant
(draw arrow from right to left)
246 000 <---------- 3 sig. digits
400 000 000 <---------- 1 sig. digit

Use appropriate rules for rounding
If the last digit before rounding is less than
5 it does not change ex. 343.3 to 3 places 343 1.544 to 2 places 1.54 If the last digit before rounding is greater than 5 – round up one ex. 205.8 to 3 places 206 10.75 to 2 places 11

use fewest number of decimal places rule for addition and
subtraction
1) 2) 3) 4)
24.05 5.6 237.52 88
123.770 28 - 21.4 - 4.76 0.46 8.75 10.2 7_________ ______ _______ ______

Use least number of significant figuresrule for multiplication and division
1) 23.7 x 6.36
2) .00250 x 14
3) 750. / 25
4) 15.5 / .005

Reliability of Measurement
ACCURACY – how close a measured value is to the accepted value
PRECISION – how close measurements are to one another - if measurements are precise they show little variation
* Precise measurements may not be accurate

Precision- refers to how close a series of measurements are to one another; precise measurements show little variation over a series of trials but may not be accurate.
LESS THAN .1 IS PRECISE
Oscar performs an experiment to determine the density of an unknown sample of metal. He performs the experiment three times:
19.30g/ml 19.31g/ml 19.30g/ml
Certainty is +/- .01 Are his results precise?

Accuracy and Precision
Accuracy – refers to how close a measured value is to an (theoretical) accepted value. The metal sample was gold( which has a density of
19.32g/ml) Certainty is
+/- .01 Are his results accurate? Need to calculate
percent error. 5% OR LESS IS ACCURATE Oscar finds the volume of a box 2.00cm3 (ml) It is really 3.00ml is it precise? Accurate?
Percent error
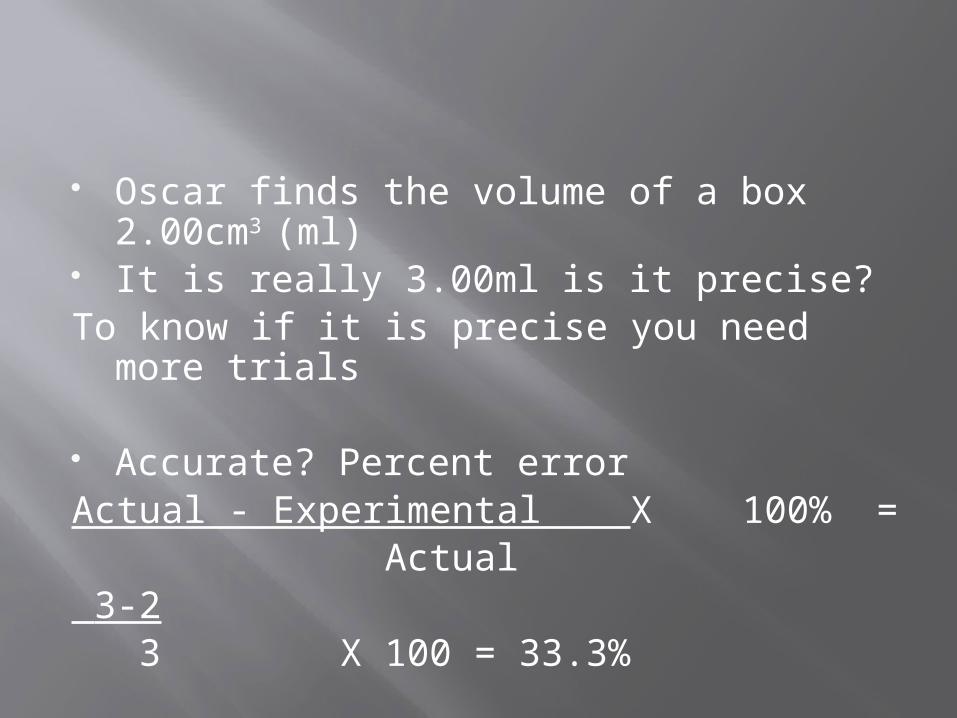
Oscar finds the volume of a box 2.00cm3
(ml) It is really 3.00ml is it precise? To know if it is precise you need more trials
Accurate? Percent errorActual - Experimental X 100% = Actual 3-2 3 X 100 = 33.3%

Activity: basket and paper clip 1. Throw 6 paper clips at basket 2. Measure the distance from the basket
to determine accuracy and precision Cm3= ml and dm3= l Liter
PAPER CLIP LAB: Q- Will I be able to precisely and
accurately throw 6 paper clips in a basket located ____________ cm away?
H:
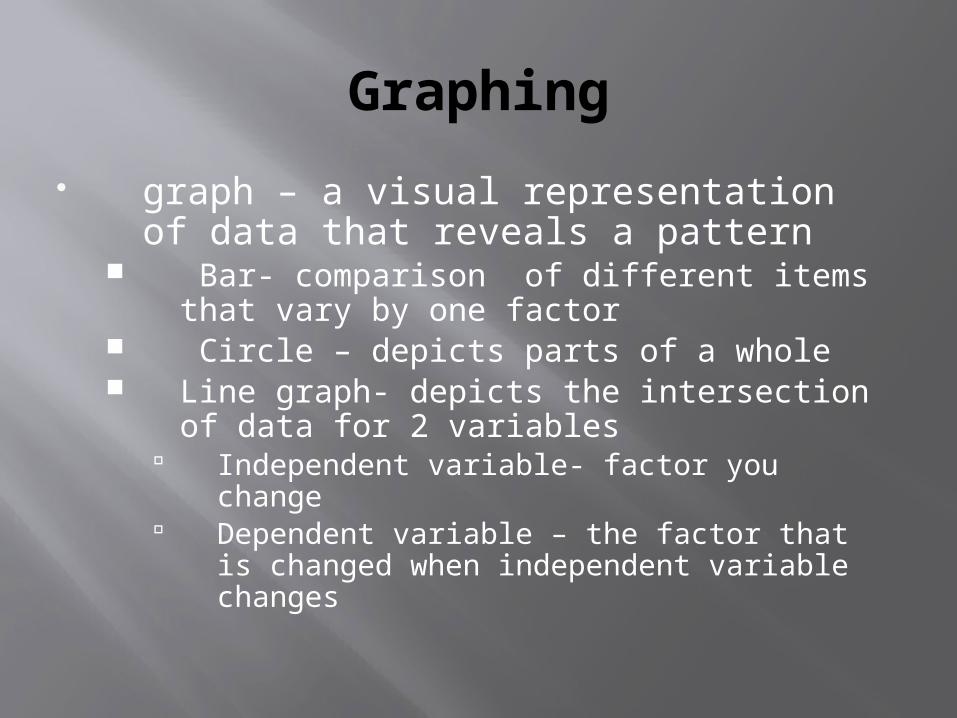
Graphing
graph – a visual representation of data that reveals a pattern
Bar- comparison of different items that vary by one factor
Circle – depicts parts of a whole Line graph- depicts the intersection of data
for 2 variables Independent variable- factor you change Dependent variable – the factor that is
changed when independent variable changes
Graphing
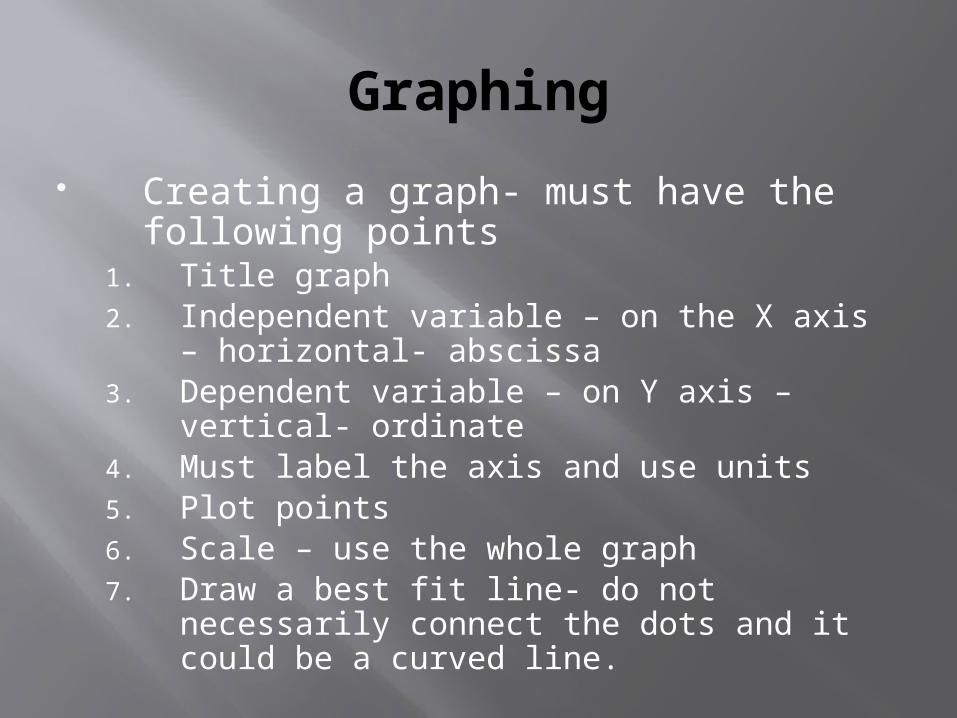
Creating a graph- must have the following points
1. Title graph2. Independent variable – on the X axis –
horizontal- abscissa3. Dependent variable – on Y axis – vertical-
ordinate4. Must label the axis and use units5. Plot points6. Scale – use the whole graph7. Draw a best fit line- do not necessarily
connect the dots and it could be a curved line.

Interpreting a graph Slope- rise Y2 –Y1
Run X2 –X1 relationship
direct – a positive slope inverse- a negative slope equation for a line – y = mx + b
m-slope b – y intercept
extrapolate-points outside the measured values- dotted line
interpolate- points not plotted within the measured values-dotted line

GRAPHING LAB
Creating a graph- must have the following points
1.Title graph2. Independent variable –on the X axis–horizontal-
abscissa3. Dependent variable – on Y axis – vertical- ordinate4. Must label the axis and use units5. Plot points6. Scale – use the whole graph7. Draw a best fit line- do not necessarily connect the dots
and it could be a curved line.

GRAPHING
Interpreting a graph Slope= rise Y2 –Y1
Run X2 –X1 relationship
direct relationship– a positive slope Inverse relationship- a negative slope equation for a line – y = mx + b
m-slope b – y intercept
extrapolate-points outside the measured values- dotted line
interpolate- points not plotted within the measured values-dotted line

NEXT…
PROPERTIES AND CHANGES CLASSIFICATION OF MATTER