) increase its international trade?
TRANSCRIPT

DPRIETI Discussion Paper Series 19-E-090
Do Japan's Free Trade Agreements (FTAs) Increase Its International Trade?
ANDO, MitsuyoKeio University
URATA, ShujiroRIETI
YAMANOUCHI, KentaKeio University
The Research Institute of Economy, Trade and Industryhttps://www.rieti.go.jp/en/

1
RIETI Discussion Paper Series 19-E-090
October 2019
Do Japan’s Free Trade Agreements (FTAs) Increase Its International Trade?*
ANDO, Mitsuyo (Keio University)
URATA, Shujiro (Waseda University/RIETI)
Yamanouchi, Kenta (Keio University)
Abstract
This paper analyzes the impacts of Free Trade Agreements (FTAs) on bilateral trade, focusing on Japan’s
FTAs. We first examined the effects of Japan’s FTAs, using a dataset of Japan’s exports and imports, not
only on all products as a whole but also on major products for a period 1995-2016. From the analysis at the
aggregate level, we found that effects of Japan’s FTAs are heterogeneous among the FTA partners, and that
Japan enjoyed trade creation effects of FTAs on exports/imports with more than half of the FTA partners.
We also investigated the dynamic effects of FTAs by the period of years from the enforcement. The results
demonstrate that positive effects tend to increase gradually for some products. Moreover, we conducted
the corresponding analysis for the same period, incorporating not only Japan’s trade but also trade between
third countries. We found that unlike the analysis only for Japan’s exports or imports, the trade creation
effects of FTAs disappeared for some FTA partners, while they were robust for others. These findings
suggest that Japan’s FTAs did not make sufficient contributions to the expansion of Japan’s trade with FTA
partners when we consider FTA partners’ trade with other countries. In other words, even when Japan’s
trade with FTA partners increased, FTA partners’ trade with countries other than Japan increased more. As
we have emphasized in a series of our studies on FTAs, to realize the trade expansion effects of FTAs, it is
crucial to facilitate the use of FTAs, for instance, by constructing user-friendly rules of origin or provide
support for the use of the FTAs.
Keywords: Free trade agreements, trade creation effects, and dynamic effects of FTAs
JEL classification: F14, F15
The RIETI Discussion Papers Series aims at widely disseminating research results in the form of professional
papers, with the goal of stimulating lively discussion. The views expressed in the papers are solely those of the
author(s), and neither represent those of the organization(s) to which the author(s) belong(s) nor the Research
Institute of Economy, Trade and Industry.
*This study is conducted as a part of the Project “A Study of the Effects of Trade Policy: A microdata analysis of Japan
from the 1990s to 2010s,” undertaken at the Research Institute of Economy, Trade and Industry (RIETI). The authors
would like to thank RIETI for this fruitful research opportunity. All remaining errors are our own.

2
1. Introduction
In recent years, free trade agreements (FTAs) have attracted many countries’ attention as one
of the key international trade policies. Indeed, it is not an overstatement to say that FTAs have
become the most important and popular trade policy. Particularly since the latter half of the 1990s,
the number of FTAs in force has been rapidly increasing in various regions of the world.
Considering the virtually stalled trade liberalization negotiations at the World Trade Organization
(WTO), many countries interested in trade liberalization have begun establishing FTAs.
Japan expressed an interest in FTAs in the late 1990s. Its first FTA with Singapore came
into force in November 2002. Japan’s FTA negotiations subsequently centered on countries in the
Association of Southeast Asian Nations (ASEAN) (Table 1). As of the beginning of June 2019, 17
FTAs had come into effect, including 14 bilateral FTAs with Singapore, Mexico, Malaysia, Chile,
Thailand, Indonesia, Brunei, the Philippines, Switzerland, Vietnam, India, Peru, Australia, and
Mongolia (in order of enactment), plus three regional FTAs with ASEAN (AJCEP), selected
Asia-Pacific countries (CPTTP or TPP11), and the European Union (Japan-EU EPA). Note that
Japan has both regional and bilateral agreements with seven of the ten ASEAN countries, i.e.,
Singapore, Vietnam, Brunei, Malaysia, Thailand, the Philippines, and Indonesia (in order of
enactment), while only regional one with the rest of the three countries, i.e., Laos, Myanmar, and
Cambodia.1
== Table 1 ==
Traditionally, Japan’s trade policy adopted a principle of non-discrimination for all member
countries in the framework of the General Agreement on Tariffs and Trade (GATT)/WTO multilateral
trading systems. However, Japan now uses a multi-layered, discriminatory approach, including from
bilateral/regional frameworks in the form of FTAs as well as the WTO’s multilateral framework.2 As
mentioned above, one of the reasons for Japan’s shift toward FTAs is the rapid increase in FTAs in
various regions of the world. In a trading environment with more FTAs, Japan has become interested
in FTAs to secure export markets in an increasingly discriminatory trade environment brought about
by these FTAs. Another reason is the need to set up international rules to improve business
environment, such as those on the international movements of capital/investment, people, and
1 Japan is currently negotiating FTAs, bilaterally with Colombia as well as Turkey, trilaterally with China and South Korea (CJK FTA), and regionally with ten ASEAN member countries and five East Asian countries (China, South Korea, India, Australia, and New Zealand). This regional FTA is named the Regional Comprehensive Economic Partnership (RCEP). The RCEP, the CPTPP, and Japan-EU EPA are called mega-FTAs because they involve many countries, including several major ones. Regarding FTA negotiations with South Korea, countries in the Gulf Cooperation Council (GCC), and Canada, they have been suspended though they started once. 2 In exceptional cases, special trade measures, such as voluntary export restraints, were adopted bilaterally with the United States to deal with trade frictions in the 1960s-1980s.

3
information. While the international movements of investment, people, and information have
intensified, rules in these areas have not been sufficiently established by the WTO. Faced with this
situation, Japan and other countries have increased their interest in FTAs to set up international rules.
Now that it has been some years since the enactment of many FTAs, ex-post evaluation of
their economic impacts is indispensable, not only for academic purposes but also to evaluate and
formulate FTA policies. Ando (2007) provided preliminary ex-post evaluation of Japan’s FTAs,
using gravity model estimation as well as detailed analysis on trade and actual tariff reduction by
FTAs.3 Although it was probably the first attempt of ex-post evaluation for Japan’s FTAs adopting a
quantitative analysis, the period of years from the enactment of FTAs was not long enough to provide
a solid evaluation. Our earlier studies on the effects of Japan’s FTAs, i.e., Ando and Urata (2011) for
FTA with Mexico and Ando and Urata (2015) for three FTAs with Malaysia, Thailand and Indonesia,
examined the impacts of Japan’s FTAs on bilateral trade by using Japan’s trade data at the
disaggregated product level and by explicitly considering the tariff levels or preferential margins,
which are gaps between most-favored nation (MFN) tariffs and preferential tariffs under FTAs.
While such analysis is useful for evaluating FTA policies, it is difficult to apply the same research
strategy to many FTAs. Moreover, the analysis using only Japan’s trade does not allow us to
consider the trend of FTA partners’ trade with other countries. As the results in Ando and Urata
(2011 and 2015) demonstrate, the possible impacts of FTAs if any may be different among
sectors/products. Although Yamanouchi (2019) must be the first paper that conducts gravity model
estimations to investigate the impacts of Japan’s FTAs, using trade data including not only Japan’s
trade but also trade between third countries (third-country trade), it does not consider either sectoral
aspect or dynamic aspect.4 Furthermore, the effects of FTAs may be different across agreements or
countries, as suggested by some recent studies such as Kohl (2014), Baier, Bergstrand, and Clance
(2018), Baier, Yotov, and Zylkin (2019), and Yamanouchi (2019).5
Considering the issues mentioned above, this paper sheds light on 15 Japan’s FTAs in force
as of the beginning of 2018, with 17 FTA partners in total, and attempts to investigate the impacts of
3 The study confirmed a certain degree of positive impact of the Japan-Mexico FTA on trade, particularly on the export side, and investment, and almost no direct impact of the Japan-Singapore FTA since actual reduction of tariffs by the FTA is quite limited. 4 Yamanouchi (2017) examines the dynamic effects of Japan’s FTAs, using Japan’s trade data only. 5 For instance, Kohl (2014) estimated the effects for each of 166 FTAs by first-differencing gravity model and first pointed out that the trade creation effects are heterogeneous and only about one-quarter of agreements are trade-promoting. Baier, Bergstrand, and Clance (2018) constructed Melitz-based general equilibrium model to explore the roles of various kinds of trade costs on extensive margin and intensive margin. They estimated the effects of Economic Integration Agreements (EIAs), including FTAs, by using the trade data for 183 countries over 1965–2010 with five-year intervals and demonstrated that EIAs are effective when the country pair is not distant with each other and has a common language and religion but different legal origins and colonial histories. Baier, Yotov, and Zylkin (2019) demonstrated highly heterogeneous effects within agreements and some determinants of those effects by using two-stage method and trade data for 70 countries over 1986–2006; for example, the effects of FTAs are small if the country pair has high levels of ex ante trade frictions.

4
these FTAs on Japan’s trade with FTA partners, not only analyzing Japan’s bilateral trade but also
considering world trade including bilateral trade between third countries.6 Since the impacts of FTAs
might be heterogeneous among FTAs as suggested by Yamanouchi (2019), we analyze not only the
overall impacts of 15 Japan’s FTAs on trade but also the impacts on bilateral trade with individual
FTA partners. In addition, the paper examines the dynamic impacts of Japan’s FTAs, or whether the
effects of FTAs will be realized gradually or not, because it may take some time for firms to know
about FTAs and to learn how to use them, and also because the tariff reduction under FTAs will be
realized gradually for some products. Furthermore, we conduct the corresponding analysis not only
for aggregate trade but also for trade by major products for Japan.
The rest of the paper is organized as follows. Section 2 provides an overview on the trend
of Japan’s trade by FTA partners and by major products. Section 3 explains the method to
quantitatively examine the impacts of FTAs, using gravity model estimations, and Section 4 discusses
the estimated results. The paper concludes in Section 5.
2. Overview on Japan’s trade by FTA partners and by major products
This section briefly provides an overview on the recent trend of Japan’s trade. Table 2
presents Japan’s trade since 2000 as a ratio to the value for 1995: i) trade by FTA partners and ii) trade
by major products. The year 1995 was chosen because our gravity model estimations use data for a
period 1995-2016. Japan’s FTA partners are 17 countries as mentioned above. Major products of
our interest are agriculture products (HS01 to HS24), chemical products (HS28 to HS40), textile
products (HS50 to HS63), metal products (HS72 to HS83), general machinery (HS84), electric
machinery (HS85), transport equipment (HS86 to HS89), and precision machinery (HS90 to HS92).7
Trade indices shown in Table 2 help to understand the trade. But we need a careful interpretation of
the index when the benchmark value is small, because such an index tends to become extremely large.
As the figures for the world in Table 2 show, Japan’s trade fluctuated but, generally speaking, tended
to increase with its peaks in 2011/2012. More precisely, Japan’ exports to the world and imports
from the world for 2016 were 1.5 times and 1.8 times that for 1995, respectively, while they reached
their peaks in 2011/2012, recording an increase of 1.9 times for exports and 2.6 times for imports.
Although both exports and imports were affected by the Global Financial Crisis and declined in 2009,
they recovered rapidly within a few years.
== Table 2 ==
6 See Table 1 for the list of 17 FTA partners in total for 15 Japan’s FTAs. As mentioned above, 14 FTA partners have at least bilateral FTA with Japan, and three FTA partners (Laos, Myanmar, and Cambodia) have only a regional FTA with Japan as of the beginning of 2018. 7 Thus, the sum of trade in these major products is not equal to total trade.

5
The patterns of the trend of trade, however, are somewhat different by FTA partners/major
products. Regarding Japan’s trade by FTA partners, Japan’s exports declined to the levels that were
below the value for 1995 for Singapore (0.75 times in 2016), Malaysia (0.64 times), and Brunei (0.64
times), while its exports to most FTA partners increased. The growth rate was positive but lower
than that of Japan’s overall exports (1.54 times) for Thailand (1.42 times), Indonesia (1.4 times), the
Philippines (1.11 times), Switzerland (1.41 times), in addition to the above-mentioned three countries.
On the other hand, Japan’s exports to CLMV (Cambodia, Laos, Myanmar, and Vietnam) expanded
rapidly, particularly since 2010. Among CLMV, the largest expansion was recorded for Vietnam,
while the smallest expansion was registered for Laos.
As for Japan’s imports by FTA partners, similarly to the patterns of exports, its imports
from CLMV increased rapidly, particularly since 2010. On the other hand, Japan’s imports from
Mongolia declined to the level of as low as only 19 percent of the value for 1995 in 2016 with some
fluctuations during the period. The growth rate was positive but lower than Japan’s overall imports
(1.81 times for 2016) for Singapore (1.08 times), Malaysia (1.64 times), Chile (1.68 times), Brunei
(1.28 times), Indonesia (1.28 times), and India (1.59 times) in addition to Mongolia, while it was
higher for other countries.
Regarding Japan’s trade by major products, Japan’s exports of major products fluctuated
but basically increased, except its exports of textile products, which declined to the level of 92 percent
of the value for 1995 in 2016. Japan’s exports in 2016 were more than double the amount for 1995
for agriculture products (2.42 times) and chemical products (2.14 times) and close to double for metal
products (1.89 times) and transport equipment (1.89 times). Similarly to its exports, Japan’s imports
of major products fluctuated but basically increased. The growth rate was the lowest for agriculture
products at 23 percent from 1995 to 2016. Japan’s imports in 2016 were more than double that for
1995 for chemical products (2.61 times), general machinery (2.3 times), electric machinery (2.59
times), and precision machinery (2.52 times). The fact that both exports and imports, particularly
imports, increased in machinery sectors reflects the notable expansion of active back-and-forth
transactions within rapidly growing regional production networks in East Asia.
Trade by FTA partners/major products also provides some features (Table A.1). For
instance, Japan’s metal exports to Mexico and Vietnam expanded remarkably, transport equipment
exports to Mexico increased, and imports of most major products from CLMV grew more rapidly than
exports.
3. Estimation method and data
3.1 Methodology

6
We first estimate the effects of Japan's FTAs based on a gravity model, using dataset of
Japan’s exports and imports. While this estimation method is simple and straightforward, the
analysis using only Japan’s trade does not allow us to consider the trend of FTA partners’ trade with
other countries. In other words, such analysis excludes the effects of FTA partners’ unilateral trade
policies or FTA partners’ trade policies other than their FTAs with Japan. In order to deal with this
problem, we also investigate the effects of Japan’s FTAs by employing trade data covering all the
countries in the world, i.e. trade data including not only Japan’s trade but also third-country trade. In
this analysis, the effects of FTAs of other countries are considered by including control variables.
Our equation of gravity model estimations for the trade values of Japan with a country 𝑗 in
year 𝑡 is as follows:
𝑇𝑟𝑎𝑑𝑒!" = exp 𝛼𝐹𝑇𝐴!" + 𝛽! ln𝐺𝐷𝑃!" + 𝛽! ln𝐺𝐷𝑃𝑝𝑐!" + 𝛽!𝑊𝑇𝑂!" + 𝛿!! + 𝛿!!
+ 𝜀!" ,
(1)
where 𝑇𝑟𝑎𝑑𝑒!" is Japan’s aggregate export or import value with country 𝑗 in year 𝑡. 𝐹𝑇𝐴!" is an
FTA dummy and equal to one if the trading country is an FTA partner of Japan in year 𝑡. We follow
Ando and Urata (2011) and regard a country in the year of the enactment of FTA as an FTA partner if
the FTA becomes effective before or in June of that year. ln𝐺𝐷𝑃!" and ln𝐺𝐷𝑃𝑝𝑐!" are logs of
GDP and GDP per capita of country 𝑗 in year 𝑡. 𝑊𝑇𝑂!" is a WTO dummy and takes the value of
one if country 𝑗 is a member of WTO in year 𝑡. 𝛿!! denotes a country fixed effect, which reflects
all unobserved time-invariant characteristics of the country like distance, and the relationship with
Japan like historical experience. We include the distance with Japan only when country fixed effect
is not included in the estimating equation. 𝛿!! denotes a year fixed effect, which can be interpreted
as Japan’s business cycles and unilateral trade policies. 𝜀!" is an error term. Standard errors are
clustered at country level.
Equation (1) is log-linearized and estimated by the ordinary least squares (OLS) method.
The bias of the OLS estimator, however, has been pointed out recently, for instance by Santos Silva
and Tenreyro (2006).8 Moreover, the flows with the value of zero must be dropped from the sample
when the equation is estimated by OLS with log-linearization, as logged value of zero is not defined.
We can deal with this zero trade value problem when estimating the equation by PPML. Therefore,
8 For instance, Santos Silva and Tenreyro (2006) emphasize that when a log-linearized model such as the gravity model is estimated by OLS, heteroskedasticity affects both consistency and efficiency. They recommend using poisson pseudo-maximum likelihood (PPML) in estimating the log-linearized model.

7
we also conduct PPML estimations and show mainly these results.9
To investigate the effects of FTAs on trade by major products, we also estimate the same
equation by using trade values by product. As mentioned in Section 2, major products examined in
our study are (1) agricultural products, (2) chemical products, (3) textile products, (4) metal products,
(5) general machinery, (6) electric machinery, (7) transport equipment, and (8) precision machinery.
The effects of FTAs may be different across agreements or countries as mentioned in
Section 1. Thus, we estimate the effects of Japan’s FTAs on bilateral trade with individual FTA
partners separately by specifying the equation as follows:
𝑇𝑟𝑎𝑑𝑒!" = exp 𝛼!𝐹𝑇𝐴!"!
!∈!"#$%&#'
+ 𝛽! ln𝐺𝐷𝑃!! + 𝛽! ln𝐺𝐷𝑃𝑝𝑐!" + 𝛽!𝑊𝑇𝑂!"
+ 𝛿!! + 𝛿!! + 𝜀!" ,
(2)
where 𝐹𝑇𝐴!"! is a dummy variable of Japan’s FTA with partner 𝑘 in year 𝑡. Other variables are
the same as equation (1). We estimate equation (2) by OLS and PPML for both aggregate trade and
trade by major products.
In addition, the trade expansion effects may increase after the enactment of FTA over time.
To explore the possible dynamic effects, we also estimate the following equation,
𝑇𝑟𝑎𝑑𝑒!" = exp 𝛼!Δ𝐹𝑇𝐴!,!!!
!
!!!!
+ 𝛼!𝐹𝑇𝐴!,!!! + 𝛽! ln𝐺𝐷𝑃!" + 𝛽! ln𝐺𝐷𝑃𝑝𝑐!"
+ 𝛽!𝑊𝑇𝑂!" + 𝛿!! + 𝛿!! + 𝜀!" ,
(3)
where Δ𝐹𝑇𝐴!,!!! is a dummy variable taking one if the FTA with the country 𝑗 entered into force 𝑠
year(s) before year 𝑡, and 𝐹𝑇𝐴!,!!! is a dummy variable taking one if the FTA has been effective for
seven years or longer before year 𝑡. Here, we consider the possible dynamic trade expansion effects
from one year before to six years after the enactment, and assume that the effects are constant after
seven years.
So far, we explained the estimation method by using dataset of Japan’s trade only.
However, Japan's FTA partners may increase trade values with the rest of the world around the time
when their FTAs with Japan entered into force. In this case, the increased trade values must be
attributed to their unilateral policies instead of the FTA with Japan. To deal with such a problem, we
9 PPML with fixed effects is computationally demanding. In this paper, we use the Stata command ppmlhdfe written by Correia, Guimarães, and Zylkin (2019a,b). See their papers for the detailed procedure.

8
investigate the effects of Japan’s FTAs by using trade data including both Japan’s trade and
third-country trade. We follow Baier and Bergstrand (2007) and Yotov, Piermartini, Monteiro, and
Larch (2016) and estimate the following equations (4) to (6), which correspond to equations (1) to (3),
respectively:
𝑇𝑟𝑎𝑑𝑒!"# = exp 𝛼!"#"$%𝐹𝑇𝐴!"#
!"#"$% + 𝛼!"#"$%𝐹𝑇𝐴!"#!"#"$% + 𝛼!𝐹𝑇𝐴!"#!
+ 𝛽!𝐶𝑈!"# + 𝛽!𝑃𝑆𝐴!"# + 𝛿!"! + 𝛿!"! + 𝛿!"! + 𝜀!"#
(4)
𝑇𝑟𝑎𝑑𝑒!"# = exp 𝛼!"#"$%&𝐹𝑇𝐴!"#
!"#"$%! + 𝛼!"#"$%!𝐹𝑇𝐴!"#!"#"$%!
!∈!"#$%&#'
+ 𝛼!𝐹𝑇𝐴!"#! + 𝛽!𝐶𝑈!"# + 𝛽!𝑃𝑆𝐴!"# + 𝛿!"! + 𝛿!"! + 𝛿!"! + 𝜀!"!
(5)
𝑇𝑟𝑎𝑑𝑒!"# = exp 𝛼!
!"#"$%Δ𝐹𝑇𝐴!",!!!!"#"$% + 𝛼!
!"#"$%Δ𝐹𝑇𝐴!",!!!!"#"$%
!
!!!!
+ 𝛼!!"#"$%𝐹𝑇𝐴!",!!!
!"#"$% + 𝛼!!"#"$%𝐹𝑇𝐴!",!!!
!"#"$% + 𝛼!𝐹𝑇𝐴!"#!
+ 𝛽!𝐶𝑈!"# + 𝛽!𝑃𝑆𝐴!"# + 𝛿!"! + 𝛿!"! + 𝛿!"! + 𝜀!"#
(6)
where 𝑇𝑟𝑎𝑑𝑒!"# is the aggregate or by-product trade value from country 𝑖 to country 𝑗 in year 𝑡.
𝐹𝑇𝐴!"#!"#"$% and 𝐹𝑇𝐴!"#
!"#"$% in equation (4) are FTA dummies and equal to one if Japan (as an
exporter/importer) and the other country of a country-pair are the members of the same FTA in year 𝑡.
The FTA dummies are decomposed into those by partners in equation (5) when we focus on
heterogeneity of FTAs across partners if any. On the other hand, the FTA dummies are decomposed
into those for a period of years from the enforcement in equation (6) when we focus on the dynamic
effects if any. 𝐹𝑇𝐴!"#! is a dummy variable and equal to one if both countries of a country-pair,
which are other than Japan, are the members of the same FTA in year 𝑡. 𝐶𝑈!"# is equal to one if
both countries are the member of the same customs union. Similarly, 𝑃𝑆𝐴!"# is a partial scope
agreement dummy. 𝛿!"! is a country-pair fixed effect and reflects all time-invariant factors that affect
the bilateral trade values, such as distance, language, and the historical relationship between two
countries. This country-pair fixed effect corresponds to the country fixed effect in equations (1) to
(3). 𝛿!"! is an exporter-year fixed effect and reflects production capacity of the exporter, outward multilateral resistance, and unilateral trade policies such as WTO accession. Finally, 𝛿!"! is an
importer-year fixed effect and reflects total expenditure of the importer, inward multilateral resistance,

9
and unilateral trade policies such as the reduction of MFN tariff rates. We can take the third-country
effects into account by including these fixed effects in the estimated equation. In all estimations,
standard errors are clustered by country pair.
3.2 Data
The trade data used in this paper are obtained from UN Comtrade. The sample period
extends from 1995 to 2016. We first construct the dataset of bilateral trade flows of all countries.
We then restrict the sample to Japan’s trade flows for the estimation of equations (1) to (3). While
we basically use the values reported by importers as trade values, many countries have missing data on
imports. Missing import values are replaced by the corresponding export data reported by the
exporters. As import values are reported on cost, insurance, and freight (cif) basis, while export
values are reported on free on board (fob) basis, we fill the gap by multiplying the export values by the
average gap of 25 percent.
We obtained GDP and GDP per capita from World Development Indicators. The data on
distance and WTO accession are taken from the Centre d’Etudes Prospectives et d’Informations
Internationales (CEPII) website, which is constructed by Head, Mayer, and Ries (2010) and Head and
Mayer (2014). The information on the trade policies is obtained from the Mario Larch Regional
Trade Agreements Database, which is constructed by Egger and Larch (2008).10
We include a country in our sample if the average of its trade as a share of world trade
during the period 1995-2016 exceeds 0.1 percent for at least one of aggregate trade and trade by eight
major products. Note that all FTA partners of Japan’s FTAs are included in our sample, regardless of
whether the trade share exceeds 0.1 percent or not. Our sample is composed of 106 countries
including Japan.11
4. Estimated results12
4.1 The effects of FTAs on aggregate trade and trade by major products
Table 3 presents the results for Japan’s trade, a) exports and b) imports, respectively, and
Table 4 those for world trade including not only Japan’s trade but also third-country trade at the
aggregate level. These tables show the results based on OLS and PPML estimations, though we
10 We manually corrected some errors of the data on Japan’s FTAs. 11 Table A.2 in the Appendix provides the list of countries in our analysis. Note that in the estimation using only Japan’s trade data, the number of countries is 104, excluding Japan and Syria, which does not have GDP data for the whole period of the analysis. In addition, some trade flows are dropped due to the availability of GDP data for some years, even though not the whole period. Moreover, some observations are dropped for the analysis of Japan’s trade by major products using PPML estimations with fixed effects if the corresponding trade data are zero for the whole period. Table A.3 in the Appendix provides a summary statistics of our dataset. 12 The results for trade by major products based on OLS estimations are available upon request.

10
basically discuss the results using PPML estimation with fixed effects; fixed effects are importer fixed
effects and year fixed effects for Japan’s exports, exporter fixed effects and year fixed effects for
Japan’s imports, and exporter-year fixed effects, importer-year fixed effects, and exporter-importer
fixed effects for word trade. Table 5 in turn shows only the sign of the coefficient for overall FTAs
with statistical significance for a comparison between PPML estimations with and without fixed
effects. Summarized figures, which are calculated based on the results using PPML equations with
fixed effects, are presented in Tables 6 and 7. Note that detailed results for major products are
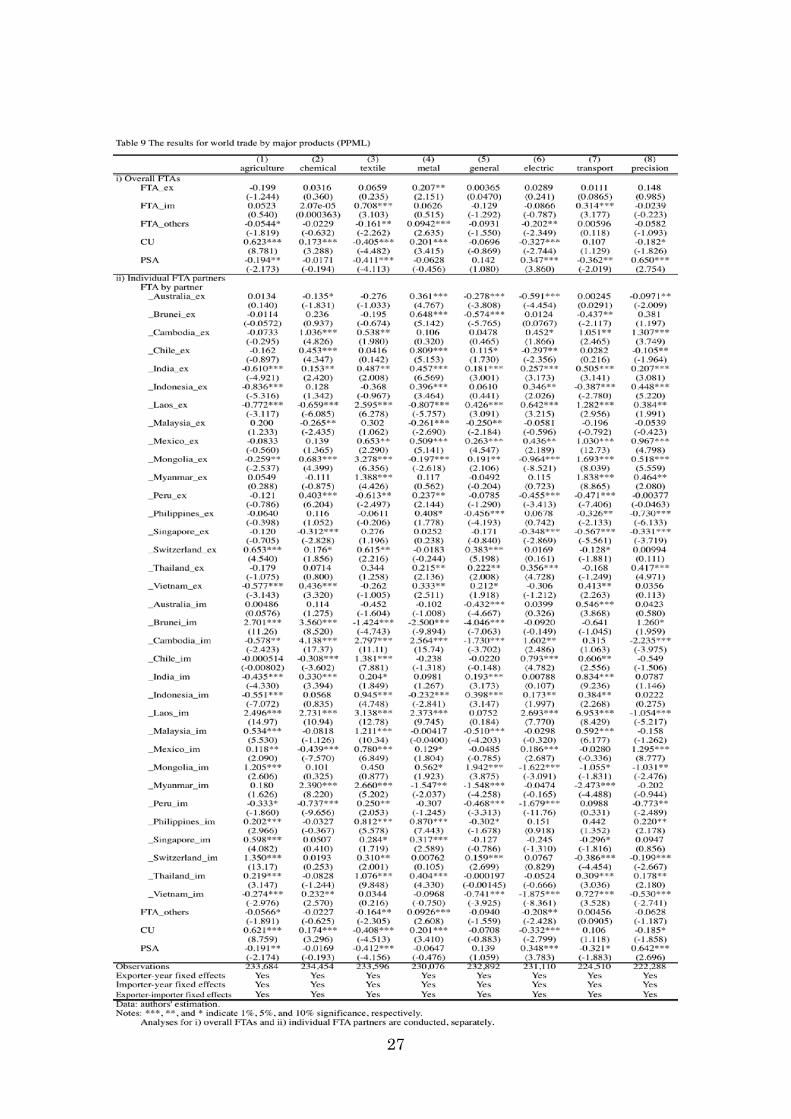
presented in Table 8 for Japan’s trade and Table 9 for world trade.13
== Table 3 ==
== Table 4 ==
All of these tables provide several interesting findings. First, most Japan’s FTA partners
seem to be natural trading partners, and the trade expansion effects of Japan’s overall FTAs are not
observed at the aggregate level. The estimated coefficients for Japan’s overall FTAs are positive and
statistically significant in all cases of the analysis of Japan’ trade for all products and major products,
except the case of imports in transport equipment, when estimations do not include fixed effects
(Table 5). The positive coefficients with statistical significance, however, disappear at the aggregate
level when estimations include fixed effects, though the positive coefficients are observed for some
products; textile and metal for exports and agriculture, chemical, textile, transport equipment, and
precision machinery for imports.14 Moreover, in the analysis of world trade with fixed effects, the
coefficients for Japan’s overall FTAs turn out to be statistically insignificant at the aggregate level.
At the product level, the coefficients are positive and statistically significant only for metal exports
and imports in textile and transport equipment. These results imply that Japan’s trade with some
FTA partners indeed increased, but the trade expansion effect of Japan’s overall FTAs was not
observed for aggregate trade and most products once fixed effects are controlled. Rather, most
Japan’s FTA partners are likely to be natural trading partners.
== Table 5 ==
Second, the impacts of FTAs on trade at the aggregate level are heterogeneous among FTA
partners, and Japan has the trade creation effects of FTAs on bilateral trade with some FTA partners,
while it does not on trade with others. As mentioned above, we could not observe the trade creation
13 See Table A.4 in the Appendix for a summary of the results of FTAs by all products/major products and by overall FTAs/individual FTA partners. 14 The result for the transport equipment was insignificant in the estimation without fixed effect.

11
effects at the aggregate level for either exports or imports when all Japan’s FTA partners are treated
together as one variable (overall FTAs). When the impacts of FTAs are analyzed by distinguishing
FTA partners, however, the estimated coefficients for Japan’s FTAs become positive and statistically
significant for some FTA partners even if estimations include fixed effects. In the analysis of Japan’s
trade at the aggregate level, for instance, coefficients on 12/11 out of 17 FTA partners, that is, more
than half of the FTA partners, are positive and significant for exports/imports, respectively. These
findings indicate that Japan’s FTAs have the positive impacts on its bilateral trade with some FTA
partners at the aggregate level.
On the other hand, the coefficients are negative and statistically significant at the aggregate
level when estimations include fixed effects for the following FTA partners: Malaysia, the Philippines,
and Singapore for exports (Table 3a) and Indonesia, Mongolia, the Philippines, and Singapore for
imports (Table 3b). Japan’s FTAs with these countries are likely to have negative impacts on Japan’s
trade as a whole. Note that the coefficients for Japan’s FTA are found to be positive and statistically
significant for Malaysia, the Philippines, and Singapore in the analysis of Japan’s exports without
controlling fixed effects. Thus, Japan’s exports to these countries indeed increased after the
enactment of FTAs considering their economic condition etc, but the trade creation effects
disappeared, and rather exports decreased after the enactment once the trend of Japan’s exports to
them is considered.
Third, the robustness of the trade creation effects of FTAs on Japan’s exports at the
aggregate level holds for nine out of 17 FTA partners, i.e., Australia, Cambodia, Chile, India,
Indonesia, Mexico, Myanmar, and Thailand, and Vietnam. The results by individual FTA partners
change when third-country trade is incorporated into the analysis. Regarding aggregate exports, the
coefficients are positive and statistically significant for around 70 percent of Japan’s FTA partners
(12/11 out of 17 FTAs) in the analysis without/with considering third-country trade, and are positive
and statistically significant for about half (nine out of 17) in both analyses with and without
considering third-country trade (Table 6a); nine FTA partners are countries mentioned above (Tables
3a and 4). These results suggest the robustness of the trade expansion effects of FTAs on aggregate
exports to these FTA partners. On the other hand, the coefficients become insignificant for three
FTA partners (Brunei, Peru, and Switzerland), though they are significantly positive in the analysis
without considering third-country trade. These findings imply that the trade creation effect on
aggregate exports does not exist for these FTA partners when a trend of their trade with other
countries is considered because FTA partners’ trade with countries other than Japan expanded more
significantly in these cases. Note that the negative coefficient became insignificant for the
Philippines when third-country trade is considered, while the coefficients are still significantly
negative for Malaysia and Singapore. As discussed in Section 2, Japan’s exports to these two
countries indeed declined.

12
== Table 6 ==
Fourth, the robustness of the trade creation effect of FTAs on Japan’s aggregate imports is
confirmed only for Brunei, Cambodia, Laos, and Myanmar. Regarding aggregate imports, only
one-fourth of FTA partners (four out of 17 FTAs), i.e., Brunei, Cambodia, Laos, and Myanmar, have
statistically positive coefficients in both analyses with and without considering trade between third
countries, suggesting the robustness of the trade expansion effects of FTAs with these FTA partners
on aggregate imports (Tables 3b, 4, and 7). Unlike the case of exports, the coefficients become
insignificant for as many as six FTA partners (Australia, Chile, India, Mexico, Peru, and Switzerland).
These results indicate that for these FTA partners, the trade creation effect does not exist when a trend
of their trade with other countries is considered because FTA partners expanded their trade with other
countries more significantly than Japan. Interestingly, the negative coefficients became insignificant
for Indonesia and Singapore when third-country trade is considered. In other words, the negative
effects of FTAs on aggregate imports to these FTA partners disappear when a trend of their trade with
other countries is considered. In addition, the coefficient changes from negative to positive with
statistical significance for the Philippines, while it changes from positive to negative for Vietnam.
The negative effects on imports are robust for Mongolia, regardless of whether third-country trade is
considered or not.
== Table 7 ==
Let us discuss main features by major products. First, the robustness of the trade creation
effects of Japan’s overall FTAs is observed only for a limited number of products. The coefficient
for Japan’s overall FTAs is positive and statistically significant in both analyses with and without
incorporating third-country trade only in one product for exports and two products for imports; metal
exports and textile and transport equipment imports (Tables 8 and 9). Rather, the coefficient is
insignificant in both analyses for most sectors or two-thirds of the major products (six out of eight
products) (Tables 6b and 7b). Although it is significantly positive for textile products in the analysis
on Japan’s exports and for agriculture products, chemical products, and precision machinery in the
analysis on Japan’s imports, their positive effects of FTAs disappear when the analysis considers
third-country trade (Tables 8 and 9).
== Table 8 ==
== Table 9 ==

13
Second, the results by products and by FTA partners change complicatedly in many cases,
depending on whether third-country trade is incorporated in the analysis or not. Regardless of
exports or imports, the positive impacts are observed in around 50 percent/40 percent of the cases (the
number of FTA partners by products) when the analysis is conducted without/with considering
third-country trade, respectively (Tables 6b and 7b). The results, however, change in about 40
percent of the cases, or 55/56 out of 136 for exports/imports, when third-country trade is considered,
while they do not for the rest. The patterns of changes have a variety: the coefficient became
insignificant from positive or negative with statistical significance, it became positively significant or
negatively significant, or it changed to the opposite sign with statistical significance from positive to
negative or from negative to positive. The positive effects are robust only in about one-thirds of the
cases, 45/43 out of 136 for exports/imports, suggesting the robustness of the trade creation effect
(Tables 6b and 7b); one/nine FTA partners for agriculture products, seven/six FTA partners for
chemical products, seven/six FTA partners for textile products, nine/six FTA partners for metal
products, seven/four FTA partners for general machinery, six/four FTA partners for electric machinery,
three/six FTA partners for transport equipment, and five/two FTA partner for precision machinery for
exports/imports, respectively. On the other hand, the negative effects are robust in 25/20 out of 136
cases (18 percent/15 percent) for exports/imports, implying the robustness of the negative impacts in
these cases.15
Regarding control variables other than dummies for Japan’s FTAs in the analysis for Japan’
trade using PPML estimations with fixed effects, the coefficient for GDP is positive and statistically
significant for aggregate exports and imports, as expected, but is not necessarily so for trade in major
products; positive and significant only for agriculture, metal, general machinery, and transport
equipment exports and metal imports and even negative and significant for general machinery imports.
The coefficient for the WTO dummy variable is positive and statistically significant for aggregate
trade and trade in most of the major products, as expected. As for GDP per capita, the coefficient is
negative for aggregate exports and positive for aggregate imports, as expected, but the results vary
among products; significant coefficients are negative for agriculture exports and positive for chemical
and general machinery imports. Regarding dummy variables for other FTAs, customs union (CU),
and partial scope agreement (PSA) in the analysis of world trade using PPML estimations with fixed
effects, only CU is significantly positive for aggregate trade. The corresponding results by major
products show both directions of the effects. Significant coefficients are positive for metal products
15 The robustness of the negative impacts on exports/imports are observed in 25/20 cases: four/one FTA partners for agriculture products, four/three FTA partners for chemical products, no/two FTA partners for textile products, three/two FTA partners for metal products, four/six FTA partners for general machinery, three/two FTA partners for electric machinery, five/two FTA partners for transport equipment, and two/two FTA partners for precision machinery for exports/imports, respectively.

14
and negative for agriculture products, textile products, and electric machinery for other FTAs; positive
for agriculture, chemical, and metal products and negative for textile products, electric machinery, and
precision machinery for CU; and positive for electric machinery and precision machinery and negative
for agriculture products, textile products, and transport equipment for PSA.
4.2 The dynamic effects of FTAs
In the following, we focus on the dynamic effects of FTAs by the period of year(s) since
the year of enactment of FTAs. Tables 10 and 11 present the results by the period from the
enforcement for Japan’s trade for all products as a whole and major products, respectively, and Table
12 those for world trade including not only Japan’s trade but also third-country trade. Both results
based on OLS and PPML estimations are shown only at the aggregated level, though we basically
discuss the results using PPML estimation with fixed effects. Figure 1 in turn plots the statistically
significant coefficient for Japan’s FTAs for cases in which the results using PPML estimations with
fixed effects confirm the positive impacts (see Table 5); no case for aggregate trade and some cases
for trade by major products, i.e., two products for Japan’s exports, five products for Japan’s imports,
one products for world trade (exports), and two products for world trade (imports).
== Table 10 ==
== Table 11 ==
== Table 12 ==
== Figure 1 ==
The results demonstrate that the trade creation effects increase gradually for some of the
major products.16 When importer fixed effects are not controlled in the analysis of Japan’s exports,
the positive and statistically significant coefficients tend to become large gradually for all products as
a whole and some of the major products, i.e., textile products, metal products, general machinery,
electric machinery, and precision machinery.17 Such a trend, however, remains to be observed only
for textile and metal products when estimations include fixed effects (Table 11a and Figure 1).
Similarly, when exporter fixed effects are not controlled in the analysis of Japan’s imports, the
positive and statistically significant coefficients are likely to increase gradually for all products as a
whole and some of the major products, i.e., agriculture products, chemical products, metal products,
16 There is no case with statistical significance in the analysis of aggregate exports/imports (Table 10). 17 See Table A.5 in the Appendix for by-product results using PPML estimation without fixed effects.

15
general machinery, electric machinery, and precision machinery. The dynamic trade creation effects
of FTAs on imports, however, are observed only for some of them when estimations include fixed
effects: agriculture products, textile products, transport equipment, and precision machinery (Table
11b and Figure 1). Note that the positive effects do not increase gradually for chemical products,
though the coefficient is positive and significant throughout the whole period.
Moreover, when third-country trade is incorporated into the analysis using PPML
estimations with fixed effects, the positive effects on exports tend to increase gradually only for metal
products, and the positive effects on imports are likely to become large gradually only for textile
products and transport equipment (Table 12 and Figure 1). They suggest the robustness of the
dynamic trade creation effects for these three cases. Note that these cases are the same as the cases
with positive and significant coefficients in the analysis of PPML estimations including fixed effects
shown in Table 8.
5. Conclusion
This paper has examined if Japan’s FTAs contributed to an expansion of its bilateral trade
with FTA partners by using gravity model estimation. We conducted the analysis by examining the
trade data from the following three aspects; aggregated trade by FTA partners (17 FTA partners),
disaggregated trade (eight products) for overall FTAs, and disaggregated trade by FTA partners. For
the analysis, we used two different sets of trade data; one consisting of only Japan’s trade and the
other global trade including trade between the third countries. In addition, we also analyzed the
impacts of Japan’s FTAs from the dynamic perspectives by incorporating the information on the
passage of time since the enactment of FTAs.
Our analysis using only Japan’s trade data at the aggregate level demonstrated that the
effects of Japan’s FTAs are heterogeneous among the FTA partners, and that the positive effects on
exports/imports are observed for more than half of FTA partners, i.e., 12/11 out of 17 FTA partners.
The results, however, also demonstrated that some cases with those positive effects disappear when
the analysis uses global trade data. Considering that the cases where significantly positive
coefficients of FTAs on trade are observed for the results using both Japan’s and global trade data as
indicating the trade creation effect, we found that Japan’s FTAs have expected trade creation effects
for 53 percent of the cases (nine out of 17 FTA partners) for aggregate exports and 24 percent (only
four FTA partners) for aggregate imports, 13 percent/25 percent of the cases (one/two out of eight
products) for disaggregated exports/imports, and approximately one-thirds of the 136 cases for
disaggregated trade (exports or imports) by FTA partners. For some of the cases with positive
impacts, the effects are shown to have increased over time.

16
Ineffectiveness of Japan’s FTAs in expanding Japan’s trade with some FTA partners (or
some products or some products by FTA partners) may be attributable to several factors. One
possibility is that trade with some FTA partners are not increased due to factors other than trade. But
such issues are beyond our scope. Other factors are related to concerns that deter the use of FTAs.
They include, for instance, the lack of knowledge about the FTAs by exporters. Even when the
exporters have a knowledge on FTAs, they may not use FTAs if they feel that the procedure for the
use of FTAs is complicated and/or time consuming, incurring costs. Also, there may be less
incentive for firms to use FTAs if FTA preferential margins (MFN tariff rate – FTA tariff rate) are
small, and it would be difficult to satisfy the conditions to use FTAs if rules of origin (ROOs) are
more restrictive. Note that Ando and Urata (2018) found that small preferential margins or
restrictive ROOs deter the use of FTAs in the case of Japan’s imports from the analysis using Japan’s
trade data. Our analysis could be extended by explicitly incorporating such information in the global
trade database, though it is not easy to obtain the necessary data for global trade.
Based on these observations, we can argue that the Japanese government can help
exporters/potential exporters use FTAs by providing necessary information about and assistance for
the use of FTAs. Furthermore, the government needs to apply low FTA tariffs or zero FTA tariffs by
eliminating tariff, and simplify the procedure for obtaining the certificate of origin (COOs). In this
regard, self-certification system, which has been introduced in recent FTAs such as the CPTPP instead
of third-party certification, are likely to reduce the cost of obtaining COOs, to realize the trade
creation effect.
Reference
Ando, Mitsuyo. 2007. Impacts of Japanese FTAs/EPAs: Preliminary Post Evaluation”. The
International Economy 11, pp. 57-83.
Ando, Mitsuyo, and Shujiro Urata. 2011. Impacts of the Japan–Mexico EPA on Bilateral Trade. RIETI
Discussion Paper No. 11-E-020. Tokyo: Research Institute of Economy, Trade and Industry.
Ando, Mitsuyo, and Shujiro Urata. 2015. Impacts of Japan’s FTAs on Trade: The Cases of FTAs with
Malaysia, Thailand, and Indonesia. RIETI Discussion Paper No. 15-E-104. Tokyo: Research
Institute of Economy, Trade and Industry.
Ando, Mitsuyo, and Shujiro Urata. 2018. Determinants of FTA Utilization for Japan's Imports:
Preferential Margins and Restrictiveness of Rules of Origin. RIETI Discussion Paper No.
18-E-78. Tokyo: Research Institute of Economy, Trade and Industry.
Baier, Scott L., and Jeffrey H. Bergstrand. 2007. Do Free Trade Agreements Actually Increase
Members’ International Trade? Journal of International Economics 71(1):72–95.

17
Baier, Scott L., Jeffrey H. Bergstrand, and Matthew W. Clance. 2018. Heterogeneous Effects of
Economic Integration Agreements. Journal of Development Economics 135(1):587–608.
Baier, Scott L., Yoto V. Yotov, and Thomas Zylkin. 2019. On theWidely Differing Effects of Free
Trade Agreements: Lessons from Twenty Years of Trade Integration. Journal of International
Economics 116(1):206–226.
Correia, Sergio, Paulo Guimarães, and Thomas Zylkin. 2019a. PPMLHDFE: Fast poisson estimation
with high-dimensional fixed effects. arXiv:1903.01690.
Correia, Sergio, Paulo Guimarães, and Thomas Zylkin. 2019b. Verifying the existence of maximum
likelihood estimates for generalized linear models. arXiv:1903.01633.
Egger, Peter, and Mario Larch. 2008. Interdependent Preferential Trade Agreement Memberships: An
Empirical Analysis. Journal of International Economics 76(2):384–399.
Head, Keith, and Thierry Mayer. 2014. Gravity Equations:Workhorse, Toolkit, and Cookbook. In:
Handbook of International Economics, vol. 4, edited by Gita Gopinath, Elhanan Helpman, and
Kenneth Rogoff, pp. 131–195. Amsterdam: Elsevier B.V.
Head, Keith, Thierry Mayer, and John Ries. 2010. The Erosion of Colonial Trade Linkages After
Independence. Journal of International Economics 81(1):1–14.
Kohl, Tristan. 2014. Do We Really Know That Trade Agreements Increase Trade? Review of World
Economics 150(3):443–469.
Santos Silva, J. M. C., and Silvana Tenreyro. 2006. The Log of Gravity. Review of Economics and
Statistics 88(4):641–658.
Yamanouchi, Kenta. 2017. Nihon no Jiyuu Boueki Kyoutei (FTA) no Boueki Soushutsu Kouka [The
Trade Creation Effects of Japan’s Free Trade Agreements]. Tokyo: Mitsubishi Economic
Research Institute (in Japanese).
Yamanouchi, Kenta. 2019. Heterogeneous Impacts of Free Trade Agreements: The Case of Japan.
Asian Economic Papers, 18(2):1-20.
Yotov, Yoto V., Roberta Piermartini, José-Antonio Monteiro, and Mario Larch. 2016. An Advanced
Guide to Trade Policy Analysis: The Structural Gravity Model. Geneva: World Trade
Organization.

18

19

20

21

22

23

24

25

26
27

28

29

30

31

32

33

34

35

36

37

38