, göran journal of agricultural and food...
TRANSCRIPT
This is an author produced version of a paper published in
Journal of agricultural and food chemistry
This paper has been peer-reviewed but may not include the final publisher
proof-corrections or pagination.
Citation for the published paper:
Hossain, Shakhawat; Bergkvist, Goran; Berglund, Kerstin; Glinwood,
Robert; Kabouw, Patrick; Martensson, Anna; Persson, Paula. (2014)
Concentration and Time Dependent Effects of Isothiocyanates Produced
from Brassicaceae Shoot Tissues on the Pea Root Rot Pathogen
Aphanomyces euteiches. Journal of agricultural and food chemistry.
Volume: 62, Number: 20, pp 4584-4591.
http://dx.doi.org/10.1021/jf501776c.
Access to the published version may require journal subscription.
Published with permission from: ACS publications.
Epsilon Open Archive http://epsilon.slu.se
1
Concentration and Time Dependent Effects of Isothiocyanates Produced from
Brassicaceae Shoot Tissues on the Pea Root Rot Pathogen Aphanomyces euteiches
Shakhawat Hossaina*
, Göran Bergkvista, Kerstin Berglund
b, Robert Glinwood
a, Patrick
Kabouwc, Anna Mårtensson
b and Paula Persson
a
aSwedish University of Agricultural Sciences, Department of Crop Production Ecology,
P.O. Box 7043, SE-750 07 Uppsala, Sweden.
bSwedish University of Agricultural Sciences, Department of Soil and Environment, P.O.
Box 7014, SE-750 07 Uppsala, Sweden.
cDepartment of Terrestrial Ecology, Netherlands Institute of Ecology (NIOO-KNAW),
Boterhoeksestraat 48, 6666 GA Heteren, The Netherlands.
*Corresponding author (Tel: +46-1867-2349. Fax: +46-1867-2890. [email protected])
2
Abstract: Isothiocyanates (ITCs) hydrolysed from glucosinolates (GSLs) in Brassicaceae 1
tissue are toxic to soil organisms. In this study, the effect of aliphatic and aromatic ITCs 2
from hydrated dry Brassicaceae shoot tissues on mycelium and oospores of the pea root 3
rot pathogen Aphanomyces euteiches was investigated. The profile and concentrations of 4
GSLs in two test-Brassicaceae species, Sinapis alba and Brassica juncea, and the ITCs 5
from the dominant hydrolysed parent GSLs were monitored. The concentrations of 6
dominant ITCs and pathogen exposure time were evaluated in in vitro experiments. The 7
greatest effect on the pathogen was observed from aliphatic ITCs hydrolysed from B. 8
juncea tissue, and the effect depended on the ITC concentration and exposure time. ITCs 9
were more effectively hydrolysed from B. juncea GSLs than from S. alba GSLs, i.e. the 10
ITC/GSL ratio was higher in B. juncea than in S. alba tissue, giving a different release 11
pattern. The release of phenylethyl ITC, which was common to both species, followed a 12
similar pattern to the dominant ITC in each crop species. This suggests that traits other 13
than GSL content, e.g. plant cell structure, may affect the release of ITCs and should 14
therefore influence the choice of species used for bio-fumigation purposes. 15
16
Keywords: Brassicaceae, glucosinolate, isothiocyanate, Aphanomyces euteiches, pea 17
root rot 18
19
20
21
22
23
3
INTRODUCTION 24
Pea root rot caused by the pathogen Aphanomyces euteiches Drechs is a serious problem 25
in pea production worldwide.1-3
The pathogen can persist in the soil for long periods 26
without a host plant due to the thick protective cell walls of the Aphanomyces oospores. 27
When oospores are stimulated to germinate by pea root exudates4, a short mycelium 28
strand and a sporangium is produced. The sporangium releases zoospores that attack the 29
pea roots.5 Pea root rot is difficult to control as there are no available pea cultivars with 30
an acceptable level of resistance.6 Further, synthetic fungicides may have a negative 31
environmental impact, and certain agents have been prohibited, for example within the 32
European Union7. The commonly recommended way to control A. euteiches is therefore 33
to leave intervals (6-8 years) between pea crops in the rotation.8 34
Many plants of the family Brassicaceae (brassica) can suppress soil-borne organisms 35
when grown as cover crops, or when added as plant residues to infested soil.9-11
In field 36
studies, Sinapis alba (white mustard) reduced the development of Aphanomyces pea root 37
rot when used as green manure. This reduction was enhanced when white mustard was 38
used for a second consecutive year.12
Studies under greenhouse conditions showed that 39
incorporating cabbage tissue after growth in contaminated soil gave close to a 10-fold 40
reduction in pea root rot disease severity.13
Suppressive effects of brassica tissues are 41
associated with the glucosinolate class of chemicals (GSLs) present in the tissues.10
The 42
bio-fumigation concept in agricultural systems was introduced by Australian scientists in 43
the 1990s and includes practices to relieve the pressure of soil pests and pathogens by the 44
use of brassica crops.14
The concept is based on the toxic volatile compounds produced 45
from hydrolyzed GSLs.10,13,15,16
When brassica crop tissues are damaged, GSLs are 46
4
hydrolysed by myrosinase to form volatile isothiocyanates (ITCs), thiocyanates, water-47
soluble nitriles and epithionitriles.10,17
The composition and quantity of the produced 48
substances depend on the parent GSL. The type and concentration of GSLs vary between 49
brassica species, cultivars and vegetative parts and are also influenced by plant 50
development stage.16,18,19
The GSLs are classified as aliphatic, aromatic or indolyl based 51
on their chemical structure.10,20
Isothiocyanates suppress a wide range of organisms, 52
including the soil-borne pathogen A. euteiches.21
A study has demonstrated that volatile 53
compounds from decomposing cabbage tissues inhibit hyphal growth of A. euteiches, and 54
that the pathogen is unable to grow further when placed in fresh air after exposure, 55
although the active substance was not specified9. The suppressive effects depend on the 56
composition and concentration of ITCs.22
The chemical structure of ITCs influences their 57
mode of action meaning that different ITCs may show varying levels of toxicity at the 58
same concentration.23-25
An aliphatic structural group attached to the nitrogen in the basic 59
ITC structure generally confers greater toxicity than an aromatic structure.26
Generally, 60
the toxicity of ITCs decreases as the size of the organic group increases.27,28
Aliphatic 61
ITCs bind directly with protein molecules inside cells and inhibit their activity whereas 62
aromatic ITCs first interact with the cell membrane changing its electrophilic properties 63
before entering the cell23
and reducing cell activity.29
64
Many different brassica-derived materials have been used to study aspects of bio-65
fumigation, such as fresh plant tissues, rape seed meal, freeze dried plant tissues and oil 66
extracts, but pure ITCs have also been used.18,30-32
Shoot tissue comprises the greater part 67
of the brassica plant material when it is used for bio-fumigation in practice. Here, we 68
5
evaluate a simple, reproducible system for studying shoot tissue effects on a plant 69
pathogen in vitro, using low temperature drying of the plant material.13,33
70
Our overall aim was to discover how brassica plant tissues can be used for bio-71
fumigation to reduce the occurrence of root rot on peas caused by A. euteiches. Our 72
specific objectives were to compare crop species with different GSL compositions to 73
generate knowledge on the choice of brassica crop for bio-fumigation in the control of 74
pea root rot. We tested the hypotheses that 1) ITCs from hydrolysed aliphatic-GSLs in B. 75
juncea shoot tissue are more effective than ITCs from aromatic-GSLs in S. alba shoot 76
tissue at reducing the ability of A. euteiches oospores to cause pea root rot 2) the lethal 77
effect of aliphatic ITCs from shoot tissues on the growth of A. euteiches depends on the 78
concentration of ITCs and time of pathogen exposure and 3) the release patterns of ITCs 79
from B. juncea and S. alba are different and influence the suppressive effects on A. 80
euteiches. 81
82
MATERIALS AND METHODS 83
Plant materials. Air dried shoot tissues of two GSL-containing plant species, Brassica 84
juncea (cv. Pacific Gold) and Sinapis alba (cv. Architect), a non-GSL plant species, 85
Secale cereale (cv. Amilo) and a water control were compared for their effect on 86
oospores and mycelium of A. euteiches. The effect of volatile compounds produced from 87
hydrated shoot tissues was studied in in vitro experiments. The most effective plant 88
species was chosen for dose and exposure-time experiments, compared with the effect of 89
chemical solutions of the dominant ITCs from the two brassica species. The composition 90
6
of GSLs in B. juncea and S. alba dry shoot tissues and of ITCs produced from hydrated 91
tissues were analysed. 92
93
Shoot tissue production. Three cover crops, S. alba, B. juncea and S. cereale were 94
grown in garden soil (Hasselfors Garden AB, Sweden) in the greenhouse. A complete 95
nutrient solution (Cederroth International AB, Sweden) was applied at regular intervals 96
together with additional (NH4)2SO4 to enhance GSL production. Shoot tissues were 97
harvested at soil level when B. juncea and S. alba reached the flowering stage. The 98
tissues were dried at 35 °C for 72 h then ground separately four times at 6000 rpm to a 99
fine powder. The ground shoot tissues were stored in air-tight containers and kept in a 100
dark and dry place until use. 101
102
Aphanomyces euteiches inoculum. Aphanomyces euteiches strain 5035:2A was used in 103
all experiments (obtained from F. Heyman, Department of Forest Mycology and Plant 104
Pathology, Swedish University of Agricultural Sciences, Uppsala, Sweden). The strain 105
was maintained on corn meal agar (CMA) (Oxoid Ltd., UK) at 6 °C and was used for soil 106
inoculation34,35
. For the production of oospore inoculum, the A. euteiches strain was 107
cultured in oat meal broth for four weeks. It was homogenised, oospore concentration 108
was calculated then it was mixed with talcum powder (VWR International AB, Sweden) 109
and dried. The dry inoculum material was sieved through a 1-mm mesh net and stored at 110
4 °C until use. 111
112
7
Field soil. Soil was collected from an agricultural field in Giresta, Enköping, Sweden, 113
and tested for the absence of A. euteiches. The soil consisted of 46% clay, 48% silt, 2% 114
sand and 4% organic matter. The organic matter content was estimated by loss on 115
ignition. The soil contained 1.5 mg N/mL and the pH (H2O) was 7.7. The soil was sieved 116
through a 0.6-cm mesh, stored at 4 °C with soil moisture content maintained at 21% 117
during storage. For some experiments the soil was sterilised by autoclaving twice at 121 118
°C for 30 min. 119
120
Oospore volatile exposure and bioassay. One gram of dry shoot tissue of B. juncea, S. 121
alba and S. cereale was transferred separately to 220 mL plastic cups (8.9 cm diameter). 122
Four grams of talcum powder containing about 2.8 X 10⁴ oospores was spread 123
homogenously on a filter paper placed in a 9 cm diameter sieve (mesh 1mm) and placed 124
on top of the cup. At the start of the experiment 5 mL sterilized de-ionized water was 125
added to the tissue and another plastic cup was immediately placed upside down on top of 126
the sieve as a lid. The container was sealed with several layers of Parafilm (Sigma-127
Aldrich, Sweden AB) and placed in the dark at 24 °C for ten days. Sterilized de-ionised 128
water was used as control and three replicates per treatment were performed. 129
After 10 days of incubation, the oospore-talcum powder was removed from the 130
container and 0.8 g of the 4 g treated powder was mixed with 80 mL sterilized and non-131
sterilized soil. Four sub-samples, 20 mL each, of the two infested soils were transferred to 132
85 mL pots. One pea seed (cv. Clare) was sown on top of the infested soils in each pot 133
and was covered with an additional 5 mL non-infested soil. The pots were placed in a 134
greenhouse with light:dark period 14:10 h, temperature 24/19±2 °C and relative humidity 135
8
(RH) 85±5%. Soil moisture was adjusted daily to field levels in order to obtain optimal 136
infection conditions. All pea seedling roots were evaluated for root rot disease severity 137
three weeks after sowing. Each pea seedling was assigned a DSI (Disease Severity Index) 138
value based on the mean disease symptoms of the individual pea seedlings in the four 139
tubes representing each experimental unit. The scale for DSI ranges from 0 to 100 (%), 140
but each individual plant can only be assigned one of five scores for disease severity: 0% 141
= healthy plant; 25% = root slightly discoloured; 50% = root extensively discoloured but 142
not shrunken; 75% = root extensively discoloured and shrunken; 100% = root partly or 143
completely rotted or plant dead.36
144
145
In vitro exposure of mycelium to volatiles- effect of dose. Dry shoot tissue, 60 mg, 100 146
mg and 140 mg of B. juncea, S. alba and S. cereale was transferred separately to 220 mL 147
plastic cups and mixed with 5 mL sterilized, de-ionized water. A water control was 148
included and all treatments had three replicates. The doses were determined after a pilot 149
study with B. juncea shoot tissues in which a 140 mg dose completely inhibited pathogen 150
growth. A plug (7 mm diameter) from actively growing A. euteiches culture was placed 151
in the centre of a 9-cm CMA dish and placed as a lid on the top of cup immediately after 152
water was added to the dry plant tissues. Cup and dish were sealed with Parafilm and 153
incubated in a growth cabinet at 24 °C for four days. The colony diameter of A. euteiches 154
was measured on the lid daily using a measuring scale. After four days, the culture dish 155
lids were removed from the cups and placed in the same growth cabinet at 24 °C and 156
observed for further growth of A. euteiches. 157
158

9
In vitro exposure of mycelium to volatiles- effect of exposure time. Hydrated B. juncea 159
shoot tissue (140 mg) was used to produce volatile compounds which were exposed to an 160
actively growing A. euteiches plug (7 mm diameter) put on fresh CMA dishes, as in the 161
dose experiment described above. Three exposure times were used, 40, 80 and 120 162
minutes, with three replicates of each. After exposure, dishes were incubated at 24 °C and 163
the colony diameter of A. euteiches was measured daily using a measuring scale on the 164
lid. After four days, the culture dish lids were removed from the cups and placed in the 165
same growth cabinet at 24 °C and observed for further growth of A. euteiches. 166
167
Exposure with ITC chemical standards. An in vitro experiment was performed using 168
authentic chemical standards (CS) of volatile compounds produced from B. juncea and S. 169
alba tissues, identified as described below. Standard solution mixtures were designed to 170
give concentrations of volatile compounds that closely resembled those recorded from 171
hydrated dry shoot tissue by collecting volatile compounds from plant tissue and CS 172
under the same conditions and quantifying the major components by gas chromatography 173
(Table 1). The B. juncea chemical standard mixture (B.juncea-CS) contained allyl ITC 40 174
µg/µl (allyl ITC >98% purity, Sigma-Aldrich, Sweden AB) and phenylethyl ITC 2 µg/µl 175
(phenylethyl ITC 99% purity, Sigma-Aldrich, Sweden AB). The S. alba chemical 176
standard mixture(S.alba-CS) contained benzyl ITC 30 µg/µl (benzyl ITC 98% purity, 177
Sigma-Aldrich, Sweden AB) phenylethyl ITC 5 µg/µl and allyl ITC 0.2 µg/µl. All 178
chemical standard mixtures were dissolved in hexane. 179
One µl of each B.juncea-CS and S.alba-CS standard mixtures was placed in the centre 180
of a filter paper in a sealed plastic cup containing an actively growing A. euteiches 181
10
mycelium (7 mm plug) placed on a fresh CMA dish and incubated in the dark at 22 °C. 182
Hyphal growth was measured daily for four days using a measuring scale. The growth 183
was compared with the growth of an A. euteiches volatile-exposed culture where the 184
volatiles originated from 140 mg hydrated dried tissues of B. juncea and S. alba, using 185
water and hexane as control treatments. For details of ITC analyses, see below. 186
187
Glucosinolate analysis. Glucosinolates were extracted from ground shoot tissue.37
In 188
brief, GLSs were extracted from 100 mg of dry shoot tissue by 70% MeOH which was 189
heated to 90 °C to deactivate myrosinase and therefore avoid degradation of the GSLs. 190
The extracts were transferred to a DEAE-Sephadex 25 column (Sigma, St. Louis, MO, 191
USA) before de-sulfating. Desulfoglucosinolates were separated and identified using 192
HPLC with an acetonitrile/Milli-Q water gradient. GSL detection was performed with a 193
photodiode array detector with 229 nm wavelength. The correction factors at 229 nm to 194
calculate the concentrations of GSLs were followed.38,39
The peaks of 195
desulfoglucosinolates were identified by comparison with standards on the basis of 196
retention times and ultraviolet spectra. Different concentrations of sinigrin (2-propenyl) 197
(Acros Organics, Fair Lawn, NJ, USA) were used as external standard and extracted 198
following the same procedure as the shoot tissue. The levels of GSLs were calculated on 199
the basis of dry weight of tissues. 200
201
Isothiocyanate analysis. Ground shoot tissue (140 mg) was placed in a glass dish and 202
moistened with 5 mL Milli-Q water. The suspension was immediately placed under a bell 203
shaped glass vessel (380 mL) with two openings and sealed with bulldog clips at 24±2 °C 204
11
in the dark. Volatile compounds were collected by pulling air from outlet of the jar 205
through a glass liner containing Tenax TA (50 mg 60/80 mesh, Supelco, Bellefont, PA, 206
USA). 207
A positive pressure push-pull system was used, with charcoal-filtered air pushed 208
through an inlet into the vessel at 500 mL/min and pulled out through the adsorbent at 209
350 mL/min. The greater push rate prevented entry of contaminating volatiles. All 210
glassware and Teflon tubes (connecting air flow tubes) were washed with detergent, 211
distilled water and acetone and baked in an oven at 175 °C for at least 16 hours prior to 212
the entrainment. Charcoal filters and glass liners with Tenax TA were baked at 175 °C 213
and 220 °C respectively under N2 flow for 16 h. Volatiles were collected for periods of 214
10 min at 0-10, 30-40, 60-70 and 120-130 min after adding water to the tissue. The rest of 215
the time, the outlet of the glass vessel was open preventing the build-up of released 216
volatiles. 217
Concentrations of ITCs arising from the dosing of chemical standard (CS) solutions as 218
described above were determined by analysing one µl of either B.juncea-CS or S.alba-CS 219
mixtures put on a filter paper, placed inside a sealed plastic cup (220 mL). A glass liner 220
(with Tenax TA) was inserted through a hole in the plastic cup and air was pulled from 221
the cup at a flow rate of 350 mL/min. The aim was to sample at the peak concentration of 222
the major ITCs, which was after 60-70 min incubation for B.juncea-CS and 0-10 min for 223
S.alba-CS, as indicated by previous analysis of volatiles from B. juncea and S. alba plant 224
tissues. Volatiles were collected for 10 min and analysed by gas chromatography as 225
described below. 226
12
For quantification, collected volatiles were analysed by gas chromatography (GC) on a 227
Agilent 6890N with a flame ionization detector, equipped with an HP-1 column (100% 228
dimethyl polysiloxane, 50 m, 0.32 mm i.d. and 0.52 μm film thickness, J & W Scientific, 229
USA), and fitted with an Optic 3 thermal desorption system (Atas GL Intl., Veldhoven, 230
Netherlands). An internal standard, 50 ng of decane, was injected onto the glass liner 231
containing the sample prior to desorption. The liner containing the Tenax with absorbed 232
volatiles was placed directly into the injector and volatiles were thermally desorbed 233
starting at 30 °C for 0.5 min and rising at 16 °C/sec to 250 °C. The GC temperature 234
program was 30 °C for 3 min, 5 °C/min to 150 °C for 0.1 min then 10 °C/min to 250 °C 235
for 15 min, using hydrogen as carrier. The amount of each compound was calculated 236
relative to the internal standard. 237
For tentative compound identification, volatile samples from the treatments, B. juncea 238
hydrated plant tissue, B.juncea-CS mixture, S. alba hydrated plant tissue and S.alba-CS 239
mixture were collected as described above and analysed by coupled GC-mass 240
spectrometry using an Agilent 7890N GC coupled to an Agilent 5975C mass selective 241
detector (electron impact 70eV) fitted with an Optic 3 thermal desorption system (Atas 242
GL Intl., Veldhoven, Netherlands). The thermal desorption and GC oven temperature 243
programs were as described above. The carrier gas was helium with a flow rate of 1.3 244
mL/min. Volatile compounds were identified by comparison against a commercially 245
available library (National Institute of Standards and Technology, NIST 08, USA) and by 246
comparison of mass spectra and retention indices with commercially available authentic 247
standards where available (Sigma-Aldrich AB, Sweden). Where standards were 248
unavailable, in some cases the retention index (Kovats Index, KI) of the substance could 249
13
be matched with a previously published KI for the compound on the type of GC column 250
used in the current study (HP-1) (Figure 5). 251
252
ITC/GSL ratios. ITC/GSL ratios were calculated for selected GSLs. The GSL 2-253
propenyl was the dominant GSL in B. juncea shoot tissues, and p-hydroxybenzyl GSL 254
was dominant in S. alba shoot tissues. 2-phenylethyl was detected in both plant tissues as 255
a common GSL. The detected GSLs were recorded as µmol/g dry tissue in the GC 256
analysis (Table 2) and converted to µg for the selected GSLs using their molecular 257
weights. Estimated amounts of ITCs produced from their parent GSLs in hydrated plant 258
tissues during the initial 130 minutes were calculated (Figures 5 A & B). Total amounts 259
of each ITC (μg) produced in the initial 130 min of hydrolysis from 1 g hydrated dry 260
tissue was divided by the amount of each GSL (μg) in 1 g dry tissue and multiplied by 261
100 to determine the ITC/GSL ratios. 262
263
Statistical analysis. Mean DSI and radial growth of hyphae were transformed to their 264
natural logarithms. The experiments were generally analysed in accordance with their 265
completely randomized design. However, the soil treatment (sterilized vs. non-sterilized) 266
in the test of disease development on peas after oospore exposure to ITC volatile 267
compounds was treated as a sub-plot factor and the cover crops as main-plot factor in a 268
split plot design. The effect of cover crop, dose of cover crops, time of exposure to 269
volatile and cover crop/chemical were treated as fixed factors in all experiments and 270
replicate was treated as a random factor. Analyses of variances were made using the 271
14
procedure linear model and least square means were compared using Tukey’s test with a 272
P ≤0.05 significance limit in R version 2.15.1 (The R Foundation, 2012) 273
274
RESULTS 275
Effects of volatile compounds on oospores. Volatile compounds from hydrated B. 276
juncea dry tissue strongly reduced the inoculum potential of A. euteiches oospores, 277
shown by a significant reduction in pea root rot symptoms compared to control shoot 278
tissues from the other species (P<0.001, SE ± 0.120; Figure 1). The other cover crops or 279
soil sterilization before the experiment started had no significant effect on disease 280
development. 281
282
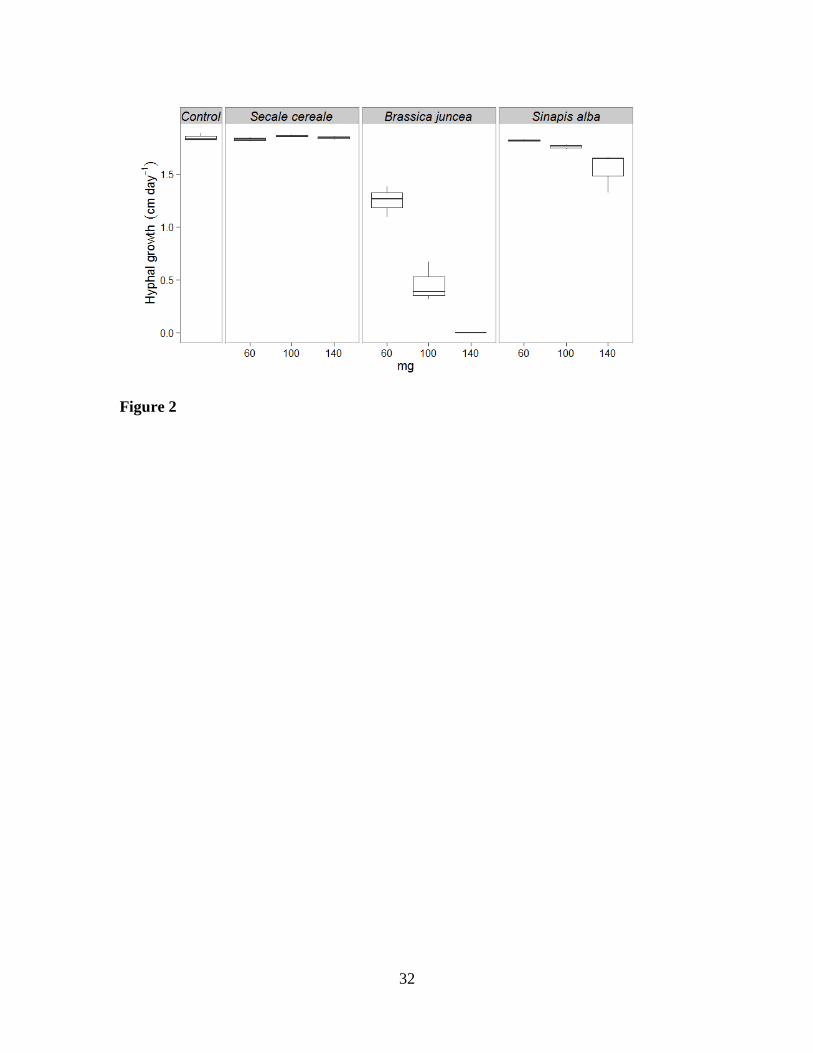
Effect of volatile compounds on hyphal growth- effect of dose. Brassica juncea shoot 283
tissue suppressed the hyphal growth of A. euteiches more efficiently than tissue from the 284
other species (P<0.001) (Figure 2). The hyphal growth of A. euteiches was more affected 285
by shoot tissue dose with B. juncea than with S. alba (dose X cover crop interaction, 286
P<0.001). The highest dose of B. juncea shoot tissue completely inhibited growth, and no 287
further growth was registered when these cultures were placed in fresh air. The volatile 288
compounds produced from the lower doses of B. juncea and the highest dose of S. alba 289
also reduced the hyphal growth of A. euteiches significantly compared with the water 290
control. No effect was found in the S. cereale tissue treatment. 291
292
Effect of volatile compounds on hyphal growth- effect of exposure time. The hyphal 293
growth of A. euteiches was affected by the time of exposure to volatile compounds 294
15
produced from hydrolysed B. juncea shoot tissue (P=0.002). The volatile compounds 295
from the 140 mg dose of hydrated B. juncea shoot tissue completely inhibited the growth 296
of A. euteiches after exposure for 120 min (Figure 3). No further growth was observed 297
during the following days when the cultures were placed in fresh air. 298
299
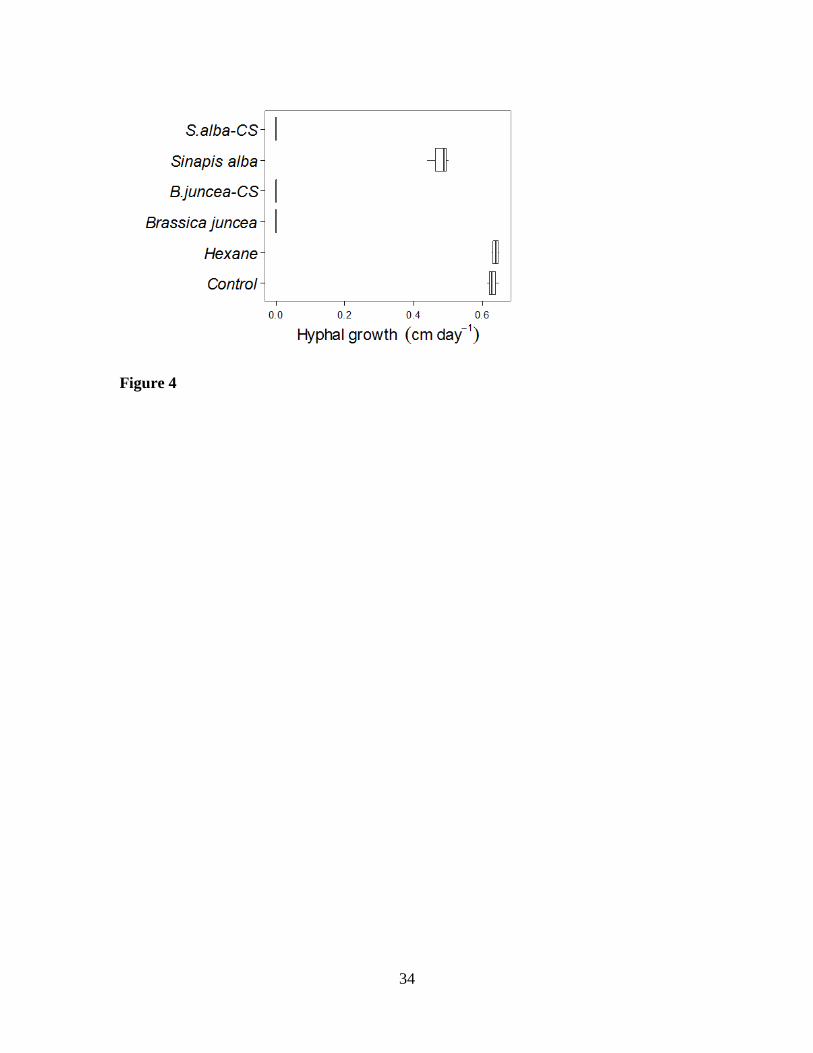
Effects of chemical standard mixtures. Volatile compounds arising from the chemical 300
standard mixtures suppressed the growth of A. euteiches in vitro (P<0.001). Volatile 301
compounds from hydrated B. juncea dried shoot tissue and both chemical standard 302
mixtures, B.juncea-CS and S.alba-CS, completely inhibited the growth of A. euteiches 303
(Figure 4). There was no further growth in the following days when the cultures were 304
placed in fresh air. Volatile compounds from hydrated S. alba tissue also caused some 305
reduction of hyphal growth compared to the water control. No inhibition of pathogen 306
growth was observed when exposed to the solvent hexane. 307
308
Glucosinolates in B. juncea and S. alba shoot tissues. Both species contained aliphatic, 309
aromatic and indolyl GSLs. Total extracted GSL concentrations in S. alba were higher 310
than the concentration of GSLs in B. juncea. Sinapis alba contained one more GSL 311
compound than B. juncea. The aliphatic GSL 2-propenyl dominated in B. juncea and the 312
aromatic GSL p-hydroxybenzyl dominated in the S. alba tissue (Table 2). 313
314
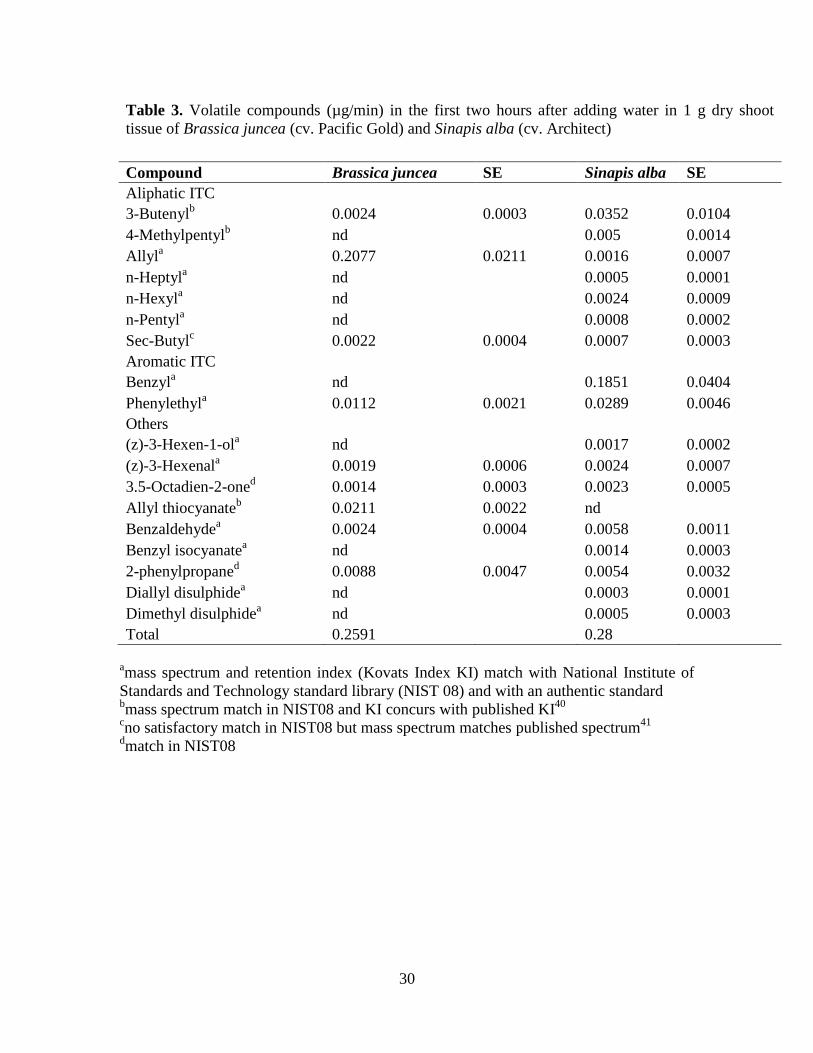
Isothiocyanates from B. juncea and S. alba. Sinapis alba shoot tissue produced more 315
volatile compounds and a greater total amount of ITCs, than B. juncea. Sinapis alba and 316
B. juncea were dominated by aromatic benzyl ITC hydrolysed from the GSLs p-317
16
hydroxybenzyl and benzyl, and aliphatic allyl ITC from the GSL 2-propenyl, 318
respectively. Both plant species produced the aromatic phenylethyl ITC (Table 3). 319
320
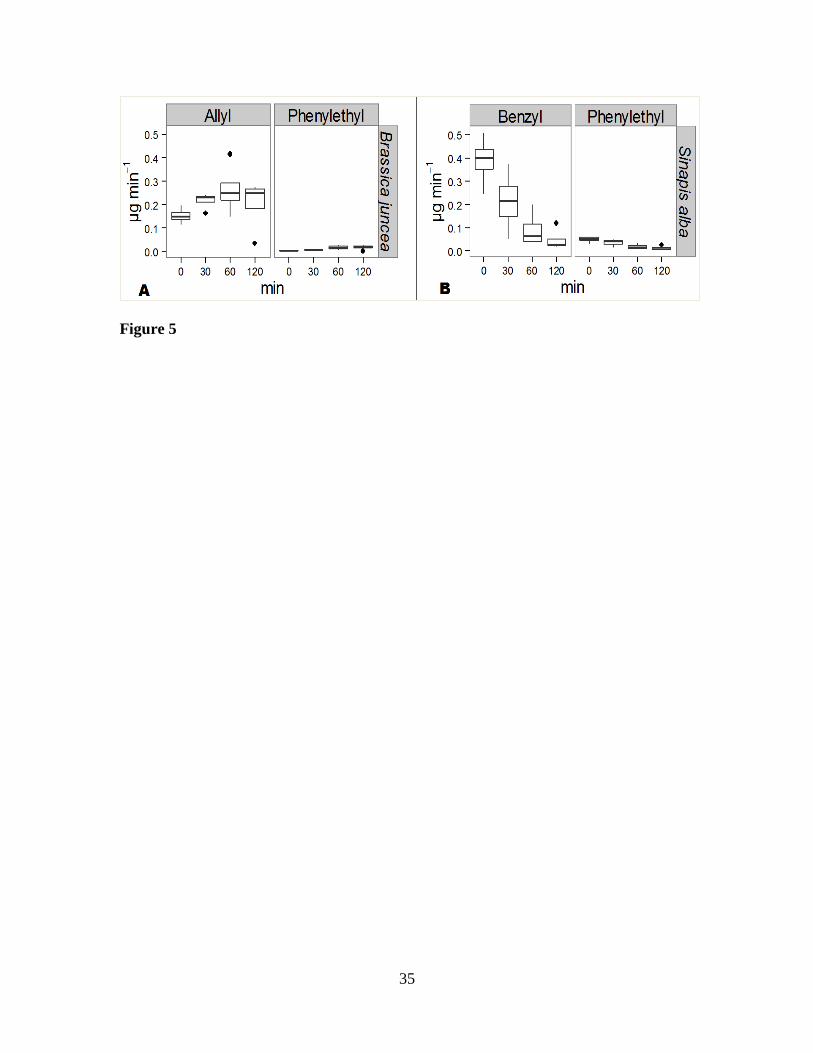
Pattern of ITC release from B. juncea and S. alba hydrated tissues. ITCs were 321
released faster from the GSLs in S. alba than from the GSLs in B. juncea tissue at the 322
beginning of hydrolysis (Figures 5 A & B). The GSLs of B. juncea produced ITCs over a 323
longer time with increasing rate compared to ITCs from S. alba tissue. The estimated 324
ITC/GSL ratio of the dominant aliphatic 2-propenyl producing allyl ITC in B. juncea was 325
1.82. The ITC/GSL ratio for the dominant aromatic p-hydroxybenzyl and benzyl 326
producing benzyl ITC in S. alba was 0.56. The ratio of the aromatic 2-phenylethyl GSL 327
producing phenylethyl ITC which was common to both species was 11.51 for B. juncea 328
and 15.51 for S. alba. 329
The release patterns of phenylethyl ITC were different for the two species, even 330
though the originating GSL 2-phenylethyl was the same in both species. Instead, it 331
followed the same pattern as the dominant allyl ITC in B. juncea and benzyl ITC in S. 332
alba (Figures 5 A & B). 333
334
DISCUSSION 335
This study shows that volatile compounds produced by brassica shoot tissue have a strong 336
inhibitory effect on Aphanomyces euteiches. However the results also highlight the 337
importance of understanding the mechanisms behind the suppression when designing 338
systems where plants containing GSLs are used to control soil borne pathogens. We show 339

17
that brassica species, dose of ITC and time of exposure interact in determining the effect 340
of the volatile compounds on A. euteiches mycelium or oospores. 341
We used shoot tissues from two brassica species with different GSL profiles. Although 342
we used different cultivars than in earlier investigations, produced the plant tissue under 343
greenhouse conditions, partly with artificial light, and dried the material to standardise 344
dosages, the variety and concentration of GSLs in B. juncea and S. alba shoot tissues was 345
similar to that found in earlier studies.10,15,42-45
This indicates that the GSL composition 346
remains consistent in the plant species despite differences in cultivar, growing conditions 347
and low temperature drying of the plant material. As a consequence of the composition of 348
GSLs, we found that the volatile compounds produced from B. juncea and S. alba were 349
dominated by allyl and benzyl ITCs respectively, which is in line with earlier studies.10
350
The thick walled, long lived oospores of A. euteiches are very different structures from 351
the thin walled A. euteiches hyphae. Nevertheless, suppression by direct exposure to 352
volatile compounds was shown for both these reproductive structures. For both mycelium 353
and oospore exposures, volatiles hydrolysed from B. juncea tissue were more effective 354
than volatiles from S. alba tissue. Previous investigations comparing the effects of 355
aliphatic and aromatic ITCs tested the survival of weevil larvae.30
The conclusion was 356
that the aliphatic allyl ITC is likely to have greater biological activity than the aromatic 357
ITCs, which is in line with the biological responses observed in the current study. 358
The in vitro data from the current study show that the amount of B. juncea tissue used 359
was lethal to A. euteiches, whereas the equivalent amount of S. alba tissue did not 360
completely prevent pathogen growth. This indicates that the highest dose of S. alba dry 361
shoot tissue did not produce a high enough concentration of volatile compounds to 362
18
prevent pathogen growth. However in the experiment with chemical standards, the 363
volatile compounds released from the S. alba chemical mixture completely prevented 364
hyphal growth. The analysis of collected volatile compounds showed that the S. alba 365
chemical mixture produced 10 times more ITCs than S. alba hydrated dry shoot tissue. It 366
can be assumed that the concentration of ITCs contributes to their suppressive effects. 367
Our ITC analysis revealed differences in the pattern of ITC release between B. juncea 368
and S. alba hydrated dry tissues. The calculated ITC/GSL ratios indicate that the GSL 2-369
propenyl is more efficient than p-hydroxybenzyl and benzyl GSLs at producing ITCs. 370
The chemical structure and size of GSLs mainly regulate their efficiency of conversion 371
into ITCs.25,48
Our chemical analysis also shows the hydrated dry shoot tissue of S. alba 372
released volatile compounds more rapidly, with the highest concentration recorded within 373
a much shorter time than for B. juncea. The dominant ITC released by B. juncea tissue, 374
allyl ITC, has a lower molecular weight and lower boiling point than benzyl ITC, the 375
dominant compound released by S. alba. However, despite the expected higher volatility 376
of allyl ITC, its concentration in the headspace of hydrolysed powder of the respective 377
plants was comparable to that of benzyl ITC. Although it is likely that the volatility of 378
these ITCs does influence their toxicity, our results suggest that other factors inherent to 379
the dry powders themselves are also important. 380
The hydrolysis process for the dominant aliphatic GSL in B. juncea shoot tissue 381
seemed to follow a longer time course than the dominant aromatic GSL in S. alba. 382
Further, we observed that the release pattern of phenylethyl ITC differed between plant 383
species, following the same pattern as the dominant ITC for each species. The ITC/GSL 384
ratio (indicating the efficiency of production) of the species common aromatic 385

19
phenylethyl ITC from the parent GSL 2-phenylethyl was lower in B. juncea tissue than in 386
S. alba. This suggests that other traits inherent to the dry powders, such as plant cell 387
structure or water absorbing capacity, influence GSL hydrolysis and ITC release. These 388
factors probably interact with the characteristics of the chemicals themselves, such as 389
volatility, to determine the eventual ITRC release.48
These factors, however, require 390
further investigation. 391
Toxic effects from incorporated B. juncea plant tissue in A. euteiches contaminated 392
soil have been shown to reduce the development of pea root rot, but an effect of ITCs has 393
not always been established.12,46
In a closed system, volatile ITCs can easily interact 394
directly with the exposed pathogen. We show that the degree of detrimental effects from 395
ITCs was enhanced as the time of pathogen exposure increased. For A. euteiches growing 396
on CMA agar medium, the lethal dose of ITCs from B. juncea was reached after two 397
hours of exposure, showing the importance of keeping the concentration of effective ITCs 398
high for this period. For an optimal effect in a bio-fumigation process, this suggests the 399
use of a cover after incorporating plant biomass to minimise evaporation of volatiles. 400
This measure was also suggested in earlier studies.47
401
The current study shows that brassica plant tissue, its dominant ITCs, their 402
concentration and release pattern, and exposure time are important factors for the 403
suppression of A. euteiches. The results highlight the importance of choosing plant 404
species with the most effective production ratio but also high biomass production to reach 405
optimal concentration levels when GSL containing plants are used for bio-fumigation. 406
The results support the use of a cover to minimise dispersal of ITCs, which should allow 407
20
the ITCs to interact directly with the pathogen for a longer period. However, the findings 408
from this study need further verification under field conditions. 409
410
ACKNOWLEDGMENTS 411
The project was funded by the research programme SLU EkoForsk at the Swedish 412
University of Agricultural Sciences. We thank Erika Qvarfordt for technical assistance. 413
414
REFERENCES 415
(1) Papavizas, G. C.; Ayres, W. A. Aphanomyces euteiches. Aphanomyces species and 416
their root diseases in pea and sugarbeet: A Review. Technical Bulletin 1485. US 417
Department of Agriculture, Washington, DC, 1974, 8-9. 418
(2) Persson, L.; Bodker, L.; Larson-Wikstrom, M. Prevalence and pathogenicity of 419
foot and root rot pathogens of pea in southern Scandinavia. Plant Dis. 1997, 81, 171-420
174. 421
(3) Gaulin, E.; Jacquet, C.; Bottin, A.; Dumas, B. Root rot disease of legumes caused 422
by Aphanomyces euteiches. Mol. Plant Pathol. 2007, 8, 539-548. 423
(4) Shang, H.; Grau, C. R.; Peters, R. D. Oospore germination of Aphanomyces 424
euteiches in root exudates and on the rhizoplanes of crop plants. Plant Dis. 2000, 84, 425
994-998. 426
(5) Hardham, A. R.; Hyde, G. J. Asexual sporulation in the oomycetes. Adv. Bot. Res. 427
1997, 24, 353-398. 428
(6) McGee, J. R.; Coyne, C.; Pilet-Nayel, M-L.; Moussart, A.; Tivoli, B.; Baranger, 429
A.; Hamon, C.; Vandemark, G.; McPhee, K. Registration of pea germplasm lines 430
21
partially resistant to Aphanomyces root rot for breeding fresh or freezer pea and dry pea 431
types. J. Plant Reg. 2012, 6, 203-207. 432
(7) European Parliament, Council of the European Union. Regulation (EC) No 433
1107/2009 of the European parliament and of the council of 21 October 2009, 434
concerning the placing of plant protection products on the market and repealing Council 435
Directives 79/117/EEC and 91/414/EEC. 436
(8) Hossain, S.; Bergkvist, G.; Berglund, K.; Mårtensson, A.; Persson, P. 437
Aphanomyces pea root rot disease and control with special reference to impact of 438
Brassicaceae cover crops. Acta Agr. Scand. B-S. P. 2012, 62, 477-487. 439
(9) Lewis, J. A.; Papavizas, G. C. Evolution of volatile sulfur-containing compounds 440
from decomposition of crucifers in soil. Soil Biol. Biochem. 1970, 2, 239-246. 441
(10) Brown, P. D.; Morra, M. J. Control of soil-borne plant pests using glucosinolate-442
containing plants. Adv. Agron. 1997, 61, 167-231. 443
(11) Kirkegaard, J. A.; Matthiessen, J. N. Developing and refining the biofumigation 444
concept. Agroindustria 2005, 3, 5-11. 445
(12) Muehlchen, A. M.; Rand, R. E.; Parke, J. L. Evaluation of green manures for 446
controlling Aphanomyces root rot of peas. Plant Dis. 1990, 74, 651-654. 447
(13) Lewis, J. A.; Papavizas, G. C. Effect of sulfur-containing volatile compounds and 448
vapors from cabbage decomposition on Aphanomyces euteiches. Phytopathology 1971, 449
61, 208-214. 450
(14) Angus, J. F.; Gardner, P. A.; Kirkegaard, J. A.; Desmarchelier, J. M. 451
Biofumigation: Isothiocyanates released from Brassica roots inhibit growth of the take-452
all fungus. Plant Soil 1994, 162, 107-112. 453
22
(15) Fahey, J. W.; Zalcmann, A. T.; Talalay, P. The chemical diversity and 454
distribution of glucosinolates and isothiocyanates among plants. Phytochemistry 2001, 455
56, 5-51. 456
(16) van Dam, N. M.; Tytgat, T. O. G.; Kirkegaard, J. A. Root and shoot 457
glucosinolates: a comparison of their diversity, function and interactions in natural and 458
managed ecosystems. Phytochem. Rev. 2009, 8, 171-186. 459
(17) Kiddle, G.; Bennett, R. N.; Botting, N. P.; Davidson, N. E.; Robertson, A. A. B.; 460
Wallsgrove, R. M. High-performance liquid chromatographic separation of natural and 461
synthetic desulphoglucosinolates and their chemical validation by UV, NMR and 462
chemical ionisation-MS methods. Phytochem. Analysis 2001, 12, 226-242. 463
(18) Smolinska, U.; Morra, M. J.; Knudsen, G. R.; Brown, P. D. Toxicity of 464
glucosinolate degradation products from Brassica napus seed meal towards 465
Aphanomyces euteiches f. sp. pisi. Phytopathology 1997, 87, 77-82. 466
(19) Malik, S. M.; Riley, B. M.; Norsworthy, K. J.; Bridges, W. (jr). Glucosinolate 467
profile variation of growth stages of wild radish (Raphanus raphanistrum). J. Agr. Food 468
Chem. 2010, 58, 3309-3315 469
(20) Wittstock, U.; Halkier, B. A. Glucosinolate research in the Arabidopsis era. 470
Trends Plant Sci. 2002, 7, 263-270. 471
(21) Brown, P. D.; Morra, M. J. Glucosinolate-containing plant tissues as 472
bioherbicides. J. Agr. Food Chem. 1995, 43, 3070-3074. 473
(22) Sang, J. P.; Minchinton, P.; Johnstone, P.; Truscott, R. J. W. Glucosinolate 474
profiles in the seed, root and leaf tissue of cabbage, mustard, rapeseed, radish and 475
swede. Can. J. Plant Sci. 1984, 64, 77-93. 476
23
(23) Kawakishi, S.; Kaneko, T. Interaction of oxidized glutathione with allyl 477
isothiocyanate. Phytochemistry 1985, 24, 715-718. 478
(24) Kirkegaard, J. A.; Sarwar, M.; Matthiessen, J. N. Assessing the biofumigation 479
potential of crucifers. Int. Soc. Hort. Sci. 1998, 459, 105-111. 480
(25) Smith, B. J.; Kirkegaard, J. A. In vitro inhibition of soil microorganisms by 2-481
phenylethyl isothiocyanate. Plant Pathol. 2002, 51, 585-593. 482
(26) Smolinska, U.; Morra, M. J.; Knudsen, G. R.; James, R. L. Isothiocyanates 483
produced by Brassica species as inhibitors of Fusarium oxysporum. Plant Dis. 2003, 484
87, 407-412. 485
(27) Falk, K. L.; Vogel, C.; Textor, S.; Bartram, S.; Hick, A. Glucosinolate 486
biosynthesis: demonstration and characterization of the condensing enzyme of the chain 487
elongation cycle in Eruca sativa. Phytochemistry 2004, 65, 1073-84. 488
(28) Yuesheng, Z. The molecular basis that unifies the metabolism, cellular uptake and 489
chemopreventive activities of dietary isothiocyanates. Carcinogenesis 2012, 33, 2-9. 490
(29) Abreu, A. C.; Borges, A.; Simoes, L. C.; Saavedra, M. J.; Simoes, M. 491
Antibacterial activity of phenyl isothiocyanate on Escherichia coli and Staphylococcus 492
aureus. Med. Chem. 2013, 9, 756-761. 493
(30) Matthiessen, J. N.; Shackleton, M. A. Biofumigation: environmental impacts on 494
the biological activity of diverse pure and plant-derived isothiocyanates. Pest Manag. 495
Sci. 2005, 61, 1043-1051. 496
(31) Gimsing, A. L.; Kirkegaard, J. A. Glucosinolate and isothiocyanate concentration 497
in soil following incorporation of Brassica biofumigants. Soil Biol. Biochem. 2006, 38, 498
2255-2264. 499
24
(32) Rongai, D.; Cerato, C.; Lazzeri, L. A natural fungicide for the control of Erysiphe 500
betae and Erysiphe cichoracearum. Eur. J. Plant Pathol. 2009, 124, 613-619. 501
(33) Bång, U. Rhizoctonia solani soil infestation in Sweden and biofumigation studies 502
in vitro. 17th triennial conference of the European association of potato reserchers, 503
Brasov, Romania, Abstract of papers and posters, 2008, 144-146. 504
(34) Schneider, C. L. Use of oospore inoculum of Aphanomyces cochloides to initiate 505
blackroot disease in sugar beet seedlings. J. Am. Soc. Sugar Beet 1978, 20, 55-62. 506
(35) Persson, L.; Larsson-Wikström, M.; Gerhardson, B. Assessment of soil 507
suppressiveness to Aphanomyces root rot of pea. Plant Dis. 1999, 83, 1108-1112. 508
(36) Parke, J. L.; Rand, R. E.; Joy, A. E.; King, E. B. Biological control of Pythium 509
damping-off and Aphanomyces root rot of peas by application of Pseudomonas cepacia 510
or P. fluorescens to seed. Plant Dis. 1991, 75, 987-992. 511
(37) Kabouw, P.; Biere, A.; van der Putten, W. H.; van Dam, N. M. Intra-specific 512
differences in root and shoot glucosinolate profiles among white cabbage (Brassica 513
oleracea var. capitata) cultivars. J. Agr. Food Chem. 2010, 58, 411–417. 514
(38) Buchner, R. Approach to determination of HPLC response factors for 515
glucosinolates. In: Wathelet, J-P. (Ed.), Glucosinolates in Rapeseeds: Analytical 516
Aspects. Martinus Nijho Publishers, Boston, 1987, 50-58. 517
(39) Brown, P. D.; Tokuhisa, J. G.; Reichelt, M.; Gershenzon, J. Variation of 518
glucosinolate accumulation among different organs and developmental stages of 519
Arabidopsis thaliana. Phytochemistry 2003, 62, 471-481. 520
25
(40) Valette, L.; Fernandez, X.; Poulain, S.; Lizzani-Cuvelier, L.; Loiseau, A. M. 521
Chemical composition of the volatile extracts from Brassica oleracea L. var. botrytis 522
‘Romanesco’ cauliflower seeds. Flavour Frag. J. 2006, 21, 107-110. 523
(41) Kjaer. A.; Ohashi. M.; Wilson. J. M.; Djerassi. C. Mass Spectra of 524
Isothiocyanates. Acta Chem. Scand. 1963, 17, 2143-2154. 525
(42) Bodnaryk, R. P. Developmental profile of p-Hydroxybenzyl (p-hydroxybenzyl 526
glucosinolate) in mustard seedlings, Sinapis alba L., and its relationship to insect 527
resistance. J. Chem. Ecol. 1991, 17, 1543-1556. 528
(43) Morra, M. J.; Kirkegaard, J. A. Isothiocyanate release from soil incorporated 529
Brassica tissues. Soil Biol. Biochem. 2002, 34, 163-1690. 530
(44) Kirkegaard, J. A.; Sarwar, M. Biofumigation potential of brassicas. I. Variation in 531
glucosinolate profiles of diverse field-grown brassicas. Plant Soil 1998, 201, 71-89. 532
(45) Rosa, E. A. S.; Heaney, R. K.; Fenwick, G. R.; Portas, C. A. M. Glucosinolates in 533
crop plants. Horict. Rev. 1997, 19, 99-215. 534
(46) Papavizas, G. C. Suppression of Aphanomyces root rot of peas by cruciferous soil 535
amendments. Phytopathology 1966, 56, 1071-1075. 536
(47) Njoroge, S. M. C.; Riley, M. B.; Keinath, A. P. Effect of incorporation of 537
Brassica spp. residues on population densities of soilborne microorganisms and on 538
damping-off and Fusarium wilt of watermelon. Plant Dis. 2008, 92, 287-294. 539
(48) Sarwar, M.; Kirkegaard, J. A.; Wong, P. T. W.; Desmarchelier, J. M. 540
Biofumigation potential of brassicas: In vitro toxicity of isothiocyanates to soil-borne 541
fungal pathogens. Plant Soil 1998, 201, 103-112. 542

26
FIGURE CAPTIONS
Figure 1. Pea root rot symptoms registered in a bioassay depending on pre-treatment of
Aphanomyces oospores with volatile compounds from hydrated dry plant tissues. Pea
seedlings were rated for pea root rot three weeks after pea seed sowing. The scale for
disease severity index (DSI) is 0-100 (%). 0%=healthy plant; 25% = root slightly
discolored; 50% = root extensively discolored but not shrunken; 75% = root extensively
discolored and shrunken; 100% = root partly or completely rotted or plant dead.36
The
value of DSI is back transformed from the natural logarithm. Control = water.
Figure 2. Effects of volatile compounds from 60, 100 and 140 mg hydrated Brassica
juncea, Sinapis alba and Secale cereale dry shoot tissues on the hyphal growth (cm/day)
of Aphanomyces euteiches at 24 °C, in vitro. Control = water.
Figure 3. Effects of volatile compounds from 140 mg hydrated Brassica juncea dry shoot
tissues exposed for 40, 80 and 120 min on the hyphal growth (cm/day) of Aphanomyces
euteiches at 24 °C, in vitro. Control = water.
Figure 4. Effects of volatile compounds from 140 mg hydrated Brassica juncea and
Sinapis alba dry shoot tissues and the chemical standard mixtures, B.juncea-CS and
S.alba-CS on the hyphal growth (cm/day) of Aphanomyces euteiches at 22 °C, in-vitro.
Control = water.
27
Figure 5. Release pattern and concentration of allyl, benzyl and phenylethyl ITCs at
different time (min) points after adding water to 1 g dry shoot tissue of A) Brassica
juncea (cv. Pacific Gold) and B) Sinapis alba (cv. Architect).
28
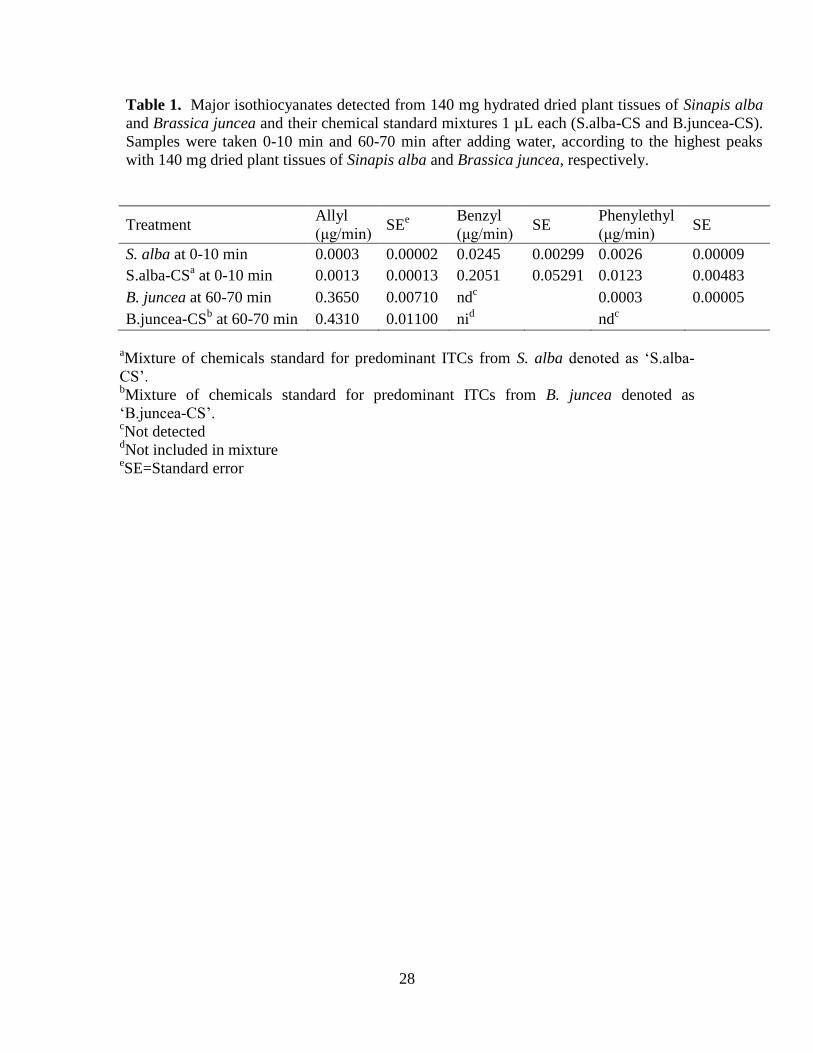
Table 1. Major isothiocyanates detected from 140 mg hydrated dried plant tissues of Sinapis alba
and Brassica juncea and their chemical standard mixtures 1 µL each (S.alba-CS and B.juncea-CS).
Samples were taken 0-10 min and 60-70 min after adding water, according to the highest peaks
with 140 mg dried plant tissues of Sinapis alba and Brassica juncea, respectively.
Treatment Allyl
(μg/min) SE
e
Benzyl
(μg/min) SE
Phenylethyl
(μg/min) SE
S. alba at 0-10 min 0.0003 0.00002 0.0245 0.00299 0.0026 0.00009
S.alba-CSa at 0-10 min 0.0013 0.00013 0.2051 0.05291 0.0123 0.00483
B. juncea at 60-70 min 0.3650 0.00710 ndc
0.0003 0.00005
B.juncea-CSb at 60-70 min 0.4310 0.01100 ni
d nd
c
aMixture of chemicals standard for predominant ITCs from S. alba denoted as ‘S.alba-
CS’. bMixture of chemicals standard for predominant ITCs from B. juncea denoted as
‘B.juncea-CS’. cNot detected
dNot included in mixture
eSE=Standard error

29
Table 2. Different glucosinolates and concentrations (μmol/g) in dry shoot tissue of Brassica
juncea (cv. Pacific Gold) and Sinapis alba (cv. Architect)
Compound Brassica juncea SE Sinapis alba SE
Aliphatic
2-(S)-2-Hydroxybutenyl nda nd 0.515 0.023
5-Methylsulphinylpentyl nd nd 0.008 0.005
4-Pentenyl 0.011 0.006 nd nd
n-Butyl 0.032 0.011 nd nd
3-Methylthiopropyl nd nd 0.013 0.004
3-Butenyl 0.012 0.007 0.062 0.005
2-Hydroxy-3-butenyl nd nd 0.018 0.001
2-Propenyl 3.909 0.497 nd nd
Unknown 0.019 0.007 nd nd
Aromatic
2-Phenylethyl 0.119 0.016 0.068 0.005
Benzyl nd nd 0.483 0.054
p-Hydroxybenzyl nd nd 7.935 0.981
Indolyl
4-Hydroxy-3-indolylmethyl 0.006 0.004 nd nd
4-Methoxy-3-indolylmethyl 0.001 0.001 0.008 0.001
3-Indolylmethyl 0.040 0.007 0.016 0.002
1-Methoxy-3-indolylmethyl 0.008 0.002 0.009 0.002
Total 4.156 9.136
and, not detected
30
Table 3. Volatile compounds (µg/min) in the first two hours after adding water in 1 g dry shoot
tissue of Brassica juncea (cv. Pacific Gold) and Sinapis alba (cv. Architect)
Compound Brassica juncea SE Sinapis alba SE
Aliphatic ITC
3-Butenylb 0.0024 0.0003 0.0352 0.0104
4-Methylpentylb nd
0.005 0.0014
Allyla 0.2077 0.0211 0.0016 0.0007
n-Heptyla nd
0.0005 0.0001
n-Hexyla nd
0.0024 0.0009
n-Pentyla nd
0.0008 0.0002
Sec-Butylc 0.0022 0.0004 0.0007 0.0003
Aromatic ITC
Benzyla nd
0.1851 0.0404
Phenylethyla 0.0112 0.0021 0.0289 0.0046
Others
(z)-3-Hexen-1-ola nd
0.0017 0.0002
(z)-3-Hexenala 0.0019 0.0006 0.0024 0.0007
3.5-Octadien-2-oned 0.0014 0.0003 0.0023 0.0005
Allyl thiocyanateb 0.0211 0.0022 nd
Benzaldehydea 0.0024 0.0004 0.0058 0.0011
Benzyl isocyanatea nd
0.0014 0.0003
2-phenylpropaned 0.0088 0.0047 0.0054 0.0032
Diallyl disulphidea nd
0.0003 0.0001
Dimethyl disulphidea nd
0.0005 0.0003
Total 0.2591 0.28
amass spectrum and retention index (Kovats Index KI) match with National Institute of
Standards and Technology standard library (NIST 08) and with an authentic standard bmass spectrum match in NIST08 and KI concurs with published KI
40
cno satisfactory match in NIST08 but mass spectrum matches published spectrum
41
dmatch in NIST08

31
Figure 1
32
Figure 2

33
Figure 3
34
Figure 4
35
Figure 5