c. atlantic economic journal - georgia state universityecobth/aej_earnings_jul78.pdfc. atlantic...
TRANSCRIPT

\;
".' c.
AtlanticEconomicJournal
VOLUME VI NUMBER 2
RICHARD T. FROYEN AND LAWRENCE S. DAVIDSON
Estimates of the Fisher Effect: A Neo-Keynesian Approach
GILLIAN GARCIA
Consumer Expenditure by Bank Credit Card
MICHAEL SATTINGERTrade Flows and Differences Between Countries
BARRY T. HIRSCH
Earnings, Occupation, and Human Capital Investment
WAYNE C. CURTIS AND LOWELL E. WI LSON
A Model to Project Loss of Earnings from Impaired or Destroyed Capacity
JANG H. YOO
Real Money Balancesas Factor Saving Media: A Note
ANTHONY E. BOPP AND MITCHELL DURST
Estimated Importance of SeasonalAdjustment on Energy Forecasts
WILLIAM A. KELLY, JR.Relative Rates of Return in the Competitive Fringe Model:Declining Dominance and Merger Activity .
EMILY P. HOFFMAN
Measurement of Faculty Productivity
DONALD C. AUCAMP AND ROBERT E. KOHN
A Diagrammatic Solution of the Pareto Problem
ROGER D. BLAIR
Random Prices and Estimation of the Elasticity of Substitution
W. MARK CRAIN, THOMAS H. DEATON, AND ROBERT D. TOLLISONMacroeconomic Determinants of Tenure in the U.S. House of Representatives
EMILE GRUNBERG
Toward Compromise on Tenure: Comment
MARTIN BRONFENBRENNER
Reply to Professor Grunberg's Comments
OTHER CONTRIBUTORS
Alan J. Donziger; Edward C. Gray; Richard P. Rozek; William T. Jackson; Wayne K.Talley and Stanley E. Warner; Usman A. Qureshi and Gary L. French; Myles Wallace;Jae W. Chung; Francis Shieh; Kern O. Kymn; J. Wilson Mixon,Jr. and Alan L. Larson;Joseph M. Sulock; Thomas Hyclak; John M. Virgo; Constantine E.A. Passaris;Ani! K.Puri
JULY 1978
Earnings, Occupation, and HumanCapital Investment
BARRY T. HIRSCH*
In recent years the human capital earningsmodel has been widely used as a framework forexamining the determination of earnings. A spec-ification of the human capital earnings functiondeveloped by Chiswick and Mincer has been em-ployed to examine earnings determination acrossindividuals [Mincer, 1974b], states [Chiswick,1974] , meLJpolitan areas [Hirsch, 1978], oc-cupations [Rahm, 1971], and over time [Chis-wick-Mincer, 1972]. However, empirical stud-ies utilizing the human capital framework haveassumed thatthe effects of work experience (post-school investment) on earnings are identical forindividuals, regardless of occupation.
This assumption runs counter to the currentemphasis of many labor economists on the im-portance to lifetime earnings of gaining early ac-cess to certain occupational job ladders and ofreceiving firm specific on-the-job training [Doer-inger and Piore, 1971; Thurow, 1975] . Likewise,human capital economists stress the importanceof postschool training investments and at leastrecognize the fact that these investments varyacross occupations. Indeed, Mincer has statedthat [Mincer, 1974a, p. 33] :
"an analysis in which these effects [of schoolingand of experience] are allowed to differ [acrossoccupations] would be desirable for a numberof purposes, not the least of which is an insight in-to differential post-schooljob skill investments."
This paper examines whether schooling, ex-
perience, and weeks worked have different ef-
fects on individual earnings in nine separate oc-
cupational categories. The Chiswick-Mincer spec-
*University of North Carolina at Greensboro. Theresearch is drawn in part from my doctoral dissertationon which William R. Johnson and Roger Sherman pro-vided helpful comments. Support by a doctoral disser-tation grant from the U.S. Department of Labor, Em-ployment and Training Administration, is gratefullyacknowledged.
ification of the human capital earnings functionis modified in order to focus on differences
across occupations in their earnings-experienceprofiles. This makes possible several inferencesregarding the intensity, length, and rate of re-turn to postschool human investments acrossoccupational job ladders. In addition, we exam-ine the manner in which occupation interactswith schooling in the earnings generation processand discuss analytical problems which arise inmodeling this process. Finally, the relationshipbetween wage rates, weeks worked, and occupa-tion is examined.
The Theoretical Framework
The Chiswick-Mincerspecification of the hu-man capital earnings function relates present netearnings in year t after schooling to all previousinvestments in human capital, minus any currentinvestment. Let ko be the fraction of potentialearnings initially invested in postschool training(at t =0) and assume that kt declines linearlyover time such that kt =ko(1 - tiT), Tbeing thenumber of years of positive net investment. Anumber of simplifying assumptions and inge-nious manipulations enables the followingwide-ly used form of the model to be derived [Chis-wick-Mincer, 1972; Mincer, 1974]:'
koin Jt = [inEo - ko(l + -)] +rS +2
ko rpkoT+ k~ 2[rpko+-(I+ko)]t-[ 2]t +T 2T
r(in WW)+ Ut=X+rS+,'t+r"t2 +r(inWW)+Ut,
(1)
where,1Several recent articles survey and critique empiri-
calliterature in the human capital area [Rosen, 1977;Griliches, 1977; Blaug, 1976].
31

32
- --
ATLANTIC ECONOMICJOURNAL
In}f = the natural logarithm of earningsin the year t of a working life;
InEo = natural logarithm of earningsthatwould be obtained in the absence
of human capital investl1lent;r = the averagerate of return to
schooling;S = yearsof schoolingcompleted;rp = the average rate of return to post-
school investment;t = years of experience estimated by
the proxy (age - S - 6);'Y= the partial elasticity of annual
earnings with respect to weeksworked;
In WW= natural logarithm of weeksworked during year t; and
Ut = a random error term with zeromean and constant variance.
Human capital theory treats work experienceas an investment phenomenon and earnings-ex-perience proftles are presumed to reflect its costsand returns.2 Given that the cost and returnstructure will differ across occupations, maxi-mizing individualswill exhibit different earnings-experience profiles even when rates of return areequalized among various occupational invest-ment paths. Equation (1) does not allow the in-tercept or the regression coefficients on experi-ence and experience squared to vary across oc-cupations. This, in effect, constrains the rate ofreturn to postschool training, the fraction of po-ential earnings initially invested in postschooltraining and the subsequent investment proftle,and the number of years of positive net post-school investment to be equal amongindividualsin occupations having different investment andearnings patterns (Le., different rp, ko, and Tcombinations). '
2Earnings-experience profiles will also reflect theeffects of discrimination, non-pecuniary returns, eco-nomic growth, and aging per se. Some recent empiricalwork has attempted to separate the independent effectsof experience and age on earnings [Klevmarken andQuigley, 1976; Lazear, 1976).
'Technically, the constraint may be non-binding
We allow rp, ko, and T to vary across occupa-tions, but continue to assume them identical
for individuals within any given occupation. Oc-cupational variation in the shapes of earningsprofiles can thus be observed by estimating apiecewise regression:
n nIn}f=X+.~ t/>pCCj+rS+.~ 8jOCCj(t) (2)J=2 J=1
n
+.~ OjOCCj(t2)+ 'Y(lnWW)+ VtJ=1
where the set of dummy variables OCCj with j =(1, . . . , n) assigns each individual a I for occu-pation j and a 0 for all others. Each individualwill be classified in one of nine occupational cat-egories. Whereas in specification (1) all differ-ences in rp, ko, and T were captured in the re-sidual Ut, in specification (2) Vtcaptures only in-traoccupational differences in these earningsfunction parameters.
Equation (2) is employed to test the hypoth-esis that occupational differences in earningsfunction parameters are a significant determi-nant of individual earnings. The relevant nullhypoth~sis, that t/>j= 0 (j = 2, . . . , n), 81 = 82 =... = on, and 01 = O2=.. . = Onhold jointly, canbe tested by use of an F statistic comparing thesums of squared residuals from (1) and (2). Fail-ure to reject the null hypothesis would indicatethat the constraints imposed by the Chiswick-Mincer human capital earnings function are in-consequential.
While the earnings function parameters rp,ko, and T cannot be directly retrieved from thecoefficients on t and t2, these parameters canbe identified if we make an assumption aboutthe net investment span T.' Since T correspondsto the unobserved peak of earnings capacity andprecedes the observed peak of earnings by about
since there are four parameters (lnEo. rp, ko' and 1)constrained by three coefficients (X, r', and r"). How-ever, it seems unlikely that variation in these earningsfunction parameters offset each other such that all oc-cupations possess identical earnings-experience profiles.
'Knapp and Hansen [1976) develop a procedureto estimate ko from longitudinal data.

-
HIRSCH: HUMANCAPITALINVESTMENT
10 years [Mincer, 1974, pp. 20-3], estimates ofT can be obtained by:
-b2T= t* -10=- -10
2b3
where t* is the peak of observed earnings (where31n Yj3t = 0), and b2 and b3 are the regressioncoefficients on t and t2.
Given any value of T, the parameter rp andko can be identified. The Chiswick-Mincer speci-fication implies:
kob2 = [rpko + - (1 + ko)]T
andrp ko 120
]b =-[-+-2 .3 2T 2T
Solving for ko and rp we find:
ko =b2T+ 2b3T2
andb2 1 + ko
rp =(-;:- T ) .0
In similar fashion, the regressioncoefficientsOJand OJfrom equation (2) can be utilized toobtain estimates of T, ko, and rpby occupation.The estimation of these important earningsfunc-tion parameters allows inferences to be madeabout differences in investment behavior acrossoccupations.
Data
The data used are from the 1/100 file of the1970 Census Public UseSample. Our sample in-cludes 7,667 white, non-farm, non-student malesbetween the ages of 15 and 64 who had somela-bor earnings in 1969, and who reside in 48 Stan-dard Metropolitan Statistical Areas (which wererandomly selected from among SMSA's withpopulations greater than 250,000 and less than3 million).
33
Empirical Results
Table 1 presents regression results for earn-ings functions (1) and (2). Equation (1), the stan-dard human capital earnings function, constrainsearnings-experienceprofiles to a common inter-cept and shape across occupations, while equa-tion (2) allows profiles to vary across occupa-tions. We calculate the relevantF statistic com-paring sums of squared residuals from equations(1) and (2) in order to test whether or not theconstraints on earnings function parameters im-posed by specification (1) are of consequence.'F;~8 is calculated to equal 16.43 and the nullhypothesis of equivalent earnings profiles is re-jected at conventional significancelevels.
Thus, allowing the intercept and the shapeof earnings-experienceprofiles to vary for indi-viduals in different occupations does add signif-icantly to the explanatory power of the humancapital earnings model. This evidence is consis-tent with those viewsof the labor market which
stress the importance of on-the-job and otherpostschool training investments.
Note that differences across occupations inthe intercept of earnings-experienceprofileswillresult not only from differences in ko but alsofrom differencesin non-pecuniary compensationand any other unmeasurable determinants ofearnings.Whileko cannot be separated from eachestimatedrpj>wecancompareequations(1) and(2) to another earnings function with the coef-ficients of t and t2 constrained to be equal acrossoccupation, but which allows the intercept tovary (i.e., equation (1) plus 8 occupational in-tercept dummies).
When this specification is estimated and therelevant F tests are performed, the null hypoth-
S The appropriate F ratio is
SSR (1) - SSR (2)/d
SSR (. )/(n - k - 1)
where, SSR is the sum of squared residuals, d is thedifference in the number of parameters between the re-stricted and unrestricted regressions, n is the numberof observations, and (k + 1) is the number of param-eters in the unrestricted model (specification (2».
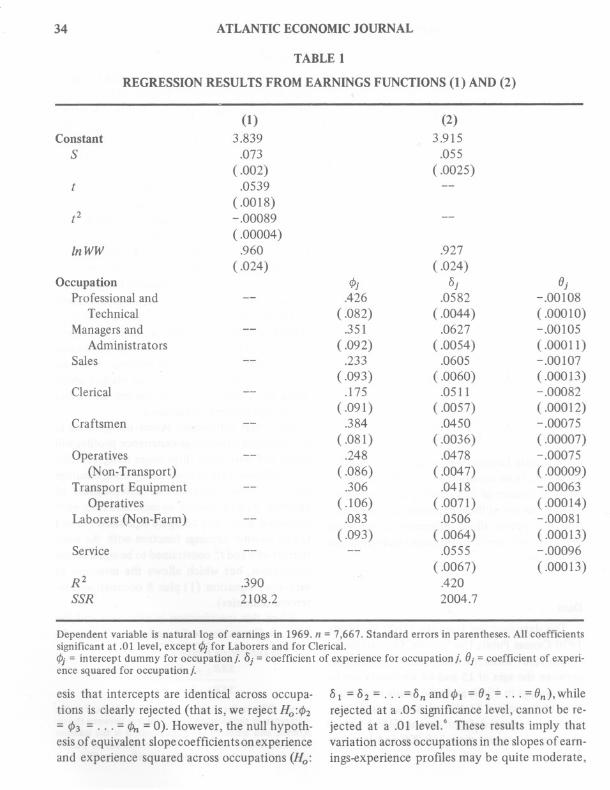
Dependent variable is natural log of earnings in 1969. n = 7,667. Standard errors in parentheses.Allcoefficientssignificant at .01 level, except cf>jfor Laborers and for Clerical.cf>j= intercept dummy for occupationj. bj = coefficient of experience for occupationj. OJ=coefficient of experi-ence squared for occupationj.
esis that intercepts are identical across occupa-tions is clearly rejected (that is, we reject Ho:cf>2= cf>3=. . . = <Pn =0). However, the null hypoth-esis of equivalen t slope coefficients on experienceand experience squared across occupations (Ho:
b 1 = b2 = . . . = bn and cf>l = O2 = . . . = On),whilerejected at a .05 significancelevel, cannot be re-jected at a .01 level.6 These results imply thatvariation acrossoccupations in the slopesof earn-ings-experience profiles may be quite moderate,
34 ATLANTICECONOMICJOURNAL
TABLE 1
REGRESSIONRESULTS FROM EARNINGSFUNCTIONS(1) AND (2)
(1) (2)Constant 3.839 3.915
S .073 .055
( .002) (.0025)( .0539
(.0018)(2 - .00089
(.00004)lnWW .960 .927
(.024) ( .024)Occupation cf>j bj OJ
Professional and -- .426 .0582 -.00108Technical (.082) (.0044) (.00010)
Managersand -- .351 .0627 -.00105Administrators (.092) (.0054) (.00011)
Sales -- .233 .0605 -.00107( .093) (.0060) (.00013)
Clerical -- .175 .0511 - .00082( .091) (.0057) (.00012)
Craftsmen -- .384 .0450 - .00075(.081) (.0036) ( .00007)
Operatives -- .248 .0478 -.00075(Non-Transport) (.086) ( .0047) ( .00009)
Transport Equipment -- .306 .0418 - .00063
Operatives (.106) (.0071) (.00014)Laborers (Non-Farm) -- .083 .0506 -.00081
( .093) ( .0064) (.00013)Service -- -- .0555 - .00096
(.0067) (.00013)R2 .390 .420SSR 2108.2 2004.7

HIRSCH:HUMANCAPITALINVESTMENT 35
after accounting for differences in intercepts,schooling, and weeks worked.
Even though variation in the shapes of earn-ings-experience profiles is small, differences inthe profiles are consistent with expectations.Those white-collar occupations where we pre-sume the amount of postschool investment isgreatest-professional and technical, managersand administrators, and sales-show the mostconcave earnings proftles. On the other hand,blue-collar occupations tend to have significant-ly flatter profiles. In addition, the empirical re-sults indicate an inverse relationship between OJand OJ.Those occupations showing the steepestrising profiles (highest OJ)also tend to show themost rapid decline (lowest OJ)'This finding isconsistent with an investment pattern whererates of return to occupational paths are equal-ized, while ko and T are inversely related.
Results from the estimation of earnings func-tion (2) indicate that earnings peak at differentagesand years ofexperience across occupations.7The earnings-experienceprofile is at a maximumat t* = -oj/20j for occupationj. The age at whichcross-sectional earnings are at a maximum is es-timated by addingto t* the mean years of school-ing in occupation j plus 6. Table 2 shows theyears of experience and age at which cross-sec-tion earnings peak by occupation. Of course,concave cross-sectional earnings profiles result,in part, from secularchangesin productivity (vin-tage effects) and in schooling quality and neednot imply that earnings for any singlecohort ac-tually decline during their working life [Rugglesand Ruggles,1978] .
6 These regression results are not shown. The esti-mated equation has SSR = 2012.4. We first test thenull hypothesis of equivalent intercepts and calculateF~654 = 45.55, thus rejectingHo at conventional signif-icance levels. We then separately test the null hypothe-sis of equivalent slope coefficients on t and t2 and cal-culate F.,':38 = 1.63. The relevant tabular values for theF statistic in the latter case areF.O5 = 1.61 andF.o1 =1.94.
7 Because In WW is on the right-hand side of the re-gression, the peak of weekly wages is, in effect, beingobserved. Generally, earnings peak earlier than do wagerates.
TABLE 2
YEARS OF EXPERIENCE AND AGEAT WHICHCROSS-SECTION EARNINGS
PEAK, BY OCCUPATION
Estimates are from specification (2).
OJt*'= --J 20.J
OJ -Age*'= - - + S. + 6
J 20. JJ
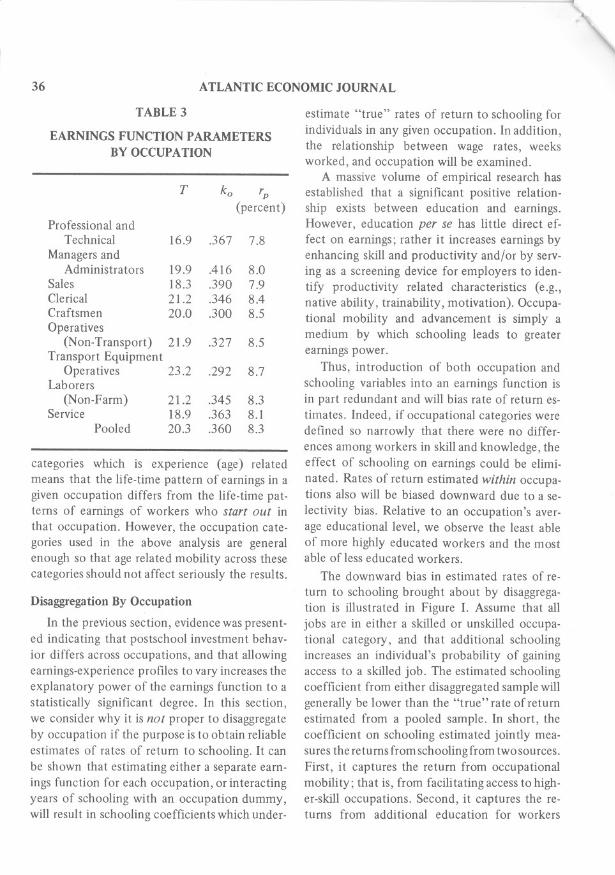
Table 3 presents estimates of the investmentparameters T, ko, and rp by occupation. Ratesof return to postschool investment are found tovary little among occupational paths, a findingconsistent with equilibrium efficiency condi-tions. The estimates of ko and T suggest thatthe initial investment intensity is greater in white-collar than in blue-collar occupations, while thelength of the net investment span is shorter.These results are consistent with the finding ofmore concave earnings profiles in white-collaroccupations. While estimates are somewhat sen-sitive to alternative assumptions and specifica-tions, they are highly suggestive,and in accordwith apriori expectations.
Note that the existence of occupational mo-bility over the life-cycle may introduce a prob-lem in interpreting the estimated occupationalearnings profiles. Mobility across occupational
t AgeProfessional and
Technical 26.9 48.2Managersand
Administrators 29.9 49.0Sales 28.3 47.2Clerical 31.2 49.3Craftsmen 30.0 46.8Operatives 31.9 48.1Transport Equipment
Operatives 33.2 49.3Laborers (Non-Farm) 31.2 47.2Service 28.9 45.4
36
------..':t,
ATLANTIC ECONOMICJOURNAL
TABLE 3
EARNINGS FUNCTION PARAMETERSBY OCCUPATION
categories which is experience (age) relatedmeans that the life-time pattern of earnings in agiven occupation differs from the life-time pat-terns of earnings of workers who start out inthat occupation. However, the occupation cate-gories used in the above analysis are generalenough so that age related mobility across thesecategories should not affect seriously the results.
Disaggregation By Occupation
In the previous section, evidence was present-ed indicating that postschool investment behav-ior differs across occupations, and that allowingearnings-experience profiles to vary increases theexplanatory power of the earnings function to astatistically significant degree. In this section,we consider why it is not proper to disaggregateby occupation if the purpose is to obtain reliable
estimates of rates of return to schooling. It canbe shown that estimating either a separate earn-ings function for each occupation, or interactingyears of schooling with an occupation dummy,will result in schooling coefficients which under-
estimate "true" rates of return to schooling forindividuals in any given occupation. In addition,the relationship between wage rates, weeksworked, and occupation will be examined.
A massive volume of empirical research hasestablished that a significant positive relation-ship exists between education and earnings.However, education per se has little direct ef-fect on earnings; rather it increases earnings byenhancing skill and productivity and/or by serv-ing as a screening device for employers to iden-tify productivity related characteristics (e.g.,native ability, trainability, motivation). Occupa-tional mobility and advancement is simply amedium by which schooling leads to greaterearnings power.
Thus, introduction of both occupation andschooling variables into an earnings function isin part redundant and will bias rate of return es-
timates. Indeed, if occupational categories weredefined so narrowly that there were no differ-ences among workers in skill and knowledge, theeffect of schooling on earnings could be elimi-nated. Rates of return estimated within occupa-tions also will be biased downward due to a se-
lectivity bias. Relative to an occupation's aver-age educational level, we observe the least ableof more highly educated workers and the mostable of less educated workers.
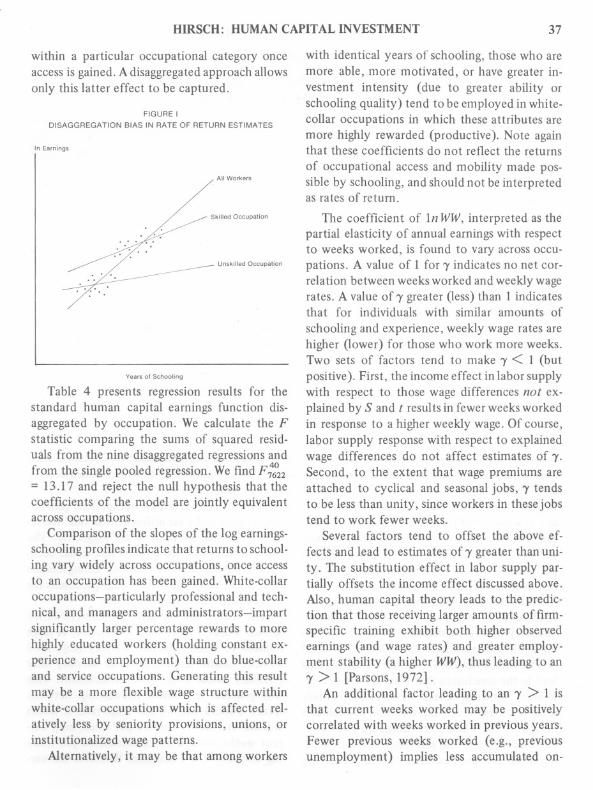
The downward bias in estimated rates of re-
turn to schooling brought about by disaggrega-tion is illustrated in Figure 1. Assume that alljobs are in either a skilled or unskilled occupa-tional category, and that additional schoolingincreases an individual's probability of gainingaccess to a skilled job. The estimated schoolingcoefficient from either disaggregated sample willgenerally be lower than the "true" rate of returnestimated from a pooled sample. In short, thecoefficient on schooling estimated jointly mea-sures the returns from schooling from two sources.First, it captures the return from occupationalmobility; that is, from facilitating access to high-er-skill occupations. Second, it captures the re-turns from additional education for workers
T ko rp(percent)
Professional andTechnical 16.9 .367 7.8
Managers andAdministrators 19.9 .416 8.0
Sales 18.3 .390 7.9Clerical 21.2 .346 8.4Craftsmen 20.0 .300 8.5Operatives
(Non-Transport) 21.9 .327 8.5Transport Equipment
Operatives 23.2 .292 8.7Laborers
(Non-Farm) 21.2 .345 8.3Service 18.9 .363 8.1
Pooled 20.3 .360 8.3
HIRSCH: HUMAN CAPITAL INVESTMENT
within a particular occupational category onceaccess is gained. A disaggregated approach allowsonly this latter effect to be captured.
FIGURE IDISAGGREGATION BIAS IN RATE OF RETURN ESTIMATES
In Eamings
All Wo,kers
Skilled Occupat;on
. /.. . ;.
Unsk;lIed Occupation
Years of Schooling
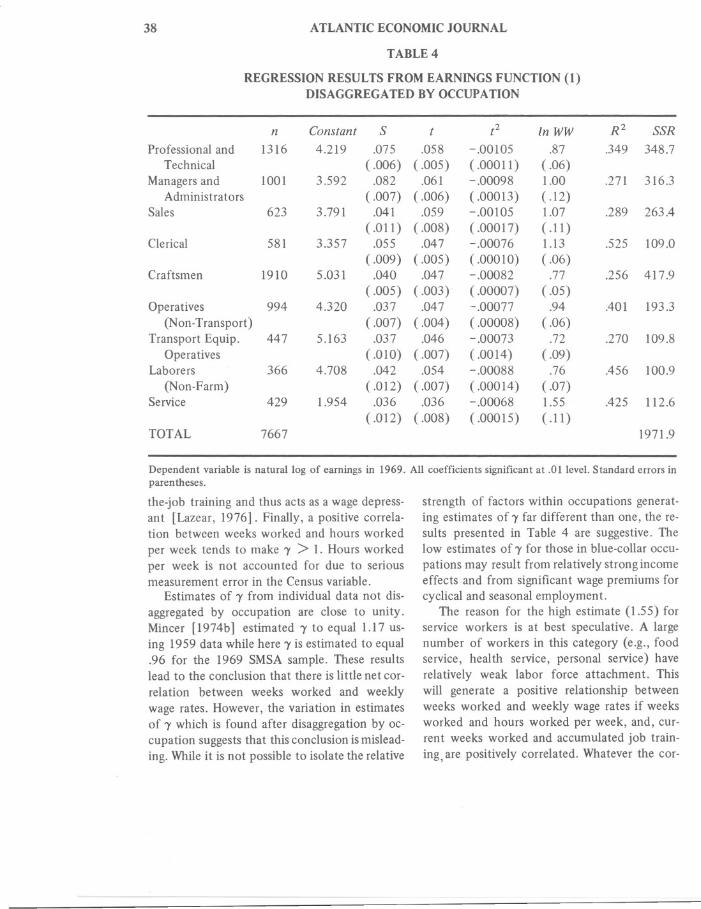
Table 4 presents regression results for thestandard human capital earnings function dis-aggregated by occupation. We calculate the Fstatistic comparing the sums of squared resid-uals from the nine disaggregatedregressionsandfrom the singlepooled regression.We find F~2= 13.17 and reject the null hypothesis that thecoefficients of the model are jointly equivalentacross occupations.
Comparison of the slopes of the log earnings-schooling profiles indicate that returns to school-ing vary widely across occupations, once accessto an occupation has been gained. White-collaroccupations-particularly professional and tech-nical, and managers and administrators-impartsignificantly larger percentage rewards to morehighly educated workers (holding constant ex-perience and employment) than do blue-collarand service occupations. Generating this resultmay be a more flexible wage structure withinwhite-collar occupations which is affected rel-atively less by seniority provisions, unions, orinstitutionalized wage patterns.
Alternatively, it may be that among workers
37
with identical years of schooling, those who aremore able, more motivated, or have greater in-vestment intensity (due to greater ability orschooling quality) tend to be employed in white-collar occupations in which these attributes aremore highly rewarded (productive). Note againthat these coefficients do not reflect the returnsof occupational access and mobility made pos-sible by schooling, and should not be interpretedas rates of return.
The coefficient of In WW, interpreted as thepartial elasticity of annual earningswith respectto weeks worked, is found to vary across occu-pations. A value of 1 for'Yindicates no net cor-relation between weeksworked and weekly wagerates. A value of'Y greater (less) than 1 indicatesthat for individuals with similar amounts ofschooling and experience, weekly wage rates arehigher (lower) for those who work more weeks.Two sets of factors tend to make 'Y< 1 (butpositive). First, the income effect in labor supplywith respect to those wage differences not ex-plained by Sand t results in fewerweeksworkedin response to a higher weekly wage. Of course,labor supply response with respect to explainedwage differences do not affect estimates of 'Y.Second, to the extent that wage premiums areattached to cyclical and seasonal jobs, 'Ytendsto be less than unity, since workers in thesejobstend to work fewer weeks.
Several factors tend to offset the above ef-fects and lead to estimates of'Y greater than uni-ty. Thesubstitution effect in labor supply par-tially offsets the income effect discussedabove.Also, human capital theory leads to the predic-tion that those receivinglarger amounts of firm-specific training exhibit both higher observedearnings (and wage rates) and greater employ-ment stability (a higher WW), thus leading to an'Y > 1 [Parsons, 1972] .
An additional factor leading to an 'Y > 1 isthat current weeks worked may be positivelycorrelated with weeks worked in previous years.Fewer previous weeks worked (e.g., previousunemployment) implies less accumulated on-
38 ATLANTICECONOMICJOURNAL
TABLE 4
REGRESSIONRESULTS FROM EARNINGSFUNCTION (1)DISAGGREGATED BY OCCUPATION
Dependent variable is natural log of earnings in 1969. All coefficients significant at .01 level. Standard errors inparentheses.
the-job training and thus acts as a wage depress-ant [Lazear, 1976]. Final]y, a positive corre]a-tion between weeks worked and hours workedper week tends to make 'Y> 1. Hours workedper week is not accounted for due to seriousmeasurement error in the Censusvariable.
Estimates of 'Yfrom individual data not dis-aggregated by occupation are close to unity.Mincer [1974b] estimated 'Yto equal 1.17 us-ing 1959 data while here 'Yis estimated to equal.96 for the 1969 SMSA sample. These resultslead to the conclusion that there is little net cor-relation between weeks worked and weeklywage rates. However, the variation in estimatesof 'Ywhich is found after disaggregationby oc-cupation suggeststhat this conclusion ismis]ead-ing. Whileit is not possible to isolate the relative
strength of factors within occupations generat-ing estimates of'Y far different than one, the re-sults presented in Tab]e 4 are suggestive. Thelow estimates of'Y for those in blue-collar occu-pations may result from relativelystrong incomeeffects and from significant wage premiums forcyclical and seasonal employment.
The reason for the high estimate (1.55) forservice workers is at best speculative. A largenumber of workers in this category (e.g., foodservice, health service, personal service) haverelatively weak labor force attachment. Thiswill generate a positive relationship betweenweeks worked and weekly wage rates if weeksworked and hours worked per week, and, cur-rent weeks worked and accumulated job train-ing, are positively correlated. Whatever the cor-
n Constant S t t2 In WW R2 SSR
Professiona] and 1316 4.219 .075 .058 - .00105 .87 .349 348.7Technical (.006) (.005) (.00011) (.06)
Managersand 100] 3.592 .082 .061 -.00098 1.00 .27] 316.3Administrators ( .007) (.006) (.00013) (.12)
Sales 623 3.791 .041 .059 -.00105 1.07 .289 263.4(.01 ]) (.008) (.00017) (.11)
Clerical 581 3.357 .055 .047 - .00076 1.13 .525 109.0(.009) (.005) (.00010) (.06)
Craftsmen 1910 5.031 .040 .047 - .00082 .77 .256 417.9(.005) (.003) (.00007) (.05)
Operatives 994 4.320 .037 .047 - .00077 .94 .401 193.3(Non-Transport) (.007) (.004) (.00008) (.06)
Transport Equip. 447 5.163 .037 .046 -.00073 .72 .270 ]09.8Operatives (.010) (.007) (.0014) (.09)
Laborers 366 4.708 .042 .054 - .00088 .76 .456 100.9(Non-Farm) ( .012) (.007) (.00014) (.07)
Service 429 1.954 .036 .036 - .00068 1.55 .425 112.6(.012) (.008) (.00015) (.11)
TOTAL 7667 1971.9
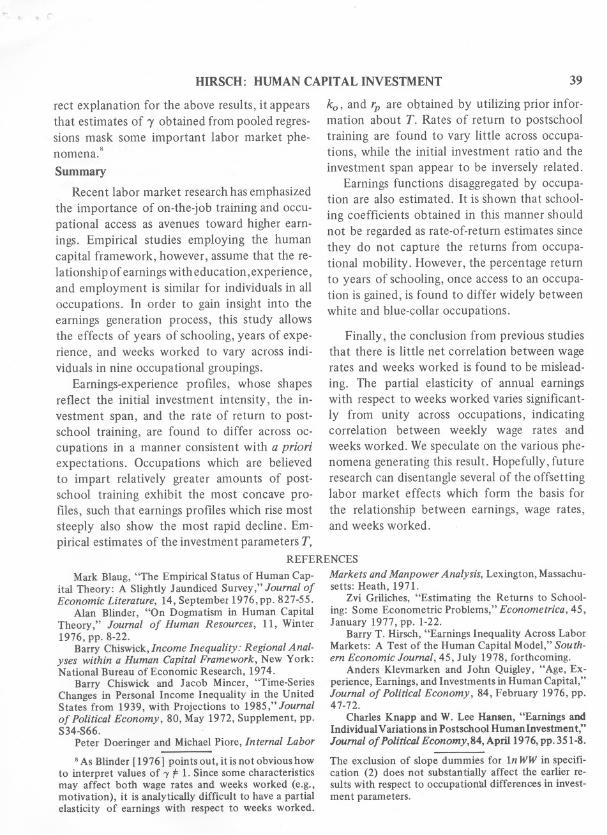
HIRSCH: HUMANCAPITALINVESTMENT 39
ko, and rp are obtained by utilizing prior infor-mation about T. Rates of return to postschooltraining are found to vary little across occupa-tions, while the initial investment ratio and theinvestment span appear to be inversely related.
Earnings functions disaggregated by occupa-tion are also estimated. It is shown that school-
ing coefficients obtained in this manner shouldnot be regarded as rate-of-return estimates sincethey do not capture the returns from occupa-tional mobility. However, the percentage returnto years of schooling, once access to an occupa-tion is gained, is found to differ widely betweenwhite and blue-collar occupations.
Finally, the conclusion from previous studiesthat there is little net correlation between wagerates and weeks worked is found to be mislead-
ing. The partial elasticity of annual earningswith respect to weeks worked varies significant-ly from unity across occupations, indicatingcorrelation between weekly wage rates andweeks worked. We speculate on the various phe-nomena generating this result. Hopefully, futureresearch can disentangle several of the offsettinglabor market effects which form the basis for
the relationship between earnings, wage rates,and weeks worked.
rect explanation for the above results, it appearsthat estimates of 'Yobtained from pooled regres-sions mask some important labor market phe-
8nomena.
Summary
Recent labor market researchhas emphasizedthe importance of on-the-job training and occu-pational access as avenues toward higher earn-ings. Empirical studies employing the humancapital framework, however, assume that the re-lationship of earningswitheducation,experience,and employment is similar for individuals in alloccupations. In order to gain insight into theearnings generation process, this study allowsthe effects of years of schooling, years of expe-rience, and weeks worked to vary across indi-viduals in nine occupational groupings.
Earnings-experience profiles, whose shapesreflect the initial investment intensity, the in-vestment span, and the rate of return to post-school training, are found to differ across oc-cupations in a manner consistent with a prioriexpectations. Occupations which are believedto impart relatively greater amounts of post-school training exhibit the most concave pro-files, such that earningsprofiles which rise moststeeply also show the most rapid decline. Em-pirical estimates of the investment parameters T,
REFERENCES
Mark Blaug, "The Empirical Status of Human Cap-ital Theory: A Slightly Jaundiced Survey," Journal ofEconomic Literature, 14, September 1976, pp. 827-55.
Alan Blinder, "On Dogmatism in Human CapitalTheory," Journal of Human Resources, 11, Winter1976, pp. 8-22.
Barry Chiswick,Income Inequality: Regional Anal-yses within a Human Capital Framework, New York:National Bureau of Economic Research, 1974.
Barry Chiswick and Jacob Mincer, "Time-SeriesChanges in Personal Income Inequality in the UnitedStates from 1939, with Projections to 1985," Journalof Political Economy, 80, May 1972, Supplement, pp.S34-S66.
Peter Doeringer and Michael Piore, Internal Labor
8 AsBlinder [1976] points out, it is not obvioushowto interpret values of 'Y f 1. Since some characteristicsmay affect both wage rates and weeks worked (e.g.,motivation), it is analytically difficult to have a partialelasticity of earnings with respect to weeks worked.
Markets and Manpower Analysis, Lexington, Massachu-setts: Heath, 1971.
Zvi Griliches, "Estimating the Returns to School-ing: Some Econometric Problems," Econometrica, 45,January 1977, pp. 1-22.
BarryT. Hirsch, "Earnings Inequality Across LaborMarkets: A Test of the Human Capital Model," South-ern Economic Journal, 45, July 1978, forthcoming.
Anders Klevmarken and John Quigley, "Age, Ex-perience, Earnings, and Investments in Human Capital,"Journal of Political Economy, 84, February 1976, pp.47- 72.
Charles Knapp and W. Lee Hansen, "Earnings andIndividual Variations in Postschool Humanb).vestmen t,"Journal of Political Economy, 84, Apri11976, pp. 351-8.
The exclusion of slope dummies for In WW in specifi-cation (2) does not substantially affect the earlier re-sults with respect to occupation1l1 differences in invest-ment parameters. .

40 ATLANTIC ECONOMICJOURNAL
Edward Lazear, "Age, Experience, and WageGrowth," American Economic Review, 66, September1976, pp. 548-58.
Jacob Mincer, "Progress in Human Capital Analysesof the Distribution of Earnings," National Bureau ofEconomic Research Working Paper No. 53, 1974a.
-, Schooling, Experience, and Earnings, NewYork: National Bureau of Economic Research, 1974b.
Donald Parsons, "Specific Human Capital: An Ap-plication to Quit Rates and Layoff Rates," Journal ofPolitical Economy, 80, November 1972, pp. 1120-43.
Carl Ra1m, "Investment in Training and the Occu-
pational Structure of Earnings in the United States,"unpublished Ph.D. dissertation, Columbia, 1971.
Sherwin Rosen, "Human Capital: A Survey of Em-pirical Research,"in Ronald G. Ehrenberg, ed.,Researchin Labor Economics, Greenwich, CT: JAI Press, 1977.
Nancy Ruggles and Richard Ruggles, "The Anatomyof Earnings Behavior," in F. Thomas Juster, ed., TheDistribution of Economic Well Being, New York: Na-tional Bureau of Economic Research, forthcoming.
Lester Thurow, Generating Inequality: Mechanismsof Distribution in the U.S. Economy, New York: BasicBooks, 1975.