© banque centrale du luxembourg, 2008 - bcl.lu · 3.3.1.1 revisions of the organic law of the bcl...
TRANSCRIPT

© Banque centrale du Luxembourg, 2008
The BCL Annual Report 2007 is an abridged translation of the Rapport Annuel de
la BCL 2007, which is the binding version.
Reproduction for educational and non-commercial purposes is permitted provided
that the source is acknowledged.
Banque centrale du Luxembourg
2, boulevard Royal - L-2983 Luxembourg
Telephone: (+352) 4774 - 1
Fax: (+352) 4774 - 4910
Internet: www.bcl.lu
E-mail: [email protected]


The Governor’s Message
1 ECONOMIC AN D F I NANCIAL S I TUAT ION
1.1 Economic situation at the international level 1.1.1 Short-term interest rates and monetary policy decisions 1.1.2 Long-term government bond yields 1.1.3 Equity markets 1.1.4 Exchange rate developments 1.1.5 Consumer prices 1.1.6 Output, demand and labour market developments 1.1.7 External trade 1.1.8 Balance of payments
1.2 Economic Situation in Luxembourg 1.2.1 Prices and costs
1.2.1.1 Consumer prices and inflation projections
1.2.1.2 Construction prices
1.2.2 Sectoral developments
1.2.2.1 Industry
1.2.2.2 Construction
1.2.2.3 Trade and other sectors
1.2.3 Consumer survey 1.2.4 Economic growth 1.2.5 Financial sector
1.2.5.1 Credit institutions’ balance sheets
1.2.5.2 Retail interest rates in Luxembourg
1.2.5.3 Employment in the banking sector
1.2.5.4 Credit institutions’ profit and loss accounts
1.2.5.5 Undertakings for collective investment
1.2.5.6 Money market funds
1.2.5.7 Bank lending survey
1.2.6 Luxembourg Stock Exchange 1.2.7 Labour market 1.2.8 External trade 1.2.9 Balance of payments 1.2.10 Macroeconomic projections 1.2.11 Public finances
1.2.11.1 Budgetary policy overview
1.2.11.2 General government revenue
1.2.11.3 General government expenditure
1.2.11.4 General government net lending or borrowing
Contents
08
111113141517181819
2020
20
30
31
31
32
32
343440
44
46
48
50
52
52
54
565864697679
79
80
80
82
8585
85
87
89
8989
90
9191919192
9394
94
95
9696
9797979798
9898
98
103
103104
104
105
106106106
107107108
2. THE BCL'S OPER AT IONS
2.1 Monetary policy operations 2.1.1 Open market operations
2.1.1.1 Main refinancing operations (MRO) in 2007
2.1.1.2 Longer-term refinancing operations (LTRO) in 2007
2.1.1.3 Fine tuning operations in 2007
2.1.2 Standing facilities 2.1.3 Minimum reserves
2.2 Foreign exchange reserves management by the BCL 2.3 Management of the BCL’s assets 2.3.1 Institutional structure 2.3.2 Risk control 2.3.3 Conceptual framework 2.3.4 Structure of portfolios 2.4 Banknotes and coins 2.4.1 Circulation of banknotes and coins
2.4.1.1 Euro banknotes and coins
2.4.1.2 Luxembourg franc banknotes and coins
2.4.2 Handling of banknotes and coins 2.4.3 Numismatic issues 2.5 Developments in the area of statistics 2.5.1 Money and banking statistics 2.5.2 External statistics 2.5.3 Economic and financial statistics 2.5.4 Other statistics
2.6 Payment and securities settlement systems 2.6.1 Real-time gross settlement systems
2.6.1.1 The activity of LIPS-Gross in 2007
2.6.1.2 Migration to TARGET2-LU
2.6.2 The interbank netting system LIPS-Net 2.6.3 The general framework of eligible collateral in the Eurosystem credit operations
2.6.3.1 The list of eligible assets
2.6.3.2 Eurosystem as a user of securities settlement systems
2.6.4 Correspondent Central Banking Model (CCBM) 2.6.5 The future management of collateral by the Eurosystem 2.6.6 Night Time Link with Clearstream Banking Luxembourg
2.7 Financial stability 2.7.1 The macro-prudential surveillance 2.7.2 The oversight of payment and securities settlement systems

111
111111111111112
113113
113
115
115
115
115
115
115
115
116
116
116
116
116117
117
117
119
120120120120121121121
3. EX TERNAL ACT IV IT I ES
3.1 Activities with the International Monetary Fund (IM) and other organisations 3.2 Activity at the European level 3.2.1 Activity at the level of the ECB 3.2.2 The Lisbon Treaty and the enlargement of the euro area 3.2.3 The Economic and Financial Committee 3.2.4 The Committee on Monetary, Financial and Balance of Payments Statistics
3.3 National activities 3.3.1 Legal developments
3.3.1.1 Revisions of the organic law of the BCL
3.3.1.2 Legal rate of interest
3.3.2 External committees
3.3.2.1 The Economic Committee (Comité de conjoncture)
3.3.2.2 The Consumer Price Index Commission
(Commission de l’indice des prix à la consommation)
3.3.2.3 Committee "Comptabilité bancaire"
3.3.2.4 Higher Council for Statistics of Luxembourg
3.3.2.5 XRBL Luxembourg asbl
3.3.3. BCL Committees
3.3.3.1 The Statistics committee
3.3.3.2 The Monetary and financial statistics consultative commission
3.3.3.3 The Balance of payments statistics consultative commission
3.3.4 Training at the BCL 3.3.5 Ex ternal events
3.3.5.1 Conferences and international meetings
3.3.5.2 Bilateral relations
3.3.5.3 Relations with the Luxembourg Parliament
3.4 Communication Activities 3.4.1 Annual reports 3.4.2 Periodical Bulletins 3.4.3 Working papers 3.4.4 The BCL’s website 3.4.5 The library 3.4.6. Press relations
4. BCL AS AN ORGANISAT ION
4.1 The Council and the Executive Board 4.1.1 The Council 4.1.2 The Board of Directors
4.2 The Corporate Governance 4.2.1 The restructuring of the BCL in 2007 4.2.2 The internal supervisory mechanisms 4.2.3 The external supervisory mechanisms 4.2.4 The code of conduct 4.2.5 The Eurosystem Procurement Co-ordination Office (EPCO)
4.3 The BCL staff 4.3.1 Quantitative evolution 4.3.2 Human resources management 4.3.3 Staff training 4.3.4 The Pension Fund4.3.5 Legal disputes
4.4 Facilities
4.5 Internal finance
4.6 The budget
4.7 The Internal Audit Activities
4.8 Financial statements as at 31 December 2007 4.8.1 Key figures 4.8.2 Report of the Independent Auditor 4.8.3 Balance sheet as at 31 December 2007 4.8.4 Off-balance sheet as at 31 December 2007 4.8.5 Profit and loss account for the year 2007 4.8.6 Notes to the financial statements as at 31 December 2007
5. ANNEXES
5.1 List of BCL circulars published in 2008
5.2 BCL Publications
5.3 Statistics series of the BCL
5.5 Glossary
123123123
125125125126126127
127127129129130130
131
132
133
133
134134135136138138139
157
157
159
163

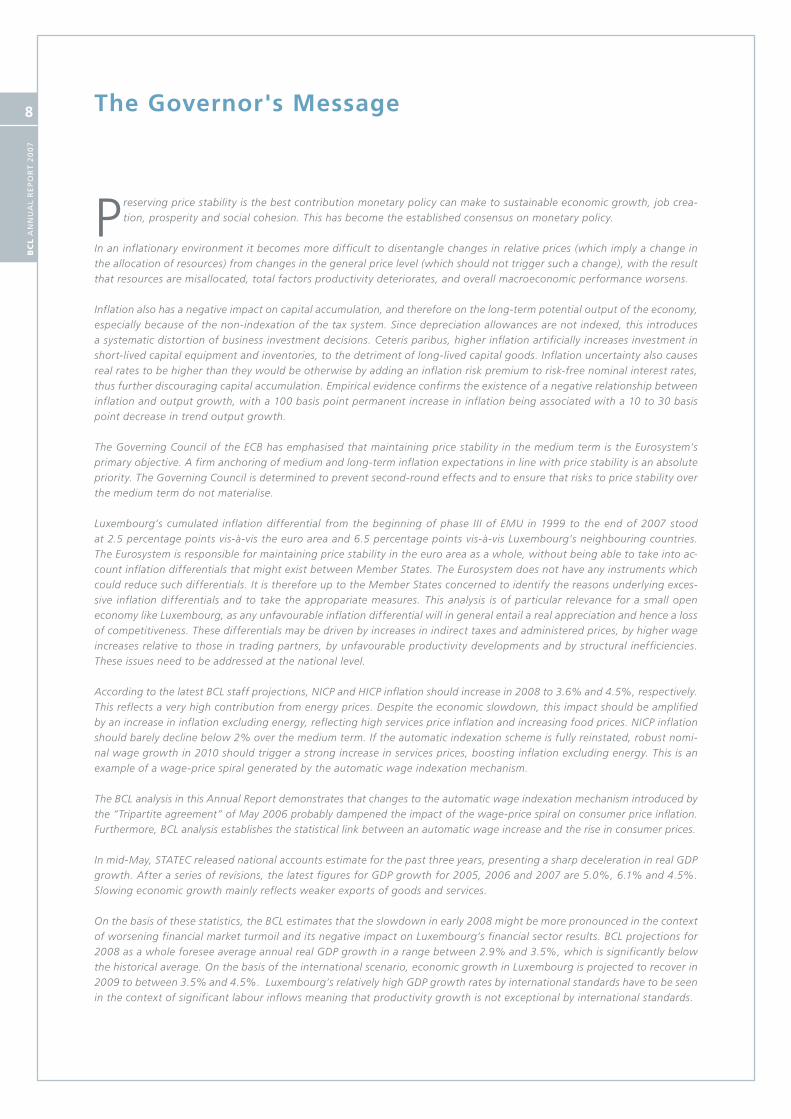
P reserving price stability is the best contribution monetary policy can make to sustainable economic growth, job crea-
tion, prosperity and social cohesion. This has become the established consensus on monetary policy.
In an inflationary environment it becomes more difficult to disentangle changes in relative prices (which imply a change in
the allocation of resources) from changes in the general price level (which should not trigger such a change), with the result
that resources are misallocated, total factors productivity deteriorates, and overall macroeconomic performance worsens.
Inflation also has a negative impact on capital accumulation, and therefore on the long-term potential output of the economy,
especially because of the non-indexation of the tax system. Since depreciation allowances are not indexed, this introduces
a systematic distortion of business investment decisions. Ceteris paribus, higher inflation artificially increases investment in
short-lived capital equipment and inventories, to the detriment of long-lived capital goods. Inflation uncertainty also causes
real rates to be higher than they would be otherwise by adding an inflation risk premium to risk-free nominal interest rates,
thus further discouraging capital accumulation. Empirical evidence confirms the existence of a negative relationship between
inflation and output growth, with a 100 basis point permanent increase in inflation being associated with a 10 to 30 basis
point decrease in trend output growth.
The Governing Council of the ECB has emphasised that maintaining price stability in the medium term is the Eurosystem’s
primary objective. A firm anchoring of medium and long-term inflation expectations in line with price stability is an absolute
priority. The Governing Council is determined to prevent second-round effects and to ensure that risks to price stability over
the medium term do not materialise.
Luxembourg’s cumulated inflation differential from the beginning of phase III of EMU in 1999 to the end of 2007 stood
at 2.5 percentage points vis-à-vis the euro area and 6.5 percentage points vis-à-vis Luxembourg’s neighbouring countries.
The Eurosystem is responsible for maintaining price stability in the euro area as a whole, without being able to take into ac-
count inflation differentials that might exist between Member States. The Eurosystem does not have any instruments which
could reduce such differentials. It is therefore up to the Member States concerned to identify the reasons underlying exces-
sive inflation differentials and to take the appropariate measures. This analysis is of particular relevance for a small open
economy like Luxembourg, as any unfavourable inflation differential will in general entail a real appreciation and hence a loss
of competitiveness. These differentials may be driven by increases in indirect taxes and administered prices, by higher wage
increases relative to those in trading partners, by unfavourable productivity developments and by structural inefficiencies.
These issues need to be addressed at the national level.
According to the latest BCL staff projections, NICP and HICP inflation should increase in 2008 to 3.6% and 4.5%, respectively.
This reflects a very high contribution from energy prices. Despite the economic slowdown, this impact should be amplified
by an increase in inflation excluding energy, reflecting high services price inflation and increasing food prices. NICP inflation
should barely decline below 2% over the medium term. If the automatic indexation scheme is fully reinstated, robust nomi-
nal wage growth in 2010 should trigger a strong increase in services prices, boosting inflation excluding energy. This is an
example of a wage-price spiral generated by the automatic wage indexation mechanism.
The BCL analysis in this Annual Report demonstrates that changes to the automatic wage indexation mechanism introduced by
the “Tripartite agreement” of May 2006 probably dampened the impact of the wage-price spiral on consumer price inflation.
Furthermore, BCL analysis establishes the statistical link between an automatic wage increase and the rise in consumer prices.
In mid-May, STATEC released national accounts estimate for the past three years, presenting a sharp deceleration in real GDP
growth. After a series of revisions, the latest figures for GDP growth for 2005, 2006 and 2007 are 5.0%, 6.1% and 4.5%.
Slowing economic growth mainly reflects weaker exports of goods and services.
On the basis of these statistics, the BCL estimates that the slowdown in early 2008 might be more pronounced in the context
of worsening financial market turmoil and its negative impact on Luxembourg’s financial sector results. BCL projections for
2008 as a whole foresee average annual real GDP growth in a range between 2.9% and 3.5%, which is significantly below
the historical average. On the basis of the international scenario, economic growth in Luxembourg is projected to recover in
2009 to between 3.5% and 4.5%. Luxembourg’s relatively high GDP growth rates by international standards have to be seen
in the context of significant labour inflows meaning that productivity growth is not exceptional by international standards.
The Governor's Message
BC
L A
nn
uA
l R
Ep
oR
t 2
00
7
8

Since 1996, unit labour costs have grown faster in Lux-
embourg than in the surrounding countries. This increase
reflects faster growth of wages per employee and slower
growth of labour productivity than in the three neigh-
bouring countries. Weak labour productivity growth could
be explained by a total factor productivity contribution
that has been low by international standards and even
negative in the most recent years. On the other hand, the
contribution of the capital-labour ratio has been higher
than in neighbouring countries. This suggests that Luxem-
bourg depends on capital accumulating much faster than
employment growth. Under this configuration, Luxem-
bourg’s labour productivity seems vulnerable to a po-
tential fall in the country’s attractiveness for foreign
investors.
The competitiveness indicators calculated by the BCL
indicate a continuing deterioration, even when they are
extended to 2010 using the results of the recent Eurosystem
projection exercise. However, as noted in the BCL 2006
Annual Report, this needs to be interpreted carefully
because in the past the deterioration of various price
and cost competitiveness indicators was accompanied by
robust export growth in Luxembourg. However, Luxem-
bourg remains especially vulnerable to a slowdown, or
even a fall, in international trade, as has been projected by the main international organisations. Luxembourg’s high
estimated export elasticities with respect to foreign demand suggest that such a negative development at the global
level could have amplified effects in Luxembourg.
As indicated during the presentation of the BCL Financial Stability Report, the impact of the financial turmoil on the real
economy and on public finances may be more negative than expected on the basis of 2007 results, especially given the wide
methodological differences in evaluating falls in asset prices. Fluctuations early in 2008 represent a very important source
of uncertainty for public finances. Central government may move once again into deficit in 2008. For 2009, the general
government surplus should also deteriorate with respect to its position in 2008.
In this context, the BCL echoes various international institutions, and in particular the European Commission, who repeatedly
stressed the urgent need for reforms to guarantee the long-term sustainability of Luxembourg’s old-age pension system. In its
assessment of the ninth update of Luxembourg’s Stability Programme, the European Commission indicates that the estimated
impact of ageing will be a spectacular increase in general government debt. This should exceed 60% of GDP shortly after 2030.
We are celebrating the tenth anniversary of the Banque centrale du Luxembourg, as it was created on the 1st June 1998.
The initial objective was to anchor the new institution within the European System of Central Banks and within the national
institutional environment. This has been pursued with determination by applying a high level of professionalism.
Despite its low initial level of capital, the Bank has successfully resisted international financial shocks.
Its strategy and management have been validated by results.
At the level of the ESCB, we have been entrusted with the creation of a “Eurosystem Procurement Coordination Office”.
At the national level, a legislative framework for the Bank’s cooperation in financial stability matters is in preparation.
This success reflects the quality and motivation of a staff that is committed to the declared values. It represents an encour-
agement to continue in the direction chosen and to give our best in the service of our country in the heart of our Europe.
Yves Mersch
BC
L A
nn
uA
l R
Ep
oR
t 2
00
7
9


BC
L A
nn
uA
l R
Ep
oR
t 2
00
7
111. Economic and financial situation
CHART 1:
KEy PoLICy RATES oF THE EuRoSySTEM,
THE EoNIA AND THE THREE-MoNTH
EuRIBoR
1.1 Economic situation at the international level
1.1.1 Short-term interest rates and monetary policy decisions
The Governing Council of the ECB raised the minimum
bid rate for the main refinancing operations by a total
of 50 basis points in March and in June 2007; in June
2008, the minimum bid rate stood at 4.00%. The in-
terest rates on the deposit facility and on the marginal
lending facility were raised to 3.00% and 5.00% res-
pectively. Since the onset of market turmoil in August
2007, the Eurosystem’s monetary policy was conducted
in a context of heightened uncertainty, in particular with
regard to the impact of market tensions on economic
developments.
Market turmoil also impinged on the overnight interbank
lending rate (EONIA), while the three-month EURIBOR
increased considerably in spite of the liquidity measures
undertaken by the Eurosystem.
Annual HICP inflation averaged 2.1% in 2007, after 2.2%
in 2006. The situation in the second quarter of 2007 sug-
gested that annual HICP inflation would rise considerably
at the end of the year; indeed, from the fourth quarter of
2007, the annual rate of inflation considerably exceeded
Sources : ECB, Bloomberg
1999/01
2000/01
2001/01
2002/01
2003/01
2004/01
2005/01
2006/01
2007/01
2008/01
3-month EURIBOR
Deposit facility
EONIA (euro overnight index average)
Marginal lending facility
Main refinancing operations
0
1.00
2.00
3.00
4.00
5.00
6.00
7.00
1. ECONOMIC AND FINANCIAL SITUATION
BC
L A
nn
uA
l R
Ep
oR
t 2
00
7
12
Source : ECB
Jan. 99
Apr. 99
July 99
Oct. 99
Jan. 00
Apr. 00
July 00
Oct. 00
Jan. 01
Apr. 01
July 01
Oct. 01
Jan. 02
Apr. 02
July 02
Oct. 02
Jan. 03
Apr. 03
July 03
Oct. 03
Jan. 04
Apr. 04
July 04
Oct. 04
Jan. 05
Apr. 05
July 05
Oct. 05
Jan. 06
Apr. 06
July 06
Oct. 06
Jan. 07
Apr. 07
Jan. 08
Apr. 08
July 07
Oct. 07
-3
-2
-1
0
1
2
3
4
5
6
7
8
9
10
11
12
13
Currency in circulation Overnight deposits
Other short-term deposits (M2 - M1) Marketable instruments (M3 - M2)
Loans to the private sector (right hand scale)M3 annual growth rate
(yearly changes in percentage; contributions to yearly changes in percentage points)
CHART 2:
MoNEy AND CREDIT DEvELoPMENTS
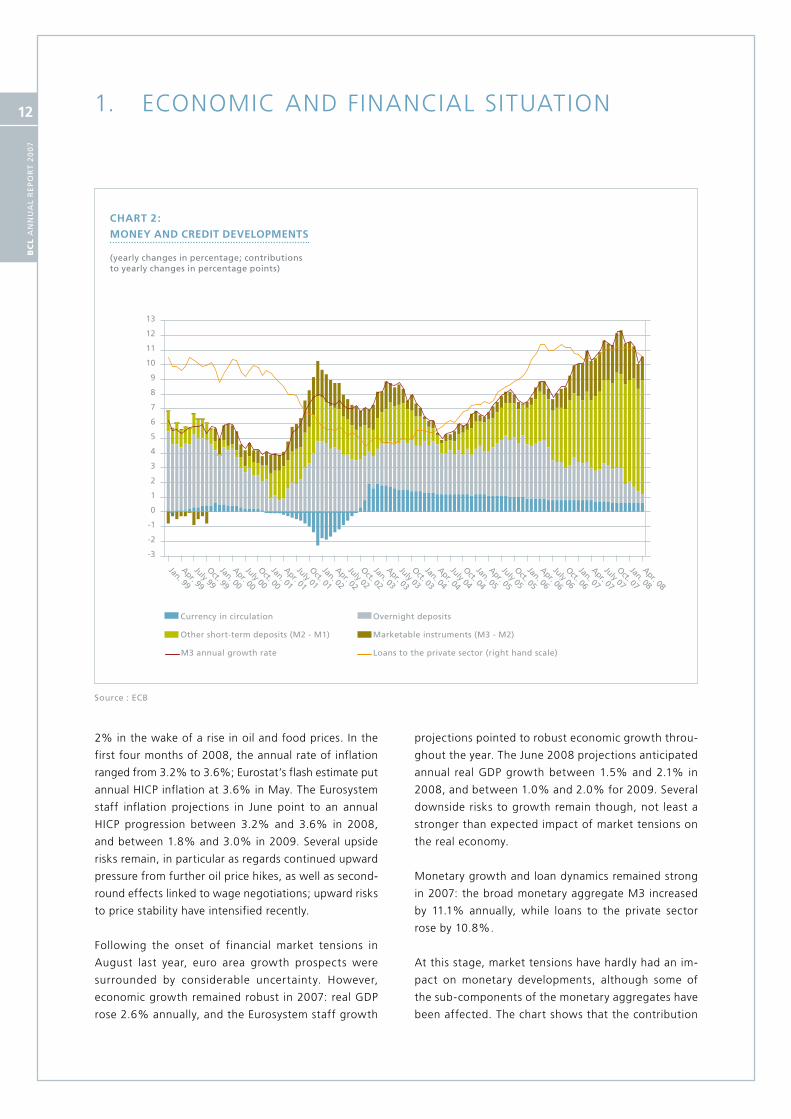
2% in the wake of a rise in oil and food prices. In the
first four months of 2008, the annual rate of inflation
ranged from 3.2% to 3.6%; Eurostat’s flash estimate put
annual HICP inflation at 3.6% in May. The Eurosystem
staff inflation projections in June point to an annual
HICP progression between 3.2% and 3.6% in 2008,
and between 1.8% and 3.0% in 2009. Several upside
risks remain, in particular as regards continued upward
pressure from further oil price hikes, as well as second-
round effects linked to wage negotiations; upward risks
to price stability have intensified recently.
Following the onset of financial market tensions in
August last year, euro area growth prospects were
surrounded by considerable uncertainty. However,
economic growth remained robust in 2007: real GDP
rose 2.6% annually, and the Eurosystem staff growth
projections pointed to robust economic growth throu-
ghout the year. The June 2008 projections anticipated
annual real GDP growth between 1.5% and 2.1% in
2008, and between 1.0% and 2.0% for 2009. Several
downside risks to growth remain though, not least a
stronger than expected impact of market tensions on
the real economy.
Monetary growth and loan dynamics remained strong
in 2007: the broad monetary aggregate M3 increased
by 11.1% annually, while loans to the private sector
rose by 10.8%.
At this stage, market tensions have hardly had an im-
pact on monetary developments, although some of
the sub-components of the monetary aggregates have
been affected. The chart shows that the contribution

BC
L A
nn
uA
l R
Ep
oR
t 2
00
7
13
of the narrow aggregate M1 (made up of “money in
circulation” and “overnight deposits”) has moderated
further. The strong annual progression of “other short
term deposits” (M2-M1) has continued, however, and
their annual growth rate reached 20.2% in April this
year, compared to 11.7% at end-2006. M2-M1 has
thus put considerable upward pressure on the broad
aggregate, as highlighted in the chart. As for the sub-
components of M2-M1, deposits with an agreed matu-
rity of up to two years grew particularly strongly, while
in 2007 and early 2008 deposits redeemable at notice
of up to three months even regressed on an annual
basis. The impact of marketable instruments (M3-M2)
on M3 also intensified in the course of 2007, before
tapering off from November onwards. Money market
fund shares and units, one of the sub-components
of M3-M2, progressed continuously in the first seven
months of 2007, while several outflows have been re-
corded since the onset of financial market tensions in
August. Debt securities of up to two years also grew
considerably: at end-2007, their annual growth rate
stood close to 60%.
As for the counterparts of M3, loans to the private sec-
tor have stabilised at a growth rate around 11% since
mid-2007. The annual progression of loans to non-fi-
nancial corporations increased continuously in the period
under review, hitting a historical high of 15.0% in March
2008. Loans to households continued to trend down on
an annual basis.
The Governing Council of the ECB is monitoring very
closely all developments. It is in a state of heightened
alertness. By acting in a firm and timely manner, the
Governing Council will prevent second-round effects and
ensure that risks to price stability over the medium term
do not materialise. The Governing Council is determined
to secure a firm anchoring of medium and long-term
inflation expectations in line with price stability.
1.1.2 Long-term government bond yields
At end-2007, the yield on euro area long-term govern-
ment bonds stood at 4.4%; this constitutes a 45 basis
point increase compared to end-2006. In the first five
months of 2008, euro area government bond yields
have risen somewhat, ending at 4.5%. Since around
mid-2007, the yield spread between US and euro area
bonds has fallen considerably, turning negative in No-
vember and standing at minus 46 basis points in May
2008. Indeed, the yield on US Treasuries dropped almost
70 basis points in the course of 2007; between end-2007
and end-May 2008, the yield has risen slightly and rea-
ched almost 4.1%. Since August 2007, market volatility
rose considerably. In light of a steepening of the yield
curve, the yield spread between two-year and ten-year
bonds rose sharply in the euro area from August 2007,
before declining slightly since March 2008.
In the first half of 2007 bond yields rose on both sides
of the Atlantic in light of favourable growth prospects.
This upward trend was only briefly interrupted between
end-January and mid-March when market participants
re-assessed US growth prospects. At the end of Februa-
ry, yields were put under additional pressure following
a flight to quality caused by market turmoil in China.
The upward trend observable in the first half of 2007
began to reverse as early as June when the first signs
of sub-prime related market tensions surfaced: at first,
bond yields fell across the entire maturity spectrum and
volatility began to increase. Market tensions intensified
in July and August and investors became increasingly
nervous about contagion effects. Government bonds
quickly became safe haven investments, which is com-
mon in times of increased uncertainty. The yield on
US Treasuries fell much more sharply than euro area
government bond yields in light of several cuts in the
federal funds rate, leading to a significant drop in the
spread between bond yields in the US and the euro
area. Indeed, the federal funds rate was cut by 100
basis points between September and December 2007
while the minimum bid rate on the ECB’s main refinan-
cing operations remained unchanged.
Uncertainty continued to haunt market participants
throughout the remainder of the period under review,
while market expectations regarding further rate cuts
only provided temporary respite. Furthermore, while
rate cuts usually lead to lower government bond yields,
this time they boosted confidence and optimism, which
put upward pressure on bond yields. Stock market vola-
tility, caused in large part by bleaker growth prospects
in the US, spread to international bond markets. In
the euro area, government bond yields rose between

1. ECONOMIC AND FINANCIAL SITUATION
BC
L A
nn
uA
l R
Ep
oR
t 2
00
7
14
January and May 2008, causing the spread over US
Treasuries to become somewhat more negative. To
some extent, the evolution of the spread reflects a
stronger resilience of euro area fundamentals. Since
mid-March, the rise in long-term government bond
yields should be seen against the backdrop of a re-
newed rise in market participants’ appetite for risk.
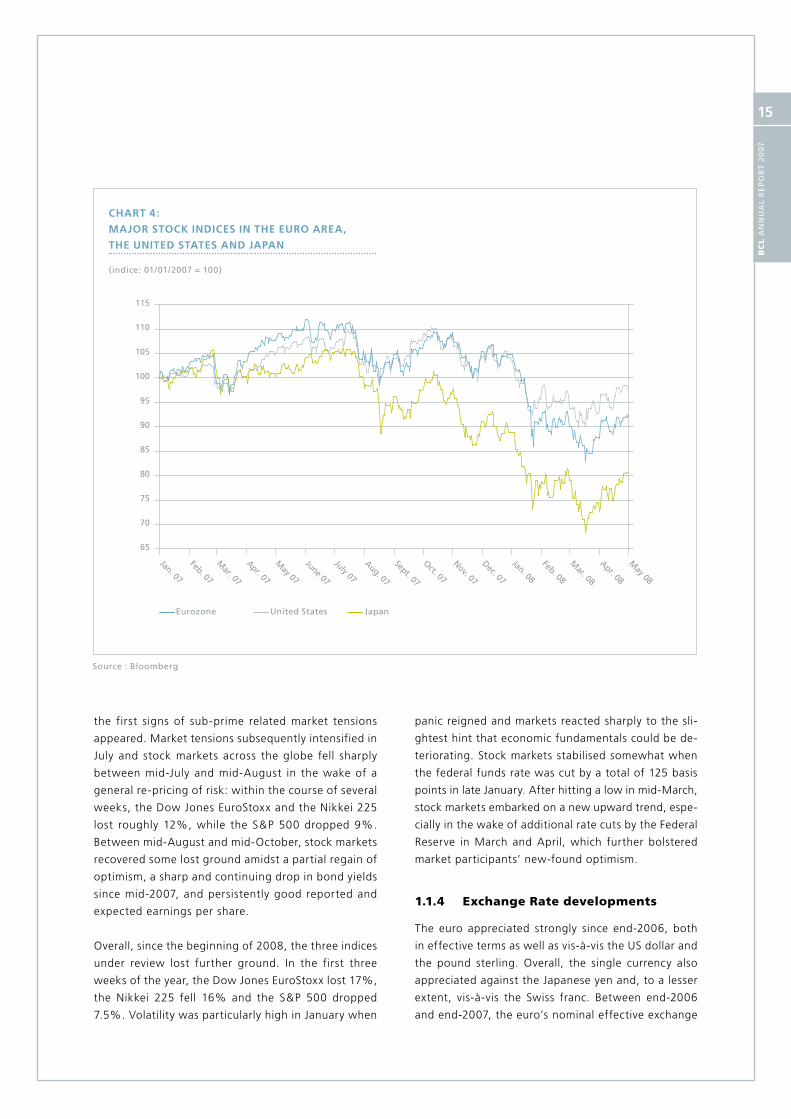
1.1.3 Equity markets
While the Dow Jones EuroStoxx and the S&P 500 pro-
gressed in 2007, the Nikkei 225 fell considerably. The
Dow Jones EuroStoxx rose by 4.9% and finished the
year at 414.9, while the S&P 500 only rose 3.5%; the
Nikkei 225 fell 11.1%. Thus, although stock markets
continued their upward progression in the euro area
and in the United States, the upward trend has slowed
down considerably compared to 2006 when the two
indices rose by 20% and 14% respectively. Moreover,
the Nikkei’s decline stands in stark contrast with its past
performance in 2006 and 2005, when it progressed by
7% and 40% respectively.
Overall stock market developments should be seen
against the backdrop of heightened uncertainty and
volatility since the onset of market turmoil around
mid-2007. In the first five months of the year, all three
indices under review lost ground overall, in spite of the
rally discernible since mid-March 2008.
In the first half of 2007, stock markets continued their
upward trend from 2006, notwithstanding several
short periods of market turmoil such as the tensions in
Chinese markets at end-February which led to a mas-
sive sell-off. The upward trend observable in the first
half of 2007 began to cool off as early as June when
Sources : Bloomberg, ECB
Jan. 07
Feb. 07
Mar. 07
Apr. 07
May 07
June 07
July 07
Aug. 07
Sept. 07
Oct. 07
Nov. 07
Dec. 07
Jan. 08
Feb. 08
Mar. 08
Apr. 08
Spread 10 years / 2 years (RHS) Euro area 10-year bond (LHS)
Spread euro area / US (RHS)T-Note 10 years (LHS)
-0.8
-0.6
-0.4
-0.2
0.0
0.2
0.4
0.6
0.8
1.0
1.2
1.4
1.6
1.8
3.0
3.2
3.4
3.6
3.8
4.0
4.2
4.4
4.6
4.8
5.0
5.2
5.4
5.6
(lHS: percentages per annum, RHS: percentage points)
CHART 3:
LoNG-TERM GovERNMENT BoND yIELDS
IN THE EuRo AREA AND IN THE uNITED STATES
BC
L A
nn
uA
l R
Ep
oR
t 2
00
7
15
the first signs of sub-prime related market tensions
appeared. Market tensions subsequently intensified in
July and stock markets across the globe fell sharply
between mid-July and mid-August in the wake of a
general re-pricing of risk: within the course of several
weeks, the Dow Jones EuroStoxx and the Nikkei 225
lost roughly 12%, while the S&P 500 dropped 9%.
Between mid-August and mid-October, stock markets
recovered some lost ground amidst a partial regain of
optimism, a sharp and continuing drop in bond yields
since mid-2007, and persistently good reported and
expected earnings per share.
Overall, since the beginning of 2008, the three indices
under review lost further ground. In the first three
weeks of the year, the Dow Jones EuroStoxx lost 17%,
the Nikkei 225 fell 16% and the S&P 500 dropped
7.5%. Volatility was particularly high in January when
panic reigned and markets reacted sharply to the sli-
ghtest hint that economic fundamentals could be de-
teriorating. Stock markets stabilised somewhat when
the federal funds rate was cut by a total of 125 basis
points in late January. After hitting a low in mid-March,
stock markets embarked on a new upward trend, espe-
cially in the wake of additional rate cuts by the Federal
Reserve in March and April, which further bolstered
market participants’ new-found optimism.
1.1.4 Exchange Rate developments
The euro appreciated strongly since end-2006, both
in effective terms as well as vis-à-vis the US dollar and
the pound sterling. Overall, the single currency also
appreciated against the Japanese yen and, to a lesser
extent, vis-à-vis the Swiss franc. Between end-2006
and end-2007, the euro’s nominal effective exchange
Source : Bloomberg
Jan. 07
Feb. 07
Mar. 07
Apr. 07
May 07
June 07
July 07
Aug. 07
Sept. 07
Oct. 07
Nov. 07
Dec. 07
Jan. 08
Feb. 08
Mar. 08
Apr. 08
May 08
Eurozone United States Japan
65
70
75
80
85
90
95
100
105
110
115
(indice: 01/01/2007 = 100)
CHART 4:
MAjoR SToCK INDICES IN THE EuRo AREA,
THE uNITED STATES AND jAPAN

1. ECONOMIC AND FINANCIAL SITUATION
BC
L A
nn
uA
l R
Ep
oR
t 2
00
7
16
Sources : Bloomberg, ECB
Jan. 07
Feb. 07
Mar. 07
Apr. 07
May 07
June 07
July. 07
Aug. 07
Sept. 07
Oct. 07
Nov. 07
Dec. 07
Jan. 08
Feb. 08
Mar. 08
Apr. 08
May 08
EUR/USD GBP/EUR NEER 24 (Nominal effective exchange rate)
104
106
108
110
112
114
116
118
1.23
1.28
1.33
1.38
1.43
1.48
1.53
1.58
CHART 5:
ExCHANGE RATE DEvELoPMENTS
rate (NEER)1 appreciated by more than 6%. Over that
same period, the euro rose more than 10% against
the US dollar, ending the year at USD 1.46; the single
currency rose 9% against the pound sterling, ending
the year at GBP 0.74.
Since early-2008, the euro has continued to appreciate
against the US dollar and the pound sterling. The euro’s
appreciation against the dollar can be largely explained
by diverging growth prospects in the United States and
in the euro area, as well as by the change in interest
rate differentials. As regards the euro’s exchange rate
vis-à-vis the pound, the single currency evolved in a
relatively narrow range up until September when it
began to appreciate following market participants’
revised interest rates expectations in the UK. The euro-
yen exchange rate behaved in a very volatile fashion
since the Japanese currency is widely used as a fun-
ding currency in carry trade operations; a rise in risk
aversion in times of financial turmoil quickly leads to
an unwinding of carry trade positions.
1 the nEER is a weighted average of bilateral euro exchange rates against the currencies of the euro area’s main trading partners.
The US dollar has a particularly strong impact on the
evolution of the NEER, in light of its weight in the
currency basket. While the euro’s appreciation against
the dollar in the first eight months of 2008 was so-
mewhat more moderate, in particular between May
and August, the single currency’s upward momentum
was soon reinforced by interest rate decisions on both
sides of the Atlantic: the ECB raised the minimum bid
rate on its main refinancing operations by 25 basis
points in March and in June respectively, while the
Federal Reserve left its federal funds rate unchanged
at 5.25%. While the onset of the market turmoil in
the summer months led to a sharp overall depreciation
of the euro versus the yen, the euro-dollar exchange
rate was at first hardly affected and even depreciated
slightly owing to the US Dollar’s status as a safe-haven
currency. However, the euro soon began to appreciate
against the dollar given that market participants felt
that US growth prospects had become increasingly
gloomy. From September onwards, the single currency
also appreciated considerably against the pound ster-
ling, in part owing to the liquidity crisis that brought
down Northern Rock.

BC
L A
nn
uA
l R
Ep
oR
t 2
00
7
17
The euro’s upward momentum slowed only partially
between November 2007 and February 2008, in the
context of market participants’ reappraisal of economic
and monetary policy developments in the US as well as
in the euro area. Between February and April, the sin-
gle currency appreciated sharply and hit historic highs
against the US dollar and the pound sterling, breaking
the USD 1.60 barrier and coming close to GBP 0.81.
These developments were largely linked to a drop in the
interest rate differentials between the euro area and
the United States and between the euro area and the
United Kingdom. It is likely that the euro’s rapid ap-
preciation is more than usually influenced by technical
elements and speculative pressures rather than from
changes in underlying economic fundamentals.
At the end of May 2008, the euro stood at USD 1.56,
GBP 0.79 and JPY 164.1.
1.1.5 Consumer prices
HICP inflation in the euro area averaged 2.1% in 2007,
compared to 2.2% the two previous years. Annual
inflation rates remained below 2% and broadly sta-
ble until the end of the summer and increased rapi-
dly thereafter, reaching 3.1% at the end of 2007. Oil
price increases (including base effects stemming from
previous energy price developments) and food price
increases significantly affected the profile of HICP in-
flation in 2007.
From January to July 2007 the impact of the rise in oil
prices on the energy price component of the HICP were
reduced by favourable base effects stemming from
the pronounced increase in energy prices observed
a year earlier. From September 2007 onwards, both
rising oil prices and unfavourable base effects led to a
considerable contribution from the energy component
to overall HICP inflation.
A major contribution to the rise in HICP inflation in late
2007 came from processed food prices, which started
to accelerate towards the end of the summer, reflecting
strong increases in the prices of certain agricultural
commodities in global markets.
The June 2008 Eurosystem staff projections antici-
pate average annual HICP inflation between 3.2% and
3.6% in 2008 and between 1.8% and 3.0% in 2009.
Compared with the March 2008 ECB staff projections,
the ranges projected for inflation in 2008 and 2009
are markedly higher, reflecting mostly higher oil and
food prices and increasing upward pressures in the
services sector.
2005 2006 2007 2006 2007 2007 2007 2007 2008 2008 2008 2008 2008 2008
Q4 Q1 Q2 Q3 Q4 Q1 Jan. Feb. Mar. April May
overall HICP 2.2 2.2 2.1 1.8 1.9 1.9 1.9 2.9 3.3 3.2 3.3 3.6 3.3 3.6
of which
-unprocessed food 0.8 2.8 3.0 4.1 3.1 3.3 2.4 3.0 3.5 3.3 3.2 3.8 3.1
-processed food 2.0 2.1 2.8 2.2 2.1 2.0 2.5 4.5 6.4 5.9 6.5 6.7 6.9
-non-energy industrial goods
0.3 0.6 1.0 0.8 1.1 1.0 1.0 1.1 0.8 0.7 0.8 0.9 0.8
-Energy 10.1 7.7 2.6 1.5 1.2 0.5 0.7 8.1 10.7 10.6 10.4 11.2 10.8
-Services 2.3 2.0 2.5 2.1 2.4 2.6 2.5 2.5 2.6 2.5 2.4 2.8 2.2
HICP excluding unpro-cessed food and energy
1.5 1.5 2.0 1.6 1.9 1.9 2.0 2.3 2.5 2.3 2.4 2.7 2.4
TABLE 1:
DEvELoPMENTS IN THE HICP AND ITS
CoMPoNENTS IN THE EuRo AREA
(ANNuAL PERCENTAGE CHANGES)
Source: Eurostat

1. ECONOMIC AND FINANCIAL SITUATION
BC
L A
nn
uA
l R
Ep
oR
t 2
00
7
18
1.1.6 Output, demand and labour market developments
The euro area economy performed well in 2007. On
average, real GDP growth was 2.6%, which is only
slightly below the 2.8% recorded in 2006, despite the
impact of energy price volatility and the uncertainty
resulting from the financial market turmoil in the se-
cond half of 2007 (see Chart 6).
Slower GDP growth in 2007 was mainly due to de-
velopments in private consumption and residential
investment as net exports remained robust.
On the domestic side, private consumption grew by
1.5% in 2007, down from 1.8% in 2006. The consump-
tion growth path in 2007 was strongly influenced by a
VAT increase in Germany in the first quarter of 2007.
Household consumption rebounded in the following
months, in line with improvements in real household
disposable income which were mainly driven by the
positive developments in employment and, to a lesser
extent, by growth in household real wealth. The wea-
kening in consumer confidence apparently linked to
the financial turmoil is considered to have had only a
limited direct impact on consumption, although consu-
mer credit standards were also tightened in the last few
months of the year. After rebounding strongly in 2006
(5.0%), total investment growth decelerated in 2007
at 4.3% for the year as a whole. This trend was most
pronounced in residential investment, reflecting the
end of the expansionary phase of the business cycle in
the construction sector in the context of slowing house
prices. As illustrated in the Eurosystem’s bank lending
survey for the fourth quarter of 2007, households’ net
demand for housing loans dropped considerably.
Euro area net exports expanded robustly by 24.1% in
2007 after 11.4% in 2006. However, this expansion
essentially reflected the drop in import growth that
exceeded the slowdown in export growth – caused by
the rapid euro appreciation over the year and strong
competition from China and other Asian countries -
was more than offset by a more pronounced slowdown
in import growth.
Against this background, the Eurosystem expects ave-
rage annual real GDP growth to decelerate to a rate
between 1.5% and 2.1% in 2008 and further to 1.0%
to 2.0% in 2009.
Labour market conditions in the euro area improved
significantly in 2007 in line with the pattern of econo-
mic growth. Strong employment growth observed in
2006 (1.4%) continued in 2007, with an annual growth
rate of 1.6% and around four million net new jobs
were created. According to the European Commission’s
Business and Consumer Survey, employment growth is
expected to decelerate in 2008 and 2009 (respectively
to 0.9% and 0.5%).
The evolution of euro area unemployment is in line
with employment trends as it has continued to fall in
2007, reaching 7.4% on average in 2007 after 8.3% on
average in 2006. This is the lowest rate seen since the
early 1980s. The latest data available for March 2008
confirm this trend as the unemployment rate declined
to 7.1% which represents - in absolute terms - less
than 11 million unemployed persons. Overall, lower
unemployment reflects robust employment growth in
line with the cyclical evolution of GDP growth as well
as the impact of labour market reforms and continued
wage moderation.
1.1.7 External trade
Euro area trade in goods grew at a slower pace in 2007,
after recording higher growth rates in 2006. Goods
exports reached €1 493 billion in 2007, increasing
by 8.3% compared with a growth rate of 11.6% in
2006. However goods imports saw a larger fall in their
growth rate, from 13.7% in 2006 to 5.6% in 2007
(reaching €1 471 billion). As a result the euro area
trade balance turned into a surplus of €22.3 billion in
2007, compared to a deficit of €14.3 billion in 2006.
This reversal reflects the improvement in the euro area
terms of trade in 2007 as a whole (see Chart).
The geochartical breakdown of trade shows that the
euro area surplus with the United Kingdom rose by
24% reaching €61 billion in 2007. However the surplus
vis-à-vis the United States declined by 13% to €64
billion in 2007 as a whole. Trade deficits with oil ex-
porting countries decreased: OPEC members (-32% at
€32.8 billion), Russia (-24% at €30 billion) and Norway

BC
L A
nn
uA
l R
Ep
oR
t 2
00
7
19
(-19% at €21 billion). However the usual heavy trade
deficit with China (€110 billion in 2007) and the deficit
with Japan (€24 billion) continued to broaden.
CHART 6:
MoNTHLy DEvELoPMENTS IN THE EuRo AREA
TRADE BALANCE AND IN THE TERMS oF TRADE
(SEASoNALLy ADjuSTED DATA)
Source: EuRoStAt
1.1.8 Balance of payments
In 2007 the current account of the euro area recor-
ded a surplus of €26.4 billion compared with a small
deficit of €1.3 billion in 2006. This shift reflected to a
large extent the improvement in the goods surplus as
imports grew slower than exports. The 21.8% increase
in the surplus of the services balance contributed also
to the improvement in the current account while the
balances for current transfers and for income deterio-
rated strongly.
In the financial account, the euro area recorded net
inflows of €103 billion in 2007 down from €112 billion
in 2006. Net outflows in direct investments dropped in
2007 and were largely offset by portfolio investment
net inflows resulting from the net sales of foreign
securities by euro area resident investors.
TABLE 2:
CoMPoSITIoN oF GDP GRowTH
(PERCENTAGE CHANGES)
Annual rates
Quarterly rates
2005 2006 2007 2006 2007 2007 2007 2007 2006 2007 2007 2007 2007
Q4 Q1 Q2 Q3 Q4 Q4 Q1 Q2 Q3 Q4
Real gross domestic product 1.6 2.8 2.6 3.2 3.2 2.5 2.7 2.2 0.8 0.7 0.3 0.7 0.4
of which:
Domestic demand 1.8 2.6 2.2 2.4 2.9 2.0 2.1 1.9 0.2 0.9 0.1 0.9 0.0
private consumption 1.6 1.8 1.5 2.1 1.4 1.6 1.7 1.1 0.5 0.1 0.6 0.5 -0.1
Government consumption 1.5 2.0 2.2 2.3 2.2 2.2 2.4 1.8 0.5 1.0 0.2 0.6 -0.1
Gross fixed capital formation 3.0 5.0 4.3 5.5 6.3 3.5 3.9 3.2 1.5 1.3 0.0 1.1 0.8
Net exports -9.4 11.4 24.1 60.9 21.8 27.0 37.6 14.2 40.6 -7.4 11.6 -5.3 16.7
Exports 4.7 7.9 6.0 9.0 6.6 6.0 7.2 4.4 3.3 0.8 0.9 2.0 0.6
Imports 5.5 7.7 5.2 7.1 5.9 5.0 5.9 3.8 1.7 1.3 0.3 2.5 -0.3
Sources : Eurostat
Terms of trade (Lefthand scale, basis 2000 = 100)
Trade balance seasonally adjusted (Righthand scale, EUR billion)
Jan. 02
July 02
Jan. 03
July 03
Jan. 04
July 04
Jan. 05
July 05
Jan. 06
July 06
Jan. 07
July 07
Jan. 08
8587899193959799
101103105
-5
-3
-1
1
3
5
7
9
11

1. ECONOMIC AND FINANCIAL SITUATION
BC
L A
nn
uA
l R
Ep
oR
t 2
00
7
20
Source : StAtEC
CHART 8:
BREAKDowN oF THE NATIoNAL CoNSuMER
PRICE INDEx (ANNuAL PERCENTAGE CHANGES)
Jan. 04
July 04
Jan. 05
July 05
Jan. 06
July 06
Jan. 07
July 07
Jan. 08
May 08
-15
-10
-5
0
5
10
15
20
25
30
National consumer price index (left-hand scale)
NICP excluding oil products (left-hand scale)
Oil products (left-hand scale)
0.0
0.5
1.0
1.5
2.0
2.5
3.0
3.5
4.0
4.5
CHART 7:
CuRRENT ACCouNT BALANCE AND ITS CoMPo-
NENTS (12- MoNTHS CuMuLATED TRANSACTIoNS)
Source: ECB
Current accountGoodsServicesIncomeCurrent transfers
20012002
20032004
20052006
20072008
-150
-100
-50
0
50
100
150
EU
R b
illi
on
s
1.2 Economic Situation in Luxembourg
1.2.1 Prices and costs
1.2.1.1 Consumer prices and inflation projections
The national index of consumer prices (NICP) increased
by an average 2.3% in 2007, down by a 0.4 percentage
point when compared with 2006. However, inflation
increased sharply since October 2007, reaching 3.4%
in December after having hovered around 2% since the
beginning of 2007. The increase in inflation at the end
of last year was mainly due to oil price developments
and rising food prices in the second half of 2007, and
adverse base effects related to energy prices.
BC
L A
nn
uA
l R
Ep
oR
t 2
00
7
21
Turning to developments in early 2008, inflation
remained above 3%. The annual rate of change of the
NICP even reached 4.0% in May 2008, which is the
highest rate on record since the series was introduced
in 1995.
Luxembourg’s inflation differentials against the euro
area and against the three neighbouring countries
remained unfavourable in 2007. Over the period from
the beginning of phase III of EMU in 1999 to the end
of 2007 Luxembourg’s cumulated inflation differential
stood at 2.5 percentage points vis-à-vis the euro area
and 6.5 percentage points vis-à-vis Luxembourg’s nei-
ghbouring countries.
According to the BCL’s consumer survey, qualitative in-
flation perceptions have risen sharply since August 2007,
reaching the highest level since the survey was launched
in 2002. Consumers’ inflation expectations also showed
a substantial increase in September, moderating thereaf-
ter while remaining high by historical standards.
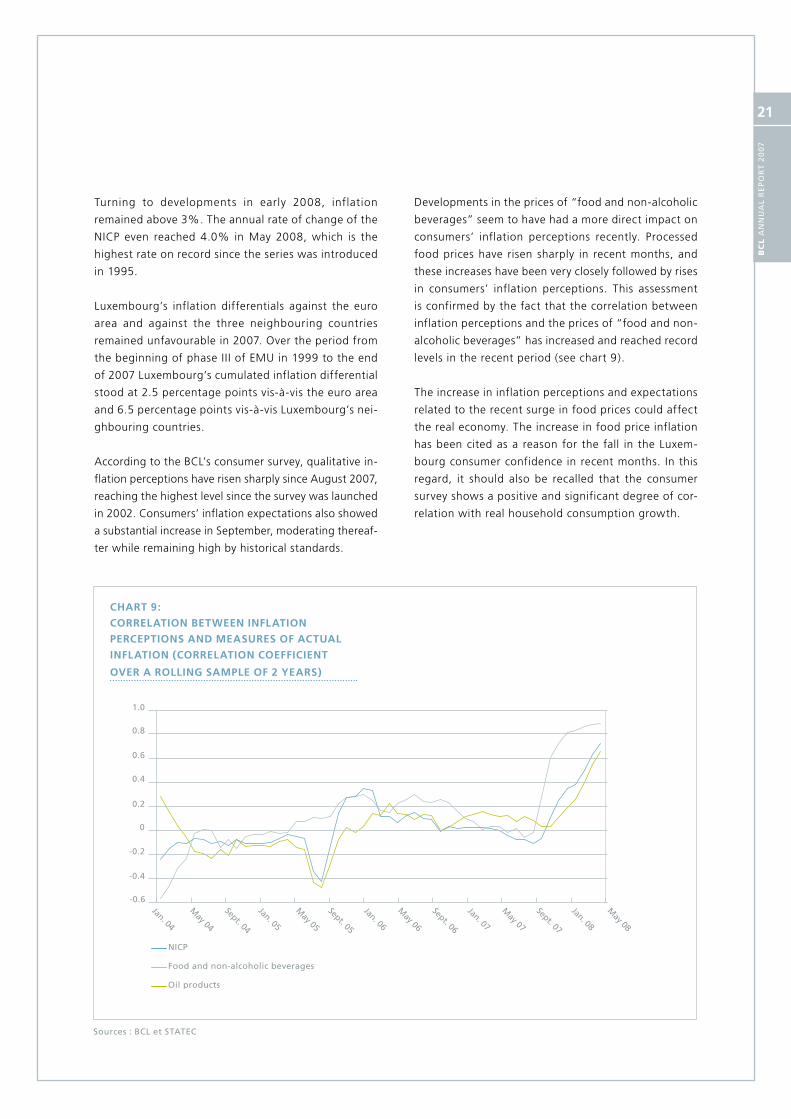
Developments in the prices of “food and non-alcoholic
beverages” seem to have had a more direct impact on
consumers’ inflation perceptions recently. Processed
food prices have risen sharply in recent months, and
these increases have been very closely followed by rises
in consumers’ inflation perceptions. This assessment
is confirmed by the fact that the correlation between
inflation perceptions and the prices of “food and non-
alcoholic beverages” has increased and reached record
levels in the recent period (see chart 9).
The increase in inflation perceptions and expectations
related to the recent surge in food prices could affect
the real economy. The increase in food price inflation
has been cited as a reason for the fall in the Luxem-
bourg consumer confidence in recent months. In this
regard, it should also be recalled that the consumer
survey shows a positive and significant degree of cor-
relation with real household consumption growth.
Sources : BCl et StAtEC
CHART 9:
CoRRELATIoN BETwEEN INFLATIoN
PERCEPTIoNS AND MEASuRES oF ACTuAL
INFLATIoN (CoRRELATIoN CoEFFICIENT
ovER A RoLLING SAMPLE oF 2 yEARS)
NICP
Food and non-alcoholic beverages
Oil products
Jan. 04
May 04
Sept. 04
Jan. 05
May 05
Sept. 05
Jan. 06
May 06
Sept. 06
Jan. 07
May 07
Jan. 08
May 08
Sept. 07
-0.6
-0.4
-0.2
0
0.2
0.4
0.6
0.8
1.0

1. ECONOMIC AND FINANCIAL SITUATION
BC
L A
nn
uA
l R
Ep
oR
t 2
00
7
22
Inflation projections
Assumptions
End of May, the price of oil fluctuated around 126
USD per barrel and the markets were anticipating a
stabilization at that level up to June 2009. The quote
for one euro against the dollar stood at 1.54, which
corresponds to an appreciation with respect to both
the average of 2007 and the previous exercise. Detailed
assumptions are given in the following table.
As regards the fiscal measures introduced by the go-
vernment, they remain unchanged compared to the
previous exercise.
Inflation excluding energy has recently turned out at
fairly high levels, and a couple of factors suggest that
it might persist around those levels in the near future.
Following the sharp rise in agricultural commodities
prices, such as wheat and milk, inflation of processed
food excluding tobacco has accelerated sharply in
recent months. It remains highly uncertain whether
the recent drop in commodities prices will also feed
through to lower consumer prices. The financial tur-
moil has clouded economic prospects in Luxembourg.
However, the eurozone has proved extremely resilient
and, although slower growth is likely in the second
quarter of 2008, there is not yet convincing evidence
of more persistent economic weakness. This context
favours the development of indirect effects stemming
from the rise in oil prices. In the labour market, wa-
ges might also continue on their accelerating path. In
Luxembourg though, these risks are contained in 2008
in light of the agreement to moderate the automatic
compensation for past inflation and the absence of a
further adjustment in the minimum wage. According
to the Eurosystem’s projections, imported inflation is
set for a sharp acceleration in 2008, before moderating
in 2009.
TABLE 3:
ASSuMPTIoNS uNDERLyING
THE INFLATIoN PRojECTIoNS
2006 2007 2008 08-Q1 08-Q2 08-Q3 08-Q4 09-Q1 09-Q2
Price of oil in uSD/barrel65.4 72.7 116.7 96.4 118.5 126 126 126 126
Exchange rate uSD/€
1.26 1.37 1.54 1.50 1.55 1.54 1.54 1.54 1.54
Price of oil in € (annual percentage changes) 18.6 1.4 43.7 45.1 49.6 49.4 32.9 26.9 7.0
Source: BCl
BC
L A
nn
uA
l R
Ep
oR
t 2
00
7
23
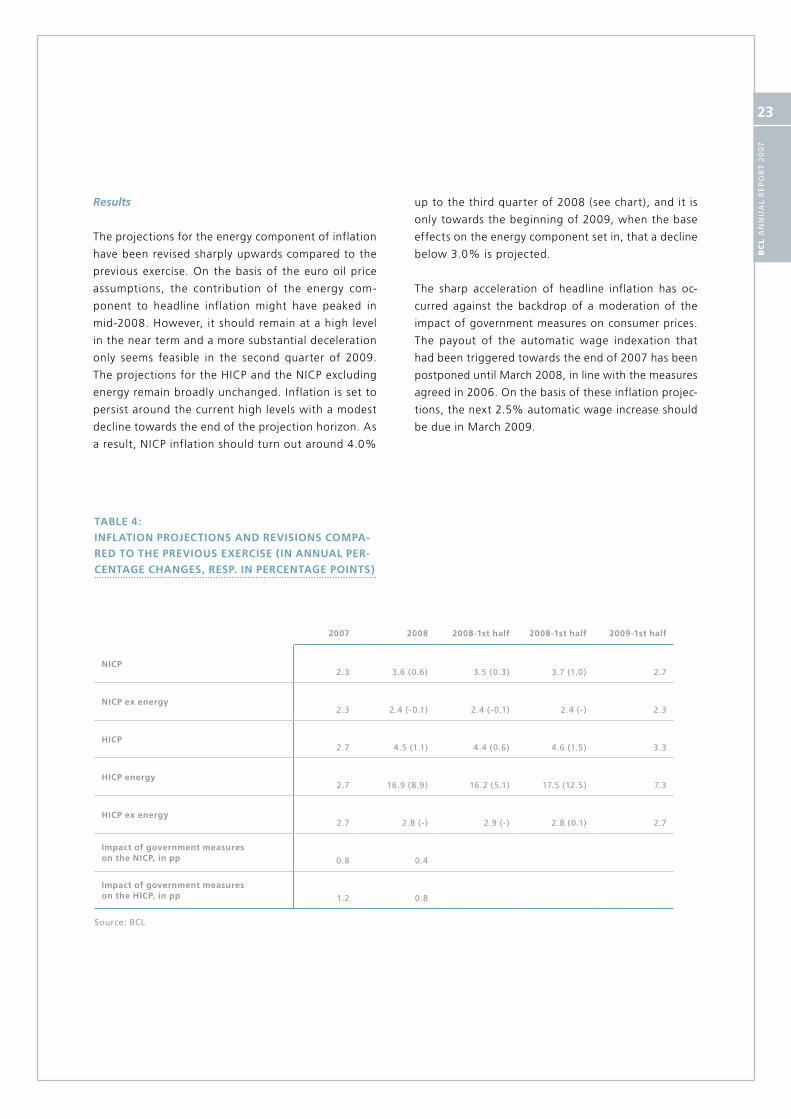
Results
The projections for the energy component of inflation
have been revised sharply upwards compared to the
previous exercise. On the basis of the euro oil price
assumptions, the contribution of the energy com-
ponent to headline inflation might have peaked in
mid-2008. However, it should remain at a high level
in the near term and a more substantial deceleration
only seems feasible in the second quarter of 2009.
The projections for the HICP and the NICP excluding
energy remain broadly unchanged. Inflation is set to
persist around the current high levels with a modest
decline towards the end of the projection horizon. As
a result, NICP inflation should turn out around 4.0%
up to the third quarter of 2008 (see chart), and it is
only towards the beginning of 2009, when the base
effects on the energy component set in, that a decline
below 3.0% is projected.
The sharp acceleration of headline inflation has oc-
curred against the backdrop of a moderation of the
impact of government measures on consumer prices.
The payout of the automatic wage indexation that
had been triggered towards the end of 2007 has been
postponed until March 2008, in line with the measures
agreed in 2006. On the basis of these inflation projec-
tions, the next 2.5% automatic wage increase should
be due in March 2009.
TABLE 4:
INFLATIoN PRojECTIoNS AND REvISIoNS CoMPA-
RED To THE PREvIouS ExERCISE (IN ANNuAL PER-
CENTAGE CHANGES, RESP. IN PERCENTAGE PoINTS)
2007 2008 2008-1st half 2008-1st half 2009-1st half
NICP2.3 3.6 (0.6) 3.5 (0.3) 3.7 (1.0) 2.7
NICP ex energy2.3 2.4 (-0.1) 2.4 (-0.1) 2.4 (-) 2.3
HICP2.7 4.5 (1.1) 4.4 (0.6) 4.6 (1.5) 3.3
HICP energy2.7 16.9 (8.9) 16.2 (5.1) 17.5 (12.5) 7.3
HICP ex energy2.7 2.8 (-) 2.9 (-) 2.8 (0.1) 2.7
Impact of government measures on the NICP, in pp 0.8 0.4
Impact of government measures on the HICP, in pp 1.2 0.8
Source: BCl

1. ECONOMIC AND FINANCIAL SITUATION
BC
L A
nn
uA
l R
Ep
oR
t 2
00
7
24
CHART 10:
CoNTRIBuTIoNS To NICP INFLATIoN
Sources : StAtEC, BCl calculations
2006-Q1 2006-Q3 2007-Q1 2007-Q3 2008-Q1 2008-Q3 2009-Q1
Unprocessed food Processed food
Non-energy industrial goods
Services
Energy
NICP
-0.5
0
0.5
1.0
1.5
2.0
2.5
3.0
3.5
4.0
4.5

BC
L A
nn
uA
l R
Ep
oR
t 2
00
7
25
1. ECONOMIC AND FINANCIAL SITUATION
BC
L A
nn
uA
l R
Ep
oR
t 2
00
7
26

BC
L A
nn
uA
l R
Ep
oR
t 2
00
7
27
Can automatic wage indexation generate an inflationary spiral?
Inflation has accelerated considerably over recent
months. While annual growth of N ICP f luc tuated
around 2.0% in mid-2007, it reached 4.0% in May
2008. This echoes the experience some years ago,
when inflation rose from an average of 1.0% in 1999
to 3.7% in November 2000. As at that time, the current
acceleration in inflation is largely attributable to the
rise in petrol prices. Back then, the BCL warned against
the potential danger of a wage-price spiral triggered
by the automatic wage indexation mechanism2. This
text box aims to revisit this discussion in the light of
recent events.
A wage-price spiral represents a situation in which
an initial increase in consumer prices boosts nominal
wages via the automatic indexation mechanism and, in
a second round, firms transmit the increase in labour
costs onto their selling price, generating feedback ef-
fects between wages and prices.
In a small open economy, such as Luxembourg which
imports more than 50% of its private consumption,
inflation is largely determined by external price de-
velopments. Imported inflation, originating mostly in
the three neighbouring countries, thus represents the
main source of fluctuations in Luxembourg’s consumer
prices. However, domestic factors, in particular labour
market conditions, can also play an important role.
This effect is most visible in the “Services” component
of the consumer price index, as this is essentially do-
mestic. Services are characterised by a high labour in-
tensity in production, meaning that labour costs play a
key role in determining their price. As a result, services
prices will be the first to reflect wage increases, espe-
cially those due to automatic wage indexation. This is
especially true for some categories of services whose
prices are officially linked to the sliding wage scale that
serves as the basis for the indexation mechanism.
Price developments since 2001 seem to confirm the
analysis published at the time. Chart 11 indicates that
2 See BCl 2000 Annual Report, pp.33-34.
services prices tend to accelerate after an automatic
2.5% wage increase. More recently, in March 2008,
the application of the indexation mechanism was fol-
lowed by an increase of about 1.0% in services prices
between February and April. However this time, the
process was already under way in the month of March.
Thus, unlike previous years, there was no delay between
the automatic wage increases and the acceleration in
services prices. The automatic 2.5% wage increase
that fell due in December 2007 had been delayed to
the month of March 2008, so that, unlike under the
previous functioning of the system, the timing of the
wage increase was no longer a surprise for the service
providers. Therefore, they were prepared in advance
to adjust their prices to compensate for the change in
their labour costs.
The apparent link between services prices, on the one
hand, and the wage indexation mechanism, on the
other, appears more clearly on chart 12. The wage
increase associated with the automatic indexation me-
chanism seems to act as a lower bound for services
price inflation. Since 2002, with the exception of some
short intervals of two months, the yearly increase in
the sliding wage scale remained constant at 2.5%,
which probably prevented services price inflation fal-
ling below this level. Conversely, the years 1996 and
1998 demonstrated that when the time span between
two automatic wage increases widened, services price
inflation could fall below this level, contributing to the
decrease in aggregate inflation.
The impact of an automatic wage increase on aggre-
gate inflation has been quantified using econometric
methods. Based on monthly data for the period Janua-
ry 1996 to May 2008, an estimated equation explains
monthly inflation (after seasonal adjustment) using a
dummy variable that takes the value unity in months
when wages are increased automatically and zero othe-
rwise. Month-on-month changes in petrol prices (in
euro) appear in the equation with a one-month delay.
The results are statistically significant: an automatic
2.5% wage increase raises month-on-month inflation

1. ECONOMIC AND FINANCIAL SITUATION
BC
L A
nn
uA
l R
Ep
oR
t 2
00
7
28
by 0.18 percentage points on average, or more than
2.1% at an annual rate. An automatic wage increase
has a statistically significant effect even after four
months and its effect is further prolonged by inflation
inertia. The cumulated impact over twelve months is
an additional 0.42 percentage point inflation for the
year as a whole. It should be emphasized that this
estimation only represents a lower bound, as it relies
on several assumptions, including the occurrence of a
single automatic wage increase during the whole year.
Furthermore, this analysis is limited to the short-term
impact of an automatic wage increase and does not
consider longer-term effects that may be associated
with the existence of an automatic wage indexation
mechanism.
The Tripartite agreement of May 2006 introduced
changes to the automatic wage indexation mechanism
that probably dampened the impact of the wage-
price spiral. The postponement of automatic wage
increases to some pre-determined dates preserved an
interval of at least 12 months between two conse-
cutive automatic wage increases. This avoided the
superimposition of two automatic wage increases on
an annual basis, as would otherwise have been the
case in the third quarter of 2006 and would be the
case again towards the end of 2008 (green line on
chart 12). In this counterfactual scenario, services
price inflation would have accelerated even more, as
was observed end-2001 and beginning-2002, when
it even exceeded 4%.
Unless a new agreement is negotiated or the current
accord is extended, the modulation of the automa-
tic wage indexation mechanism will expire end-2009.
On the basis of the current inflation projections, the
Sources: StAtEC data, BCl calculations
Jan. 95
Jan. 96
Jan. 97
Jan. 98
Jan. 99
Jan. 00
Jan. 01
Jan. 02
Jan. 03
Jan. 04
Jan. 05
Jan. 06
Jan. 07
Jan. 08
Jan. 09
Annualised growth rate of 3-months moving average of services prices
Annualised growth rate of 6-months moving average of services prices
0
1.0
2.0
3.0
4.0
5.0
6.0
CHART 11:
SERvICES PRICE INFLATIoN
BC
L A
nn
uA
l R
Ep
oR
t 2
00
7
29
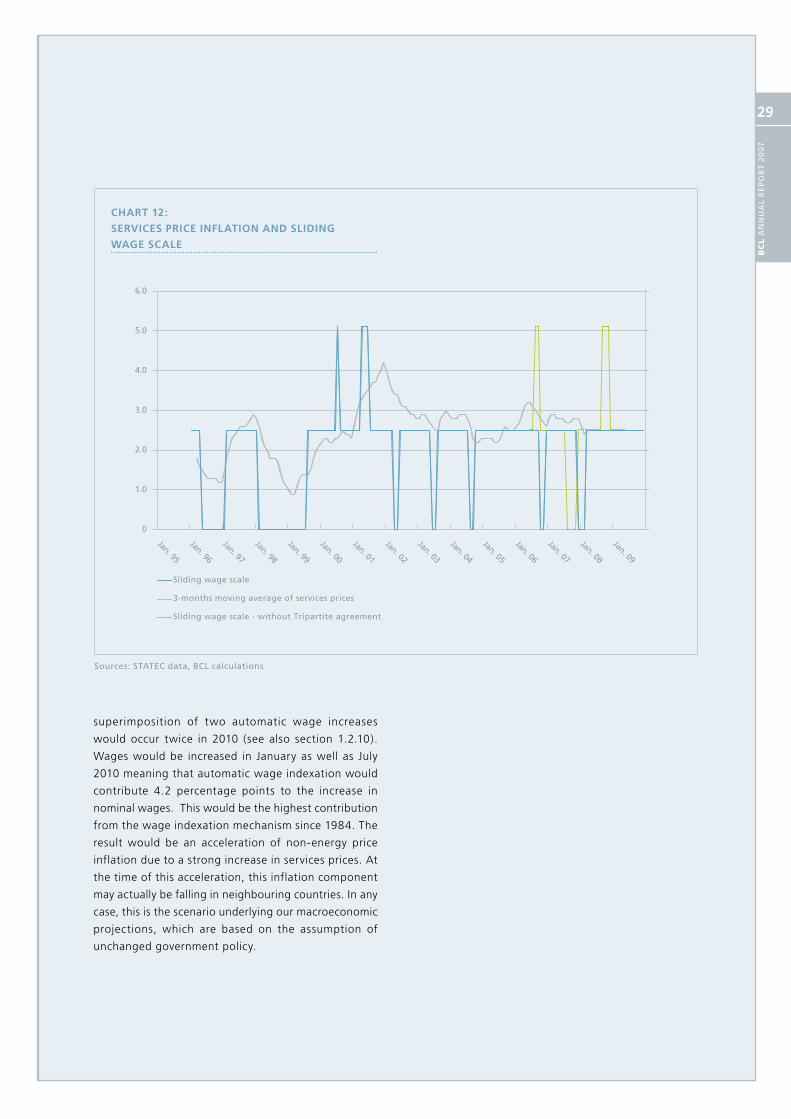
superimposition of two automatic wage increases
would occur twice in 2010 (see also section 1.2.10).
Wages would be increased in January as well as July
2010 meaning that automatic wage indexation would
contribute 4.2 percentage points to the increase in
nominal wages. This would be the highest contribution
from the wage indexation mechanism since 1984. The
result would be an acceleration of non-energy price
inflation due to a strong increase in services prices. At
the time of this acceleration, this inflation component
may actually be falling in neighbouring countries. In any
case, this is the scenario underlying our macroeconomic
projections, which are based on the assumption of
unchanged government policy.
Sources: StAtEC data, BCl calculations
Jan. 95
Jan. 96
Jan. 97
Jan. 98
Jan. 99
Jan. 00
Jan. 01
Jan. 02
Jan. 03
Jan. 04
Jan. 05
Jan. 06
Jan. 07
Jan. 08
Jan. 09
Sliding wage scale
3-months moving average of services prices
Sliding wage scale - without Tripartite agreement
0
1.0
2.0
3.0
4.0
5.0
6.0
CHART 12:
SERvICES PRICE INFLATIoN AND SLIDING
wAGE SCALE
1. ECONOMIC AND FINANCIAL SITUATION
BC
L A
nn
uA
l R
Ep
oR
t 2
00
7
30
the aggregate picture suggests flat prices for consumer
goods, the breakdown reveals that prices for food pro-
ducts have accelerated sharply in the course of 2007,
probably on the back of the sharp price increases re-
corded for agricultural commodities, such as wheat and
milk. These developments have also influenced prices
at the consumer level.
The annual inflation rates have been on a downward
trend since the beginning of 2007, and have fallen to
around 7% in the beginning of 2008. The available
data from the harmonised business surveys however
suggest that this trend might soon revert and that
inflation is set for a re-acceleration (see chart).
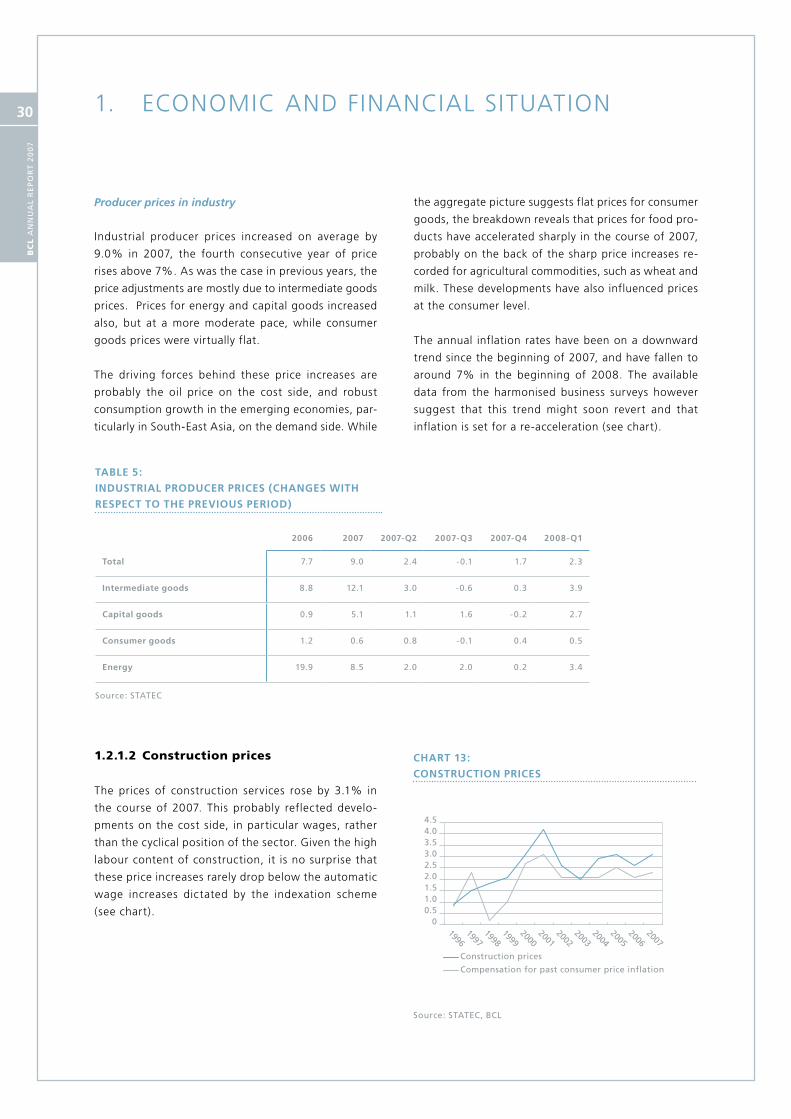
Producer prices in industry
Industrial producer prices increased on average by
9.0% in 2007, the fourth consecutive year of price
rises above 7%. As was the case in previous years, the
price adjustments are mostly due to intermediate goods
prices. Prices for energy and capital goods increased
also, but at a more moderate pace, while consumer
goods prices were virtually flat.
The driving forces behind these price increases are
probably the oil price on the cost side, and robust
consumption growth in the emerging economies, par-
ticularly in South-East Asia, on the demand side. While
TABLE 5:
INDuSTRIAL PRoDuCER PRICES (CHANGES wITH
RESPECT To THE PREvIouS PERIoD)
2006 2007 2007-Q2 2007-Q3 2007-Q4 2008-Q1
Total 7.7 9.0 2.4 -0.1 1.7 2.3
Intermediate goods 8.8 12.1 3.0 -0.6 0.3 3.9
Capital goods 0.9 5.1 1.1 1.6 -0.2 2.7
Consumer goods 1.2 0.6 0.8 -0.1 0.4 0.5
Energy 19.9 8.5 2.0 2.0 0.2 3.4
Source: StAtEC
CHART 13:
CoNSTRuCTIoN PRICES
Source: StAtEC, BCl
Construction prices
Compensation for past consumer price inflation
00.51.01.52.02.53.03.54.04.5
19961997
19981999
20002001
20022003
20042005
20062007
1.2.1.2 Construction prices
The prices of construction services rose by 3.1% in
the course of 2007. This probably reflected develo-
pments on the cost side, in particular wages, rather
than the cyclical position of the sector. Given the high
labour content of construction, it is no surprise that
these price increases rarely drop below the automatic
wage increases dictated by the indexation scheme
(see chart).

BC
L A
nn
uA
l R
Ep
oR
t 2
00
7
31
CHART 14:
INDuSTRIAL PRoDuCER PRICES, PAST
AND ExPECTED DEvELoPMENTS
Sources : Eurostat, BCl
Oct. 00
Oct. 01
Oct. 02
Oct. 03
Oct. 04
Oct. 05
Oct. 06
Oct. 07
Oct. 08
Industrial producer prices excluding energy (3-months moving average, in annual percentage changes, left-hand scale)
Selling price expectations (3-months moving average, lead by 5 months, right-hand scale)
Selling price expectations (gross data)
-5
0
5
10
15
20
-30
-20
-10
0
10
20
30
40
50
1.2.2 Sectoral developments
1.2.2.1 Industry
The short-term indicators paint a fairly mixed picture
for the industrial sector. The value of production and
the turnover statistics point to an apparently comfor-
table performance in 2007. However, the latter stems
exclusively from the sharp rise in industrial producer
prices. Production per working day, which is corrected
for price developments, stagnated in 2007, and was
thus below the growth of the manufacturing sector in
the euro area.
The sectoral breakdown of production per working
day suggests fairly heterogeneous developments in
the different branches. Production of capital goods
rose by almost 10% compared to 2007, whereas inter-
mediate goods production stagnated. An outright fall
in production levels was recorded for the energy and
consumer components.
The confidence indicator based on harmonised monthly
business surveys declined from its peak in February
2007. While the corporate sector has tempered its
optimism, the confidence indicator remains nonethe-
less above its long-run average (see chart), possibly
suggesting that the financial turmoil not yet affected

1. ECONOMIC AND FINANCIAL SITUATION
BC
L A
nn
uA
l R
Ep
oR
t 2
00
7
32
its activities. The quarterly surveys suggest a resilient
manufacturing sector however no new impulses seem
present. In April, growth prospects worsened consi-
derably as the confidence indicators in the neighbou-
ring countries recorded sharp drops and this in all the
sectors polled. This does not bode well for economic
activity in the second quarter, in the euro area as well
as in Luxembourg.
1.2.2.2 Construction
In 2007, the construction sector fared slightly better
than the manufacturing sector. Turnover accelerated
to 5.7%, whereas production per working day slowed
to 1.4%. The activity breakdown suggests that the
dynamism is virtually all due to civil engineering, since
the building branch apparently stagnated. Leading
indicators however paint a more favourable scenario
for the latter. The loans to households for house pur-
chase grew robustly in both 2007 and the beginning
of 2008. In addition, the government is pursuing its
policy of increasing housing supply. It remains to be
seen whether the increase in building permits granted
will also translate into higher economic activity.
TABLE 6:
INDICAToRS FoR THE INDuSTRIAL SECToR
(IN ANNuAL PERCENTAGE CHANGES)
2006 2007 2007-Q1 2007-Q2 2007-Q3 2007-Q4
Value of production 9.7 7.1 9.5 9.0 3.8 6.0
turnover 14.7 4.9 7.9 8.1 4.8 -0.9
production per working day 2.4 0.3 2.4 2.1 -2.9 -0.7
Intermediate goods (ppwd) 6.1 1.1 8.3 5.3 -5.5 -3.8
Capital goods (ppwd) 1.3 12.2 12.8 10.0 16.7 9.9
Consumer goods (ppwd) -4.3 -6.3 -4.0 -3.4 -9.6 -8.1
Energy (ppwd) -1.5 -4.3 -16.9 -15.1 6.8 14.3
Source: StAtEC, BCl
For example, mortgage rates rose to 4.9%, which risks
weighing on demand prospects. Higher monthly ins-
talments on variable-rate loans will deter some house-
holds from buying and building new homes, especially
since several indicators suggest that, in relative terms,
house prices have already reached historically high
levels3. On a more reassuring note, the dislocations in
the money markets since the second quarter of 2007
have not yet fed through to mortgage rates. According
to the Bank Lending Survey, banks are unlikely to tigh-
ten financial conditions for households. However, an
easing does not seem to be on the agenda either.
1.2.2.3 Trade and other sectors
The trade branches have overall fared fairly well in
2007 as wholesale trade and retail trade maintained
their strong growth performance of the previous year.
However, retail trade data need to be interpreted
carefully as they are affected by e-commerce acti-
vities, which do not do not reflect the behaviour of
Luxembourg consumers. After correcting for these
activities, turnover growth rate would have been only
3.8%, thus below the corrected value of 5.4% in
2006. Car registrations recorded only modest growth,
3 See BCl Bulletin 2007/1, pp. 337-40

BC
L A
nn
uA
l R
Ep
oR
t 2
00
7
33
CHART 15:
CoNFIDENCE INDICAToRS
AND INDuSTRIAL PRoDuCTIoN
Sources : Eurostat, BCl
May 00
Nov. 00
May 01
Nov. 01
May 02
Nov. 02
May 03
Nov. 03
May 04
Nov. 04
May 05
Nov. 05
May 06
Nov. 06
May 07
Nov. 07
May 08
Industrial production per working day, 3-month MA, annual percentage changes, left hand scale
Industrial confidence indicator, 3-months MA, right-hand scale
Confidence indicator, gross, right-hand scale
Industrial confidence indicator, long run average, right hand scale
-6
-4
-2
0
2
4
6
8
10
-40
-30
-20
-10
0
10
20
TABLE 7:
INDICAToRS FoR THE CoNSTRuCTIoN SECToR
(IN ANNuAL PERCENTAGE CHANGES)
2006 2007 2007-Q1 2007-Q2 2007-Q3 2007-Q4 2008-Q1
Turnover - Total 5.3 5.7 25.3 11.6 -1.8 -5.1 -
Production per working day -Total 2.5 1.4 13.0 1.6 -3.2 -4.4 -
Production per working day - Building 2.3 0.3 9.8 -0.3 -3.9 -3.4 -
Production per working day - Civil engineering
3.2 5.7 28.8 9.0 -0.3 -8.4 -
Building permits -5.9 12.1 -6.5 37.2 -9.4 25.5 -
Loans for house purchase - outstanding amounts
13.8 22.1 22.3 22.0 21.9 22.0 12.2
Loans for house purchase - new business 9.4 19.4 14.4 18.4 -0.4 43.5 16.7
Mortgage rates 4.1 4.7 4.6 4.6 4.9 4.9 4.9
Sources : StAtEC, BCl
1. ECONOMIC AND FINANCIAL SITUATION
BC
L A
nn
uA
l R
Ep
oR
t 2
00
7
34
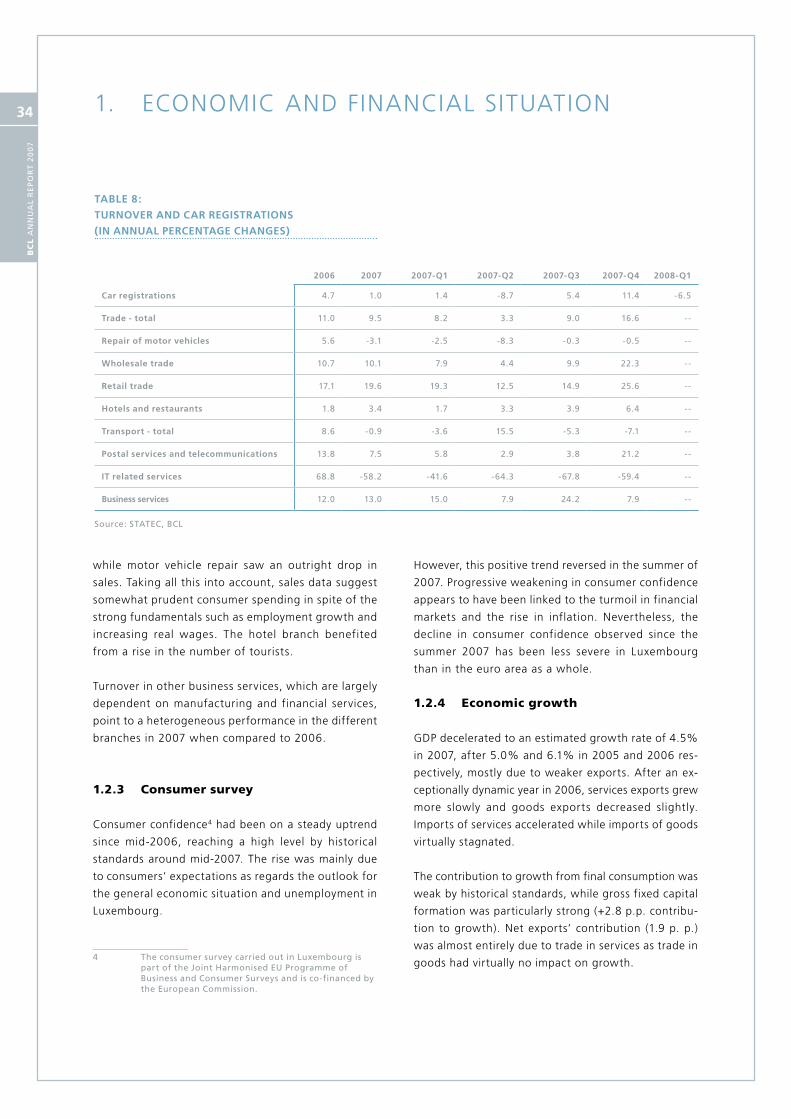
while motor vehicle repair saw an outright drop in
sales. Taking all this into account, sales data suggest
somewhat prudent consumer spending in spite of the
strong fundamentals such as employment growth and
increasing real wages. The hotel branch benefited
from a rise in the number of tourists.
Turnover in other business services, which are largely
dependent on manufacturing and financial services,
point to a heterogeneous performance in the different
branches in 2007 when compared to 2006.
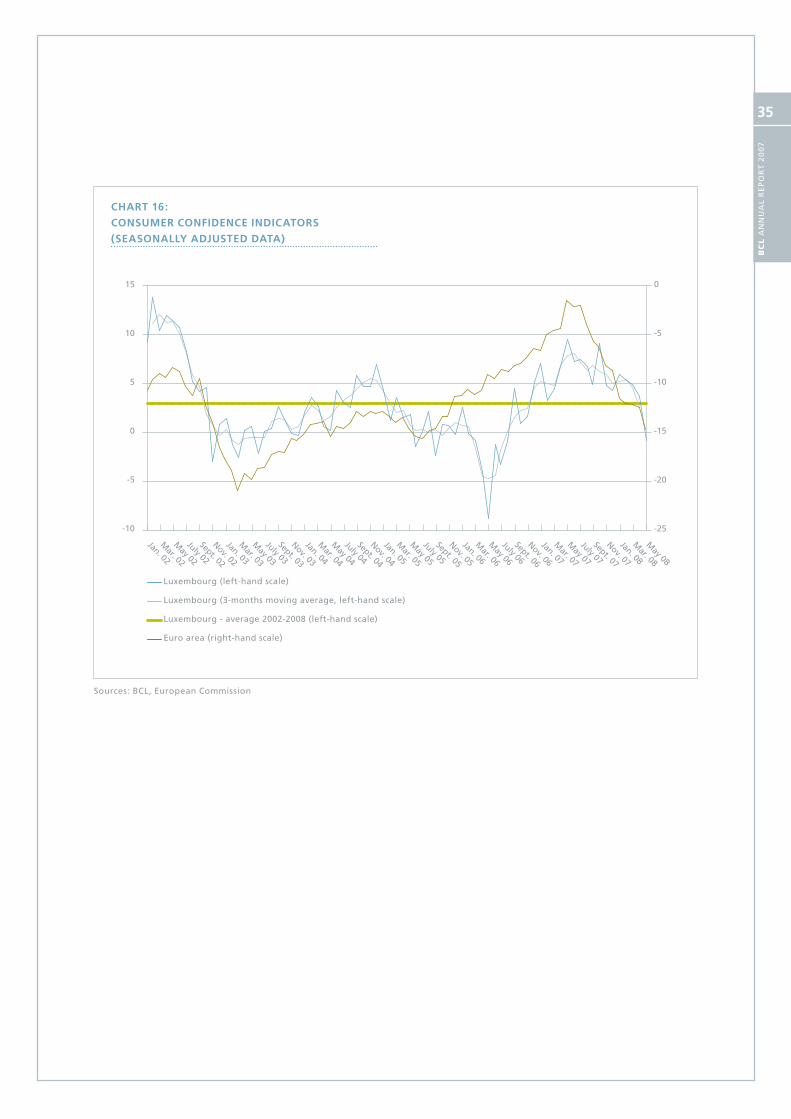
1.2.3 Consumer survey
Consumer confidence4 had been on a steady uptrend
since mid-2006, reaching a high level by historical
standards around mid-2007. The rise was mainly due
to consumers’ expectations as regards the outlook for
the general economic situation and unemployment in
Luxembourg.
4 the consumer survey carried out in luxembourg is part of the Joint Harmonised Eu programme of Business and Consumer Surveys and is co-financed by the European Commission.
However, this positive trend reversed in the summer of
2007. Progressive weakening in consumer confidence
appears to have been linked to the turmoil in financial
markets and the rise in inflation. Nevertheless, the
decline in consumer confidence observed since the
summer 2007 has been less severe in Luxembourg
than in the euro area as a whole.
1.2.4 Economic growth
GDP decelerated to an estimated growth rate of 4.5%
in 2007, after 5.0% and 6.1% in 2005 and 2006 res-
pectively, mostly due to weaker exports. After an ex-
ceptionally dynamic year in 2006, services exports grew
more slowly and goods exports decreased slightly.
Imports of services accelerated while imports of goods
virtually stagnated.
The contribution to growth from final consumption was
weak by historical standards, while gross fixed capital
formation was particularly strong (+2.8 p.p. contribu-
tion to growth). Net exports’ contribution (1.9 p. p.)
was almost entirely due to trade in services as trade in
goods had virtually no impact on growth.
TABLE 8:
TuRNovER AND CAR REGISTRATIoNS
(IN ANNuAL PERCENTAGE CHANGES)
2006 2007 2007-Q1 2007-Q2 2007-Q3 2007-Q4 2008-Q1
Car registrations 4.7 1.0 1.4 -8.7 5.4 11.4 -6.5
Trade - total 11.0 9.5 8.2 3.3 9.0 16.6 --
Repair of motor vehicles 5.6 -3.1 -2.5 -8.3 -0.3 -0.5 --
wholesale trade 10.7 10.1 7.9 4.4 9.9 22.3 --
Retail trade 17.1 19.6 19.3 12.5 14.9 25.6 --
Hotels and restaurants 1.8 3.4 1.7 3.3 3.9 6.4 --
Transport - total 8.6 -0.9 -3.6 15.5 -5.3 -7.1 --
Postal services and telecommunications 13.8 7.5 5.8 2.9 3.8 21.2 --
IT related services 68.8 -58.2 -41.6 -64.3 -67.8 -59.4 --
Business services 12.0 13.0 15.0 7.9 24.2 7.9 --
Source: StAtEC, BCl
BC
L A
nn
uA
l R
Ep
oR
t 2
00
7
35
Sources: BCl, European Commission
Jan. 02
Mar. 02
May 02
July 02
Sept. 02
Nov. 02
Jan. 03
Mar. 03
May 03
July 03
Sept. 03
Nov. 03
Jan. 04
Mar. 04
May 04
July 04
Sept. 04
Nov. 04
Jan. 05
Mar. 05
May 05
July 05
Sept. 05
Nov. 05
Jan. 06
Mar. 06
May 06
July 06
Sept. 06
Nov. 06
Jan. 07
Mar. 07
May 07
Jan. 08
Mar. 08
May 08
July 07
Sept. 07
Nov. 07
Luxembourg (left-hand scale)
Luxembourg (3-months moving average, left-hand scale)
Luxembourg - average 2002-2008 (left-hand scale)
Euro area (right-hand scale)
-10
-5
0
5
10
15
-25
-20
-15
-10
-5
0
CHART 16:
CoNSuMER CoNFIDENCE INDICAToRS
(SEASoNALLy ADjuSTED DATA)

1. ECONOMIC AND FINANCIAL SITUATION
BC
L A
nn
uA
l R
Ep
oR
t 2
00
7
36
TABLE 9:
ANNuAL NATIoNAL ACCouNTS
ANNuAL RATES oF CHANGE CoNTRIBuTIoNS To GDP GRowTH (in p. p.)
2002 2003 2004 2005 2006 2007 2002 2003 2004 2005 2006 2007
Final consumption expenditure 5.5 2.0 3.0 3.3 2.1 2.1 3.2 1.2 1.7 1.9 1.1 1.1
Final consumption expenditure of private households 5.7 0.7 1.9 3.6 1.7 2.1 2.3 0.3 0.7 1.4 0.6 0.7
Final consumption expenditure of NPISH 9.3 10.2 6.8 6.4 10.2 -1.0 0.1 0.2 0.1 0.1 0.2 0.0
Final consumption expenditure of Public Administrations 4.6 4.4 5.1 2.4 2.1 2.4 0.7 0.7 0.8 0.4 0.3 0.4
Gross capital formation -4.4 6.2 4.2 7.3 -2.3 8.0 -1.1 1.4 0.9 1.6 -0.5 1.5
of which : Gross fixed capital formation 5.5 2.4 2.1 2.1 3.1 15.2 1.2 0.5 0.5 0.4 0.6 2.8
Exports of goods and services 2.1 5.0 9.8 6.3 9.6 5.5 3.0 7.0 13.3 9.3 15.0 9.2
Exports of goods 2.4 2.3 8.4 -1.5 10.1 -0.6 1.0 0.9 3.1 -0.6 4.0 -0.2
Exports of services 1.9 6.0 10.4 9.2 9.4 7.4 2.0 6.1 10.1 9.9 11.0 9.4
Imports of goods and services 0.8 6.1 9.7 6.1 7.2 5.3 -1.0 -7.4 -11.0 -7.8 -9.5 -7.3
Imports of goods -1.4 4.2 6.8 0.9 9.1 0.0 0.8 -2.1 -3.2 -0.5 -4.6 0.0
Imports of services 2.4 7.5 11.7 9.7 6.0 8.3 -1.8 -5.3 -7.7 -7.3 -4.9 -7.3
Gross Domestic Product 4.1 2.1 4.9 5.0 6.1 4.5
GDP deflator 2.1 5.0 1.7 4.2 6.2 2.2
Employees 3.4 1.9 2.4 3.0 4.0 4.4
Total employment 3.2 1.8 2.2 2.9 3.7 4.2
Compensation per employee 3.1 2.2 3.9 3.8 4.5 3.5
Labour productivity 0.8 0.3 2.6 2.1 2.3 0.3
unit Labour Cost 2.2 1.9 1.3 1.7 2.2 3.2
Profit margins -0.1 3.1 0.4 2.5 4.1 -1.0
Source : StAtEC, BCl calculations

BC
L A
nn
uA
l R
Ep
oR
t 2
00
7
37
Job creation rose to 4.4% despite slowing economic
activity, in line with the observation that job growth is
often a lagging function of GDP growth. The diverging
dynamics of GDP and job growth led to a slowdown
in productivity (+0.3%). In a context of robust wage
growth (+3.5%), accelerating ULC, combined with
slow growth in the GDP deflator, resulted in the first
decrease in profit margins since 2002 (-1%).
Quarterly national accounts figures show that the
deceleration of growth started in the first quarter
of 2006 and intensified in the course of 2007. As
employment accelerated towards the end of 2007,
productivity growth became negative in the fourth
quarter, a development which should be reversed in
the medium term, quite possibly by a pronounced
cyclical deceleration of employment.
2002 2003 2004 2005 2006 2007
Imports
Final public consumption
Exports
Gross capital formation
Final household consumption
GDP growth
-12-10
-8-6-4-202468
1012141618
GDP
Total employment
0.0
1.0
2.0
3.0
4.0
5.0
6.0
7.0
04Q304Q4
05Q105Q2
05Q305Q4
06Q106Q2
06Q306Q4
07Q107Q2
07Q307Q4
CHART 17:
CoNTRIBuTIoN oF INDIvIDuAL
AGGREGATES To REAL GDP GRowTH
Sources : StAtEC, BCl calculations
CHART 18:
GDP AND ToTAL EMPLoyMENT (ANNuAL
PERCENTAGE GRowTH, QuARTERLy DATA)
Source : StAtEC

1. ECONOMIC AND FINANCIAL SITUATION
BC
L A
nn
uA
l R
Ep
oR
t 2
00
7
38
Output Gap and Potential Growth Estimates
This text box provides an update of the output gap
and potential growth estimates published in the 2006
annual report. It is well known that these estimates
are subject to important revisions, especially for the
most recent observations. To reduce this problem
of limited reliability, the series have been extended
until 2010 using the results of the latest projection
exercise.
With respect to the estimates published in June 2007,
the new results indicate clearly that output was be-
low its potential level during the period 2003-2005
(negative gap according to all methods). However,
for the year 2006 all methods found a negative gap
in June 2007, while using the latest data the output
gap in 2006 is now positive according to five of the six
methods considered. This change is partly the result
of new national accounts data published in October
2007. These revised upwards GDP growth in 2004
and 2005 by more than a percentage point. Now, the
output gap in 2006 is negative only according to the
Apel-Jansson model (-2.4%). This could be explained
by the fact that this method also takes into account
fluctuations in unemployment in order to identify the
cyclical component of output. As a result, the rise in
unemployment from 2001 to 2006 translates into a
more negative output gap according to this method,
which only begins to fall back in 2006.
For the year 2007, the situation is unchanged with res-
pect to 2006 according to one method (HP filter), de-
teriorates according to three methods (by about 0.5%
of GDP), and improves according to the other two
methods (between 0.2% and 1.1% of GDP). For the
following years, the projections anticipate a slowdown
in 2008 and a gradual recovery in 2009-2010, which
implies a negative gap for five of the six methods. The
production function approach is less pessimistic over
the projection horizon, partly thanks to the recent
reduction in unemployment and the expectations of
sustained growth in fixed capital formation.
These estimates (and especially those for current or
future periods) are subject to a large amount of uncer-
tainty, as indicated by the size of the revisions since
the last publication in June 2007. Note that the level
of GDP was also revised by more than 1% in each
of the years 2003-2007. As a result, the linear trend
finds an increase in the output gap between one and
two percentage points over the years 2004-2007.
The gap estimated for the year 2003 has been revised
downwards for four of the six methods (by nearly two
percentage points according to the Kuttner model).
For the years 2004-2007 revisions are almost always
positive (smaller negative gap or larger positive gap).
The production function approach is characterized
by the smallest revisions in absolute value (highest
reliability). Univariate methods, which are limited to
analysing fluctuations in GDP growth, have seen the
largest revisions in absolute value. In particular, the
linear trend appears to be the least reliable method
(subject to the largest revisions).
Potential growth estimates have generally been re-
vised slightly upwards. According to the linear trend,
potential growth remains at 5.0%. According to the
other methods, the average of potential growth since
1981 increased by 0.1 percentage points in three ca-
ses. The average since 2001 rose between 0.2 and
0.8 percentage points. Potential growth seems to
remain within the range 4% to 5% over the projection
horizon 2008-2010 (with the possible exception of
the Apel-Jansson model). However, it bears repeating
that the results for the projection period should be
interpreted with caution.
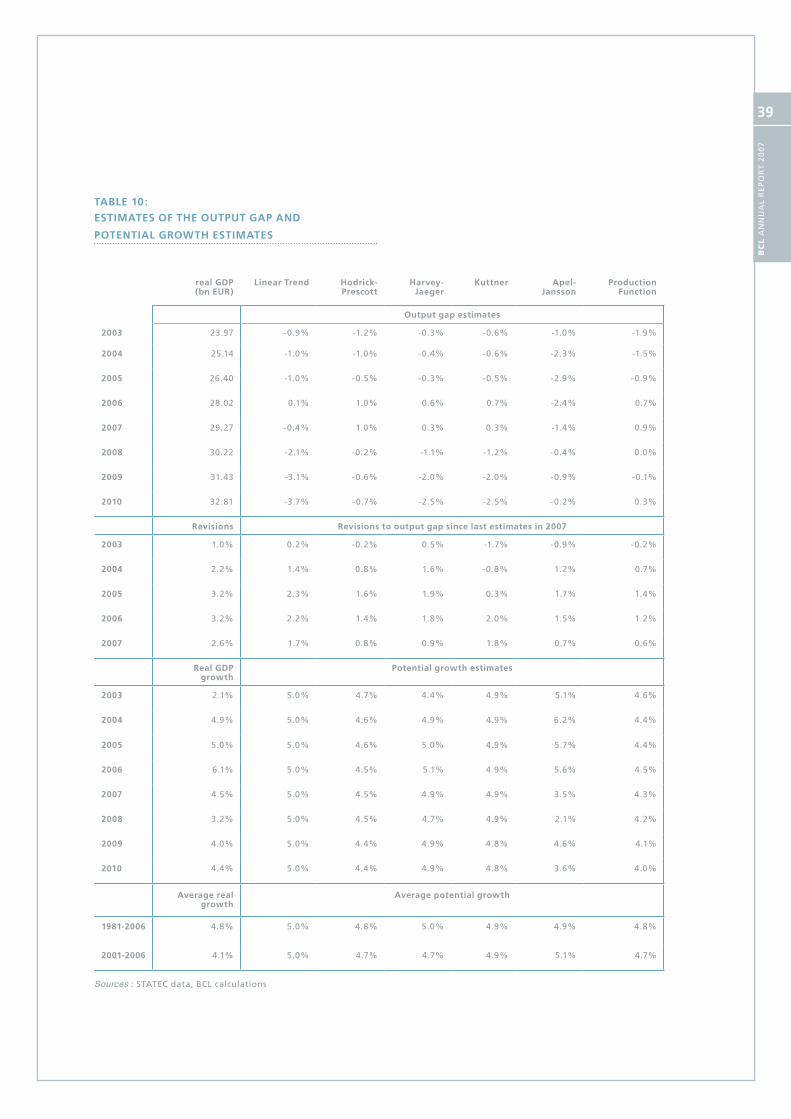
BC
L A
nn
uA
l R
Ep
oR
t 2
00
7
39
TABLE 10:
ESTIMATES oF THE ouTPuT GAP AND
PoTENTIAL GRowTH ESTIMATES
real GDP (bn EuR)
Linear Trend Hodrick-Prescott
Harvey-jaeger
Kuttner Apel- jansson
Production Function
output gap estimates
2003 23.97 -0.9% -1.2% -0.3% -0.6% -1.0% -1.9%
2004 25.14 -1.0% -1.0% -0.4% -0.6% -2.3% -1.5%
2005 26.40 -1.0% -0.5% -0.3% -0.5% -2.9% -0.9%
2006 28.02 0.1% 1.0% 0.6% 0.7% -2.4% 0.7%
2007 29.27 -0.4% 1.0% 0.3% 0.3% -1.4% 0.9%
2008 30.22 -2.1% -0.2% -1.1% -1.2% -0.4% 0.0%
2009 31.43 -3.1% -0.6% -2.0% -2.0% -0.9% -0.1%
2010 32.81 -3.7% -0.7% -2.5% -2.5% -0.2% 0.3%
Revisions Revisions to output gap since last estimates in 2007
2003 1.0% 0.2% -0.2% 0.5% -1.7% -0.9% -0.2%
2004 2.2% 1.4% 0.8% 1.6% -0.8% 1.2% 0.7%
2005 3.2% 2.3% 1.6% 1.9% 0.3% 1.7% 1.4%
2006 3.2% 2.2% 1.4% 1.8% 2.0% 1.5% 1.2%
2007 2.6% 1.7% 0.8% 0.9% 1.8% 0.7% 0.6%
Real GDP growth
Potential growth estimates
2003 2.1% 5.0% 4.7% 4.4% 4.9% 5.1% 4.6%
2004 4.9% 5.0% 4.6% 4.9% 4.9% 6.2% 4.4%
2005 5.0% 5.0% 4.6% 5.0% 4.9% 5.7% 4.4%
2006 6.1% 5.0% 4.5% 5.1% 4.9% 5.6% 4.5%
2007 4.5% 5.0% 4.5% 4.9% 4.9% 3.5% 4.3%
2008 3.2% 5.0% 4.5% 4.7% 4.9% 2.1% 4.2%
2009 4.0% 5.0% 4.4% 4.9% 4.8% 4.6% 4.1%
2010 4.4% 5.0% 4.4% 4.9% 4.8% 3.6% 4.0%
Average real growth
Average potential growth
1981-2006 4.8% 5.0% 4.8% 5.0% 4.9% 4.9% 4.8%
2001-2006 4.1% 5.0% 4.7% 4.7% 4.9% 5.1% 4.7%
Sources : StAtEC data, BCl calculations

1. ECONOMIC AND FINANCIAL SITUATION
BC
L A
nn
uA
l R
Ep
oR
t 2
00
7
40
1.2.5 Financial sector
The real estate crisis in the United States affected the
global financial system through two major channels.
On the one hand, it directly affected credit institutions
providing housing loans in the USA or holding securities
representing securitised housing loans. On the other
hand, it had an indirect impact through the significant
downturn of stock indices, observed especially during
the first quarter of 2008.
As in other countries, the financial sector in Luxem-
bourg experienced a turbulent year, marked by sharp
reversals in performance of credit institutions and mu-
tual funds. The first half of the year under review was
perfectly in line with developments observed during
2006, with high growth in the major indicators of the
financial sector (such as employment, results of credit
institutions or net asset values of undertakings for col-
lective investments). However, the second half of the
year indicated a clear reversal. Employment growth is
the only indicator to have been spared so far.
The impact of this degradation on the financial centre
is undeniable. However, it is important to mention that
this reversal affects the various indicators unevenly.
Between December 2006 and 2007 the net asset value
(NAV) of undertakings for collective investment grew
11.6%, far below growth rates in 2005 and 2006.
Employment in the banking sector increased by 1 387
units during 2007, representing a growth rate of 5.6%,
a slight decrease compared to the rate of 6.6% ob-
served in 2006. Banks’ aggregate balance sheet rose
by 9.0% to €915 448 million as at 31 December 2007.
By contrast, net results of credit institutions were sub-
ject to an important decline, significantly larger than
that observed in 2002 in the financial market turbulen-
ces amplified by the terrorist attacks of 11 September
2001. Net income fell by 35.8% compared to 2006.

BC
L A
nn
uA
l R
Ep
oR
t 2
00
7
41
Is there a credit crunch in Luxembourg?
1. Introduction
The current financial turmoil has led to fears that a
“credit crunch” may emerge in Europe, as has been
the case in the United States. The tightening of credit
conditions in financial markets together with the wea-
kening of the capital positions of big banks naturally
raise the question of whether a restriction of credit has
occurred in Luxembourg.
This box discusses the different definitions of a credit
crunch, before analysing recent data. Special attention
is given to the banking industry Balance Sheet Items
(BSI), results of the last quarterly Bank Lending Sur-
vey (BLS), and indicators typically used for monitoring
banks’ capital base.
2. Multiple definitions
There is no single definition of a credit crunch that is
commonly accepted. At present, the academic literature
provides a variety of definitions. According to Bernanke
and Lown5, a credit crunch is a significant leftward
shift in the supply of bank loans, holding constant
both the real interest rate and the quality of potential
borrowers. Owens and Schref6 define it as a period of
sharply increased non-price credit rationing. This view
is shared by Green and Oh7, who also describe a credit
crunch as an inefficient situation characterised by sol-
vent borrowers which are unable to obtain credit, and
lenders which are excessively prudent. More formally,
a credit crunch is typically defined as a situation where
the erosion of banks’ capital base forces them into a
de-leveraging process in order to maintain regulatory
capital adequacy ratios. In such a situation, banks are
unable to extend credit, irrespective of the price they
could charge or the rating of the borrower. This nar-
row definition is sometimes also referred to as “capital
crunch8”.
5 Bernanke and lown (1991) “the Credit Crunch”, Brookings papers on Economic Activity, Vol. 1991, no. 2, pp. 205-247.6 owens and Schreft (1995) “Identifying Credit Crunches”, Contemporary Economic policy, April, Vol. 13, no. 2, pp. 63-76.7 Green et oh (1991) “Can a ‘Credit Crunch’ Be Efficient? ”, Federal Reserve Bank of Minneapolis Quarterly Review, Vol. 15, no. 4, pp. 3-17.8 See peek and Rosengren (1995) “the Capital Crunch:
Finally, following a broader definition of a credit
crunch, the trigger may lie not only in banks’ balance
sheet problems (impaired capital ratios), but also in
borrowers’ balance sheet problems (impaired credi-
tworthiness) or, more precisely, uncertainties created
by asymmetric information.
Note that a credit crunch may take place between
banks as well as between banks and borrowers. It
may be localised in particular sectors of the economy
(the real estate market for example) or categories of
borrowers (households for example). In the following,
we’ll see credit crunches as a supply-side phenome-
non, including situations where banks significantly
tighten their non-price credit standards or write more
protective covenants into the terms of a loan (reflec-
ting changes in banks’ standards that go beyond a
normal cyclical tightening), or when higher uncer-
tainty results in significantly higher estimated pro-
babilities of borrower default and thus higher capital
charges (reflecting changes in the risk environment;
for example via changes to the value of borrowers’
collateral). We are particularly interested in assessing
the risks of a credit crunch for households and Non-
Financial Corporations (NFCs).
3. The growth of loans continues to increase…
By the end of December 2007, Luxembourg banks re-
gistered €77 702 million of outstanding loans to NFCs.
This figure represents an increase of €13 742 million
(+21.5%) within 12 months. Euro area NFCs represen-
ted the most important player in nominal terms. Credits
to the latter increased by €6 135 million (+18.6%) over
one year. Credits to NFCs situated outside the euro area
went up by 19.5% (€4 337 million). In relative terms,
the strongest credit growth was observed at national
level with 37.8% (€3 270 million) between end-2006
and end-2007. According to the latest data, outstan-
ding loans to euro area NFCs continued to increase in
the first quarter of 2008 (+ 27.2% within 12 months
in April 2008).
neither a Borrower nor a lender Be”, Journal of Money, Credit and Banking, Vol. 27, no. 3, pp. 625-638.

1. ECONOMIC AND FINANCIAL SITUATION
BC
L A
nn
uA
l R
Ep
oR
t 2
00
7
42
Outstanding loans granted by Luxembourg banks to
households increased by 10% in 2007 (€34 251 mil-
lion). According to the latest figures, loans to Luxem-
bourg residents remained buoyant during the first
four months of the year whereas loans to euro area
households excluding Luxembourg were decreasing.
Overall, outstanding loans granted by Luxembourg
banks to euro area households were still increasing in
April 2008 (+3.1%).
4. … but the Bank Lending Survey indicates a
tightening of financing conditions!
BLS data suggest that credit standards on loans to
NFCs have tightened in Luxembourg. This tightening
has been stronger for large companies. Moreover, it
should continue during the second quarter of 2008.
These results should be considered with caution as the
correlation between the evolution of reported corpo-
rate credit standards and corporate loan developments
is far from perfect. For instance, the BLS reported tigh-
tening credit standards between 2005 and 2006 during
a period that coincided with a significant acceleration
of loan growth.
5. Banking sector performance indicators are
satisfactory
At this stage, there is no sign of an erosion of banks’
capital base that could generate a capital crunch. Al-
though decreasing somewhat between 2007 and 2006,
solvency ratios remain far above the minimum required
level of 8%.The average solvency ratio stood at 14.2%
in 2007 compared to 14.9% in 2006. The return on
assets ratio “Net results /total assets” was on average
0.68% in 2007 compared to 0.79% in 2006. The li-
quidity ratio “liquid assets/eligible liabilities” remained
comfortably above the minimum required level of 30%
(63.3% on average in 2007).
6. Borrowers remain solvent
The broad definition of a credit crunch implies that
borrower solvency should be monitored carefully. BLS
data suggest that a credit crunch would first and fo-
remost affect riskier corporate borrowers. Moreover,
judging by recent credit standard developments, large
firms are particularly vulnerable, while the household
sector has largely been shielded from adverse develo-
pments in financial markets. This is unlikely to change
significantly in the near term. On the other hand, in the
absence of corporate loan data by branch of activity, it
is impossible to draw further conclusions about which
kind of borrowers may be affected.
7. Conclusion
Strong loan growth has continued during the first quar-
ter 2008. The total supply of credit to both households
and NFCs has not been affected by financial turmoil
that appeared in August 2007. At this stage, there is no
evidence of a credit crunch in Luxembourg.
It should be noted that the decline would be limited to
23.7% if one neutralises non-recurring gains of €904
million that occurred in 2006. The significant decline of
credit institutions’ net profits is primarily due to impor-
tant value adjustments and resident credit institutions’
provisions to cover risks.
Finally, due to continuing uncertainty on global stock
exchanges as well as the impact of the economic
slowdown in the US, a further weakening in 2008 can
no longer be ruled out.

BC
L A
nn
uA
l R
Ep
oR
t 2
00
7
43

1. ECONOMIC AND FINANCIAL SITUATION
BC
L A
nn
uA
l R
Ep
oR
t 2
00
7
44
1.2.5.1 Credit institutions’ balance sheets
The aggregate balance sheet grew virtually uninterrup-
ted since 2003, with the exception of December 2007,
when it fell by €25 296 million. Between 31 Decem-
ber 2006 and 31 December 2007 banks’ aggregate
balance sheet increased by €75 883 million, or 9.0%,
to reach €915 448 million. The first quarter of 2008
saw similar growth, with an increase of 2.6% between
31 December 2007 and 31 March 2008. Thus, at the
end of first quarter of 2008 the Luxembourg banks’
aggregate balance sheet stood at €939 299 million.
The increase in activity stems mostly from growth in
credits and debts as much from the inter-bank market
as from non-bank customers.
It is worth mentioning that despite the introduction of
International Financial Reporting Standards (IFRS) for all
Luxembourg credit institutions, loans (72.0% of total
assets) and deposits (82.9% of total assets) are still
expressed at their face value in the statistical reports
of the BCL. By contrast, the level of securities held or
issued are subject to changes in accounting standards
which have obviously an impact on the developments
of the outstanding amounts. Indeed, previously only a
small share of securities were valued at market price,
the application of IAS / IFRS means that the majority
of securities are now measured at fair value. Finally, it
is also important to mention that the new accounting
standards require accounting for derivatives on the
balance sheet rather than off-balance sheet as was
still the case in 2007. The statistical reporting to the
BCL requires that the latter positions be classified un-
der other assets and/or other liabilities, respectively.
These residual categories are therefore subject to some
increase during the first quarter of 2008 as financial
derivatives are moved onto the balance sheet.
On the asset side, inter-bank loans increased €37 739
million (9.0%) between December 2006 and 2007.
During the first three months of 2008, there was an
additional increase of €15 404 million (3.4%), reaching
€471 086 million by 31 March 2008. At this stage,
interbank activity accounts for nearly half (50.2%) of
Luxembourg banks’ total assets.
Loans to non-bank customers grew by €34 100 mil-
lion (21.1%) on an annual basis, rising from €161 250
million at the end of 2006 to €195 350 million at the
end of 2007. During the first quarter of this year, loans
TABLE 11:
MAIN FIGuRES RELATING To THE ASSET SIDE oF
THE AGGREGATE BALANCE SHEET (ouTSTANDING
AMouNTS AS AT END oF PERIoD)
Amounts in million euros variation in million euros and in % 1 Relativeweight
Assets 2006/12 2007/12 2008/03 2006/12 - 2007/12 2007/12 - 2008/03 2008/03
million euros
in % million euros
in %
Interbank loans 417 943 455 682 471 086 37 739 9.0 15 404 3.4 50.2
Loans to non bank customers 161 250 195 350 204 367 34 100 21.1 9 017 4.6 21.8
Portofolio investment 233 602 236 700 230 632 3 098 1.3 -6 068 -2.6 24.6
other assets 26 770 27 717 32 214 946 3.5 5 497 18.8 3.5
Total assets 839 565 915 448 939 299 75 883 9.0 23 851 2.6 100.0
Source: BCl
1 Relative weight in relation to total assets
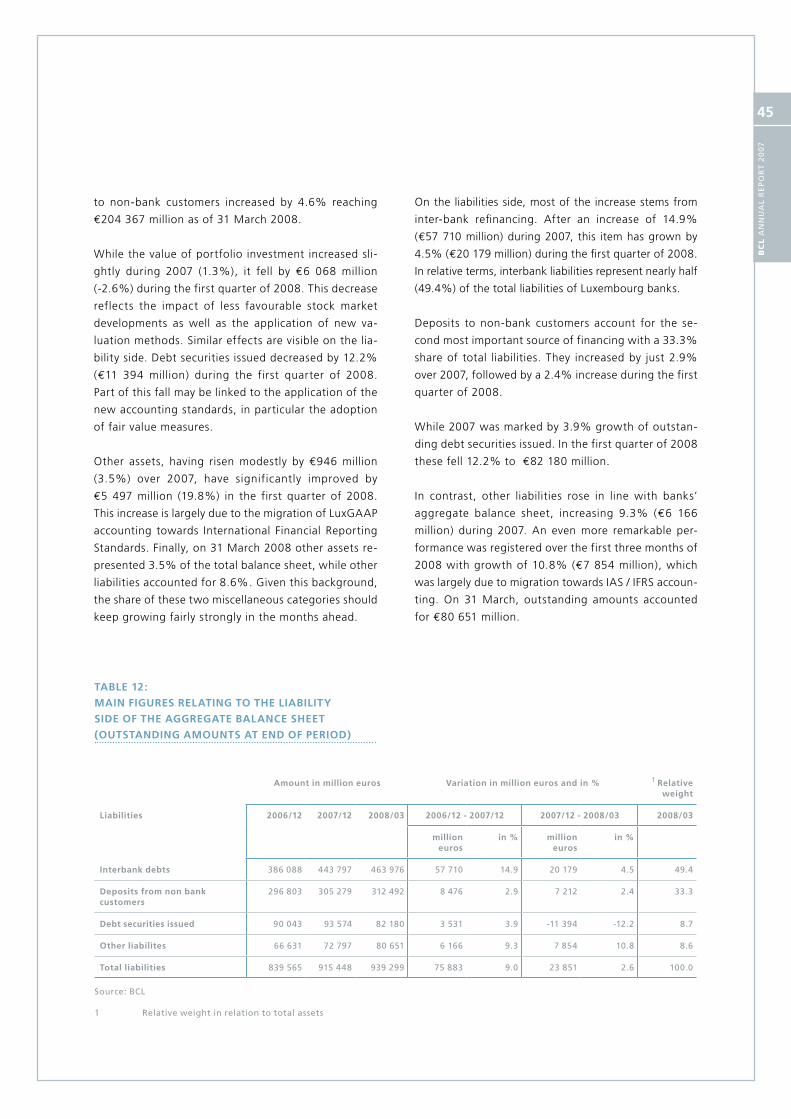
BC
L A
nn
uA
l R
Ep
oR
t 2
00
7
45
to non-bank customers increased by 4.6% reaching
€204 367 million as of 31 March 2008.
While the value of portfolio investment increased sli-
ghtly during 2007 (1.3%), it fell by €6 068 million
(-2.6%) during the first quarter of 2008. This decrease
reflects the impact of less favourable stock market
developments as well as the application of new va-
luation methods. Similar effects are visible on the lia-
bility side. Debt securities issued decreased by 12.2%
(€11 394 million) during the first quarter of 2008.
Part of this fall may be linked to the application of the
new accounting standards, in particular the adoption
of fair value measures.
Other assets, having risen modestly by €946 million
(3.5%) over 2007, have significantly improved by
€5 497 million (19.8%) in the first quarter of 2008.
This increase is largely due to the migration of LuxGAAP
accounting towards International Financial Reporting
Standards. Finally, on 31 March 2008 other assets re-
presented 3.5% of the total balance sheet, while other
liabilities accounted for 8.6%. Given this background,
the share of these two miscellaneous categories should
keep growing fairly strongly in the months ahead.
TABLE 12:
MAIN FIGuRES RELATING To THE LIABILITy
SIDE oF THE AGGREGATE BALANCE SHEET
(ouTSTANDING AMouNTS AT END oF PERIoD)
Amount in million euros variation in million euros and in % 1 Relative weight
Liabilities 2006/12 2007/12 2008/03 2006/12 - 2007/12 2007/12 - 2008/03 2008/03
million euros
in % million euros
in %
Interbank debts 386 088 443 797 463 976 57 710 14.9 20 179 4.5 49.4
Deposits from non bank customers
296 803 305 279 312 492 8 476 2.9 7 212 2.4 33.3
Debt securities issued 90 043 93 574 82 180 3 531 3.9 -11 394 -12.2 8.7
other liabilites 66 631 72 797 80 651 6 166 9.3 7 854 10.8 8.6
Total liabilities 839 565 915 448 939 299 75 883 9.0 23 851 2.6 100.0
Source: BCl 1 Relative weight in relation to total assets
On the liabilities side, most of the increase stems from
inter-bank refinancing. After an increase of 14.9%
(€57 710 million) during 2007, this item has grown by
4.5% (€20 179 million) during the first quarter of 2008.
In relative terms, interbank liabilities represent nearly half
(49.4%) of the total liabilities of Luxembourg banks.
Deposits to non-bank customers account for the se-
cond most important source of financing with a 33.3%
share of total liabilities. They increased by just 2.9%
over 2007, followed by a 2.4% increase during the first
quarter of 2008.
While 2007 was marked by 3.9% growth of outstan-
ding debt securities issued. In the first quarter of 2008
these fell 12.2% to €82 180 million.
In contrast, other liabilities rose in line with banks’
aggregate balance sheet, increasing 9.3% (€6 166
million) during 2007. An even more remarkable per-
formance was registered over the first three months of
2008 with growth of 10.8% (€7 854 million), which
was largely due to migration towards IAS / IFRS accoun-
ting. On 31 March, outstanding amounts accounted
for €80 651 million.
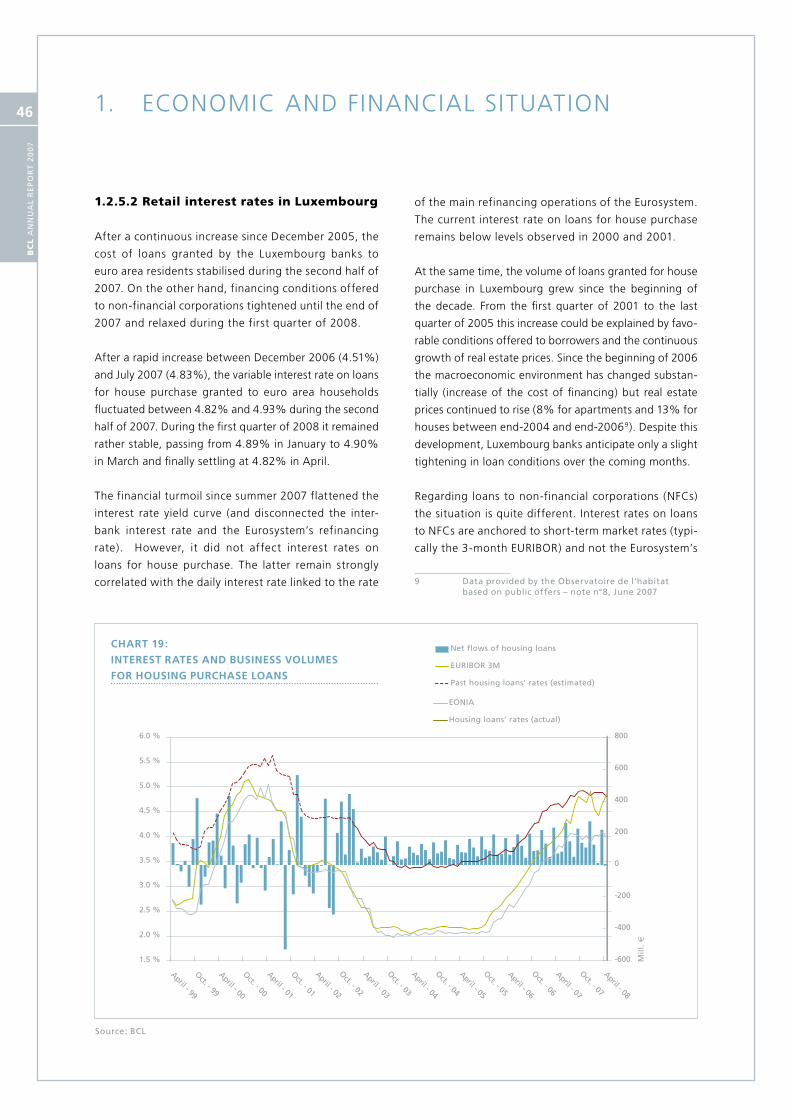
1. ECONOMIC AND FINANCIAL SITUATION
BC
L A
nn
uA
l R
Ep
oR
t 2
00
7
46
1.2.5.2 Retail interest rates in Luxembourg
After a continuous increase since December 2005, the
cost of loans granted by the Luxembourg banks to
euro area residents stabilised during the second half of
2007. On the other hand, financing conditions offered
to non-financial corporations tightened until the end of
2007 and relaxed during the first quarter of 2008.
After a rapid increase between December 2006 (4.51%)
and July 2007 (4.83%), the variable interest rate on loans
for house purchase granted to euro area households
fluctuated between 4.82% and 4.93% during the second
half of 2007. During the first quarter of 2008 it remained
rather stable, passing from 4.89% in January to 4.90%
in March and finally settling at 4.82% in April.
The financial turmoil since summer 2007 flattened the
interest rate yield curve (and disconnected the inter-
bank interest rate and the Eurosystem’s refinancing
rate). However, it did not affect interest rates on
loans for house purchase. The latter remain strongly
correlated with the daily interest rate linked to the rate
of the main refinancing operations of the Eurosystem.
The current interest rate on loans for house purchase
remains below levels observed in 2000 and 2001.
At the same time, the volume of loans granted for house
purchase in Luxembourg grew since the beginning of
the decade. From the first quarter of 2001 to the last
quarter of 2005 this increase could be explained by favo-
rable conditions offered to borrowers and the continuous
growth of real estate prices. Since the beginning of 2006
the macroeconomic environment has changed substan-
tially (increase of the cost of financing) but real estate
prices continued to rise (8% for apartments and 13% for
houses between end-2004 and end-20069). Despite this
development, Luxembourg banks anticipate only a slight
tightening in loan conditions over the coming months.
Regarding loans to non-financial corporations (NFCs)
the situation is quite different. Interest rates on loans
to NFCs are anchored to short-term market rates (typi-
cally the 3-month EURIBOR) and not the Eurosystem’s
9 Data provided by the observatoire de l’habitat based on public offers – note n°8, June 2007
Source: BCl
CHART 19:
INTEREST RATES AND BuSINESS voLuMES
FoR HouSING PuRCHASE LoANS
April - 99
Oct. - 99
April - 00
Oct. - 00
April - 01
Oct. - 01
April - 02
Oct. - 02
April - 03
Oct. - 03
April - 04
Oct. - 04
April - 05
Oct. - 05
April - 06
Oct. - 06
April - 07
Oct. - 07
April - 08
Net flows of housing loans EONIA
EURIBOR 3M Housing loans‘ rates (actual)
Past housing loans’ rates (estimated)
Mil
l.
-600
-400
-200
0
200
400
600
800
1.5 %
2.0 %
2.5 %
3.0 %
3.5 %
4.0 %
4.5 %
5.0 %
5.5 %
6.0 %
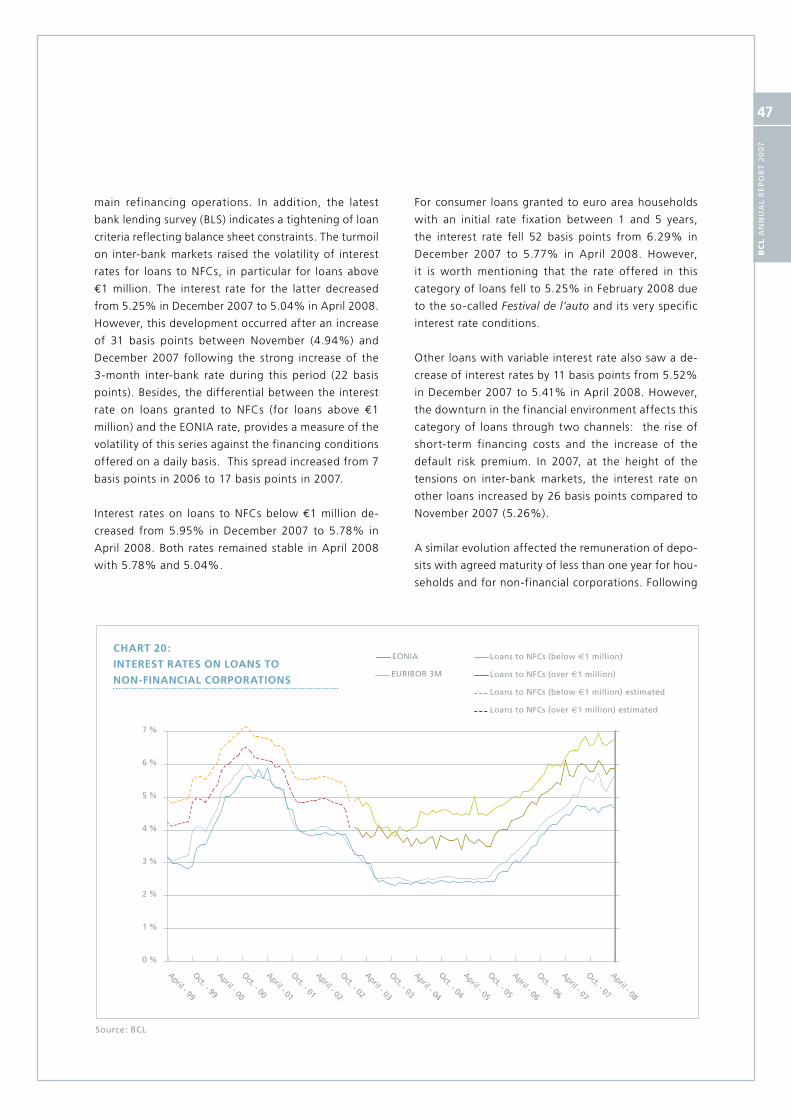
BC
L A
nn
uA
l R
Ep
oR
t 2
00
7
47
main refinancing operations. In addition, the latest
bank lending survey (BLS) indicates a tightening of loan
criteria reflecting balance sheet constraints. The turmoil
on inter-bank markets raised the volatility of interest
rates for loans to NFCs, in particular for loans above
€1 million. The interest rate for the latter decreased
from 5.25% in December 2007 to 5.04% in April 2008.
However, this development occurred after an increase
of 31 basis points between November (4.94%) and
December 2007 following the strong increase of the
3-month inter-bank rate during this period (22 basis
points). Besides, the differential between the interest
rate on loans granted to NFCs (for loans above €1
million) and the EONIA rate, provides a measure of the
volatility of this series against the financing conditions
offered on a daily basis. This spread increased from 7
basis points in 2006 to 17 basis points in 2007.
Interest rates on loans to NFCs below €1 million de-
creased from 5.95% in December 2007 to 5.78% in
April 2008. Both rates remained stable in April 2008
with 5.78% and 5.04%.
For consumer loans granted to euro area households
with an initial rate fixation between 1 and 5 years,
the interest rate fell 52 basis points from 6.29% in
December 2007 to 5.77% in April 2008. However,
it is worth mentioning that the rate offered in this
category of loans fell to 5.25% in February 2008 due
to the so-called Festival de l’auto and its very specific
interest rate conditions.
Other loans with variable interest rate also saw a de-
crease of interest rates by 11 basis points from 5.52%
in December 2007 to 5.41% in April 2008. However,
the downturn in the financial environment affects this
category of loans through two channels: the rise of
short-term financing costs and the increase of the
default risk premium. In 2007, at the height of the
tensions on inter-bank markets, the interest rate on
other loans increased by 26 basis points compared to
November 2007 (5.26%).
A similar evolution affected the remuneration of depo-
sits with agreed maturity of less than one year for hou-
seholds and for non-financial corporations. Following
Source: BCl
CHART 20:
INTEREST RATES oN LoANS To
NoN-FINANCIAL CoRPoRATIoNS
April - 99
Oct. - 99
April - 00
Oct. - 00
April - 01
Oct. - 01
April - 02
Oct. - 02
April - 03
Oct. - 03
April - 04
Oct. - 04
April - 05
Oct. - 05
April - 06
Oct. - 06
April - 07
Oct. - 07
April - 08
EONIA
EURIBOR 3M
Loans to NFCs (below 1 million)
Loans to NFCs (over 1 million)
Loans to NFCs (below 1 million) estimated
Loans to NFCs (over 1 million) estimated
0 %
1 %
2 %
3 %
4 %
5 %
6 %
7 %
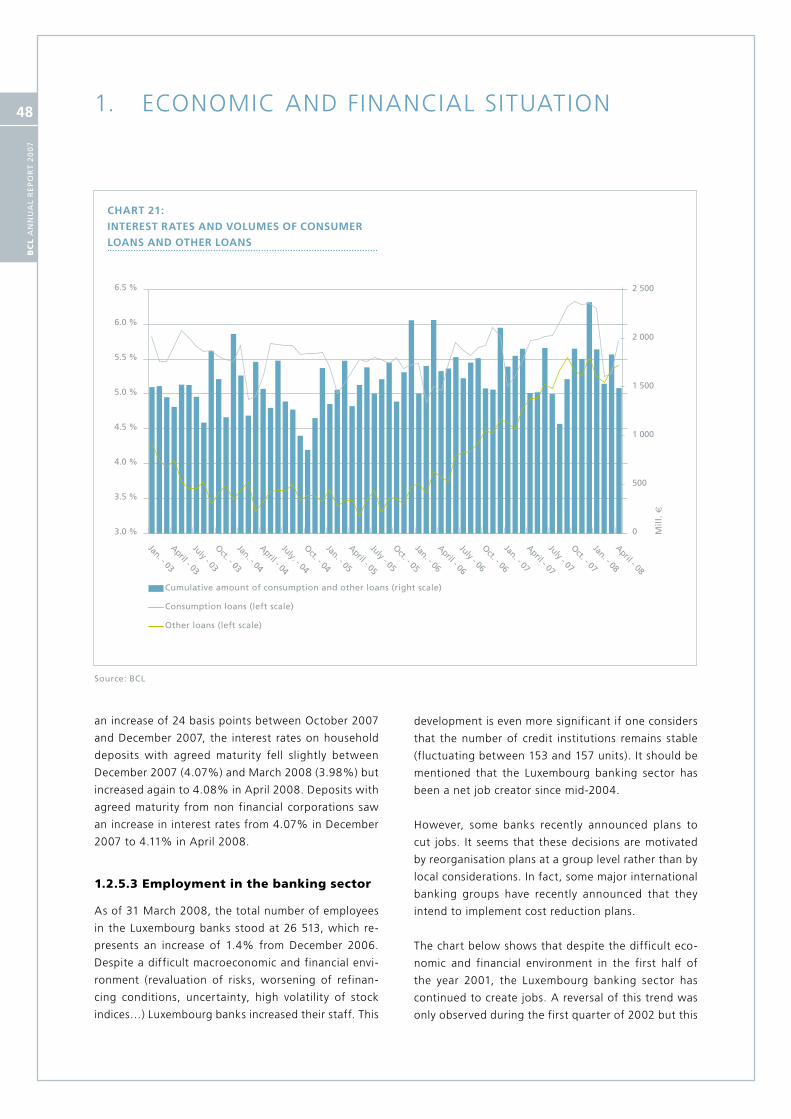
1. ECONOMIC AND FINANCIAL SITUATION
BC
L A
nn
uA
l R
Ep
oR
t 2
00
7
48
an increase of 24 basis points between October 2007
and December 2007, the interest rates on household
deposits with agreed maturity fell slightly between
December 2007 (4.07%) and March 2008 (3.98%) but
increased again to 4.08% in April 2008. Deposits with
agreed maturity from non financial corporations saw
an increase in interest rates from 4.07% in December
2007 to 4.11% in April 2008.
1.2.5.3 Employment in the banking sector
As of 31 March 2008, the total number of employees
in the Luxembourg banks stood at 26 513, which re-
presents an increase of 1.4% from December 2006.
Despite a difficult macroeconomic and financial envi-
ronment (revaluation of risks, worsening of refinan-
cing conditions, uncertainty, high volatility of stock
indices…) Luxembourg banks increased their staff. This
development is even more significant if one considers
that the number of credit institutions remains stable
(fluctuating between 153 and 157 units). It should be
mentioned that the Luxembourg banking sector has
been a net job creator since mid-2004.
However, some banks recently announced plans to
cut jobs. It seems that these decisions are motivated
by reorganisation plans at a group level rather than by
local considerations. In fact, some major international
banking groups have recently announced that they
intend to implement cost reduction plans.
The chart below shows that despite the difficult eco-
nomic and financial environment in the first half of
the year 2001, the Luxembourg banking sector has
continued to create jobs. A reversal of this trend was
only observed during the first quarter of 2002 but this
Source: BCl
CHART 21:
INTEREST RATES AND voLuMES oF CoNSuMER
LoANS AND oTHER LoANS
July - 03
Oct. - 03
Jan. - 03
April - 03
July. - 04
Oct. - 04
Jan. - 04
April - 04
July - 05
Oct. - 05
Jan. - 05
April - 05
July - 06
Oct. - 06
Jan. - 06
April - 06
July - 07
Oct. - 07
Jan. - 07
April - 07
Jan. - 08
April - 08
Mil
l.
Cumulative amount of consumption and other loans (right scale)
Consumption loans (left scale)
Other loans (left scale)
3.0 %
3.5 %
4.0 %
4.5 %
5.0 %
5.5 %
6.0 %
6.5 %
0
500
1 000
1 500
2 000
2 500
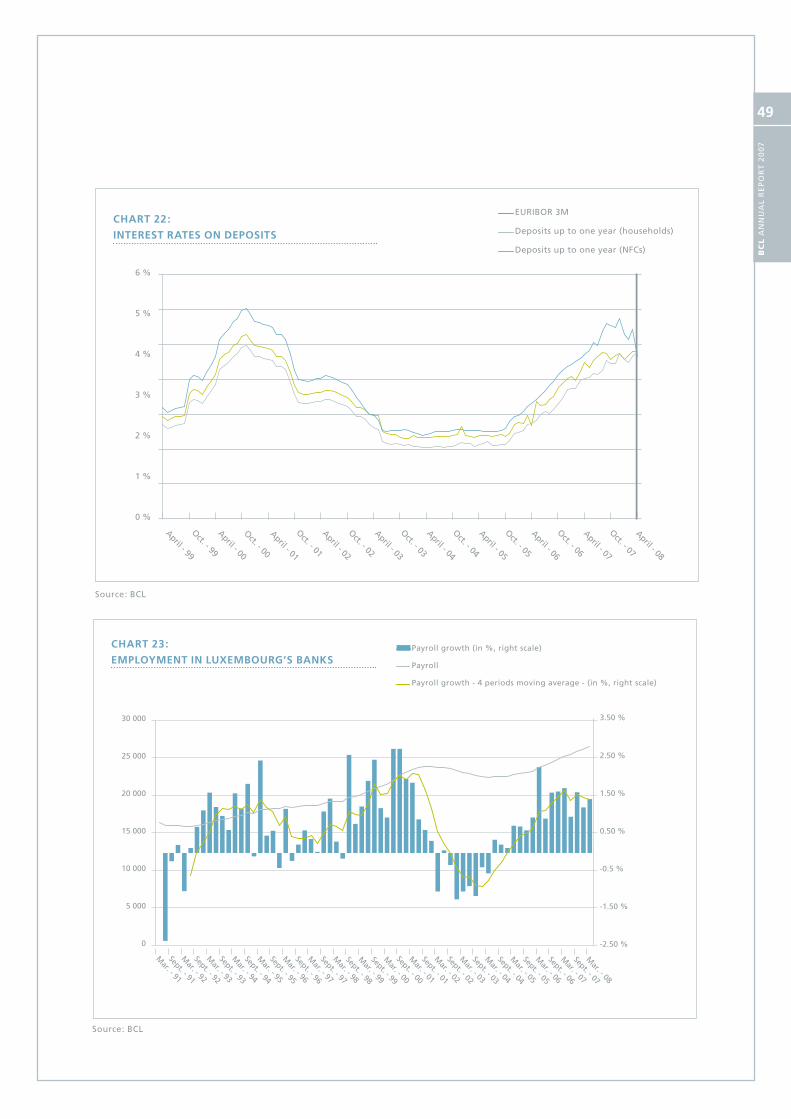
BC
L A
nn
uA
l R
Ep
oR
t 2
00
7
49
Source: BCl
CHART 22:
INTEREST RATES oN DEPoSITS
April - 99
Oct. - 99
April - 00
Oct. - 00
April - 01
Oct. - 01
April - 02
Oct. - 02
April - 03
Oct. - 03
April - 04
Oct. - 04
April - 05
Oct. - 05
April - 06
Oct. - 06
April - 07
Oct. - 07
April - 08
EURIBOR 3M
Deposits up to one year (households)
Deposits up to one year (NFCs)
0 %
1 %
2 %
3 %
4 %
5 %
6 %
CHART 23:
EMPLoyMENT IN LuxEMBouRG’S BANKS
Source: BCl
Mar. - 91
Sept. - 91
Mar. - 92
Sept. - 92
Mar. - 93
Sept. - 93
Mar. - 94
Sept. - 94
Mar. - 95
Sept. - 95
Mar. - 96
Sept. - 96
Mar. - 97
Sept. - 97
Mar. - 98
Mar. - 01
Sept. - 01
Mar. - 02
Sept. - 02
Mar. - 03
Sept. - 03
Mar. - 04
Sept. - 04
Mar. - 05
Sept. - 05
Mar. - 06
Sept. - 06
Mar. - 07
Sept. - 07
Mar. - 08
Sept. - 98
Mar. - 99
Sept. - 99
Mar. - 00
Sept. - 00
Payroll growth (in %, right scale)
Payroll
Payroll growth - 4 periods moving average - (in %, right scale)
-2.50 %
-1.50 %
-0.5 %
0.50 %
1.50 %
2.50 %
3.50 %
0
5 000
10 000
15 000
20 000
25 000
30 000
1. ECONOMIC AND FINANCIAL SITUATION
BC
L A
nn
uA
l R
Ep
oR
t 2
00
7
50
reversal was strong and durable; as it took 2 years
to return to job creation. This suggests a time-lag
between the start of a crisis and its impact on the level
of employment in the Luxembourg banks.
1.2.5.4 Credit institutions’ profit and loss accounts
After an excellent first half of 2007, in line with the
results of 2006, earnings in Luxembourg’s credit insti-
tutions suffered from the financial turmoil that started
in August 2007. The aggregate net result after taxes
declined by €2 046 million, or 35.8% compared with
2006, to €3 670 million, which nearly represents a
return to the level in 2005.
The interest margin rose considerably by 24.5%, or
€1 199 million, to €6 102 million in 2007. Net income
benefited especially from an increase in net income from
securities of 275.5%, or €259 million, whereas other
net income dropped by €760 million, or 45.5%.
The slight decline in net income by 2.3% was more
than compensated by the increased interest margin
so that gross income rose from €10 878 million to
€11 939 million, or 9.8%, over 2007.
General administrative expenditure (staff costs and other
administrative expenditure) rose by 11.2% during 2007.
Staff costs increased due to wage adjustments and to
new job creation in the banking sector (+ 1 387 jobs).
In 2007, Luxembourg banks reached an aggregate gross
income before taxes and provisions of €7 364 million,
representing an improvement of 8.9% in comparison with
the year 2006, when an exceptionally high level of €6 761
million was achieved (+46.7% compared to 2005).
However, due to the sub-prime mortgage crisis and
subsequent financial turmoil, credit institutions had to
increase net provisions from €193 million in 2006 to
€2 899 million in 2007, representing 24.3% of gross
income. Although some banks holding mortgage-bac-
ked securities and collateralised debt obligations faced
significant losses, the vast majority of Luxembourg
banks seem to have been fairly resilient to the effects
the sub-prime mortgage crisis had on international
financial markets.

BC
L A
nn
uA
l R
Ep
oR
t 2
00
7
51
TABLE 13:
AGGREGATE PRoFIT AND LoSS ACCouNT oF
LuxEMBouRG BANKS AT yEAR-END, INCLuDING
THEIR FoREIGN BRANCHES 1)2)
(Eur millions except otherwise indicated)
Debit and credit items 2000 2001 2002 2003 2004 2005 2006 2007
1 Interest receivable and income from securities
50 694 52 993 42 681 35 300 30 241 36 515 49 972 62 452
2 Interest payable 47 081 48 524 38 441 31 129 26 241 32 531 45 069 56 350
3 Interest margin (1-2) 3 613 4 469 4 240 4 171 4 000 3 984 4 903 6 102
other income:
4 from securities 290 189 172 297 415 376 94 353
5 from commission 3 102 2 830 2 655 2 575 2 831 3 285 3 761 4 115
6 from foreign exchange 300 290 316 285 296 335 446 455
7 other net income 463 413 948 430 64 503 1 674 914
8 Net income (4+5+6+7) 4 155 3 722 4 091 3 587 3 606 4 499 5 975 5 837
9 Gross income (3+8) 7 768 8 190 8 331 7 758 7 606 8 483 10 878 11 939
10 Staff costs 1 677 1 806 1 864 1 807 1 860 2 016 2 208 2 432
11 other administrative expenditure 1 444 1 498 1 412 1 381 1 413 1 518 1 628 1 832
12 General administrative expenditure (10+11)
3 121 3 304 3 276 3 188 3 273 3 534 3 836 4 264
13 Taxes other than tax on income 99 95 50 40 36 38 46 54
14 write downs of non-financial fixed assets
315 402 314 295 296 286 235 257
15 Results before provisions (9-12-13-14) 4 232 4 390 4 691 4 235 4 001 4 625 6 761 7 364
16 Provisions and write downs of fixed financial assets
1 584 1 381 1 912 1 318 1 004 1 007 712 3 587
17 write back of provisions 719 627 526 593 622 630 519 688
18 Net provisions 864 754 1 386 725 382 377 193 2 899
19 Result after provisions (15-18) 3 368 3 635 3 305 3 510 3 619 4 248 6 568 4 465
20 Tax on income 936 834 630 657 747 775 852 795
21 Net result (19-20) 2 432 2 802 2 675 2 853 2 872 3 473 5 716 3 670
22 Average balance sheet total 639 043 696 961 700 099 668 088 687 486 754 825 837 148 896 069
Significant indicators
23 operating costs (row 10 to 14) 0.55 0.55 0.52 0.53 0.52 0.51 0.49 0.51
24 Results before provisions (row 15) 0.66 0.63 0.67 0.63 0.58 0.61 0.81 0.82
25 Net provisions (row 18) 0.14 0.11 0.20 0.11 0.06 0.05 0.02 0.32
26 Result after provisions (row 19) 0.53 0.52 0.47 0.53 0.53 0.56 0.78 0.50
Source: BCl
1. Data has been revised in the light of new information.2. 2007 provisional data.
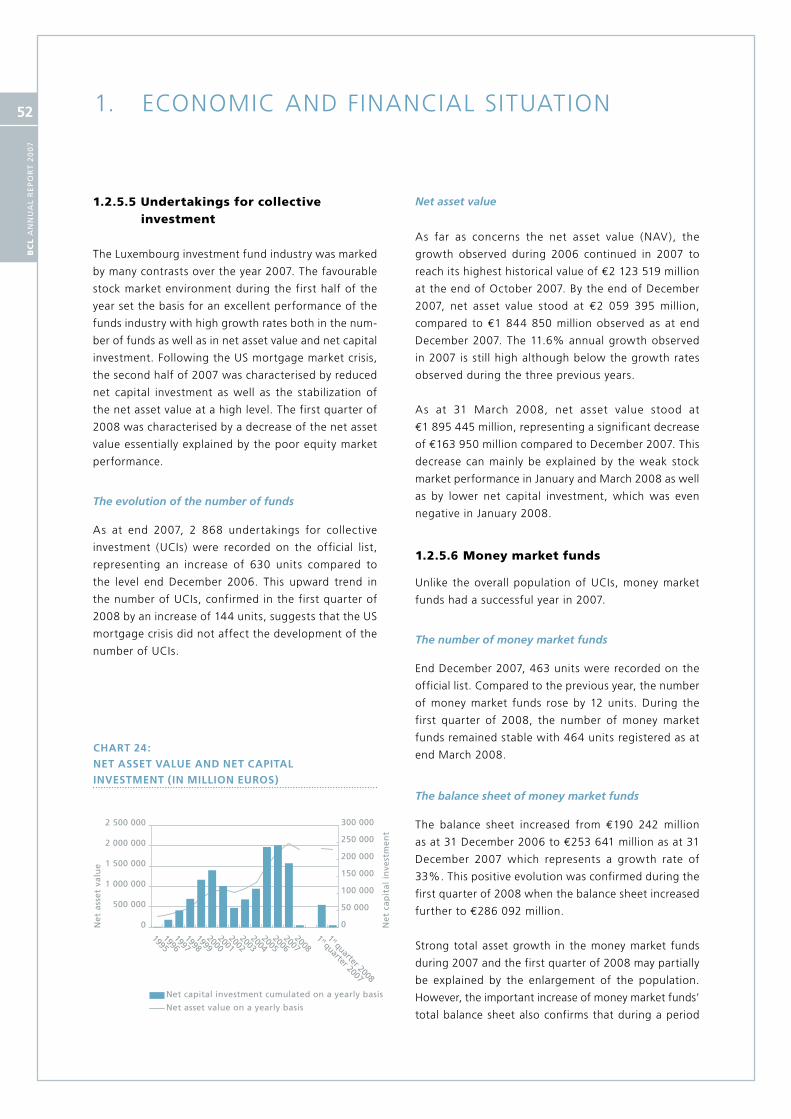
1. ECONOMIC AND FINANCIAL SITUATION
BC
L A
nn
uA
l R
Ep
oR
t 2
00
7
52
1.2.5.5 Undertakings for collective investment
The Luxembourg investment fund industry was marked
by many contrasts over the year 2007. The favourable
stock market environment during the first half of the
year set the basis for an excellent performance of the
funds industry with high growth rates both in the num-
ber of funds as well as in net asset value and net capital
investment. Following the US mortgage market crisis,
the second half of 2007 was characterised by reduced
net capital investment as well as the stabilization of
the net asset value at a high level. The first quarter of
2008 was characterised by a decrease of the net asset
value essentially explained by the poor equity market
performance.
The evolution of the number of funds
As at end 2007, 2 868 undertakings for collective
investment (UCIs) were recorded on the official list,
representing an increase of 630 units compared to
the level end December 2006. This upward trend in
the number of UCIs, confirmed in the first quarter of
2008 by an increase of 144 units, suggests that the US
mortgage crisis did not affect the development of the
number of UCIs.
Net asset value
As far as concerns the net asset value (NAV), the
growth observed during 2006 continued in 2007 to
reach its highest historical value of €2 123 519 million
at the end of October 2007. By the end of December
2007, net asset value stood at €2 059 395 million,
compared to €1 844 850 million observed as at end
December 2007. The 11.6% annual growth observed
in 2007 is still high although below the growth rates
observed during the three previous years.
As at 31 March 2008, net asset value stood at
€1 895 445 million, representing a significant decrease
of €163 950 million compared to December 2007. This
decrease can mainly be explained by the weak stock
market performance in January and March 2008 as well
as by lower net capital investment, which was even
negative in January 2008.
1.2.5.6 Money market funds
Unlike the overall population of UCIs, money market
funds had a successful year in 2007.
The number of money market funds
End December 2007, 463 units were recorded on the
official list. Compared to the previous year, the number
of money market funds rose by 12 units. During the
first quarter of 2008, the number of money market
funds remained stable with 464 units registered as at
end March 2008.
The balance sheet of money market funds
The balance sheet increased from €190 242 million
as at 31 December 2006 to €253 641 million as at 31
December 2007 which represents a growth rate of
33%. This positive evolution was confirmed during the
first quarter of 2008 when the balance sheet increased
further to €286 092 million.
Strong total asset growth in the money market funds
during 2007 and the first quarter of 2008 may partially
be explained by the enlargement of the population.
However, the important increase of money market funds’
total balance sheet also confirms that during a period
Net capital investment cumulated on a yearly basis
Net asset value on a yearly basis
Ne
t ca
pit
al
inve
stm
en
t
Ne
t a
sse
t va
lue
0
500 000
1 000 000
1 500 000
2 000 000
2 500 000
0
50 000
100 000
150 000
200 000
250 000
300 000
19951996
19971998
19992000
20012002
20032004
20052006
20072008
1 st quarter 2007
1 st quarter 2008
CHART 24:
NET ASSET vALuE AND NET CAPITAL
INvESTMENT (IN MILLIoN EuRoS)

BC
L A
nn
uA
l R
Ep
oR
t 2
00
7
53
Number of uCIs
Number of subfunds
Net asset value
Net capital investment 1) 2)
variation of financial
market 2) 3)
Annual change in
EuR million
Annual percentage
change
2000 1 785 6 995 874 600 168 200 -28 118 140 082 19.1
2001 1 908 7 519 928 447 121 700 -67 900 53 847 6.2
2002 1 941 7 806 844 508 57 314 -141 206 -83 939 -9.0
2003 1 870 7 509 953 302 82 609 26 185 108 794 12.9
2004 1 968 7 876 1 106 222 113 731 39 189 152 920 16.0
2005 2 060 8 497 1 525 208 236 277 182 709 418 986 37.9
2006 2 238 9 473 1 844 850 241 344 78 298 319 642 21.0
2007 2 868 11 115 2 059 395 188 488 26 057 214 545 11.6
2007
jan. 2 260 9 563 1 895 810 30 749 20 211 312 566 19.7
Feb. 2 278 9 637 1 908 707 29 083 -16 186 270 601 16.5
March 2 248 9 680 1 927 360 6 378 12 275 252 100 15.0
April 2 276 9 793 1 966 996 22 233 17 403 264 757 15.6
May 2 302 9 900 2 024 662 21 578 36 088 366 985 22.1
june 2 352 10 042 2 047 022 20 598 1 762 394 896 23.9
july 2 407 10 194 2 052 977 23 771 -17 816 373 459 22.2
Aug. 2 460 10 336 2 035 294 166 -17 849 327 888 19.2
Sept. 2 501 10 415 2 059 144 -607 24 457 326 114 18.8
oct. 2 618 10 644 2 123 519 24 630 39 745 342 402 19.2
Nov. 2 761 10 924 2 063 797 6 860 -66 582 264 272 14.7
Dec. 2 868 11 115 2 059 395 3 049 -7 451 214 545 11.6
2008
jan. 2 932 11 262 1 951 141 -7 580 -100 674 55 331 2.9
Feb. 2 972 11 387 1 962 845 9 027 2 677 54 138 2.8
March 3 012 11 498 1 895 445 4 794 -72 194 -31 915 -1.7
Source: CSSF
1. net capital investment is defined as the difference between net proceeds from shares or units and net payments made in settlement of redemptions in liquidation adjusted to take into consideration uCIs2. Figures cumulated on a yearly/monthly basis3. the column variation of financial markets reflects the change in net assets which is due to the fluctuation of financial markets.
TABLE 14:
GLoBAL SITuATIoN oF uNDERTAKINGS FoR
CoLLECTIvE INvESTMENTS
(in million euros, outstanding amounts at the end of period, except where otherwise stated)
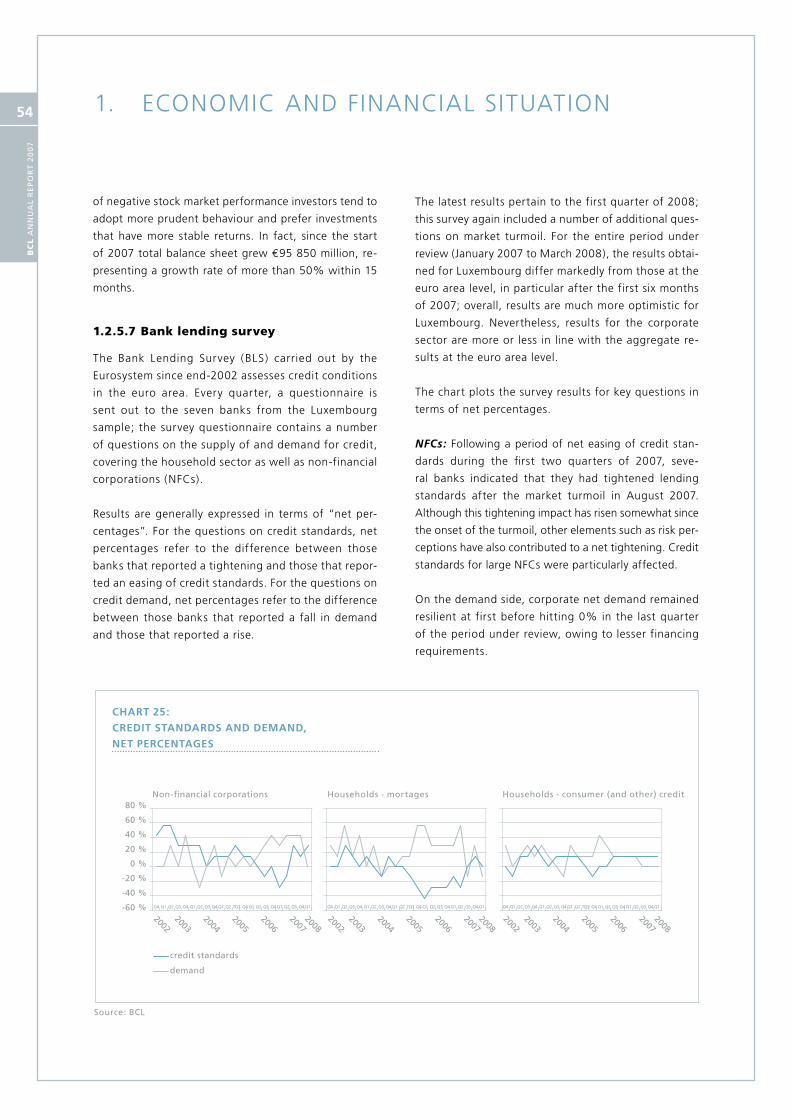
1. ECONOMIC AND FINANCIAL SITUATION
BC
L A
nn
uA
l R
Ep
oR
t 2
00
7
54
of negative stock market performance investors tend to
adopt more prudent behaviour and prefer investments
that have more stable returns. In fact, since the start
of 2007 total balance sheet grew €95 850 million, re-
presenting a growth rate of more than 50% within 15
months.
1.2.5.7 Bank lending survey
The Bank Lending Survey (BLS) carried out by the
Eurosystem since end-2002 assesses credit conditions
in the euro area. Every quarter, a questionnaire is
sent out to the seven banks from the Luxembourg
sample; the survey questionnaire contains a number
of questions on the supply of and demand for credit,
covering the household sector as well as non-financial
corporations (NFCs).
Results are generally expressed in terms of “net per-
centages”. For the questions on credit standards, net
percentages refer to the difference between those
banks that reported a tightening and those that repor-
ted an easing of credit standards. For the questions on
credit demand, net percentages refer to the difference
between those banks that reported a fall in demand
and those that reported a rise.
The latest results pertain to the first quarter of 2008;
this survey again included a number of additional ques-
tions on market turmoil. For the entire period under
review (January 2007 to March 2008), the results obtai-
ned for Luxembourg differ markedly from those at the
euro area level, in particular after the first six months
of 2007; overall, results are much more optimistic for
Luxembourg. Nevertheless, results for the corporate
sector are more or less in line with the aggregate re-
sults at the euro area level.
The chart plots the survey results for key questions in
terms of net percentages.
NFCs: Following a period of net easing of credit stan-
dards during the first two quarters of 2007, seve-
ral banks indicated that they had tightened lending
standards after the market turmoil in August 2007.
Although this tightening impact has risen somewhat since
the onset of the turmoil, other elements such as risk per-
ceptions have also contributed to a net tightening. Credit
standards for large NFCs were particularly affected.
On the demand side, corporate net demand remained
resilient at first before hitting 0% in the last quarter
of the period under review, owing to lesser financing
requirements.
credit standards
demand
20022003
20042005
20062007
-60 %
-40 %
-20 %
0 %
20 %
40 %
60 %
80 %
20022003
20042005
20062007
20022003
20042005
20062007
20082008
2008
Source: BCl
CHART 25:
CREDIT STANDARDS AND DEMAND,
NET PERCENTAGES
non-financial corporations Households - mortages Households - consumer (and other) credit

BC
L A
nn
uA
l R
Ep
oR
t 2
00
7
55

1. ECONOMIC AND FINANCIAL SITUATION
BC
L A
nn
uA
l R
Ep
oR
t 2
00
7
56
Households (mortgages) : Although the two-year
period during which mortgage credit standards have
eased continuously came to an end in the third quar-
ter 2007, only one net tightening has been recorded
since. The ad hoc questions on market turmoil indicate
that market tensions have indeed had little impact on
mortgage lending standards. These results are much
more favourable for borrowers than those recorded at
the euro area level, though it is worth highlighting that
considerable intra-country differences exist.
Net mortgage demand has moderated considerably
after a prolonged period during which high net per-
centages had been recorded; indeed, net demand was
negative in the third quarter of 2007 and in the first
quarter of 2008. Moreover, participating banks indi-
cated that housing market prospects had a mitigating
impact on loan demand.
Households (consumer and other credit): Regarding
credit standards, consecutive net tightenings have been
recorded since the third quarter of 2006. However, it
is essential to recall that the net percentages are not
weighted, and the overall results should therefore not
be interpreted as a broad-based tightening affecting
the Luxembourg economy at large.
On the demand side, net percentages have been flat
since the third quarter of 2007, following a prolonged
period during which net demand was positive. The drop
in net demand for consumer (and other) credit is in part
linked to a fall in consumer confidence.
Ad hoc questions regarding the impact of market
tensions on funding access: In addition to the ques-
tions regarding the impact of market tensions on credit
standards, the last three survey rounds included a series
of questions on whether market turmoil had affected
banks’ funding access. Results indicate that participa-
ting banks in Luxembourg have primarily experienced
funding difficulties in the money market; these difficul-
ties have increased somewhat since the third quarter
2007. While funding difficulties were less severe with
regard to the issuance of debt securities, it should be
highlighted that not all banks from the sample were
active in this market segment, while securitisation was
not widely used at all.
These funding difficulties have also had an impact
on the quantity banks were willing to lend, and es-
pecially on their margins. Bank capital was virtually
unaffected.
1.2.6 Luxembourg Stock Exchange
In 2007, the LuxX index progressed by 11.1%, finishing
the year at 2 419.28. During the first five months of
2008, the LuxX fell by 4.5%, standing at 2 311.54
at end-May. Nevertheless, compared to other major
stock indices the performance of the LuxX remains
impressive.
The overall rise in the index veils a rather heterogeneous
evolution of its components. It is, for example, largely
attributable to ArcelorMittal, which contributes over
20% to the index basket. However, some of the other
components of the LuxX, most notably financial sector
shares, had a much less favourable performance.
All in all, 13 353 new listings were introduced in the
year under review (2 305 in the alternative Euro MTF
market); this contrasts with 7 639 de-listings, yielding
a total of 45 573 listings at end-2007.
Total turnover by volume fell from €1 500.5 million to
€652 million, however, largely owing to a substantial
drop in bond turnover (-65%).
Apart from these developments, it is worth mentio-
ning that the alternative market Euro MTF launched
in July 2005 has become increasingly popular at the
international level, in particular with issuers outside
the European Union; this alternative market lies out-
side the scope of some EU regulations, such as IAS.
At end-2007, 4 259 securities were listed on Euro
MTF. In March 2007, Euronext and the Luxembourg
Stock Exchange announced the signature of a Master
Agreement. On May 2, 2007, the Luxembourg Stock
Exchange migrated all securities listed on its two
markets to the NSC® trading platform of Euronext.
A few weeks later, LCH.Clearnet SA and the Luxem-
bourg Stock Exchange announced the signature of a
Memorandum of Understanding to implement clearing
services for Luxembourg Stock Exchange markets in
respect of transactions in corporate bonds, government
bonds and equities.
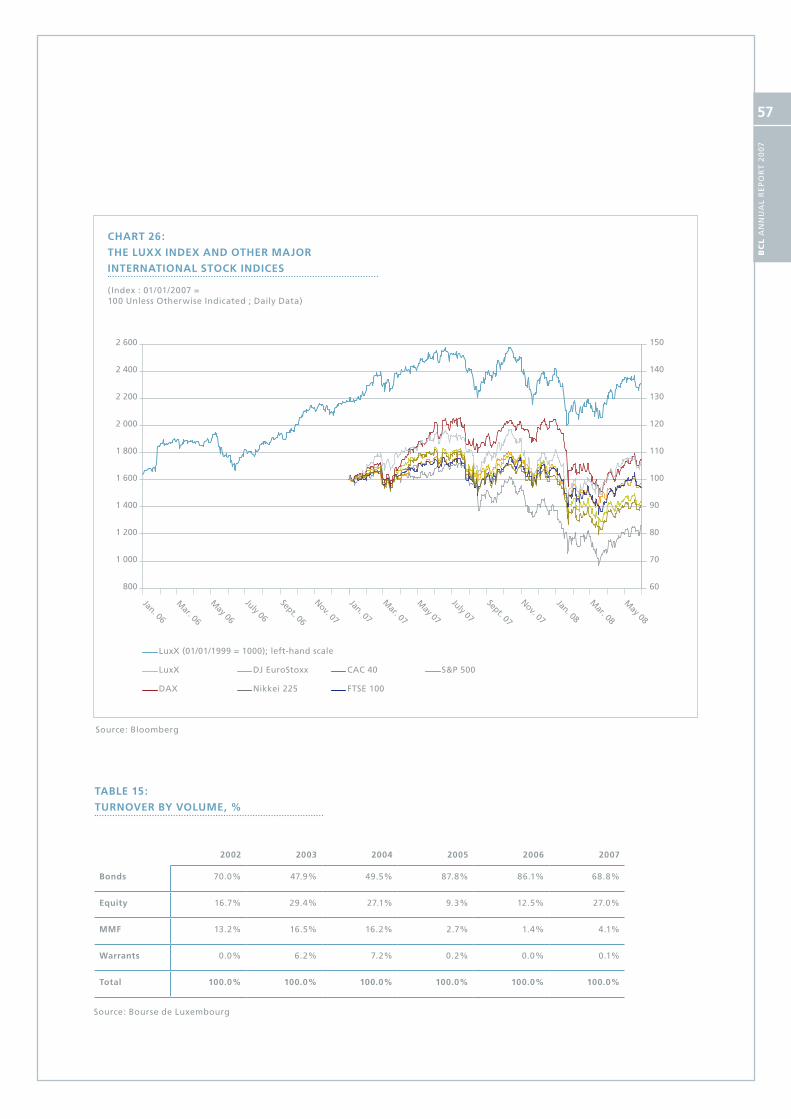
BC
L A
nn
uA
l R
Ep
oR
t 2
00
7
57
Source: Bloomberg
CHART 26:
THE Luxx INDEx AND oTHER MAjoR
INTERNATIoNAL SToCK INDICES (Index : 01/01/2007 = 100 unless otherwise Indicated ; Daily Data)
Jan. 06
Mar. 06
May 06
July 06
Sept. 06
Nov. 07
Jan. 07
Mar. 07
May 07
Jan. 08
Mar. 08
May 08
July 07
Sept. 07
Nov. 07
LuxX (01/01/1999 = 1000); left-hand scale
LuxX DJ EuroStoxx CAC 40 S&P 500
DAX Nikkei 225 FTSE 100
800
1 000
1 200
1 400
1 600
1 800
2 000
2 200
2 400
2 600
60
70
80
90
100
110
120
130
140
150
TABLE 15:
TuRNovER By voLuME, %
2002 2003 2004 2005 2006 2007
Bonds 70.0% 47.9% 49.5% 87.8% 86.1% 68.8%
Equity 16.7% 29.4% 27.1% 9.3% 12.5% 27.0%
MMF 13.2% 16.5% 16.2% 2.7% 1.4% 4.1%
warrants 0.0% 6.2% 7.2% 0.2% 0.0% 0.1%
Total 100.0% 100.0% 100.0% 100.0% 100.0% 100.0%
Source: Bourse de luxembourg
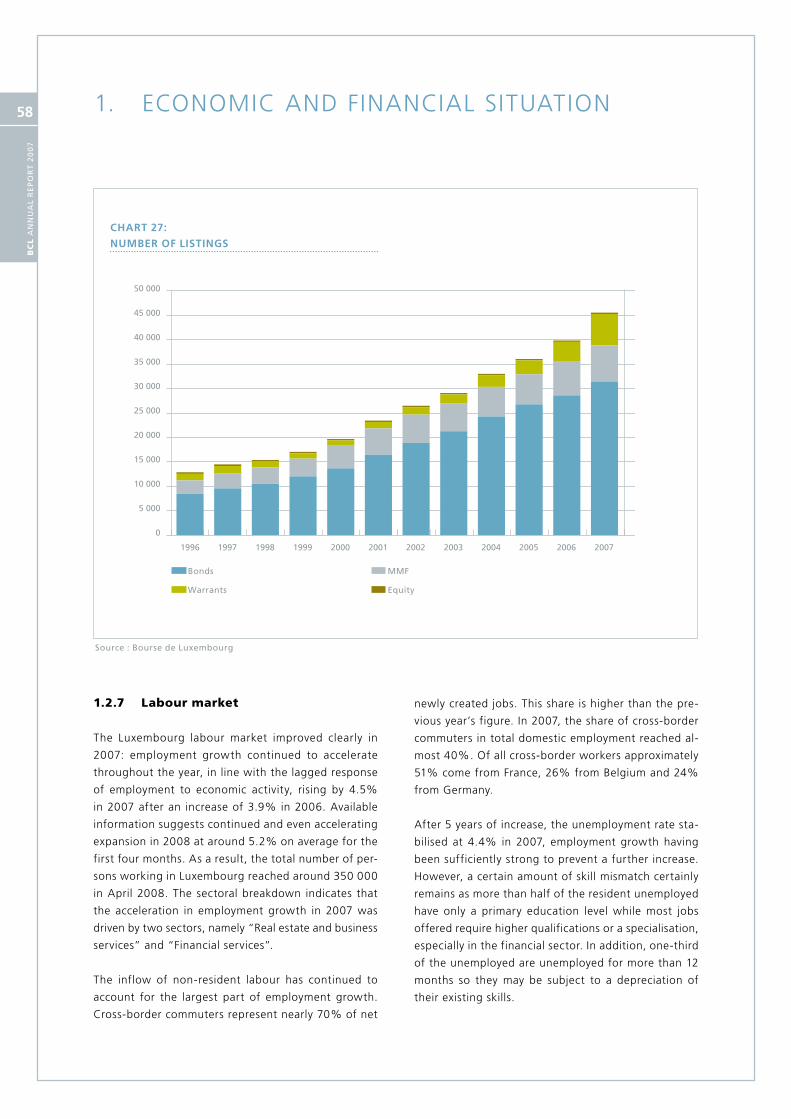
1. ECONOMIC AND FINANCIAL SITUATION
BC
L A
nn
uA
l R
Ep
oR
t 2
00
7
58
newly created jobs. This share is higher than the pre-
vious year’s figure. In 2007, the share of cross-border
commuters in total domestic employment reached al-
most 40%. Of all cross-border workers approximately
51% come from France, 26% from Belgium and 24%
from Germany.
After 5 years of increase, the unemployment rate sta-
bilised at 4.4% in 2007, employment growth having
been sufficiently strong to prevent a further increase.
However, a certain amount of skill mismatch certainly
remains as more than half of the resident unemployed
have only a primary education level while most jobs
offered require higher qualifications or a specialisation,
especially in the financial sector. In addition, one-third
of the unemployed are unemployed for more than 12
months so they may be subject to a depreciation of
their existing skills.
1.2.7 Labour market
The Luxembourg labour market improved clearly in
2007: employment growth continued to accelerate
throughout the year, in line with the lagged response
of employment to economic activity, rising by 4.5%
in 2007 after an increase of 3.9% in 2006. Available
information suggests continued and even accelerating
expansion in 2008 at around 5.2% on average for the
first four months. As a result, the total number of per-
sons working in Luxembourg reached around 350 000
in April 2008. The sectoral breakdown indicates that
the acceleration in employment growth in 2007 was
driven by two sectors, namely “Real estate and business
services” and “Financial services”.
The inflow of non-resident labour has continued to
account for the largest part of employment growth.
Cross-border commuters represent nearly 70% of net
Source : Bourse de luxembourg
1996
Bonds MMF
Warrants Equity
0
5 000
10 000
15 000
20 000
25 000
30 000
35 000
40 000
45 000
50 000
1997 1998 1999 2000 2001 2002 2003 2004 2005 2006 2007
CHART 27:
NuMBER oF LISTINGS

BC
L A
nn
uA
l R
Ep
oR
t 2
00
7
59
Unit labour costs and productivity: comparison with neighbouring countries
This text box analyses unit labour cost developments
over the period 1996-2006, comparing Luxembourg’s
performance with that of its three neighbouring coun-
tries (Germany, France and Belgium). These three coun-
tries are also Luxembourg’s main trading partners and
in 2006 they were the destination of more than 50%
of Luxembourg’s goods exports and nearly 40% of its
services exports. Any international comparison requi-
res comparable data. This is why this text box relies
on the AMECO database, published by the European
Commission services, in which the most recent annual
observation is 2006.
Unit labour costs are measured by the ratio of wages
per employee to labour productivity (GDP divided by
total employment, including the self-employed). In
general, international comparisons are based on nomi-
nal unit labour costs (calculated using real GDP)10. The
table indicates that Luxembourg experienced the fastest
growth in unit labour costs over the period 1996-2006
(1.95%), above Belgium and France (1.38% and 1.22%).
In Germany, unit labour costs even declined slightly in
nominal terms over this period (-0.05%). Limiting the
analysis to the five most recent years (2001-2006), it
appears that growth in unit labour costs in Luxembourg
was even higher, by nearly 0.8 percentage points with
respect to the whole of the decade. Note also that over
the period 2001-2006, the drop in Germany was nearly
twice as fast as the decline over the last decade.
10 Comparing real unit labour costs luxembourg’s situation appears to be much better because these incorporate the GDp deflator, which has grown much more rapidly in luxembourg than abroad. By analogy, it would be mistaken to compare the price of apples in luxembourg and abroad after deflating by the consumer price index (which has increased more in luxembourg than in neighbouring countries).
TABLE 16:
uNIT LABouR CoSTS: CoMPARISoN
wITH NEIGHBouRING CouNTRIES
Luxembourg Germany France Belgium
Average 1996-2006
unit labour costs (1) = (2) - (3) 1.95% -0.05% 1.38% 1.22%
wages per employee (2) 3.01% 1.03% 2.52% 2.49%
Labour productivity (3)=(4)+(5)
1.06% 1.08% 1.14% 1.27%
Contribution from total factor productivity (4) 0.45% 0.58% 0.64% 0.87%
Contribution from capital-deepening (5) 0.61% 0.50% 0.50% 0.40%
Average 2001-2006
unit labour costs (1) = (2) - (3) 2.76% -0.09% 1.98% 1.61%
wages per employee (2) 3.12% 0.90% 2.93% 2.65%
Labour productivity (3)=(4)+(5)
0.36% 0.99% 0.95% 1.04%
Contribution from total factor productivity (4) -0.56% 0.51% 0.26% 0.64%
Contribution from capital-deepening (5) 0.93% 0.47% 0.69% 0.40%
Sources : European Commission (AMECo), BCl calculations

1. ECONOMIC AND FINANCIAL SITUATION
BC
L A
nn
uA
l R
Ep
oR
t 2
00
7
60
Growth in unit labour costs can be decomposed into the
contribution of wages per employee and the contribu-
tion of labour productivity (GDP per person employed).
Luxembourg experienced the fastest growth in wages
per employee (3.01% on average), well above France
(2.52%) and Belgium (2.49%), with Germany demons-
trating significant wage moderation (1.03%). On the
other hand, labour productivity grew more slowly in
Luxembourg (1.06%) than in Belgium (1.27%) or France
(1.14%) or even Germany (1.08%). Considering that
Luxembourg experienced the weakest productivity
growth and the strongest wage growth, it is natural
that its unit labour costs grew faster than in its neigh-
bouring countries. Concentrating on the last five years
of the decade, one can see that wages per employee
accelerated in Luxembourg but also in France and in
Belgium. Furthermore, over the period 2001-2006, la-
bour productivity growth was nearly three times slower
than over the whole of the decade, contributing to the
decline in Luxembourg’s relative position.
Labour productivity growth can be further decomposed
by relying on the conventional assumptions of growth
accounting. Assume that observed GDP is produced by a
Cobb-Douglas function with constant returns to scale:
Y = (K) 1−α (L) α TFP
where Y represents real GDP, K represents the real
capital stock, L represents total employment and TFP
represents total factor productivity. Applying natural
logarithms (ln) and taking first differences (Δxt = x
t-x
t-1),
one can rewrite this equation as follows:
Δln (Y/L) = (1-α)Δln (K/L) + Δln (TFP)
The term on the left-hand side measures growth in
labour productivity, which can now be decomposed
into the two terms on the right-hand side: fluctua-
tions in the capital-labour ratio (capital-deepening) and
growth in total factor productivity. The parameter α
is conventionally set at the average share of the wage
bill in nominal GDP (on the assumption that on average
factor markets are at their competitive equilibrium).
This makes it possible to calculate TFP as a residual.
Based on the capital stock estimates in the AMECO
database11, the results of this accounting exercise sug-
gest that the contribution of total factor productivity
has been weakest in Luxembourg, with respect to its
neighbouring countries, and that it has even been
negative over the last five years. This result should be
taken with some caution, as total factor productivity
is not observed but only estimated on the basis of the
(possibly unrealistic) assumptions mentioned earlier.
In particular, if one of the factors of production (la-
bour or capital) is not homogeneous, but varies due
to quality improvements or composition effects, this
will contaminate total factor productivity if measured
as described.
The second component of labour productivity reflects
changes in the capital-labour ratio. The results suggest
that the contribution from “capital deepening” has
been very important in Luxembourg, exceeding that
in the three neighbouring countries. In particular, this
contribution increased over the last five years, practically
reaching the double of levels observed in Germany and
Belgium. This means that growth in labour productivity
in Luxembourg reflects the fact that each worker had
a greater portion of capital stock available. In order for
this component to provide a positive contribution to
labour productivity, capital accumulation must grow
faster than total employment. Again, it is important to
bear in mind that the capital stock measure used in this
international comparison is calculated by the European
Commission services on the basis of some assumptions
that could be challenged12. However, it is possible to
draw some provisional conclusions.
Since 1996, unit labour costs have grown faster in
Luxembourg than in the surrounding countries. This
increase could be attributed to faster growth of wages
per employee and slower growth of labour producti-
vity than in the three neighbouring countries. On the
basis of some conventional assumptions, weak labour
productivity growth can be decomposed separately.
Results suggest that this has suffered from a contribu-
tion of total factor productivity that has been weak in
11 this series for luxembourg’s capital stock is not produced by StAtEC. the national statistics institute has not validated the series for luxembourg available on www.eu-klems.com either.12 For all countries, the initial level of the capital stock is fixed at 300% of GDp in 1960.
BC
L A
nn
uA
l R
Ep
oR
t 2
00
7
61
international comparison and even negative over the
most recent years. On the other hand, the “capital-
deepening” contribution of the capital-labour ratio
has been higher than in the neighbouring countries.
This suggests that Luxembourg depends on a capital
accumulation that has been much faster than employ-
ment growth. Under this configuration, Luxembourg’s
labour productivity seems vulnerable to a fall in the
country’s attractiveness for foreign investors.
Impact of the Tripartite Coordination Committee’s
measures on the compensation per employee in
Luxembourg
1. Presentation of the measures decided by the
Tripartite Coordination Committee
In April 2006, the Tripartite Coordination Committee’s
stressed the imbalances in public finances, in the labour
and real estate market and the rise in inflation. In order
to preserve competitiveness, the Tripartite Coordination
Committee decided to modulate the automatic indexation
scheme for the period 2006-2009. The principle of the in-
dexation mechanism remained unaltered but the inflation-
related pay increases were postponed as follows:
2006: the automatic wage increase due in August −
2006 was postponed to December 2006.
2007: the automatic wage indexation was suspended. −
2008: the automatic wage increase due in January −
2008 was postponed until March 2008, as the ave-
rage oil price exceeded the threshold of 63 USD per
barrel during the last six months of 2006 (65.1 dol-
lars on average) and in 2007 (72 dollars on average).
2009: the previous automatic wage increase −
will be paid in January or March 2009 de-
pending on the average level of the oil price.
This modulation of the indexation scheme will be ap-
plied until 31st December 2009.
In addition to the modulation of the indexation sche-
me, the Government announced a wage freeze for
public employees in 2007 and 2008.
2. Impact on compensation per employee
To quantify the impact on wages of the changes to
the indexation scheme, two cases are presented si-
multaneously in Table 17. The first case describes the
situation without indexation modulation, in other
words under the counterfactual assumption that the
automatic indexation mechanism remained unchanged
in 2006-2009. The second case shows the impact of
the modulated scheme on compensation per employee
and on unit labour costs. The main result is that on
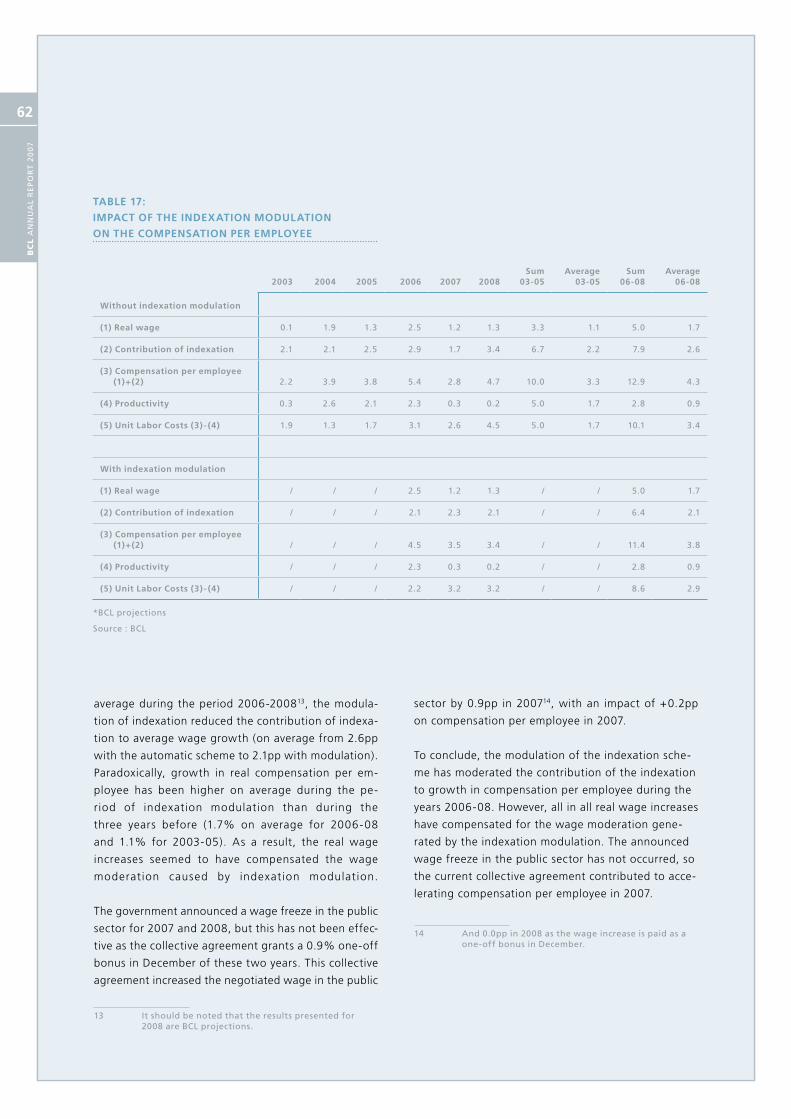
1. ECONOMIC AND FINANCIAL SITUATION
BC
L A
nn
uA
l R
Ep
oR
t 2
00
7
62
average during the period 2006-200813, the modula-
tion of indexation reduced the contribution of indexa-
tion to average wage growth (on average from 2.6pp
with the automatic scheme to 2.1pp with modulation).
Paradoxically, growth in real compensation per em-
ployee has been higher on average during the pe-
riod of indexation modulation than during the
three years before (1.7% on average for 2006-08
and 1.1% for 2003-05). As a result, the real wage
increases seemed to have compensated the wage
moderation caused by indexation modulation.
The government announced a wage freeze in the public
sector for 2007 and 2008, but this has not been effec-
tive as the collective agreement grants a 0.9% one-off
bonus in December of these two years. This collective
agreement increased the negotiated wage in the public
13 It should be noted that the results presented for 2008 are BCl projections.
sector by 0.9pp in 200714, with an impact of +0.2pp
on compensation per employee in 2007.
To conclude, the modulation of the indexation sche-
me has moderated the contribution of the indexation
to growth in compensation per employee during the
years 2006-08. However, all in all real wage increases
have compensated for the wage moderation gene-
rated by the indexation modulation. The announced
wage freeze in the public sector has not occurred, so
the current collective agreement contributed to acce-
lerating compensation per employee in 2007.
14 And 0.0pp in 2008 as the wage increase is paid as a one-off bonus in December.
TABLE 17:
IMPACT oF THE INDExATIoN MoDuLATIoN
oN THE CoMPENSATIoN PER EMPLoyEE
2003 2004 2005 2006 2007 2008Sum
03-05Average
03-05Sum
06-08Average
06-08
without indexation modulation
(1) Real wage 0.1 1.9 1.3 2.5 1.2 1.3 3.3 1.1 5.0 1.7
(2) Contribution of indexation 2.1 2.1 2.5 2.9 1.7 3.4 6.7 2.2 7.9 2.6
(3) Compensation per employee (1)+(2) 2.2 3.9 3.8 5.4 2.8 4.7 10.0 3.3 12.9 4.3
(4) Productivity 0.3 2.6 2.1 2.3 0.3 0.2 5.0 1.7 2.8 0.9
(5) unit Labor Costs (3) - (4) 1.9 1.3 1.7 3.1 2.6 4.5 5.0 1.7 10.1 3.4
with indexation modulation
(1) Real wage / / / 2.5 1.2 1.3 / / 5.0 1.7
(2) Contribution of indexation / / / 2.1 2.3 2.1 / / 6.4 2.1
(3) Compensation per employee (1)+(2) / / / 4.5 3.5 3.4 / / 11.4 3.8
(4) Productivity / / / 2.3 0.3 0.2 / / 2.8 0.9
(5) unit Labor Costs (3) - (4) / / / 2.2 3.2 3.2 / / 8.6 2.9
*BCl projections
Source : BCl

BC
L A
nn
uA
l R
Ep
oR
t 2
00
7
63
TABLE 18:
IMPACT oF THE wAGE AGREEMENT IN THE PuBLIC
SECToR oN CoMPENSATIoN PER EMPLoyEE
2006 2007 2008
If the wage freeze was applied
negotiated wage in the public sector 0.8 0.0 0.0
(1) Real wage 2.4 1.0 1.3
(2) Contribution of indexation with modulation 2.1 2.3 2.1
(3) Compensation per employee (1)+(2) 4.5 3.3 3.4
with the wage agreement signed in the public sector for 2007, 2008 and 2009
negotiated wage in the public sector 0.8 0.9 0.0
(1) Real wage 2.4 1.3 1.3
(2) Contribution of indexation with modulation 2.1 2.3 2.1
(3) Compensation per employee (1)+(2) 4.5 3.5 3.4
*BCl projections
Source : BCl

1. ECONOMIC AND FINANCIAL SITUATION
BC
L A
nn
uA
l R
Ep
oR
t 2
00
7
64
1.2.8 External trade
As for the euro area, Luxembourg’s trade in goods
grew at slower pace in 2007, after recording strong
growth rates in 2006. Luxembourg goods exports rose
4.6% reaching €11.8 billion in 2007, compared with a
growth rate of 9.6% in 2006. Goods imports grew even
less, down to 4.6% in 2007 (reaching €16.3 billion)
from 10.6% in 2006. As a result Luxembourg’s trade
deficit increased at a lower pace in 2007 (2.3% at
€4.4 billion).
CHART 28:
LuxEMBouRG TRADE IN GooDS
Source: StAtEC
2002 2003 2004 2005 2006 2007
Exports (left-hand scale)
Annual rates of change in exports (right-hand scale)
Imports (left-hand scale)
Trade balance (left-hand scale)
Annual rates of change in imports (right-hand scale)
-4 %
-2 %
0 %
2 %
4 %
6 %
8 %
10 %
12 %
14 %
-10 000
-5 000
0
5 000
10 000
15 000
20 000
Mil
lio
n
Va
ria
tio
ns
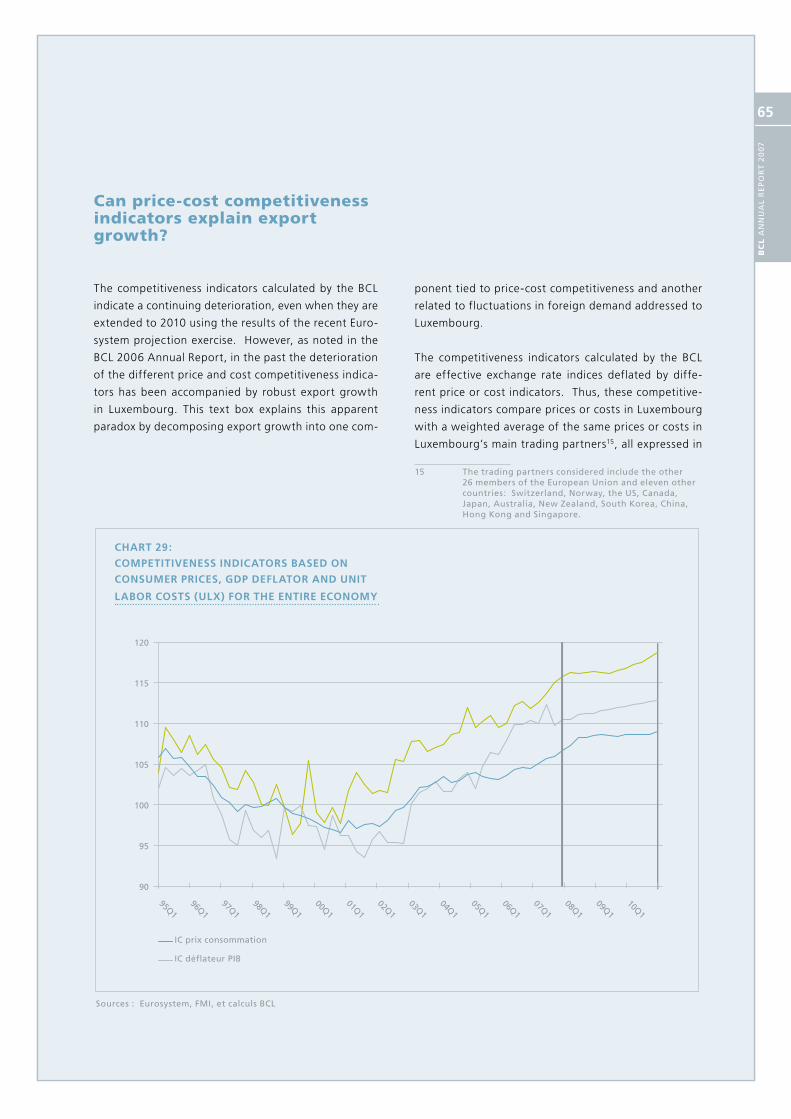
BC
L A
nn
uA
l R
Ep
oR
t 2
00
7
65
Can price-cost competitiveness indicators explain export growth?
The competitiveness indicators calculated by the BCL
indicate a continuing deterioration, even when they are
extended to 2010 using the results of the recent Euro-
system projection exercise. However, as noted in the
BCL 2006 Annual Report, in the past the deterioration
of the different price and cost competitiveness indica-
tors has been accompanied by robust export growth
in Luxembourg. This text box explains this apparent
paradox by decomposing export growth into one com-
ponent tied to price-cost competitiveness and another
related to fluctuations in foreign demand addressed to
Luxembourg.
The competitiveness indicators calculated by the BCL
are effective exchange rate indices deflated by diffe-
rent price or cost indicators. Thus, these competitive-
ness indicators compare prices or costs in Luxembourg
with a weighted average of the same prices or costs in
Luxembourg’s main trading partners15, all expressed in
15 the trading partners considered include the other 26 members of the European union and eleven other countries: Switzerland, norway, the uS, Canada, Japan, Australia, new Zealand, South Korea, China, Hong Kong and Singapore.
96Q1
IC prix consommation
IC déflateur PIB
IC CSU ensemble économie
90
95
100
105
110
115
120
95Q197Q1
98Q199Q1
00Q101Q1
02Q103Q1
04Q105Q1
06Q107Q1
08Q109Q1
10Q1
Sources : Eurosystem, FMI, et calculs BCl
CHART 29:
CoMPETITIvENESS INDICAToRS BASED oN
CoNSuMER PRICES, GDP DEFLAToR AND uNIT
LABoR CoSTS (uLx) FoR THE ENTIRE ECoNoMy
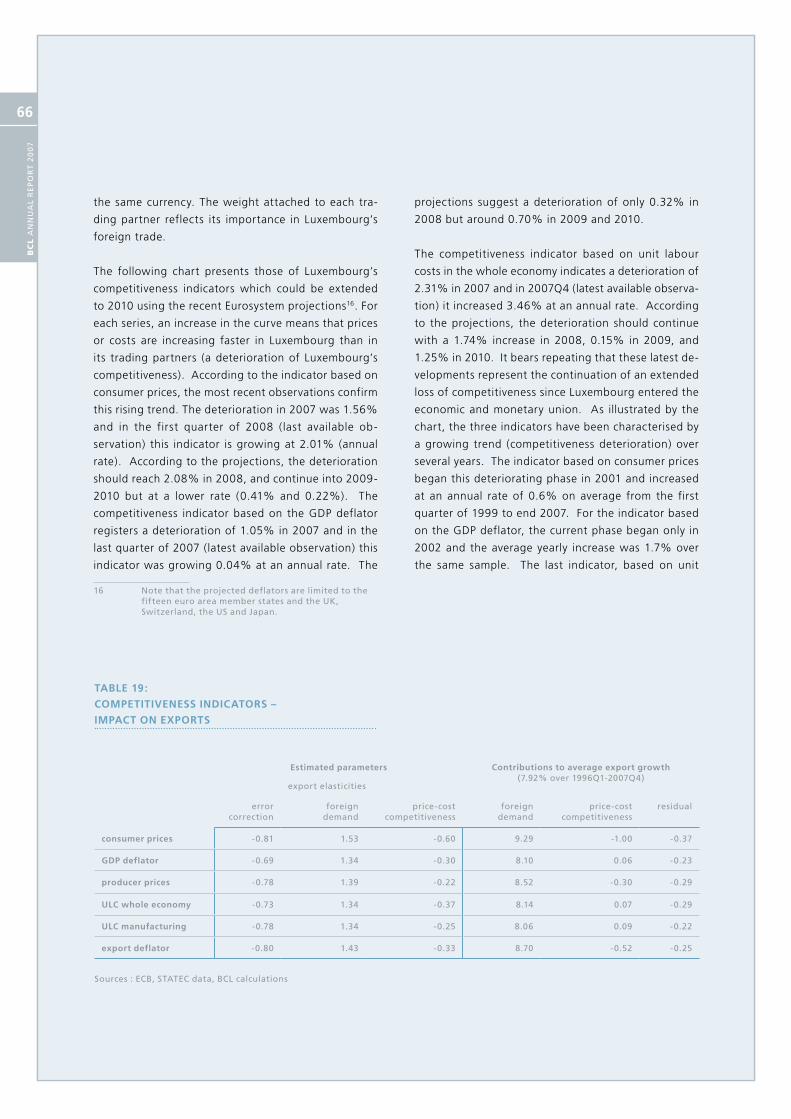
1. ECONOMIC AND FINANCIAL SITUATION
BC
L A
nn
uA
l R
Ep
oR
t 2
00
7
66
the same currency. The weight attached to each tra-
ding partner reflects its importance in Luxembourg’s
foreign trade.
The following chart presents those of Luxembourg’s
competitiveness indicators which could be extended
to 2010 using the recent Eurosystem projections16. For
each series, an increase in the curve means that prices
or costs are increasing faster in Luxembourg than in
its trading partners (a deterioration of Luxembourg’s
competitiveness). According to the indicator based on
consumer prices, the most recent observations confirm
this rising trend. The deterioration in 2007 was 1.56%
and in the first quarter of 2008 (last available ob-
servation) this indicator is growing at 2.01% (annual
rate). According to the projections, the deterioration
should reach 2.08% in 2008, and continue into 2009-
2010 but at a lower rate (0.41% and 0.22%). The
competitiveness indicator based on the GDP deflator
registers a deterioration of 1.05% in 2007 and in the
last quarter of 2007 (latest available observation) this
indicator was growing 0.04% at an annual rate. The
16 note that the projected deflators are limited to the fifteen euro area member states and the uK, Switzerland, the uS and Japan.
projections suggest a deterioration of only 0.32% in
2008 but around 0.70% in 2009 and 2010.
The competitiveness indicator based on unit labour
costs in the whole economy indicates a deterioration of
2.31% in 2007 and in 2007Q4 (latest available observa-
tion) it increased 3.46% at an annual rate. According
to the projections, the deterioration should continue
with a 1.74% increase in 2008, 0.15% in 2009, and
1.25% in 2010. It bears repeating that these latest de-
velopments represent the continuation of an extended
loss of competitiveness since Luxembourg entered the
economic and monetary union. As illustrated by the
chart, the three indicators have been characterised by
a growing trend (competitiveness deterioration) over
several years. The indicator based on consumer prices
began this deteriorating phase in 2001 and increased
at an annual rate of 0.6% on average from the first
quarter of 1999 to end 2007. For the indicator based
on the GDP deflator, the current phase began only in
2002 and the average yearly increase was 1.7% over
the same sample. The last indicator, based on unit
TABLE 19:
CoMPETITIvENESS INDICAToRS –
IMPACT oN ExPoRTS
Estimated parameters Contributions to average export growth (7.92% over 1996Q1-2007Q4)
export elasticities
error correction
foreign demand
price-cost competitiveness
foreign demand
price-cost competitiveness
residual
consumer prices -0.81 1.53 -0.60 9.29 -1.00 -0.37
GDP deflator -0.69 1.34 -0.30 8.10 0.06 -0.23
producer prices -0.78 1.39 -0.22 8.52 -0.30 -0.29
uLC whole economy -0.73 1.34 -0.37 8.14 0.07 -0.29
uLC manufacturing -0.78 1.34 -0.25 8.06 0.09 -0.22
export deflator -0.80 1.43 -0.33 8.70 -0.52 -0.25
Sources : ECB, StAtEC data, BCl calculations

BC
L A
nn
uA
l R
Ep
oR
t 2
00
7
67
labour costs in the whole economy, began its deterio-
ration in 2001 and increased at an average yearly rate
of 1.4% over 1999Q1-2007Q4.
How can one reconcile the deterioration in price-
cost competitiveness observed since 2001 with the
good performance of Luxembourg’s economy and
in particular its exports over the same period? One
must first recognise that exports not only depend on
fluctuations in relative costs and prices, but also on
growth in foreign demand addressed to Luxembourg.
The latter is measured here by a weighted average
of real imports in Luxembourg’s main trading par-
tners, with weights reflecting each country’s share
in Luxembourg’s foreign trade. This indicator has
a similar structure and geochartic coverage to the
effective exchange rate indicators presented above17.
It is then possible to estimate an export equation for
Luxembourg, linking them to this measure of foreign
demand and a measure of price-cost competitive-
ness18. The following table presents the results of
these estimations19. Each row in the table reports
an export equation estimated with a different price-
cost competitiveness indicator20. In each case, the
equation is estimated using quarterly data (seasonally
adjusted) from 1996Q1 to 2007Q4 and adopting an
error-correction specification. The first column reports
the speed of adjustment towards the long-term equili-
brium. This equilibrium is characterised by the export
elasticities in the following two columns21.
Comparing the different rows, one can observe that
results are quite similar for all the price-cost com-
petitiveness indicators considered. In every case, the
error-correction term is included between zero and -1,
as required for the stability of the equation. Adjust-
17 Real imports in luxembourg’s trading partners are expressed in a common currency and with the same base year.18 Goldstein and Khan (1985) “Income and price Effects in Foreign trade” Handbook of International Economics, Elsevier.19 these results are based on combined exports of goods and services. Similar results are obtained when the exercise is repeated separately for goods exports and for services exports.20 Ca’Zorzi and Schnatz (2007) “Explaining and forecasting euro area exports: which competitiveness indicator performs best?” ECB Working paper 833.21 All coefficients are statistically different from zero. the equation includes three lags of all variables in first differences (short-term dynamics) and test results are consistent with the absence of residual autocorrelation up to four lags.
ment is always fast: 69% to 81% of deviations from
the long-term equilibrium are eliminated after a single
quarter22. In the following column, one can observe
that the (long-term) export elasticities with respect to
foreign demand are always positive, consistent with
economic theory. However, they are always statistically
above unity, which is problematic from the perspec-
tive of theory. In fact, Luxembourg’s exports cannot
systematically increase faster than foreign demand.
Nevertheless, this result is consistent with experience
since 1996 and imposing a unit elasticity could in-
troduce mis-specification error, generating a bias in
the estimates of the other parameters23. Elasticities
above unity are often found for other countries and
it is generally recommended to tolerate them24. In the
third column, export elasticities with respect to the
different measures of price-cost competitiveness are
always negative, as expected, but also relatively weak
(from -0.22 to -0.60). This means that a 5% deterio-
ration of competitiveness implies a fall of exports of
only 1.1% to 3%. This weakness of export elasticities
with respect to price-cost competitiveness is a result
that has already been found for other continental Eu-
ropean economies25. In summary, Luxembourg’s loss of
price-cost competitiveness had an impact on exports
that was negative and statistically significant, but its
economic significance was limited.
The right-hand panel of the table uses the estima-
ted equations to decompose Luxembourg’s average
export growth over the period 1996Q1-2007Q4. The
equations are simulated under two different scenarios.
In the first, price-cost competitiveness (represented
by the different indicators in each row) is kept at its
level in 1995Q4 until 2007Q1. In the second scenario,
it is foreign demand that is kept at its level of 1995Q1.
The results of this exercise indicate that (for all pri-
ce-cost competitiveness indicators considered) fo-
reign demand has been crucial in determining export
22 For each price-cost competitiveness indicator, the existence of a cointegration relationship is confirmed by the rejection of the hypothesis that this coefficient is zero.23 In addition, for each of the estimated equations the Wald test rejects a unit elasticity.24 Krugman (1989) «Differences in Income Elasticities and trends in Real Exchange Rates,» European Economic Review, 33, 1031-1054.25 Hooper, Johnson and Marquez (2000) “trade Elasticities for the G-7 Countries,” princeton Studies in International Economics, no. 87.

1. ECONOMIC AND FINANCIAL SITUATION
BC
L A
nn
uA
l R
Ep
oR
t 2
00
7
68
growth, representing an average yearly contribution
of 8.06% to 9.29%. On the other hand, the average
yearly contribution of price-cost competitiveness has
been negative or close to zero (although it may have
been important for individual quarters). In fact, the
average contribution of price-cost competitiveness
has been comparable (or even below) the residual
contribution (export growth that is not explained by
the estimated equations), which is reported in the
last column.
In conclusion, the deterioration of price-cost compe-
titiveness has marginally reduced Luxembourg’s ex-
ports over the period 1996Q1-2007Q4. However, in a
context or strong growth in foreign demand addressed
to Luxembourg, this competitiveness effect was mi-
nor. High estimated export elasticities with respect
to foreign demand may suggest that exporting firms
benefit from other competitiveness factors (quality,
specialisation) which have offset the negative effects
of the deterioration in price-cost competitiveness.
From a wider perspective, one should take note of the
fact that the world economy has just experienced a
phase of exceptionally strong growth in international
trade. This has benefited Luxembourg, minimising
the negative effects of the deterioration of its price-
cost competitiveness. However, Luxembourg remains
especially vulnerable to a slowdown, or even a fall,
in international trade. The high estimated values
for Luxembourg’s export elasticities with respect to
foreign demand suggest that the negative effects
of such a development at the global level could be
amplified in Luxembourg. Therefore, it is crucial that
Luxembourg authorities maintain their opposition to
the protectionist tendencies that are increasingly vi-
sible in the public arena.
BC
L A
nn
uA
l R
Ep
oR
t 2
00
7
69
1.2.9 Balance of payments
In 2007 the Luxembourg current account surplus remai-
ned unchanged at €3.6 billion. This stability reflected
strong divergent developments in the four components
of the current account. The strong increase in the ser-
vices surplus (17.8%) was offset by growing deficits on
current transfers and factor incomes. The improvement
in net services receipts was mostly driven by favourable
developments in the financial sector. However, in the
wake of the financial turmoil, the surplus on financial
services grew at slower pace in 2007 (20%), after re-
cording a strong increase (34%) in 2006.
The goods balance was positively affected by sales of
fuel to non-residents and by net sales of non-mone-
tary gold. In the income balance, dividends payments
abroad and compensations of cross-border employees
turned the overall balance into a huge deficit in 2007
while the rising deficit in current transfers was mainly
driven by the redistribution of monetary income within
the Eurosystem.
In the financial account, Luxembourg registered net
outflows of €3.5 billion in 2007. This development
reflected net inflows in portfolio investments which
were largely offset by net outflows in foreign direct
investments and in other investments.
1. ECONOMIC AND FINANCIAL SITUATION
BC
L A
nn
uA
l R
Ep
oR
t 2
00
7
70
BCL monetary operations within Luxembourg’s balance of payments and international investment position
This text box focuses on BCL operations as a monetary
authority within Luxembourg’s Balance of Payments26
(BOP) and International Investment Position27 ( IIP). The
role of a central bank requires special treatment; in par-
ticular transactions are categorised to identify how a
monetary authority could potentially finance an current
account imbalance. In other words, the balance of tran-
sactions of the sector “resident monetary authorities”
is the direct counterpart of the balance of transactions
of the sector “non-monetary residents”.
26 the balance of payments (Bop) is a statistical statement that summarises transactions between residents and non-residents during a given period. It comprises the current account, the capital account, and the financial account.27 the international investment position (IIp) is a financial statement setting out the value and composition of a country’s external financial assets and liabilities. the IIp is established on a quarterly basis.
In order to fulfil its statistical obligations, the BCL
records all its operations under a regular statistical
BOP reporting. Thus, the BCL transmits BOP and IIP
statistics to the European Central Bank to allow it to
establish the BOP and IIP of the EMU and thus detect
a potential disequilibrium on the external balance.
This framework includes transactions executed within
the field of monetary policy, operations with the ECB
and other supranational organisations (i.e. the Inter-
national Monetary Fund ( IMF)) as well as operations
related to daily management. The above-mentioned
transactions are primarily related to reserve assets,
portfolio investment and other investments of the BCL.
Finally, the nomenclature employed is defined by the
IMF’s balance of payments manual (BPM5).
BC
L A
nn
uA
l R
Ep
oR
t 2
00
7
71
1. Reserve Assets
Reserve assets are an important component of BOP
statistics and an essential element in the analysis of an
economy’s external position. Reserve assets consist of
those external assets that are readily available to and
controlled by a monetary authority for direct financing
of payments imbalances, for indirectly regulating the
magnitude of such imbalances through intervention in
exchange markets to affect the currency exchange rate,
and/or for other purposes. Reserve assets comprise
monetary gold, special drawing rights, the reserve
position in the IMF, foreign exchange assets (consisting
of currency and deposits and securities), and other
claims. Securities that do not satisfy the requirements
of reserve assets are included in direct investment or
portfolio investment.
Reserve assets held by the BCL comprise the following
categories:
a. Monetary gold
Monetary gold is gold owned by the BCL and held as
a reserve asset. Other gold (i.e. non-monetary gold,
possibly including commercial stocks held for trading
purposes…) is treated as any other commodity. Transac-
tions in monetary gold occur only between monetary
authorities and their counterparts in other economies
or between monetary authorities and international
monetary organisations.
b. Special Drawing Rights (SDRs)
SDRs are international reserve assets created by the IMF
(in 1970) to supplement other reserve assets that are
periodically allocated to IMF members in proportion
to their respective quotas. SDRs are not considered
liabilities of the Fund, and IMF members to whom SDRs
are allocated do not incur actual liabilities to repay SDR
allocations.
c. Reserve position within the IMF
An IMF member may have a position that is recorded
under the category “reserve assets”. This is referred to
as the member’s reserve position in the Fund. A mem-
bers’ reserve position is the sum of the reserve tranche
purchases it may draw upon and any indebtedness of
the Fund that is readily repayable to the member.
d. Foreign exchange
Foreign exchange includes monetary authorities’ claims
on non-residents in the forms of currency bank depo-
sits, government securities, other bonds and notes,
money market instruments, financial derivatives, equity
securities, and non-marketable claims arising from ar-
rangements between central banks or governments.
The BCL compiles data on reserve assets since 1999,
but data on BOP and IIP is only available since 2002.
The sharp increase beginning of 2008 is due to an
investment of foreign currency outside the Eurozone.
According to the IMF’s methodology, these investments
have to be included in reserve assets.
2. Portfolio Investment
Portfolio Investment targets the management of BCL
assets. The core objective of these investments is to
generate a regular income. The main components of
this portfolio are equities, bonds (majority) as well as
money market instruments.
3. Operations with the European Central Bank (ECB) /
Other investments
Operations with the ECB and operations relative to
financial derivatives are part of other investments.
Operations with the ECB and transactions within the
ESCB comprise:
a. Revenues generated by monetary operations
As of 2003, the amount of monetary revenue of each
national central bank in the Eurosystem is defined via
the amount of revenue generated by a basket of certain
assets. This basis comprises:
Banknotes; −
Liabilities (linked to monetary policy operations) −
denominated in EUR towards credit institutions of
the eurozone.
Intra-Eurosystem liabilities (i.e. liabilities towards −
the ECB)
b. Profit allocation of the ECB
The ECB’s profit is distributed to the national central
banks. National central banks are also responsible for
possible ECB losses.

1. ECONOMIC AND FINANCIAL SITUATION
BC
L A
nn
uA
l R
Ep
oR
t 2
00
7
72
Source : BCl
CHART 31:
EvoLuTIoN oF CoMPoNENTS oF
RESERvE ASSETS (IN EuR MILLIoNS)
1999/01
2000/01
2001/01
2002/01
2003/01
2004/01
2005/01
2006/01
2007/01
2008/01
Total
Reserve Position within the Fund
Monetary gold
Foreign exhange
SDRs
-100
0
100
200
300
400
500
1999/01
2000/01
2001/01
2002/01
2003/01
2004/01
2005/01
2006/01
2007/01
2008/01
Total
Reserve Position within the Fund
Monetary gold
Foreign exhange
SDRs
-100
0
100
200
300
400
500
Source : BCl
CHART 30:
EvoLuTIoN1 oF RESERvE ASSETS2
( IN EuR MILLIoNS)
1 All charts are based on quarterly data2 2007 figures are subject to revisions

BC
L A
nn
uA
l R
Ep
oR
t 2
00
7
73
c. Income from banknotes and Target
(payment system)
d. Income from fines enforced by the ECB
e. Income from reserve asset pooling
f. Income from collateral exchange
Monetary policy operations as well as the balance
resulting from Target operations account for most of
these amounts. The increase of end-2007 reflects the
higher refinancing needs of Luxembourg’s credit ins-
titutions. These refinancing operations were executed
through the Target system. In addition, in December
2007, commercial banks participated in USD operations
offered by the Eurosystem in response to the financial
market turbulence.
The recent increase in the deficit on current transfers
mainly reflects the reallocation of monetary income
within the Eurosystem.
Inside the Eurosystem, income from seigniorage is
transferred to the ECB before being attributed to na-
tional central banks. In this particular case, the BCL had
to transfer funds to the Eurosystem because it issues a
large volume of banknotes.
Finally, the following table identifies the operations
described above within the BCL balance sheet.
Source: BCl
CHART 32:
EvoLuTIoN oF PoRTFoLIo INvESTMENTS –
ASSETS – ToTAL SToCK (IN EuR MILLIoNS)

1. ECONOMIC AND FINANCIAL SITUATION
BC
L A
nn
uA
l R
Ep
oR
t 2
00
7
74
CHART 33:
EvoLuTIoN oF oPERATIoNS BETwEEN THE
BCL AND THE ECB – ASSETS – ToTAL SToCK
(IN EuR MILLIoNS)
Source : BCl
Source : BCl
CHART 34:
IMPACT oF BCL oPERATIoNS oN THE BALANCE
oF CuRRENT TRANSFERS (IN EuR MILLIoNS)
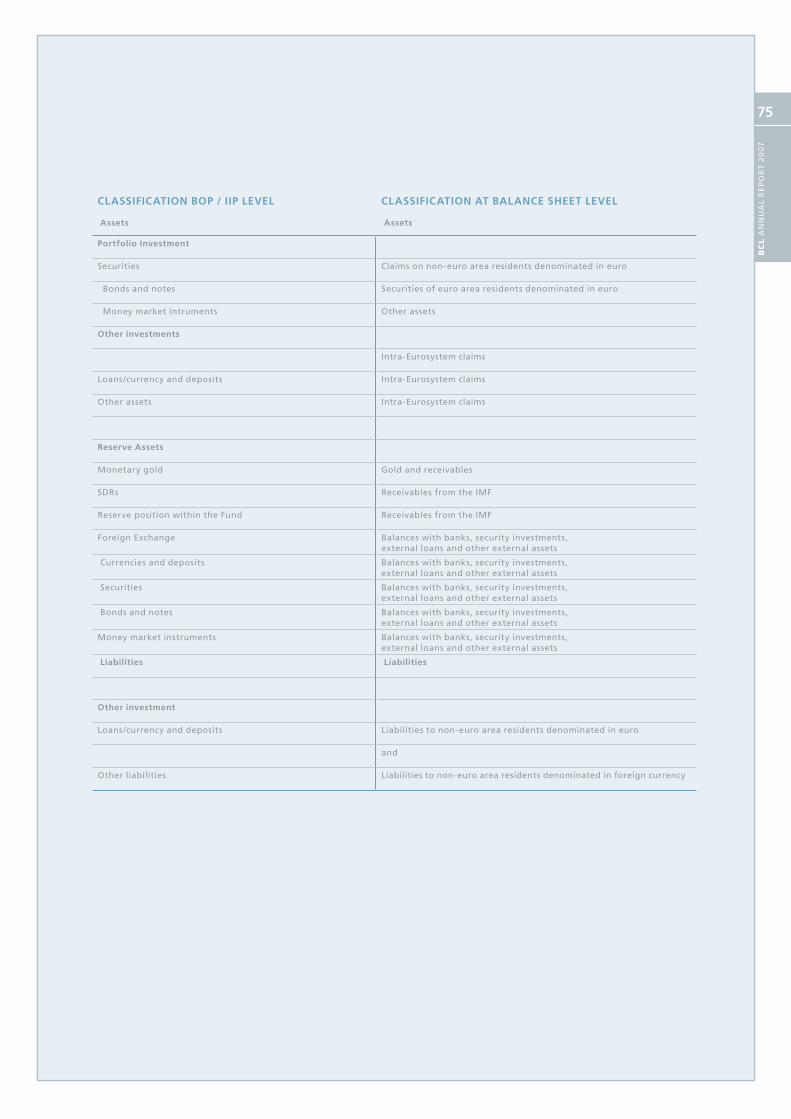
BC
L A
nn
uA
l R
Ep
oR
t 2
00
7
75
CLASSIFICATIoN BoP / IIP LEvEL CLASSIFICATIoN AT BALANCE SHEET LEvEL
Assets Assets
Portfolio Investment
Securities Claims on non-euro area residents denominated in euro
Bonds and notes Securities of euro area residents denominated in euro
Money market intruments other assets
other investments
Intra-Eurosystem claims
loans/currency and deposits Intra-Eurosystem claims
other assets Intra-Eurosystem claims
Reserve Assets
Monetary gold Gold and receivables
SDRs Receivables from the IMF
Reserve position within the Fund Receivables from the IMF
Foreign Exchange Balances with banks, security investments, external loans and other external assets
Currencies and deposits Balances with banks, security investments, external loans and other external assets
Securities Balances with banks, security investments, external loans and other external assets
Bonds and notes Balances with banks, security investments, external loans and other external assets
Money market instruments Balances with banks, security investments, external loans and other external assets
Liabilities Liabilities
other investment
loans/currency and deposits liabilities to non-euro area residents denominated in euro
and
other liabilities liabilities to non-euro area residents denominated in foreign currency

1. ECONOMIC AND FINANCIAL SITUATION
BC
L A
nn
uA
l R
Ep
oR
t 2
00
7
76
1.2.10 Macroeconomic projections
Since the finalisation of the previous projection exercise,
Luxembourg’s economy has fared slightly worse than
expected. Real GDP growth in 2007 is currently estimated
at 4.5%, at the lower end of our December projections.
Furthermore, the quarterly growth profile has been ad-
justed downwards. A negative growth rate has been
recorded for the third quarter, though it was followed
by considerable rebound thereafter. Towards the end of
2007, the carry-over effect on annual real GDP growth
in 2008 is estimated at 1.5%.
The business cycle probably peaked towards the turn of
the year 2005/2006. While growth initially decelerated
only gradually and remained at a high level, in the course
of 2007 the slowdown grew sharper. According to our
baseline scenario, the trough was probably reached in
the first quarter of 2008, with a renewed decline in
the level of activity, and a further substantial drop in
annual growth rates. In that period, the financial turmoil
resulted in a 10% drop of major stock-market indices,
leading to a 7% decline of the net asset value of listed
mutual funds, the first negative growth rate since the
beginning of 2003. As a result, banks’ income from
trading fees also recorded a drop, both on a quarterly
and on an annual basis. In the second quarter of 2008,
as market sentiment gradually convinced itself that the
worst of the financial crisis was over in the USA, equity
markets turned the corner, which bodes well for activity
in the banking sector and real GDP growth.
Overall, the short-term growth profile in Luxembourg
was probably different from the euro area, and in parti-
cular from Germany, our main export market. However,
this is hardly a surprise, given that Luxembourg’s main
sector of production, financial services, was at the
centre of the turmoil.
Monthly indicators in manufacturing also suggest the
downward phase of the business cycle. Although manu-
facturers have dampened their optimism, their sentiment
falls short of outright pessimism. The confidence indica-
tor remains above the medium-term value suggesting a
more sustained drop in activity is not in the offing.
Overall, compared to the previous exercise, the outlook
for the international environment has been significantly
adjusted downwards, both for 2008 and 2009. Growth
slowed already in 2007, but international organisations
now agree that the slowdown might reach at least until
2009. However, annual average growth rates are rather
slow in identifying turning points. The quarterly pro-
jection profile suggests that the upturn could emerge
as early as the second half of 2008.
The international scenario embodies generally very
weak growth, if any, in the USA as the economy digests
the downturn in the housing market. Faced with this
weakness, other economies should also be affected,
though a prolonged period of weak global growth is
unlikely. US weakness should be partially compensated
by dynamism in South-east Asia and the resilience of
the euro area economy.
The euro area was characterised by a period of strong
growth that extended well into the first quarter of
2008. In light of the international scenario, it could
have also slowed down in the second quarter of 2008
before converging gradually back to trend growth.
According to the recent Eurosystem projections, eco-
nomic growth is expected to range between 1.5% and
2.1% in 2008 and between 1.0% and 2.0% in 2009,
slightly lower than previously assumed.
Growth in Luxembourg’s export markets declined shar-
ply in 2007 after being particularly dynamic in 2006.
The deceleration could continue in 2008 before a pro-
jected gradual recovery to trend growth. As for the in-
ternational assumptions, this scenario has been revised
downwards compared to the previous exercise.
On the basis of this analysis and especially in the euro
area context, economic activity in Luxembourg is set
to decelerate further in 2008. Thus the scenario re-
mains unchanged compared to previous projections.
However, the speed of the slowdown has increased
in the context of the financial turmoil and its projec-
ted repercussions on the performance of the banking
sector. Real GDP growth is now expected in a range
between 2.9% and 3.5%, thus below trend growth.
On the basis of the international scenario, and taking
into account the different short-term growth profile,
economic growth could rebound in 2009. These pro-
jections are based on the assumptions of faster growth
in private and public consumption spending, which
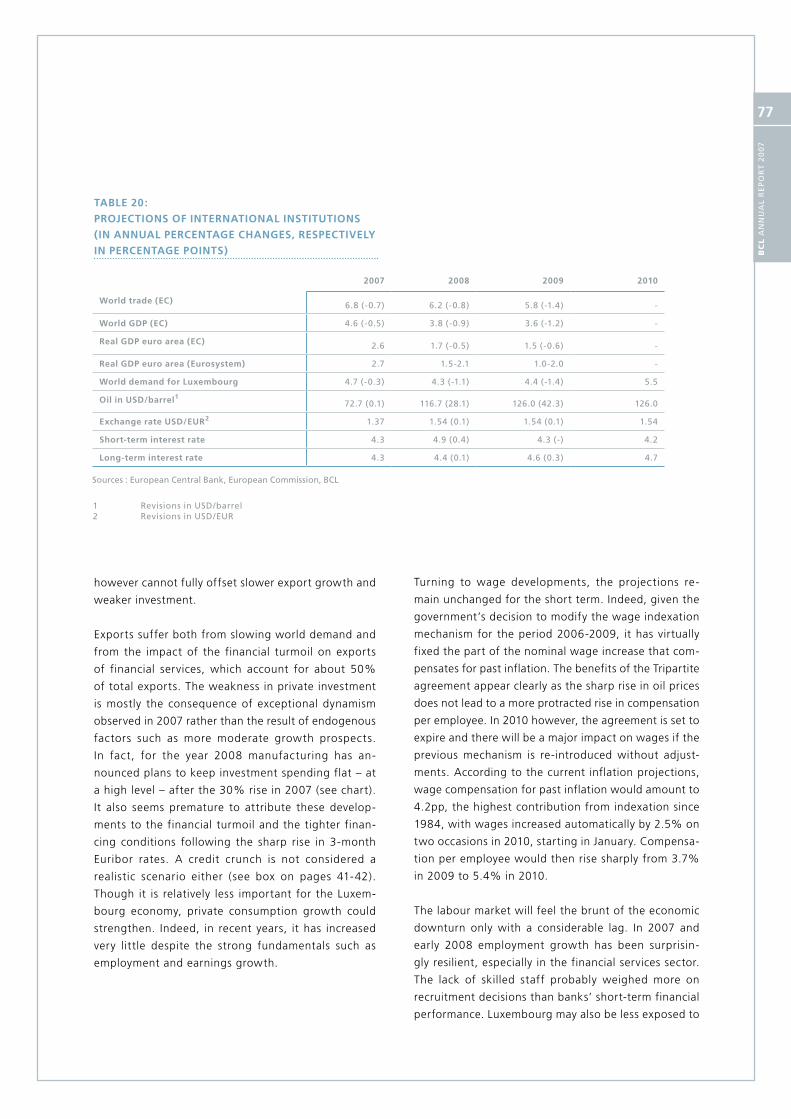
BC
L A
nn
uA
l R
Ep
oR
t 2
00
7
77
Turning to wage developments, the projections re-
main unchanged for the short term. Indeed, given the
government’s decision to modify the wage indexation
mechanism for the period 2006-2009, it has virtually
fixed the part of the nominal wage increase that com-
pensates for past inflation. The benefits of the Tripartite
agreement appear clearly as the sharp rise in oil prices
does not lead to a more protracted rise in compensation
per employee. In 2010 however, the agreement is set to
expire and there will be a major impact on wages if the
previous mechanism is re-introduced without adjust-
ments. According to the current inflation projections,
wage compensation for past inflation would amount to
4.2pp, the highest contribution from indexation since
1984, with wages increased automatically by 2.5% on
two occasions in 2010, starting in January. Compensa-
tion per employee would then rise sharply from 3.7%
in 2009 to 5.4% in 2010.
The labour market will feel the brunt of the economic
downturn only with a considerable lag. In 2007 and
early 2008 employment growth has been surprisin-
gly resilient, especially in the financial services sector.
The lack of skilled staff probably weighed more on
recruitment decisions than banks’ short-term financial
performance. Luxembourg may also be less exposed to
however cannot fully offset slower export growth and
weaker investment.
Exports suffer both from slowing world demand and
from the impact of the financial turmoil on exports
of financial services, which account for about 50%
of total exports. The weakness in private investment
is mostly the consequence of exceptional dynamism
observed in 2007 rather than the result of endogenous
factors such as more moderate growth prospects.
In fact, for the year 2008 manufacturing has an-
nounced plans to keep investment spending flat – at
a high level – after the 30% rise in 2007 (see chart).
It also seems premature to attribute these develop-
ments to the financial turmoil and the tighter finan-
cing conditions following the sharp rise in 3-month
Euribor rates. A credit crunch is not considered a
realistic scenario either (see box on pages 41-42).
Though it is relatively less important for the Luxem-
bourg economy, private consumption growth could
strengthen. Indeed, in recent years, it has increased
very little despite the strong fundamentals such as
employment and earnings growth.
TABLE 20:
PRojECTIoNS oF INTERNATIoNAL INSTITuTIoNS
(IN ANNuAL PERCENTAGE CHANGES, RESPECTIvELy
IN PERCENTAGE PoINTS)
2007 2008 2009 2010
world trade (EC) 6.8 (-0.7) 6.2 (-0.8) 5.8 (-1.4) -
world GDP (EC) 4.6 (-0.5) 3.8 (-0.9) 3.6 (-1.2) -
Real GDP euro area (EC) 2.6 1.7 (-0.5) 1.5 (-0.6) -
Real GDP euro area (Eurosystem) 2.7 1.5-2.1 1.0-2.0 -
world demand for Luxembourg 4.7 (-0.3) 4.3 (-1.1) 4.4 (-1.4) 5.5
oil in uSD/barrel1 72.7 (0.1) 116.7 (28.1) 126.0 (42.3) 126.0
Exchange rate uSD/EuR2 1.37 1.54 (0.1) 1.54 (0.1) 1.54
Short-term interest rate 4.3 4.9 (0.4) 4.3 (-) 4.2
Long-term interest rate 4.3 4.4 (0.1) 4.6 (0.3) 4.7
Sources : European Central Bank, European Commission, BCl
1 Revisions in uSD/barrel2 Revisions in uSD/EuR
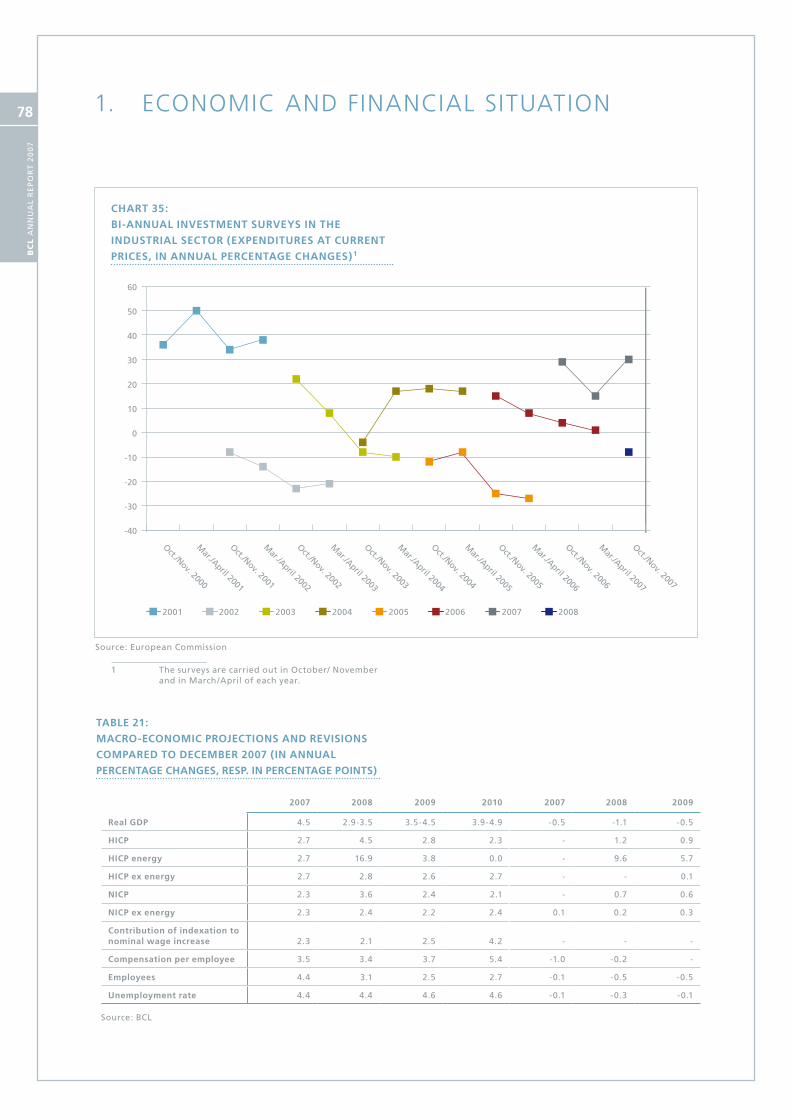
1. ECONOMIC AND FINANCIAL SITUATION
BC
L A
nn
uA
l R
Ep
oR
t 2
00
7
78
Source: European Commission
CHART 35:
BI-ANNuAL INvESTMENT SuRvEyS IN THE
INDuSTRIAL SECToR (ExPENDITuRES AT CuRRENT
PRICES, IN ANNuAL PERCENTAGE CHANGES)1
1 the surveys are carried out in october/ november and in March/April of each year.
2001 2005
Oct./Nov. 2000
Mar./April 2001
Oct./Nov. 2001
Mar./April 2002
Oct./Nov. 2002
Mar./April 2003
Oct./Nov. 2003
Mar./April 2004
Oct./Nov. 2004
Mar./April 2005
Oct./Nov. 2005
Mar./April 2006
Oct./Nov. 2006
Mar./April 2007
Oct./Nov. 2007
-40
-30
-20
-10
0
10
20
30
40
50
60
2002 2006 2003 2007 2004 2008
TABLE 21:
MACRo-ECoNoMIC PRojECTIoNS AND REvISIoNS
CoMPARED To DECEMBER 2007 (IN ANNuAL
PERCENTAGE CHANGES, RESP. IN PERCENTAGE PoINTS)
2007 2008 2009 2010 2007 2008 2009
Real GDP 4.5 2.9-3.5 3.5-4.5 3.9-4.9 -0.5 -1.1 -0.5
HICP 2.7 4.5 2.8 2.3 - 1.2 0.9
HICP energy 2.7 16.9 3.8 0.0 - 9.6 5.7
HICP ex energy 2.7 2.8 2.6 2.7 - - 0.1
NICP 2.3 3.6 2.4 2.1 - 0.7 0.6
NICP ex energy 2.3 2.4 2.2 2.4 0.1 0.2 0.3
Contribution of indexation to nominal wage increase 2.3 2.1 2.5 4.2 - - -
Compensation per employee 3.5 3.4 3.7 5.4 -1.0 -0.2 -
Employees 4.4 3.1 2.5 2.7 -0.1 -0.5 -0.5
unemployment rate 4.4 4.4 4.6 4.6 -0.1 -0.3 -0.1
Source: BCl
BC
L A
nn
uA
l R
Ep
oR
t 2
00
7
79
the sub-prime crisis than other major financial services
centres because of its concentration on mutual funds.
Nevertheless, we expect employment growth to drop
below 3%, which would be insufficient to generate a
further decline in the unemployment rate. The rebound
of the labour market is likely to be shallow, in line with
the projected upturn for economic growth.
The favourable inflation dynamics observed in 2007
have come to an end, and headline inflation is set to ac-
celerate sharply in 2008 to levels not seen since 1993.
These developments stem largely from a high contribu-
tion from the energy component in the context of the
surge in the oil price to above 120 USD/barrel. In spite
of the economic slowdown, the effect is likely to be
exacerbated by an acceleration of inflation excluding
energy. This would be driven mostly by high services in-
flation and the rise in food prices. In the medium term,
a decline of inflation is feasible. However, although the
projections are conditional on a stabilisation of the oil
price, a drop of NICP inflation below 2% is unlikely.
The sharp rise in wages in 2010 following the return
to automatic wage indexation should lead to higher
services inflation, and therefore also to higher inflation
in the NICP and the HICP excluding energy.
Risks analysis
The BCL business cycle indicator is calculated using
monthly data as available on 4 June 2008. The dataset
used includes around 100 economic and financial time
series. Among them 14 were available until May 2008,
nine until April 2008 and 48 until March 2008 to date
(4 June 2008).
Based on this monthly information, the provisional
results for the indicator suggest that economic growth
in Luxembourg remained sustained during the first se-
mester 2008, despite the global slowdown. Therefore,
the indicator favours the upper part of the range of
BCL growth projections.
1.2.11 Public finances
1.2.11.1 Budgetary policy overview
2007 was marked by three fiscal policy milestones.
First, the implementation of the budgetary consolida-
tion measures agreed in 2006 by the Comité de Coor-
dination Tripartite. The main measures were an increase
of fiscal and para-fiscal pressure, the suspension of the
indexation of family allowances, and the rescheduling
of pensions’ indexation to real wages. In addition, a
public sector wage freeze was announced as well as
closer monitoring of investment expenditure. Second,
the ninth update of the Stability Programme, published
in October 2007, confirmed the more cautious budge-
tary course. Even though the general government ba-
lance registered a surplus, public expenditure increase
was to remain moderate compared to previous years.
Third, a very favourable macroeconomic environment,
especially in the financial sector, allowed general go-
vernment to accumulate significant revenues, resulting
in a surplus of 3% of GDP.
The general government budget adopted by the Cham-
ber of Deputies in December 2007 marked a clear de-
celeration of expenditure growth compared to the last
few years (5.3% in 2008). Revenues should grow faster
than expenditures, allowing the central government
deficit to fall significantly from €188 million in 2007 to
€20.5 million the year after (see table below).
However, these figures should be interpreted with
caution, as they incorporate allocations to extra-bud-
getary funds instead of their actual expenditures.
In addition, the final 2007 budget is an inappropriate
basis for comparison, as in Luxembourg budgetary
executions diverge clearly from the final budget. After
correcting for these two inconsistencies, total central
government expenditure should increase by 11.1% in
the period 2006-2008 (or 5.5% per year on average),
reflecting significant growth in planned expenditures
by the extra-budgetary funds and by some public
institutions. On the other hand, central government
revenues should increase by only 6.3% over the pe-
riod 2006-200828.
28 For more details about the consolidation please see BCl Bulletin 2007/02.

1. ECONOMIC AND FINANCIAL SITUATION
BC
L A
nn
uA
l R
Ep
oR
t 2
00
7
80
1.2.11.2 General government revenue
After a significant fall in 2006, the revenue-to-GDP
ratio rose in 2007. Revenues moved from 40.1% of
GDP in 2006 to 41.1% the following year. Despite this
increase, the revenue ratio remains low compared to
the last decade, reflecting exceptionally high nominal
GDP growth. According to the national accounts pu-
blished in May 2008, nominal GDP increased about 7%
in 2007, after 13% in 2006. In nominal terms, total
general government revenue increased by 9.5% in
2007, which is significantly above the trend observed
at the beginning of the century.
During 2007 the significant increase in total revenue
benefited from exceptional growth in direct tax re-
venues (18% on an annual basis), mainly reflecting
buoyant corporate taxes. Indirect tax receipts and social
contributions followed the same trend in nominal terms,
although at lower levels: 6.2% and 9.5% respectively.
These positive effects reflected very favourable macroe-
conomic developments, an excellent financial sector
performance, and strong employment growth.
Total general government revenue is expected to de-
crease in 2008 and 2009, before stabilising in 2010. This
profile is dictated by the general economic slowdown
following the sub-prime crisis. In addition, the introduc-
tion of the statut unique in 2009 could induce additional
downward effects on social security revenues. Employ-
ment growth is also projected to slow.
It is important to mention that the projections are sub-
ject to a high degree of uncertainty. They basically set
the high level of observed revenues in 2007 in a highly
uncertain macroeconomic and financial context. Risk
factors include the real effects of the financial market
turmoil, higher inflation, and downward revision of
world GDP growth. In addition, the additional revenues
collected in the last three years, may be less persistent
than assumed in the projections.
1.2.11.3 General government expenditure
The expenditure-to-GDP ratio declined sharply in 2007
for a second consecutive year. It reached 38.2% of
nominal GDP compared to 38.8% in 2006. Although
expenditure growth increased only slightly in 2007 – at
5% it is low compared to average growth in the last five
years – it is still higher than in neighbouring countries.
Total expenditure in nominal terms should increase by
9.9% in 2008, mainly boosted by the introduction of a
new tax credit for children. Expenditure growth should
stabilize around 6.7% on average over 2009-2010. Conti-
nuing consolidation of expenditure is required in order to
diminish the uncertainties related to future revenues.
Furthermore, lower expenditure growth in 2007 is
in part due to a fall in social transfers, including the
suspension of indexation of family allowances and the
modulation of pension indexation to real wages.
TABLE 22:
KEy FIGuRES IN THE 2008 CENTRAL GovERNMENT BuDGET
(EuR MILLIoNS, uNLESS oTHERwISE INDICATED)
Final 2007 2008 BudgetIncrease in
nominal terms
Revenue 7 841.7 8 438.0 7.6%
Current revenue 7 761.0 8 355.4 7.7%
Capital revenue 80.7 82.6 2.4%
Expenditure 8 029.5 8 458.5 5.3%
Current expenditure 7 239.6 7 631.3 5.4%
Capital expenditure 789.9 827.2 4.7%
Balance -187.8 -20.5 --
of which current balance 521.4 724.1 --
of which capital balance -709.2 -744.6 --
Source: 2007 and 2008 budget law.

BC
L A
nn
uA
l R
Ep
oR
t 2
00
7
81
TABLE 23:
GENERAL GovERNMENT REvENuE
(AS A PERCENTAGE oF GDP, uNLESS
oTHERwISE INDICATED)
official data May 2008 BCL projections june 2008
2002 2003 2004 2005 2006 2007 2008 2009 2010
Direct taxes 15.3 14.7 13.0 13.7 13.0 13.5 13.5 13.6 13.9
payable by households 7.2 7.3 7.3 7.9 8.1 8.0 8.1 8.2 8.4
payable by corporations 8.0 7.4 5.7 5.8 5.0 5.5 5.4 5.4 5.5
Indirect taxes 13.0 12.6 13.5 13.4 12.8 13.0 12.7 12.4 12.1
Social contributions 11.8 11.7 11.6 11.4 10.8 11.1 11.3 10.9 10.9
other revenue 3.9 3.6 3.4 3.3 3.5 3.6 3.4 3.4 3.4
Total revenue 43.9 42.6 41.5 41.8 40.1 41.1 40.9 40.3 40.4
Nominal increase in total revenue % 4.5 4.0 4.0 10.3 8.1 9.5 4.0 5.2 7.3
Sources: IGF, IGSS, StAtEC, uCM, BCl calculations.
TABLE 24:
GENERAL GovERNMENT ExPENDITuRE
(AS A PERCENTAGE oF GDP, uNLESS
oTHERwISE INDICATED)
official data May 2008 BCL Projections june 2008
2002 2003 2004 2005 2006 2007 2008 2009 2010
Social transfers 20.3 20.9 21.1 20.7 19.4 19.0 20.1 19.9 19.9
public investments 4.9 4.6 4.3 4.5 3.6 3.8 4.0 4.0 4.0
Composition expenditure1 11.5 11.4 11.5 11.4 10.4 10.4 10.6 10.6 10.7
Subsidies2 1.7 1.7 1.7 1.7 1.6 1.6 1.6 1.6 1.6
other expenditure 3.4 3.5 4.2 3.6 3.8 3.3 3.7 3.7 3.7
Total expenditure 41.8 42.1 42.7 42.0 38.8 38.2 40.1 39.9 39.9
Nominal increase in total expenditure (%) 15.3 7.9 8.3 7.4 4.3 5.0 9.9 6.2 7.2
Sources: IGF, IGSS, StAtEC, uCM, BCl calculations
1 Compensation of employees and intermediate cosumption. 2 Disregarding capital transfers.

1. ECONOMIC AND FINANCIAL SITUATION
BC
L A
nn
uA
l R
Ep
oR
t 2
00
7
82
1.2.11.4 General government net lending or borrowing
The general government budget balance is obviously
the difference between the expenditure and revenue
ratios described above. After a period of deterioration,
2006 and 2007 have seen a return to a surplus posi-
tion. This mainly reflects a very favourable economic
environment, an excellent financial sector performance
and the implementation of the budgetary consolida-
tion measures agreed in 2006 by the Comité de Coor-
dination Tripartite.
On the other hand, the gradual consolidation process
since 2005 may come to a halt in 2008. The general
government surplus should decrease from 3% of GDP
in 2007 to 0.8% of GDP in 2008, mainly due to new
measures adopted in the 2008 budget. These include
the transformation of child allowance from tax deduc-
tion to tax credit, the partial indexation of tax brackets
to past inflation up to 6%, and the reduction of the
registration tax rate (droit d’apport) from 1% to 0.5%.
Moreover, in 2008 the central government is projected
to record a deficit once again, reaching -1.1% of GDP.
As indicated in table below, the budgetary deteriora-
tion is mainly attributable to the central government in
a broad sense, after consolidating the extra-budgetary
funds and some administrations of central government
sensu stricto.
For 2009, the general government surplus is projected
to deteriorate compared to 2008. The surplus should
decline from 0.8% to 0.4% of GDP. This deterioration is
explained on the one hand by a less favourable economic
environment, and on the other hand, by the introduction
of the Statut unique adopted by Chamber of Deputies in
April 2008, coming into effect January 1st 2008.
So far, no new significant measure for 2010 has been
announced. On this basis, the surplus should remain
positive and stable in 2010.
The Prime Minister’s speech on the state of the Nation,
delivered on May 22, 2008, to the Chamber of Deputies,
reviewed the economic, social and financial situation.
It contained no concrete and quantifiable measure for
2010 that could have a significant impact on public
finances.
Several measures were announced for 2009:
Partial indexation of tax brackets to past inflation −
up to 6%;
Transformation of the − abattement compensatoire
for wage-earners, the tax deduction for pen-
sioners, and the abattement monoparental to
corresponding tax credits;
TABLE 25:
GENERAL GovERNMENT NET LENDING (+) oR NET
BoRRowING (-) (AS A PERCENTAGE oF GDP)
Actual balance (net lending (+) or net borrowing (-))
official data May 2008 BCL Projections june 2008
2002 2003 2004 2005 2006 2007 2008 2009 2010
General government 2.1 0.5 -1.2 -0.1 1.3 3.0 0.8 0.4 0.5
of which central government -0.4 -1.2 -2.6 -1.3 -0.7 0.6 -1.1 -1.1 -0.9
of which local governments 0.1 0.0 -0.1 -0.3 0.2 0.0 -0.1 -0.1 -0.2
of which social securitiy 2.4 1.8 1.5 1.5 1.8 2.4 1.9 1.7 1.6
Stability Programme -- -- -- -- 0.7 1.0 0.8 1.0 1.2
BCL projections December 2006 -- -- -- -- 0.7 1.3 0.9 0.6 --
Cyclically adjusted balances
BCL projections june 20081 1.4 0.5 - 0.6 0.3 1.8 2.6 1.0 0.6 0.6
Stability Programme estimate october 2008 1.1 0.8 0.7 0.6 1.1
Sources: IGF, IGSS, StAtEC, uCM, BCl calculations.
1 these cyclically adjusted balances are based on a disaggregated Hodrick-prescott approach..

BC
L A
nn
uA
l R
Ep
oR
t 2
00
7
83
introduction of a tax allowance on motor vehicles −
for large families;
increase of the minimum wage; −
regular adjustment of rents and pensions; −
and introduction of “Services” transfers to fami- −
lies with children.
These measures should have an impact on the budget
balance in 2009 and 2010. Preliminary BCL estimates
(limited to the partial indexation of tax brackets) sug-
gest a possible negative effect of the order of 0.2% to
0.3% of GDP in 2009 and 2010. The official BCL pro-
jections presented above do not include this effect.
The modifications to the automatic indexation of wa-
ges agreed by the Comité de Coordination Tripartite
in 2006, should expire 1st January 2010, assuming
acceptable economic developments.
Luxembourg’s public debt ratio remains among the
lowest in the EU. In 2007 it was 6.9% of GDP, with an
increasing trend mostly driven by central government.
BCL projections anticipate a rising trend over the three
next years, with the debt ratio reaching 7.7% of GDP
in 2010. Although this remains very low compared to
other European countries, vigilance is required, as the
general pension regime could put severe strain on public
finances if no significant reform is adopted in the near
future. The BCL, along with all major international insti-
tutions, and in particular the European Commission, has
repeatedly stressed the seriousness of the problem.
The European Commission projects Luxembourg’s ge-
neral government debt through 2050 under two alter-
native scenarios.
The first scenario (scenario 2007) assumes that the struc-
tural primary balance, ignoring the ageing effect, will
maintain the level reached in 2007 over the projection pe-
riod. The second scenario (scenario Programme) assumes
that the budget objectives of the Stability Programme are
respected. In both cases, the simulations take into account
the ageing-related increase in general government expen-
diture. This has been estimated at 8.2% of GDP between
2010 and 2050. The estimated impact of ageing would
lead to a spectacular increase of the general government
debt ratio, as shown clearly in chart below. The debt ratio
is projected to reach 60% of GDP by the mid-2030s.
250
200
10
100
50
0
-50
2007 scenario
programme scenario
20052010
20152020
20252030
20352040
20452050
CHART 36:
LoNG TERM PRojECTIoNS FoR THE GovERNMENT
DEBT RATIo uNDER Two SCENARIoS
(AS A PERCENTAGE oF GDP)
Sources: European Commission (2008), An analysis of the octo-ber 2007 update of the Stability programme for luxembourg, p.36.


BC
L A
nn
uA
l R
Ep
oR
t 2
00
7
85
2. The BC L's operations
the deposit facility: the counterparties benefit from −
the possibility to make deposits with BCL at the
end of the day.
Minimum Reserves
The financial institutions of the Euro zone are subject
to a system of mandatory minimum reserves to be held
on accounts opened at their national central bank.
Those reserves aim at stabilising money market interest
rates, and at creating a structural liquidity deficit.
2.1.1 Open market operations
2.1.1.1 Main refinancing operations (MRO) in 2007
The year 2007 is divided in two halves: the first one,
which was rather stable and similar in pattern to pre-
vious years, covers the period from January until the
end of July; and a second one, much more volatile,
which covers the period from August until the end of
the year and beyond.
Chart 1 below, which shows the liquidity amounts
that were bid and allotted in the Euro zone in 2007,
illustrates well those two periods: until mid-20071
volumes allocated through main refinancing opera-
tions were rather stable. Afterwards, in order to face
the turmoil, the ECB increasingly used the longer term
refinancing operations (see below) and reduced the
volume allocated through main refinancing operations
accordingly. It should also be noted that the durations
of the MROs at the end of the year were modified in
order to take into account the public holidays. The
Eurosystem extended the penultimate operation in
order to provide the liquidities needed to span the
year-end period. As a consequence, the last operation
of the year between Christmas and New Year, was
shortened and the amounts bid and allotted were very
low as funding requirements were already met by the
previous MRO.
1 operation 20070050
2.1 Monetary policy operations
In the Grand-Duchy of Luxembourg, BCL is responsible
for conducting the monetary policy as defined by the
ECB, for the entire Euro zone.
The role of monetary policy is to steer interest rates
and to control the liquidity in the money markets. To
achieve this aim, instruments from three categories
are being used:
Open Market Operations
The refinancing operations conducted by the BCL (open
market operations), consist of funds granted by the BCL
against eligible collateral submitted by its counterpar-
ties, the financial institutions in Luxembourg.
Open market operations are split into:
Main refinancing operations (MRO),carried out −
by the Eurosystem on a regular basis. MROs are
realised through weekly tenders, with a one-
week maturity. Those operations play a leading
role in the management of banking liquidity
and in signalling the trend of monetary policy.
Longer term refinancing operations (LTRO), carried −
out by the Eurosystem on a regular basis. LTRO are
normally conducted through monthly tenders. They
mostly have a three month-maturity. Those opera-
tions aim at providing additional longer term funding
to the financial sector. They do not aim at giving si-
gnals about the orientation of the monetary policy.
Fine tuning operations, executed by the Eurosystem −
on an ad hoc basis in order to counter temporary
imbalances.
Standing Facilities
This instrument allows for the injection and withdrawal
of liquidities on a day to day basis.
There are two types of standing facilities:
the marginal lending facility: the counterparties bene- −
fit from a marginal lending facility at BCL, which they
can use in the form of a current account overdraft
(against a guarantee) until the following working day.
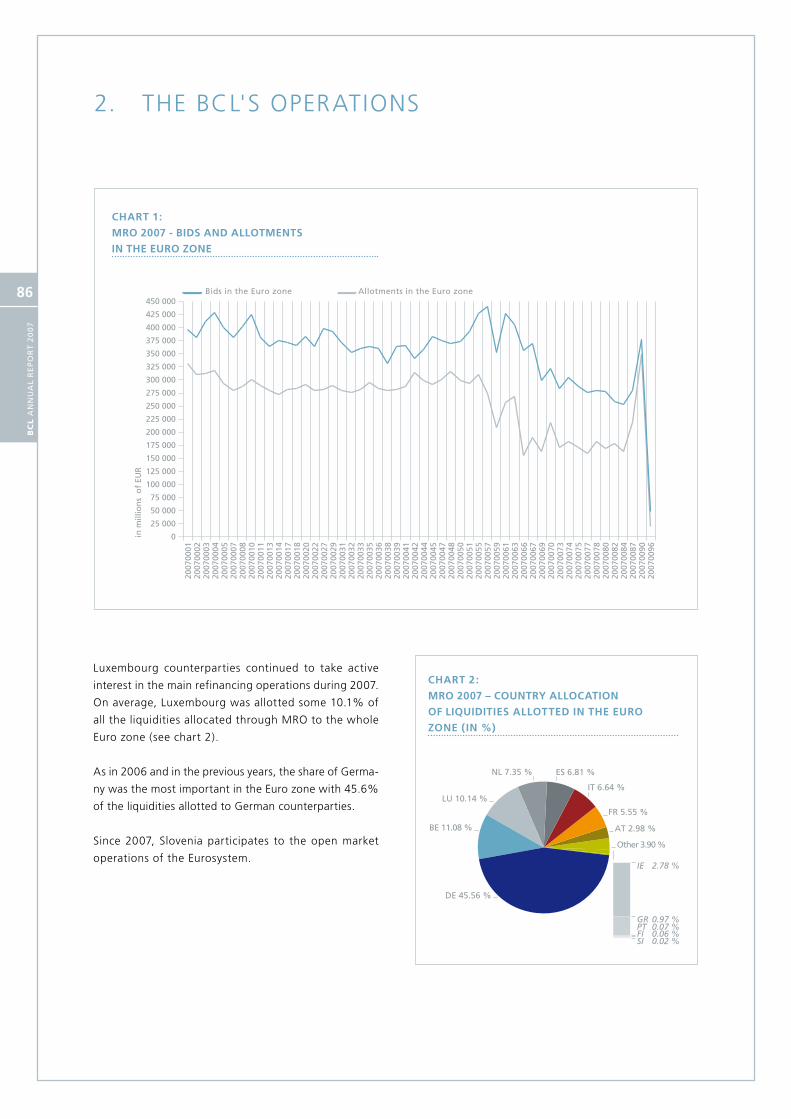
2. THE BCL'S OPERATIONS
BC
L A
nn
uA
l R
Ep
oR
t 2
00
7
86
NL 7.35 %
DE 45.56 %
BE 11.08 %
LU 10.14 %
ES 6.81 %
IT 6.64 %
IE 2.78 %
GR 0.97 %PT 0.07 %FI 0.06 %SI 0.02 %
FR 5.55 %
Other 3.90 %
AT 2.98 %
0
25 000
50 000
75 000
100 000
125 000
150 000
175 000
200 000
225 000
250 000
275 000
300 000
325 000
350 000
375 000
400 000
425 000
450 000
2007
0001
2007
0002
2007
0003
2007
0004
2007
0005
2007
0007
2007
0008
2007
0010
2007
0011
2007
0013
2007
0014
2007
0017
2007
0018
2007
0020
2007
0022
2007
0027
2007
0029
2007
0031
2007
0032
2007
0033
2007
0035
2007
0036
2007
0038
2007
0039
2007
0041
2007
0042
2007
0044
2007
0045
2007
0047
2007
0048
2007
0050
2007
0051
2007
0055
2007
0057
2007
0059
2007
0061
2007
0063
2007
0066
2007
0067
2007
0069
2007
0070
2007
0073
2007
0074
2007
0075
2007
0077
2007
0078
2007
0080
2007
0082
2007
0084
2007
0087
2007
0090
2007
0096
in m
illio
ns
of
EUR
Bids in the Euro zone Allotments in the Euro zone
CHART 2:
MRo 2007 – CouNTRy ALLoCATIoN
oF LIQuIDITIES ALLoTTED IN THE EuRo
zoNE (IN %)
Luxembourg counterparties continued to take active
interest in the main refinancing operations during 2007.
On average, Luxembourg was allotted some 10.1% of
all the liquidities allocated through MRO to the whole
Euro zone (see chart 2).
As in 2006 and in the previous years, the share of Germa-
ny was the most important in the Euro zone with 45.6%
of the liquidities allotted to German counterparties.
Since 2007, Slovenia participates to the open market
operations of the Eurosystem.
CHART 1:
MRo 2007 - BIDS AND ALLoTMENTS
IN THE EuRo zoNE
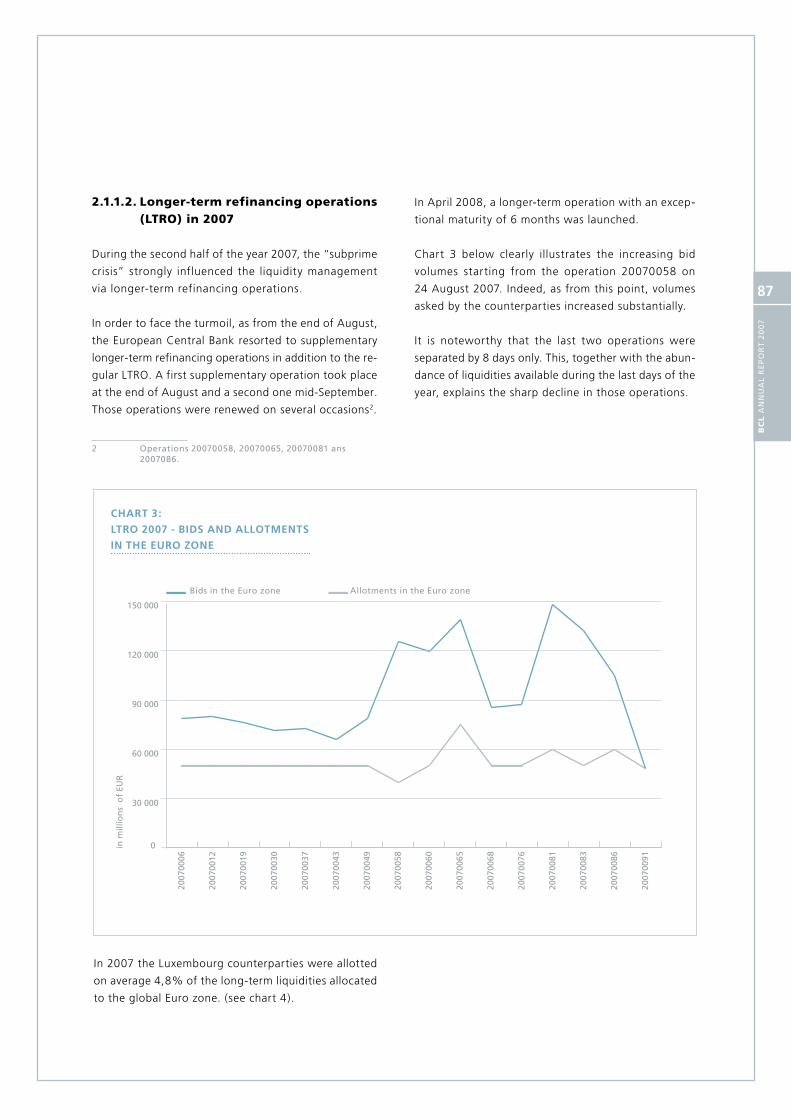
BC
L A
nn
uA
l R
Ep
oR
t 2
00
7
87
2.1.1.2. Longer-term refinancing operations (LTRO) in 2007
During the second half of the year 2007, the “subprime
crisis” strongly influenced the liquidity management
via longer-term refinancing operations.
In order to face the turmoil, as from the end of August,
the European Central Bank resorted to supplementary
longer-term refinancing operations in addition to the re-
gular LTRO. A first supplementary operation took place
at the end of August and a second one mid-September.
Those operations were renewed on several occasions2.
2 operations 20070058, 20070065, 20070081 ans 2007086.
CHART 3:
LTRo 2007 - BIDS AND ALLoTMENTS
IN THE EuRo zoNE
In 2007 the Luxembourg counterparties were allotted
on average 4,8% of the long-term liquidities allocated
to the global Euro zone. (see chart 4).
In April 2008, a longer-term operation with an excep-
tional maturity of 6 months was launched.
Chart 3 below clearly illustrates the increasing bid
volumes starting from the operation 20070058 on
24 August 2007. Indeed, as from this point, volumes
asked by the counterparties increased substantially.
It is noteworthy that the last two operations were
separated by 8 days only. This, together with the abun-
dance of liquidities available during the last days of the
year, explains the sharp decline in those operations.
30 000
60 000
90 000
120 000
150 000
0in m
illio
ns
of
EUR
Bids in the Euro zone Allotments in the Euro zone
2007
0019
2007
0012
2007
0006
2007
0030
2007
0049
2007
0043
2007
0037
2007
0058
2007
0068
2007
0065
2007
0060
2007
0076
2007
0086
2007
0083
2007
0081
2007
0091

2. THE BCL'S OPERATIONS
BC
L A
nn
uA
l R
Ep
oR
t 2
00
7
88
CHART 4:
LTRo 2007: CouNTRy ALLoCATIoN oF
THE LIQuIDITIES ALLoTTED To THE EuRo
zoNE (IN %)
CHART 5:
LTRo 2007 – AvERAGE ALLoTMENT
IN THE EuRo zoNE (2007 vS 2006)
IE 9.32 %
DE 58.48 %
FR 11.40 %
LU 4.75 %
ES 4.61 %
BE 2.61 %
IT 1.21 %
GR 1.04 %
PT 0.38 %FI 0.17 %SI 0.04 %
NL 4.25 %
Other 2.85 %AT 1.73 %
0
5 000
10 000
15 000
20 000
25 000
30 000
35 000
0 196.61 200.8375.1379.81 129.1639.6918 1 137.32 696.54 966.8555.425 805
20.291.1197 543.8630.1902.11 359.52 216.32 400.82 476.64 853.65 93630 465.4
2006
2007
13 12 11 10 9 8 7 6 5 4 3 2 1
Like in 2006 and the previous years, the share of Germa-
ny is the most important in the Euro zone, with 58.5%
of the liquidities allocated to the German counterparties.
It should also be noted that the share of French coun-
terparties in those longer-term operations has increased
substantially. (see Chart 5 here-below).

BC
L A
nn
uA
l R
Ep
oR
t 2
00
7
89
2.1.1.3 Fine tuning operations in 2007
Contrary to earlier years, 2007 saw great recourse to
fine tuning operations.
From the beginning of the financial turmoil, the European
Central Bank resorted to this instrument in order to re-
establish balanced liquidity conditions on the money
markets. Seven operations were launched between the
beginning of August 2007 and the beginning of October
2007. In the beginning of the crisis, these operations were
liquidity providing in order to fulfil the requirements of
counterparties. As of September, fine tuning operations
were always liquidity absorbing in order to drain excess
liquidities from the markets. Nine liquidity absorbing
operations were conducted during December only.
In the beginning of 2008, the European Central Bank
continued to make use of this instrument more regu-
larly to absorb as well as to provide liquidity on an ad
hoc basis.
2.1.2 Standing facilities
Luxembourg counterparties may have recourse to stan-
ding facilities at the BCL, these being either the deposit
facility or the marginal lending facility. Recourse is made
against predefined interest rates, which are directly rela-
ted to the reference rate of the European central Bank.
Apart from a few exceptions, the counterparties have
only used the deposit facility on the last day of the
maintenance period.
2.1.3 Minimum reserves
The counterparties of the Eurozone are required to hold
minimum reserves at the national central bank of their
country of residence. Those obligations have to be met
on average over the maintenance period, which allows
counterparties to make free use of their liquidities over
the period. This feature helps stabilising the market.
The minimum reserves system was unchanged in 2007.
Luxembourg counterparties rarely failed their obliga-
tions in 2007. Only two counterparties were imposed
a sanction in this respect.

2. THE BCL'S OPERATIONS
BC
L A
nn
uA
l R
Ep
oR
t 2
00
7
90
2.2 Foreign exchange reserves management by the BCL
In accordance with the Statute of the Eurosystem and
in line with its share in the ECB’s capital key, the BCL
transferred €74.6 million in foreign exchange assets
to the ECB.
The ECB’s foreign exchange reserves have been ma-
naged in a decentralised way by the national central
banks since January 1999. Since 1 January 2007, fol-
lowing the adjustment of the weightings, which takes
place every five years, and the EU’s enlargement on
1 May 2004, the BCL’s share in the ECB’s capital key
has been 0.1575%, previously 0.1568%; an additional
€3.5 million has been transferred to the ECB. As at 31
December 2007, the total market value of the ECB’s
reserves (including accrued interest) managed by the
BCL corresponded to €236.6 million.
One goal of the foreign exchange reserves manage-
ment of the ECB is to ensure that the ECB has sufficient
liquidity available to intervene in the foreign exchange
markets if need be. Security and liquidity are, there-
fore, basic requirements in managing these reserves.
A tactical benchmark is set up for each currency by
taking into account the strategic benchmark.
This tactical benchmark reflects the ECB’s risk/return
medium-term preference as regards market conditions.
A change in the tactical benchmark may affect diffe-
rent risk categories (for example, modified duration or
liquidity risk). The Value at Risk of the tactical bench-
mark may differ from that of the strategic benchmark
in the context of fluctuation margins announced, in
advance, by the ECB.
In the management of this portfolio, the prime task
of the BCL is to invest the foreign exchange reserves
on behalf of the ECB within the prescribed fluctuation
bands and fixed risk limits, with the objective being
return maximisation. The amount of actively managed
assets in gold is specified by the ECB, taking account
of strategic considerations and market conditions.
The BCL manages a US-dollar portfolio on behalf of
the ECB.

BC
L A
nn
uA
l R
Ep
oR
t 2
00
7
91
Level 4: − The tactical committees
The tactical committees monitor the evolution of the
portfolios on a shorter-term basis and work out propo-
sals for tactical benchmarks that comply with the limits
laid down by the strategic benchmark.
The tactical committees consist of the following:
The − Comité de gestion, for the BCL’s own funds,
The − Comité réserves de change for the pooled
reserves of the ECB,
The − Comité tactical benchmark for the pension
fund of the BCL.
Level 5: − The portfolio managers
The transactions are executed by the portfolio mana-
gers, in strict compliance with the limits set, covering
both the overall and specific investment limits.
2.3.2 Risk control
In addition, the important role played in the asset
management framework by the Organisation and Risk
Management unit (OR) and the Internal Audit unit ( IA)
should be mentioned.
The Risk Manager of the OR unit monitors the positions
of all the portfolios in order to assess risks and to verify
compliance with the pre-defined limits. This monitoring
is carried out daily, independently of the Front Office.
The IA unit complements the monitoring structure with
specific missions at different levels of the organisation.
In addition, the Middle and Back Offices also take part
in the monitoring process.
2.3.3 Conceptual framework
The investment policy objectives
The main objectives are to generate a high income on
a regular basis and to ensure a total return over the
long term by taking into account considerations such
as capital safety, stability of securities and liquidity. In
order to achieve these goals and in accordance with
the principle of risk diversification, the BCL implements
2.3 Management of the BCL’s assets
2.3.1 Institutional structure
Asset management is based on a five-level intervention
structure, in addition to risk control:
The Council (level 1), −
The Board of Directors (level 2), −
The Asset and Liability Management Committee −
(ALCO) (level 3), −
The tactical committees (level 4), −
The portfolio managers (level 5). −
Level 1: − The Council
The Council approves the guidelines of the asset ma-
nagement framework. Thus, the Council has granted
the BCL the possibility to provide asset management
services to third parties and to hold own funds asset
portfolios in order to diversify the Bank’s income. The
guidelines also include mitigation of the risk framework
applied to asset management.
Level 2: − The Board of Directors
The Board of Directors defines the risk management
framework. Thus, it determines the maximum risk al-
lowance (MRA) in the management of the Bank’s own
assets. It also specifies the risk management measures,
like the Value at Risk (VaR) method and the application
of stress-testing scenarios. The Board of Directors also
sets warning thresholds, which can lead to the calling
of emergency meetings for assessment and arbitrage
purposes. The Board of Directors sets the limits of the
framework annually.
Level 3: − The Asset and Liability Management
Committee ALCO
ALCO determines the strategic benchmark according to
the framework fixed annually by the Board of Directors
by examining the impact of each risk profile (market,
credit and liquidity risk) which would result from the
proposed investment policies, in respect of both the
overall balance sheet and the profit and loss account
of the BCL. During the year, ALCO regularly assesses
the results of the investment policy.

2. THE BCL'S OPERATIONS
BC
L A
nn
uA
l R
Ep
oR
t 2
00
7
92
a coordinated, progressive and pro-active investment
policy based on modern portfolio theory.
The investment approach takes into account:
the analysis of economies and international finan- −
cial markets;
the asset allocation decisions by assessing the −
returns on different international markets;
the drawing-up of a clearly defined strategy; −
the capital value preservation of the assets under −
management by a policy of risk diversification and
the application of specific qualitative requirements
with regard to investments;
the application of strict risk control measures. −
Investment decisions are based on:
market risks (interest rates, exchange rates, equity −
prices, commodity prices);
credit risks (minimum credit ratings criteria by in- −
ternational rating agencies);
liquidity risks (concentration limits by sector, by is- −
suer, by issue and by geochartical diversification).
Performance measurement
The quality of the investment decisions is measured
by comparing the performance with the external ben-
chmarks of leading investment banks. This permits a
given performance to be assigned to a decision level
(strategic, tactical) as well as to daily management.
2.3.4 Structure of portfolios
The bulk of the BCL’s own funds are invested in fixed-
income securities denominated in euro. The strategic
orientation permits a diversification into other asset
categories.
The BCL manages five kinds of portfolios: Investment
Portfolio, Liquidity Portfolio, Domestic Reserves Port-
folio, Pension Fund Portfolio and Portfolios from third
parties. In 2007 BCL has started to constitute a hold-
to-maturity portfolio. The constitution of this portfolio
will be completed in 2008 according to the rules of
the Eurosystem.
Investment Portfolio (Portfolio 1)
This portfolio consists of assets (equity and bonds),
which can be deemed to represent its own funds (with
a longer-term investment profile). The main goal of
the portfolio is to maximise the return by taking into
account the above-mentioned risk constraints (see
section 2.3.2). As of 31 December 2007 the total mar-
ket value (including accrued interest) amounted to
€1 598 million.
In 2007 the share of this portfolio invested in fixed
income securities with a maturity above three years
has been increased from 19% to 28%, whereas the
percentage of bonds with a one to three year maturity
declined from 36% to 29%. Moreover, by the end of
2007, variable rate and fixed rate bonds with maturity
under one year represented 43% of Portfolio 1, about
the same level as of 31 December 2006.
The securities included in this portfolio are widely
diversified, not only geochartically but also in terms
of sector and issuer.
Liquidity Portfolio (Portfolio 2)
This portfolio comprises the other assets that are lar-
gely attributable to a Eurosystem arrangement (Agree-
ment on Net Financial Assets) and mirrors TARGET
accounts and other liabilities. This portfolio, whose
liability profile covers certain liquidity needs, also
aims to maximise income. The instruments used are
mainly fixed-income short-term bonds, variable rate

BC
L A
nn
uA
l R
Ep
oR
t 2
00
7
93
bonds and certificates of deposits (ECP), provided that
they comply with strict and predefined rating criteria.
As of 31 December 2007, the total market value (inclu-
ding accrued interest) amounted to €4 293.1million.
BREAK-DowN oF RESERvES AS oF
31 DECEMBER 2007
Maturity Portfolio 1 Portfolio 2
0 -1 year
43% 85%
1-3 years
29% 12%
3-10 years
28% 3%
Domestic Reserves Portfolio
This portfolio aims to maintain an intervention portfo-
lio in addition to the pooled foreign exchange reserves
transferred to the ECB. Thus, the main requirements
for this portfolio are security and liquidity. As of 31
December 2007, the total market value (including ac-
crued interest) of this portfolio in foreign currencies
amounted to €132 million.
Pension Fund Portfolio
The management of this fund is described further in
section 4.3.4 of this report.
Investments Portfolios
The BCL provides non-standardised discretionary
management services to institutional clients (central
banks and international organisations). The Bank be-
longs to the Eurosystem service providers. Six central
banks within the Eurosystem offer institutional clients
(central banks, public authorities and international
organisations) a comprehensive range of services for
managing Euro-denominated reserve assets under a
new framework of harmonised services defined by
the ECB.
2.4 Banknotes and coins
Euro banknotes are produced to meet all the NCBs’
banknote requirements, which are aggregated by the
ECB. The production of one denomination is assigned
to, at most, two NCBs. In 2007, the BCL was responsi-
ble for producing €9.6 million €100 banknotes for its
own requirements. The production of these banknotes
was entrusted to the specialised security printer Johan
Enschedé in the Netherlands.
According to an agreement with the Luxembourg go-
vernment, the BCL is in charge of the production of
Luxembourg’s euro coins. Following an invitation to
tender, the BCL put the Monnaie de Paris (Mint of
France) in charge of the production in 2007 of 43.5
million coins for its own requirements.
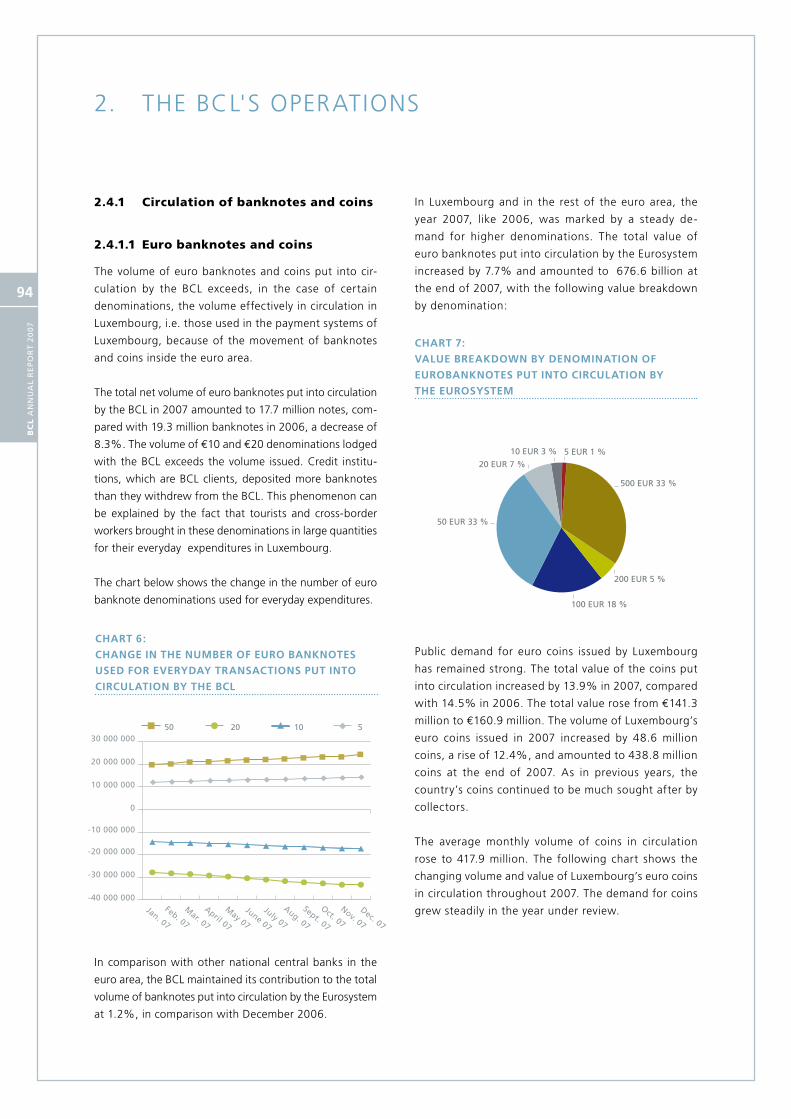
2. THE BCL'S OPERATIONS
BC
L A
nn
uA
l R
Ep
oR
t 2
00
7
94
2.4.1 Circulation of banknotes and coins
2.4.1.1 Euro banknotes and coins
The volume of euro banknotes and coins put into cir-
culation by the BCL exceeds, in the case of certain
denominations, the volume effectively in circulation in
Luxembourg, i.e. those used in the payment systems of
Luxembourg, because of the movement of banknotes
and coins inside the euro area.
The total net volume of euro banknotes put into circulation
by the BCL in 2007 amounted to 17.7 million notes, com-
pared with 19.3 million banknotes in 2006, a decrease of
8.3%. The volume of €10 and €20 denominations lodged
with the BCL exceeds the volume issued. Credit institu-
tions, which are BCL clients, deposited more banknotes
than they withdrew from the BCL. This phenomenon can
be explained by the fact that tourists and cross-border
workers brought in these denominations in large quantities
for their everyday expenditures in Luxembourg.
The chart below shows the change in the number of euro
banknote denominations used for everyday expenditures.
In comparison with other national central banks in the
euro area, the BCL maintained its contribution to the total
volume of banknotes put into circulation by the Eurosystem
at 1.2%, in comparison with December 2006.
In Luxembourg and in the rest of the euro area, the
year 2007, like 2006, was marked by a steady de-
mand for higher denominations. The total value of
euro banknotes put into circulation by the Eurosystem
increased by 7.7% and amounted to €676.6 billion at
the end of 2007, with the following value breakdown
by denomination:
CHART 7:
vALuE BREAKDowN By DENoMINATIoN oF
EuRoBANKNoTES PuT INTo CIRCuLATIoN By
THE EuRoSySTEM
Public demand for euro coins issued by Luxembourg
has remained strong. The total value of the coins put
into circulation increased by 13.9% in 2007, compared
with 14.5% in 2006. The total value rose from €141.3
million to €160.9 million. The volume of Luxembourg’s
euro coins issued in 2007 increased by 48.6 million
coins, a rise of 12.4%, and amounted to 438.8 million
coins at the end of 2007. As in previous years, the
country’s coins continued to be much sought after by
collectors.
The average monthly volume of coins in circulation
rose to 417.9 million. The following chart shows the
changing volume and value of Luxembourg’s euro coins
in circulation throughout 2007. The demand for coins
grew steadily in the year under review.
CHART 6:
CHANGE IN THE NuMBER oF EuRo BANKNoTES
uSED FoR EvERyDAy TRANSACTIoNS PuT INTo
CIRCuLATIoN By THE BCL
50 EUR 33 %
20 EUR 7 %
10 EUR 3 % 5 EUR 1 %
500 EUR 33 %
200 EUR 5 %
100 EUR 18 %
B B B B B B B B B B B B
J J J J J J J J J J J J
H H H H H H H H H H H H
F F F F F F F F F F F F
-40 000 000
-30 000 000
-20 000 000
-10 000 000
0
10 000 000
20 000 000
30 000 000B 50 J 20 H 10 F 5
Dec. 07
Nov. 07
Oct. 07
Sept. 07
Aug. 07
July 07
June 07
May 07
April 07
Mar. 07
Feb. 07
Jan. 07
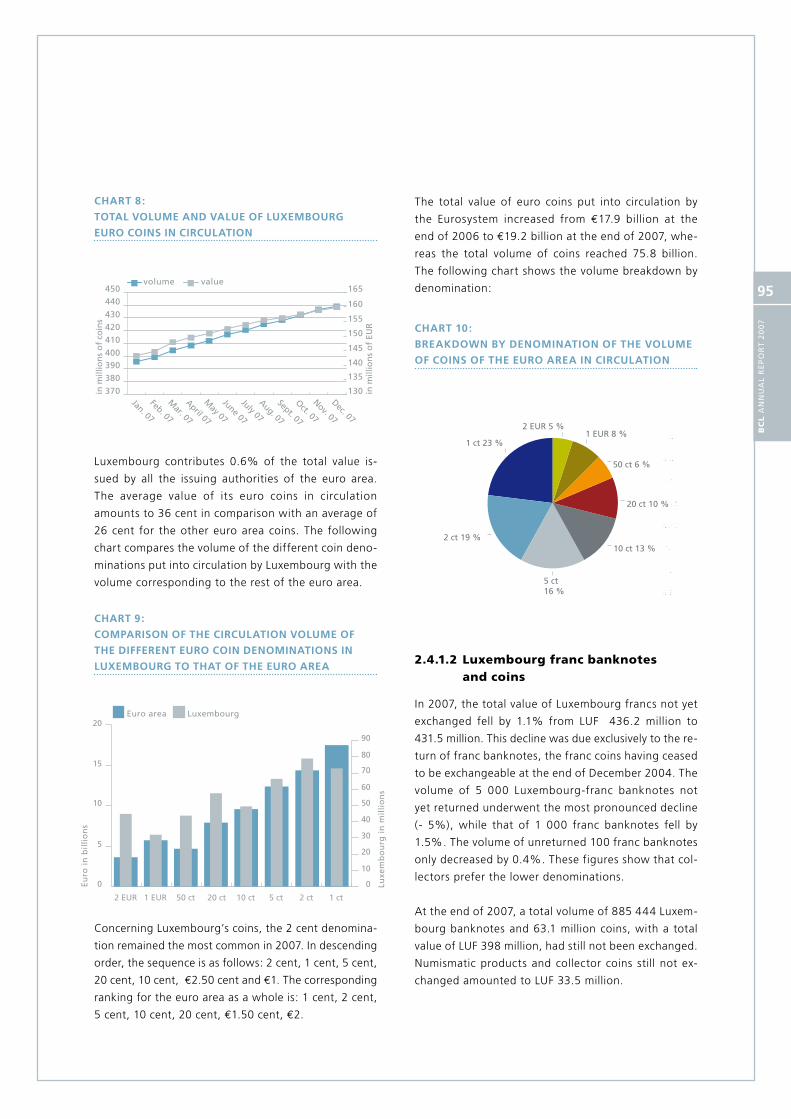
BC
L A
nn
uA
l R
Ep
oR
t 2
00
7
95
CHART 8:
ToTAL voLuME AND vALuE oF LuxEMBouRG
EuRo CoINS IN CIRCuLATIoN
Luxembourg contributes 0.6% of the total value is-
sued by all the issuing authorities of the euro area.
The average value of its euro coins in circulation
amounts to 36 cent in comparison with an average of
26 cent for the other euro area coins. The following
chart compares the volume of the different coin deno-
minations put into circulation by Luxembourg with the
volume corresponding to the rest of the euro area.
CHART 9:
CoMPARISoN oF THE CIRCuLATIoN voLuME oF
THE DIFFERENT EuRo CoIN DENoMINATIoNS IN
LuxEMBouRG To THAT oF THE EuRo AREA
Concerning Luxembourg’s coins, the 2 cent denomina-
tion remained the most common in 2007. In descending
order, the sequence is as follows: 2 cent, 1 cent, 5 cent,
20 cent, 10 cent, €2.50 cent and €1. The corresponding
ranking for the euro area as a whole is: 1 cent, 2 cent,
5 cent, 10 cent, 20 cent, €1.50 cent, €2.
The total value of euro coins put into circulation by
the Eurosystem increased from €17.9 billion at the
end of 2006 to €19.2 billion at the end of 2007, whe-
reas the total volume of coins reached 75.8 billion.
The following chart shows the volume breakdown by
denomination:
CHART 10:
BREAKDowN By DENoMINATIoN oF THE voLuME
oF CoINS oF THE EuRo AREA IN CIRCuLATIoN
2.4.1.2 Luxembourg franc banknotes and coins
In 2007, the total value of Luxembourg francs not yet
exchanged fell by 1.1% from LUF 436.2 million to
431.5 million. This decline was due exclusively to the re-
turn of franc banknotes, the franc coins having ceased
to be exchangeable at the end of December 2004. The
volume of 5 000 Luxembourg-franc banknotes not
yet returned underwent the most pronounced decline
(- 5%), while that of 1 000 franc banknotes fell by
1.5%. The volume of unreturned 100 franc banknotes
only decreased by 0.4%. These figures show that col-
lectors prefer the lower denominations.
At the end of 2007, a total volume of 885 444 Luxem-
bourg banknotes and 63.1 million coins, with a total
value of LUF 398 million, had still not been exchanged.
Numismatic products and collector coins still not ex-
changed amounted to LUF 33.5 million.
volume value
Jan. 07
Feb. 07
Mar. 07
April 07
May 07
June 07
July 07
Aug. 07
Sept. 07
Oct. 07
Nov. 07
Dec. 07
400
410
420
430
440
450
370
165
130
135
140
145
150
155
160
380
390
in m
illio
ns
of
coin
s
in m
illio
ns
of
EUR
1 ct
2 ct
5 ct
10 ct
20 ct
50 ct
1 EUR
2 EUR
1 ct 23 %
2 ct 19 %
5 ct16 %
10 ct 13 %
20 ct 10 %
50 ct 6 %
1 EUR 8 %2 EUR 5 %
Euro area Luxembourg
Euro
in
bil
lio
ns
Luxe
mb
ou
rg i
n m
illi
on
s
2 EUR 1 EUR 50 ct 20 ct 10 ct 5 ct 2 ct 1 ct
0
10
20
30
40
50
60
70
80
90
0
5
10
15
20

2. THE BCL'S OPERATIONS
BC
L A
nn
uA
l R
Ep
oR
t 2
00
7
96
2.4.2 Handling of banknotes and coins
The number of euro banknotes returned by financial
institutions to the BCL – 66.5 million - remained nearly
unchanged compared with the previous year.
The number of euro banknotes processed by sorting
machines rose noticeably, by some 5.9%, from 59.7
million notes in 2006 to 61.4 million in 2007. The
sorting machines carry out both authenticity tests and
soiling tests. Nearly 15.9 million notes of all denomina-
tions had to be destroyed as they were unfit for circula-
tion. The reject /destruction rate remained unchanged
at 25.9% of the total number of euro banknotes sorted
in 2007. Moreover, this percentage varied greatly from
one denomination to another: 10.8% for the €500
banknote to 50.7% for the €5 note.
In the field of counterfeit monitoring, the BCL conti-
nued to work closely with the ECB and the national
authorities in analysing discovered counterfeits.
2.4.3 Numismatic issues
Due to the ongoing collectors’ interest for Luxembourg
numismatic products, the BCL created several new
distribution channels in 2007. Since January 2007, the
retail to the public is located in the new numismatic
premises of the BCL, at avenue Monterey 43, Luxem-
bourg. In February 2007, the BCL introduced a mail
order facility, followed in October 2007 by the launch
of its Internet shop (eShop).
In 2007, the BCL issued the following numismatic
products:
Two − €2 commemorative coins with a distinctive na-
tional side, put on sale respectively in February
and May 2007. The first issue depicts the Grand-
Ducal Palace, official residence of the Grand Duke,
whereas the second is dedicated to the 50th an-
niversary of the Treaty of Rome. Both issues have
been minted with 15 000 coins each in "Brilliant
Uncirculated" quality (packed as coin cards) and
with 1 million coins each in circulation quality.
The "2007 BU set" comprises Luxembourg’s euro −
coins (1 cent to €2, including both €2 comme-
morative coins), struck in "Brilliant Uncirculated"
quality and dated 2007. The mintage is limited to
15 000 sets. This set is the third one of a series
of 7 sets dedicated to the different architectu-
ral periods as depicted on the euro banknotes.
The "2007 BENELUX set" contains the 2007 series −
of eight euro coins of the three BENELUX countries
struck in "Brilliant Uncirculated" quality. It also
includes a specially designed cupronickel medal.
The "2007 Proof set" features Luxembourg’s 10 euro −
coins (ranging from 1 cent to €2) plus both €2 com-
memorative coins, all struck in “Proof” quality and
dated 2007. The mintage amounts to 2 500 sets.
The silver coin dedicated to the 30th anniver- −
sary of the European Court of Auditors was is-
sued at the anniversary date of October 17, 2007
and represents the sixth collector coin in the sil-
ver series “European institutions”. The mintage
amounts to 3 000 coins. This coin has a face va-
lue of €25 and is minted with a silver fineness of
925. It has a diameter of 37 mm and a weight of
22.85 gr. As all collector coins in precious metal
issued by a euro area Member State, the silver
coin is legal tender only in the issuing country.
A set of eight Slovene euro coins in circulation −
quality (ranging from 1 cent to €2) was issued in
October 2007. This set commemorates the adhesion
of Slovenia to the euro area on January 1, 2007 and
extends the “cube” collection issued in 2002 by the
BCL, putting together one set of euro coins of each
Member State having adopted the euro.
BC
L A
nn
uA
l R
Ep
oR
t 2
00
7
97
2.5 Developments in the area of statistics
2.5.1 Money and banking statistics
The Eurosystem continued its work on the revision of
regulation ECB/1001/13 and ECB/2001/18 concerning
the consolidated balance sheet as well as interest rates
of MFIs in order to improve the availability of euro area
statistics. The objective of this revision mainly consists
in the inclusion of new financial instruments, statistics
concerning payments systems as well as information on
securitisation in money and banking statistics.
The BCL also participates in the statistical work of the
Bank for International Settlements (BIS) and contribu-
tes to the international banking statistics collected and
published by the BIS. In this context, it participated in
the triennial survey on foreign exchange and derivatives
conducted during April 2007. The results of this survey
have been published in the BCL’s Bulletin 2007/2.
Furthermore, the BCL provides information on the
Luxembourg financial system to the International Mo-
netary Fund ( IMF) in order to publish it in the monthly
International Financial Statistics review of the IMF as
well as in the framework of the Special Data dissemi-
nation Standard (SDDS).
The BCL publishes on its website, as well as in its pe-
riodical Bulletin, monthly and quarterly statistics on the
balance sheet of Luxembourg monetary financial ins-
titutions (MFIs) and Luxembourg credit institutions as
well as the interest rates applied by credit institutions
on loans and deposits. Finally, the BCL also publishes
information on the profit and loss accounts of Luxem-
bourg credit institution as well an on their staff.
2.5.2 External statistics
The BCL publishes on its website quarterly statistics
of the Luxembourg balance of payments as well as
International investment position, External debt and
Reserve assets statistics. The BCL and the STATEC dis-
seminate, after availability of a new dataset, on a
quarterly basis, a joint press statement that aims to
inform the public of the large evolutions touching the
balance of payments.
The BCL participates in the annual Coordinated Portfo-
lio Investment Survey of the IMF (the so-called CPIS).
The results of this survey are available on the BCL
website.
In the course of the year under review, the BCL has
communicated the final set of instructions concerning
transmission of own and third party position on a
security by security basis to the banking sector. A first
transmission is requested as regards data for end of
December 2008. These substantial developments will
enable the BCL to respect the deadlines fixed in the
ECB guideline ECB/2004/15 dated July 16th, 2004.
Finally, the BCL has jointly decided with the STATEC
to increase, as from July 2008 onwards, the threshold
from 12 500 euros to 50 000 euros.
2.5.3 Economic and financial statistics
During 2007 the BCL contributed to the ECB’s concep-
tual development of a new data collection for the
sector of financial intermediaries (investment funds and
securitisation entities) that are important actors on the
capital markets. This work was finalised in 2007 and
thus allowing the Governing Council to adopt a new
regulation, ECB/200/9, concerning statistics on assets
and liabilities of investments funds.
In order to allow Luxembourg to respond to this new
information request by the ECB, the BCL, in close coo-
peration with the Luxembourg investment fund indus-
try through the intermediary of the Luxembourg Invest-
ment Fund Association (ALFI), modified the statistical
data collection for money markets funds and defined
a new data collection for non monetary investment
funds. The modified data collection for money market
funds as well as the new data collection for invest-
ments funds will enter into force in January 2009.
Finally, the BCL publishes its periodic newsletter and
on its website information on the situation of UCIs and
PFS (professionals of the financial sector).
2. THE BCL'S OPERATIONS
BC
L A
nn
uA
l R
Ep
oR
t 2
00
7
98
2.5.4 Other statistics
Since some fifteen years, central banks of the ESCB
collect in their respective jurisdictions statistics for the
use of different means of payments and on the activity
of payment systems and securities settlement. These
statistics are published annually in the “Blue Book”.
The ESCB is in the process of harmonizing the described
data collection. Work on this project began in 2007 and
should be finalised in the course of the year 2008.
2.6 Payment and securities settlement systems
2.6.1 Real-time gross settlement systems
On 19 November 2007, the real-time gross settlement
system, LIPS-Gross3, migrated its activities to the new
TARGET2-LU system. As a consequence, the 2007 LIPS-
Gross exercise was limited to 224 days of operation
against 255 in 2006. Global figures of activity for the
two years are therefore not directly comparable.
In 2007, the number of participants in LIPS-Gross de-
creased from 31 to 30.
2.6.1.1 The activity of LIPS-Gross in 2007
Domestic payments4
In 2007, participants in LIPS-Gross exchanged a total
of 301 148 payments (against 197 744 in 2006) for a
total value of €2.880 billion euros (compared to €3.387
billion in 2006). Compared to 2006, the volume ex-
changed increased by 52% while the value exchanged
decreased by 15%. The important increase in volume
was triggered mainly by a migration of payments from
LIPS-Net (the system ceased its activities in October
2006) to LIPS-Gross. The average value per transaction
was thus reduced to €9.6 million.
3 Real time Gross Settlement System (RtGS)4 Domestic payments : payments exchanged between two lIpS-Gross participants

BC
L A
nn
uA
l R
Ep
oR
t 2
00
7
99
CHART 11:
DoMESTIC PAyMENTS:
EvoLuTIoN oF AvERAGE DAILy voLuME
CHART 12:
DoMESTIC PAyMENTS:
EvoLuTIoN oF THE AvERAGE DAILy vALuE
The following charts show the evolution of daily avera-
ges in volume and value of domestic payments.
Y2005 Y2006 Y2007
Y2005 Y2006 Y2007
Ave
rag
e d
aily
nu
mb
er
0
1 000
1 200
800
600
400
200
1 400
2 000
1 800
1 600
Dec.Nov.Oct.Sept.Aug.JulyJuneMayAprilMar.Feb.Jan.
0
4 000
2 000
6 000
10 000
8 000
12 000
16 000
18 000
14 000
Dec.Nov.Oct.Sept.Aug.JulyJuneMayAprilMar.Feb.Jan.
Y2005 Y2006 Y2007
Y2005 Y2006 Y2007
Ave
rag
e d
aily
nu
mb
er
0
1 000
1 200
800
600
400
200
1 400
2 000
1 800
1 600
Dec.Nov.Oct.Sept.Aug.JulyJuneMayAprilMar.Feb.Jan.
0
4 000
2 000
6 000
10 000
8 000
12 000
16 000
18 000
14 000
Dec.Nov.Oct.Sept.Aug.JulyJuneMayAprilMar.Feb.Jan.

2. THE BCL'S OPERATIONS
BC
L A
nn
uA
l R
Ep
oR
t 2
00
7
100
(increase of 30%). Members in LIPS-Gross received
less cross-border payments than they sent. The value
of cross-border payments received remained above the
value of payments sent.
The following charts show the evolution of average
daily volumes and values of cross-border payments
sent by participants in LIPS-Gross.
Cross-border payments5
In 2007, participants in LIPS-Gross sent 464 295 pay-
ments to other EU countries (against 473 199 payments
in 2006) for a total value of €5 437 billion (against
€4 491 billion in 2006). They received 376 583 cross-
border payments (compared to 404 176 payments
in 2006) for a total value of €5 451 billion (€4 489
billion in 2006). The average value per cross-border
payment sent was €11.7 million (increase of 23%). For
a payment received the average value was €14.5 million
5 Cross-border payment : a payment exchanged between a participant in lIpS-Gross and a participant in tARGEt
CHART 13:
CRoSS-BoRDER PAyMENTS SENT:
EvoLuTIoN oF AvERAGE DAILy voLuME
0
500
1 000
1 500
2 000
2 500
Dec.Nov.Oct.Sept.Aug.JulyJuneMayAprilMar.Feb.Jan.
Y2005 Y2006 Y2007
nov déc
2005
2006
2007
Ave
rag
e d
aily
nu
mb
er
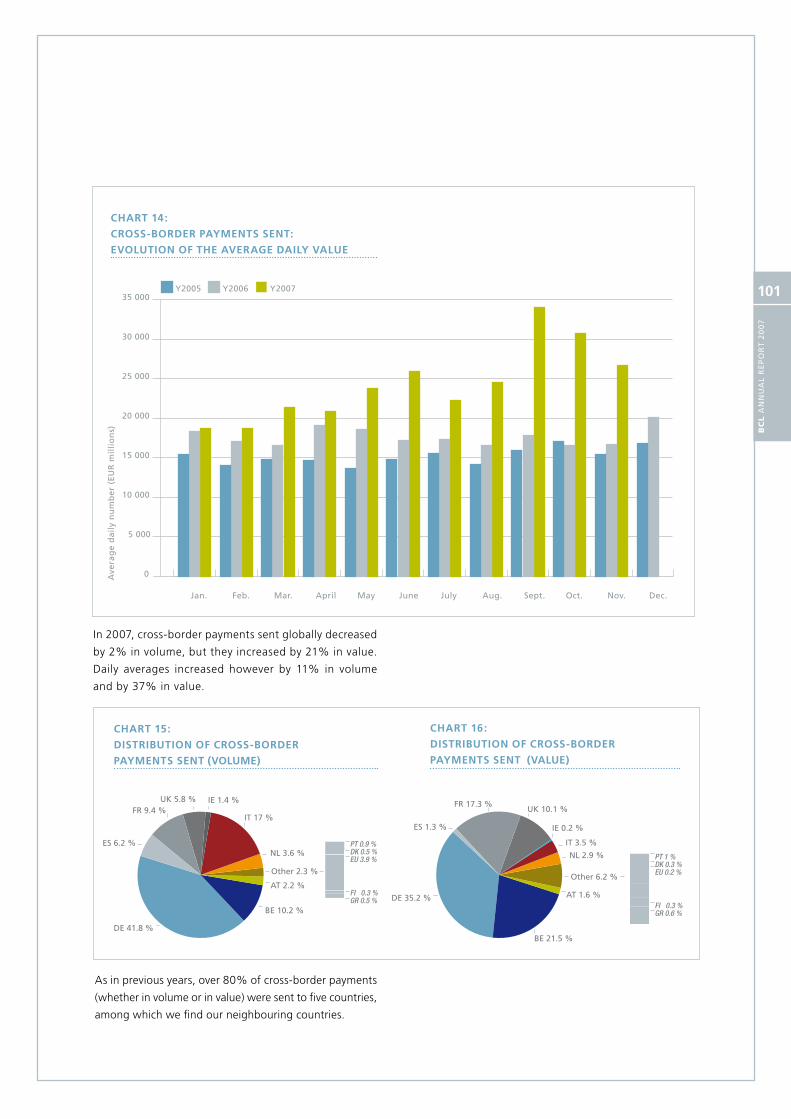
BC
L A
nn
uA
l R
Ep
oR
t 2
00
7
101
In 2007, cross-border payments sent globally decreased
by 2% in volume, but they increased by 21% in value.
Daily averages increased however by 11% in volume
and by 37% in value.
CHART 14:
CRoSS-BoRDER PAyMENTS SENT:
EvoLuTIoN oF THE AvERAGE DAILy vALuE
As in previous years, over 80% of cross-border payments
(whether in volume or in value) were sent to five countries,
among which we find our neighbouring countries.
CHART 15:
DISTRIBuTIoN oF CRoSS-BoRDER
PAyMENTS SENT (voLuME)
CHART 16:
DISTRIBuTIoN oF CRoSS-BoRDER
PAyMENTS SENT (vALuE)
Y2005 Y2006 Y2007
Ave
rag
e d
aily
nu
mb
er (
EUR
mil
lio
ns)
0
5 000
10 000
15 000
20 000
25 000
30 000
35 000
Dec.Nov.Oct.Sept.Aug.JulyJuneMayAprilMar.Feb.Jan.
DE 41.8 %
BE 10.2 %
NL 3.6 %ES 6.2 %
FR 9.4 %UK 5.8 % IE 1.4 %
IT 17 %
0.0
0.5
1.0
1.5
2.0
2.5
Other 2.3 %
AT 2.2 %
DE 35.2 %
NL 2.9 %
ES 1.3 %
FR 17.3 %UK 10.1 %
IE 0.2 %
IT 3.5 %
0.0
0.5
1.0
1.5
2.0
2.5
Other 6.2 %
AT 1.6 %
BE 21.5 %
PT 0.9 %DK 0.5 %EU 3.9 %
FI 0.3 %GR 0.5 %
PT 1 % DK 0.3 % EU 0.2 %
FI 0.3 % GR 0.6 %
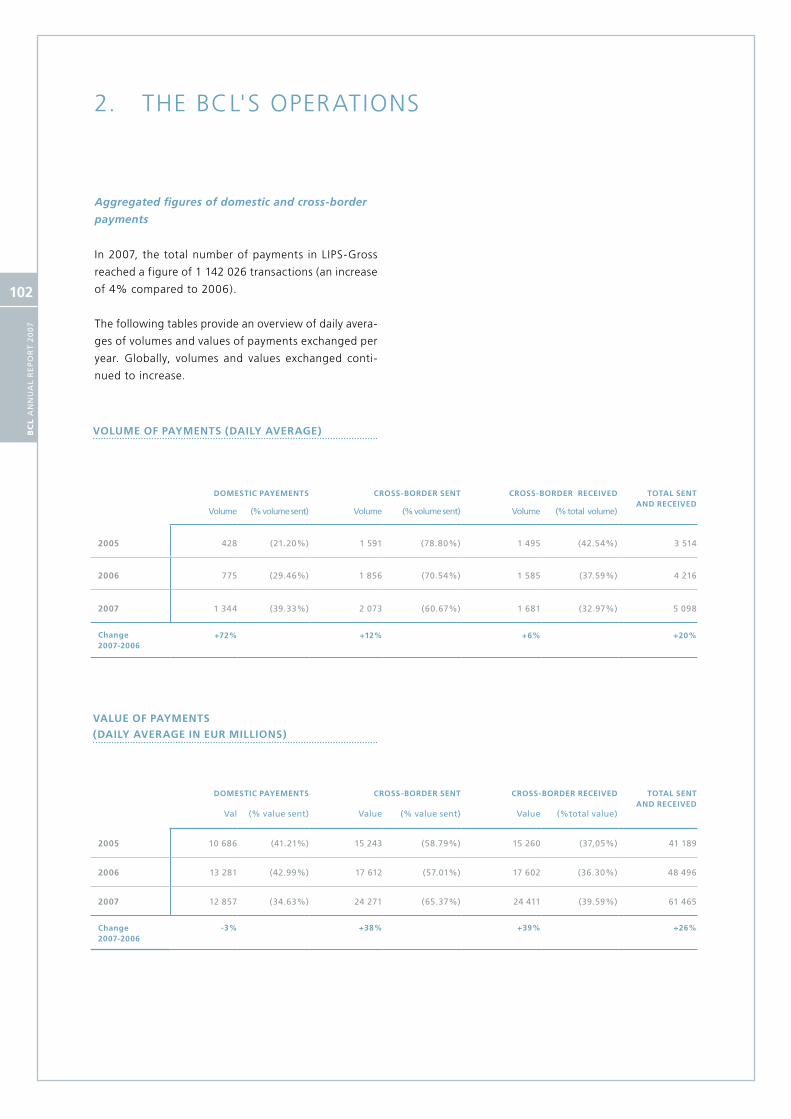
2. THE BCL'S OPERATIONS
BC
L A
nn
uA
l R
Ep
oR
t 2
00
7
102
Aggregated figures of domestic and cross-border
payments
In 2007, the total number of payments in LIPS-Gross
reached a figure of 1 142 026 transactions (an increase
of 4% compared to 2006).
The following tables provide an overview of daily avera-
ges of volumes and values of payments exchanged per
year. Globally, volumes and values exchanged conti-
nued to increase.
DoMESTIC PAyEMENTS CRoSS-BoRDER SENT CRoSS-BoRDER RECEIvED ToTAL SENT
AND RECEIvED Volume (% volume sent) Volume (% volume sent) Volume (% total volume)
2005 428 (21.20%) 1 591 (78.80%) 1 495 (42.54%) 3 514
2006 775 (29.46%) 1 856 (70.54%) 1 585 (37.59%) 4 216
2007 1 344 (39.33%) 2 073 (60.67%) 1 681 (32.97%) 5 098
Change2007-2006
+72% +12% +6% +20%
DoMESTIC PAyEMENTS CRoSS-BoRDER SENT CRoSS-BoRDER RECEIvED ToTAL SENT AND RECEIvED
Val (% value sent) Value (% value sent) Value (%total value)
2005 10 686 (41.21%) 15 243 (58.79%) 15 260 (37,05%) 41 189
2006 13 281 (42.99%) 17 612 (57.01%) 17 602 (36.30%) 48 496
2007 12 857 (34.63%) 24 271 (65.37%) 24 411 (39.59%) 61 465
Change 2007-2006
-3% +38% +39% +26%
voLuME oF PAyMENTS (DAILy AvERAGE)
vALuE oF PAyMENTS
(DAILy AvERAGE IN EuR MILLIoNS)
BC
L A
nn
uA
l R
Ep
oR
t 2
00
7
103
LIPS-Gross compared to other systems connected
to TARGET
In 2007, all national RTGS systems together executed
a total of 72.6 million domestic payments (compa-
red to 64.2 million in 2006) for a global value of
€395 412 billion (compared to €348 765 billion in
2006). On daily average, payments between parti-
cipants in Luxembourg represented 0.47% of the
volume and 0.83% of the value of all national pay-
ments in TARGET.
In addition, 20.8 million of cross-border payments
(19 million in 2006) for a value of €221 319 billion
(€184 777 billion in 2006) were exchanged in the
course of the year. On daily average, LIPS-Gross
contributed 2.54% to the volume and 2.80% to the
value exchanged.
Availability of TARGET
The availability of TARGET as a whole increased from
99.87% in 2006 to 99.90% in 2007. The average
availability of TARGET over its 9 years of existence is
99.73%.
The availability of LIPS-Gross reached 99.98% in 2007
(compared to 99.80% in 2006). Two minor technical
incidents affected our system. The availability of LIPS-
Gross was 100% for 10 months out of 11. Since its
launch, LIPS-Gross’ average availability is 99.73%.
2.6.1.2 Migration to TARGET2-LU
Following the decision of the Governing Council on 24
October 2002 to harmonize the national RTGS systems
on a Eurosystem level, the new platform TARGET2
was developed and all national RTGS system agreed
to migrate to the common infrastructure. Luxembourg
was among the first wave of countries that joined the
TARGET2-platform or Single Shared Platform (SSP)
on 19 November 2007. Other not yet migrated RTGS
systems followed in two additional migration windows
on 18 February and on 19 May 2008. With migration
completed, about one thousand banks participate
directly in TARGET2 and offer an indirect access to a
multitude of banks throughout the world. In addition,
TARGET2 is the preferred system for the settlement
of its participants’ positions for most European an-
cillary systems.
As a consequence of the migration, the system LIPS-
Gross ceased its activities on 16 November 2007. On
19 November 2007, its successor, TARGET2-LU, took
over the operations on the SSP of TARGET2. Twenty-
three of the former LIPS-Gross participants are directly
connected to TARGET2-LU.
The RTGS-L Gie, owner of the LIPS-Gross system, will
be dismantled in 2008.
2.6.2 The interbank netting system LIPS-Net
LIPS-Net, the national automated clearing system for
cheques and credit transfers, was developed in the ear-
ly 90s as a substitute to the manual clearing house.
Considering the limited scope for increasing its activity,
insufficient economies of scale as well as the ongoing
integration process at the European level6, the mana-
gers of the SYPAL-Gie, the system’s owner, decided to
terminate LIPS Net operations in October 2006.
Cheques, whose volumes have been steadily declined
over the past few years, are exchanged and settled on
a bilateral basis since 1 July 2006.
Credit transfers and standing orders are processed
on the pan-European STEP2 platform operated by the
Euro Banking Association (EBA).
Luxembourg participants’ activity in STEP2
The bulk of Luxemburg credit transfer and standing
order transactions are since October 2006 processed
by the pan-European system STEP2.
Transactions that are not processed in STEP2 are sett-
led either via TARGET2 or on a bilateral basis.
In 2007, Luxembourg participants sent 57 000 tran-
sactions for a value of €88 million on a daily average
6 the European financial sector is preparing the “Single Euro payment Area” (SEpA), which is to be implemented by the end of the year 2010.

2. THE BCL'S OPERATIONS
BC
L A
nn
uA
l R
Ep
oR
t 2
00
7
104
through the Step2 system. Domestic transactions ac-
counted for 77% in volume (close to 44 000 opera-
tions) and 70% in value (€61 million).
2.6.3 The general framework of eligible collateral in the Eurosystem credit operations
2.6.3.1 The list of eligible assets
All credit operations of the ECB and the national
central banks are effected “on the basis of adequate
collateral”7. Consequently, each counterparty of the
Eurosystem guarantees the credit received from a Euro-
system central bank by providing assets as collateral.
These assets have to fulfill specific eligibility criteria
defined by the Eurosystem, which are published on
the ECB’s website.
In 2007, the Eurosystem replaced its two categories
of eligible assets8 by a single list. This single list com-
prises two different asset classes, marketable assets
(securities) and non-marketable assets (in particular
credit claims). The inclusion of non-marketable assets
has required the development by each NCB of appro-
priate handling procedures, as well as the develop-
ment and implementation of a euro area wide credit
assessment framework. In this context, the Governing
Council has accepted, amongst others, the following
key elements:
between 2007 and 2012 each national central −
bank will apply its own threshold for credit claims.
As from 2012, a common minimum threshold of
500 000 will be applied by the whole Eurosystem.
the debtors of the claims provided as collateral have −
to be financially sound. The Eurosystem will assess
the financial soundness of the debtors according
to the “Eurosystem Credit Assessment Framework
(ECAF)”, which details the rules governing the
Eurosystem’s credit quality requirements. In this
context, the Eurosystem also published its minimum
7 Article 18 of the Statute of the ESCB and the ECB, article 22 of the founding law of the BCl.8 these were the tier 1 assets, debt instruments fulfilling uniform euro area wide eligibility criteria specified by the Eurosystem, and tier 2 assets, complementary assets on a national level.

BC
L A
nn
uA
l R
Ep
oR
t 2
00
7
105
such cross-border use of collateral. Counterparties
may use
the CCBM − 12; and
links established between securities settlement −
systems.
Currently two types of links are eligible: direct links
and relayed links. In a given securities settlement sys-
tem located in a country of the European Union, direct
links make available securities issued in a system of
another European Union country, thanks to bilateral
accounts that the two systems maintain with each
other. Relayed links enable the transfer of securities
between two systems without bilateral accounts by
using a third system with which the first two systems
have bilateral accounts. Links have to be approved
by the Governing Council before being used for the
collateralisation of central bank credit operations. In
2007, Luxembourg counterparties had the possibility
to use the direct links between CBL and Clearstream
Banking Frankfurt A.G., Euroclear, the National Bank
of Belgium, Monte Titoli ( Italy), OeKB (Austria), and
Euroclear Netherlands.
Securities settlement in central bank money:
TARGET2-Securities
The aim of TARGET2-Securities (T2S) is to further fi-
nancial market infrastructure integration. T2S will thus
provide to the market settlement services in central
bank money. In March 2007, the Governing Council
decided after thorough evaluation that the T2S sys-
tem is feasible. Moreover, the Governing Council de-
cided that the T2S system will be implemented on
the technical platform used by the payment system
TARGET2.
Draft user requirements were defined in 2007 on the
basis of general principles and high level proposals
that were previously submitted to public consulta-
tion. These user requirements were elaborated in
a six-month period of intensive collaboration of a
team of experts composed of representatives of the
12 Correspondent Central Banking Model, see section 2.6.4.
rating threshold. This threshold is set at a rating of
at least A-, or by means of a probability of default
no higher than 10 basis points.
The law of 13 July 2007 concerning the market on
financial instruments provides for the registration of
credit claims at the central bank and establishes a re-
gime for the pledging of credit claims that is like those
offered in neighbouring countries.9
2.6.3.2 Eurosystem as a user of securities settlement systems
Selection of depositories10 at the domestic level
In order to meet the requirement of “adequate
collateral”11, the Eurosystem also assesses against spe-
cific safety criteria depositories that are safekeeping
securities used in the framework of central bank credit
operations. Thus, a national depository is eligible if it
obtains, after verification of its compliance with the
Eurosystem user standards, the formal approval of
the Governing Council. In this context, the Governing
Council approved in 2006 a new arrangement for the
safekeeping of international securities in global bearer
note form, the so-called “New Global Note” (NGN)
arrangement, developed by Clearstream Banking
Luxembourg (CBL), Euroclear Bank, and other market
participants. The NGN arrangement is compliant with
the user standards, provided that the respective NGN
is safekept by an institution that has been positively
assessed against these standards by the Eurosystem.
Cross-border use of collateral
Besides using eligible domestic securities settled via
the national depository, which for Luxembourg coun-
terparties is Clearstream Banking Luxembourg (CBL),
all Eurosystem counterparties may receive credit from
their local national central bank by using collateral
issued in a depository located elsewhere in the Euro-
pean Union. The Eurosystem foresees two ways for
9 For more detailed information on these specific provisions see section 3.3.1.10 A depository is an institution that operates a securities settlement system.11 Article 18 of the Statute of the ESCB and the ECB, article 22 of the founding law of the BCl.
2. THE BCL'S OPERATIONS
BC
L A
nn
uA
l R
Ep
oR
t 2
00
7
106
Eurosystem, central securities depositories as well as
of banks. In the framework of a second public consul-
tation launched in December 2007, the market was
invited to comment on the draft user requirements.
Moreover, the market was invited to comment on the
methodology for the economic impact assessment
the Eurosystem will apply in order to calculate the
costs, the benefits and macroeconomic impacts of
T2S. Market participants’ comments will be assessed
before submission of the final version of the user
requirements for decision of the Governing Council
in summer 2008.
2.6.4 Correspondent Central Banking Model (CCBM)
The objective of the CCBM is to enable counterparties
of the Eurosystem to use securities on a cross-border
basis even if there is no eligible link between the na-
tional depository and the foreign depository in which
the counterparty holds securities. For this purpose, in
the CCBM each NCB acts on behalf of the other central
banks as a custodian for securities held at the national
depository. This procedure involves on the one side a
central bank called a correspondent central bank (CCB),
which differs from the central bank granting the credit
to the counterparty. The CCB holds the account at
the depository in which the securities deposited are
registered. The home central bank (HCB) grants the
credit to its counterparty on the basis of confirmations
it receives from the CCB.
The CCBM has been a success with the counterparties
and it remains the main channel for the cross-border
mobilisation of collateral used in the Eurosystem’s credit
operations.
The most active correspondent central banks in 2007
have been those from Spain (26.2%), Luxembourg
(24.0%), Belgium (23.0%), and Italy (10.7%). The most
active home central banks have been those from Ger-
many (54.7%), United Kingdom (11.0%), France (9.3%),
the Netherlands (4.1%), and from Ireland (4.1%).
2.6.5 The future management of collateral by the Eurosystem
In 2007 the Eurosystem reviewed its collateral ma-
nagement procedures and in particular the CCBM. In
view of the evolution of the counterparties’ needs and
in order to realise synergies, the Governing Council
decided to develop a single platform for the mana-
gement of domestic and cross-border collateral. This
platform will be called CCBM2 (Collateral Central Bank
Management) and will offer central banks the neces-
sary functionalities for the management of securities
and credit claims received from their counterparties.
In order to develop a platform that meets the market’s
needs, the Eurosystem launched in April 2007 a first
public consultation on the general principles defined
for this project. Participants’ answers have been taken
into account while defining the user requirements for
the CCBM2. A new public consultation was launched
in this context in February 2008.
2.6.6 Night Time Link with Clearstream Banking Luxembourg
Operation of the Night Time Link procedure with
Clearstream was terminated with the migration of
the Luxembourg banking community to the TARGET2
system. The functionalities of TARGET2 enable the
concerned banks to continue using their collateral at
the BCL to guarantee the credit granted by CBL in the
night clearing.
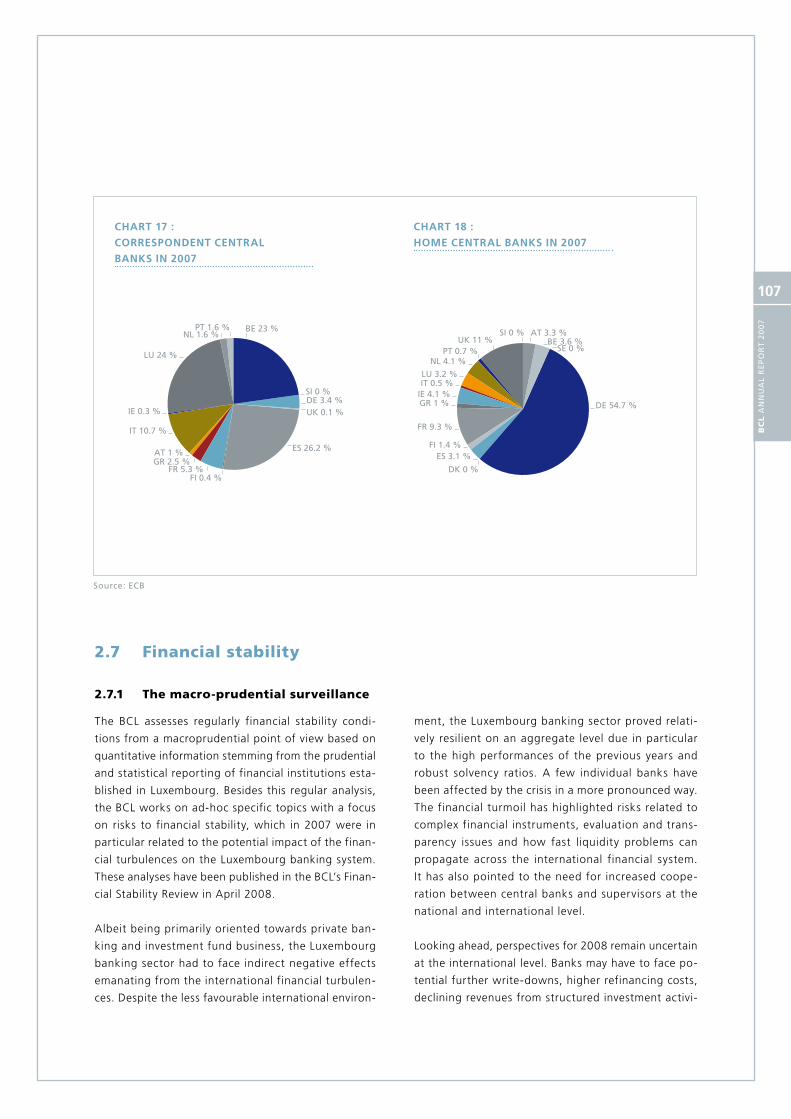
BC
L A
nn
uA
l R
Ep
oR
t 2
00
7
107
2.7 Financial stability
2.7.1 The macro-prudential surveillance
The BCL assesses regularly financial stability condi-
tions from a macroprudential point of view based on
quantitative information stemming from the prudential
and statistical reporting of financial institutions esta-
blished in Luxembourg. Besides this regular analysis,
the BCL works on ad-hoc specific topics with a focus
on risks to financial stability, which in 2007 were in
particular related to the potential impact of the finan-
cial turbulences on the Luxembourg banking system.
These analyses have been published in the BCL’s Finan-
cial Stability Review in April 2008.
Albeit being primarily oriented towards private ban-
king and investment fund business, the Luxembourg
banking sector had to face indirect negative effects
emanating from the international financial turbulen-
ces. Despite the less favourable international environ-
ment, the Luxembourg banking sector proved relati-
vely resilient on an aggregate level due in particular
to the high performances of the previous years and
robust solvency ratios. A few individual banks have
been affected by the crisis in a more pronounced way.
The financial turmoil has highlighted risks related to
complex financial instruments, evaluation and trans-
parency issues and how fast liquidity problems can
propagate across the international financial system.
It has also pointed to the need for increased coope-
ration between central banks and supervisors at the
national and international level.
Looking ahead, perspectives for 2008 remain uncertain
at the international level. Banks may have to face po-
tential further write-downs, higher refinancing costs,
declining revenues from structured investment activi-
CHART 17 :
CoRRESPoNDENT CENTRAL
BANKS IN 2007
CHART 18 :
HoME CENTRAL BANKS IN 2007
Source: ECB
2. THE BCL'S OPERATIONS
BC
L A
nn
uA
l R
Ep
oR
t 2
00
7
108
ties and investment banking in general, potential new
vulnerabilities as well as the impact from a less favo-
rable macro economic environment.
Specific analytical work carried out in 2007 includes
total factor productivity, z-core index, risk aversion
indicator, extraction of investor’s expectations through
option prices, and the update of the vulnerability index
of Luxembourg banking sector.
As a member of the European system of central banks, the
BCL participates to the Banking Supervision Committee
(BSC) and its sub-structures as well as in the work of the
Committee of European Banking Supervisors (CEBS).
2.7.2 The oversight of payment and securities settlement systems
In 2007, the BCL has pursued its oversight activities of
payment and securities settlement systems.
The scope of its oversight covered the securities settle-
ment system operated by Clearstream Banking Luxem-
bourg and Lips-Gross, the real time gross payment
system, until November 2007, date of its migration
to Target2. Following this migration, Lips-Gross has
been denotified with the European Commission in the
context of the settlement finality Directive and Target2-
LU, the Luxembourg legal component of Target2, has
been notified. The oversight of the centralised features
of Target2 is performed centrally at the level of the
European system of central banks. A first assessment
of the Target 2 design has been finalised in 2007.
The BCL also contributes to the work of the Payment
and Settlement Systems Committee of the ESCB and
its sub-structures. In this context, a framework for
the oversight of euro card payment schemes has been
designed and an assessment of these schemes will
start in 2008. Discussions are going on as regards the
oversight of other payment instruments.

BC
L A
nn
uA
l R
Ep
oR
t 2
00
7
109


BC
L A
nn
uA
l R
Ep
oR
t 2
00
7
111
3. External activities
3.1 Activities with the International Monetary Fund (IM) and other organisations
The BCL President, being also Alternate Governor of
the IMF, attended the Annual Meeting of the IMF
and the meetings of the International Monetary and
Financial Committee.
The BCL handles Luxembourg’s financial transactions
with the IMF. For this purpose, it manages Luxem-
bourg’s assets and liabilities vis-à-vis the IMF in both
the general account and the special drawing rights
(SDR) account. As at 31 December 2007, Luxembourg’s
quota, recorded in full on the BCL’s balance sheet,
amounted to SDR 279.1 million, whereas the reserve
position (the difference between Luxembourg’s total
quota at the IMF and the euro-denominated assets
held by the IMF at the BCL) represented 6.71% of
Luxembourg’s quota.
The IMF’s operational budget defines the currencies
to be made available to its members on a quarterly
basis and the distribution of reimbursements among
its members. During 2007, the BCL did not grant any
credits related to IMF operations and was reimbursed
to the tune of €11.8 million.
At the end of 2007, Luxembourg held 75.2% of its SDR
allocation (72.1% in 2006) following the accumulation
of net interest received on the SDR account and on the
reserve position. As at 31 December 2007, the amount
recorded on the SDR account was SDR 12.8 million.
One BCL staff member is on secondment to the IMF.
The BCL also attended the meetings of several working
groups at the Organisation for Economic Cooperation
and Development (OECD) and at the Bank for Interna-
tional Settlements (BIS), contributing, in particular, to
the work of the OECD’s Financial Markets Committee
(FMC) and that of the BIS’ Committee on the Global
Financial System (CGFS).
The BCL President attended the BIS Annual General
Meeting.
3.2 Activity at the European level
3.2.1 Activity at the level of the ECB
During 2007 the Governor of the BCL participated in
all meetings of the Governing Council and the General
Council.
3.2.2 The Lisbon Treaty and the enlar-gement of the euro area
The Treaty of Lisbon, amending the Treaty on Euro-
pean Union and the Treaty establishing the European
Community, was signed in the Portuguese capital on
13 December 2007. The Treaty was intended to enter
into force on the first of January 2009, subject to ra-
tification by all Member States. Otherwise, the Treaty
of Lisbon will enter into force on the first day of the
month following ratification by the last Member State.
On May 29, 2008, Luxembourg became the 15th Mem-
ber State to ratify the Treaty.
On January 1, 2008, exactly one year after Slovenia,
Cyprus and Malta introduced the euro, bringing the
number of Member States having adopted the single
currency to 15. On that date the central banks of
Cyprus and Malta fully integrated the Eurosystem.
3.2.3 The Economic and Financial Committee
A BCL representative participates in meetings of the
Economic and Financial Committee (EFC). The Commit-
tee is composed of representatives from the finance
ministries and central banks of EU Member States, the
European Commission and the ECB. According to the
Treaty, one of the tasks of the EFC is to “review the
economic and financial situation of the Member States
and of the Community and to report regularly thereon
to the Council and to the Commission”.
The EFC contributes to multilateral surveillance in order
to monitor the compliance of Member States’ economic
policies with the broad economic policy guidelines
and with the Stability and Growth Pact. Thus, the EFC
examines the stability Programmes of the eurozone
3. EX TERNAL ACT IV IT I ES
BC
L A
nn
uA
l R
Ep
oR
t 2
00
7
112
Member States and the convergence Programmes of
the Member States that have not yet adopted the euro.
The EFC also prepares the ECOFIN Council decisions
related to the excessive deficit procedure.
The EFC was briefed by the European Central Bank
on preparation of its “Target2-Securities” initiative
for the settlement in central bank money of securities
transactions in euro. It prepared the related Council
conclusions.
The EFC also discussed draft Council conclusions set-
ting out further steps, at both EU and national levels,
for the development of financial stability arrangements.
The conclusions include common principles for cross-
border financial crisis management and a roadmap
for enhancing cooperation and preparedness and for
reviewing the tools for crisis prevention, management
and resolution. Furthermore, the EFC reviewed the
Lamfalussy regulatory process for financial services and
drafted Council conclusions on this matter.
The EFC also drafted Council conclusions on statis-
tics, covering information requirements under the EU’s
economic and monetary union (EMU), reduction of
the statistical burden on businesses, governance in
the field of statistics and the communication of major
statistical revisions.
The EFC also works on economic policy issues discussed
at informal ECOFIN meetings, which are attended by
the BCL’s President.
The EFC meets six times a year in plenary session, but
also meets in restricted composition. It is worth noting
that the ECB participates in the Eurogroup Working
Group, where it represents the Eurosystem.
3.2.4 The Committee on Monetary, Financial and Balance of Payments Statistics
In the context of the mission of the Statistical Office of
the European Communities (Eurostat), the Committee
of Monetary, Finance and Balance of Payments Statis-
tics (CMFB) works on the development and coordina-
tion of statistics categories that are required under the
policy implemented by the Council, the Commission
and various committees assisting them. Central Banks,
National Statistics Institutes as well as the Commission
and the ECB are represented in the CMFB. Under the
leadership of this Committee, different “task forces”
operate with specific duties assigned to them. The BCL
has contributed actively in 2007 to this framework. Pro-
gress has been made particularly in terms of financial
accounts, balance of payments, financial services and
public finance statistics as well as national accounts.

BC
L A
nn
uA
l R
Ep
oR
t 2
00
7
113
3.3 National activities
3.3.1 Legal developments
During the year, the BCL followed the legislation and
regulation concerning its field of activity just as other
texts of importance for Luxembourg.
3.3.1.1 Revisions of the organic law of the BCL
The organic law of the BCL has been revised on 13 July
2007 by the enactment of the law on markets in finan-
cial instruments1. Besides the Luxembourg government,
the legislative process involved the European Central
Bank2, the BCL3 and the State Council4. As announced
in the annual report of last year, the revision consists
of three points formulated in Article 172 of the afore-
mentioned law.
The financial collateral
.2force on 1 January 2007 of the obligation incumbent
on the central banks of the Eurosystem to accept credit
claims as securities for loans that they grant.
The former situation −
Prior to the entry into force of Article 172 of the law
of 13 July 2007 on markets in financial instruments5,
the creation of a pledge on credit claims was governed
by Article 5, third paragraph, of the law of 5 August
2005 on financial collateral arrangements, by virtue of
which the creation of pledge on a credit claim is valid
and enforceable against third parties upon the creation
1 law of 13 July 2007 on markets in financial instruments, which mainly aimed at implementing the Directive on markets in financial instruments (referred to as the «MiFID») Mémorial A – n°116 of 16 July 20072 opinion of the European Central Bank of 11 December 2006 at the request of the luxembourg Ministry of Finance on a draft law on markets in financial instruments (Con/2006/56), available on the website of the ECB (www.ecb.int)3 observations from the Banque centrale du luxem bourg on Article 172 on the draft law on markets in financial instruments, 1 February 2007, available on the website of the BCl (www.bcl.lu)4 opinion of the State Council of 3 July 2007 on the draft law 56275 Mémorial A, 16 July 2007, n°116, p. 2076.
being notified to the debtor of the pledged claims or
being accepted by the latter.
At that time the BCL adapted their general terms and
conditions by mainly establishing the recourse to a
Master pledge agreement for credit claims, which was
in line with the provisions applicable to pledges as set
out in the law of 5 August 2005 on financial collateral
arrangements. The mechanism put in place established
that the banker-pledgor should notify the creation of
the pledge to the debtor and that he was authorised to
continue exercising the rights deriving from its claim,
without prejudice to the rights of the BCL as benefi-
ciary of the pledge. The cross-border use of claims was
also catered for by some of the provisions.
The entry into force of Article 22-1 −
The functioning of the mechanism put in place has
been improved by the adoption of the law of 13 July
2007 on markets in financial instruments which nota-
bly aimed at modifying the organic law of the Banque
centrale du Luxembourg of 23 December 1998 by in-
troducing a new Article 22-1 whose purpose was to
clarify the rules governing the creation of a pledge on
credit claims in favour of the BCL6. Such provision aims
at ensuring an efficient implementation of the new ru-
les of the Eurosystem on eligible assets, which include
credit claims in the list of eligible assets7.
A transitional regime prevailed until the 1 September
2007, date on which Article 22-1 entered into force,
whereas the law of 13 July 2007 only entered into force
on 1 November 2007. Indeed, the legislator established
that the pledge agreements on claims concluded before
the entry into force of Article 22-1 would be recorded
in the register on the date of such entry into force
6 Since 1999, the BCl has essentially recourse to the technique of pledge for operational reasons. not withstanding the wording of Article 22-1, the BCl is not limited in its selection of the type of security to be used. If it deems it opportune, it may decide to have recourse to other techniques governed by the law of 5 August 2005 on financial collateral arrangements.7 the ECB in its opinion of 13 December 2006 stated that it was favourable to such new provision.

3. EX TERNAL ACT IV IT I ES
BC
L A
nn
uA
l R
Ep
oR
t 2
00
7
114
without the initial date of recording being affected.
Nonetheless, the effects described in paragraph (4) of
Article 22-1, as set out hereinafter, only apply as from
the date of recording.
The new enforceability rules −
Article 172 of the law of 13 July 2007 introduces
in the organic law of the BCL an Article 22-1 which
creates a sui generis method of perfection and en-
forceability for pledges of claims used as security for
loans granted by the BCL. The law of 13 July 2007
creates a register where pledges of claims in favour
of the BCL are recorded. The sole entry in the register
of a pledge on a claim in favour of the BCL renders
the pledge effective against all third parties. In doing
so, the formality of the notification required in order
to render the pledge enforceable and to perform
the dispossession of the pledged object is abolished.
Moreover, such notification ensures that the BCL’s
rights in respect of such claim have priority over any
other rights created in favour of third parties after
such entry. If a third party receives a payment from
the debtor of a claim previously pledged to the BCL
through an entry in the registry, this third party must
transfer the amount to the BCL. Furthermore, no
compensation may result in undermining the security
granted to the BCL on such claims.
Paragraph (4) of Article 22-1 which establishes the
principle of the primacy of the collateral received by
the BCL and recorded in the register, is directly inspired
from a provision proposed in Belgium in order to ensure
the practical efficiency of the pledges provided to the
Banque Nationale de Belgique8.
It has to be mentioned that the common regime appli-
cable to financial collateral is in no way affected by the
law of 13 July 2007. Hence, solely a new enforceability
procedure against third parties is established in favour
of the BCL.
The maintenance of the register −
Thus, by virtue of Article 22-1 (2), the BCL is in charge
of maintaining a register of the pledge agreements on
8 Belgian law of 20 July 2006 bearing divers provisions, Chapter VII – Modification of the law of 22 February 1998 establishing the organic statute of the Banque Nationale de Belgique (Moniteur belge of 28 July 2006 – Ed. 2, page 36950).
claims which it accepts as security for its credit ope-
rations. Moreover, it is the responsibility of the BCL
to define the functioning rules of the register as well
as the related costs recovery rules. To that purpose,
a certain number of modifications had to be made to
the General Terms and Conditions of the BCL and more
precisely to the Conditions générales des operations,
annexes 8 Manuel de procédures des opérations, 10
Tarifs des opérations and 14 Master pledge agreement
for credit claims as well as to the Additional Terms and
Conditions of Banque centrale du Luxembourg when
acting as CCB and as assisting NCB for claims.
Such modifications aimed at:
Complementing the procedures governing the use of i.
credit claims as security by adding provisions relating
to the functioning conditions of the register,
Clarifying the effects of the entry to the register as ii.
regards the obligation to notify the debtor,
Defining the conditions of the consultation of the iii.
register,
Establishing the transaction fees relating to the iv.
pledged claims,
Determining the consultation fees of the register, v.
Requiring the fulfilment of additional formalities when vi.
the debtor is not established in Luxembourg, and
Adapting the legal and operational requirements vii.
applicable to the mobilisation of a claim.
The obligation of entry into the register is applicable
in an exclusive manner. The counterparties which want
to pledge credit claims do not have any other choice
than using the register.
The publicity of the register −
The law of 13 July 2007 establishes the principle of the
access of third parties to the register. The conditions of
such access are determined by the BCL in its General
Terms and Conditions, as well as in the document enti-
tled Registre des contrats de gage de créances: informa-
tion à destination des tiers available on the website of
the Banque centrale du Luxembourg. The BCL considers
that the access to the register is only possible for third
parties having a legitimate interest.
The cross-border mobilization of credit claims −
The mechanism instituted by the law of 13 July 2007
also covers the situations in which the BCL acts as agent

BC
L A
nn
uA
l R
Ep
oR
t 2
00
7
115
of other central banks of the Eurosystem in respect of
the cross-border creation of securities for the credit
operations of the Eurosystem. The issues of international
private law are currently catered for by internal mecha-
nisms specific to the Eurosystem which are disclosed on
the websites of the national central banks.
3.3.1.2 Legal rate of interest
The rate was fixed at 5.25 per cent for the year 2007
by a grand-ducal regulation of 22 December 2006
(published in the Mémorial A no. 237 of 29 December
2006). For 2008, this rate has been fixed at 5.75 per
cent by a Grand-Ducal regulation of 13 December
2007 (published in the Mémorial A no. 226 of 19 De-
cember 2007). It is observed that these rates, being
determined by regulatory means, do not correspond
to specific rates of reference of the money or capital
markets.
3.3.2 External committees
3.3.2.1 The Economic Committee (Comité de conjoncture)
The Economic Committee acts on the basis of the
legislation which authorises the government to take
measures to stabilise employment and growth. Thus,
the Committee provides a framework for examining bu-
siness cycle fluctuations in the country’s economy and
for monitoring economic policy issues as they arise.
The BCL belongs to the Economic Committee for two
reasons: it collects information on Luxembourg’s cyclical
position and it contributes to the Committee’s work by
monitoring and commenting on the latest developments
in the monetary domain and in the financial sector.
3.3.2.2 The Consumer Price Index Commission (Commission de l’indice des prix à la consommation)
The BCL has observer status at the meetings of the
Consumer Price Index Commission (CPIC), which is in
charge of advising and assisting STATEC in the prepa-
ration of consumer price indices. This Commission also
issues technical opinions on the design of the monthly
consumer price index and supervises the compliance
of this index with national and European regulations.
The BCL presents its inflation projections for Luxem-
bourg to the CPIC and provides explanations related
to BCL work in the area of consumer prices.
3.3.2.3 Committee «Comptabilité bancaire»
The committee Comptabilité Bancaire set up by the
Commission de surveillance du secteur financier (CSSF),
aims to ensure an exchange of views between the su-
pervisory authority, the BCL and players of the Luxem-
bourg financial centre. The committee is consulted
during the preparation CSSF circulars concerning bank
accounting issues.
The committee members met several times in 2007 to
discuss the implementation of the accounting stan-
dards IAS / IFRS, the new regulatory capital adequacy,
financial reporting (FINREP) and the common reporting
(COREP) defined by the Committee of European Ban-
king Supervisors.
3.3.2.4 Higher Council for Statistics of Luxembourg
The Higher Council for Statistics carries out advisory
functions on behalf of the national statistical institute
of Luxembourg (STATEC) and is mandated to provide
appraisal on the STATEC’s annual Programme.
The BCL contributes in two ways to the work of the Hi-
gher Council for Statistics: on the one hand, it provides
its opinion on the documents elaborated during mee-
tings and submitted to it and, secondly, it provides the
STATEC with data collected on the financial centre to
enable the STATEC to achieve its work Programme.
3.3.2.5 XRBL Luxembourg asbl
XBRL (eXtensible Business Reporting Language) is a
standard financial reporting based on XML whose main
objective it is to improve the correct character, transpa-
rency and efficiency of internal and external reporting.
The non-profit association XBRL Luxembourg inclu-
des some twenty organisations using XBRL and / or
providing services related to XBRL technology.

3. EX TERNAL ACT IV IT I ES
BC
L A
nn
uA
l R
Ep
oR
t 2
00
7
116
The role of the association is to promote the XBRL
standard within the Luxembourg economy.
The BCL, as a founding member of XBRL Luxembourg,
will adopt the XBRL standard in the context of repor-
ting statistics it collects from companies of the Luxem-
bourg financial sector.
3.3.3. BCL Committees
The BCL committees gather experts that advice the
Bank in some specific domains of its activity.
In 2007, there were 8 committees.
3.3.3.1 The Statistics committee
The Statistics Committee has been set up by the BCL to
ensure a constant dialogue between the actors of the
financial centre that are subject to statistical reporting
requirements and the main users of these data.
During 2007, the committee’s advice has been sought
for the definition of a security by security reporting
for credit institutions and undertakings for collective
investment (UCIs) as well as for the new data collection
for investment funds.
3.3.3.2 The Monetary and financial statistics consultative commission
The Monetary and Financial Statistics Consultative
Commission has been set up by the BCL to enhance
the dialogue between reporting agents and the central
bank. The commission also ensures the efficiency of
the reporting procedures in the area of monetary and
financial statistics.
During 2007, the Commission has been informed and
consulted on various conceptual issues in relation with
the introduction of a new statistical data collection
for financial intermediaries (non-monetary UCIs), the
security by security reporting fro is and undertakings
for collective investment as well as for the revision of
the statistical data collection for monetary financial
institutions.
3.3.3.3 The Balance of payments statistics consultative commission
The Balance of payments statistics consultative com-
mission acts as an advisory group and assists the BCL
in its mission to collect data in the areas of balance
of payments and international investment position.
The Commission ensures the up keeping of an effi-
cient organisation of the data collection so as to avoid
redundancies and to limit the collection charge for the
entities requested to submit statistical data.
During 2007, the Commission has been consulted in
the framework of the finalisation of the instructions
on security by security collection as well as for the
increase of the exemption threshold from 12 500 euro
to 50 000 euro.
3.3.4 Training at the BCL
The internal training courses at the BCL cover essentially
the Bank’s areas of expertise such as monetary policy,
payment and settlement systems, financial stability and
European institutional matters. Such courses can be
given to outsiders upon demand and depending on the
availability of lecturers.
The BCL furthered its cooperation with the young Uni-
versity of Luxembourg where a staff member gave lec-
tures on institutional aspects of the Eurosystem. Other
staff members taught economics at the Université ca-
tholique de Louvain, at the Fachhochschule Trier and at
the Dolibois European Campus of the Miami University
(MUDEC) in Luxembourg.
The BCL is shareholder of the Agence de Transfert de
Technologie Financière (ATTF). This agency, established
in 1999 at the initiative of the Luxembourg govern-
ment, shares with emerging countries Luxembourg’s
know-how in financial matters. In the context of ATTF
seminars, the BCL held a presentation for managers of
the People’s Bank of China and the Shanghai Pudong
Development Bank in June 2007. In July 2007 the BCL
held a lecture for bankers from Uzbekistan participating
in the ATTF’s Summer Executive Programme.

BC
L A
nn
uA
l R
Ep
oR
t 2
00
7
117
In May 2007 a staff member of the BCL participated in
a technical assistance mission organised by the World
Bank for the State Bank of Vietnam, Vietnam’s central
bank. The purpose of this mission was to review the
legal and institutional framework in which the State
Bank of Vietnam operates.
In September 2007, the BCL gave for the third consecu-
tive year a presentation for senior Indian managers on
the occasion of a visit jointly organised by the Adminis-
trative Staff College of India and the Maastricht School
of Management.
3.3.5 External events
3.3.5.1 Conferences and international meetings
The Governor of the BCL attended the Spring Mee-
tings as well as the Annual Meetings of the IMF and
the World Bank in October 2007 in Washington. In
April 2007 the Governor of the BCL was the key-note
speaker of The Transatlantic Roundtable on Finance
and Monetary Affairs organised by the European Insti-
tute on the topic of “The US, the Eurozone and Global
Financial Markets”.
The Governor of the BCL also participated in the
half-yearly informal ECOFIN Council of Ministers Mee-
tings.
In May 2007, the Governor of the BCL took part in
the 15th annual meeting of the governors of French-
speaking countries in Switzerland and held a presen-
tation about human resources management. End of
June the Governor of the BCL attended the festivities
celebrating the 100th anniversary of the Swiss National
Bank and the annual general assembly of the Bank for
International Settlements in Basel.
The Bridge - Forum Dialogue, the President of which is
the Governor of the BCL and which is made up of the
executives of the European and national institutions
in Luxembourg and the live forces of the country, or-
ganised a conference on 25 April 2007 on “Research
Policy in the European Union”. Speakers were Janez
Potoçnik, European Commissioner for Science and
Research, Rolf Tarrach, President of the Université de
Luxembourg, Michael Sohlman, Executive Director of
the Nobel Foundation and Lars Heikensten, member
of the European Court of Auditors.
In February 2007, the Governor of the BCL took part in
a Eurosystem seminar with the central banks of west
and central Africa, jointly organised by the Banque de
France and the ECB. The seminar provided a platform
for multilateral dialogue among governors on regional
economic integration, the impact of commodity price
developments on monetary and fiscal policies and the
governance of central banks.
In March 2007. the Governor of the BCL took part
in the fourth Euro-Mediterranean seminar, which
brings together Eurosystem and non-euro area Me-
diterranean central banks. The seminar, which was
jointly organised by the Banco de España and the
ECB, focused on recent economic and financial deve-
lopments in Mediterranean countries, fiscal policy in
Mediterranean countries’ macroeconomic frameworks
and the recent developments and prospects for Euro-
Mediterranean trade.
On the cultural scene, the BCL inaugurated on 12
January 2007 the exhibition “Greek coins - Celtic
coins” in the presence of Governors Yves Mersch,
Guy Quaden, National Bank of Belgium, and Nicho-
las C. Garganas, Bank of Greece. This exhibition was
organised by the BCL and the Bank of Greece with
the assistance of the Cabinets des Médailles de la
Bibliothèque royale de Belgique, the Musée national
d’Histoire et d’Art (Luxembourg) and the Embassy of
the Hellenic Republic in Luxembourg, The exhibition
displayed classic Greek coins, Greek coins used in eve-
ryday life as well as Celtic coins used in Luxembourg
and neighbouring regions.
3.3.5.2 Bilateral relations
On 26 February 2007, the Governor of the BCL received
Mr. Ardian Fullani, Governor of the Bank of Albania for
a working visit.
The Governor of the BCL participated in May 2007 in
the fourth Islamic Financial Services Board Summit,
organised on the topic of “The Need for a Cross-

3. EX TERNAL ACT IV IT I ES
BC
L A
nn
uA
l R
Ep
oR
t 2
00
7
118
the Executive Board of the BNB, were received at the
BCL in July 2007 for a working meeting between the
executive boards of the two central banks. The meeting
focused on cooperation in the areas of bills and coins
financial stability, the collateral system for credits and
international relations.
On the invitation of the Governor of the Central Bank
of Algeria, Mr Mohammed Laksaci, the Governor of
the BCL visited Algeria in July 2007 and held a speech
on financial regulation « Principles versus rules ».
In September 2007 the Governor of the BCL accompa-
nied the Luxembourg Prime Minister during an official
visit to Estonia and Bulgaria.
Upon invitation by the Governor of the central bank of
Cape Verde, Mr Carlos de Burgo, the Governor of the
BCL made a working visit to Cape Verde in September
2007. During this visit the Governor of the BCL held
discussions with the President of the Republic, the
Minister of Finance and Public Administration and the
Governor of the Central Bank of West African Sta-
tes. Governor Mersch held a speech on the topic of
"The development of a financial system in the light of
Luxembourg’s experience".
During a seminar concerning the introduction of the
euro which was held in Prague in October 2007, the
Governor of the BCL held a presentation “Not only
financial markets benefit from the euro – Relevance
of Luxembourg’s experience for the new members of
the euro zone”.
During his official visit to Luxembourg, Mr Justin Damo
Baro, Governor of the Banque centrale des Etats de
l'Afrique de l'Ouest (The Central Bank of West African
States), accompanied by an official delegation, was
received by the Governor of the BCL in November 2007.
The discussions focused on the role of central banks
with respect to micro-finance, risk management and
private sector supervision.
The BCL was also represented at the fourth Joint Hi-
gh-Level Eurosystem – Bank of Russia Seminar held in
October 2007 in Moscow. The purpose of the seminar
was to further strengthen the dialogue and to enhance
relations between the Bank of Russia and the Eurosystem,
Sectoral Approach to the Supervision of Islamic Finan-
cial Services” in Dubai. He chaired a discussion panel
on “The relevance of a cross-sectoral approach to the
supervision of Islamic Financial Services- recent Expe-
rience and Prospects”.
Within the context of an official visit to Luxembourg,
the Governor of the BCL received in June 2007 the
Prime Minister of Laos, H.E. Mr B. Bouphavanh, accom-
panied by an official delegation, for a working visit.
This was followed by the visit of Mr T. Thammavong,
President of the National Assembly of the People’s
Democratic Republic of Lao in November 2007.
In 2007 the annual meeting between the BCL and the
Belgian national Bank (BNB) took place in Luxembourg.
These meetings provide an opportunity to strengthen
the bilateral cooperation between the two central
banks. Upon invitation by the Governor of the BCL,
Mr Guy Quaden, Governor of the BNB, accompanied
by Mr Luc Coene, Vice-governor and other members of

BC
L A
nn
uA
l R
Ep
oR
t 2
00
7
119
which have intensified in recent years. The main issues
addressed at the seminar pertained to the current
state of the Russian economy and the challenges for
monetary policy as well as to the enlargement of the
European Union and its implications for the Russian
Federation.
In March 2007 the BCL organised a visit for a delega-
tion from the Democratic Republic of Vietnam, mainly
consisting of representatives from the State Bank of
Vietnam. The first days of this visit were devoted to a
presentation of the BCL’s activities.
3.3.5.3 Relations with the Luxembourg Parliament
On 20 November 2007, the BCL’s Governor presented
the opinion of the Bank on the state budget motion
to the Financial and Budget Commission of the Luxem-
bourg Parliament.

3. EX TERNAL ACT IV IT I ES
BC
L A
nn
uA
l R
Ep
oR
t 2
00
7
120
R − ésumé non technique du cahier d’études « Taux
d’intérêt de détail au Luxembourg : une étude au
niveau agrégé et au niveau individuel »
Résumé non technique du cahier d’études « Un −
indicateur d’activité pour le Luxembourg »
Articles are published in their original language.
3.4.3 Working papers
In its working papers the BCL publishes the results of
research conducted by its staff. Each working paper
contains a non-technical summary. In 2007, five wor-
king papers were published:
N° 24 : Mesure de la vulnérabilité du secteur bancaire −
luxembourgeois, by Abdelaziz Rouabah, April 2007
N°25: Co-variation des taux de croissance sectoriels au −
Luxembourg : l’apport des corrélations conditionnelles
dynamiques, by Abdelaziz Rouabah, April 2007
N°26: Commuters, residents and job competition in −
Luxembourg, by Olivier Pierrard, May 2007
N°27: Banking output and price indicators from quar- −
terly reporting data, by Abdelaziz Rouabah and Paolo
Guarda, June 2007
N°28 : An analysis of regional commuting flows in the −
European Union, by Jordan Marvakov and Thomas Y.
Mathä, November 2007
3.4.4 The BCL’s website
The BCL’s website, www.bcl.lu, provides information
about the Bank’s activities and services, its internal or-
ganisation, as well as statistics about Luxembourg and
the Eurosystem. It also contains links to other central
banks of the ESCB and to the ECB’s website.
Based on its search engine and its configurable mailing
list, the site offers to each visitor a clearly structured
information package, suitable for professionals as well
as private individuals.
All BCL publications can be viewed and downloaded
from the Publications section at www.bcl.lu. Hard
copies are available from the BCL on request, as long
as stocks last.
3.4 Communication Activities
3.4.1 Annual reports
As required by its statutes, the BCL publishes each year
a report on its activities. This annual report is published
in French and in English.
3.4.2 Periodical Bulletins
Beside its presentations on the economic and financial
situation in Luxembourg and bulletins issued on current
topics, the following papers and analyses have been
published.
Financial Stability Review:
Mesure de la vulnérabilité du secteur bancaire −
luxembourgeois
Co-variation des taux de croissance sectoriels au −
Luxembourg : l’apport des corrélations condition-
nelles dynamiques
Analyse long terme du compte de profit et pertes −
des établissements de crédit luxembourgeois
Bank’s liquidity management regimes and inter- −
bank activity in a financial stability perspective
Securities lending −
Bulletin No 2007/1
Un indicateur d’activité pour le Luxembourg −
Présentation désagrégée des finances publiques : −
application au Luxembourg
Aktuelle Qualitätsmesszahlen zur Luxemburger Za- −
hlungsbilanzstatistik
Nicht-technische Zusammenfassung des Arbeitspa- −
piers “Eine Analyse regionaler Pendlerströme in der
Europäischen Union“
Bulletin 2007/2
La position extérieure globale du Luxembourg −
Le marché de change et des produits dérivés −
luxembourgeois dans le contexte international
Analyse de l’évolution du secteur des OPC au −
plan international et au Luxembourg

BC
L A
nn
uA
l R
Ep
oR
t 2
00
7
121
The website exists in English and French: Publica-
tions are displayed in their original language (English,
French or German).
3.4.5 The library
The library, opened in 2005, uses the ALEPH library
management systems as do a number of other cen-
tral banks. The library is open to the public upon
request, either by fax (+352 4774 4910), or by e-mail
3.4.6 Press relations
In 2007, six press conferences were held. They were
related to BCL publications, the presentation of the
Bank’s financial results as well as the participation
of representatives from the financial centre in the
Islamic Financial Services Board Summit in Dubai.
A total of 84 press releases were published.
In October 2007, the BCL organised seminars for mem-
bers of the Luxembourg press. These seminars covered
monetary policy, payment and settlement systems,
financial stability and European institutional matters.


BC
L A
nn
uA
l R
Ep
oR
t 2
00
7
123
4. The BC L as an organisation
4.1 The Council and the Executive Board
4.1.1 The Council
Article 6 of the Founding Law of 23 December 1998
defines the powers of the Council of the Bank. In 2007,
the Council consisted of the following members:
Governor: Yves Mersch Members: Andrée Billon Jean Hamilius Pit Hentgen Mathias Hinterscheid Serge Kolb Patrice Pieretti Jacques F. Poos Michel Wurth
The Council also observed and commented on econo-
mic and financial developments on a national and inter-
national basis and was kept informed of the decisions
taken by the Governing Council of the ECB.
The Audit Committee
Created by the Council in 2001, the Audit Committee’s
objective is to assist the Council in its choice of the
statutory auditor to be proposed to the Government,
in specifying the scope of the potential specific controls
to be performed by the statutory auditor and in the
approval of the financial accounts by the Council. It is
kept informed on the internal audit plan. It may invite
the head of the internal audit unit and the statutory
auditor of the Bank to participate in its work.
At its meeting on 13 December 2007, the Council no-
minated the non-executive members of the Audit Com-
mittee for 2008: Mr Pit Hentgen, Mr Patrice Pieretti
and Mr Jacques F. Poos. Mr Yves Mersch is an ex officio
member in his capacity as President of the Council. The
Audit Committee is chaired by Mr Pit Hentgen.
The Audit Committee held six meetings in 2007.
4.1.2 The Board of Directors
The Board of Directors is the superior executive autho-
rity of the BCL. It takes the decisions and draws up
the measures necessary for the Banque centrale du
Luxembourg to carry out its tasks.
Without prejudice to the independence of the Director-
General with regard to all instructions in his capacity
as a member of the Governing Council of the ECB,
the decisions of the Board of Directors shall be taken
collectively.
The Board of Directors consists of a Director-General
and two Directors:
Director-General: Yves Mersch Directors: Andrée Billon and Serge Kolb
During 2007, the Council held six meetings. Within
the framework of monitoring the financial situation of
the Bank, the Council approved the financial accounts
as per 31 December 2006, the budgetary trends and
subsequently, the budget and the organisation chart
of the Bank for the 2008 financial exercise.
Row 1, from l. to r.: Mr. pit Hentgen, Mr. Yves Mersch, Mrs Andrée Billon, Mr. Jean Hamilius; Row 2, from l. to r.: Mr. Jacques F. poos, Mr. Serge Kolb; Row 3, from l. to r.: Mr. Michel Wurth, Mr. Mathias Hinterscheid, Mr. patrice pieretti.

4. THE BCL A S AN ORGAN ISAT ION
BC
L A
nn
uA
l R
Ep
oR
t 2
00
7
124
THE BCL’S oRGANISATIoN CHART 2007
Executive Board
Executive Board Secretariat
unit unit General Secretariat
Internal Audit oR - organisation and Controlling GS - General Secretariat
Sections
GS1 Governor's officeGS2 legal ServicesGS3 External Relations and Communication
General Departments
General Department A General Department B General Department C
Sections
B0.1 procurement
Department Department Department
A1 - Economics and Research B1 - Human Resources C1 - IT
Sections Sections
A1.1 Monetary Analysis and Economic Research A1.2 Economic and Business Cycle Analysis
C1.1 Infrastructure C1.2 Software and DevelopmentC1.3 It Security, planning and Support
Department Department Department
A2 - Cashier's office B2 - Internal Finance C2 - Statistics
Sections Sections
A2.1 Cashier's ServicesA2.2 Banking Relations
C2.1 Banking and Monetary StatisticsC2.2 External StatisticsC2.3 Economic and Financial Statistics
Department Department Department
A3 - operations B3 - Numismatics and Logistics C3 - Financial Stability
Sections Sections Sections
A3.1 Front office A3.2 Investments A3.3 Back office - Securities A3.4 payments
B3.1 numismatics B3.2 Administration B3.3 Security
C3.1 Supervision and oversight C3.2 Market Infrastructures
The members of the Board of Directors receive a salary
according to the wage scale in the public sector as well as
different allowances. They receive, in accordance with the
legal provisions of the law of 22 June 1963 determining
the salary scheme for civil servants, a family allowance
depending on their domestic situation and a thirteenth
month’s allowance.
Besides, in relation to their function within the Bank,
board members are entitled to the payment of a re-
presentation allowance (for a total amount of 66 955
euro in 2007) and to a BCL’s Council allowance (for a
total amount of 31 390 euro in 2007).
The salary components are subject to the current legal
tax rates in Luxembourg. Contributions to the pension
system are neither due with regard to the thirteenth
month’s allowance nor with the representation and
BCL’s Council allowances.
The basic salary paid to the board members is as follows:
2007E
2006E
Yves Mersch (Director-General)
151 788 147 330
Andrée Billon (Director)
141 118 136 974
Serge Kolb (Director)
141 118 136 974
Total 434 024 421 278

BC
L A
nn
uA
l R
Ep
oR
t 2
00
7
125
4.2 The Corporate Governance
4.2.1 The restructuring of the BCL in 2007
Based on a detailed analysis of the existing structure by
a consulting company, the Executive Board decided to
change the internal organisation of the Bank, in order
to strengthen its efficiency and its accountability.
The internal reorganisation, which came into effect
on 1 May 2007 transformed the seven departments
into three general departments. In order to assist
the Executive Board in the decision making process,
an Executive Committee was created. It comprises
the Board members and the heads of the general
departments.
Senior management was granted more autonomy and
larger responsibilities, but with reinforced control me-
chanisms. To this end, new positions for a controller
and a compliance officer were created.
Concerning Eurosystem/ESCB matters, the main tasks
of the Eurosystem/ESCB Coordination Committee have
been restructured and are now performed by three
coordinators /experts. The Committee assists the Go-
vernor in his capacity as a member of the Governing
Council of the ECB.
Three other existing units have undergone no changes:
the Secretariat general, the Internal Audit and the
Organisation and Risk Management unit.
The new structure of the bank also lead to changes
within the general departments, i.e. various tasks being
reallocated among different sections and new sections
being created like a procurement office.
4.2.2 The internal supervisory mechanisms
The BCL’s internal supervisory system is based on
general rules and regulations, which are widely ac-
cepted as standards by the financial sector, and also
takes into consideration the BCL’s specific needs as
a central bank.
An initial internal supervisory system concerning the
general management of the BCL has been put in place
by the Executive Board. The senior management of
the BCL and their staff are responsible for the pro-
per functioning of this supervision. Some functional
checks are carried out by specific administrative units,
ensuring a separation of the tasks to be carried out
by the BCL.
The risk management section is now part of the Orga-
nisation and Risk Management unit. Whereas the senior
supervisors from the general departments are responsible
for identifying the risks linked to their fields of activities
and for taking appropriate actions to mitigate these risks,
the risk manager has the following responsibilities:
Establish a common methodology for risk analysis; −
Evaluate (quantify) the risks taken; −
Check whether risks are sufficiently mitigated; −
Deliver periodic reports to the Executive Board; −
concerning the general situation.
On a regular basis, the risk management section eva-
luates different types of risk (credit, liquidity, solvency,
funds, operational risk, IT risks) to which the Bank is
exposed and checks the mitigation measures.
Moreover, the section is in charge of controlling fi-
nancial risks linked to investment operations and the
analysis and follow-up of operational risks.
Daily and independently from the investment depart-
ment, it monitors and reports on the various invest-
ment positions within the portfolio of the bank.
The Controlling section, also managed by the Or-
ganisation and Risk management unit, includes the
following tasks:
Ensure the good execution of the budgetary pro- −
cedures
Supervise the execution of the budget −
Authorise certain expenditures and accounting −
Evaluate new activities −
4. THE BCL A S AN ORGAN ISAT ION
BC
L A
nn
uA
l R
Ep
oR
t 2
00
7
126
Provide budgetary and financial follow-up of projects −
Provide operational performance follow-up −
The purpose of the Compliance function is to assist the
central bank in managing its compliance risk, defined
as the risk the bank may suffer from as a result of its
failure to comply with all applicable laws, regulations,
codes of conduct and standards of good practice.
The scope of intervention of the Compliance Offi-
cer has been substantially enlarged. The Compliance
Officer is currently responsible for the implementa-
tion of the compliance policy of the central Bank. In
addition to the implementation of AML/CFT policies
and regulations, the scope of his function includes
ethics and integrity, the prevention of insider trading
operations, the prevention of misuse of confidential
information, compliance with internal procurement
rules and data protection. The Compliance Officer
has been certified as Data Protection Officer by the
Commission Nationale de Protection des Données in
November 2007.
The BCL’s strategic orientations are defined on the
basis of performance measurement according to the
Balanced Scorecard method and of the principles laid
out in the Official Stance, a document describing the
Bank’s positioning which has been approved by the
Council and published on the BCL’s website.
The Internal Audit analyses and evaluates, on the basis
of predefined objectives and a precise methodology,
the appropriateness and efficiency of the existing
supervision. Internal Audit is a supervisory unit inde-
pendent of the BCL’s other administrative units and
reports directly to the President of the Council.
The Head of Internal Audit may also be involved in the
work of the Audit Committee. Generally speaking, the
Internal Audit pursues the objectives and follows the
reporting procedure of the ESCB.
4.2.3 The external supervisory mechanisms
An initial external supervision of the BCL’s activities,
namely the checking of its accounts, is carried out
by the Bank’s independent external Auditor, who is
nominated yearly in a proposal sent by the Council
of the Bank to the government. At the request of the
Council, the independent Auditor carries out specific
complementary checks and analyses during the year. At
the European level, the Auditor of the Bank is approved
by the Council of Ministers upon the recommendation
of the Governing Council of the ECB. In this context,
the Auditor is given responsibility for particular tasks
with regard to the Eurosystem.
4.2.4 The code of conduct
In 2001, the BCL established a code of conduct, which
defines internal and external rules of conduct appli-
cable to all its staff. Without prejudice to public ser-
vice law, social legislation or pre-existing contractual
obligations, the code of conduct provides for ethical
standards based on nondiscrimination, solidarity, ef-
ficiency and independence which are to be strictly
observed by all staff members. The code of conduct
is currently being revised and a new version will be
available in 2008.
The ECB has required, since 2002, that all members
of the Governing Council observe a code of conduct
which lays down the highest standards of professional
ethics. The members are expected to act honestly, in-
dependently, impartially, with discretion and without
regard to self-interest and to avoid any situation liable
to give rise to a personal conflict of interests. They
must continue to abide by these standards for one year
after leaving office.
The code has been revised at the end of 2006. Partici-
pation in conferences, receptions or other events are
subject to clear conditions. Governors should carefully
handle personal invitations and their spouses or par-
tners should behave according to accepted standards
in international relations.

BC
L A
nn
uA
l R
Ep
oR
t 2
00
7
127
4.2.5 The Eurosystem Procurement Co-ordination Office (EPCO)
In December 2007, the Governing Council of the ECB
decided that the BCL should host and implement
the Eurosystem Procurement Co-ordination Office
(EPCO).
EPCO has been mandated with three main tasks :
co-ordinating the Eurosystem procurement −
agenda ;
facilitating the adoption of best practices within −
the Eurosystem ;
developing the infrastructure to enable the poo- −
ling of purchasing power.
4.3 The BCL staff
4.3.1 Quantitative evolution
During 2007, the BCL staff increased by 5.3 % to reach
a total of 219 members of staff on 31 December 2007,
equivalent to 204.5 full time positions and represen-
ting a 6 % increase compared to 2006. Staff members
are of ten different nationalities, thus contributing to
the diversity of the human capital and to its cultural
enrichment.
On December 31, 2007, twenty-five staff members
worked part-time:
Part-time work (50%) : − 10 staff members
Part-time work (75%) : − 8 staff members
Leave for part-time work : − 7 staff members
Three staff members were on full-time parental leave and
two staff members were on part-time parental leave.
Finally, two staff members were on unpaid leave on this
date and two staff members were on special leave.
The average number of staff members working at the
BCL in 2007 was of 211, compared to 206.5 in 2006.
The overall approved headcount for the year 2007 was
of 217 full time equivalent positions. This ceiling was
increased to 226 full time equivalent positions for the
year 2008.
During 2007, six staff members left the BCL while
eighteen new staff members joined the Bank. The BCL
received 300 spontaneous job applications and 210
applications for internships or student jobs.

4. THE BCL A S AN ORGAN ISAT ION
BC
L A
nn
uA
l R
Ep
oR
t 2
00
7
128
The average age of BCL staff members has slightly
increased from 38.8 years in 2006 to 39.3 years on
December 31, 2007. On this date, the staff counted
35 % females and 65 % males.
CHART 1:
STAFF MEMBERS By NATIoNALITy
CHART 3:
EvoLuTIoN IN STAFF NuMBERS SINCE 1998
CHART 2:
DISTRIBuTIoN oF STAFF MEMBERS PER AGE GRouP
Luxembourgish 57.53 %
Belgian 14.16 %
French 17.81 %
German 5.02 %Others 5.48 %
7
<2020-2425-2930-3435-3940-4445-4950-5455-60
>60
Male Female
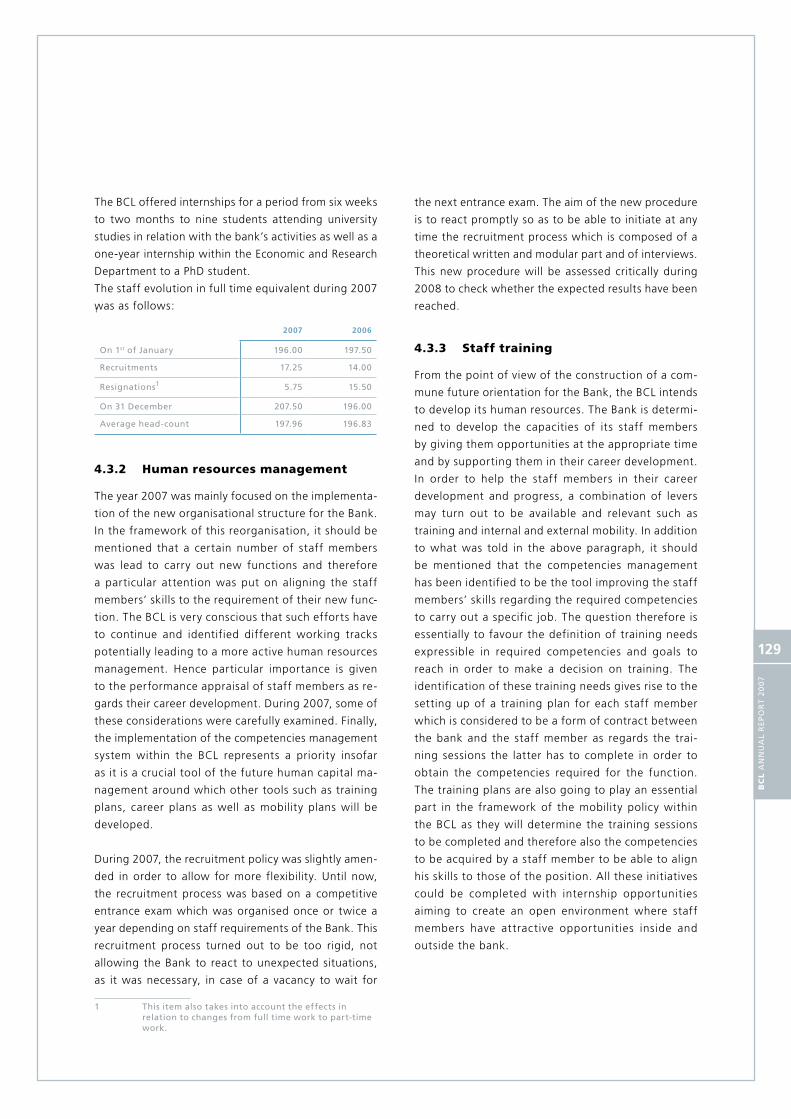
BC
L A
nn
uA
l R
Ep
oR
t 2
00
7
129
The BCL offered internships for a period from six weeks
to two months to nine students attending university
studies in relation with the bank’s activities as well as a
one-year internship within the Economic and Research
Department to a PhD student.
The staff evolution in full time equivalent during 2007
was as follows:1
2007 2006
on 1st of January 196.00 197.50
Recruitments 17.25 14.00
Resignations1 5.75 15.50
on 31 December 207.50 196.00
Average head-count 197.96 196.83
4.3.2 Human resources management
The year 2007 was mainly focused on the implementa-
tion of the new organisational structure for the Bank.
In the framework of this reorganisation, it should be
mentioned that a certain number of staff members
was lead to carry out new functions and therefore
a particular attention was put on aligning the staff
members’ skills to the requirement of their new func-
tion. The BCL is very conscious that such efforts have
to continue and identified different working tracks
potentially leading to a more active human resources
management. Hence particular importance is given
to the performance appraisal of staff members as re-
gards their career development. During 2007, some of
these considerations were carefully examined. Finally,
the implementation of the competencies management
system within the BCL represents a priority insofar
as it is a crucial tool of the future human capital ma-
nagement around which other tools such as training
plans, career plans as well as mobility plans will be
developed.
During 2007, the recruitment policy was slightly amen-
ded in order to allow for more flexibility. Until now,
the recruitment process was based on a competitive
entrance exam which was organised once or twice a
year depending on staff requirements of the Bank. This
recruitment process turned out to be too rigid, not
allowing the Bank to react to unexpected situations,
as it was necessary, in case of a vacancy to wait for
1 this item also takes into account the effects in relation to changes from full time work to part-time work.
the next entrance exam. The aim of the new procedure
is to react promptly so as to be able to initiate at any
time the recruitment process which is composed of a
theoretical written and modular part and of interviews.
This new procedure will be assessed critically during
2008 to check whether the expected results have been
reached.
4.3.3 Staff training
From the point of view of the construction of a com-
mune future orientation for the Bank, the BCL intends
to develop its human resources. The Bank is determi-
ned to develop the capacities of its staff members
by giving them opportunities at the appropriate time
and by supporting them in their career development.
In order to help the staff members in their career
development and progress, a combination of levers
may turn out to be available and relevant such as
training and internal and external mobility. In addition
to what was told in the above paragraph, it should
be mentioned that the competencies management
has been identified to be the tool improving the staff
members’ skills regarding the required competencies
to carry out a specific job. The question therefore is
essentially to favour the definition of training needs
expressible in required competencies and goals to
reach in order to make a decision on training. The
identification of these training needs gives rise to the
setting up of a training plan for each staff member
which is considered to be a form of contract between
the bank and the staff member as regards the trai-
ning sessions the latter has to complete in order to
obtain the competencies required for the function.
The training plans are also going to play an essential
part in the framework of the mobility policy within
the BCL as they will determine the training sessions
to be completed and therefore also the competencies
to be acquired by a staff member to be able to align
his skills to those of the position. All these initiatives
could be completed with internship opportunities
aiming to create an open environment where staff
members have attractive opportunities inside and
outside the bank.

4. THE BCL A S AN ORGAN ISAT ION
BC
L A
nn
uA
l R
Ep
oR
t 2
00
7
130
4.3.4 The Pension Fund
Article 14 of Founding Law of 23 December 1998 re-
lating to the monetary status and the Banque centrale
du Luxembourg provides that legal pension entitle-
ments of BCL agents are determined by their status
(i.e., civil servant, State employee, private employee
or worker).
Paragraph 4(b) of this article provides that:
“The pensions of the Bank’s agents shall be paid by
the Bank. These costs shall be financed by a pension
fund of the Bank. The pension fund shall be financed
on the one hand by statutory deductions from agents’
salaries in accordance with the rules governing the
pension scheme corresponding to their status, on
the other hand by contributions made by the Bank
itself.”
The BCL’s pension fund, which started operating in
2001, is governed by a set of internal rules and two
committees, one executive and one consultative. The
executive committee is the Comité directeur composed
of the BCL’s Board of Directors, two elected represen-
tatives from the staff, two co-opted members acting
as delegated managers and one member designated
by the Staff Committee. The consultative committee is
the Tactical Benchmark Committee.
The Bank meets the representatives of social secu-
rity bodies as well as civil servants and administrative
coordination Administration. The aim is to reconcile
the need for workers’ mobility with the principles of
financial independence of the Bank and its functional
autonomy.
It has been agreed that a draft law amending the law
of 28 July 2000 coordinating the different national
pension schemes and any other texts dealing with
individual pension rights and beneficiaries of the BCL’s
pension fund be prepared by the government depart-
ment responsible for monitoring social security and
submitted to the national legislator in order to insure
the recognition of the BCL’ pension fund as social
security body.
Until now, the draft law is not yet available as articles
not related to BCL’s pension fund are still in debate.
4.3.5 Legal disputes
By its decision of 12 June 2007 the Luxembourg Admi-
nistrative Court of Appeal rejected the appeal lodged
by a former staff member of BCL and member of the
BCL staff representation A-BCL.
The Court confirmed the entire judgment of first ins-
tance which did not annul the decision of dismissal
of this staff member by ruling: “It follows from the
foregoing elements that the BCL’s Executive Board is
not to be reproached concerning the dismissal of the
appellant so that the appeal is declared unfounded and
the judgment of 23 November 2006 is confirmed”.
(informal translation).
The Court concluded that the decision of dismissal was
not due to the staff member’s activity as a member of
the staff representation, but to multiple professional
faults, which had undermined BCL’s Executive Board
confidence in the appellant.

BC
L A
nn
uA
l R
Ep
oR
t 2
00
7
131
4.4 Facilities
Key elements of 2007 for the Facilities and Logistics
section were cost reduction, the optimisation of energy
consumption and consumables, the planning of invest-
ments and medium-term operational costs as well as
the finalisation of the waste management concept to
be established in 2008.
The review of BCL’s organisation chart which was set
up at the beginning of 2007, engendered moving some
85 staff within the 3 buildings of the BCL.
These moves were realised by considering both or-
ganisational needs as well as an optimal use of the
available space.
The new building of the BCL, located 43, avenue
Monterey, was operational during the full year. Its
technical installations proved reliable.

4. THE BCL A S AN ORGAN ISAT ION
BC
L A
nn
uA
l R
Ep
oR
t 2
00
7
132
4.5 Internal finance
BCL continued to update its accounting system and
its procedures in order to meet its internal quality
standards and those of the Eurosystem. In 2007, the
accounting techniques relating to the operations on
financial assets were modified in the BCL’s systems.
The Eurosystem requires the daily reporting of balance
sheet data according to harmonised rules. The trans-
mission techniques were modified in accordance to
new reporting rules and the introduction of Target 2.
The controlling systems in place proved to be effective
during the year.
The Bank regularly checks the development of balance
sheet, off-balance-sheet and profit and loss items.
Investments, revenues and expenses are in particular
closely monitored with special attention paid to signing
powers.
The cost accounting system gives an indication concer-
ning costs and invoicing of services. The methodology
follows the rules recommended by the Eurosystem.
It consists of allocating BCL’s operational expenses
according to their destination, i.e. according to the
respective sections and units, and it permits to allocate
the costs of each of the Bank’s activities. In 2008,
harmonised techniques relative to project costs will
be introduced.
The monthly balance sheet of the Bank is published
on its Internet site.
The management information system meets the need
to follow the Bank’s activities. It is based on a set of
indicators, which are calculated daily, weekly, monthly,
quarterly and annually. These tables include all activities
of the Bank. The analysis of the profit and loss items is
complemented by an analysis concerning the net profit
of the various activities. The Bank strictly controls the
development of the interest margin and compares the
profitability of its investments to benchmarks.
The Bank performs static and dynamic assessments
of its long-term financial situation. It carries out pros-
pective analyses of external factors like interest rates,
exchange rates and other variables of the Eurosystem
and of the economic situation.
The Bank’s decision-making bodies are regularly infor-
med of the results in order to be in a position to decide
on the future directions and actions to take.
The asset /liability committee closely follows the risk
exposure and the financial situation during the year,
and in particular the risk resulting from the appropria-
teness of assets and liabilities. It checks the investment
limits imposed by the balance sheet positions of the
NCBs and the ECB.
As at 1 January 2008, Cyprus and Malta entered into
the Eurosytem. Consequently, the BCL’s key in the Euro-
system changed from 0.22659% to 0.22598%.

BC
L A
nn
uA
l R
Ep
oR
t 2
00
7
133
4.7 The Internal Audit Activities
In accordance with internationally accepted profes-
sional standards, the internal audit is an independant
and impartial activity designed to add value by im-
proving an organisation’s operations and the control
thereover.
The Internal Audit helps the Bank to accomplish its ob-
jectives by bringing a systematic, disciplined approach
to evaluate and improve the effectiveness of risk ma-
nagement, control and management processes.
The Internal Audit unit reports directly to the President
of the Bank.
The annual internal audit plan comprises audit engage-
ments on a national level, as well as audit objects that
are coordinated by the Internal Auditors Committee of
the ESCB in compliance with the ESCB audit policy.
During the year 2007, the Internal Audit unit perfor-
med various reviews in the areas of the management
of business continuity/disaster recovery, the handling
of euro banknotes and coins, monetary policy opera-
tions, numismatics, accounting, payments systems,
information technology as well as in the context of
various projects.
The Internal Audit unit is in charge of following-up on the
recommendations issued during its audit activities.
4.6 The budget
The establishing of the annual budget of the BCL is part
of a long term planning exercise which aims to ensure
the financial balance of the accounts of the Bank over
a long term horizon. The budget of the BCL reflects
the corporate values of the Bank, which are:
professionalism; −
quality in the services provided; −
stability ensured by a long-term perspective; −
objectivity resulting from an impartial application −
of precise rules;
integrity resulting from the transparency of its inter- −
nal operations and the respect for professional ethics.
The 2007 budget of the Bank has been established
in conformity with the budgetary procedures and the
orientations formulated by the Council. The 2007 bud-
get has been approved by the Council on 14 December
2006.
The main orientations for 2007 were:
Non structural revenues are hoarded in order to −
increase the Bank's own funds;
An optimal output of the portfolio is targeted −
through diversified and high quality investments
as well as by a meticulous management of the risks
inherent to such investments;
The development of new activities generating addi- −
tional revenues for the Bank is emphasised;
The strict control of cost is reinforced in 2007 by −
the implementation of a procurement office and a
controlling entity;
The recruitment of new staff is linked to the de- −
velopment of new activities generating revenues
for the Bank.
The orientations formulated by the Council have been
respected and the figures of the 2007 profit and loss
account confirm that the operational costs have stayed
within the budgetary limits.
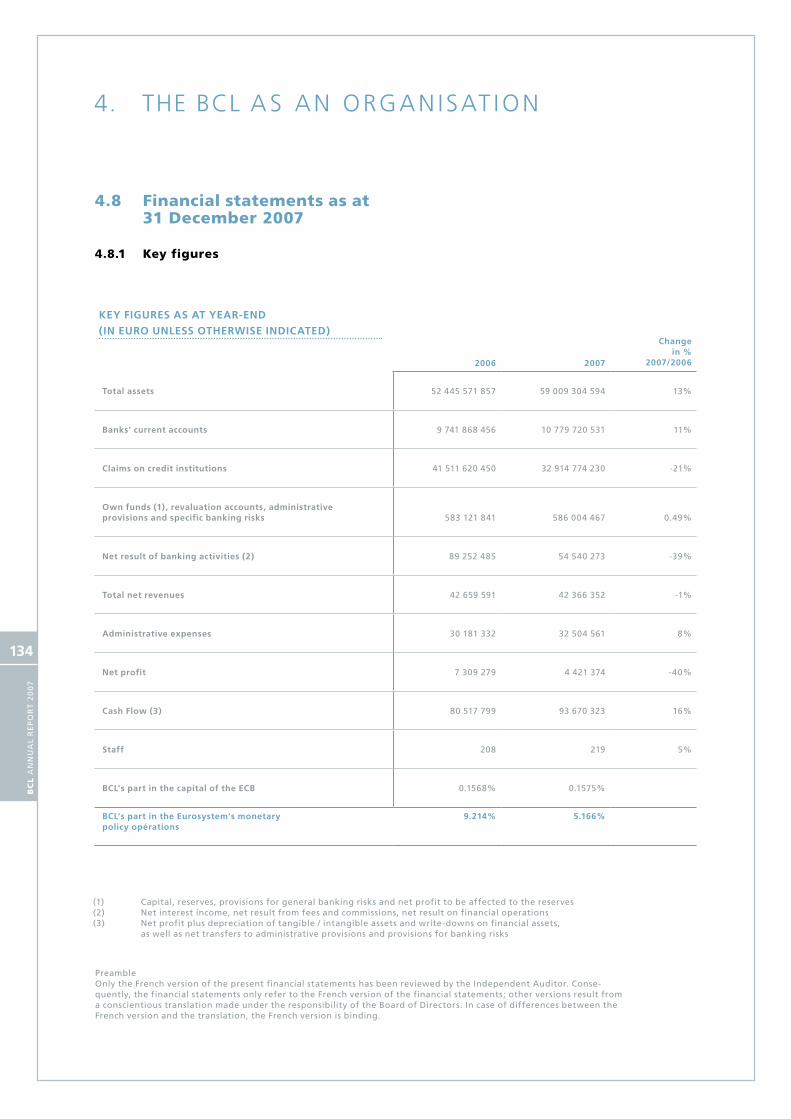
4. THE BCL A S AN ORGAN ISAT ION
BC
L A
nn
uA
l R
Ep
oR
t 2
00
7
134
4.8 Financial statements as at 31 December 2007
4.8.1 Key figures
2006 2007
Change
in % 2007/2006
Total assets 52 445 571 857 59 009 304 594 13%
Banks' current accounts 9 741 868 456 10 779 720 531 11%
Claims on credit institutions 41 511 620 450 32 914 774 230 -21%
own funds (1), revaluation accounts, administrative provisions and specific banking risks 583 121 841 586 004 467 0.49%
Net result of banking activities (2) 89 252 485 54 540 273 -39%
Total net revenues 42 659 591 42 366 352 -1%
Administrative expenses 30 181 332 32 504 561 8%
Net profit 7 309 279 4 421 374 -40%
Cash Flow (3) 80 517 799 93 670 323 16%
Staff 208 219 5%
BCL's part in the capital of the ECB 0.1568% 0.1575%
BCL's part in the Eurosystem's monetary policy opérations
9.214% 5.166%
(1) Capital, reserves, provisions for general banking risks and net profit to be affected to the reserves(2) net interest income, net result from fees and commissions, net result on financial operations(3) net profit plus depreciation of tangible / intangible assets and write-downs on financial assets, as well as net transfers to administrative provisions and provisions for banking risks
KEy FIGuRES AS AT yEAR-END
(IN EuRo uNLESS oTHERwISE INDICATED)
preambleonly the French version of the present financial statements has been reviewed by the Independent Auditor. Conse-quently, the financial statements only refer to the French version of the financial statements; other versions result from a conscientious translation made under the responsibility of the Board of Directors. In case of differences between the French version and the translation, the French version is binding.
BC
L A
nn
uA
l R
Ep
oR
t 2
00
7
135
4.8.2 Report of the Independent Auditor
To the Council of the Banque centrale du Luxembourg
To the Government
To the Chamber of Representatives
We have audited the accompanying financial statements of Banque centrale du Luxembourg, which comprise the
balance sheet as at December 31, 2007 and the profit and loss account for the year then ended, and a summary of
significant accounting policies and other explanatory notes.
Directors’ responsibility for the financial accounts
The financial statements are the responsibility of the Directors and are approved by the Council. The Directors are
responsible for the preparation and fair presentation of these financial statements in accordance with generally ac-
cepted accounting principles and those defined by the European System of Central Banks. This responsibility includes:
designing, implementing and maintaining internal control relevant to the preparation and fair presentation of financial
statements that are free from material misstatement, whether due to fraud or error; selecting and applying appropriate
accounting policies; and making accounting estimates that are reasonable in the circumstances.
Responsibility of the réviseur d’entreprises
Our responsibility is to express an opinion on these financial statements based on our audit. We conducted our audit
in accordance with International Standards on Auditing as adopted by the Institut des réviseurs d’entreprises. Those
standards require that we comply with ethical requirements and plan and perform the audit to obtain reasonable
assurance whether the financial statements are free from material misstatement.
An audit involves performing procedures to obtain audit evidence about the amounts and disclosures in the financial
statements. The procedures selected depend on the judgment of the réviseur d’entreprises, including the assessment
of the risks of material misstatement of the financial statements, whether due to fraud or error. In making those risk
assessments, the réviseur d’entreprises considers internal control relevant to the entity’s preparation and fair presen-
tation of the financial statements in order to design audit procedures that are appropriate in the circumstances, but
not for the purpose of expressing an opinion on the effectiveness of the entity’s internal control.
An audit also includes evaluating the appropriateness of accounting policies used and the reasonableness of accounting
estimates made by the Directors, as well as evaluating the overall presentation of the financial statements. We believe
that the audit evidence we have obtained is sufficient and appropriate to provide a basis for our audit opinion.
Opinion
In our opinion, the financial statements give a true and fair view of the financial position of Banque centrale du
Luxembourg as of December 31, 2007, and of the results of its operations for the year then ended in accordance with
generally accepted accounting principles and those defined by the European System of Central Banks.
Deloitte S.A.Réviseur d’entreprises
Pascal Pincemin Vafa MoayedPartner Partner
March 3, 2008
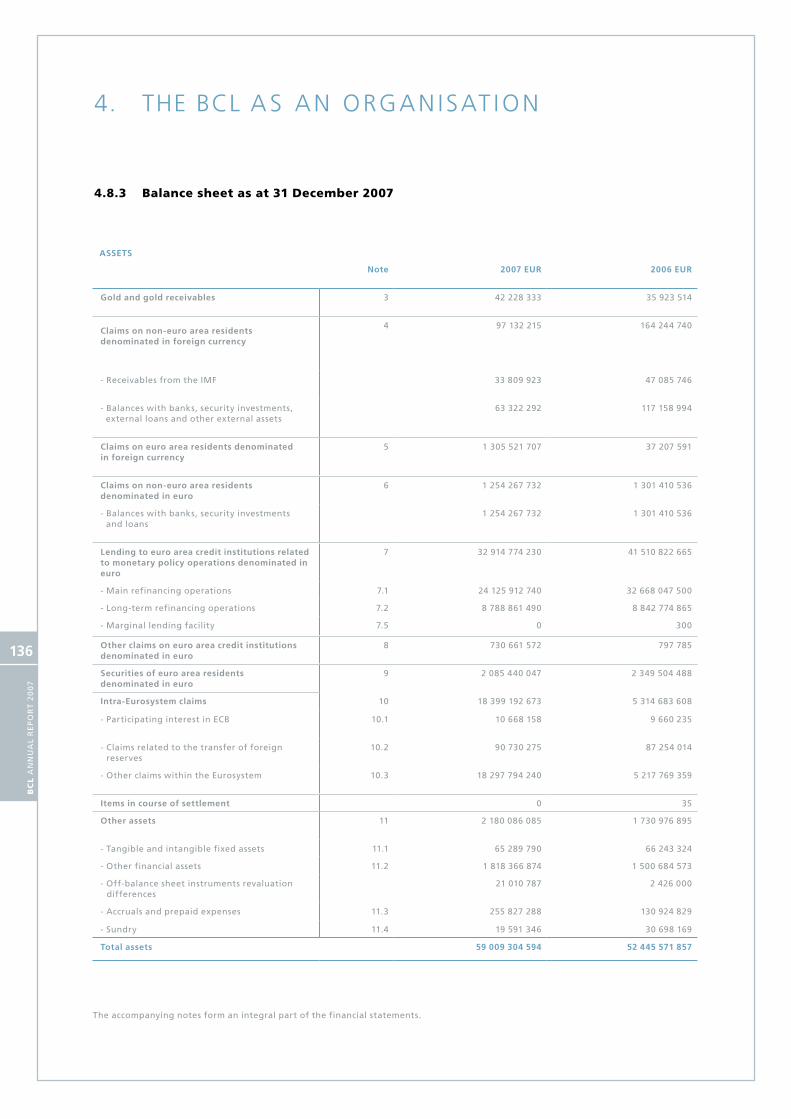
4. THE BCL A S AN ORGAN ISAT ION
BC
L A
nn
uA
l R
Ep
oR
t 2
00
7
136
Note 2007 EuR 2006 EuR
Gold and gold receivables 3 42 228 333 35 923 514
Claims on non-euro area residentsdenominated in foreign currency
4 97 132 215 164 244 740
- Receivables from the IMF 33 809 923 47 085 746
- Balances with banks, security investments, external loans and other external assets
63 322 292 117 158 994
Claims on euro area residents denominated in foreign currency
5 1 305 521 707 37 207 591
Claims on non-euro area residents denominated in euro
6 1 254 267 732 1 301 410 536
- Balances with banks, security investments and loans
1 254 267 732 1 301 410 536
Lending to euro area credit institutions related to monetary policy operations denominated in euro
7 32 914 774 230 41 510 822 665
- Main refinancing operations 7.1 24 125 912 740 32 668 047 500
- long-term refinancing operations 7.2 8 788 861 490 8 842 774 865
- Marginal lending facility 7.5 0 300
other claims on euro area credit institutions denominated in euro
8 730 661 572 797 785
Securities of euro area residents denominated in euro
9 2 085 440 047 2 349 504 488
Intra-Eurosystem claims 10 18 399 192 673 5 314 683 608
- participating interest in ECB 10.1 10 668 158 9 660 235
- Claims related to the transfer of foreign reserves
10.2 90 730 275 87 254 014
- other claims within the Eurosystem 10.3 18 297 794 240 5 217 769 359
Items in course of settlement 0 35
other assets 11 2 180 086 085 1 730 976 895
- tangible and intangible fixed assets 11.1 65 289 790 66 243 324
- other financial assets 11.2 1 818 366 874 1 500 684 573
- off-balance sheet instruments revaluation differences
21 010 787 2 426 000
- Accruals and prepaid expenses 11.3 255 827 288 130 924 829
- Sundry 11.4 19 591 346 30 698 169
Total assets 59 009 304 594 52 445 571 857
4.8.3 Balance sheet as at 31 December 2007
ASSETS
the accompanying notes form an integral part of the financial statements.
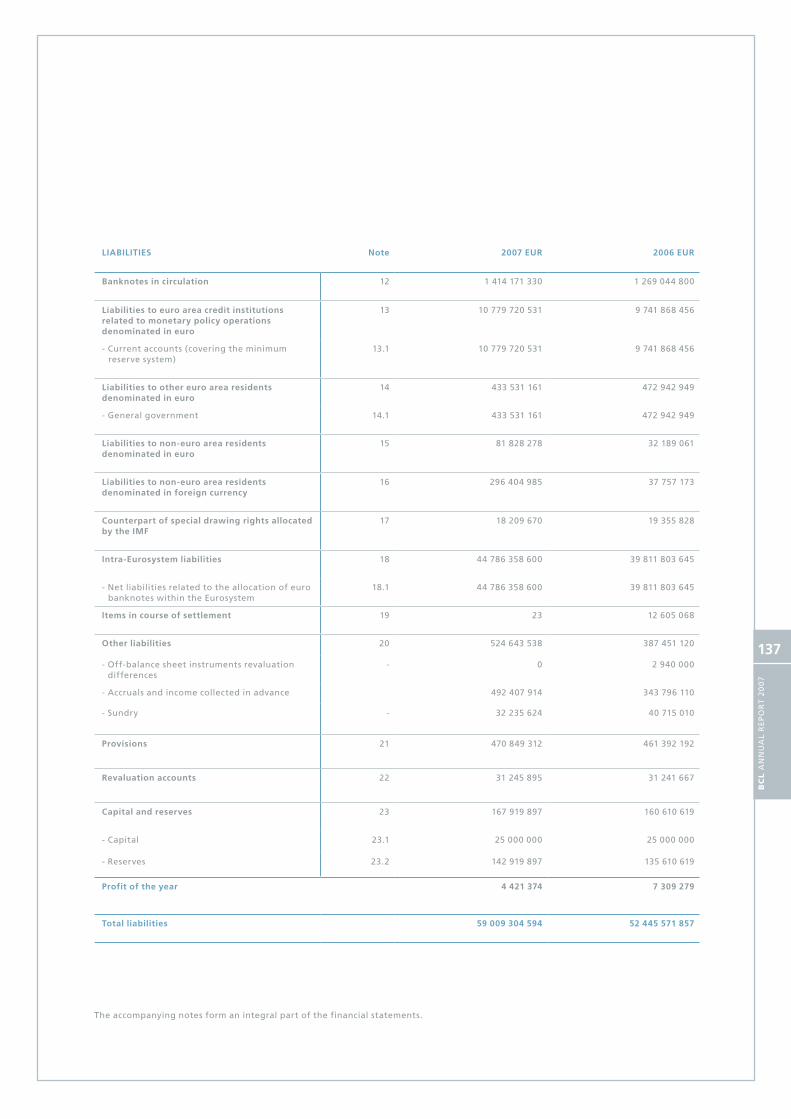
BC
L A
nn
uA
l R
Ep
oR
t 2
00
7
137
LIABILITIES Note 2007 EuR 2006 EuR
Banknotes in circulation 12 1 414 171 330 1 269 044 800
Liabilities to euro area credit institutions related to monetary policy operations denominated in euro
13 10 779 720 531 9 741 868 456
- Current accounts (covering the minimum reserve system)
13.1 10 779 720 531 9 741 868 456
Liabilities to other euro area residents denominated in euro
14 433 531 161 472 942 949
- General government 14.1 433 531 161 472 942 949
Liabilities to non-euro area residents denominated in euro
15 81 828 278 32 189 061
Liabilities to non-euro area residents denominated in foreign currency
16 296 404 985 37 757 173
Counterpart of special drawing rights allocated by the IMF
17 18 209 670 19 355 828
Intra-Eurosystem liabilities 18 44 786 358 600 39 811 803 645
- net liabilities related to the allocation of euro banknotes within the Eurosystem
18.1 44 786 358 600 39 811 803 645
Items in course of settlement 19 23 12 605 068
other liabilities 20 524 643 538 387 451 120
- off-balance sheet instruments revaluation differences
- 0 2 940 000
- Accruals and income collected in advance 492 407 914 343 796 110
- Sundry - 32 235 624 40 715 010
Provisions 21 470 849 312 461 392 192
Revaluation accounts 22 31 245 895 31 241 667
Capital and reserves 23 167 919 897 160 610 619
- Capital 23.1 25 000 000 25 000 000
- Reserves 23.2 142 919 897 135 610 619
Profit of the year 4 421 374 7 309 279
Total liabilities 59 009 304 594 52 445 571 857
the accompanying notes form an integral part of the financial statements.
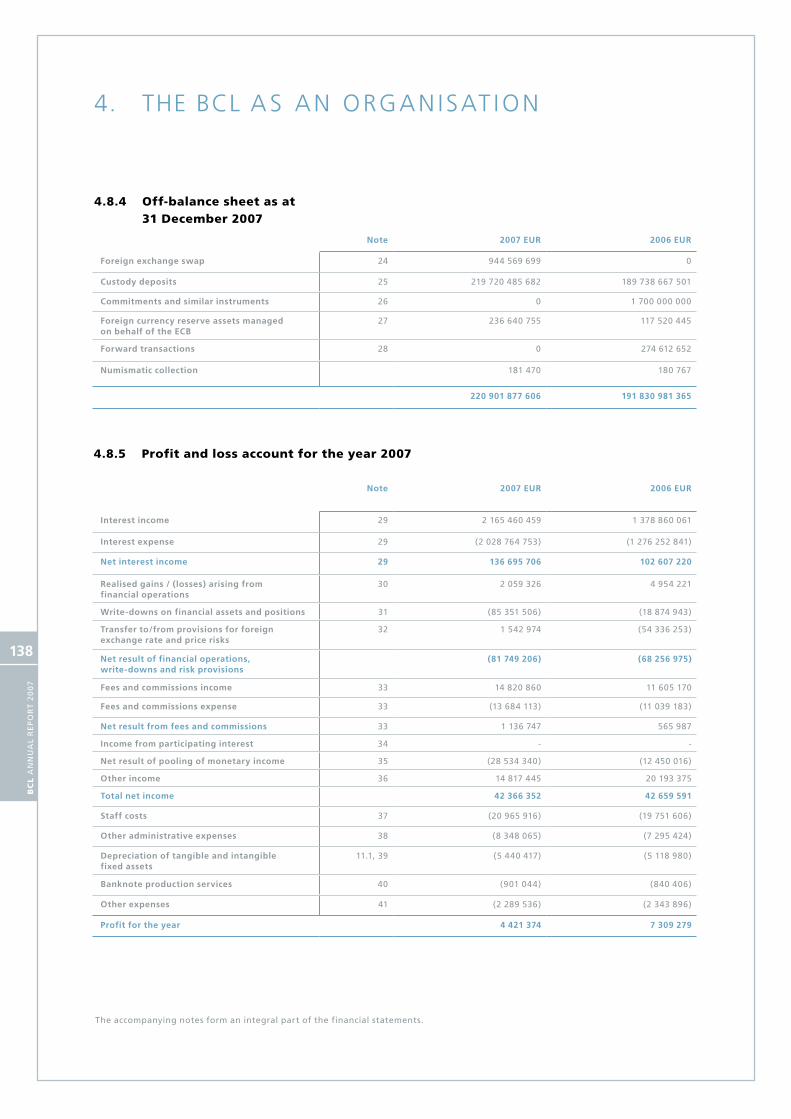
4. THE BCL A S AN ORGAN ISAT ION
BC
L A
nn
uA
l R
Ep
oR
t 2
00
7
138
Note 2007 EuR 2006 EuR
Foreign exchange swap 24 944 569 699 0
Custody deposits 25 219 720 485 682 189 738 667 501
Commitments and similar instruments 26 0 1 700 000 000
Foreign currency reserve assets managed on behalf of the ECB
27 236 640 755 117 520 445
Forward transactions 28 0 274 612 652
Numismatic collection 181 470 180 767
220 901 877 606 191 830 981 365
4.8.4 Off-balance sheet as at 31 December 2007
4.8.5 Profit and loss account for the year 2007
Note 2007 EuR 2006 EuR
Interest income 29 2 165 460 459 1 378 860 061
Interest expense 29 (2 028 764 753) (1 276 252 841)
Net interest income 29 136 695 706 102 607 220
Realised gains / (losses) arising from financial operations
30 2 059 326 4 954 221
write-downs on financial assets and positions 31 (85 351 506) (18 874 943)
Transfer to/from provisions for foreign exchange rate and price risks
32 1 542 974 (54 336 253)
Net result of financial operations, write-downs and risk provisions
(81 749 206) (68 256 975)
Fees and commissions income 33 14 820 860 11 605 170
Fees and commissions expense 33 (13 684 113) (11 039 183)
Net result from fees and commissions 33 1 136 747 565 987
Income from participating interest 34 - -
Net result of pooling of monetary income 35 (28 534 340) (12 450 016)
other income 36 14 817 445 20 193 375
Total net income 42 366 352 42 659 591
Staff costs 37 (20 965 916) (19 751 606)
other administrative expenses 38 (8 348 065) (7 295 424)
Depreciation of tangible and intangible fixed assets
11.1, 39 (5 440 417) (5 118 980)
Banknote production services 40 (901 044) (840 406)
other expenses 41 (2 289 536) (2 343 896)
Profit for the year 4 421 374 7 309 279
the accompanying notes form an integral part of the financial statements.

BC
L A
nn
uA
l R
Ep
oR
t 2
00
7
139
4.8.6 Notes to the financial statements as at 31 December 2007
Note 1 - General
The Banque centrale du Luxembourg (“BCL”) was foun-
ded in accordance with the law of 22 April 1998. The
Founding Law of 23 December 1998 stipulates that
the main task of the BCL shall be to contribute to the
accomplishment of the tasks of the European System
of Central Banks (ESCB) so as to achieve the objectives
of the ESCB. The BCL is a public institution, endowed
with legal personality and financial independence.
Note 2 - Accounting policies
The accounting policies applied in preparing the finan-
cial statements are described below :
2.1 Layout of the financial statements
The financial statements of the BCL have been pre-
pared and drawn up in accordance with the generally
accepted accounting principles and the rules adopted
by the ESCB.
2.2 Accounting principles
The following accounting principles have been applied:
economic reality and transparency; −
prudence; −
recognition of post-balance sheet events; −
accruals principle; −
consistency and comparability. −
2.3 Basic principles
The financial statements are based on historical cost
and are adjusted to take account of the valuation
at market prices of securities, financial instruments,
gold and of all the elements, both on-balance-sheet
and off-balance-sheet, denominated in foreign cur-
rencies.
Transactions in financial assets and liabilities are reflec-
ted in the accounts of BCL on their settlement date.
2.4 Gold, assets and liabilities in foreign
currencies
Assets and liabilities denominated in foreign currencies
(including gold) are converted into euro at the ex-
change rate in force on the balance sheet closing date.
Income and expenses are converted at the exchange
rate prevailing on the date of the transaction.
Foreign currencies are revalued on a currency-by-cur-
rency basis including on-balance-sheet and off-balan-
ce-sheet items.
Securities are revalued separately from the revaluation
of foreign exchange for securities denominated in fo-
reign currencies.
Gold is revalued on the basis of the euro price per
fine ounce as derived from the quotation in US dollars
established at the time of the London fixing on the last
working day of the year.
2.5 Securities
Negotiable securities denominated in foreign currencies
and in euro are valued at the market price prevailing
on the balance sheet date. Securities held to maturity
are valued at purchase or transfer price adjusted by
premiums and discounts.
The revaluation took place item-by-item on the basis
of their ISIN code.
2.6 Recognition of gains and losses
Income and expenses are assigned to the financial year
during which they are earned or incurred.
Realised gains and losses on foreign exchange tran-
sactions, securities and financial instruments linked to
interest rates and market prices are taken to the profit
and loss account.
At the end of the year, unrealised revaluation gains on
foreign currencies, securities and financial instruments
are not considered in the profit and loss account, but
transferred to a revaluation account on the liabilities
side of the balance sheet.
Unrealised losses are recognised in the profit and loss
account when they exceed previous revaluation gains
registered in the corresponding revaluation account.
They may not be reversed against new unrealised gains
in subsequent years. Unrealised losses regarding a
specific security, financial instrument, currency or in
gold holdings are not netted with unrealised gains in

4. THE BCL A S AN ORGAN ISAT ION
BC
L A
nn
uA
l R
Ep
oR
t 2
00
7
140
other securities, financial instruments, currencies or
gold holdings.
In order to calculate the acquisition cost of securities
or currencies that are sold, the average cost method
is used on a daily basis. If any negative revaluation
differences are taken to the profit and loss account,
the average cost of the asset in question is adjusted
downwards to the level of the current exchange rate
or market price thereof.
For fixed-income securities, the premiums or discounts
arising from the difference between the average ac-
quisition cost and the redemption price are calculated
and presented on a prorata basis as part of the interest
positions and amortised over the remaining life of the
securities.
2.7 Post-balance-sheet events
Assets and liabilities are adjusted to take account of
events occurring between the balance sheet date and
the date on which the BCL’s Council approves the an-
nual accounts if such events have a material effect on
the assets and liabilities on the balance sheet date.
2.8 Banknotes in circulation
The European Central Bank (ECB) and the participa-
ting National Central Banks (NCBs), which together
comprise the Eurosystem, have issued euro banknotes
as from 1 January 2002. The total value of euro ban-
knotes in circulation is allocated on the last working
day of each month in accordance with the banknote
allocation key.
The ECB has been allocated a share of 8% of the to-
tal value of euro banknotes in circulation from 2002,
whereas the remaining 92% has been allocated to
NCBs according to their weightings in the capital key
of the ECB. The share of banknotes allocated to each
NCB is disclosed under the balance sheet liability item
“Banknotes in circulation”.
The difference between the value of the euro bank-
notes allocated to each NCB in accordance with the
banknote allocation key and the value of the euro
banknotes that it actually puts into circulation gives
rise to remunerated intra-Eurosystem balances. These
claims or liabilities, which incur interest, are disclosed
under the sub-item “Intra-Eurosystem: Net claim/liabi-
lity related to the allocation of euro banknotes within
the Eurosystem”.
The intra-system balances arising from the allocation
of euro banknotes are adjusted in order to avoid signi-
ficant changes in NCBs’ relative income positions as
compared to previous years. The adjustments are ef-
fected by taking into account the differences between
the average value of banknotes in circulation of each
NCB during a reference period and the average value
of banknotes that would have been allocated to them
during that period under the ECB’s capital key. The
adjustments will be reduced in annual stages to finally
result in an allocation of income on banknotes fully in
proportion to the NCBs’ paid-up shares in the ECB’s
capital.
The interest income and expense on these balances
is cleared through the accounts of the ECB and is dis-
closed under “Net interest income.”
The Governing Council of the ECB has decided that the
seigniorage income of the ECB, which arises from the
8% share of euro banknotes allocated to the ECB, shall
not be distributed in 2007. This income has been allo-
cated, in the ECB’s accounts, to a provision for foreign
exchange rate, interest rate and gold price risks.
2.9 Intra-Eurosystem claims and liabilities
Intra-Eurosystem balances arising from the allocation
of euro banknotes within the Eurosystem are included
as a net single asset or liability under “Net claim/liabi-
lity related to the allocation of euro banknotes within
the Eurosystem”.
Intra-Eurosystem claims and liabilities arising from TAR-
GET balances and counterparties accounts are shown
as a single net asset or liability on the balance sheet.
2.10 Treatment of tangible and intangible assets
The tangible and intangible assets are recorded at their
acquisition cost less depreciation. Depreciation was
calculated on a straight-line basis over the expected
economic lifetime of the assets :
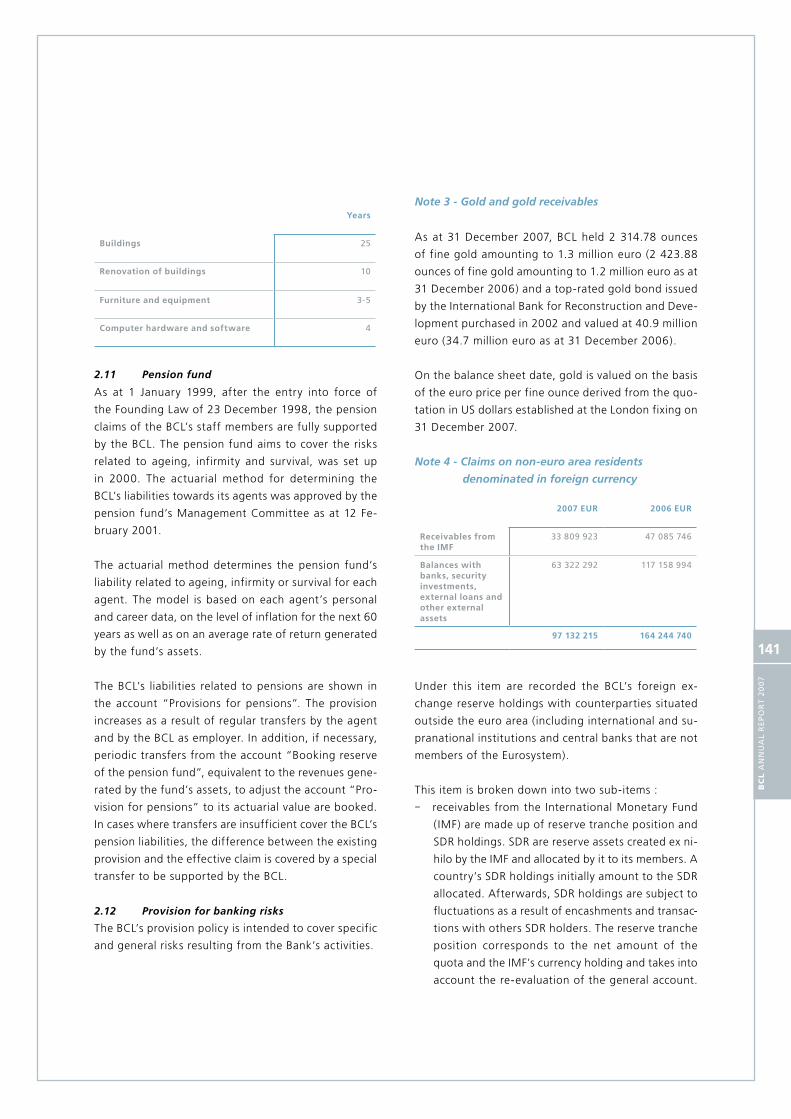
BC
L A
nn
uA
l R
Ep
oR
t 2
00
7
141
years
Buildings 25
Renovation of buildings 10
Furniture and equipment 3-5
Computer hardware and software 4
2.11 Pension fund
As at 1 January 1999, after the entry into force of
the Founding Law of 23 December 1998, the pension
claims of the BCL’s staff members are fully supported
by the BCL. The pension fund aims to cover the risks
related to ageing, infirmity and survival, was set up
in 2000. The actuarial method for determining the
BCL’s liabilities towards its agents was approved by the
pension fund’s Management Committee as at 12 Fe-
bruary 2001.
The actuarial method determines the pension fund’s
liability related to ageing, infirmity or survival for each
agent. The model is based on each agent’s personal
and career data, on the level of inflation for the next 60
years as well as on an average rate of return generated
by the fund’s assets.
The BCL’s liabilities related to pensions are shown in
the account “Provisions for pensions”. The provision
increases as a result of regular transfers by the agent
and by the BCL as employer. In addition, if necessary,
periodic transfers from the account “Booking reserve
of the pension fund”, equivalent to the revenues gene-
rated by the fund’s assets, to adjust the account “Pro-
vision for pensions” to its actuarial value are booked.
In cases where transfers are insufficient cover the BCL’s
pension liabilities, the difference between the existing
provision and the effective claim is covered by a special
transfer to be supported by the BCL.
2.12 Provision for banking risks
The BCL’s provision policy is intended to cover specific
and general risks resulting from the Bank’s activities.
Note 3 - Gold and gold receivables
As at 31 December 2007, BCL held 2 314.78 ounces
of fine gold amounting to 1.3 million euro (2 423.88
ounces of fine gold amounting to 1.2 million euro as at
31 December 2006) and a top-rated gold bond issued
by the International Bank for Reconstruction and Deve-
lopment purchased in 2002 and valued at 40.9 million
euro (34.7 million euro as at 31 December 2006).
On the balance sheet date, gold is valued on the basis
of the euro price per fine ounce derived from the quo-
tation in US dollars established at the London fixing on
31 December 2007.
Note 4 - Claims on non-euro area residents
denominated in foreign currency
2007 EuR 2006 EuR
Receivables from the IMF
33 809 923 47 085 746
Balances with banks, security investments, external loans and other external assets
63 322 292 117 158 994
97 132 215 164 244 740
Under this item are recorded the BCL’s foreign ex-
change reserve holdings with counterparties situated
outside the euro area (including international and su-
pranational institutions and central banks that are not
members of the Eurosystem).
This item is broken down into two sub-items :
receivables from the International Monetary Fund −
( IMF) are made up of reserve tranche position and
SDR holdings. SDR are reserve assets created ex ni-
hilo by the IMF and allocated by it to its members. A
country’s SDR holdings initially amount to the SDR
allocated. Afterwards, SDR holdings are subject to
fluctuations as a result of encashments and transac-
tions with others SDR holders. The reserve tranche
position corresponds to the net amount of the
quota and the IMF’s currency holding and takes into
account the re-evaluation of the general account.

4. THE BCL A S AN ORGAN ISAT ION
BC
L A
nn
uA
l R
Ep
oR
t 2
00
7
142
balances held on accounts with banks outside the −
euro area as well as securities, loans and other
foreign currency assets issued by non-residents of
the euro area. This sub-item includes in particular
the US dollar securities portfolio which could be
used, if needed, for monetary policy operations.
This portfolio, which amounts to 59.8 million euro as at
31 December 2007 (115.3 million euro as at 31 Decem-
ber 2006), only contains government bonds and top-
rated bonds issued by international and supranational
institutions denominated in US dollars. Securities are
valued at market prices. As at 31 December 2007, their
value at market prices included an unrealised gain
amounting to 1.2 million euro (unrealised gain amoun-
ted to 0.3 million euro as at 31 December 2006).
Balances with banks amounted to 3.5 million euro as at
31 December 2007 (1.9 million euro as at 31 December
2006).
Note 5 - Claims on euro area residents denominated
in foreign currency
This item includes mainly a claim arising from reverse
operations with Eurosystem counterparties amounting
to 940.8 million euro, in connection with the US dollar
Term Auction Facility. Under this Programme, 20 billion
USD were provided by the Federal Reserve to the ECB
by means of temporary reciprocal currency arrange-
ment (swap line) with the aim of offering short-term
US dollar funding to Eurosystem counterparties. The
ECB simultaneously entered into back-to-back swap
transactions with NCBs that have adopted the euro,
which used the resulting funds to conduct liquidity-
providing operations with the Eurosystem counterpar-
ties. These back-to-back swap transactions resulted in
non-remunerated inter-Eurosystem balances between
the ECB and the NCBs reported under “Other claims
within the Eurosystem(net)”.
This item includes also BCL’s balances denominated in
foreign currency with counterparties inside the euro
area.
Note 6 - Claims on non-euro area residents
denominated in euro
2007 EuR 2006 EuR
Balances with banks
10 143 289 10 959 298
Security investments
1 244 124 443 1 290 451 238
1 254 267 732 1 301 410 536
This item contains balances held on accounts with
banks outside the euro area as well as securities, loans
and other euro-denominated assets issued by non-
residents of the euro area.
This portfolio only contains government bonds and first
rated bonds issued by companies outside the euro area
denominated in euro. Securities are valued at market
prices. As at 31 December 2007, their value at market
prices included an unrealised loss amounting to 39.0
million euro (unrealised loss amounting to 15.5 million
euro as at 31 December 2006).
Note 7 - Lending to euro area credit institutions
related to monetary policy operations
denominated in euro
This balance sheet item represents the liquidity-
providing transactions executed by the BCL with
Luxembourg credit institutions.
The item is divided into various sub-items depending
on the type of instrument used to provide liquidity to
the financial sector :

BC
L A
nn
uA
l R
Ep
oR
t 2
00
7
143
2007 EuR 2006 EuR
Main refinancing operations
24 125 912 740 32 668 047 500
Longer-term refinancing operations
8 788 861 490 8 842 774 865
Fine-tuning re-verse operations
- -
Structural reverse operations
- -
Marginal lending facility
- 300
Credits related to margin calls
- -
32 914 774 230 41 510 822 665
7.1 Main refinancing operations
This sub-item records the amount of liquidity provi-
ded to credit institutions by way of weekly one-week
tenders and of exceptional tenders allocated at year
end.
7.2 Long-term refinancing operations
This sub-item records the amount of credit extended
to credit institutions by way of monthly three-month
tenders and of exceptional tenders allocated at year
end.
7.3 Fine-tuning reverse operations
This sub-item records open market operations carried
out on a non-regular basis, intended primarily to meet
unexpected fluctuations in market liquidity.
7.4 Structural reverse operations
These are open market operations carried out with the
primary intention of bringing about a lasting change in
the structural liquidity position of the financial sector
vis-à-vis the Eurosystem.
No such transactions were made during the year under
review.
7.5 Marginal lending facility
This sub-item records a standing facility enabling coun-
terparties to obtain 24-hour credit from the Bank at a
pre-specified interest rate, against eligible collateral.
7.6 Credits related to margin calls
This sub-item records additional credit extended to
credit institutions and resulting from the increase in the
value of the securities pledged as collateral for other
credits extended to these same institutions.
No such operation took place during the year just ended.
Note 8 - Other claims on euro area credit institutions
denominated in euro
This item includes the BCL’s current accounts and fixed-
term deposits not related to monetary policy operation
with credit institutions inside the euro area.
Note 9 - Securities of euro area residents denomina-
ted in euro
This item covers the BCL’s portfolio in euro issued by
residents of the euro area which could be used, if nee-
ded, for monetary policy operations. This amounted to
2 085.4 million euro as at 31 December 2007 (2 349.5
million euro as at 31 December 2006).
This portfolio only contains government bonds in euro
issued by Member States of the European Union and
first rated bonds issued by companies of the euro area.
Securities are valued at market prices. As at 31 De-
cember 2007, their value at market prices included an
unrealised loss amounting to 28.8 million euro (against
14.7 million euro as at 31 December 2006).
Note 10 - Intra-Eurosystem claims
10.1 Participating interest in the ECB
Pursuant to Article 28 of the ESCB Statute, the ESCB
national central banks are the sole subscribers to the
capital of the ECB. Subscriptions depend on shares
which are fixed in accordance with Article 29.3 of the
ESCB Statute and which are subject to adjustment
every five years. On 31 December 2007, the share that
the BCL holds in the capital of the ECB was 0.1575%,
which amounts to 10 668 158 euro, on a total of
subscribed capital of the ECB of 5.761 billion euro (this
corresponds to 0.1568% or 9 660 235 euro, on a total
of subscribed capital of the ECB of 5.565 billion euro
as at 31 December 2006).

4. THE BCL A S AN ORGAN ISAT ION
BC
L A
nn
uA
l R
Ep
oR
t 2
00
7
144
The share that the BCL held in the accumulated net
profits of the ECB reflects the repayment of 0.9 million
euro by the ECB.
On 1 January 2007 the national central banks of Bul-
garia and Romania joined the ESCB while the national
central bank of Slovenia joined the Eurosystem. As a
result the BCL’s capital keys changed in both systems.
More over, the calculations on population and GDP
were revised. BCL’s key in the ESCB changed from
0.1568% to 0.1575% and BCL’s key in the Eurosystem
changed from 0.21933% to 0.22659%.
10.2 Claims equivalent to the transfer of foreign
reserves
This sub-item represents the euro-denominated claims
on the ECB in respect of the transfer of part of BCL’s
foreign reserves. The claims are denominated in euro
at a value fixed at the time of their transfer.
They are remunerated at the latest available marginal
rate for the Eurosystem’s main refinancing operations,
adjusted to reflect a zero return on the gold compo-
nent.
On 31 December 2007, the claim of the BCL amounted
to 90 730 275 euro (87 254 014 euro on 31 December
2006).
10.3 Other claims within the Eurosystem
This sub-item represents the BCL’s net claims towards
the Eurosystem, mostly from transactions resulting
from cross-border payments initiated for monetary
or financial operations, made via the TARGET system,
between the BCL and the other NCBs as well as the
ECB. This claim amounts to 18.3 billion euro as at
31 December 2007 (5.2 billion euro as at 31 Decem-
ber 2006).
The net position vis-à-vis the ECB bears interest at the
marginal interest rate applying to the main refinancing
operations.

BC
L A
nn
uA
l R
Ep
oR
t 2
00
7
145
Note 11 – Other assets
11.1 Tangible and intangible assets
Tangible and intangible fixed assets developed as fol-
lows:
11.2 Other financial assets
The components of this item are as follows:
2007 EuR 2006 EuR
other participating interests
170 226 216 994
Pension fund 88 987 746 83 271 152
Securities portfolio
1 729 208 902 1 417 196 427
1 818 366 874 1 500 684 573
The other participating interests comprise the BCL’s invest-
ments in RTGS-L GIE, in liquidation, Swift and ATTF.
The assets of the pension fund are recorded in the accounts
under “Pension fund BCL”. The balance of this account cor-
responds to the net asset value of the fund as calculated by
the depositary bank as at 31 December 2007.
The securities portfolio recorded under this heading
includes:
1) As at 31 December 2007 the securities held by the
BCL for the purpose of investment amounting to a
total of 1 362.6 million euro (1 417.2 million euro as
at 31 December 2006). Securities are valued at market
BuildingsEuR
Furniture and equipment EuR
SoftwareEuR
Total EuR
Cost as at 1 january 2007 87 695 681 11 447 327 5 583 458 104 726 466
Disposals - - - -
Acquisitions 3 609 069 701 145 176 669 4 486 883
Cost as at 31 December 2007 91 304 750 12 148 472 5 760 127 109 213 349
Accumulated depreciation as at 1 january 2007
26 147 057 8 435 710 3 900 375 38 483 142
Disposals - - - -
Depreciation 3 923 441 975 602 541 374 5 440 417
Accumulated depreciation as at 31 December 2007
30 070 498 9 411 312 4 441 749 43 923 559
Net book value as at 31 December 2007 61 234 252 2 737 160 1 318 378 65 289 790
The sub-item “Buildings” comprises the acquisition
cost of the premises located on the 2, boulevard Royal,
the costs incurred in relation to the reconstruction and
transformation of the Pierre Werner building and the
renovations made to the Siège Royal (main building).
The building located on the avenue Monterey was com-
pletely written off in 2003, having been demolished
in order to construct a new one. Construction of this
new building was finished in 2006.
The Pierre Werner building and the Avenue Monterey
building are considered as new buildings and are being
amortised over a period of 25 years while the costs
incurred in relation to the transformation of the Siège
Royal are considered as renovations and are being
amortised over 10 years.
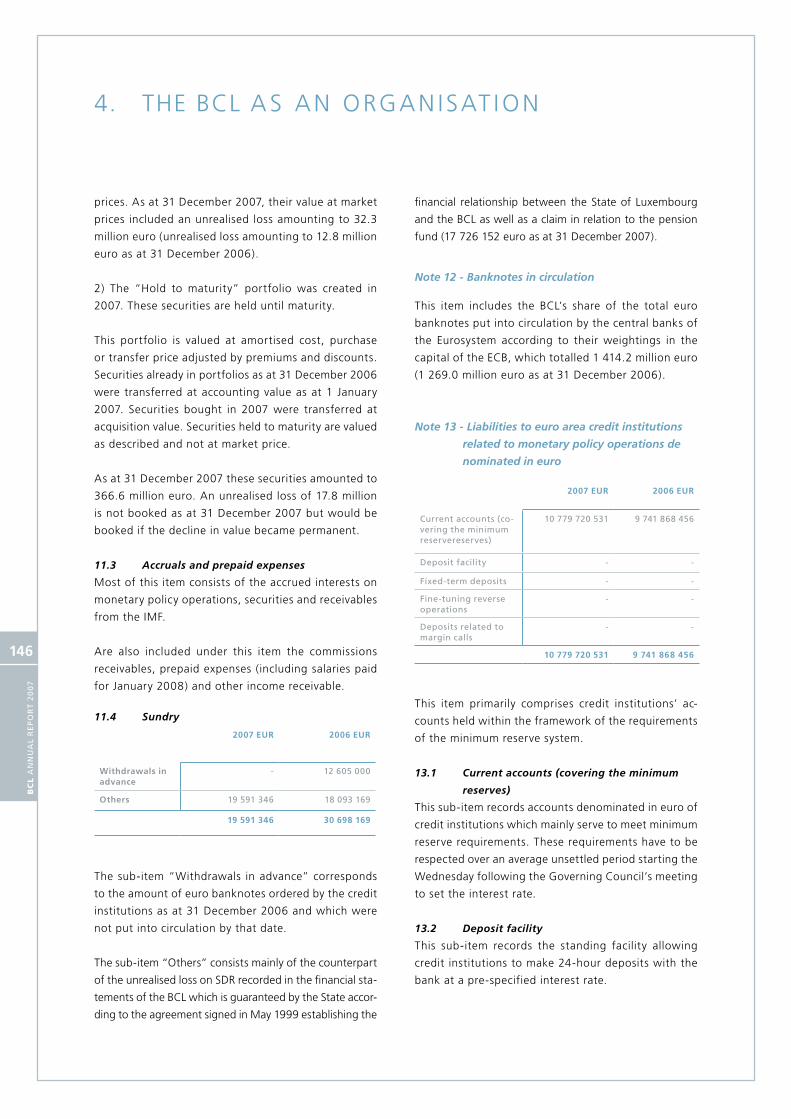
4. THE BCL A S AN ORGAN ISAT ION
BC
L A
nn
uA
l R
Ep
oR
t 2
00
7
146
prices. As at 31 December 2007, their value at market
prices included an unrealised loss amounting to 32.3
million euro (unrealised loss amounting to 12.8 million
euro as at 31 December 2006).
2) The “Hold to maturity” portfolio was created in
2007. These securities are held until maturity.
This portfolio is valued at amortised cost, purchase
or transfer price adjusted by premiums and discounts.
Securities already in portfolios as at 31 December 2006
were transferred at accounting value as at 1 January
2007. Securities bought in 2007 were transferred at
acquisition value. Securities held to maturity are valued
as described and not at market price.
As at 31 December 2007 these securities amounted to
366.6 million euro. An unrealised loss of 17.8 million
is not booked as at 31 December 2007 but would be
booked if the decline in value became permanent.
11.3 Accruals and prepaid expenses
Most of this item consists of the accrued interests on
monetary policy operations, securities and receivables
from the IMF.
Are also included under this item the commissions
receivables, prepaid expenses (including salaries paid
for January 2008) and other income receivable.
11.4 Sundry
2007 EuR 2006 EuR
withdrawals in advance
- 12 605 000
others 19 591 346 18 093 169
19 591 346 30 698 169
The sub-item “Withdrawals in advance” corresponds
to the amount of euro banknotes ordered by the credit
institutions as at 31 December 2006 and which were
not put into circulation by that date.
The sub-item “Others” consists mainly of the counterpart
of the unrealised loss on SDR recorded in the financial sta-
tements of the BCL which is guaranteed by the State accor-
ding to the agreement signed in May 1999 establishing the
financial relationship between the State of Luxembourg
and the BCL as well as a claim in relation to the pension
fund (17 726 152 euro as at 31 December 2007).
Note 12 - Banknotes in circulation
This item includes the BCL’s share of the total euro
banknotes put into circulation by the central banks of
the Eurosystem according to their weightings in the
capital of the ECB, which totalled 1 414.2 million euro
(1 269.0 million euro as at 31 December 2006).
Note 13 - Liabilities to euro area credit institutions
related to monetary policy operations de
nominated in euro
2007 EuR 2006 EuR
Current accounts (co-vering the minimum reservereserves)
10 779 720 531 9 741 868 456
Deposit facility - -
Fixed-term deposits - -
Fine-tuning reverse operations
- -
Deposits related to margin calls
- -
10 779 720 531 9 741 868 456
This item primarily comprises credit institutions’ ac-
counts held within the framework of the requirements
of the minimum reserve system.
13.1 Current accounts (covering the minimum
reserves)
This sub-item records accounts denominated in euro of
credit institutions which mainly serve to meet minimum
reserve requirements. These requirements have to be
respected over an average unsettled period starting the
Wednesday following the Governing Council’s meeting
to set the interest rate.
13.2 Deposit facility
This sub-item records the standing facility allowing
credit institutions to make 24-hour deposits with the
bank at a pre-specified interest rate.

BC
L A
nn
uA
l R
Ep
oR
t 2
00
7
147
13.3 Fixed-term deposits
This sub-item records deposits made at the Bank for
the purpose of absorbing market liquidity in connec-
tion with fine-tuning operation in the Eurosystem.
13.4 Fine-tuning reverse operations
This sub-item records other monetary policy operations
aimed at tightening liquidity.
No such operation took place in 2007.
13.5 Deposits related to margin calls
This sub-item records deposits made by credit institu-
tions to compensate for the decrease in the value of
securities pledged as collateral for other credits granted
to these same institutions.
Note 14 – Liabilities to other euro area residents
denominated in euro
14.1 Liabilities to general government
This item records the amounts as follows:
2007 EuR 2006 EuR
Current accounts 2 204 291 84 691
Account related to euro coins issued by the Treasury
161 326 870 142 858 258
Fixed-term deposit 270 000 000 330 000 000
433 531 161 472 942 949
The item current accounts records an amount of 2 204 261
euro owed to the Luxembourg Treasury and an amount
of 30 euro owed to the CCPL.
In accordance with the amendment of 10 April 2003 to
the agreement between the State of Luxembourg and
the BCL establishing their financial relationship, the
“Account related to euro coins issued by the Treasury”
corresponds to the amount of coins issued by the BCL
in the name and for the account of the Treasury.
The fixed-term deposit renewed on a monthly basis
relates to the above-mentioned agreement.
Note 15 - Liabilities to non-euro area residents
denominated in euro
This item includes current accounts held by central
banks, international and supranational institutions and
other account holders outside the euro area.
Note 16 - Liabilities to non-euro area residents
denominated in foreign currency
This item includes current accounts in foreign currency
held by central banks outside the euro area.
Note 17 - Counterpart of special drawing rights
allocated by the IMF
The amount shown under this item represents the coun-
tervalue of SDR, converted to euro at the same rate as
applied to the SDR assets, which should be returned
to the IMF if SDR are cancelled, if the SDR Department
established by the IMF is closed or if Luxembourg de-
cides to withdraw from it. This liability, of unlimited
duration, amounts to SDR 17.0 million, or 18.2 million
euro as at 31 December 2007 (SDR 17.0 million, or 19.4
million euro as at 31 December 2006).
Note 18 - Intra-Eurosystem liabilities
18.1 Net liabilities related to the allocation of
euro banknotes within the Eurosystem
This item consists of the liabilities of the BCL vis-à-vis
the Eurosystem relating to the allocation of euro ban-
knotes within the Eurosystem. The net position bears
interest at the marginal interest rate applying to the
main refinancing operation.
Note 19 - Items in course of settlement
This item contains mainly the counterpart of the euro
banknotes ordered by credit institutions as at 31 December
2006 which were not put into circulation by that date.

4. THE BCL A S AN ORGAN ISAT ION
BC
L A
nn
uA
l R
Ep
oR
t 2
00
7
148
Note 20 - Other liabilities
This item comprises mainly the negative revaluation
differences on financial instruments linked to interest
rates and market prices, accrued interest, including
accrued interest on intra-Eurosystem liabilities, as well
as miscellaneous expenses payable, including suppliers,
and the Luxembourg banknotes not yet returned.
The Luxembourg banknotes still circulating as at 31
December 2007 amount to 5.3 million euro (5.4 million
euro as at 31 December 2006).
Note 21 - Provisions
Provisions developed as follows :
2007 EuR 2006 EuR
Provisions for banking risks
379 975 432 381 518 406
Provisions for pensions
90 823 880 79 823 786
other provisions 50 000 50 000
470 849 312 461 392 192
21.1 Provisions for banking risks
Provisions for banking risks include the following
items:
2007 EuR 2006 EuR
Provision covering credit and market risk
176 811 696 178 365 669
Provision covering operational risk
8 840 000 10 925 000
Provision covering liquidity risk
14 829 513 14 318 659
Provision covering interest rate risk
200 000 200 000
200 681 209 203 809 328
Provisions for general banking risks
2007 EuR 2006 EuR
Provision for liabili-ties resulting from monetary agreements
32 341 954 32 341 954
other provision for general banking risks
146 952 269 145 367 124
179 294 223 177 709 078
379 975 432 381 518 406

BC
L A
nn
uA
l R
Ep
oR
t 2
00
7
149
21.1.1 Provision covering credit and market risk
The provision for 176.8 million euro (178.4 million euro
as at 31 December 2006) corresponds to :
4% of the BCL’s own securities portfolio existing −
as at 31 December 2003 and still kept as at 31
December 2007 (portfolio allocated to monetary
policy operations if necessary and structural portfo-
lio) and participations other than the participating
interest in the ECB ;
2% of the increase, between 31 December 2003 −
and 31 December 2007, of the BCL’s own securities
portfolio and participations other than the partici-
pating interest in the ECB ;
2% of firm commitments on stock exchange in- −
dexes existing as at 31 December 2007;
4% of the average amount lent by the Eurosystem as −
at year-end for monetary policy reasons multiplied
by the capital key corresponding to the BCL.
Provision on stock exchange index was created in
2006. There was no outstanding amount at the end
of 2007.
The BCL’s aim is to attain a rate of 4% on all items in
the medium term.
21.1.2 Provision covering operational risk
This provision is intended to cover the risk of losses
resulting from the inadequacy or fault attributable to
procedures, to the human factor or to the BCL’s sys-
tems or to external causes. Because of a lack of relevant
statistics on the dimension of risk, the transfer to the
provision is based on the Basic Indicator Approach
described in the consultative working paper of the
Basel Committee as being 15% of the average for the
last three years of the net banking product (including
payments allocated on monetary income).
21.1.3 Provision for liabilities resulting from
monetary agreements
The provision for liabilities resulting from monetary
treaties created in order to face any future monetary
liabilities monetary liabilities did not change in 2007.
21.1.4 Other provision for general banking risks
In 2006, for prudence’s sake and to safeguard its as-
sets, the BCL transferred 1.6 million euro (17.4 million
euro for the financial year 2006) to the provision for
general banking risks to cover any inherent risks related
to central bank activities.
21.2 Provisions for pensions
Provisions for pensions include the following items:
2007 EuR 2006 EuR
Provision for pensions
88 432 010 77 431 916
Provision for equalisation and financial risks
850 252 850 252
Provision for increase of PBo
1 541 618 1 541 618
90 823 880 79 823 786
21.2.1 Provision for pensions
The pensions claims of its agents are fully supported by
the BCL. The corresponding liability is calculated on the
basis of the actuarial method described in note 2.11 in
consideration of current factors and amounted to 88.4
million euro as at 31 December 2007 (77.4 million euro
as at 31 December 2006).
The increase of the provision during the year results from :
monthly deductions from the gross salaries of BCL −
agents (employee’s part) as well as the employer’s
share ;
periodic transfers from the account “Booking re- −
serve of the pension fund” to adjust the account
“Provision for pensions” to its actuarial value ;
a transfer, if needed, to adjust the account “Provi- −
sion for pensions” to its actuarial value.
21.2.2 Provision for equalisation and financial
risks
This provision for equalisation and financial risks was
intended to cover fluctuations in the pension fund’s
liabilities in its early years and/or to compensate for
a lower return on assets. The provision was partially
used but did not changed in 2007.
21.2.3 Provision for increase of Projected Benefit
Obligation
This provision was intended to cover the liability (Pro-
jected Benefit Obligation or PBO) for new agents or the

4. THE BCL A S AN ORGAN ISAT ION
BC
L A
nn
uA
l R
Ep
oR
t 2
00
7
150
changes of present value of potential payments taking
into account individual parameters and the actuarial
method used. The provision did not changed in 2006.
Note 22 – Revaluation accounts
This item includes positive revaluation differences re-
lated to the spread between the exchange rate as
at year-end and the average exchange rate of BCL’s
currency and gold positions, as well as positive reva-
luation differences related to the spread between the
market value as at year-end and the amortised cost for
securities positions.
Note 23 - Capital and reserves
23.1 Capital
The State of Luxembourg is the sole shareholder of the
BCL’s capital, which is fixed at 25 million euro.
23.2 Reserves
The reserves amount to 142.9 million euro (135.6 mil-
lion euro as at 31 December 2006). This amount was
increased by 7.3 million euro in 2007 following the al-
location of profit for 2006 according to the decision of
the BCL’s Council and its Founding Law (Article 31).
Note 24 - Foreign exchange swap
This item includes forward liabilities to the ECB as at
31 December 2007 which arose in connection with
the US dollar Term Auction Facility established by the
Federal Reserve (see also note 5 “Claims on euro area
residents denominated in foreign currency”).
Note 25 – Custody deposits
This item includes the securities given into custody by
Luxembourg credit institutions to cover their liabilities
related to refinancing operations, marginal lending
facilities and intra-day credits.
This item also includes the securities given into custody
in Luxembourg and used as a guarantee by commercial
banks incorporated in other member states according
to the Correspondent Central Banking Model (CCBM).
This agreement allows commercial banks to obtain
funding from their country of residence’s central bank
by using the securities held in another Member State
as a guarantee.
As at 31 December 2007, the market value of these
securities amounts to 219.7 billion euro (189.7 billion
euro as at 31 December 2006).
Note 26 – Commitments and similar instruments
2007 EuR 2006 EuR
Commitments and similar instruments
- 1 700 000 000
This item corresponded to the guarantee issued by the
BCL for the Night Time Link project. This commitment
was guaranteed by assets received in custody for the
same amount. This procedure was replaced by Target
2 at the end of 2007.
Note 27 - Foreign currency reserve assets
administrated on behalf of the ECB
This item includes the foreign currency reserves at mar-
ket value managed by BCL on behalf of the ECB.
Note 28 – Forward contracts
BCL can be engaged in bond and stock index futures.
These instruments are mainly held for hedging purpo-
ses of interest rate risks related to the securities portfo-
lio and for the purpose of adjusting the duration of the
existing portfolio depending on market conditions.
As at 31 December 2007, no such liabilities existed
(274.6 million euro as at 31 December 2006). One secu-
rity has been given as a guarantee in order to cover the
initial margin deposit. This security remains on the BCL’s
balance sheet for an amount of 10.0 million euro as at
31 December 2007, no change compared to 2006.
Note 29 – Net interest income
This item includes interest income, after deduction of in-
terest expense, on assets and liabilities in foreign currency
and in euro. Interest income and expense are as follows:

BC
L A
nn
uA
l R
Ep
oR
t 2
00
7
151
Amounts in foreign currency EuR Amounts in euro EuR
2007 2006 2007 2006
IMF 1 273 454 1 521 372 - -
Monetary policy - - 1 468 637 585 1 062 362 643
Intra-Eurosystem claims
- - 456 897 715 173 380 646
Securities 4 899 994 4 460 338 221 992 931 134 366 145
Gold 331 612 366 298 - -
other 7 550 781 2 127 297 3 876 387 275 322
Total 14 055 841 8 475 305 2 151 404 618 1 370 384 756
CoMPoSITIoN oF INTEREST INCoME
Amounts inforeign currency EuR
Amounts in euro EuR
2007 2006 2007 2006
IMF (762 600) (726 090) - -
Current accounts (including minimum reserves) and deposits related to monetary policy operations
- - (341 757 536) (226 747 634)
Liabilities related to the reallocation of euro banknotes in the Eurosystem
- - (1 667 852 566) (1 039 347 699)
other intra-Eurosystem liabilities - - (41 847) (35 255)
Interests on term deposits - - (8 597 639) (6 150 833)
other liabilities (5 755 533) (1 573 198) (3 042 037) (1 672 132)
Interest on swap operation (954 995) - - -
Total (7 473 128) (2 299 288) (2 021 291 625) (1 273 953 553)
CoMPoSITIoN oF INTEREST ExPENSE
The increase in interest results from an increase in ave-
rage amounts outstanding during the year and from a
change in the interest rates.

4. THE BCL A S AN ORGAN ISAT ION
BC
L A
nn
uA
l R
Ep
oR
t 2
00
7
152
Note 30 - Realised gains / (losses) arising from
financial operations
This item includes the result from transactions in fo-
reign currencies, from securities and from financial
instruments linked to interest rates and market prices,
i.e. gains realised minus loss realised on these tran-
sactions. In 2007, they amounted to 26.0 million euro
(23.6 million euro as at 31 December 2006) and to
23.9 million euro (18.6 million euro as at 31 December
2006) respectively, making a net income of 2.1 million
euro (5.0 million euro as at 31 December 2006).
Note 31 - Write-downs on financial assets and
positions
This item includes revaluation losses on securities for
74.6 million euro and on currency for 10.7 million euro
(revaluation losses on securities for 15.9 million and
on financial instruments linked to interest rates and
market prices for 2.9 million euro in 2006).
Note 32 - Transfer to/from provisions for foreign
exchange rate and price risks
This item includes the transfers to and from provisions
for banking risks.
Note 33 - Net result from fees and commissions
Fees and commissions income and expense are as
follows :
Fees and commissions income EuR
Fees and commissions expense EuR
2007 2006 2007 2006
Securi-ties
13 705 964 10 812 837 (13 556 025) (10 932 676)
others 1 114 896 792 333 (128 088) (106 507)
Total 14 820 860 11 605 170 (13 684 113) (11 039 183)
Note 34 - Income from participating interest
This item may include the dividend distributed by the
European Central Bank.
No dividend was distributed in 2007.
In 2007, the ECB’s income on euro banknotes in cir-
culation amounting to 2 004 million euro was used
in full by the ECB in accordance with a decision of the
Governing Council with respect to the establishment
of a provision for foreign exchange rate, interest rate
and gold price risks.
Note 35 - Net result of pooling of monetary income
The monetary income of each Eurosystem NCB is de-
termined by measuring the actual annual income that
derives from the earmarkable assets held against its
liability base. The liability base consists of the following
items:
banknotes in circulation; −
liabilities to credit institutions related to monetary −
policy operations denominated in euro;
net intra-Eurosystem liabilities resulting from −
TARGET transactions;
net intra-Eurosystem liabilities related to the allo- −
cation of euro banknotes within the Eurosystem.
Any interest paid on liabilities included within the liabi-
lity base is to be deducted from the monetary income
to be pooled.
The earmarkable assets consist of the following items:
lending to euro area credit institutions related to −
monetary policy operations denominated in euro;
intra-Eurosystem claims equivalent to the transfer −
of foreign reserve assets to the ECB;
net intra-Eurosystem claims resulting from TAR- −
GET transactions;
net intra-Eurosystem claims related to the alloca- −
tion of euro banknotes within the Eurosystem;
a limited amount of each NCBs’ gold holdings in −
proportion to its capital key.
Gold is considered as generating no income.

BC
L A
nn
uA
l R
Ep
oR
t 2
00
7
153
Where the value of an NCB’s earmarkable assets ex-
ceeds or falls short of the value of its liability base, the
difference shall be offset by applying to that difference
the average rate of return on the earmarkable assets
of all NCBs taken together.
The monetary income pooled by the Eurosystem is
allocated among NCBs according to the subscribed
capital key (0.22659% for the BCL in 2007).
Calculation of net monetary income allocated to the
BCL:
(EuR millions)
2007 2006
Monetary income pooled by BCL
(81.0) (45.2)
Monetary income reallocated to BCL
52.5 32.7
Net result arising from the calculation of monetary income
(28.5) (12.5)
Note 36 - Other income
Other income includes revenue for services rendered to
third parties, transfers from administrative provisions,
rents from the Monterey building renting and income
from numismatic activities.
Other income includes also BCL’s revenue from financial
agreement between the State of Luxembourg and BCL.
Note 37 -Staff costs
This item includes the salaries and compensations as
well as the employer’s share of contributions to the
pension and social security schemes. The compen-
sations paid to the Board of Directors amounted to
500 980 euro for the year 2007 (486 737 euro for the
year 2006).
As at 31 December 2007, the BCL employed 219 per-
sons (208 as at 31 December 2006). The average num-
ber of persons working for the BCL from 1 January to
31 December 2007 was 211 (206 for the year 2006).
Note 38 - Administrative expenses
This item includes all general and recurring expenses,
meaning leasing, cleaning and repair of buildings and
equipment, small goods and materials, fees paid and other
services and supplies as well as training expenses. The com-
pensations paid to the members of the Council amounted
to 74 493 euro in 2007 (72 289 euro in 2006).
Note 39 - Depreciation of tangible and intangible
fixed assets
This item shows the depreciation applied on buildings,
renovations on buildings, furniture and office equip-
ment, computer hardware and software.
Note 40 - Banknote production services
This item shows mainly the costs related to the produc-
tion and issue of banknotes denominated in euro.
Note 41 - Other expenses
This item shows mainly the transfer to the adminis-
trative provisions and costs related to numismatic ac-
tivities.

4. THE BCL A S AN ORGAN ISAT ION
BC
L A
nn
uA
l R
Ep
oR
t 2
00
7
154

BC
L A
nn
uA
l R
Ep
oR
t 2
00
7
155
Country ESCB key from 1 january 2007 onwards
Eurosystem key from 1 january 2008 onwards
Belgium 2.4708 3.54509493
Denmark 1.5138
Germany 20.5211 29.44360031
Greece 1.8168 2.60673809
Spain 7.5498 10.83242582
France 14.3875 20.64313314
Irland 0.8885 1.27481660
Italy 12.5297 17.97756839
Luxembourg 0.1575 0.22598043
Netherlands 3.8937 5.58666672
Austria 2.0159 2.89240605
Portugal 1.7137 2.45881058
Finland 1.2448 1.78603455
Sweden 2.3313
united Kingdom 13.9337
Czech Republic 1.3880
Estonia 0.1703
Cyprus 0.1249 0.17920607
Latvia 0.2813
Lithuania 0.4178
Hungary 1.3141
Malta 0.0622 0.08924434
Poland 4.8748
Slovenia 0.3194 0.45827397
Slovak Republic 0.6765
Bulgaria 0.8833
Romania 2.5188
100.000000 100.00000000
Note 42 - Post-balance-sheet events
On 1 January 2008 following the entry of national
central banks of Cyprus and Malta in the Eurosystem,
the BCL’s Eurosystem participation key changed from
0.22659% to 0.22598%. BCL’s key in the ESCB did
not change.
BCNs participations are as follows:


BC
L A
nn
uA
l R
Ep
oR
t 2
00
7
157
5. Annexes
5.1 List of BCL circulars published in 2008
BCL Circular No 2007/203 of 2 May 2007 – −
Surveys on foreign direct investment – sent to
all credit institutions as well as to the finan-
cial services of the Postal and Telecommunica-
tions Services Company (giro accounts service).
BCL Circular No 2007/204 of 20 August −
2007 – Cyprus and Malta’s adoption of the
Euro, as from 1st January 2008 - sent to all Un-
dertakings for Collective Investment (UCI ).
BCL Circular No 2007/205 of 20 August 2007 – −
Cyprus and Malta’s adoption of the Euro, as from
1st January 2008 - sent to all credit institutions.
BCL Circular No 2007/206 of 20 August 2007 – −
Cyprus and Malta’s adoption of the Euro, as from
1st January 2008: Impact over the statistical sta-
tements referring to the balance of payments
– sent to all credit institutions as well as to the
financial services of the Postal and Telecommuni-
cations Services Company (giro accounts service).
BCL Circular No 2007/207 of 1 October 2007 – −
Amendments to the BCL’s general terms and condi-
tions – sent to all credit institutions as well as to the
financial services of the Postal and Telecommuni-
cations Services Company (giro accounts service).
BCL Circular No 2007/208 of 8 October 2007 – −
Dates of submission of statistical reports to the BCL,
and determination of the periods of holding mini-
mum reserves in 2008 – sent to all credit institutions.
BCL Circular No 2007/209 of 8 October 2007 −
Dates of submission of statistical reports to the
BCL in 2008 – sent to all Luxembourg-based Un-
dertakings for Collective Investment (UCI ).
BCL Circular No 2007/210 of 16 October 2007 - −
Balance of payments reporting – Modification of the
instructions – sent to all credit institutions as well as to
the financial services of the Postal and Telecommuni-
cations Services Company (giro accounts service).
BCL Circular No 2007/211 of 15 October 2007 −
– New statistical data collection for investment
funds - modification of the statistical data collection
for money market funds – sent to all Luxembourg-
based Undertakings for Collective Investment (UCI).
BCL Circular No 2007/212 of 7 November 2007 −
- Updated instructions for the collection of statisti-
cal data at the BCL – sent to all credit institutions.
BCL Circular No 2007/213 of 7 November 2007 −
- Balance of payments reporting – New statisti-
cal data collection for investment funds; Modi-
fication of the statistical data collection for mo-
ney market funds - sent to all credit institutions.
BCL Circular No 2007/214 of 16 November 2007 −
Amendments to the BCL’s general terms and condi-
tions – sent to all credit institutions as well as to the
financial services of the Postal and Telecommuni-
cations Services Company (giro accounts service).
BCL Circular No 2007/215 of 14 December 2007 – −
Amendments to the BCL’s general terms and condi-
tions – sent to all credit institutions as well as to the
financial services of the Postal and Telecommuni-
cations Services Company (giro accounts service).
BCL Circular No 2007/216 of 28 December 2007 – −
Transmission of statistical data to the BCL by means of
telecommunications – sent to all credit institutions.
5.2 BCL Publications
BCL Working Papers
Working Paper N°24, April 2007 −
"Mesure de la vulnérabilité du secteur bancaire
luxembourgeois", by Abdelaziz Rouabah
Working Paper N°25, April 2007 −
"Co-variation des taux de croissance sectoriels
au Luxembourg : l’apport des corrélations condi-
tionnelles dynamique", by Abdelaziz Rouabah

5. A N N EXES
BC
L A
nn
uA
l R
Ep
oR
t 2
00
7
158
Working Paper N°26, May 2007 −
"Commuters, residents and job competition in
Luxembourg", by Olivier Pierrard
Working Paper N°27, June 2007 −
"Banking Output & Price Indicators from Quar-
terly Reporting Data", by Abdelaziz Rouabah
Working Paper N°28, November 2007 −
"An analysis of regional commuting flows in the
European Union", by Jordan Marvakov and Tho-
mas Y. Mathä
External Publications of BCL Staff
Olivier Pierrard, "Microeconomic Uncertainty and −
Macroeconomic Indeterminacy", with J-F. With J-F.
Fagnart and H. Sneessens, In European Economic
Review 2007, 51(6), p. 1564-1588
Abdelaziz Rouabah, "L’inflation et la Rentabilité des −
actions: Une Relation Enigmatique et un Casse-tête
pour les banques centrales", in Economie et Prévi-
sion, 2007, N°177, p 19-34
BCL Brochures
Brochure des produits numismatiques de la Banque −
centrale du Luxembourg, édition 2007
"Chronique de l’immeuble Monterey", René Link, −
January 2007
"Exposition Monnaies Greques- Monnaies Celtes", −
January 2007
BCL Information Material on the Euro
General Conditions for the BCL’s operations
Paper copies of publications may be obtained at then
BCL’s counters as long as stocks last and according to
the BCL’s conditions. The BCL’s publications may be
downloaded from the website www.bcl.lu.
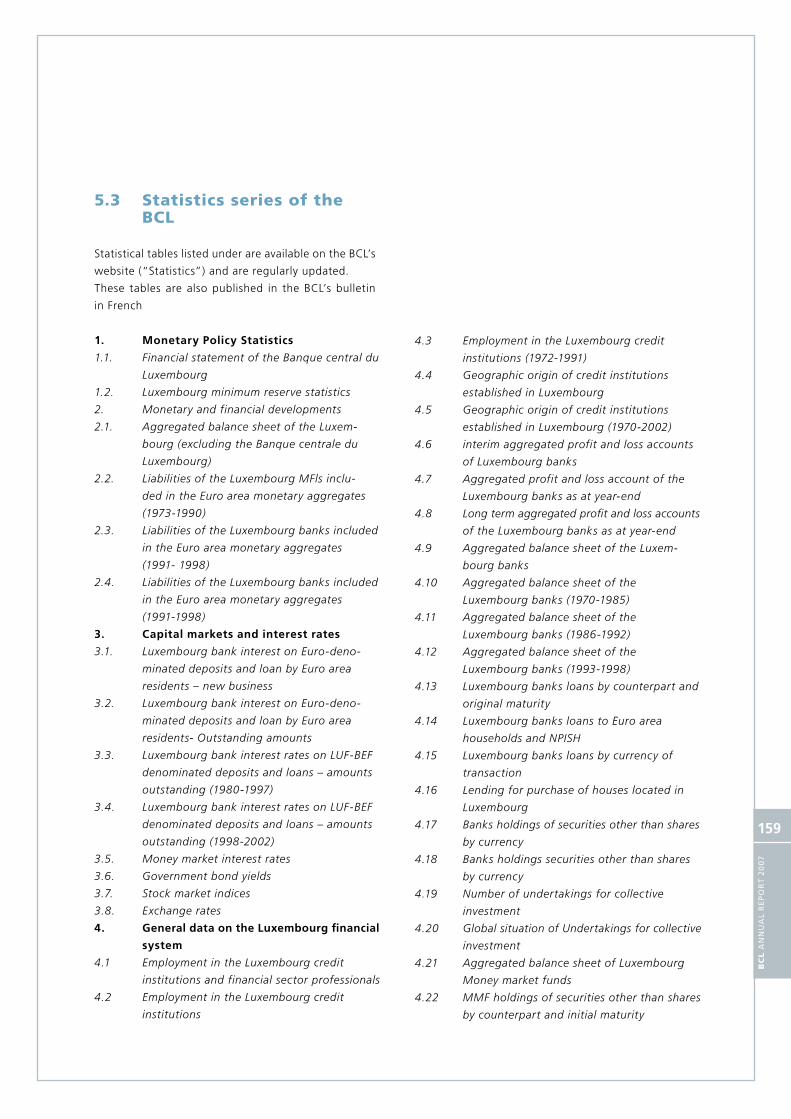
BC
L A
nn
uA
l R
Ep
oR
t 2
00
7
159
5.3 Statistics series of the BCL
Statistical tables listed under are available on the BCL’s
website (“Statistics”) and are regularly updated.
These tables are also published in the BCL’s bulletin
in French
1. Monetary Policy Statistics
1.1. Financial statement of the Banque central du
Luxembourg
1.2. Luxembourg minimum reserve statistics
2. Monetary and financial developments
2.1. Aggregated balance sheet of the Luxem-
bourg (excluding the Banque centrale du
Luxembourg)
2.2. Liabilities of the Luxembourg MFls inclu-
ded in the Euro area monetary aggregates
(1973-1990)
2.3. Liabilities of the Luxembourg banks included
in the Euro area monetary aggregates
(1991- 1998)
2.4. Liabilities of the Luxembourg banks included
in the Euro area monetary aggregates
(1991-1998)
3. Capital markets and interest rates
3.1. Luxembourg bank interest on Euro-deno-
minated deposits and loan by Euro area
residents – new business
3.2. Luxembourg bank interest on Euro-deno-
minated deposits and loan by Euro area
residents- Outstanding amounts
3.3. Luxembourg bank interest rates on LUF-BEF
denominated deposits and loans – amounts
outstanding (1980-1997)
3.4. Luxembourg bank interest rates on LUF-BEF
denominated deposits and loans – amounts
outstanding (1998-2002)
3.5. Money market interest rates
3.6. Government bond yields
3.7. Stock market indices
3.8. Exchange rates
4. General data on the Luxembourg financial
system
4.1 Employment in the Luxembourg credit
institutions and financial sector professionals
4.2 Employment in the Luxembourg credit
institutions
4.3 Employment in the Luxembourg credit
institutions (1972-1991)
4.4 Geographic origin of credit institutions
established in Luxembourg
4.5 Geographic origin of credit institutions
established in Luxembourg (1970-2002)
4.6 interim aggregated profit and loss accounts
of Luxembourg banks
4.7 Aggregated profit and loss account of the
Luxembourg banks as at year-end
4.8 Long term aggregated profit and loss accounts
of the Luxembourg banks as at year-end
4.9 Aggregated balance sheet of the Luxem-
bourg banks
4.10 Aggregated balance sheet of the
Luxembourg banks (1970-1985)
4.11 Aggregated balance sheet of the
Luxembourg banks (1986-1992)
4.12 Aggregated balance sheet of the
Luxembourg banks (1993-1998)
4.13 Luxembourg banks loans by counterpart and
original maturity
4.14 Luxembourg banks loans to Euro area
households and NPISH
4.15 Luxembourg banks loans by currency of
transaction
4.16 Lending for purchase of houses located in
Luxembourg
4.17 Banks holdings of securities other than shares
by currency
4.18 Banks holdings securities other than shares
by currency
4.19 Number of undertakings for collective
investment
4.20 Global situation of Undertakings for collective
investment
4.21 Aggregated balance sheet of Luxembourg
Money market funds
4.22 MMF holdings of securities other than shares
by counterpart and initial maturity
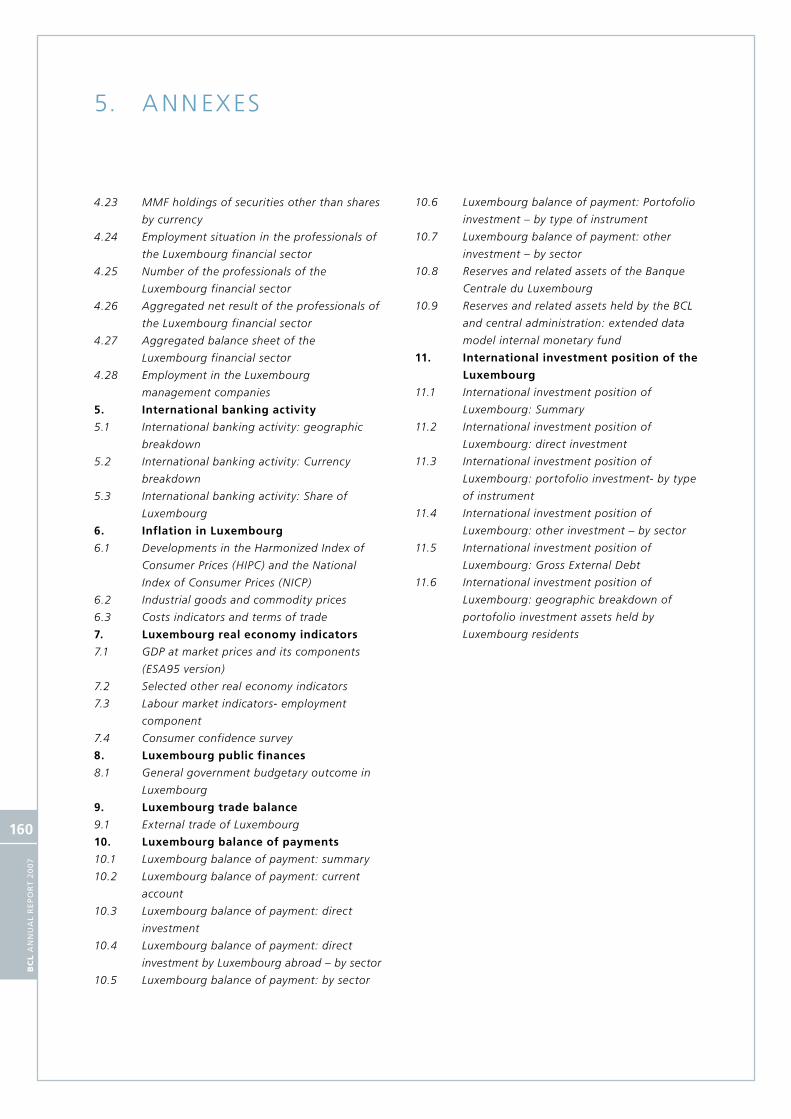
5. A N N EXES
BC
L A
nn
uA
l R
Ep
oR
t 2
00
7
160
4.23 MMF holdings of securities other than shares
by currency
4.24 Employment situation in the professionals of
the Luxembourg financial sector
4.25 Number of the professionals of the
Luxembourg financial sector
4.26 Aggregated net result of the professionals of
the Luxembourg financial sector
4.27 Aggregated balance sheet of the
Luxembourg financial sector
4.28 Employment in the Luxembourg
management companies
5. International banking activity
5.1 International banking activity: geographic
breakdown
5.2 International banking activity: Currency
breakdown
5.3 International banking activity: Share of
Luxembourg
6. Inflation in Luxembourg
6.1 Developments in the Harmonized Index of
Consumer Prices (HIPC) and the National
Index of Consumer Prices (NICP)
6.2 Industrial goods and commodity prices
6.3 Costs indicators and terms of trade
7. Luxembourg real economy indicators
7.1 GDP at market prices and its components
(ESA95 version)
7.2 Selected other real economy indicators
7.3 Labour market indicators- employment
component
7.4 Consumer confidence survey
8. Luxembourg public finances
8.1 General government budgetary outcome in
Luxembourg
9. Luxembourg trade balance
9.1 External trade of Luxembourg
10. Luxembourg balance of payments
10.1 Luxembourg balance of payment: summary
10.2 Luxembourg balance of payment: current
account
10.3 Luxembourg balance of payment: direct
investment
10.4 Luxembourg balance of payment: direct
investment by Luxembourg abroad – by sector
10.5 Luxembourg balance of payment: by sector
10.6 Luxembourg balance of payment: Portofolio
investment – by type of instrument
10.7 Luxembourg balance of payment: other
investment – by sector
10.8 Reserves and related assets of the Banque
Centrale du Luxembourg
10.9 Reserves and related assets held by the BCL
and central administration: extended data
model internal monetary fund
11. International investment position of the
Luxembourg
11.1 International investment position of
Luxembourg: Summary
11.2 International investment position of
Luxembourg: direct investment
11.3 International investment position of
Luxembourg: portofolio investment- by type
of instrument
11.4 International investment position of
Luxembourg: other investment – by sector
11.5 International investment position of
Luxembourg: Gross External Debt
11.6 International investment position of
Luxembourg: geographic breakdown of
portofolio investment assets held by
Luxembourg residents
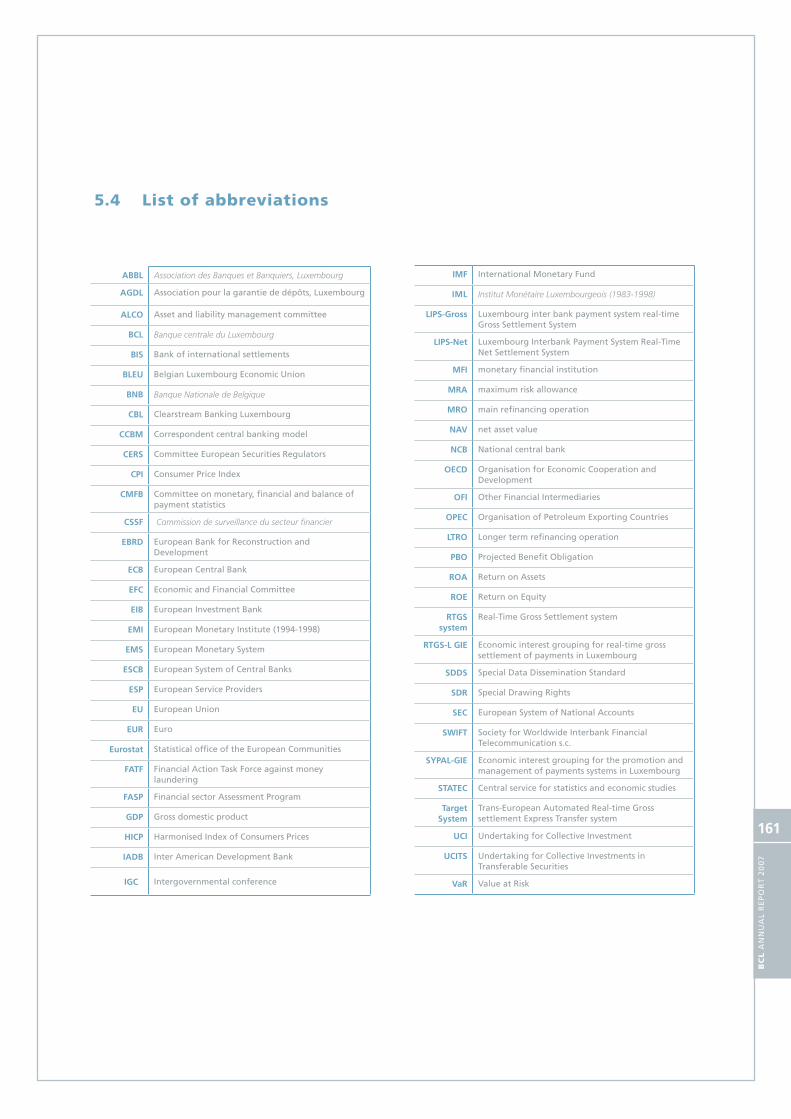
BC
L A
nn
uA
l R
Ep
oR
t 2
00
7
161
ABBL Association des Banques et Banquiers, Luxembourg
AGDL Association pour la garantie de dépôts, Luxembourg
ALCo Asset and liability management committee
BCL Banque centrale du Luxembourg
BIS Bank of international settlements
BLEu Belgian Luxembourg Economic Union
BNB Banque Nationale de Belgique
CBL Clearstream Banking Luxembourg
CCBM Correspondent central banking model
CERS Committee European Securities Regulators
CPI Consumer Price Index
CMFB Committee on monetary, financial and balance of payment statistics
CSSF Commission de surveillance du secteur financier
EBRD European Bank for Reconstruction and Development
ECB European Central Bank
EFC Economic and Financial Committee
EIB European Investment Bank
EMI European Monetary Institute (1994-1998)
EMS European Monetary System
ESCB European System of Central Banks
ESP European Service Providers
Eu European Union
EuR Euro
Eurostat Statistical office of the European Communities
FATF Financial Action Task Force against money laundering
FASP Financial sector Assessment Program
GDP Gross domestic product
HICP Harmonised Index of Consumers Prices
IADB Inter American Development Bank
IGC Intergovernmental conference
IMF International Monetary Fund
IML Institut Monétaire Luxembourgeois (1983-1998)
LIPS-Gross Luxembourg inter bank payment system real-time Gross Settlement System
LIPS-Net Luxembourg Interbank Payment System Real-Time Net Settlement System
MFI monetary financial institution
MRA maximum risk allowance
MRo main refinancing operation
NAv net asset value
NCB National central bank
oECD Organisation for Economic Cooperation and Development
oFI Other Financial Intermediaries
oPEC Organisation of Petroleum Exporting Countries
LTRo Longer term refinancing operation
PBo Projected Benefit Obligation
RoA Return on Assets
RoE Return on Equity
RTGS system
Real-Time Gross Settlement system
RTGS-L GIE Economic interest grouping for real-time gross settlement of payments in Luxembourg
SDDS Special Data Dissemination Standard
SDR Special Drawing Rights
SEC European System of National Accounts
SwIFT Society for Worldwide Interbank Financial Telecommunication s.c.
SyPAL-GIE Economic interest grouping for the promotion and management of payments systems in Luxembourg
STATEC Central service for statistics and economic studies
Target System
Trans-European Automated Real-time Gross settlement Express Transfer system
uCI Undertaking for Collective Investment
uCITS Undertaking for Collective Investments in Transferable Securities
vaR Value at Risk
5.4 List of abbreviations

5. A N N EXES
BC
L A
nn
uA
l R
Ep
oR
t 2
00
7
162

BC
L A
nn
uA
l R
Ep
oR
t 2
00
7
163
5.5 Glossary1
Acquis communautaire: Term commonly used to all
community law including EU treaties, regulations and
directives, Countries joining the EU must have imple-
mented the existing equips communautare by the time
of accession.
Base effect: When analyzing business cycles, the evo-
lution of annual variation rates of a variable are often
explained by "base effects", A base effect occurs when
the evolution of a variable's annual rate from month t+1
varies because of the evolution of the variable's level 12
months before and not because of the variation of the
variable's level between month and month n+1.
Central securities depository (CSD): An entity which
holds and administers securities or other financial as-
sets and enables securities transactions to be processed
by book entry, assets may exist either physically (but
immobilized within the CSD) or in a dematerialized
from (i.e. only as electronic records).
Counter trade/ counterparty: The opposite party in
a financial transaction.
Credit Institution : Any institution covered by
the definition contained in Article 1(1) of Directive
2000/12/EC, as amended. Accordingly, a credit ins-
titution is "( I ) an undertaking whose business is to
receive deposits or other repayable funds from the
public and to grant credits for its own account; or (ii)
an undertaking or any other legal person, other than
those under ( I ), which issues means of payment in the
form of electronic money." The most common types
of credit institutions are banks and savings banks. See
also electronic money (e-money).
Correspondent central banking model (CCBM):
A mechanism established by the European System Cen-
tral Banks with the aim of enabling counterparties to
obtain credit from the central bank of the country in
which they are based using collateral held’s in another
country. In the CCBM, an NCB acts as custodian for the
other NCBs with regard to the securities held’s in its
domestic securities settlement system (SSS).
1 A comprehensive and detailed glossary can be found on the ECB’s website.
Consolidated MFI balance sheet: This is obtained
by netting out inter-MFI positions (e.g. inter-MFI loans
and deposits) on the aggregated MFI balance sheet,
It provides statistical information on the MFI sector's
assets and liabilities statistical information on the MFI
sector's assets and liabilities vis-à-vis non MFI Euro
area residents (i.e. general government and other Euro
area residents) and on its external assets and liabili-
ties (i.e. balance vis-à-vis non Euro area residents).
This consolidated balance sheet is the main statistical
source for the calculation of monetary aggregates and
its provides the basic for the regular analysis of the
counterparts of M3.
Economic and Monetary Union (EMU) : The treaty
describes the process of achieving EMU in the European
Union (EU) in three stages. Stage three started on
1 January 2002 completed the set-up of EMU.
European Central Bank (ECB): The ECB lies at centre
of the European System of Central Banks (ESCB) and
the Eurosystem and has legal personality under Com-
munity law. It ensures that the tasks conferred upon
the Eurosystem and the ESCB are implanted either
thought its own activities or the national central banks,
pursuant to the statues of the European of Central
Banks of Central Banks and of the European central
Bank. The ECB is governed by the Governing Council
and the Executive Boards, and, as a third decision-
making body, by the General Council.
EURIBOR (Euro interbrain offered rate): The rate at
which a prime bank is willing to lend funds in Euro to
another prime bank.
Euro: The name of the European single currency adop-
ted by the European council at its meting in Madrid on
15 and 16 December 1995 and used instead of the term
ECU originally employed in the Treaty.
Euro Area:
The Area encompassing the EU Member states which
have adopted the Euro as their single currency in accor-
dance with the Treaty and in which a single monetary
policy is conducted under the responsibility of the
governing council of the European Central Bank. The
5. A N N EXES
BC
L A
nn
uA
l R
Ep
oR
t 2
00
7
164
Governing Council of the European Central Bank. The
Euro area currently comprises of Belgium, Germany,
Greece, Spain, France, Ireland, Italy, and Luxembourg.
The Netherlands, Austria, Portugal, Slovenia and Fin-
land.
Effective exchange rate (EER) of the Euro (nomi-
nal/real):
Effective (nominal /real) exchange rates (EERs):
Nominal EERs consist of a geometric weighted ave-
rage of various bilateral exchange rates. Real EERs
are nominal EERs deflated by a weighted average of
foreign, relative to domestic, prices or costs. They are
thus measures of price and cost competitiveness. The
European Central Bank calculates nominal EER indices
for the Euro against the currencies of a narrow and a
broad group of trading partners of the Euro area. Since
January 2001, the narrow group has consisted of 12
industrial and newly industrialized partner countries,
while the broad group has been made up of 38 trading
partners including emerging market and transition eco-
nomies. The real EER indices for the Euro are calculated
using alternative measures of prices and costs.
Eurosystem : Comprises of the European Central
Bank(ECB) and the national central banks (NCBs) of the
member states which have adopted the euro in stage
three of Economic and Monetary Union ( see also Euro
area). The eurosystem is governed by the Governing
Council and the Executive Board of the ECB.
European System of Central Banks (ESCB): Com-
posed of the European Central bank (ECB) and the na-
tional central banks of all EU member states. The ESCB
includes, in addition to the member states which have
not yet adopted the Euro in stage three of Economic
and monetary Union ( see also Euro area). The Euro
system is governed by the Governing Council and the
Executive board of the ECB.
Electronic money (e-money) : An electronic store
of monetary value on a technical device that may be
widely used as prepaid bearer instrument for ma-
king payments to undertakings other than the issuer,
without necessarily involving bank accounts in the
transactions.
Executive board: Second decision-making body of the
European Central Bank (ECB),It comprises the presi-
dent and the vice-president of the ECB and four other
members appointed by common accord by the Heads
of state or Government of the Member States that have
adopted the Euro.
ERM II (Exchange rate mechanism II): The exchange
rate arrangement which provides the framework for
exchange rate policy cooperation between the Euro
areas from the start of stage three of Economic and
Monetary Union. Membership of the mechanism is vo-
luntary. Nevertheless, member states with derogation
are expected to join the mechanism. Foreign exchange
intervention and financing at the margins of the stan-
dard or narrower fluctuation bands are, in principle,
automatic and unlimited, with very short-term financing
available. The European central bank and the parti-
cipating non-Euro area national central banks could,
however, suspend automatic intervention if this were
to conflict with their primary objective of maintaining
price stability.
European Monetary Institute (EMI) : A temporary
institution established at he start of stage two of Eco-
nomic and Monetary Union on 1 January 1994. The two
main tasks of the EMI were to strengthen central bank
co-operation and monetary policy co-ordination and
to make the preparations required for establishment of
the European System of Central Banks, for the conduct
of the single monetary policy and for the creation of a
single currency in stage three. It went into liquidation
upon the establishment of the European Central Banks
on 1 June 1998.
Eurosystem's international reserves: These comprise
the reserve assets of the European Central Bank (ECB)
and the reserve assets held by the national central
banks (NCBs) of the participating Member States. Re-
serve assets must be under the effective control of the
relevant monetary authority, whether the ECB or the
NCB of one of the participating Member States, and
comprise highly liquid, marketable and creditworthy
foreign (i.e. non-euro) currency-denominated claims
on non-Euro area residents, plus gold, special drawing
rights and the reserve positions in the International
Monetary Fund of the participating NCBs.

BC
L A
nn
uA
l R
Ep
oR
t 2
00
7
165
Foreign exchange swap: Simultaneous spot and
forward transactions exchanging one currency against
another. The can execute open market operations
in the form of foreign exchange swaps, where the
national central banks (or the European central bank)
buys or sells Euro spot against a foreign currency and,
at the same time, sell or buy them back in forward
transaction.
General council: One of the decision-making bodies
of the European Central Bank (ECB). It comprises of the
members of the executive boards of the ECB and the
governors of the national central banks of the member
states that have adopted the Euro.
Governing council: The supreme decision-making
body of the European Central Bank (ECB). It comprises
of all the members of the executive Board of the ECB
and the governors of the national central banks of the
member states that have adopted the Euro.(e.g. any
party transacting with a central bank).
Guarantee:
Harmonized index of the consumer prices (HICP): The
measures of prices used by the governing council for
the purpose of assessing price stability. The HICP was
developed by the European Commission (Eurostat) in
close developed by the national Statistical institutes
and the European Monetary Institute, and later the
European Central Bank, in order to fulfill the Treaty
requirement for a consumer on a comparable.
Longer- term refinancing operation: A regular open
market operation executed by the Eurosystem in the
form of a reverse transaction, Longer-term refinancing
operations are carried out thought monthly standard
tenders and have a maturity of three months.
.
Main Refinancing Operation: A regular open market
operation executed by the Eurosystem (in the form of
a reverse transaction) for the purpose of providing
the banking system with the amount of liquidity that
the former deems to be appropriate. Main refinancing
operations are conducted through weekly standard
tenders (in which banks can bid for liquidity) and nor-
mally have a maturity of one week. See also open
market operation.
Marginal lending facility: A standing facility of the
Eurosystem which counterparties may use to receive
overnight credit from a national central bank at a pre-
specified interest rate against eligible assets.
Monetary financial institutions (MFIs) : Financial
institutions which from the money-issuing sector of
the Euro area. Theses include the Eurosystem, resident
credit institutions (as defined in community law) and
all other resident financial institutions whose business
in to revive deposits and/or close substitutes for de-
posits from entities other than MFIs and, for their own
account (at least in economic terms) to grant credit
and/or invest in securities, The latter group consists
predominantly of money market funds basis, taking
into account differences in national definitions.
M1,M2, M3: See monetary aggregates
Monetary aggregates: Currency in circulation, plus
outstanding amounts of certain liabilities of monetary
financial institutions and central governments that have
a relatively high degree of liquidity and are held by
non-MFI Euro area residents outside the central govern-
ment sector. The narrow monetary aggregate M1 has
been defined as currency in circulation plus overnight
deposits. The "intermediate" monetary aggregate M2
comprises of M1 plus deposits with agreed maturity
of up to two years and deposits redeemable at notice
of up to three months. to broad monetary aggregate
M3 includes M2 plus repurchase agreements, money
market funds shares and units, money market paper
and debt securities with a maturity of up to two years,
In October 1998 the Governing Council announced a
reference value for the growth of M3, which it has
since reconfirmed (see also reference value for mone-
tary growth).
Open market operation: An operation executed on
the initiative of the central bank in the financial mar-
kets. With regard to their aims, regularity and procedu-
res, Eurosystem open market operations can be divided
into four categories: Main refinancing operations; lon-
ger-term refinancing operations; fine tuning opera-
tions; and structural operations; As for the instrument
used, reserve transactions are the main open market
instrument of the European and can be employed in all
four categories of operations. In addition, the issuance

5. A N N EXES
BC
L A
nn
uA
l R
Ep
oR
t 2
00
7
166
for debt certificates and outright transactions, forei-
gn exchange swaps and the collection of fixed-term
deposits are available for the conduct of fine-tuning
operations.
Outright transaction: A transaction whereby as-
sets are bought or sold up to their maturity (spot or
forward).
Price stability: The maintenance of price stability is
the primary objective of the European Central Bank.
In October 1998, the governing council published a
quantities definition of price stability in order to give
clear guidance to expectations of future price develo-
pments and to be accountable. The Governing Council
defined price stability as a year-on-year increase in the
Harmonized Index of Consumer Prices (HICP) for the
Euro area of below 2%. In may 2003, the governing
council announced clarified that, in its pursuit of price
stability, it aims to maintain inflation rates below, but
close to, 2% over the medium term.
Provisional transfer: A conditional transfer in which
one or more parties retain the right by law or agree-
ment to rescind the transfer.
Quick tender: The tender procedure used by the Euro-
system for fine-tuning operations, Quick tenders are
executed within a time frame of one hour and are
restricted to limited set of counterparties.
Real Time Gross Selman express transfer system:
The real-time gross settlement (RTGS) system for the
Euro. It is a decentralized system consisting of 15 na-
tional RTGS systems and the European Central Bank
payment mechanism. These are interconnected by
common procedures ( Interlinking mechanism) to allow
cross-border transfers throughout the EU to move from
one system to another.
Reserve requirement: The minimum amount of reser-
ves a credit institution is required to hold with a central
bank. In the minimum reserve framework of the Euro-
system, the reserve requirement of a credit institution
is calculated by multiplying the reserve ratio for each
category of items in the reserve base by the amount
of those items on the institution's balance sheet. In
addition, institutions are allowed to deduct a lump-sum
allowance from their reserve requirement.
Reserve ratio: The ratio defined by the central bank for
each category of eligible balance sheet items included
in the reserve base. The ratios are used to calculate
reserve requirements. See also reserve requirements.
Reference value for monetary growth: In order to
assess monetary developments, the Governing Council
has announced a reference value for the broad mone-
tary aggregate M3. This reference value refers to the
rate of M3 growth that is deemed to be compatible
with price stability over the medium term. The reference
value is derived in a manner that is consistent with and
serves the achievement of the Governing Council’s de-
finition of price stability on the basis of medium-term
assumptions regarding trend real GDP growth and the
trend in the velocity of circulation of M3. Substantial
or prolonged deviations of M3 growth from the refe-
rence value would, under normal circumstances, signal
risks to price stability over the medium term. However,
the concept of the reference value does not entail a
commitment on the part of the Governing Council to
correct mechanically deviations of M3 growth from the
reference value.
Reserve base: The sum of the balance sheet items
(in particular liabilities) which constitute the basic for
calculating the reserve requirement of a credit insti-
tution.
Standing facility: A central bank facility available to
counterparties on their own initiative. The Eurosystem
offers two overnight standing facilities: the marginal
lending facility and the deposit facility.
standardized deduction: The fixed percentage of
the amount outstanding of debt securities with an
agreed maturity of up to two years (including mo-
ney market paper) which can be deducted from the
reserve base by issuers that cannot present evidence
that such outstanding amount is held by other insti-
tutions subject to the minimum reserve system of the
Eurosystem, by the ECB or by a national central bank.
See also reserve base.

BC
L A
nn
uA
l R
Ep
oR
t 2
00
7
167
Standard Tender: A tender procedure used by the
Euro system in its regular Open market operations
standard tenders are carried out whiten 24 hours, All
counterparties fulfilling the general eligibility criteria
are entitled to submit bids.
Securities settlement system (SSS): A system which
permits the holding and transfer of securities or other
financial assets, either free of payment or against pay-
ment (delivery versus payment).
SEC 95: The European System of National Accounts is
an accounting framework applicable on an internatio-
nal level and allowing to describe in a systematic and
detailed way what is called a "total economy" (i.e. a
region, a country, a group of countries), its components
and its relations with other total economies.
TARGET (Trans-European Automated Real-time
Gross settlement Express Transfer system) : The
real-time gross settlement (RTGS) system for the Euro.
It is a decentralized system consisting of 15 national
RTGS systems and the European Central Bank payment
mechanism. These are interconnected by common pro-
cedures ( Interlinking mechanism) to allow cross-border
transfers throughout the EU to move from one system
to another.
Target 2: A new generation of the Target system which
replaces the former decentralized system consisting
structure with a single shared platform offering a har-
monized service with a uniform pricing scheme.
Treaty: The treaty establishing the European Commu-
nity. The initial treaty of the Rome was amended on
several occasions, notably by the treaty on European
Union (Maastricht Treaty) which constitutes the basic
for Economic and Monetary Union and defines the
statues of the ESCB.

5. A N N EXES
BC
L A
nn
uA
l R
Ep
oR
t 2
00
7
168